We recently published 10 Stocks Hit by Painful Plunge. Freeport-McMoRan Inc. (NYSE:FCX) is one of the best-performing stocks on Wednesday.
Freeport-McMoran dropped its share prices for a third consecutive day on Wednesday, shedding 9.46 percent to close at $39.14 apiece as investors sold off positions following President Donald Trump’s imposition of 50 percent tariffs on copper imports.
Effective Friday, August 1, the US will slap a 50-percent levy on copper import products such as copper pipes, wires, rods, sheets, and tubes, as well as copper-intensive derivative products such as pipe fittings, cables, connectors, and electrical components.
Freeport-McMoran (FCX) Tumbles 9.46% as Copper Gets Slapped With 50% Tariff
Copyright: tomas1111 / 123RF Stock Photo
Trump said that the imposition was aimed at addressing the effects of copper imports on America’s national security.
While headquartered in the US, Freeport-McMoRan Inc. (NYSE:FCX) was not spared from the new policies, having two mining sites in Peru and Chile, and one in Indonesia.
In other news, Freeport-McMoRan Inc. (NYSE:FCX) saw its net income attributable to shareholders increase by 25 percent in the second quarter of the year, to $772 million from $616 million in the same period last year.
Revenues increased by 14 percent to $772 million from $616 million year-on-year.
While we acknowledge the potential of FCX as an investment, our conviction lies in the belief that some AI stocks hold greater promise for delivering higher returns and have limited downside risk. If you are looking for an extremely cheap AI stock that is also a major beneficiary of Trump tariffs and onshoring, see our free report on the best short-term AI stock.
Freeport-McMoRan recently reported a substantial increase in its second-quarter sales to USD 7,582 million and net income growing to USD 772 million, fueling positive investor sentiment. This was further supported by the company’s strategic buyback initiative, repurchasing 1.5 million shares during the quarter, indicating confidence in its valuation. Despite a broader market trend, characterized by modest gains led by strong tech earnings, Freeport-McMoRan’s price move of 7.5% stands out, reflecting a meaningful response to robust earnings growth and proactive shareholder returns, aligning with the current optimistic market conditions.
We’ve identified 1 possible red flag for Freeport-McMoRan that you should be aware of.
FCX Earnings Per Share Growth as at Jul 2025
Outshine the giants: these 21 early-stage AI stocks could fund your retirement.
The recent boost in Freeport-McMoRan’s sales and net income aligns closely with the company’s proactive measures, such as its share buyback initiative, and signals positive momentum. Over a five-year span, the company’s total return, including dividends, was 198.28%, suggesting robust long-term performance amid fluctuating markets. However, in the past year, Freeport-McMoRan’s share performance lagged behind both the US Metals and Mining industry and the broader US market, which is important contextual information for current investors.
The introduction of the Indonesian smelter and U.S. initiatives could potentially bolster integration, reduce costs, and increase margins, directly impacting revenue and earnings positively. With these developments, analysts forecast Freeport-McMoRan’s revenue to grow at 6.5% annually over the next three years, increasing future earnings substantially. The recent price move to US$39.14 offers a discount relative to the consensus price target of US$50.90, suggesting potential room for share price growth if the company’s strategy unfolds as planned. Nonetheless, the performance relative to this target will heavily depend on the stability of market conditions and the execution of ongoing expansion projects.
Jump into the full analysis health report here for a deeper understanding of Freeport-McMoRan.
This article by Simply Wall St is general in nature. We provide commentary based on historical data and analyst forecasts only using an unbiased methodology and our articles are not intended to be financial advice. It does not constitute a recommendation to buy or sell any stock, and does not take account of your objectives, or your financial situation. We aim to bring you long-term focused analysis driven by fundamental data. Note that our analysis may not factor in the latest price-sensitive company announcements or qualitative material. Simply Wall St has no position in any stocks mentioned.
Companies discussed in this article include FCX.
This article was originally published by Simply Wall St.
Have feedback on this article? Concerned about the content? Get in touch with us directly. Alternatively, email editorial-team@simplywallst.com
Investors in Southern Copper Corporation SCCO need to pay close attention to the stock based on moves in the options market lately. That is because the Jan 16, 2026 $37.50 Call had some of the highest implied volatility of all equity options today.
What is Implied Volatility?
Implied volatility shows how much movement the market is expecting in the future. Options with high levels of implied volatility suggest that investors in the underlying stocks are expecting a big move in one direction or the other. It could also mean there is an event coming up soon that may cause a big rally or a huge sell-off. However, implied volatility is only one piece of the puzzle when putting together an options trading strategy.
What do the Analysts Think?
Clearly, options traders are pricing in a big move for Southern Copper shares, but what is the fundamental picture for the company? Currently, Southern Copper is a Zacks Rank #3 (Hold) in the Mining – Non Ferrous industry that ranks in the Top 24% of our Zacks Industry Rank. Over the last 60 days, the Zacks Consensus Estimate for the current quarter has moved from $1.05 per share to $1.08.Given the way analysts feel about Southern Copper right now, this huge implied volatility could mean there’s a trade developing. Oftentimes, options traders look for options with high levels of implied volatility to sell premium. This is a strategy many seasoned traders use because it captures decay. At expiration, the hope for these traders is that the underlying stock does not move as much as originally expected.
Looking to Trade Options?
Check out the simple yet high-powered approach that Zacks Executive VP Kevin Matras has used to close recent double and triple-digit winners. In addition to impressive profit potential, these trades can actually reduce your risk.Click to see the trades now >>
Want the latest recommendations from Zacks Investment Research? Today, you can download 7 Best Stocks for the Next 30 Days. Click to get this free report
Southern Copper Corporation (SCCO) : Free Stock Analysis Report
This article originally published on Zacks Investment Research (zacks.com).
By Sam Tobin
LONDON (Reuters) -BHP and Vale are facing a London lawsuit from the law firm representing hundreds of thousands of people over Brazil's worst environmental disaster, alleging the companies sought to cheat the firm out of legal fees by procuring settlements.
BHP said it rejected the allegations "in their entirety" and would contest them. Vale declined to comment.
Pogust Goodhead, which represents the claimants in an ongoing case against BHP over the 2015 collapse of the Fundao dam in Mariana, southeastern Brazil, says it will seek 1.3 billion pounds ($1.7 billion) for unpaid fees.
The firm was representing more than 600,000 Brazilians in the case at London's High Court. A June presentation by BHP and Vale's Samarco joint venture – which owned and operated the dam – said around 130,000 people had settled.
In a legal letter sent on Pogust Goodhead's behalf, lawyers representing the firm allege BHP, Vale and Samarco pressured claimants to "settle their claims at far below their true value".
Pogust Goodhead also alleges that a 170 billion-reais ($30.3 billion) compensation agreement which Brazil signed with BHP, Vale and Samarco in October 2024 prevented claimants from discussing the deal with the firm or paying its legal fees.
The firm says it has also incurred an extra $1 billion in borrowing costs to finance the English case over the dam's collapse.
BHP DENIES ALLEGATIONS
"We reject Pogust Goodhead's claims and allegations in their entirety and dispute their factual and legal basis," a BHP spokesperson said in a statement.
"These allegations and threatened claims are entirely without merit and BHP rejects and will vigorously contest them."
The BHP spokesperson pointed to last year's compensation deal, saying: "We continue to believe Brazil is the most appropriate, effective, and efficient place for compensation for the Fundao dam failure from Samarco to be delivered."
Pogust Goodhead's threat of legal action – in a so-called "letter before action" that is required as part of the process – is the latest development in the litigation, after the High Court last month ruled BHP should face a full contempt of court hearing for funding parallel litigation in Brazil.
BHP, meanwhile, still awaits judgment following a trial of the underlying lawsuit over the dam collapse, in which Pogust Goodhead said it was seeking damages of up to 36 billion pounds.
When the dam burst in 2015, it unleashed a wave of toxic sludge that killed 19 people, left thousands homeless, flooded forests and polluted the length of the Doce River.
The trial began in October and finished in March. BHP denies liability and says the case duplicates legal proceedings and reparation and repair programs in Brazil.
(Reporting by Sam Tobin. Additional reporting by Clara Denina. Editing by Mark Potter)
By Clara Denina and Nqobile Dludla
LONDON (Reuters) -Global miner Anglo American (AAL.L) on Thursday reported a $1.9 billion loss in the first half, reduced its dividend, and said restructuring efforts continued, including divestment of its coal and ailing diamond units.
The London-listed miner has been selling or spinning off non-core assets to focus on copper and iron ore since bigger rival BHP's (BHP.L) failed attempt to take it over last year.
Anglo demerged its platinum business in May and on Thursday said its nickel and steelmaking coal assets were discontinued operations, with their sale agreed but not yet completed.
The company declared an interim dividend of $0.07 per share, down from $0.42 a year earlier, reflecting negative earnings at the platinum and coal divisions, and no contribution from diamond unit De Beers.
It posted a $1.9 billion loss for the first half, about triple its $672 million loss in the same period a year ago.
Core earnings or EBITDA of $3 billion for its copper, iron ore and De Beers businesses was above the $2.9 billion expected by analysts.
Anglo American, which expects copper to make up more than 60% of EBITDA post-restructuring, joined rival diversified miners Rio Tinto and BHP in reporting lower results, partly as global trade tensions have weighed on prices of most industrial metals this year.
CEO Duncan Wanblad said he expects "some material inflationary increases in the cost of goods over time," adding that the direct impact of rising tariffs for Anglo was limited.
Anglo's shares were down 4.6% in mid-morning trading.
DE BEERS
Wanblad said a formal process for the sale of De Beers, although complicated by a slump in global diamond prices, was advancing, with the second round of bids from interested buyers expected in the next month.
De Beers's spin-off and eventual listing is the other option for Anglo American, which values it at $4.9 billion after recording $3.5 billion in impairments over the past two years.
"A trade sale would be the preferred option, but the trade sale has to happen to the right group of buyers… work is carrying on in parallel in terms of setting up the business for an IPO at the right time," Wanblad said on Thursday.
Net debt stood at $10.8 billion, below analysts' consensus estimate of $11.6 billion. Anglo expects this to come down once it starts to receive the proceeds from the nickel and coal asset sales and the 19.9% it still holds in the platinum business Valterra (VALT.L), formerly Amplats.
Wanblad did not give details about the timing of the sale of its remaining stake in Valterra, valued at $2.6 billion.
Despite a production halt caused by a fire at one of the mines included in the $3.78 billion sale to Peabody Energy in April, the miner still expects the transaction to be finalized.
Peabody in May issued a Material Adverse Change (MAC) notice to Anglo American, arguing the fire and closure of the mine were a significant negative development that potentially allowed the buyer to terminate the agreement.
"It's really down to Peabody to decide what they intend to do with that now," Wanblad said.
Analysts at Jefferies said that while an arbitration process would be a negative for both companies, a "revised negotiated deal that may include contingent deferred payments relating to a Moranbah restart is possible."
(Reporting by Clara Denina and Nqobile Dludla; Editing by Jon Boyle and Bernadette Baum)
SSR Mining SSRM continues to face significant impact on operations, cash flows and financial condition following the suspension of operations at its Çöpler mine in Türkiye. The mine’s operations have been suspended since Feb. 13, 2024, following a significant slip on the heap leach pad. SSRM has since been focusing on remediation and care and maintenance activities.
Çöpler was a key contributor to SSRM’s output, producing 220,999 gold equivalent ounces in 2023 and accounting for 31% of its total gold production in the year. The company recorded gold production of 21,827 ounces from Çöpler in the first quarter of 2024. Consequently, contributions to revenues from Çöpler for 2024 dipped to 7%, down from 31% in 2023 and 2022.
SSR Mining continues to work closely with the relevant authorities to advance the restart of the Çöpler mine. While the company remains confident and committed to resuming operations, it is uncertain when it will materialize. Despite the lost output from Çöpler, SSRM projects gold production between 320,000 and 380,000 ounces in 2025 with contributions from Seabee, Marigold and CC&V, higher than the 275,013 ounces produced in 2024.
In the first quarter of 2025, remediation and reclamation spend totaled $5 million and care and maintenance costs totaled $35.8 million, including $20.6 million in cash care and maintenance costs. As of March 31, 2024, the company had estimated a preliminary cost range of $250-$300 million for future reclamation and remediation costs related to Çöpler, in addition to the approximately $22.5 million incurred during the first quarter of 2024. SSRM recorded reclamation and remediation costs of approximately $272.9 million during 2024 as a result of the Çöpler incident.
Leach pad failures, where the structures holding mining waste and solutions fail, or similar incidents like tailing dams collapsing, can significantly impact mining companies, leading to financial losses, operational shutdowns, environmental damage and reputational harm. These failures often result in costly cleanup efforts and lawsuits.
One of the most notable cases is the Brumadinho dam disaster, which occurred on Jan. 25, 2019, when a tailings dam at Vale S.A.’s VALE Córrego do Feijão iron ore mine collapsed.
Earlier in 2015, the collapse of the dam at the iron ore mine in 2015 owned by Samarco, a joint venture between Vale and BHP Group BHP, near the city of Mariana in southeastern Brazil, unleashed a wave of tailings and resulted in casualties. Both VALE and BHP have faced intense scrutiny. The companies have since committed billions toward remediation, including reparations, rebuilding communities and restoring ecosystems.
SSRM’s Price Performance, Valuation & Estimates
Year to date, SSRM shares have gained 73.2%, outpacing the industry's 16.1% growth. In comparison, the Basic Materials sector has risen 12.6%, while the S&P 500 has moved up 8%.
Zacks Investment Research
Image Source: Zacks Investment Research
SSR Mining is currently trading at a forward 12-month price-to-earnings multiple of 6.75X compared with the industry average of 14.86X.
Zacks Investment Research
Image Source: Zacks Investment Research
The consensus mark for 2025 earnings is pegged at $1.21 per share, indicating a year-over-year surge of 332%. The estimate for 2026 of $2.21 indicates an increase of 82.9%.
The Zacks Consensus Estimate for SSR Mining’s earnings for 2025 has moved up 11.01% over the past 60 days. The same for 2026 has moved up 18.2%.
Zacks Investment Research
Image Source: Zacks Investment Research
SSRM stock currently carries a Zacks Rank #3 (Hold).
You can see the complete list of today’s Zacks #1 Rank (Strong Buy) stocks here.
Want the latest recommendations from Zacks Investment Research? Today, you can download 7 Best Stocks for the Next 30 Days. Click to get this free report
BHP Group Limited Sponsored ADR (BHP) : Free Stock Analysis Report
VALE S.A. (VALE) : Free Stock Analysis Report
Silver Standard Resources Inc. (SSRM) : Free Stock Analysis Report
This article originally published on Zacks Investment Research (zacks.com).
BHP Group (BHP) and Vale (VALE) are facing a lawsuit in London filed by law firm Pogust Goodhead, wh
Boulder Housing Partners
BOULDER, Colo., July 31, 2025 (GLOBE NEWSWIRE) — Boulder Housing Partners (BHP) today announced it has been awarded $205,000 from the Colorado Department of Early Childhood (CDEC), administered through Parent Possible, to implement the Home Instruction for Parents of Preschool Youngsters (HIPPY) program. This evidence-based home visiting program is designed to empower parents as their children’s first and most important teachers, fostering early literacy and school readiness for families within BHP communities.
"Boulder Housing Partners is deeply committed to providing opportunities for our residents to thrive. The HIPPY program is a critical component of these efforts, specifically aimed at helping families flourish and strengthening our support for children aged 2-5," said Karin Stayton, director of Resident Services at Boulder Housing Partners. "This funding to bring HIPPY to our communities is a significant step forward in ensuring our youngest residents have a strong start. We are excited to offer this proven model that supports parents in fostering their children's educational journey right from the beginning, aligning perfectly with our mission to create vibrant and supportive communities."
Parent Possible is a Colorado-based non-profit organization dedicated to supporting parents and caregivers through high-quality, evidence-based home visiting programs. HIPPY is one of its flagship initiatives, with a demonstrated track record of improving child outcomes and strengthening families.
"BHP’s established presence and deep understanding of the families they serve make them an ideal partner,” said Brian Conly, executive director of Parent Possible. “Evidence shows investing in early childhood development through programs like HIPPY yields long-term benefits for children, families and entire communities. We look forward to seeing the positive impact this program will have in Boulder."
The HIPPY program at Boulder Housing Partners will begin serving 26 families this fall. While open to all BHP households, the program will focus on serving families the Bringing School Home program who live in BHP’s deeply affordable housing communities. Trained home visitors will work with participating families, providing weekly in-home sessions that include role-playing educational activities and providing books and materials. The program also offers group meetings, connecting parents with a network of support and additional community resources.
Key Benefits of the HIPPY Program:
-
Improved School Readiness: Children enter kindergarten better prepared with essential literacy, numeracy and social-emotional skills.
-
Empowered Parents: Parents gain confidence and skills as their child's primary educator.
-
Strengthened Parent-Child Relationships: The program encourages positive interaction and bonding through learning activities.
-
Increased Parental Involvement: HIPPY fosters greater engagement in children's education and community life.
Families interested in learning more about the HIPPY program and eligibility are encouraged to email "Bringing School Home" at BSH@boulderhousing.org.
About Boulder Housing Partners: Boulder Housing Partners (BHP) is the housing authority for the City of Boulder. BHP’s mission is to provide quality, affordable housing, inspire vibrant communities, and create the opportunity for change in people’s lives. BHP builds, owns, and manages a diverse portfolio of 2,000 housing options and provides supportive services to help residents achieve stability and self-sufficiency. Learn more at https://boulderhousing.org/
About Parent Possible: Parent Possible promotes and delivers high-quality, evidence-based home visiting services to ensure that all Colorado children, regardless of circumstance, are ready to succeed in school and in life. Parent Possible supports a network of partner organizations across the state to implement proven programs like HIPPY, fostering strong families and healthy child development. Learn more at https://parentpossible.org/hippy/
Contact:
Melissa SprinkleHawke Mediamsprinkle@hawkemedia.com
Brian Conly, Executive DirectorParent Possiblebrian@parentpossible.org
Freeport-McMoRan (FCX) is one of the stocks most watched by Zacks.com visitors lately. So, it might be a good idea to review some of the factors that might affect the near-term performance of the stock.
Over the past month, shares of this mining company have returned -1.9%, compared to the Zacks S&P 500 composite's +3.4% change. During this period, the Zacks Mining – Non Ferrous industry, which Freeport-McMoRan falls in, has lost 3.7%. The key question now is: What could be the stock's future direction?
While media releases or rumors about a substantial change in a company's business prospects usually make its stock 'trending' and lead to an immediate price change, there are always some fundamental facts that eventually dominate the buy-and-hold decision-making.
Revisions to Earnings Estimates
Rather than focusing on anything else, we at Zacks prioritize evaluating the change in a company's earnings projection. This is because we believe the fair value for its stock is determined by the present value of its future stream of earnings.
Our analysis is essentially based on how sell-side analysts covering the stock are revising their earnings estimates to take the latest business trends into account. When earnings estimates for a company go up, the fair value for its stock goes up as well. And when a stock's fair value is higher than its current market price, investors tend to buy the stock, resulting in its price moving upward. Because of this, empirical studies indicate a strong correlation between trends in earnings estimate revisions and short-term stock price movements.
For the current quarter, Freeport-McMoRan is expected to post earnings of $0.57 per share, indicating a change of +50% from the year-ago quarter. The Zacks Consensus Estimate has changed +13.2% over the last 30 days.
The consensus earnings estimate of $1.81 for the current fiscal year indicates a year-over-year change of +22.3%. This estimate has changed +7.1% over the last 30 days.
For the next fiscal year, the consensus earnings estimate of $2.46 indicates a change of +35.5% from what Freeport-McMoRan is expected to report a year ago. Over the past month, the estimate has changed +11.2%.
Having a strong externally audited track record, our proprietary stock rating tool, the Zacks Rank, offers a more conclusive picture of a stock's price direction in the near term, since it effectively harnesses the power of earnings estimate revisions. Due to the size of the recent change in the consensus estimate, along with three other factors related to earnings estimates, Freeport-McMoRan is rated Zacks Rank #3 (Hold).
The chart below shows the evolution of the company's forward 12-month consensus EPS estimate:
12 Month EPS12-month consensus EPS estimate for FCXRevenue Growth Forecast
While earnings growth is arguably the most superior indicator of a company's financial health, nothing happens as such if a business isn't able to grow its revenues. After all, it's nearly impossible for a company to increase its earnings for an extended period without increasing its revenues. So, it's important to know a company's potential revenue growth.
For Freeport-McMoRan, the consensus sales estimate for the current quarter of $6.97 billion indicates a year-over-year change of +2.6%. For the current and next fiscal years, $27.8 billion and $30.15 billion estimates indicate +9.2% and +8.4% changes, respectively.
Last Reported Results and Surprise History
Freeport-McMoRan reported revenues of $7.58 billion in the last reported quarter, representing a year-over-year change of +14.5%. EPS of $0.54 for the same period compares with $0.46 a year ago.
Compared to the Zacks Consensus Estimate of $7.12 billion, the reported revenues represent a surprise of +6.47%. The EPS surprise was +17.39%.
Over the last four quarters, Freeport-McMoRan surpassed consensus EPS estimates two times. The company topped consensus revenue estimates three times over this period.
Valuation
Without considering a stock's valuation, no investment decision can be efficient. In predicting a stock's future price performance, it's crucial to determine whether its current price correctly reflects the intrinsic value of the underlying business and the company's growth prospects.
While comparing the current values of a company's valuation multiples, such as price-to-earnings (P/E), price-to-sales (P/S), and price-to-cash flow (P/CF), with its own historical values helps determine whether its stock is fairly valued, overvalued, or undervalued, comparing the company relative to its peers on these parameters gives a good sense of the reasonability of the stock's price.
As part of the Zacks Style Scores system, the Zacks Value Style Score (which evaluates both traditional and unconventional valuation metrics) organizes stocks into five groups ranging from A to F (A is better than B; B is better than C; and so on), making it helpful in identifying whether a stock is overvalued, rightly valued, or temporarily undervalued.
Freeport-McMoRan is graded B on this front, indicating that it is trading at a discount to its peers. Click here to see the values of some of the valuation metrics that have driven this grade.
Conclusion
The facts discussed here and much other information on Zacks.com might help determine whether or not it's worthwhile paying attention to the market buzz about Freeport-McMoRan. However, its Zacks Rank #3 does suggest that it may perform in line with the broader market in the near term.
Want the latest recommendations from Zacks Investment Research? Today, you can download 7 Best Stocks for the Next 30 Days. Click to get this free report
Freeport-McMoRan Inc. (FCX) : Free Stock Analysis Report
This article originally published on Zacks Investment Research (zacks.com).
FMC (FMC) came out with quarterly earnings of $0.69 per share, beating the Zacks Consensus Estimate of $0.59 per share. This compares to earnings of $0.63 per share a year ago. These figures are adjusted for non-recurring items.
This quarterly report represents an earnings surprise of +16.95%. A quarter ago, it was expected that this chemical producer would post earnings of $0.08 per share when it actually produced earnings of $0.18, delivering a surprise of +125%.
Over the last four quarters, the company has surpassed consensus EPS estimates four times.
FMC, which belongs to the Zacks Agriculture – Operations industry, posted revenues of $1.05 billion for the quarter ended June 2025, surpassing the Zacks Consensus Estimate by 8.82%. This compares to year-ago revenues of $1.04 billion. The company has topped consensus revenue estimates three times over the last four quarters.
The sustainability of the stock's immediate price movement based on the recently-released numbers and future earnings expectations will mostly depend on management's commentary on the earnings call.
FMC shares have lost about 13.5% since the beginning of the year versus the S&P 500's gain of 8.3%.
What's Next for FMC?
While FMC has underperformed the market so far this year, the question that comes to investors' minds is: what's next for the stock?
There are no easy answers to this key question, but one reliable measure that can help investors address this is the company's earnings outlook. Not only does this include current consensus earnings expectations for the coming quarter(s), but also how these expectations have changed lately.
Empirical research shows a strong correlation between near-term stock movements and trends in earnings estimate revisions. Investors can track such revisions by themselves or rely on a tried-and-tested rating tool like the Zacks Rank, which has an impressive track record of harnessing the power of earnings estimate revisions.
Ahead of this earnings release, the estimate revisions trend for FMC was mixed. While the magnitude and direction of estimate revisions could change following the company's just-released earnings report, the current status translates into a Zacks Rank #3 (Hold) for the stock. So, the shares are expected to perform in line with the market in the near future. You can see the complete list of today's Zacks #1 Rank (Strong Buy) stocks here.
It will be interesting to see how estimates for the coming quarters and the current fiscal year change in the days ahead. The current consensus EPS estimate is $0.90 on $1.09 billion in revenues for the coming quarter and $3.34 on $4.17 billion in revenues for the current fiscal year.
Investors should be mindful of the fact that the outlook for the industry can have a material impact on the performance of the stock as well. In terms of the Zacks Industry Rank, Agriculture – Operations is currently in the bottom 13% of the 250 plus Zacks industries. Our research shows that the top 50% of the Zacks-ranked industries outperform the bottom 50% by a factor of more than 2 to 1.
Another stock from the same industry, Alico (ALCO), has yet to report results for the quarter ended June 2025.
This agribusiness and land management company is expected to post quarterly loss of $0.35 per share in its upcoming report, which represents a year-over-year change of -29.6%. The consensus EPS estimate for the quarter has remained unchanged over the last 30 days.
Alico's revenues are expected to be $16.9 million, up 24.2% from the year-ago quarter.
Want the latest recommendations from Zacks Investment Research? Today, you can download 7 Best Stocks for the Next 30 Days. Click to get this free report
FMC Corporation (FMC) : Free Stock Analysis Report
Alico, Inc. (ALCO) : Free Stock Analysis Report
This article originally published on Zacks Investment Research (zacks.com).
It doesn't matter your age or experience: taking full advantage of the stock market and investing with confidence are common goals for all investors.
Many investors also have a go-to methodology that helps guide their buy and sell decisions. One way to find winning stocks based on your preferred way of investing is to use the Zacks Style Scores, which are indicators that rate stocks based on three widely-followed investing types: value, growth, and momentum.
Why Investors Should Pay Attention to This Value Stock
Finding good stocks at good prices, and discovering which companies are trading under their true value, are what value investors like to focus on. So, the Value Style Score takes into account ratios like P/E, PEG, Price/Sales, and Price/Cash Flow to highlight the most attractive and discounted stocks.
Freeport-McMoRan (FCX)
Based in Phoenix, AZ, Freeport-McMoRan Inc., formerly Freeport-McMoRan Copper & Gold Inc., is engaged in mineral exploration and development; mining and milling of copper, gold, molybdenum and silver; as well as the smelting and refining of copper concentrates. The company conducts its operations primarily through its principal operating subsidiaries, PT Freeport Indonesia (PT-FI), Freeport Minerals Corporation and Atlantic Copper. PT Freeport Indonesia’s principal asset is Papua, Indonesia-based Grasberg mine, which contains the world’s largest copper and gold reserves.
FCX sits at a Zacks Rank #3 (Hold), holds a Value Style Score of B, and has a VGM Score of A. Compared to the Mining – Non Ferrous industry's P/E of 21.6X, shares of Freeport-McMoRan are trading at a forward P/E of 23.9X. FCX also has a PEG Ratio of 0.8, a Price/Cash Flow ratio of 14.2X, and a Price/Sales ratio of 2.4X.
Value investors don't just pay attention to a company's valuation ratios; positive earnings play a crucial role, too. Six analysts revised their earnings estimate upwards in the last 60 days for fiscal 2025. The Zacks Consensus Estimate has increased $0.14 to $1.81. FCX has an average earnings surprise of 10.4%.
Investors should take the time to consider FCX for their portfolios due to its solid Zacks Ranks, notable earnings and valuation metrics, and impressive Value and VGM Style Scores.
Want the latest recommendations from Zacks Investment Research? Today, you can download 7 Best Stocks for the Next 30 Days. Click to get this free report
Freeport-McMoRan Inc. (FCX) : Free Stock Analysis Report
This article originally published on Zacks Investment Research (zacks.com).
PHILADELPHIA (AP) — PHILADELPHIA (AP) — FMC Corp. (FMC) on Wednesday reported second-quarter profit of $66.7 million.
On a per-share basis, the Philadelphia-based company said it had profit of 53 cents. Earnings, adjusted for one-time gains and costs, came to 69 cents per share.
The results beat Wall Street expectations. The average estimate of seven analysts surveyed by Zacks Investment Research was for earnings of 59 cents per share.
The chemical producer posted revenue of $1.05 billion in the period, also exceeding Street forecasts. Three analysts surveyed by Zacks expected $965.4 million.
_____
This story was generated by Automated Insights (http://automatedinsights.com/ap) using data from Zacks Investment Research. Access a Zacks stock report on FMC at https://www.zacks.com/ap/FMC
Maintains full year adjusted EBITDA and adjusted EPS guidance; announces sale of India commercial business
Second Quarter 2025 Highlights
-
Revenue of $1.05 billion, up 1 percent versus Q2 2024, up 2 percent organically1
-
Consolidated GAAP net income of $67 million, a decline of 77 percent versus Q2 2024
-
Adjusted EBITDA of $207 million, up 2 percent versus Q2 2024
-
Consolidated GAAP net income of $0.53 per diluted share, down 77 percent versus Q2 2024
-
Adjusted earnings per diluted share of $0.69, an increase of 10 percent versus Q2 2024
Full-Year Outlook2
-
Revenue outlook of $4.08 billion to $4.28 billion, excluding India, down 2 percent at the midpoint versus 2024 reported results, which included India
-
Maintains adjusted EBITDA outlook of $870 million to $950 million, an increase of 1 percent versus prior year at the midpoint
-
Adjusted earnings per diluted share outlook unchanged at $3.26 to $3.70, flat at the midpoint to prior year
-
Free cash flow forecast remains $200 million to $400 million, reflecting a decline of 51 percent at the midpoint from prior year
PHILADELPHIA, July 30, 2025 /PRNewswire/ —
FMC Corporation Logo. (PRNewsFoto/FMC Corporation)
FMC Corporation (NYSE:FMC) today reported second quarter 2025 revenue of $1.05 billion, up 1 percent versus second quarter 2024, and up 2 percent organically. On a GAAP basis, the company reported net income of $0.53 per diluted share in the second quarter, a decrease of 77 percent versus second quarter 2024 due to gains related to tax incentives recorded in the prior year. Second quarter adjusted earnings were $0.69 per diluted share, up 10 percent versus second quarter 2024.
Higher second quarter revenue was driven by volume growth of 6 percent as customers in most countries appear to have reached target channel inventory levels for FMC products. Price declined 3 percent, over half of which was attributed to price adjustments in certain "cost-plus" contracts with specific diamide partners as a result of lower manufacturing costs. Foreign currency was a headwind of 1 percent3. The company's growth portfolio increased by high-single digits while core portfolio sales were essentially flat.
Sales in North America declined 5 percent as solid branded growth in the U.S. was more than offset by lower volume from expected destocking in Canada. Latin America sales were 1 percent higher than prior year, 5 percent higher excluding currency impacts, aided by solid growth of new active ingredients fluindapyr and Isoflex™ active. In Asia, sales were lower by 17 percent, down 15 percent excluding currency impacts, due to lower pricing as well as reduced volume driven by ongoing destocking activity in India. EMEA sales increased 29 percent, 27 percent excluding currency impacts. Growth was driven by strong volume gains particularly for herbicides, diamide partners, and branded Cyazypyr® products. The Plant Health business grew 3 percent driven by gains in biologicals.
|
FMC Revenue |
Q2 2025 |
|
Total Revenue Change (GAAP) |
1 % |
|
Less FX Impact |
(1) % |
|
Organic1 Revenue Change (Non-GAAP) |
2 % |
GAAP net income in the second quarter declined 77 percent due to gains related to tax incentives recorded in the prior year. FMC second quarter adjusted EBITDA was $207 million, an increase of 2 percent from the prior-year period as favorable costs were partially offset by price and FX headwinds. Adjusted EPS grew 10 percent driven mainly by higher adjusted EBITDA and lower interest expense.
On a GAAP basis, cash from operations was $66 million, a decline of $226 million versus 2024 due primarily to a smaller reduction in inventory levels than in the prior year. Free cash flow was $40 million, a decline of $241 million versus Q2 2024 primarily due to lower cash from operations.
Intention to Divest India Commercial Business
In response to challenges in India, the FMC Board of Directors has approved divesting the company's commercial business in the country. FMC plans to continue to actively participate in the India market through a supply agreement with the eventual buyer of the business for its patented and data-protected portfolio, ranging from new diamide technologies to active ingredients and biologicals. The company will continue its active ingredient manufacturing operations in India. The sale process is underway and is expected to conclude within the next year.
Outlook2
The India commercial business will be classified as held for sale beginning in the third quarter. Revenue generated by the India commercial business will be included in reported revenue, while revenue guidance for the company will exclude India. Earnings of the India commercial business will be excluded from adjusted EBITDA and adjusted EPS. The company reaffirms its full-year 2025 adjusted EBITDA, adjusted EPS and free cash flow guidance ranges. Revenue excluding India is expected to be $4.08 billion to $4.28 billion, down 2 percent at the midpoint versus prior year reported revenue. Other than the exclusion of India revenue, there is no change to revenue guidance.
Third quarter revenue excluding India is expected to be in the range of $1.00 billion to $1.10 billion, down 1 percent at the midpoint versus reported third quarter 2024. Volume growth and a minor FX tailwind are expected to be more than offset by a mid-single digit price headwind, in part driven by diamide partner contract adjustments and higher rebates as customers purchase higher volumes. The India exclusion is a negative 6 percent impact. Adjusted EBITDA is forecasted to be in the range of $210 million to $250 million, an increase of 14 percent at the midpoint versus the prior year as lower costs and volume growth more than offset headwinds from pricing and FX. Lower costs are driven by COGS tailwinds from improved fixed cost absorption, lower raw material costs and restructuring benefits. FMC expects adjusted earnings per diluted share to be in the range of $0.78 to $0.98 in the third quarter, which represents a 28 percent increase at the midpoint versus third quarter 2024 driven mainly by higher adjusted EBITDA.
Fourth quarter revenue excluding India is expected to be in the range of $1.24 billion to $1.34 billion, an increase of 5 percent at the midpoint versus reported fourth quarter 2024. The company expects strong volume growth driven by sales of new products as well as contributions from the additional route to market recently put in place in Brazil. Pricing is expected to be a low-single digit headwind, while FX is forecasted to be a minor tailwind. The India exclusion is negative 6 percent. Adjusted EBITDA is forecasted to be in the range of $334 million to $374 million, an increase of 4 percent at the midpoint versus the prior year as favorable costs and higher volumes are partially offset by lower price. FMC expects adjusted earnings per diluted share to be in the range of $1.62 to $1.84 in the fourth quarter, which represents a 3 percent decrease at the midpoint versus fourth quarter 2024. The unfavorable variance is mainly driven by an exceptionally low tax rate in the prior year.
|
Full-Year 2025 Outlook2 |
Second-Half Outlook2 (excludes India in Q3 and Q4) |
Third Quarter Outlook2 (excludes India) |
Fourth Quarter Outlook2 (excludes India) |
|
|
Revenue |
$4.08 billion to $4.28 billion |
$2.24 billion to $2.44 billion |
$1.00 billion to $1.10 billion |
$1.24 billion to $1.34 billion |
|
Growth at midpoint vs. 2024 |
(2) % |
2 % |
(1) % |
5 % |
|
Adjusted EBITDA |
$870 million to $950 million |
$544 million to $624 million |
$210 million to $250 million |
$334 million to $374 million |
|
Growth at midpoint vs. 2024 |
1 % |
8 % |
14 % |
4 % |
|
Adjusted EPS^ |
$3.26 to $3.70 |
$2.40 to $2.82 |
$0.78 to $0.98 |
$1.62 to $1.84 |
|
Growth at midpoint vs. 2024 |
0 % |
5 % |
28 % |
(3) % |
|
^ EPS estimates assume 125.6 million diluted shares for full year and 125.6 million diluted shares for Q3 and Q4. |
|
Note that percentages are calculated using whole numbers. Minor differences may exist due to rounding. India has been excluded from second half, third quarter and fourth quarter outlooks. Variances are calculated versus 2024 results which include India. |
Supplemental Information
The company will post supplemental information on the web at https://investors.fmc.com, including its webcast slides for tomorrow's earnings call, definitions of non-GAAP terms and reconciliations of non-GAAP figures to the nearest available GAAP term.
Always read and follow all label directions, restrictions and precautions for use. Products listed here may not be registered for sale or use in all states, countries or jurisdictions. FMC, the FMC logo, Cyazypyr and Isoflex are trademarks of FMC Corporation or an affiliate.
About FMC
FMC Corporation is a global agricultural sciences company dedicated to helping growers produce food, feed, fiber and fuel for an expanding world population while adapting to a changing environment. FMC's innovative crop protection solutions – including biologicals, crop nutrition, digital and precision agriculture – enable growers and crop advisers to address their toughest challenges economically while protecting the environment. FMC is committed to discovering new herbicide, insecticide and fungicide active ingredients, product formulations and pioneering technologies that are consistently better for the planet. Visit fmc.com to learn more and follow us on LinkedIn®.
Statement under the Safe Harbor Provisions of the Private Securities Litigation Reform Act of 1995: FMC and its representatives may from time to time make written or oral statements that are "forward-looking" and provide other than historical information, including statements contained in this press release, in FMC's other filings with the SEC, and in presentations, reports or letters to FMC stockholders.
In some cases, FMC has identified these forward-looking statements by such words or phrases as "outlook", "will likely result," "is confident that," "expect," "expects," "should," "could," "may," "will continue to," "believe," "believes," "anticipates," "predicts," "forecasts," "estimates," "projects," "potential," "intends" or similar expressions identifying "forward-looking statements" within the meaning of the Private Securities Litigation Reform Act of 1995, including the negative of those words or phrases. Such forward-looking statements are based on our current views and assumptions regarding future events, future business conditions and the outlook for the company based on currently available information. The forward-looking statements involve known and unknown risks, uncertainties and other factors that may cause actual results to be materially different from any results, levels of activity, performance or achievements expressed or implied by any forward-looking statement. These statements are qualified by reference to the risk factors included in Part I, Item 1A of our Annual Report on Form 10-K for the year ended December 31, 2024 (the "2024 Form 10-K"), the section captioned "Forward-Looking Information" in Part II of the 2024 Form 10-K and to similar risk factors and cautionary statements in all other reports and forms filed with the Securities and Exchange Commission ("SEC"). We wish to caution readers not to place undue reliance on any such forward-looking statements, which speak only as of the date made. Forward-looking statements are qualified in their entirety by the above cautionary statement.
We specifically decline to undertake any obligation, and specifically disclaim any duty, to publicly update or revise any forward-looking statements that have been made to reflect events or circumstances after the date of such statements or to reflect the occurrence of anticipated or unanticipated events, except as may be required by law.
This press release contains certain "non-GAAP financial terms" which are defined on our website www.fmc.com/investors. Such terms include adjusted EBITDA, adjusted earnings, free cash flow, organic revenue growth and revenue excluding India. In addition, we have also provided on our website reconciliations of non-GAAP terms to the most directly comparable GAAP terms.
Organic revenue growth (non-GAAP) excludes the impact of foreign currency changes.
Although we provide forecasts for adjusted earnings per share, adjusted EBITDA, and free cash flow (non-GAAP financial measures), we are not able to forecast the most directly comparable measures calculated and presented in accordance with GAAP. Certain elements of the composition of the GAAP amounts are not predictable, making it impractical for us to forecast. Such elements include, but are not limited to, restructuring, acquisition charges, our India held for sale business, and discontinued operations. As a result, no GAAP outlook is provided. Starting with the third quarter 2025 guidance, we provide forecasts for revenue excluding India (non-GAAP financial measure). We are not able to forecast the GAAP revenue due to potential actions we may take during the held for sale period to prepare the business for a potential buyer and other uncertainties, including customer reaction to the announcement of our intention to sell our India commercial business. For all outlooks provided, variances are calculated versus 2024 results which include India.
In certain instances, parts included in the variance explanations in the discussion may not sum to the total variance for the financial statement line item due to rounding.
|
FMC CORPORATION CONSOLIDATED STATEMENTS OF INCOME (LOSS) (Unaudited and in millions, except per share amounts) |
|||||||
|
Three Months Ended June 30, |
Six Months Ended June 30, |
||||||
|
2025 |
2024 |
2025 |
2024 |
||||
|
Revenue |
$ 1,050.5 |
$ 1,038.4 |
$ 1,841.9 |
$ 1,956.4 |
|||
|
Costs of sales and services |
644.2 |
640.3 |
1,118.9 |
1,218.6 |
|||
|
Gross margin |
$ 406.3 |
$ 398.1 |
$ 723.0 |
$ 737.8 |
|||
|
Selling, general and administrative expenses |
176.8 |
164.8 |
348.8 |
328.7 |
|||
|
Research and development expenses |
66.4 |
75.9 |
135.1 |
136.8 |
|||
|
Restructuring and other charges (income) |
36.7 |
95.1 |
54.5 |
136.0 |
|||
|
Total costs and expenses |
$ 924.1 |
$ 976.1 |
$ 1,657.3 |
$ 1,820.1 |
|||
|
Income from continuing operations before non-operating pension, postretirement, and other charges (income), interest expense, net and income taxes |
$ 126.4 |
$ 62.3 |
$ 184.6 |
$ 136.3 |
|||
|
Non-operating pension, postretirement, and other charges (income) |
6.6 |
4.2 |
9.8 |
8.5 |
|||
|
Interest expense, net |
61.0 |
63.6 |
111.1 |
125.3 |
|||
|
Income (loss) from continuing operations before income taxes |
$ 58.8 |
$ (5.5) |
$ 63.7 |
$ 2.5 |
|||
|
Provision (benefit) for income taxes |
14.4 |
(303.5) |
27.9 |
(304.9) |
|||
|
Income (loss) from continuing operations |
$ 44.4 |
$ 298.0 |
$ 35.8 |
$ 307.4 |
|||
|
Discontinued operations, net of income taxes |
23.4 |
(2.8) |
16.4 |
(15.3) |
|||
|
Net income (loss) |
$ 67.8 |
$ 295.2 |
$ 52.2 |
$ 292.1 |
|||
|
Less: Net income (loss) attributable to noncontrolling interests |
1.1 |
0.1 |
1.0 |
(0.3) |
|||
|
Net income (loss) attributable to FMC stockholders |
$ 66.7 |
$ 295.1 |
$ 51.2 |
$ 292.4 |
|||
|
Amounts attributable to FMC stockholders: |
|||||||
|
Income (loss) from continuing operations |
$ 43.3 |
$ 297.9 |
$ 34.8 |
$ 307.7 |
|||
|
Discontinued operations, net of tax |
23.4 |
(2.8) |
16.4 |
(15.3) |
|||
|
Net income (loss) |
$ 66.7 |
$ 295.1 |
$ 51.2 |
$ 292.4 |
|||
|
Basic earnings (loss) per common share attributable to FMC stockholders: |
|||||||
|
Continuing operations |
$ 0.34 |
$ 2.37 |
$ 0.28 |
$ 2.45 |
|||
|
Discontinued operations |
0.19 |
(0.02) |
0.13 |
(0.12) |
|||
|
Basic earnings per common share |
$ 0.53 |
$ 2.35 |
$ 0.41 |
$ 2.33 |
|||
|
Average number of shares outstanding used in basic earnings per share computations |
125.2 |
125.0 |
125.1 |
125.0 |
|||
|
Diluted earnings (loss) per common share attributable to FMC stockholders: |
|||||||
|
Continuing operations |
$ 0.34 |
$ 2.37 |
$ 0.28 |
$ 2.45 |
|||
|
Discontinued operations |
0.19 |
(0.02) |
0.13 |
(0.12) |
|||
|
Diluted earnings per common share |
$ 0.53 |
$ 2.35 |
$ 0.41 |
$ 2.33 |
|||
|
Average number of shares outstanding used in diluted earnings per share computations |
125.6 |
125.4 |
125.5 |
125.3 |
|||
|
Other Data: |
|||||||
|
Capital additions and other investing activities |
$ 9.8 |
$ 14.4 |
$ 47.2 |
$ 37.8 |
|||
|
Depreciation and amortization expense |
43.4 |
44.3 |
87.1 |
90.0 |
|||
|
FMC CORPORATION RECONCILIATION OF NON-GAAP FINANCIAL MEASURES
RECONCILIATION OF NET INCOME (LOSS) ATTRIBUTABLE TO FMC STOCKHOLDERS (GAAP) TO ADJUSTED AFTER-TAX EARNINGS FROM CONTINUING OPERATIONS, ATTRIBUTABLE TO FMC STOCKHOLDERS (NON-GAAP) (Unaudited and in millions, except per share amounts) |
|||||||
|
Three Months Ended June 30, |
Six Months Ended June 30, |
||||||
|
2025 |
2024 |
2025 |
2024 |
||||
|
Net income (loss) attributable to FMC stockholders (GAAP) |
$ 66.7 |
$ 295.1 |
$ 51.2 |
$ 292.4 |
|||
|
Corporate special charges (income): |
|||||||
|
Restructuring and other charges (income) (a) |
36.7 |
95.1 |
54.5 |
136.0 |
|||
|
Non-operating pension, postretirement, and other charges (income) (b) |
6.6 |
4.2 |
9.8 |
8.5 |
|||
|
Income tax expense (benefit) on Corporate special charges (income) (c) |
(6.8) |
(13.8) |
(11.2) |
(23.4) |
|||
|
Discontinued operations attributable to FMC stockholders, net of income taxes (d) |
(23.4) |
2.8 |
(16.4) |
15.3 |
|||
|
Tax adjustment (e) |
6.9 |
(304.3) |
21.2 |
(304.3) |
|||
|
Adjusted after-tax earnings from continuing operations attributable to FMC stockholders (Non-GAAP) (1) |
$ 86.7 |
$ 79.1 |
$ 109.1 |
$ 124.5 |
|||
|
Diluted earnings per common share (GAAP) |
$ 0.53 |
$ 2.35 |
$ 0.41 |
$ 2.33 |
|||
|
Corporate special charges (income) per diluted share, before tax: |
|||||||
|
Restructuring and other charges (income) |
0.29 |
0.76 |
0.43 |
1.09 |
|||
|
Non-operating pension, postretirement, and other charges (income) |
0.05 |
0.03 |
0.08 |
0.07 |
|||
|
Income tax expense (benefit) on Corporate special charges (income), per diluted share |
(0.04) |
(0.11) |
(0.09) |
(0.19) |
|||
|
Discontinued operations attributable to FMC stockholders, net of income taxes per diluted share |
(0.19) |
0.02 |
(0.13) |
0.12 |
|||
|
Tax adjustments per diluted share |
0.05 |
(2.42) |
0.17 |
(2.43) |
|||
|
Diluted adjusted after-tax earnings from continuing operations per share, attributable to FMC stockholders (Non-GAAP) |
$ 0.69 |
$ 0.63 |
$ 0.87 |
$ 0.99 |
|||
|
Average number of shares outstanding used in diluted adjusted after-tax earnings from continuing operations per share computations |
125.6 |
125.4 |
125.5 |
125.3 |
|||
|
____________________ |
|
|
(1) |
Referred to as Adjusted earnings. The Company believes that Adjusted earnings, a Non-GAAP financial measure, and its presentation on a per share basis provides useful information about the Company's operating results to management, investors, and securities analysts. Adjusted earnings excludes the effects of corporate special charges, tax-related adjustments and the results of our discontinued operations. The Company also believes that excluding the effects of these items from operating results allows management and investors to compare more easily the financial performance of its underlying business from period to period. |
|
(a) |
Three Months Ended June 30, 2025: |
|
Restructuring and other charges (income) includes restructuring charges of $13.0 million primarily related to the previously announced global restructuring plan, referred to as "Project Focus." Charges incurred related to Project Focus consist of $4.9 million of professional service provider costs and other miscellaneous charges, $5.4 million of severance and employee separation costs, and accelerated depreciation of $2.5 million on assets identified for disposal in connection with the restructuring initiative. Other charges (income) of $23.7 million is comprised of $7.4 million of charges associated with our environmental sites, a charge of $11.9 million due to changes in our estimate for Furadan disposal costs at our Middleport site, and $4.4 million of other miscellaneous charges. |
|
|
Three Months Ended June 30, 2024: |
|
|
Restructuring and other charges (income) includes restructuring charges of $83.8 million primarily related to Project Focus. Charges incurred related to Project Focus consist of $53.3 million of non-cash asset write-off charges resulting from the contract termination with one of our third-party manufacturers, $18.6 million of severance and employee separation costs, including costs associated with the CEO transition, $6.5 million of professional service provider costs and other miscellaneous charges, and accelerated depreciation of $5.9 million on assets identified for disposal in connection with the restructuring initiative. Other charges (income) of $11.3 million is comprised of $5.7 million of charges associated with our environmental sites and $5.6 million of other miscellaneous charges. |
|
|
Six Months Ended June 30, 2025: |
|
|
Restructuring and other charges (income) includes restructuring charges of $26.6 million primarily related to the previously announced global restructuring plan, referred to as "Project Focus." Charges incurred related to Project Focus consist of $11.5 million of professional service provider costs and other miscellaneous charges, $9.6 million of severance and employee separation costs, and accelerated depreciation of $5.6 million on assets identified for disposal in connection with the restructuring initiative. Other charges (income) of $27.9 million is comprised of $10.9 million of charges associated with our environmental sites, a charge of $11.9 million due to changes in our estimate for Furadan disposal costs at our Middleport site, and $5.1 million of other miscellaneous charges. |
|
|
Six Months Ended June 30, 2024: |
|
|
Restructuring and other charges (income) includes restructuring charges of $117.5 million primarily related Project Focus. Charges incurred in connection with Project Focus consist of $53.3 million of non-cash asset write off charges resulting from the contract termination with one of our third-party manufacturers, $37.5 million of severance and employee separation costs, including costs associated with the CEO transition, $18.7 million of professional service provider costs and other miscellaneous charges, and accelerated depreciation of $8.2 million on assets identified for disposal in connection with the restructuring initiative. Other charges (income) of $18.5 million is comprised of $9.0 million of charges associated with our environmental sites and $9.5 million of other miscellaneous charges. |
|
|
(b) |
Our non-operating pension, postretirement and other charges (income) includes those costs (benefits) related to interest, expected return on plan assets, amortized actuarial gains and losses and the impacts of any plan curtailments or settlements. These are excluded from our Adjusted Earnings and are primarily related to changes in pension plan assets and liabilities which are tied to financial market performance and we consider these costs to be outside our operational performance. We continue to include the service cost and amortization of prior service cost in our Adjusted Earnings results noted above. These elements reflect the current year operating costs to our businesses for the employment benefits provided to active employees. The three and six months ended June 30, 2025 also includes other charges of $3.3 million incurred as a make-whole premium in connection with the early redemption of $500 million of the Senior Notes due May 18, 2026. |
|
(c) |
The income tax expense (benefit) on Corporate special charges (income) is determined using the applicable rates in the taxing jurisdictions in which the corporate special charge or income occurred and includes both current and deferred income tax expense (benefit) based on the nature of the non-GAAP performance measure. |
|
(d) |
Discontinued operations includes provisions, net of recoveries, for environmental liabilities and legal reserves and expenses related to previously discontinued operations and retained liabilities. We recorded a $34.5 million reduction in our legal reserve in discontinued operations for the three and six months ended June 30, 2025 as a result of a decrease in outstanding cases. |
|
(e) |
We exclude the GAAP tax provision, including discrete items, from the Non-GAAP measure of income, and include a Non-GAAP tax provision based upon the projected annual Non-GAAP effective tax rate. The GAAP tax provision includes certain discrete tax items including, but are not limited to: income tax expenses or benefits that are not related to continuing operating results in the current year; tax adjustments associated with fluctuations in foreign currency remeasurement of certain foreign operations; certain changes in estimates of tax matters related to prior fiscal years; certain changes in the realizability of deferred tax assets and related interim accounting impacts; and changes in tax law. In 2024 and 2023, we recorded significant deferred tax assets due to various tax incentives granted to the Company's Swiss subsidiaries (the "Swiss Tax Incentives"). The initial recognition of these Swiss Tax Incentives did not impact our adjusted non-GAAP effective tax rate but will be considered annually as we realize the benefits. Management believes excluding these discrete tax items, as well as the impacts of the Swiss Tax Incentives annually as the related benefits are realized, assists investors and securities analysts in understanding the tax provision and the effective tax rate related to continuing operating results thereby providing investors with useful supplemental information about FMC's operational performance. |
|
Three Months Ended June 30, |
Six Months Ended June 30, |
||||||
|
(in Millions) |
2025 |
2024 |
2025 |
2024 |
|||
|
Tax adjustments: |
|||||||
|
Revisions to valuation allowances of historical deferred tax assets |
$ — |
$ — |
$ (1.2) |
$ (1.6) |
|||
|
Net impact of Switzerland tax incentives |
10.5 |
(300.0) |
13.3 |
(300.0) |
|||
|
Foreign currency remeasurement and other discrete items |
(3.6) |
(4.3) |
9.1 |
(2.7) |
|||
|
Total Non-GAAP tax adjustments |
$ 6.9 |
$ (304.3) |
$ 21.2 |
$ (304.3) |
|||
|
RECONCILIATION OF NET INCOME (LOSS) (GAAP) TO ADJUSTED EARNINGS FROM CONTINUING OPERATIONS, BEFORE INTEREST, INCOME TAXES, DEPRECIATION AND AMORTIZATION, AND NONCONTROLLING INTERESTS (NON-GAAP) |
|||||||
|
(Unaudited, in millions) |
|||||||
|
Three Months Ended June 30, |
Six Months Ended June 30, |
||||||
|
2025 |
2024 |
2025 |
2024 |
||||
|
Net income (loss) (GAAP) |
$ 67.8 |
$ 295.2 |
$ 52.2 |
$ 292.1 |
|||
|
Restructuring and other charges (income) |
36.7 |
95.1 |
54.5 |
136.0 |
|||
|
Non-operating pension, postretirement, and other charges (income) |
6.6 |
4.2 |
9.8 |
8.5 |
|||
|
Discontinued operations, net of income taxes |
(23.4) |
2.8 |
(16.4) |
15.3 |
|||
|
Interest expense, net |
61.0 |
63.6 |
111.1 |
125.3 |
|||
|
Depreciation and amortization |
43.4 |
44.3 |
87.1 |
90.0 |
|||
|
Provision (benefit) for income taxes |
14.4 |
(303.5) |
27.9 |
(304.9) |
|||
|
Adjusted earnings from continuing operations, before interest, income taxes, depreciation and amortization, and noncontrolling interests (Non-GAAP) (1) |
$ 206.5 |
$ 201.7 |
$ 326.2 |
$ 362.3 |
|||
|
___________________ |
|
|
(1) |
Referred to as Adjusted EBITDA. Defined as operating profit excluding restructuring and other charges (income) and depreciation and amortization expense. |
|
RECONCILIATION OF CASH PROVIDED (REQUIRED) BY OPERATING ACTIVITIES OF CONTINUING OPERATIONS (GAAP) TO FREE CASH FLOW (NON-GAAP) |
|||||||
|
(Unaudited, in millions) |
|||||||
|
Three Months Ended June 30, |
Six Months Ended June 30, |
||||||
|
2025 |
2024 |
2025 |
2024 |
||||
|
Cash provided (required) by operating activities of continuing operations (GAAP) (1) |
$ 65.9 |
$ 292.2 |
$ (479.1) |
$ 149.3 |
|||
|
Capital expenditures |
(15.0) |
(9.9) |
(46.6) |
(30.6) |
|||
|
Other investing activities |
5.2 |
(4.5) |
(0.6) |
(7.2) |
|||
|
Capital additions and other investing activities |
$ (9.8) |
$ (14.4) |
$ (47.2) |
$ (37.8) |
|||
|
Cash provided (required) by operating activities of discontinued operations |
(16.4) |
2.6 |
(29.7) |
(18.9) |
|||
|
Free cash flow (Non-GAAP) (2) |
$ 39.7 |
$ 280.4 |
$ (556.0) |
$ 92.6 |
|||
|
___________________ |
|
|
(1) |
Includes cash payments made in connection with our Project Focus transformation program of $14.9 million and $23.6 million for the three months ended June 30, 2025 and 2024, respectively, and $70.6 million and $63.5 million for the six months ended June 30, 2025 and 2024, respectively. |
|
(2) |
Free cash flow is defined as cash provided (required) by operating activities of continuing operations (GAAP) adjusted for spending for capital additions and other investing activities as well as cash provided (required) by discontinued operations and divestiture transaction costs associated with the sale of our GSS business. We believe that this Non-GAAP financial measure provides a useful basis for investors and securities analysts to evaluate the cash generated by routine business operations, including to assess our our ability to repay debt, fund acquisitions and return capital to shareholders through share repurchases and dividends. Our use of free cash flow has limitations as an analytical tool and should not be considered in isolation or as a substitute for an analysis of our results under U.S. GAAP. |
|
RECONCILIATION OF REVENUE CHANGE (GAAP) TO ORGANIC REVENUE CHANGE (NON-GAAP) (1) (Unaudited) |
|||
|
Three Months Ended June 30, 2025 vs. 2024 |
Six Months Ended June 30, 2025 vs. 2024 |
||
|
Total Revenue Change (GAAP) |
1 % |
(6) % |
|
|
Less: Foreign Currency Impact |
(1) % |
(2) % |
|
|
Organic Revenue Change (Non-GAAP) |
2 % |
(4) % |
|
|
___________________ |
|
|
(1) |
We believe organic revenue growth (non-GAAP) provides management and investors with useful supplemental information regarding our ongoing revenue performance and trends by presenting revenue growth excluding the impact of fluctuations in foreign exchange rates. |
|
RECONCILIATION OF NET INCOME (LOSS) ATTRIBUTABLE TO FMC STOCKHOLDERS (GAAP) TO RETURN ON INVESTED CAPITAL ("ROIC") NUMERATOR (NON-GAAP) AND ADJUSTED ROIC (USING NON-GAAP NUMERATOR)(1) (Unaudited) |
|||
|
Twelve Months Ended |
|||
|
June 30, 2025 |
|||
|
Net income (loss) attributable to FMC stockholders (GAAP) |
$ 99.9 |
||
|
Interest expense, net, net of income taxes |
195.2 |
||
|
Corporate special charges (income) |
157.8 |
||
|
Income tax expense (benefit) on Corporate special charges (income) |
(24.9) |
||
|
Discontinued operations attributable to FMC stockholders, net of income taxes |
30.1 |
||
|
Tax adjustments |
158.0 |
||
|
ROIC numerator (Non-GAAP) |
$ 616.1 |
||
|
June 30, 2025 |
June 30, 2024 |
||
|
Total debt |
$ 4,163.3 |
$ 4,179.1 |
|
|
Total FMC stockholders' equity |
4,397.0 |
4,559.4 |
|
|
Total debt and FMC stockholders' equity (GAAP) |
$ 8,560.3 |
$ 8,738.5 |
|
|
ROIC denominator (2 yr average total debt and FMC stockholders' equity) |
$ 8,649.4 |
||
|
ROIC (using Net income (loss) attributable to FMC stockholders (GAAP) as numerator) |
1.15 % |
||
|
Adjusted ROIC (using Non-GAAP numerator) |
7.12 % |
||
|
___________________ |
|
|
(1) |
We believe Adjusted ROIC (non-GAAP) provides management and investors with useful supplemental information regarding our utilization of capital provided by both equity and debt as well as our working capital and free cash flow management. Additionally, vesting of certain restricted stock awards granted to officers is connected to Adjusted ROIC as a performance metric. |
|
FMC CORPORATION CONDENSED CONSOLIDATED BALANCE SHEETS (Unaudited, in millions) |
|||
|
June 30, 2025 |
December 31, 2024 |
||
|
Cash and cash equivalents |
$ 438.2 |
$ 357.3 |
|
|
Trade receivables, net of allowance of $42.8 in 2025 and $39.4 in 2024 |
3,076.3 |
2,903.2 |
|
|
Inventories |
1,395.7 |
1,201.6 |
|
|
Prepaid and other current assets |
557.1 |
496.2 |
|
|
Total current assets |
$ 5,467.3 |
$ 4,958.3 |
|
|
Property, plant and equipment, net |
890.7 |
849.7 |
|
|
Goodwill |
1,527.0 |
1,507.0 |
|
|
Other intangibles, net |
2,401.4 |
2,360.7 |
|
|
Deferred income taxes |
1,549.5 |
1,523.8 |
|
|
Other long-term assets |
461.2 |
453.8 |
|
|
Total assets |
$ 12,297.1 |
$ 11,653.3 |
|
|
Short-term debt and current portion of long-term debt |
$ 893.3 |
$ 337.4 |
|
|
Accounts payable, trade and other |
906.0 |
768.5 |
|
|
Advanced payments from customers |
— |
453.8 |
|
|
Accrued and other liabilities |
819.8 |
755.2 |
|
|
Accrued customer rebates |
812.0 |
489.9 |
|
|
Guarantees of vendor financing |
61.5 |
85.5 |
|
|
Accrued pensions and other postretirement benefits, current |
3.0 |
6.4 |
|
|
Income taxes |
77.5 |
122.5 |
|
|
Total current liabilities |
$ 3,573.1 |
$ 3,019.2 |
|
|
Long-term debt, less current portion |
$ 3,270.0 |
$ 3,027.9 |
|
|
Long-term liabilities |
1,025.9 |
1,097.4 |
|
|
Equity |
4,428.1 |
4,508.8 |
|
|
Total liabilities and equity |
$ 12,297.1 |
$ 11,653.3 |
|
|
FMC CORPORATION CONDENSED CONSOLIDATED STATEMENTS OF CASH FLOWS (Unaudited, in millions) |
|||
|
Six Months Ended June 30, |
|||
|
2025 |
2024 |
||
|
Cash provided (required) by operating activities of continuing operations |
$ (479.1) |
$ 149.3 |
|
|
Cash provided (required) by operating activities of discontinued operations |
(29.7) |
(18.9) |
|
|
Cash provided (required) by investing activities of continuing operations |
(51.4) |
(39.6) |
|
|
Cash provided (required) by financing activities of continuing operations |
628.7 |
84.7 |
|
|
Effect of exchange rate changes on cash |
12.4 |
(6.4) |
|
|
Increase (decrease) in cash and cash equivalents |
$ 80.9 |
$ 169.1 |
|
|
Cash and cash equivalents, beginning of period |
$ 357.3 |
$ 302.4 |
|
|
Cash and cash equivalents, end of period |
$ 438.2 |
$ 471.5 |
|
Cision
View original content to download multimedia:https://www.prnewswire.com/news-releases/fmc-corporation-reports-second-quarter-results-at-high-end-of-guidance-range-302517824.html
SOURCE FMC Corporation
Harmony Gold Mining Co. Ltd. HMY and Gold Fields Limited GFI are prominent South Africa-based gold mining companies. They are benefiting from the surge in gold prices this year, driven by investor demand for safe-haven assets amid global economic uncertainties. While gold prices have fallen from their April 2025 highs, they remain favorable, aided by economic uncertainties, and are currently hovering above the $3,300 per ounce level. Against this backdrop, comparing these two gold producers is particularly relevant for investors seeking exposure to the precious metals sector.Despite the recent pullback, gold prices have gained roughly 27% this year. The aggressive trade policies, including sweeping new import tariffs announced by President Donald Trump, intensified global trade tensions and heightened investor anxiety, prompting the price rally. Also, central banks worldwide have been accumulating gold reserves, led by risks arising from Trump’s policies. Prices of the yellow metal catapulted to a record high of $3,500 per ounce on April 22. Increased purchases by central banks, hopes of interest rate cuts, and geopolitical tensions are expected to support gold prices. Let’s dive deep and closely compare the fundamentals of these two gold miners to determine which one is a better investment now.
The Case for Harmony
Harmony is South Africa's biggest gold producer by volume, with production of roughly 1.56 million ounces in fiscal 2024. It has a diverse portfolio of gold development projects spread across South Africa and Papua New Guinea (PNG). The company’s development projects currently in progress include the development of the Wafi-Golpu copper-gold project in PNG and the Eva Copper project in Australia. The Wafi-Golpu project is believed to be a game-changer for the company, with an estimated gold reserve of 13 million ounces. HMY is currently in negotiations with its joint venture partner, Newmont Corporation (NEM) and the PNG Government regarding the terms of a Mining Development Contract, which is required for a Special Mining Lease.The low-risk Eva Copper project in Australia offers additional upside, giving HMY a significant global copper-gold footprint. HMY acquired Eva Copper in 2022, adding a tier-one mining jurisdiction to its portfolio. The acquisition is in line with HMY’s objective of transitioning into a low-cost gold and copper mining company. The feasibility study update for the project is currently underway. HMY has received a conditional grant funding from the Queensland government, which will help accelerate the development of this project. It is subject to several conditions, including HMY reaching a positive final investment decision by January 2026. Eva Copper is expected to produce 55,000-60,000 tons of copper per annum. Harmony boasts a strong balance sheet and generates substantial cash flows, which allows it to finance its development projects and drive shareholder value. Its net cash climbed roughly 53% to $592 million at the end of the third quarter of fiscal 2025 (ended March 31, 2025), from $386 million at the end of first-half fiscal 2025 (ended Dec. 31, 2024). HMY also has a dividend policy to pay 20% of net free cash generated to its shareholders at its board’s discretion. HMY offers a dividend yield of 1.4% at the current stock price. It has a five-year annualized dividend growth rate of about 19.4%.
The Case for Gold Fields
Gold Fields continues to progress its strategic priorities that align with its three strategic pillars of the business, which include reliable and cost-effective delivery and improving the quality of its asset portfolio. GFI had a strong start to 2025 with attributable equivalent gold production climbing roughly 19% year over year to 551,000 ounces in the first quarter. Gold Fields remains on track to meet its production guidance for 2025. It expects gold equivalent production of 2.25-2.45 million ounces, which indicates year-over-year growth of 13% at the mid-point. In October 2024, Gold Fields completed the acquisition of Osisko Mining. This move is in sync with GFI’s goal to strengthen its portfolio through investments in high-quality and long-life assets. The acquisition enables GFI to expand its presence in Quebec, a Tier 1 mining jurisdiction. It will allow the company to use its expertise in greenfields exploration, project development and underground mining.GFI is advancing its high-grade Windfall project in Quebec, targeting 300,000 ounces of gold annually. It acquired 100% ownership of the Windfall project through the completion of its Osisko Mining buyout. Gold Fields is focused on obtaining the required environmental approvals for full-scale construction and mining.Production ramp-up also continues at Salares Norte in Chile, with commercial levels of production expected in the third quarter of 2025, followed by steady state throughput during the fourth quarter. Gold equivalent production from the mine is expected to be between 325,000 ounces and 375,000 ounces for 2025. GFI is conducting extensive exploration drilling to identify life extension opportunities at the mine.The proposed acquisition of Gold Road offers additional upside. Gold Fields, in May 2025, agreed to acquire 100% of the issued and outstanding share capital of Gold Road Resources Limited. The acquisition, expected to be completed by October 2025, provides an opportunity to enhance GFI’s portfolio through the consolidation of the Gruyere mine in Western Australia, which Gold Fields already operates. Gold Road holds a 50% interest in the Gruyere gold mine in addition to a portfolio of 100%-owned exploration projects. The full ownership of Gruyere will offer GFI more flexibility regarding operation and future development opportunities, besides enhancing its cash-flow profile. Gold Fields remains committed to driving shareholder returns and reducing debt, leveraging healthy cash flow, aided by higher gold prices. It reduced net debt to $1,981 million at the end of the first quarter from $2,086 million at the end of the prior quarter. GFI offers a dividend yield of 2.5% at the current stock price. Its five-year annualized dividend growth rate is roughly 17.3%.
Price Performance and Valuation of HMY & GFI
Year to date, HMY stock has shot up 71%, while GFI stock has rallied 91.8% compared with the Zacks Mining – Gold industry’s increase of 55.4%.
Zacks Investment Research
Image Source: Zacks Investment Research
Harmony is currently trading at a forward 12-month earnings multiple of 4.93. This represents a roughly 60% discount when stacked up with the industry average of 12.4X.
Zacks Investment Research
Image Source: Zacks Investment Research
Gold Fields is trading at a premium to Harmony. The GFI stock is currently trading at a forward 12-month earnings multiple of 8.74, below the industry.
Zacks Investment Research
Image Source: Zacks Investment Research
How Does Zacks Consensus Estimate Compare for HMY & GFI?
The Zacks Consensus Estimate for HMY’s 2025 EPS implies a year-over-year rise of 190.8%. The EPS estimates for 2025 have been going up over the past 60 days.
Zacks Investment Research
Image Source: Zacks Investment Research
The consensus estimate for GFI’s 2025 EPS implies year-over-year growth of 93.9%. The EPS estimates for 2025 have been trending northward over the past 60 days.
Zacks Investment Research
Image Source: Zacks Investment Research
HMY or GFI: Which Stock Should You Bet on Now?
Both HMY and GFI currently have a Zacks Rank #1 (Strong Buy) each, so picking one stock is not easy. You can see the complete list of today’s Zacks #1 Rank stocks here.Both Harmony Gold and Gold Fields are well-positioned to capitalize on the current gold price environment. HMY appears to have an edge over GFI due to its more attractive valuation. In addition, Harmony Gold’s stronger growth projections suggest that it may offer better investment prospects in the current market environment. Investors seeking exposure to the gold space might consider HMY as the more favorable option at this time.
Want the latest recommendations from Zacks Investment Research? Today, you can download 7 Best Stocks for the Next 30 Days. Click to get this free report
Gold Fields Limited (GFI) : Free Stock Analysis Report
Harmony Gold Mining Company Limited (HMY) : Free Stock Analysis Report
This article originally published on Zacks Investment Research (zacks.com).
Southern Copper recently reported Q2 2025 earnings, highlighting an increase in net income and stable EPS despite a dip in quarterly sales. The company’s strategic shift towards value benchmarks, indicated by index constituent changes in June, likely reinforced investor confidence, coinciding with the market’s positive movement driven by optimism in corporate earnings and easing tariff concerns. With the overall market showing a 17% rise over the past year and consistent economic growth, Southern Copper’s 9% price increase last quarter seemed aligned with broader market trends and potentially buoyed by its robust year-to-date sales and income performance.
You should learn about the 1 warning sign we’ve spotted with Southern Copper.
SCCO Revenue & Expenses Breakdown as at Jul 2025
The recent Q2 2025 earnings report from Southern Copper, highlighting increased net income and stable EPS amid a dip in sales, brings attention to its ongoing narrative of capital investment-led growth. With a price increase of 9% last quarter, the stock seemed aligned with broader market optimism, reflecting investor confidence despite revenue challenges. This backdrop of optimism could bolster upcoming forecasts, though the dip in sales requires scrutiny of future revenue projections.
Over the past five years, Southern Copper’s total shareholder return has been an impressive 186.88%, marking substantial long-term growth. Nevertheless, in the past year, the company’s performance lagged behind both the market and the US Metals and Mining industry, which returned 17.5% and 14% respectively. This discrepancy highlights both the historical strength and recent underperformance of the company’s stock, pointing to potential volatility and investment risks.
The company’s commitment to expanding production through significant capital investments in Mexico and Peru could materially affect future revenue and earnings forecasts. Analysts anticipate revenue to grow by 1.7% annually over the next three years, with profits reaching US$4.2 billion by 2028. However, concerns over U.S.-China relations and rising costs may pose risks to these growth projections. The current share price of $96.66 sits slightly above the analyst consensus price target of $95.71, reflecting a minor deviation that underscores the importance of careful consideration of future market movements.
This article by Simply Wall St is general in nature. We provide commentary based on historical data and analyst forecasts only using an unbiased methodology and our articles are not intended to be financial advice. It does not constitute a recommendation to buy or sell any stock, and does not take account of your objectives, or your financial situation. We aim to bring you long-term focused analysis driven by fundamental data. Note that our analysis may not factor in the latest price-sensitive company announcements or qualitative material. Simply Wall St has no position in any stocks mentioned.
Companies discussed in this article include SCCO.
This article was originally published by Simply Wall St.
Have feedback on this article? Concerned about the content? Get in touch with us directly. Alternatively, email editorial-team@simplywallst.com
Materials stocks turned lower following the Federal Reserve’s decision to keep interest rates steady. The S&P 500’s materials sector was down 0.9% shortly after the decision that sent bond yields higher.
(Bloomberg) — The US copper market suffered its largest intra-day fall on record after President Donald Trump shocked traders by exempting the most widely imported form of copper from his planned tariffs.
Most Read from Bloomberg
Tariffs of 50% will apply to imports of semi-finished copper products from Aug. 1, but not to imports of refined metal, the White House said on Wednesday.
US copper futures on Comex plunged 20% after the announcement. Until Wednesday afternoon, US copper prices had been trading around 28% above benchmark copper futures on the London Metal Exchange, as traders anticipated the tariff would be applied to all refined metal imports.
The decision is the latest surprise from Trump to upend the copper market. When the US president first flagged the likelihood of tariffs early this year, he triggered a surge in US copper prices relative to the rest of the world and set off a race to ship copper to the US to beat the tariffs, delivering substantial profits to some of the world’s biggest metals traders.
Then earlier this month, he triggered a further surge in the US copper market with an announcement that the tariff would be 50% — twice what most market participants had been expecting — which sent prices to a new all-time high.
The decision to exclude refined copper — known as cathodes — from the tariffs is likely to further roil global trade flows of the metal, which plays a crucial role in the global economy thanks to its widespread use in electrical wiring. The massive volumes of copper that have been shipped to the US in recent months created a huge stockpile that now may be re-exported.
“If cathode is excluded, the arb is over,” said Michael Haigh, head of FIC and Commodity Research at Societe Generale. The market “should approach parity again.”
The move to differentiate between refined metal and semi-processed products in the tariff policy follows lobbying from the copper industry, with some key players arguing that the US did not have sufficient capacity to replace all of its copper imports immediately.
“The Trump Administration listened to the concerns of our industry and made a smart, strategic decision,” said Juan Ignacio Díaz, the president of the International Copper Association. “This action protects US interests while maintaining strong ties with reliable partners, ensuring a secure and resilient copper supply chain.”
Still, the prospect of import tariffs on refined copper may not have entirely disappeared. A proclamation published by the White House on Wednesday stated that the Department of Commerce had recommended a delayed imposition of import tariffs on refined metal, with the rate set at 15% starting in 2027, rising to 30% in 2028.
Trump directed the Secretary of Commerce to provide an update on US copper markets by the end of June 2026, so that the president could determine whether such “a phased universal import duty on refined copper” would be warranted.
The 50% import tariff announced on Wednesday will apply to semi-finished products such as copper pipes, wires, rods, sheets and tubes, and to copper-intensive goods like pipe fittings, cables, connectors and electrical components, according to the White House statement. Less processed goods, including copper ore, concentrates, mattes, cathodes and anodes are not subject to the tariffs.
The copper levies, which come under Section 232 of the Trade Expansion Act, will not stack on top of separate charges on automobile imports, which Trump put in place earlier this year, according to the White House. If a product is subject to auto tariffs, the import tax on vehicles will apply and not the copper duty, the White House said.
The White House also said it would require that 25% of high-quality copper scrap and forms of raw copper made in the US to be sold domestically.
However, the export requirements look unlikely to have any meaningful effect in the near term, since around 40% of US copper scrap and around 75% of US copper concentrates are already processed domestically.
Shares in US producers such as Freeport-McMoRan Inc. slumped as the proclamation eroded the American copper premium. The decision is a relief to major shippers of refined copper to the US led by Chilean state-owned supplier Codelco.
“This is good news for Chile, for Codelco, and for our customers in the USA,” Codelco Chairman Maximo Pacheco said.
–With assistance from Julian Luk and James Attwood.
(Updates with detail on future review of refined metal tariffs.)
Most Read from Bloomberg Businessweek
-
Russia Builds a New Web Around Kremlin’s Handpicked Super App
-
It’s Not Just Tokyo and Kyoto: Tourists Descend on Rural Japan
-
Everyone Loves to Hate Wind Power. Scotland Found a Way to Make It Pay Off
-
Cage-Free Eggs Are Booming in the US, Despite Cost and Trump’s Efforts
©2025 Bloomberg L.P.
Harmony Gold Mining Company Limited (NYSE:HMY) is one of the most profitable gold stocks to buy right now. On July 17, BMO Capital analyst Raj Ray initiated coverage of Harmony Gold Mining Company Limited (NYSE:HMY) with a Market Perform rating and a $16 price target.
An open pit mine with heavy excavation machinery toiling away against the backdrop of a hidden valley.
The analyst told investors in a research note that Harmony Gold Mining Company Limited (NYSE:HMY) is a South African senior gold producer experiencing geographical diversification and increasing copper exposure.
While the firm stated that it likes Harmony Gold Mining Company Limited’s (NYSE:HMY) operational setup, it also believes that the stock’s valuation is now broadly in line with the peer average.
Harmony Gold Mining Company Limited (NYSE:HMY) mines and explores gold and is involved in sales and financial management, building mines, open-pit operations, land rehabilitation, and mine closure.
The company’s operations are divided into the following segments: Tshepong Operations, Moab Khotsong, Bambanani, Joel, Doornkop, Target 1, Kusasalethu, Masimong, Unisel, Mponeng, Mine Waste Solutions, and Hidden Valley.
While we acknowledge the potential of HMY as an investment, we believe certain AI stocks offer greater upside potential and carry less downside risk. If you’re looking for an extremely undervalued AI stock that also stands to benefit significantly from Trump-era tariffs and the onshoring trend, see our free report on the best short-term AI stock.
READ NEXT: 30 Stocks That Should Double in 3 Years and 11 Hidden AI Stocks to Buy Right Now.
Disclosure: None. This article is originally published at Insider Monkey.
Harmony Gold Mining Co. Ltd. HMY remains confident in achieving its full-year fiscal 2025 production guidance, even though gold output declined year over year in the first nine months. The company produced roughly 1.11 million ounces during this period, down 6% from 1.18 million ounces a year ago, largely due to interruptions from unprecedented rainfall in South Africa, which impacted electricity supply to its West Wits operations. This impacted production from Mponeng, Doornkop and Kusasalethu operations. Nevertheless, Harmony expects to meet its production guidance of 1.4-1.5 million ounces of gold for fiscal 2025, banking on a stronger final quarter and improved performance at its high-grade Mponeng and Moab Khotsong assets. It raised its underground recovered grade guidance to 6.00g/t from 5.80g/t, driven by strong performances from Mponeng and Moab Khotsong, and now expects to attain above that revised target. The company’s continued investment in mine-life extension and asset optimization underscores its push for a strong finish to fiscal 2025. Among its peers, AngloGold Ashanti plc AU saw a 22% year-over-year surge in gold production to 720,000 ounces in first-quarter 2025. This was its strongest first-quarter production since the first quarter of 2020. The upside was driven by a strong performance from AngloGold Ashanti’s managed operations with solid gains at Siguiri, Cerro Vanguardia and the Australian operations. AngloGold Ashanti expects consolidated gold production between 2.900 million ounces and 3.225 million ounces for 2025.Gold Fields Limited GFI had a strong start to 2025 with attributable equivalent gold production climbing roughly 19% year over year to 551,000 ounces in the first quarter. Gold Fields remains on track to meet its production guidance for 2025. Gold Fields sees attributable gold equivalent production of between 2.25-2.45 million ounces for the full year.
HMY’s Price Performance, Valuation & Estimates
Shares of Harmony Gold have rallied 68.9% year to date against the Zacks Mining – Gold industry’s rise of 58.7%, thanks to a surge in gold prices.
Zacks Investment Research
Image Source: Zacks Investment Research
From a valuation standpoint, HMY is currently trading at a forward 12-month earnings multiple of 4.87, a roughly 61.7% discount to the industry average of 12.72X. It carries a Value Score of B.
Zacks Investment Research
Image Source: Zacks Investment Research
The Zacks Consensus Estimate for HMY’s fiscal 2025 earnings implies a year-over-year rise of 190.8%. The EPS estimates for fiscal 2025 have been trending higher over the past 60 days.
Zacks Investment Research
Image Source: Zacks Investment Research
HMY stock currently sports a Zacks Rank #1 (Strong Buy). You can see the complete list of today’s Zacks #1 Rank stocks here.
Want the latest recommendations from Zacks Investment Research? Today, you can download 7 Best Stocks for the Next 30 Days. Click to get this free report
AngloGold Ashanti PLC (AU) : Free Stock Analysis Report
Gold Fields Limited (GFI) : Free Stock Analysis Report
Harmony Gold Mining Company Limited (HMY) : Free Stock Analysis Report
This article originally published on Zacks Investment Research (zacks.com).
Harmony Gold Mining Company Limited (NYSE:HMY) is included in our list of the 10 Best Junior Gold Mining Stocks to Buy According to Billionaires.
A man, dressed in protective gear, holding a golden nugget freshly extracted from an underground mining shaft.
On June 23, 2025, ahead of its financial year-end on June 30, 2025, Harmony Gold Mining Company Limited (NYSE:HMY) reported a pre-year-end update. The company reaffirmed its 1.4 to 1.5 million ounces of total production guidance, while expecting its all-in sustaining costs to remain in the $0.057-$0.062 per kg range. Meanwhile, underground recovered grades have surpassed expectations, and capital expenditure is expected to be below the guided $0.61 billion.
The company’s capital allocation strategy allowed it to meet or exceed guidance for a 10th consecutive year. Furthermore, Harmony Gold Mining Company Limited (NYSE:HMY) reported a record interim dividend payment of $0.08 billion. Its share price on the domestic exchange also hit a record high in April.
Looking ahead, the company’s potential acquisition of MAC Copper Australia is expected to increase annual copper output by 40,000 tons, boosting free cash flow. Harmony Gold Mining Company Limited (NYSE:HMY) aims to focus its investment strategy on high-grade, low-risk assets like Hidden Valley and Mponeng. Harmony Gold Mining Company Limited (NYSE:HMY) also aims to advance feasibility studies at Eva Copper and permitting for the Tier 1 Wafi-Golpu project, strengthening its copper-gold growth trajectory.
With mineral properties located in South Africa, Papua New Guinea, and Australasia, Harmony Gold Mining Company Limited (NYSE:HMY) is focused on the exploration, extraction, and processing of gold, uranium, silver, and copper deposits. It is included in our list of the best gold stocks.
While we acknowledge the potential of HMY as an investment, we believe certain AI stocks offer greater upside potential and carry less downside risk. If you're looking for an extremely undervalued AI stock that also stands to benefit significantly from Trump-era tariffs and the onshoring trend, see our free report on the best short-term AI stock.
READ NEXT: 11 Most Undervalued Cloud Stocks Under $10 According to Hedge Funds and 11 Best Mineral Stocks to Buy According to Hedge Funds.
Disclosure: None.
OVERLAND PARK, Kan., July 29, 2025–(BUSINESS WIRE)–Compass Minerals (NYSE: CMP), a leading global provider of essential minerals, will release its third-quarter fiscal 2025 results Monday, Aug. 11, 2025, after the markets close. The company’s president and CEO, Edward C. Dowling Jr., and CFO, Peter Fjellman, will discuss these results on a conference call on Tuesday, Aug. 12, 2025, at 9:30 a.m. ET.
Access to the conference call will be available via webcast at investors.compassminerals.com or by dialing 1-800-715-9871. Callers must provide the conference ID number 7896827. Outside of the U.S. and Canada, callers may dial 1-646-307-1963. An audio replay of the conference call will be available on the company’s website.
About Compass Minerals
Compass Minerals (NYSE: CMP) is a leading global provider of essential minerals focused on safely delivering where and when it matters to help solve nature’s challenges for customers and communities. The company’s salt products help keep roadways safe during winter weather and are used in numerous other consumer, industrial, chemical and agricultural applications. Its plant nutrition products help improve the quality and yield of crops while supporting sustainable agriculture. Compass Minerals operates 12 production and packaging facilities with more than 1,800 employees throughout the U.S., Canada and the U.K. Visit compassminerals.com for more information about the company and its products.
View source version on businesswire.com: https://www.businesswire.com/news/home/20250729233257/en/
Contacts
Investor Contact Brent CollinsVice President, Treasurer & Investor Relations+1.913.344.9111InvestorRelations@compassminerals.com
Media Contact Kevin GabrielSenior Director, Corporate Affairs+1.913.344.9265MediaRelations@compassminerals.com
Toronto, Ontario–(Newsfile Corp. – July 28, 2025) – Minnova Corp. (TSXV: MCI) (OTC Pink: AGRDF) ("Minnova" or the "Company"), announces that further to its press releases of May 7, 2025, June 19, 2025, July 14, 2025 and July 22, 2025, it has completed the final tranche of its non-brokered private placement financing for gross proceeds of $150,000 through the issuance of 3,000,000 units (the "Units") at a price of $0.05 per Unit (the "Offering").
Each Unit was comprised of one common share of the Company (each, a "Common Share") and one-half of one whole Common Share purchase warrant (each whole warrant, a "Warrant") of the Company. Each Warrant entitles the holder thereof to purchase one Common Share at a price of $0.10 per Common Share for a period of two (2) years from the date of issuance, provided, however, that should the closing price at which the Common Shares trade on the TSX Venture Exchange (or any such other stock exchange in Canada as the Common Shares may trade at the applicable time) exceed $0.20 for twenty (20) consecutive trading days at any time following the date that is four months and one day after the date of issuance, the Company may accelerate the Warrant term (the "Reduced Warrant Term") such that the Warrants shall expire on the date which is 30 business days following the date a press release is issued by the Company announcing the Reduced Warrant Term.
Gross proceeds raised from the Offering will be used for the Company's PL Mine including; permitting, resource expansion and exploration drill program planning, as well as for general working capital purposes. All securities issued in connection with the Offering are subject to a hold period of four months plus a day from the date of issuance and the resale rules of applicable securities legislation.
The Offering constituted a related party transaction within the meaning of TSX Venture Exchange Policy 5.9 and Multilateral Instrument 61-101 – Protection of Minority Security Holders in Special Transactions ("MI 61-101") as an insider of the Company subscribed for 1,000,000 Units pursuant to the Offering. The Company is relying on the exemptions from the valuation and minority shareholder approval requirements of MI 61-101 contained in sections 5.5(b) and 5.7(1)(a) of MI 61-101, as the Company is not listed on a specified market and the fair market value of the participation in the Offering by the insider does not exceed 25% of the market capitalization of the Company in accordance with MI 61-101. The Company did not file a material change report in respect of the related party transaction at least 21 days before the closing of the of the Offering, which the Company deems reasonable in the circumstances in order to complete the Offering in an expeditious manner.
This press release does not constitute an offer to sell or a solicitation of an offer to buy the securities in the United States. The securities have not been and will not be registered under the United States Securities Act of 1933, as amended (the "U.S. Securities Act") or any state securities laws and may not be offered or sold within the United States or to U.S. Persons as defined under applicable United States securities laws unless registered under the U.S. Securities Act and applicable state securities laws or an exemption from such registration is available.
About Minnova Corp.
Minnova Corp. is focused on the restart of its PL Gold Mine, which included completion of a Positive Feasibility Study in 2018 using a long-term gold price of US$1,250 per ounce. The study concluded the restart of the PL Mine, at an average annual production rate of 46,493 ounces over a minimum 5-year mine life, was economically robust. Importantly the global resource remains open to expansion, as does the reserve. The PL Gold Mine benefits from a short pre-production timeline forecast at 15 months, a valid underground mining permit (Environment Act 1207E), an existing 1,000 tpd processing plant, over 7,000 meters of developed underground ramp to -135 metres depth. The project is fully road accessible and close to existing mining infrastructure in the prolific Flin Flon Greenstone Belt of Central Manitoba.
For more information please contact:
Minnova Corp.Gorden GlennPresident & Chief Executive OfficerTel: 647-985-2785
Investor Relations: info@minnovacorp.ca
Website: www.minnovacorp.ca
Forward-Looking Statements
Neither the TSX Venture Exchange nor its Regulation Services Provider (as that term is defined in the policies of the TSX Venture Exchange) accepts responsibility for the adequacy or accuracy of this release.
This news release contains certain "forward-looking information" within the meaning of applicable securities laws. Forward looking information is frequently characterized by words such as "plan", "expect", "project", "intend", "believe", "anticipate", "estimate", "may", "will", "would", "potential", "proposed" and other similar words, or statements that certain events or conditions "may" or "will" occur. These statements are only predictions. Forward-looking information is based on the opinions and estimates of management at the date the information is provided, and is subject to a variety of risks and uncertainties and other factors that could cause actual events or results to differ materially from those projected in the forward-looking information. For a description of the risks and uncertainties facing the Company and its business and affairs, readers should refer to the Company's Management's Discussion and Analysis. The Company undertakes no obligation to update forward-looking information if circumstances or management's estimates or opinions should change, unless required by law. The reader is cautioned not to place undue reliance on forward-looking information.
Not for distribution to U.S. Newswire Services or for dissemination in the United States. Any failure to comply with this restriction may constitute a violation of U.S. Securities laws.
NOT FOR DISSEMINATION INTO THE UNITED STATES
To view the source version of this press release, please visit https://www.newsfilecorp.com/release/260412
FMC Corporation (NYSE:FMC), a cheaply priced stock popular among hedge funds and offering upside potential, is included in our list of the 10 Cheap Lithium Stocks to Buy According to Hedge Funds.
A person inspecting a lithium-ion battery that is being recycled.
On July 14, 2025, KeyBanc increased its price target on FMC Corporation (NYSE:FMC) from $53 to $61, maintaining an ‘Overweight’ rating. For a stock that is trading at $43.21 as of the time of writing, representing a 41.17% upside, per the analyst. The analyst signals growing optimism around the company’s growth potential.
Meanwhile, two days later, FMC Corporation (NYSE:FMC)’s board declared a regular quarterly dividend of $0.58 per share, payable on October 16, 2025. Amid the volatile market environment, this points to the company’s commitment to shareholder returns and operational resilience.
With decades of experience in developing and producing lithium amides, lithium alkoxides, lithium metal hydrides, alkyllithiums, and aryllithiums, FMC Corporation (NYSE:FMC) has enabled the production of agricultural and pharmaceutical intermediates. It is included in our list of cheap lithium stocks.
FMC Corporation (NYSE:FMC), a global agricultural sciences company, offers sustainable crop protection and precision agriculture solutions. It is included in our list of cheap lithium stocks.
While we acknowledge the potential of FMC as an investment, we believe certain AI stocks offer greater upside potential and carry less downside risk. If you're looking for an extremely undervalued AI stock that also stands to benefit significantly from Trump-era tariffs and the onshoring trend, see our free report on the best short-term AI stock.
READ NEXT: 11 Most Undervalued Cloud Stocks Under $10 According to Hedge Funds and 11 Best Mineral Stocks to Buy According to Hedge Funds.
Disclosure: None.
Goliath Resources Limited
Infographic 1
Infographic 1
Infographic 2
Infographic 2
Infographic 3
Infographic 3
-
2025 drilling has more than doubled the known extent of the Bonanza Zone from 550 meters to over 1.1 km across and remains wide open with 100% of the drill holes intersecting substantial quartz-sulphide mineralization as well as 94% of drill holes containing gold visible to the naked eye (“VG”), assays pending.
-
Drilling has been completed in 34 holes (~25,000 meters) within the first month of drilling with 81 holes remaining (~35,000 meters) on Surebet. With 2 months remaining, the Company is on target to complete the planned and fully funded ~60,000 meter program with 9 rigs actively drilling.
-
Drill hole GD-25-317 intersected excellent gold mineralization in two separate intervals from the Bonanza Zone and the Surebet Zone that remain open, where 8 occurrences of gold visible to the naked eye were identified in quartz-stockwork and breccia zones containing moderate amounts of sphalerite, galena and pyrrhotite:
-
The Bonanza Zone interval consists of 3.17 g/t Au over 18.73 meters, including 5.10 g/t Au over 11 meters, including 11 g/t Au over 4.85 meters.
-
The Surebet Zone interval consists of 3.64 g/t Au over 9.40 meters, including 6.02 g/t Au over 5.50 meters.
-
The reported assays reflect gold only (AuEq value in intervals will be adjusted accordingly once Ag, Cu, Pb and Zn are received).
-
Accompanying infographics are available at: https://www.globenewswire.com/NewsRoom/AttachmentNg/54cbbc6a-4e52-46d7-8ef8-bae27c4e69f1
-
-
-
Drill hole GD-25-302 intersected substantial gold mineralization in two separate intervals within a 96.50 meter interval where 6 occurrences of gold visible to the naked eye were identified in an altered andesite unit with high density quartz-sulphide veining corresponding to the Bonanza Zone that remains open:
-
The first interval consists of 2.26 g/t Au over 19.00 meters, including 6.28 g/t Au over 6.00 meters, including 8.88 g/t Au over 4.00 meters.
-
The second interval consists of 1.59 g/t Au over 16.00 meters, including 3.44 g/t Au over 6.00 meters.
-
These new intervals extend the footprint of high-grade gold mineralization of the Bonanza Zone to the south by 150 meters increasing the resource potential of this zone that remains wide open.
-
The reported assays reflect gold only (AuEq value in intervals will be adjusted accordingly once Ag, Cu, Pb and Zn are received).
-
Accompanying infographics are available at: https://www.globenewswire.com/NewsRoom/AttachmentNg/6d522349-1f53-4b0d-8463-7c79aa699d7a
-
-
-
Drill hole GD-25-314 intersected 2.25 g/t Au over 4 meters, including 2.82 g/t Au over 3.15 meters part of the Bonanza Zone.
-
Drill hole GD-25-317 is located 180 meters to the northeast and GD-25-302 is located 420 meters to the east of drill hole GD-24-260, the highest grade gold interval drilled on Surebet to date (see news January 13, 2025), which assayed 34.52 g/t AuEq or 1.11 oz/T AuEq (34.47 g/t Au and 3.96 g/t Ag) over 39.00 meters including 132.93 g/t AuEq or 4.27 oz/T AuEq (132.78 g/t Au and 12.98 g/t Ag) over 10.00 meters, and 166.04 g/t AuEq or 5.34 oz/T AuEq (165.84 g/t Au and 16.07 g/t Ag) over 8.00 meters within an interval composed of altered andesite with substantial quartz-sulphide veining confirming the additional discovery potential for high-grade gold mineralization at the Surebet Discovery that remains wide open.
-
Accompanying infographics are available at: https://www.globenewswire.com/NewsRoom/AttachmentNg/6bfb0934-85ea-4347-82c7-2d3b9cb7a2ec
-
-
High-grade gold has now been recovered in three distinct rock packages discovered to date on Surebet. This includes the gently dipping gold-rich stacked veins, the gold-rich intermediate to felsic Eocene-aged Reduced Intrusive Related Gold (RIRG) near vertical dykes, and the newly discovered broad gold-rich zones of calc-silicate altered breccia, all of which contain substantial amounts of gold visible to the naked eye and remain wide open for expansion, confirming the presence of the Motherlode magmatic source at depth, a causative intrusion responsible for the extensive 1.8 km2 high-grade gold system at Surebet.
-
The 2025 planned campaign is under way and consists of 60,000 meters (recently increased from 40,000 meters) of systematic drilling with 9 drill rigs. The campaign aims at expanding the full geometry of the Surebet discovery laterally and to depth. 100% of the drilling will be focused on the Surebet Discovery, where the Company has designed a detailed drill plan that will consist of:
-
Testing for the Motherlode Magmatic intrusive gold source;
-
Testing an additional 13 Eocene-aged dykes observed on the surface that have never been drill tested for RIRG mineralization;
-
Infill drilling with the goal of increasing pierce points density in all known stacked veins with a particular focus on the highest-grade areas from the Bonanza Zone and Surebet Zone intersection domain;
-
Testing zones where the RIRG Eocene-aged dykes and gently dipping veins crosscut which are being called Goldilocks Zones as they are key locations where there are two styles of gold mineralization enriching the zones; and
-
Expanding the known mineralized veins laterally and to depth where they currently remain open.
-
TORONTO, July 28, 2025 (GLOBE NEWSWIRE) — Goliath Resources Limited (TSX-V: GOT) (OTCQB: GOTRF) (FSE: B4IF) (the “Company” or “Goliath”) is very pleased to announce positive assay results from drill hole GD-25-317 which assayed 3.17 g/t Au over 18.73 meters, including 5.10 g/t Au over 11 meters, including 11 g/t Au over 4.85 meters within the Bonanza Zone that remains wide open at Surebet on the 100 % controlled Golddigger Property (the “Property”), Golden Triangle, British Columbia. An additional gold-rich interval in the same hole consists of 3.64 g/t Au over 9.40 meters, including 6.02 g/t Au over 5.50 meters part of the Surebet Zone.
Two intervals of high-grade gold mineralization were also intersected in drill hole GD-25-302 that assayed 2.26 g/t Au over 19.00 meters, including 6.28 g/t Au over 6.00 meters, including 8.88 g/t Au over 4.00 meters, and 1.59 g/t Au over 16.00 meters, including 3.44 g/t Au over 6.00 meters. These new intervals extend the footprint of high-grade gold mineralization of the Bonanza Zone to the south by 150 meters increasing the resource potential of this zone that remains wide open, confirming the additional discovery potential for high-grade gold mineralization at the Surebet Discovery.
The Company has completed 25,000 meters of drilling (out of 60,000 meters planned and fully funded for 2025), with 100% of the drill holes intersecting substantial quartz-sulphide mineralization as well as 94 % of the holes contain gold visible to the naked eye. The reported assays reflect gold only (AuEq value in interval will be adjusted accordingly once Ag, Cu, Pb and Zn are received).
Mr. Roger Rosmus, Founder & CEO of Goliath states: "Receiving exceptional gold only assays of 3.17 g/t Au over 18.73 meters, including 5.10 g/t Au over 11 meters, including 11 g/t Au over 4.85 meters from the first new holes completed in 2025 is a testament to the strong high-grade gold potential at Surebet. With 100% of drill holes completed this year intersecting mineralization, as well as 94% of the holes containing gold visible to the naked eye, we are on track to complete the most ambitious drill program on Surebet to date with 25,000 meters completed and 35,000 meters to go for a total of 60,000 meters that is fully funded. We are looking forward to releasing additional assay results and updating the gold-equivalent (AuEq) hole results as they become available.”
Drill hole GD-25-317 intersected 5 occurrences of gold visible to the naked eye (“VG”) hosted in veins that are part of a quartz-stockwork in sandstone units containing moderate amounts of sulphides such as sphalerite, galena and pyrrhotite. A 27.68 meter interval with high-density of quartz-sulphide veining from 332.88 meters to 360.56 meters contains 2 occurrences of visible gold at 355.90 meters and 359.47 meters from the Surebet Zone. Another 19.83 meter interval from 441.90 meters to 461.73 meters contains multiple quartz-sulphide veins up to 50 cm wide with 2 occurrences of visible gold at 457.02 meters and 459.66 meters from the Bonanza Zone. Additional VG was identified at 256.90 m. The new intercept is located 180 meters to the northeast of drill hole GD-24-260, the highest grade gold interval drilled on Surebet to date, which assayed 34.52 g/t AuEq or 1.11 oz/T AuEq (34.47 g/t Au and 3.96 g/t Ag) over 39.00 meters including 132.93 g/t AuEq or 4.27 oz/T AuEq (132.78 g/t Au and 12.98 g/t Ag) over 10.00 meters, and 166.04 g/t AuEq or 5.34 oz/T AuEq (165.84 g/t Au and 16.07 g/t Ag) over 8.00 meters within an interval composed of altered andesite with substantial quartz-sulphide veining (see news January 13, 2025). Drill hole GD-25-302 intersected 6 occurrences of VG over a 96.50 meter interval from 89.50 meters to 186.00 meters within an altered andesite unit with high density quartz-sulphide veining corresponding to the Bonanza Zone that remains open. The new intercept is located 420 meters to the east of drill hole GD-24-260.
Table 1: Assay highlights from 2025 drill holes reported in this news release.
|
Hole ID |
|
From (m) |
To (m) |
Interval (m) |
Au (g/t) |
|
GD-25-317 |
Interval |
352.00 |
361.40 |
9.40 |
3.64 |
|
including |
355.90 |
361.40 |
5.50 |
6.02 |
|
|
Interval |
443.00 |
461.73 |
18.73 |
3.17 |
|
|
including |
449.85 |
460.85 |
11.00 |
5.10 |
|
|
including |
456.00 |
460.85 |
4.85 |
11.00 |
|
|
GD-25-302 |
Interval |
99.00 |
115.00 |
16.00 |
1.59 |
|
Including |
103.00 |
109.00 |
6.00 |
3.44 |
|
|
Interval |
121.00 |
140.00 |
19.00 |
2.26 |
|
|
Including |
128.00 |
134.00 |
6.00 |
6.28 |
|
|
Including |
128.00 |
132.00 |
4.00 |
8.88 |
|
|
GD-25-314 |
Interval |
315.00 |
319.00 |
4.00 |
2.25 |
|
including |
315.00 |
318.15 |
3.15 |
2.82 |
|
|
|
|||||
High-grade gold mineralization has been confirmed in three distinct rock packages at the Surebet Discovery, which include: gently-dipping gold-rich mineralized stacked veins; gold-rich intermediate to felsic Eocene-aged RIRG dykes that crosscut the veins; and the broad zones of calc-silicate altered breccia. All three rock packages contain substantial amounts of VG and remain wide open, which strongly indicates the presence of a Motherlode magmatic causative source at depth responsible for the widespread high-grade gold mineralization at the Surebet Discovery.
Table 2: Collar information for drill hole GD-25-302 reported in this news release.
|
Hole ID |
CRS |
Northing (m) |
Easting (m) |
Elevation (m) |
Azimuth (deg) |
Dip (deg) |
Length (m) |
|
GD-25-317 |
NAD83 / UTM zone 9N |
6162777 |
457445 |
1511 |
130 |
67 |
717 |
|
GD-25-314 |
NAD83 / UTM zone 9N |
6162588 |
457018 |
1382 |
80 |
70 |
593 |
|
GD-25-302 |
NAD83 / UTM zone 9N |
6162509 |
457818 |
1141 |
195 |
69 |
1635 |
|
|
|||||||
The 2025 planned campaign is under way and consists of 60,000 meters (recently increased from 40,000 meters) of systematic drilling with 9 drill rigs. The campaign aims at expanding the full geometry of the Surebet discovery laterally and to depth. 100% of the drilling will be focused on the Surebet Discovery, where the Company has designed a detailed drill plan that will consist of: testing for the Motherlode Magmatic intrusive gold source; testing an additional 13 Eocene-aged dykes observed on the surface that have never been drill tested for RIRG mineralization; infill drilling with the goal of increasing pierce points density in all known stacked veins with a particular focus on the highest-grade areas from the Bonanza Zone and Surebet Zone intersection domain; testing zones where the RIRG dykes and gently dipping veins crosscut which are being called Goldilocks Zones as they are key locations where there are two styles of gold mineralization enriching the zones; and expanding the known mineralized veins laterally and to depth where they currently remain open.
2025 re-logging initiative
Recently released results from the re-logging of holes drilled between 2021 – 2024 include a new interval from drill hole GD-22-64 (see news June 23, 2025) comprising a Reduced Intrusion Related Gold dyke believed to be directly related to the Motherlode feeder source that contained gold visible to the naked eye and assayed 6.31 g/t AuEq over 14.35 meters including 11.36 g/t AuEq over 7.85 meters, as well as drill hole GD-24-280 (see news July 7, 2025), which assayed 8.31 g/t Au over 23.00 meters, including 15.69 g/t Au over 11 meters, including 37.45 g/t Au or 1.20 oz/T over 4 meters hosted in the calc-silicate altered breccia within the high-grade gold Bonanza Zone.
From the early season re-logging initiative, assays are pending for an additional 6 drill holes containing VG associated with RIRG dykes, calc-silicate altered breccias and known stacked veins, including:
-
GD-24-277 (1 occurrence of VG, hosted in calc-silicate altered andesite breccia);
-
GD-22-102 (5 occurrences of VG, hosted in altered andesite);
-
GD-24-254 (2 occurrences of VG, hosted in andesite);
-
GD-24-267 (1 occurrence of VG hosted in sandstone); and
-
GD-24-244 (1 occurrence of VG hosted in an Eocene-aged dyke).
Table 3: Assay highlights from the 2025 re-logging program.
|
Hole ID |
|
From (m) |
To (m) |
Interval (m) |
Au (g/t) |
Ag (g/t) |
Cu (ppm) |
Pb (ppm) |
Zn (ppm) |
AuEq (g/t) |
|
GD-24-249 |
Interval |
89.00 |
91.95 |
2.95 |
1.71 |
0.73 |
0.01 |
0.00 |
0.01 |
1.72 |
|
GD-24-283 |
Interval |
527.50 |
530.15 |
2.65 |
0.35 |
0.52 |
0.00 |
0.00 |
0.01 |
0.37 |
|
GD-24-283 |
Interval |
534.00 |
536.00 |
2.00 |
0.93 |
1.05 |
0.01 |
0.00 |
0.12 |
0.98 |
|
GD-21-09 |
Interval |
136.50 |
139.21 |
2.71 |
0.29 |
1.37 |
0.00 |
0.01 |
0.02 |
0.32 |
|
|
||||||||||
Table 4: Collar information for drill holes from the 2025 re-logging program reported in this news release.
|
Hole ID |
CRS |
Northing (m) |
Easting (m) |
Elevation (m) |
Azimuth (deg) |
Dip (deg) |
Length (m) |
|
GD-21-09 |
NAD83 / UTM zone 9N |
6163076 |
457510 |
1657 |
140 |
62 |
388 |
|
GD-24-283 |
NAD83 / UTM zone 9N |
6162756 |
457363 |
1506 |
135 |
55 |
650 |
|
GD-24-249 |
NAD83 / UTM zone 9N |
6162560 |
457938 |
1138 |
10 |
80 |
396 |
|
|
|||||||
Surebet Discovery Highlights
-
32 out of 34 holes (or 94%) drilled thus far in 2025 contain gold visible to the naked eye and a 100% hit rate of drill holes have intersected substantial quartz-sulphide mineralization.
-
60 out of 64 holes (or 94%) drilled in 2024 contained gold visible to the naked eye up to 11.5 mm (7/16 inches) in size, all of which returned high-grade gold.
-
The best hole drilled to date is GD-24-260 previously reported from the Bonanza Zone assayed 34.52 g/t AuEq (34.47 Au and 3.96 Ag) over 39.00 meters, including 132.93 g/t AuEq (132.78 Au and 12.98 Ag) over 10.00 meters, and 166.04 g/t AuEq (165.84 Au and 16.07 Ag) over 8.00 meters (see news release dated January 13, 2025).
-
The best hole drilled to date from the RIRG Eocene-aged dykes is GD-22-58 that assayed 12.03 g/t AuEq (11.84 g/t Au and 15.61 g/t Ag) over 10.00 meters including 19.91 g/t AuEq (19.62 g/t Au and 25.61 g/t Ag) over 6.00 meters, including 23.82 g/t AuEq (23.47 g/t Au and 30.54 g/t Ag) over 5.00 meters, plus a second separate interval down hole of 8.59 g/t AuEq (8.35 g/t Au and 20.74 g/t Ag) over 5.00 meters (see news release dated March 13, 2025).
-
The best hole drilled to date from the third distinct rock package consisting of calc-silicate altered breccia is GD-24-280 that assayed 8.31 g/t Au over 23.00 meters, including 15.69 g/t Au over 11 meters, including 37.45 g/t Au or 1.20 oz/T over 4 meters within the Bonanza Zone (see news July 7, 2025).
-
Multiple gently-dipping gold-mineralized stacked veins have been identified every year on the Surebet high-grade gold discovery. Recent discoveries include RIRG Eocene-aged dykes, Goldilocks Zones where the veins and vertical RIRG dykes crosscut (which are characterized by having high-grade gold in two temperature regimes) and recently discovered high-grade gold in a third distinct rock package. Which continuously increase the potential tonnage and gold content of the high-grade gold system at the Surebet discovery.
-
A total of 12 stacked gently dipping high-grade gold veins extend for 1.2 kilometers at the Surebet discovery, have been enhanced by four high-grade RIRG Eocene-aged dykes that are up to 25 meters wide and exposed along strike at surface for up to 1,500 meters have been discovered and modelled to date (see news release dated June 23, 2025).
-
The footprint of the mineralization discovered to date at Surebet is 1.8 km2, the equivalent in size to >336 NFL football fields and remains open in all directions.
-
Thanks to the mountainous topography, mineralization in the veins is exposed on the surface for 2.1 km of strike (1.0 km on the south slope and 1.1 km on the north slope) with a vertical relief of 700 meters.
-
A study completed by the Colorado School of Mines confirms a new interpretation of the ore forming process of high-grade gold mineralization at Surebet and outlines a common magmatic source for the high-grade gold system, now in three distinct rock packages. Which gives the Surebet discovery tremendous untapped discovery potential to increase tonnage and gold content in the various known rock package. Until this study, researchers and explorers in the Golden Triangle had not recognized the high-grade gold discovery potential in the Eocene-aged RIRG dykes (see news release March 13, 2025), which is showing the potential that these discoveries could be a geological breakthrough in the Golden Triangle of British Columbia.
-
Goliath has drilled a total of 92,000 meters with over 400 pierce points on the Golddigger property between 2021 and 2024, which culminated in the updated geologic model used for this year’s drill planning.
-
The Surebet Discovery has predictable continuity and very good metallurgy with gold recoveries of 92.2% from gravity and flotation at a 327-micrometer crush including 48.8% free gold recovery from gravity alone (no cyanide required to recover the gold). The metallurgy completed to date shows a benign rock composition without deleterious elements (see news release March 1, 2023).
-
Based on positive grassroots exploration and drill results in recent years, Goliath significantly increased its land package from 66,608 hectares to 91,518 hectares (226,146 acres) and now controls 56 kilometers of key terrain of the Red Line geologic trend providing for additional upside discovery potential.
-
The Golddigger Property is located on tidewater with a barge route to Prince Rupert (190 km south) and close to infrastructure including the town of Kitsault adjacent to a permitted mine site on private property.
About Golddigger Property
The Golddigger Property is 100% controlled and covers an area of 91,518 hectares in a highly prospective geological setting of the Eskay Rift, within 3 kilometers of the Red Line in the Golden Triangle of British Columbia. This area, in close proximity to the Red Line, has hosted some of Canada’s greatest gold mines including Eskay Creek, Premier and Snip. Other significant and well-known deposits in the Golden Triangle include Brucejack, Copper Canyon, Galore Creek, Granduc, KSM, Red Chris, and Schaft Creek. Goliath controls 56 kilometers of the Red Line which is a geologic contact between Triassic age Stuhini rocks and Jurassic age Hazelton rocks used as key markers when exploring for gold-copper-silver mineralization.
The Surebet discovery has predictable continuity and excellent metallurgy with gold recoveries from gravity and flotation at a 327-micrometer crush of 92.2% including 48.8% free gold from gravity alone (no cyanide required to recover the gold). The metallurgy completed to date shows no deleterious elements are present (see news release dated March 1, 2023).
The Property is in an excellent location in close proximity to the communities of Alice Arm and Kitsault where there is a permitted mill site on private property. It is situated on tide water with direct barge access to Prince Rupert (190 kilometers via the Observatory inlet/Portland inlet). The town of Kitsault is accessible by road (190 kilometers from Terrace, 300 kilometers from Prince Rupert) and has a barge landing, dock, and infrastructure capable of housing at least 300 people, including high-tension power.
Additional infrastructure in the area includes the Dolly Varden Silver Mine Road (only 7 kilometers to the East of the Surebet discovery) with direct road access to Alice Arm barge landing (18 kilometers to the south of the Surebet discovery) and high-tension power (25 kilometers to the east of Surebet discovery). The city of Terrace (population 16,000) provides access to railway, major highways, and airport with supplies (food, fuel, lumber, etc.), while the town of Prince Rupert (population 12,000) is located on the West Coast of British Columbia and houses an international container seaport also with direct access to railway and an airport.
About CASERM (Center to Advance the Science of Exploration to Reclamation in Mining)
Goliath Resources is a paying member and active supporter of the Center to Advance the Science of Exploration to Reclamation in Mining (CASERM), which is one of the world’s largest research centers in the mining sector. CASERM is a collaborative research venture between Colorado School of Mines and Virginia Tech that is supported by a consortium of mining and exploration companies, analytical instrumentation and software companies, and federal agencies aiming to transform the way geoscience data is acquired and used across the mining value chain. The center forms part of the I-UCRC program of the National Science Foundation. Research focuses on the integration of diverse geoscience data to improve decision making across the mine life cycle, beginning with the exploration for subsurface resources continuing through mine operation as well as closure and environmental remediation. Over the past three years, Goliath Resources’ membership in CASERM has allowed a high level of research to be performed on the Surebet Discovery.
Qualified Person
Rein Turna P. Geo is the qualified person as defined by National Instrument 43-101, for Goliath Resource Limited projects, and supervised the preparation of, and has reviewed and approved, the technical information in this release. Mr. Turna is an Independent Director of the Company.
About Goliath Resources Limited
Goliath Resources is an explorer of precious metals projects in the highly prospective Golden Triangle of Northwestern British Columbia. All of its projects are in high quality geological settings and geopolitical safe jurisdictions amenable to mining in Canada. Goliath is a member and active supporter of CASERM which is an organization that represents a collaborative venture between Colorado School of Mines and Virginia Tech. Goliath has embarked on its largest drill campaign to date that is fully funded for up to 60,000 meters in total during 2025. The Company’s key strategic cornerstone shareholders include Crescat Capital, a Global Commodity Group (Singapore), McEwen Mining Inc. (NYSE: MUX) (TSX: MUX), Waratah Capital Advisors, Mr. Rob McEwen, Mr. Eric Sprott and Mr. Larry Childress.
For more information please contact:
Goliath Resources Limited Mr. Roger Rosmus Founder and CEO Tel: +1.416.488.2887roger@goliathresources.com www.goliathresourcesltd.com
Disclaimer
The reader is cautioned that grab samples are spot samples which are typically, but not exclusively, constrained to mineralization. Grab samples are selective in nature and collected to determine the presence or absence of mineralization and are not intended to be representative of the material sampled.
Oriented HQ-diameter or NQ-diameter diamond drill core from the drill campaign is placed in core boxes by the drill crew contracted by the Company. Core boxes are transported by helicopter to the staging area and then transported by truck to the core shack. The core is then re-orientated, meterage blocks are checked, meter marks are labelled, Recovery and RQD measurements taken, and primary bedding and secondary structural features including veins, dykes, cleavage, and shears are noted and measured. The core is then described and transcribed in MX DepositTM. Drill holes were planned using Leapfrog GeoTM and QGISTM software and data from the 2017-2024 exploration campaigns. Drill core containing quartz breccia, stockwork, veining and/or sulphide(s), or notable alteration is sampled in lengths of 0.5 to 1.5 meters. Core samples are cut lengthwise in half: one-half remains in the box and the other half is inserted in a clean plastic bag with a sample tag. The bagged samples are then weighed and secured with a zip tie. Certified reference materials (CRMs), blanks and duplicates are added in the sample stream at a rate of 10%. To ensure analytical anonymity, CRM identification labels are removed prior to submission to the laboratory. Additional out-of-sequence blanks are introduced immediately following core samples that contain visible gold or high-grade sulphide mineralization.
Grab, channels, chip and talus samples were collected by foot with helicopter assistance. Prospective areas included, but were not limited to, proximity to MINFile locations, placer creek occurrences, regional soil anomalies, and potential gossans based on high-resolution satellite imagery. The rock grab and chip samples were extracted using a rock hammer, or hammer and chisel to expose fresh surfaces and to liberate a sample of anywhere between 0.5 to 5.0 kilograms. All sample sites were flagged with biodegradable flagging tape and marked with the sample number. All sample sites were recorded using hand-held GPS units (accuracy 3-10 meters) and sample ID, easting, northing, elevation, type of sample (outcrop, subcrop, float, talus, chip, grab, etc.) and a description of the rock were recorded on all-weather paper. Samples are then inserted in a clean plastic bag with a sample tag for transport and shipping to the geochemistry lab. QA/QC samples including blanks, certified reference materials, and duplicate samples are inserted regularly into the sample sequence at a rate of 10%.
All samples are transported in rice bags sealed with numbered security tags. The rice bags are transported from the core shacks to the MSALABS facilities in Terrace, BC. MSALABS is certified with both AC89-IAS and ISO/IEC Standard 17025:2017. The core samples undergo preparation via drying, crushing to ~70% of the material passing a 2 mm sieve and riffle splitting. The sample splits are weighed and transferred into three plastic jars, each containing between 300 g and 500 g of crushed sample material. A 250 g split is pulverized to ensure at least 85% of the material passes through a 75 µm sieve. The crushed samples are transported to the MSALABS PhotonAssayTM facility in Prince George, where gold concentrations are quantified via photon assay analysis (method CPA-Au1). Samples that result in gold concentrations ≥5 ppm are analyzed to extinction. Photon assay uses high-energy X-rays (photons) to excite atomic nuclei within the jarred samples, inducing the emission of secondary gamma rays, which are measured to quantify gold concentrations. The assays from all jars are combined on a weight-averaged basis. Multielement analyses are carried at the MSALABS facilities in Surrey, BC, where 250 g of pulverized splits are analyzed via ICF6xx and IMS-230 methods. The IMS-230 method uses 4-acid digestion (a combination of hydrochloric, nitric, perchloric and hydrofluoric acids) followed by inductively coupled plasma emission spectrometry to quantify concentrations of 48 elements. Samples with over-limit results for Ag, Cu, Pb and Zn undergo ore-grade analysis via the ICF-6xx method (where ‘xx’ denotes the target metal). This method employs 4-acid digestion followed by inductively coupled plasma emission spectrometry.
Widths are reported in drill core lengths and the true widths are estimated to be 80-90% and Gold Equivalent (AuEq) metal values are calculated using: Au 2797.16 USD/oz, Ag 31.28 USD/oz, Cu 4.25 USD/lbs, Pb 1955.58 USD/ton and Zn 2750.50 USD/ton on January 31st, 2025. There is potential for economic recovery of gold, silver, copper, lead, and zinc from these occurrences based on other mining and exploration projects in the same Golden Triangle Mining Camp where Goliath’s project is located such as the Homestake Ridge Gold Project (Auryn Resources Technical Report, Updated Mineral Resource Estimate and Preliminary Economic Assessment on the Homestake Ridge Gold Project, prepared by Minefill Services Inc. Bothell, Washington, dated May 29, 2020). Here, AuEq values were calculated using 3-year running averages for metal price, and included provisions for metallurgical recoveries, treatment charges, refining costs, and transportation. Recoveries for Gold were 85.5%, Silver at 74.6%, Copper at 74.6% and Lead at 45.3%. It will be assumed that Zinc can be recovered with the Copper at the same recovery rate of 74.6%. The quoted reference of metallurgical recoveries is not from Goliath’s Golddigger Project, Surebet Zone mineralization, and there is no guarantee that such recoveries will ever be achieved, unless detailed metallurgical work such as in a Feasibility Study can be eventually completed on the Golddigger Project.
Neither the TSX Venture Exchange nor its Regulation Services Provider (as that term is defined in the policies of the TSX Venture Exchange), nor the OTCQB Venture Market accepts responsibility for the adequacy or accuracy of this release.
Certain statements contained in this press release constitute forward-looking information. These statements relate to future events or future performance. The use of any of the words "could", "intend", "expect", "believe", "will", "projected", "estimated" and similar expressions and statements relating to matters that are not historical facts are intended to identify forward-looking information and are based on Goliath’s current belief or assumptions as to the outcome and timing of such future events. Actual future results may differ materially. In particular, this release contains forward-looking information relating to, among other things, the ability of the Company to complete financings and its ability to build value for its shareholders as it develops its mining properties. Various assumptions or factors are typically applied in drawing conclusions or making the forecasts or projections set out in forward-looking information. Those assumptions and factors are based on information currently available to Goliath. Although such statements are based on management's reasonable assumptions, there can be no assurance that the proposed transactions will occur, or that if the proposed transactions do occur, will be completed on the terms described above.
The forward-looking information contained in this release is made as of the date hereof and Goliath is not obligated to update or revise any forward-looking information, whether as a result of new information, future events or otherwise, except as required by applicable securities laws. Because of the risks, uncertainties and assumptions contained herein, investors should not place undue reliance on forward-looking information. The foregoing statements expressly qualify any forward-looking information contained herein.
This announcement does not constitute an offer, invitation, or recommendation to subscribe for or purchase any securities and neither this announcement nor anything contained in it shall form the basis of any contract or commitment. In particular, this announcement does not constitute an offer to sell, or a solicitation of an offer to buy, securities in the United States, or in any other jurisdiction in which such an offer would be illegal.
The securities referred to herein have not been and will not be will not be registered under the United States Securities Act of 1933, as amended (the “U.S. Securities Act”), or any state securities laws and may not be offered or sold within the United States or to or for the account or benefit of a U.S. person (as defined in Regulation S under the U.S. Securities Act) unless registered under the U.S. Securities Act and applicable state securities laws or an exemption from such registration is available.
Nike (NKE) stock is climbing after being upgraded to Overweight from Neutral by JPMorgan, citing the company’s effective turnaround efforts. The firm also raised its price target for the stock to $93.
Copper mining company Freeport-McMoRan (FCX) stock is falling after a Chilean official said there may be a US tariff exemption for copper (HG=F).
Alibaba (BABA) announced its first pair of smart glasses. The Quark glasses will use the company’s large language model (LLM).
To watch more expert insights and analysis on the latest market action, check out more Market Catalysts here.
Video Transcript
Now, time for some of today’s trending tickers.
We are watching Nike, Freeport McMoRan, and Alibaba.
First up, Nike shares climbing this morning.
It got an upgrade from JPMorgan.
Analysts are upping the stock to overweight from neutral and raising their price target to $93.
They cited Nike’s turnaround plans, expecting recovery to begin in the second half of 2026, and the call, by the way, follows Goldman Sachs’ price target raised earlier this month on the basis of strong consumer demand and adjustments for tariff rates, as some of Nike’s biggest producers, including Vietnam and Indonesia, have reached trade deals with the US.
Still with me is Brooke De Palma, who tracks Nike closely.
So Brooke, it is interesting to see sentiment turning a little bit when it comes to Nike.
Yeah, very surprising compared to where we were a year ago.
We are seeing that stock move higher, up 9% year over year as the CEO there, Elliott Hill, who was named last fall, really makes this turnaround play or turnaround strategy get underway.
Of course, he’s trying to implement more consistent pricing, not as many price cuts that we’ve seen in the past.
He’s also trying to return to some of those wholesale partners like Foot Locker or Dick Sporting Goods worth noting.
Dick’s Sporting Goods has recently agreed to acquire Foot Locker and what we’ve seen over this past year is really this momentum for Nike to get underway to gain back its relevance.
It’s since lost to maybe Hoka as well as on running over these past few years as the strategy and the move to direct consumer came underway.
It’s also worth noting, as you mentioned at the top, these tariff negotiations have really taken a toll on Nike, Indonesia, Vietnam, China.
Those are some sourcing regions for Nike and so seeing this company overcome all those tariff negotiations and come out on top is what investors are really looking for here as well.
Yeah, definitely demand and cost both in focus here.
Let’s talk about shares of copper miner Freeport McMoRan.
They’re taking a hit after the finance minister of Chile said in an interview with a Chilean radio station that the country is hoping to receive an exemption on the US’s 50% tariff on copper.
Import shares of Freeport dropping as much as 5%.
Right now they’re down by about 3%, and this is while that Chilean finance minister’s in Washington and doing some talks with the US on here.
Freeport, one of the big producers here in the US, so the thinking was if there was this 50% tariff that stayed in place, Brooke, that you know that that Freeport and other US producers could maybe have an advantage.
So that’s going away, it seems the investors perceiving the opposite is true.
Yeah, we’re seeing this in line with copper futures.
Copper futures that ticker HG equals down about 3% in intraday trading as well.
And when you think about just how much copper makes up, it has to do with electronics.
It also has to do with automobiles, you know, vehicles have copper in them.
In addition to that, we also know that the home builder industry also has to do with.
Copper Essentially copper makes up all our electrical wires at home.
And so ultimately what was thought here was that copper was going to cost more, that consumers here in the US would have to pay higher for these these copper rates.
But now based on this latest announcement, then maybe we’re hoping for a bit of trade negotiation here and these copper tariffs to go away now essentially.
We’re reversing maybe those gains that we’ve seen copper over the past say really 2 months is up more than 20% or nearly 21%, and that’s largely once again because of this idea that copper was going to cost more here, right?
And finally on our trenders list, Alibaba, it’s debuting its first ever pair of smart glasses.
The Chinese e-commerce giant sharing the first look at its glasses.
They’re called Quark.
They’ll be powered by its large language model.
They’ll be equipped with its AI assistant and similar to Meta Glasses, the new Alibaba product can be used to make calls, listen to music, transcribe, or translate conversations.
Alibaba says the glasses will be released in China by the end of the year.
Those shares up about 2.5% in the US trading.
Would you wear these things?
Have you tried the Meta Glasses yet, Brooke?
Julie, I have never tried the glasses, but I was recently at a wedding.
I’ve been to many weddings so far this year and one of the guests there was actually recording one of the speeches with the glasses, and I was like this is the future and clearly now Alibaba wants a piece of that future in their hands as well.
We are seeing Alibaba shares once again as you said, move a bit higher on this new shares are up about.
2.5% year to date, Alibaba has really had this momentum behind it, of course, being a Chinese e-commerce giant, shares are up more than 46% year to date, and so it’s been pretty interesting to see how this Chinese e-commerce player has been able to come on to.
Now they’re getting into this conversation, of course, me out this week.
It will be interesting to hear if they have anything to say about their recent partnership with Ray-Ban as well.
Julie, have you tried them though?
I haven’t, but I love the idea of recording things with them because like nobody likes to be at something and you’ve got your, your phone up right this way.
You just look I like that.
I like it.
All right, thank you.
Hope you enjoy the rest of wedding season and you can scan the QR code below to track the best and worst performing stocks with Yahoo Finance’s trending tickers page.
This might be the most critical week for investors in years. In fact, in over two decades of investing, and more than a decade as a professional analyst, I’ve never seen a single week with this many potentially market-moving headlines. Between earnings surprises, critical inflation and jobs data, a Federal Reserve decision, and a looming tariff cliff, investors are facing a powder keg of risk. The S&P 500 might be flirting with record highs, but August 1st could bring a shift. I’ll walk you through each of the market-moving headlines to watch in this week’s stock market update.
Why August 1 Matters More than You Think
Trump’s proposed tariffs would affect major trading partners with rates up to 35% if deals aren’t finalized by the Friday deadline. China, Canada, Mexico, and the EU are all in last-minute negotiations. Some deals are in progress. China and Japan have agreed in principle to frameworks that would keep rates lower. But others remain unsettled. More impactful are the sector-specific tariffs already rolling out. Steel, copper, and car parts are under new restrictions. Trump has also threatened additional tariffs on pharmaceuticals, semiconductors, and lumber—some as high as 200%.
Who Benefits from the Tariff Storm?
These aren’t bargaining chips anymore. They’re weapons in a broader plan to repatriate manufacturing and redraw the global supply chain. And for some U.S.-based companies, this could be a windfall. Some stocks stand to benefit massively from this shifting landscape. Pharmaceuticals: The administration is floating a tariff of up to 200% on imported pharmaceuticals to push drugmakers back to U.S. soil. While the market hasn’t reacted strongly yet – due to assumptions that implementation will be delayed – the announcement alone could rattle drugmakers like Teva which leads in overseas generics manufacturing. On the flip side, companies like Eli Lilly (LLY) and Thermo Fisher Scientific (TMO), both with significant U.S. production, could see a tailwind.
Semiconductors: A proposed 25% tariff on imported chips and related equipment would impact a wide swath of industries, from autos to smartphones. But for U.S. fabricators like Intel (INTC) and Micron Technology (MU), this could be a breakout moment. Despite Intel’s recent disappointing earnings, its U.S. fabs in Arizona, New Mexico, and Ohio could become strategic assets. Copper & Steel: Tariffs on imported copper jump to 50% on August 1 and join the already high tariff on steel. That boosts domestic suppliers like Freeport-McMoRan (FCX), with shares already up 16% this year. Steel, too, is seeing a resurgence, with Cleveland-Cliffs (CLF) benefitting from its 100% U.S. flat-rolled production. Lumber: A brewing trade spat with Canada makes increased lumber tariffs all but certain. The administration is considering a 25% rate on Canadian softwood. Weyerhaeuser (WY), with over 10 million acres of U.S. timberland, could see higher prices and stronger margins.
Earnings to Watch This Week
As if tariffs weren’t enough, a packed earnings calendar has already sent individual stocks soaring or crashing over the last two weeks. Investors are rewarding companies that can boost guidance but severely punishing anyone failing to beat expectations. SoFi Technologies (SOFI) reports Tuesday with shares are up nearly 190% in a year but stuck around $21 each. With a price-to-book ratio of 3.5x, it's looking expensive for a bank stock. While growth is strong and the company’s digital banking model remains compelling, investors should be cautious at these levels. ARM Holdings (ARM) reports Wednesday and has already surged 30% this year. Riding the AI wave, ARM benefits from chip design dominance, but at 42x sales, it’s priced for perfection. Any dip could be a buying opportunity for long-term believers. Meta Platforms (META) and Microsoft (MSFT) also report Wednesday. Microsoft is expected to grow 14% annually but trades at 14x price to sales. Without a major AI breakthrough or less contention with OpenAI, it may struggle to justify the premium. Meta, meanwhile, trades at a more reasonable 11x sales and is aggressively expanding AI-driven advertising tools. I’d favor Meta at these levels and consider adding on dips. Robinhood Markets (HOOD) has defied the doubters, including me. Up 180% this year, the company is charging into tokenized assets and stock trading in Europe. With projected 27% revenue growth and expanding product lines, it’s hard to ignore, though margins and regulation remain concerns. Coinbase Global (COIN) reports Thursday and despite slow 12% projected revenue growth, its U.S.-regulated exchange status and Circle stablecoin exposure give it a unique edge. At 15x sales, it’s not cheap, but the long-term thesis is gaining momentum as crypto adoption grows. I love talking stocks and that face-to-face community we’re building on the YouTube channel. Join the Bow Tie Nation and check out all the 2025 stock picks on Let’s Talk Money!
The Wildcards: Fed Policy, Jobs & Inflation
Beyond earnings and tariffs, this week includes three economic landmines:
Federal Reserve Decision (Wednesday): The Fed is widely expected to hold rates steady, with CME FedWatch showing 97% odds of no rate cut. Rising inflation (up to 2.7% in June CPI) and a resilient job market could derail hopes for any cuts this year. Trump has voiced his frustration with Fed Chair Powell and may erupt if rates remain unchanged.
PCE Inflation Report (Thursday): The Fed’s preferred inflation gauge is expected to show a 2.7% annual rate. Add rising tariffs to the mix and even September rate cuts could be off the table.
Jobs Report (Friday): Forecasts call for just 102,000 new jobs in July, down from 147,000 in June. So far, employment has been the bright spot in the economy. But a surprise miss here could rattle investor confidence.
What Investors Can Do Now
Earnings have been strong. The economy is holding up – for now. But with so many potential shocks on the calendar, this is the time to hedge.
-
Buy puts on the S&P 500 ETF (SPY): A simple way to protect your portfolio from a broad market downturn while still letting your individual stocks run. With volatility nearing lows for the year, option premiums on the index fund are relatively cheap.
-
Sell call options against individual stocks: This generates income and reduces risk while allowing for some upside though it will limit gains to the option’s strike price.
-
Look for domestic winners: Companies with U.S.-based production and supply chains could thrive as tariffs hit competitors.
We’re entering a new economic era—one defined by onshoring, inflation, and volatility. Investors who prepare now won’t just survive it. They’ll profit from it. Disclosure: This is the Most Dangerous Week for Investors in 20 Years is written by Joseph Hogue, CFA who is a former equity analyst and economist. Born and raised in Iowa, after serving in the Marine Corps, Joseph worked in corporate finance and real estate before starting a career in investment analysis. He has appeared on Bloomberg and CNBC and led a team of equity analysts for a venture capital research firm. He holds a master’s degree in business and the Chartered Financial Analyst (CFA) designation. Positions in stocks mentioned: SOFI, META, ARM
Toronto, Ontario–(Newsfile Corp. – July 28, 2025) – C3 Metals Inc. (TSXV: CCCM) (OTCQB: CUAUF) ("C3 Metals" or the "Company") is pleased to announce results of a closely spaced soil sampling program completed over a volcanic redbed copper prospect within the northwest portion of the Bellas Gate Project, Jamaica.
The Bellas Gate Project comprises three separate Special Exclusive Prospecting Licenses and totals 13,020 hectares (Figure 1). On February 11, 2025, the Company announced it had entered into an earn-in agreement with Freeport-McMoRan Exploration Corporation ("Freeport"), a wholly-owned affiliate of Freeport-McMoRan Inc. (NYSE: FCX) whereby Freeport can earn up to 75% in the project by funding up to US$75 million in exploration and project related expenditures (see press release dated February 11, 2025).
Nine widely spaced soil lines covering a 3km strike across a volcanic redbed copper prospect were run with samples collected at approximately 5-metre intervals along each line (Figure 2). Results include:
-
A 120m wide zone that averaged 0.12% copper in soils.
-
A 90m wide zone that averaged 0.13% copper in soils.
-
A 50m wide zone that averaged 0.16% copper in soils.
-
A 205m wide zone that averaged 452ppm copper in soils.
-
In total, the results have defined an east-west trending copper in soil anomaly 2.7km long by up to 200m wide with a minimum threshold of 400ppm copper.
-
For reference, copper in soils at or above 300ppm is considered anomalous and of high interest for follow up exploration.
-
Dan Symons, President and CEO, stated, "The results of the soil geochemical data collection program in the northwest project area are highly encouraging. The redbed copper prospect is a target that warrants further exploration. We believe we can drill test the redbed target quickly and cost effectively, as drill holes would be relatively shallow to approximately 150m depth. These types of deposits account for the second most copper production globally after porphyry deposits. We plan to drill test this redbed copper target, along with other porphyry targets, during the second half of 2025."
Figure 1: Map showing the Bellas Gate Project and the location of the strong copper in soil results at the redbed copper-silver prospect in the northwest project area.
To view an enhanced version of this graphic, please visit:https://images.newsfilecorp.com/files/2661/260153_4dd2a376747aabab_001full.jpg
Bellas Gate Project is host to various copper-gold and silver mineralization styles including porphyry, low to intermediate sulphidation epithermal and volcanic redbed systems. The Company is further advancing a volcanic redbed target in the northwest project area, where localized zones of volcanic redbed-style copper-silver mineralization were confirmed in initial mapping and sampling (see press release dated November 29, 2022).
Outcrop is scarce in the target area, limited to undulating creeks and locally along ridgelines. To better define the volcanic redbed mineralization, close spaced (5-metre) soil sampling was undertaken and completed along specified lines intended to cross perpendicular across the redbed target. Soil lines were designed to bisect the known copper trend with the goal of defining boundaries to the copper mineralization and confirm potential drill targets. A total of 535 soil samples were collected from nine soil lines with sample sites generally at 5m spacings along most lines. Soil sampling has defined a 2,700m anomalous copper zone that trends east-west and varies in width from 20 to 205 metres (Figure 2). The anomaly remains open to the northwest and east. Soil lines 2, 3 and 8 returned very high copper in soils over broad intervals, including:
-
Soil Line-02. Copper content of soils ranges from 406ppm to 4,220 ppm copper over a 50m interval, with an average 1,599ppm copper.
-
Soil Line-03. Copper content of soils ranges from 428ppm to 4,130 ppm copper over a 120m interval, with an average 1,217ppm copper.
-
Soil Line-08. Copper content of soils ranges from 165ppm to 5,990 ppm copper over a 90m interval, with an average 1,344ppm copper.
Figure 2: Geology map showing copper in soil (circles) and rock chip (triangles) geochemistry. Map shows the nine soil lines recently completed. Proposed drill holes shown on lines 02, 03 and 08.
To view an enhanced version of this graphic, please visit:https://images.newsfilecorp.com/files/2661/260153_4dd2a376747aabab_002full.jpg
Next Steps
The tight spaced soil sampling campaign at the redbed target was highly successful, demonstrating strong copper in soils over an extensive east-west trending zone that remains open in both directions. Soil geochemical data indicates there are at least two favorable horizons that are hosting the copper mineralization, interpreted as amygdaloidal basalt units. The stratigraphy in this area dips shallowly to the northwest. Therefore, the redbed hosted copper mineralization can be easily tested with shallow drill holes.
An initial 750m diamond drilling program in 5 holes has been designed to drill test the compelling copper targets along soil Lines 02, 03 and 08. This area is fully permitted for drilling. The Company intends to drill the first ever holes in this redbed prospect during the second half of 2025.
For additional information, contact:
Dan SymonsPresident and CEO+1 416 716 6466dsymons@c3metals.com
ABOUT C3 METALS INC.
C3 Metals Inc. is a mineral exploration company focused on creating substantive value for its shareholders through the discovery and development of large copper and gold deposits. The Company holds approximately 31,000 hectares located in the prolific high-grade Andahuaylas-Yauri Porphyry-Skarn belt of Southern Peru. Mineralization at Jasperoide is hosted in a similar geological setting to the nearby major mining operations at Las Bambas (MMG), Constancia (Hudbay) and Antapaccay (Glencore). At Jasperoide, the Company has identified over 15 skarn prospects and an outcropping porphyry system over two parallel 28km belts. The Company has published a maiden resource estimate on the first of these skarn targets, which contained Measured & Indicated Resources of 52Mt at 0.5% copper and 0.2 g/t gold[] The Company is also actively exploring in Jamaica where it has identified 16 porphyry, 40 epithermal and multiple volcanic redbed copper prospects over a 30km strike extent. The Company holds a 100% interest in 17,855 hectares of exploration licenses, of which Freeport-McMoRan Exploration Corporation, a wholly-owned affiliate of Freeport-McMoRan Inc. (NYSE: FCX), has the option on 13,020 hectares to earn up to a 75% interest by funding up to US$75 million of exploration and project related expenditures. The Company also holds a 50% interest in 9,870 hectares in a joint venture with Geophsyx Jamaica Ltd, the largest mineral tenure holder in the country. Barrick Gold Corp. announced on May 1, 2024 that it had entered into an earn-in agreement with Geophysx Jamaica Ltd. on approximately 400,000 hectares of exploration licenses, several of which surround C3 Metals' mineral concessions. Mining is currently the second largest industry in Jamaica, and historical mining dates back to the colonial eras of the 1500s (Spanish) and 1800s (British).
Related Link: www.c3metals.com
Neither the TSX Venture Exchange nor its Regulation Services Provider (as that term is defined in the policies of the TSX Venture Exchange) accepts responsibility for the adequacy or accuracy of this release.
QP Statement
Stephen Hughes, P.Geo. is Vice President Exploration and a Director for C3 Metals and is a Qualified Person as defined by National Instrument 43-101. Mr. Hughes has reviewed the technical information in this news release and approves the written disclosure contained herein.
Technical Program
C3 Metals adheres to a strict QA/QC protocol for handling, sampling, sample transportation and analyses. Chain-of-custody protocols are designed to ensure security of samples until their delivery at the laboratory.
Soil samples were collected along nine planned sampling lines at 5m- spaced sample stations along each line. Sampling lines are perpendicular to anomalous geological features identified in fact mapping and historical data. Soil pits were dug carefully with a digger and trowel to the depth of approximately 2 to 3 feet to target the C horizon and to collect approximately 2kg of soil material. A field duplicate was collected from the same pit and same soil horizon. Samples were sun-dried and sieved at C3 Metals' operations base in Bellas Gate, St Catherine, Jamaica by Company personnel. Approximately 160g of sieved soil sample of minus 80 mesh (180um) fraction was prepared. The pulp duplicate was collected by random scooping of the minus 80 mesh (180um) material.
Samples were bagged, tagged and packaged for shipment by DHL air freight service to ALS Vancouver, British Columbia, Canada where a size test was performed to 100% passing 80 mesh (180um) on 4% of samples in a batch. Additional preparation with oven dry and 80 mesh sieving was done on less than 100% size test passing batch. The prepared samples were sent to the ALS assay laboratories in Vancouver, Canada for copper, gold and silver assays, and multi-element ICP. ALS is an accredited laboratory which is independent of the Company. Gold assays were by fire assay fusion with AAS finish on a 30g sample and the overlimit gold assay was completed by fire assay and gravimetric finish on 30g sample. Copper and silver were assayed by ICP-MS following a 4-acid digestion on the ME-MS61 package for a suite of 48 elements and the over limit copper by 4-Acid digestion and assayed by ICP-AES on each sample with copper greater than 10,000ppm (1%). Copper and gold standards as well as blanks and duplicates (field duplicate and pulp split) were inserted into the sampling sequence for quality control. On average, 6.3% of the submitted samples are quality control samples. No data quality problems were indicated by the QA/QC program.
Caution Regarding Forward Looking Statements
Certain statements contained in this press release constitute forward-looking information. These statements relate to future events or future performance. The use of any of the words "could", "intend", "expect", "believe", "will", "projected", "estimated" and similar expressions and statements relating to matters that are not historical facts are intended to identify forward-looking information and are based on the Company's current belief or assumptions as to the outcome and timing of such future events. Actual future results may differ materially. In particular, this release contains forward-looking information relating to, among other things, the exploration operations of the Company and the timing which could be affected by the current global COVID-19 pandemic. Those assumptions and factors are based on information currently available to the Company. Although such statements are based on reasonable assumptions of the Company's management, there can be no assurance that any conclusions or forecasts will prove to be accurate.
While the Company considers these assumptions to be reasonable based on information currently available, they may prove to be incorrect. Forward looking information involves known and unknown risks, uncertainties and other factors which may cause the actual results, performance or achievements to be materially different from any future results, performance or achievements expressed or implied by the forward-looking information. Such factors include risks inherent in the exploration and development of mineral deposits, including risks relating to changes in project parameters as plans continue to be redefined, risks relating to variations in grade or recovery rates, risks relating to changes in mineral prices and the worldwide demand for and supply of minerals, risks related to increased competition and current global financial conditions and the COVID-19 pandemic, access and supply risks, reliance on key personnel, operational risks, and regulatory risks, including risks relating to the acquisition of the necessary licenses and permits, financing, capitalization and liquidity risks.
The forward-looking information contained in this release is made as of the date hereof, and the Company is not obligated to update or revise any forward-looking information, whether as a result of new information, future events or otherwise, except as required by applicable securities laws. Because of the risks, uncertainties and assumptions contained herein, investors should not place undue reliance on forward-looking information. The foregoing statements expressly qualify any forward-looking information contained herein.
1 Based on the assumptions and parameters outlined in the NI 43-101 Technical Report titled Jasperoide Copper-Gold Project Cusco Region, Peru dated July 5, 2023.
To view the source version of this press release, please visit https://www.newsfilecorp.com/release/260153
Southern Copper (SCCO) closed at $97.11 in the latest trading session, marking a -1.1% move from the prior day. This change lagged the S&P 500's daily gain of 0.02%. Meanwhile, the Dow experienced a drop of 0.14%, and the technology-dominated Nasdaq saw an increase of 0.33%.
Prior to today's trading, shares of the miner had lost 4.21% lagged the Basic Materials sector's gain of 4.33% and the S&P 500's gain of 4.93%.
The investment community will be paying close attention to the earnings performance of Southern Copper in its upcoming release. In that report, analysts expect Southern Copper to post earnings of $1.07 per share. This would mark a year-over-year decline of 12.3%. Our most recent consensus estimate is calling for quarterly revenue of $3.02 billion, down 3.25% from the year-ago period.
For the full year, the Zacks Consensus Estimates are projecting earnings of $4.63 per share and revenue of $12.38 billion, which would represent changes of +6.93% and +8.24%, respectively, from the prior year.
Any recent changes to analyst estimates for Southern Copper should also be noted by investors. These revisions help to show the ever-changing nature of near-term business trends. Therefore, positive revisions in estimates convey analysts' confidence in the business performance and profit potential.
Our research reveals that these estimate alterations are directly linked with the stock price performance in the near future. To capitalize on this, we've crafted the Zacks Rank, a unique model that incorporates these estimate changes and offers a practical rating system.
The Zacks Rank system, stretching from #1 (Strong Buy) to #5 (Strong Sell), has a noteworthy track record of outperforming, validated by third-party audits, with stocks rated #1 producing an average annual return of +25% since the year 1988. Over the past month, the Zacks Consensus EPS estimate has moved 1.62% higher. Southern Copper is currently sporting a Zacks Rank of #3 (Hold).
Looking at valuation, Southern Copper is presently trading at a Forward P/E ratio of 21.19. This denotes a discount relative to the industry average Forward P/E of 21.81.
One should further note that SCCO currently holds a PEG ratio of 2.52. The PEG ratio is similar to the widely-used P/E ratio, but this metric also takes the company's expected earnings growth rate into account. The Mining – Non Ferrous industry had an average PEG ratio of 0.81 as trading concluded yesterday.
The Mining – Non Ferrous industry is part of the Basic Materials sector. This group has a Zacks Industry Rank of 44, putting it in the top 18% of all 250+ industries.
The Zacks Industry Rank gauges the strength of our individual industry groups by measuring the average Zacks Rank of the individual stocks within the groups. Our research shows that the top 50% rated industries outperform the bottom half by a factor of 2 to 1.
Make sure to utilize Zacks.com to follow all of these stock-moving metrics, and more, in the coming trading sessions.
Want the latest recommendations from Zacks Investment Research? Today, you can download 7 Best Stocks for the Next 30 Days. Click to get this free report
Southern Copper Corporation (SCCO) : Free Stock Analysis Report
This article originally published on Zacks Investment Research (zacks.com).
Harmony Gold (HMY) ended the recent trading session at $14.03, demonstrating a -1.34% change from the preceding day's closing price. The stock's performance was behind the S&P 500's daily gain of 0.4%. Meanwhile, the Dow experienced a rise of 0.47%, and the technology-dominated Nasdaq saw an increase of 0.24%.
The stock of gold miner has risen by 2.23% in the past month, lagging the Basic Materials sector's gain of 3.4% and the S&P 500's gain of 4.61%.
The upcoming earnings release of Harmony Gold will be of great interest to investors.
For the full year, the Zacks Consensus Estimates are projecting earnings of $2.85 per share and revenue of $0 million, which would represent changes of +190.82% and 0%, respectively, from the prior year.
Investors should also note any recent changes to analyst estimates for Harmony Gold. These latest adjustments often mirror the shifting dynamics of short-term business patterns. As a result, we can interpret positive estimate revisions as a good sign for the business outlook.
Based on our research, we believe these estimate revisions are directly related to near-term stock moves. We developed the Zacks Rank to capitalize on this phenomenon. Our system takes these estimate changes into account and delivers a clear, actionable rating model.
The Zacks Rank system, which varies between #1 (Strong Buy) and #5 (Strong Sell), carries an impressive track record of exceeding expectations, confirmed by external audits, with stocks at #1 delivering an average annual return of +25% since 1988. Over the past month, there's been no change in the Zacks Consensus EPS estimate. Currently, Harmony Gold is carrying a Zacks Rank of #1 (Strong Buy).
Digging into valuation, Harmony Gold currently has a Forward P/E ratio of 4.99. Its industry sports an average Forward P/E of 11.66, so one might conclude that Harmony Gold is trading at a discount comparatively.
We can also see that HMY currently has a PEG ratio of 0.09. The PEG ratio is akin to the commonly utilized P/E ratio, but this measure also incorporates the company's anticipated earnings growth rate. The Mining – Gold industry currently had an average PEG ratio of 0.55 as of yesterday's close.
The Mining – Gold industry is part of the Basic Materials sector. At present, this industry carries a Zacks Industry Rank of 31, placing it within the top 13% of over 250 industries.
The strength of our individual industry groups is measured by the Zacks Industry Rank, which is calculated based on the average Zacks Rank of the individual stocks within these groups. Our research shows that the top 50% rated industries outperform the bottom half by a factor of 2 to 1.
Keep in mind to rely on Zacks.com to watch all these stock-impacting metrics, and more, in the succeeding trading sessions.
Want the latest recommendations from Zacks Investment Research? Today, you can download 7 Best Stocks for the Next 30 Days. Click to get this free report
Harmony Gold Mining Company Limited (HMY) : Free Stock Analysis Report
This article originally published on Zacks Investment Research (zacks.com).
Quarterly financial reports play a vital role on Wall Street, as they help investors see how a company has performed and what might be coming down the road in the near-term. And out of all of the metrics and results to consider, earnings is one of the most important.
Life and the stock market are both about expectations, and rising above what is expected is often rewarded, while falling short can come with negative consequences. Investors might want to try to capture stronger returns by finding positive earnings surprises.
2 Stocks to Add to Your Watchlist
The Zacks Earnings ESP is more formally known as the Expected Surprise Prediction, and it aims to grab the inside track on the latest analyst estimate revisions ahead of a company's report. The idea is relatively intuitive as a newer projection might be based on more complete information. The ESP is calculated by comparing the Most Accurate Estimate to the Zacks Consensus Estimate, with the percentage difference between the two giving us the Zacks ESP figure.
Now that we understand what the ESP is and how beneficial it can be, let's dive into a stock that currently fits the bill. Vital Farms (VITL) earns a Zacks Rank #1 right now and its Most Accurate Estimate sits at $0.29 a share, just 13 days from its upcoming earnings release on August 7, 2025.
VITL has an Earnings ESP figure of +2.35%, which, as explained above, is calculated by taking the percentage difference between the $0.29 Most Accurate Estimate and the Zacks Consensus Estimate of $0.28.
VITL is part of a big group of Consumer Staples stocks that boast a positive ESP, and investors may want to take a look at FMC (FMC) as well.
FMC, which is readying to report earnings on July 30, 2025, sits at a Zacks Rank #3 (Hold) right now. Its Most Accurate Estimate is currently $0.61 a share, and FMC is five days out from its next earnings report.
FMC's Earnings ESP figure currently stands at +2.89% after taking the percentage difference between its Most Accurate Estimate and its Zacks Consensus Estimate of $0.59.
VITL and FMC's positive ESP metrics may signal that a positive earnings surprise for both stocks is on the horizon.
Find Stocks to Buy or Sell Before They're Reported
Use the Zacks Earnings ESP Filter to turn up stocks with the highest probability of positively, or negatively, surprising to buy or sell before they're reported for profitable earnings season trading. Check it out here >>
Want the latest recommendations from Zacks Investment Research? Today, you can download 7 Best Stocks for the Next 30 Days. Click to get this free report
Vital Farms, Inc. (VITL) : Free Stock Analysis Report
FMC Corporation (FMC) : Free Stock Analysis Report
This article originally published on Zacks Investment Research (zacks.com).
If you would like to receive our free newsletter via email, simply enter your email address below & click subscribe.
 Follow us on Twitter
 Become our facebook fan
CONNECT WITH US
Tweets
Tweet with hash tag #miningfeeds or @miningfeeds and your tweets will be displayed across this site.
MOST ACTIVE MINING STOCKS
Daily Gainers
 CMC Metals Ltd. CMC Metals Ltd. |
CMB.V | +900.00% |
 Eden Energy Ltd Eden Energy Ltd |
EDE.AX | +200.00% |
| GoviEx Uranium Inc. |
GXU.V | +42.86% |
| Eagle Nickel Ltd. |
ENL.AX | +41.67% |
| Citigold Corp. Limited |
CTO.AX | +33.33% |
| Mount Burgess Mining NL |
MTB.AX | +33.33% |
| Exalt Resources Limited |
ERD.AX | +31.94% |
| Casa Minerals Inc. |
CASA.V | +30.00% |
| Cariboo Rose Resources Ltd |
CRB.V | +28.57% |
| Belmont Resources Inc. |
BEA.V | +28.57% |


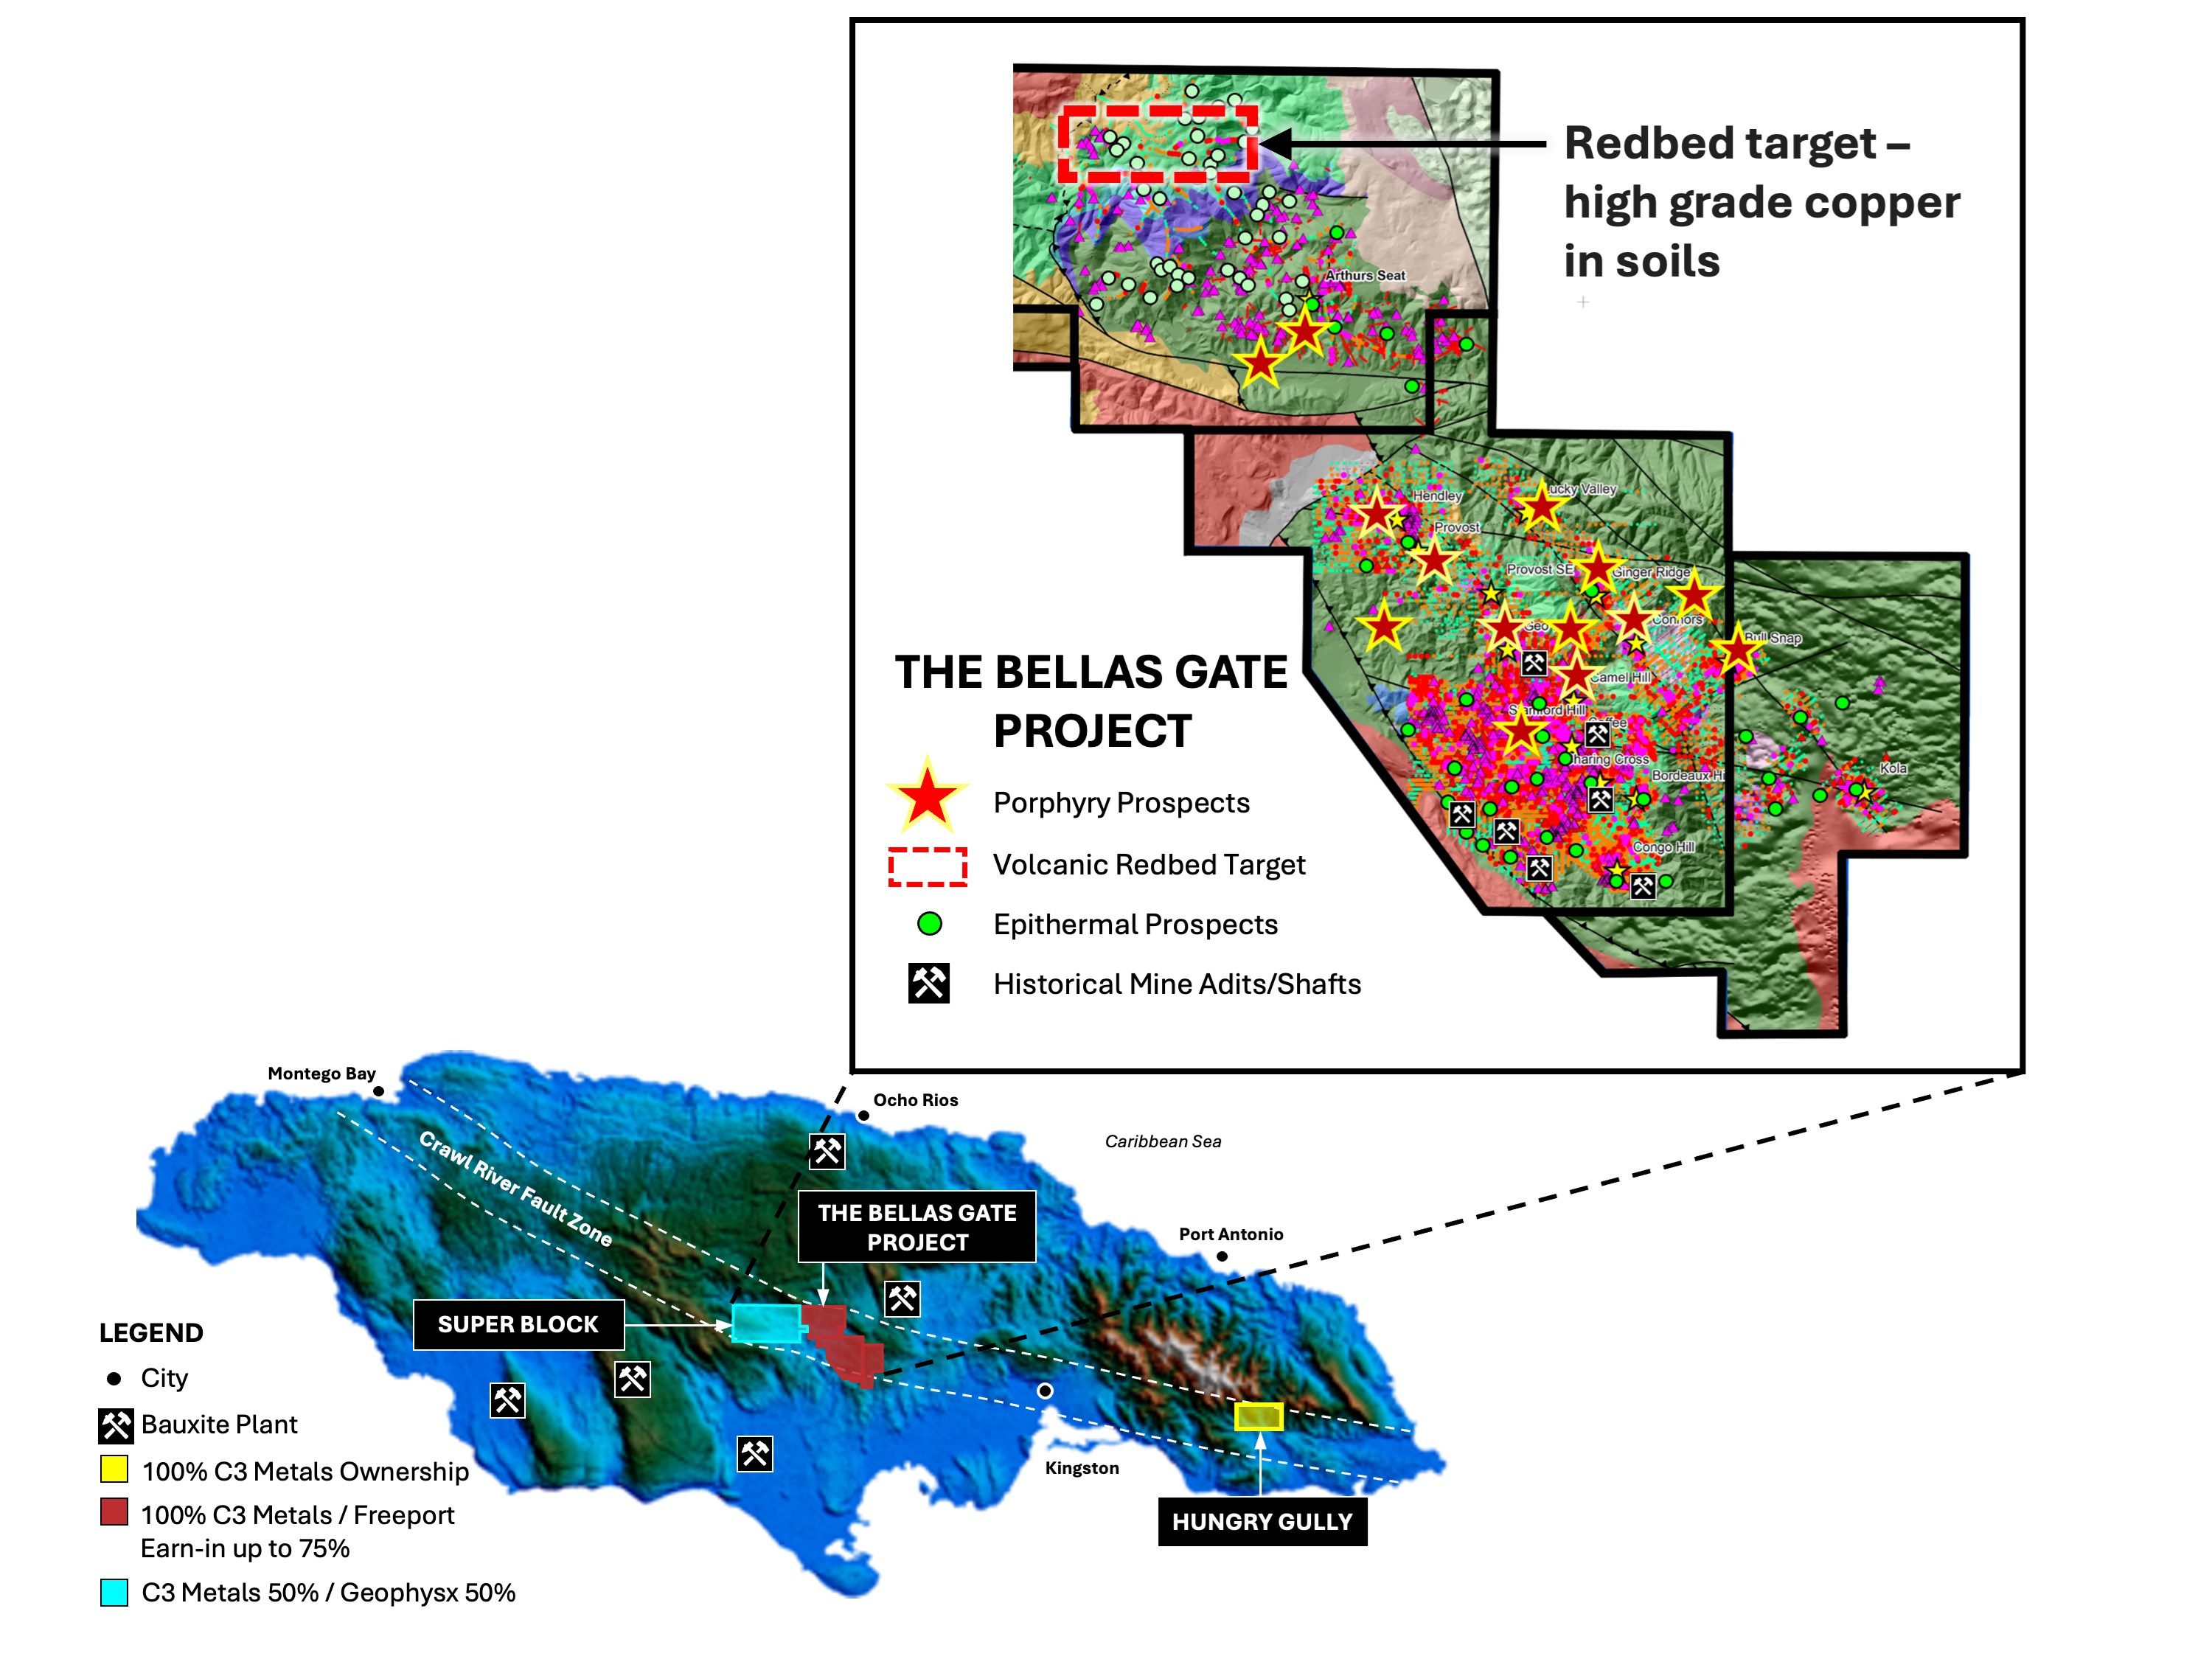
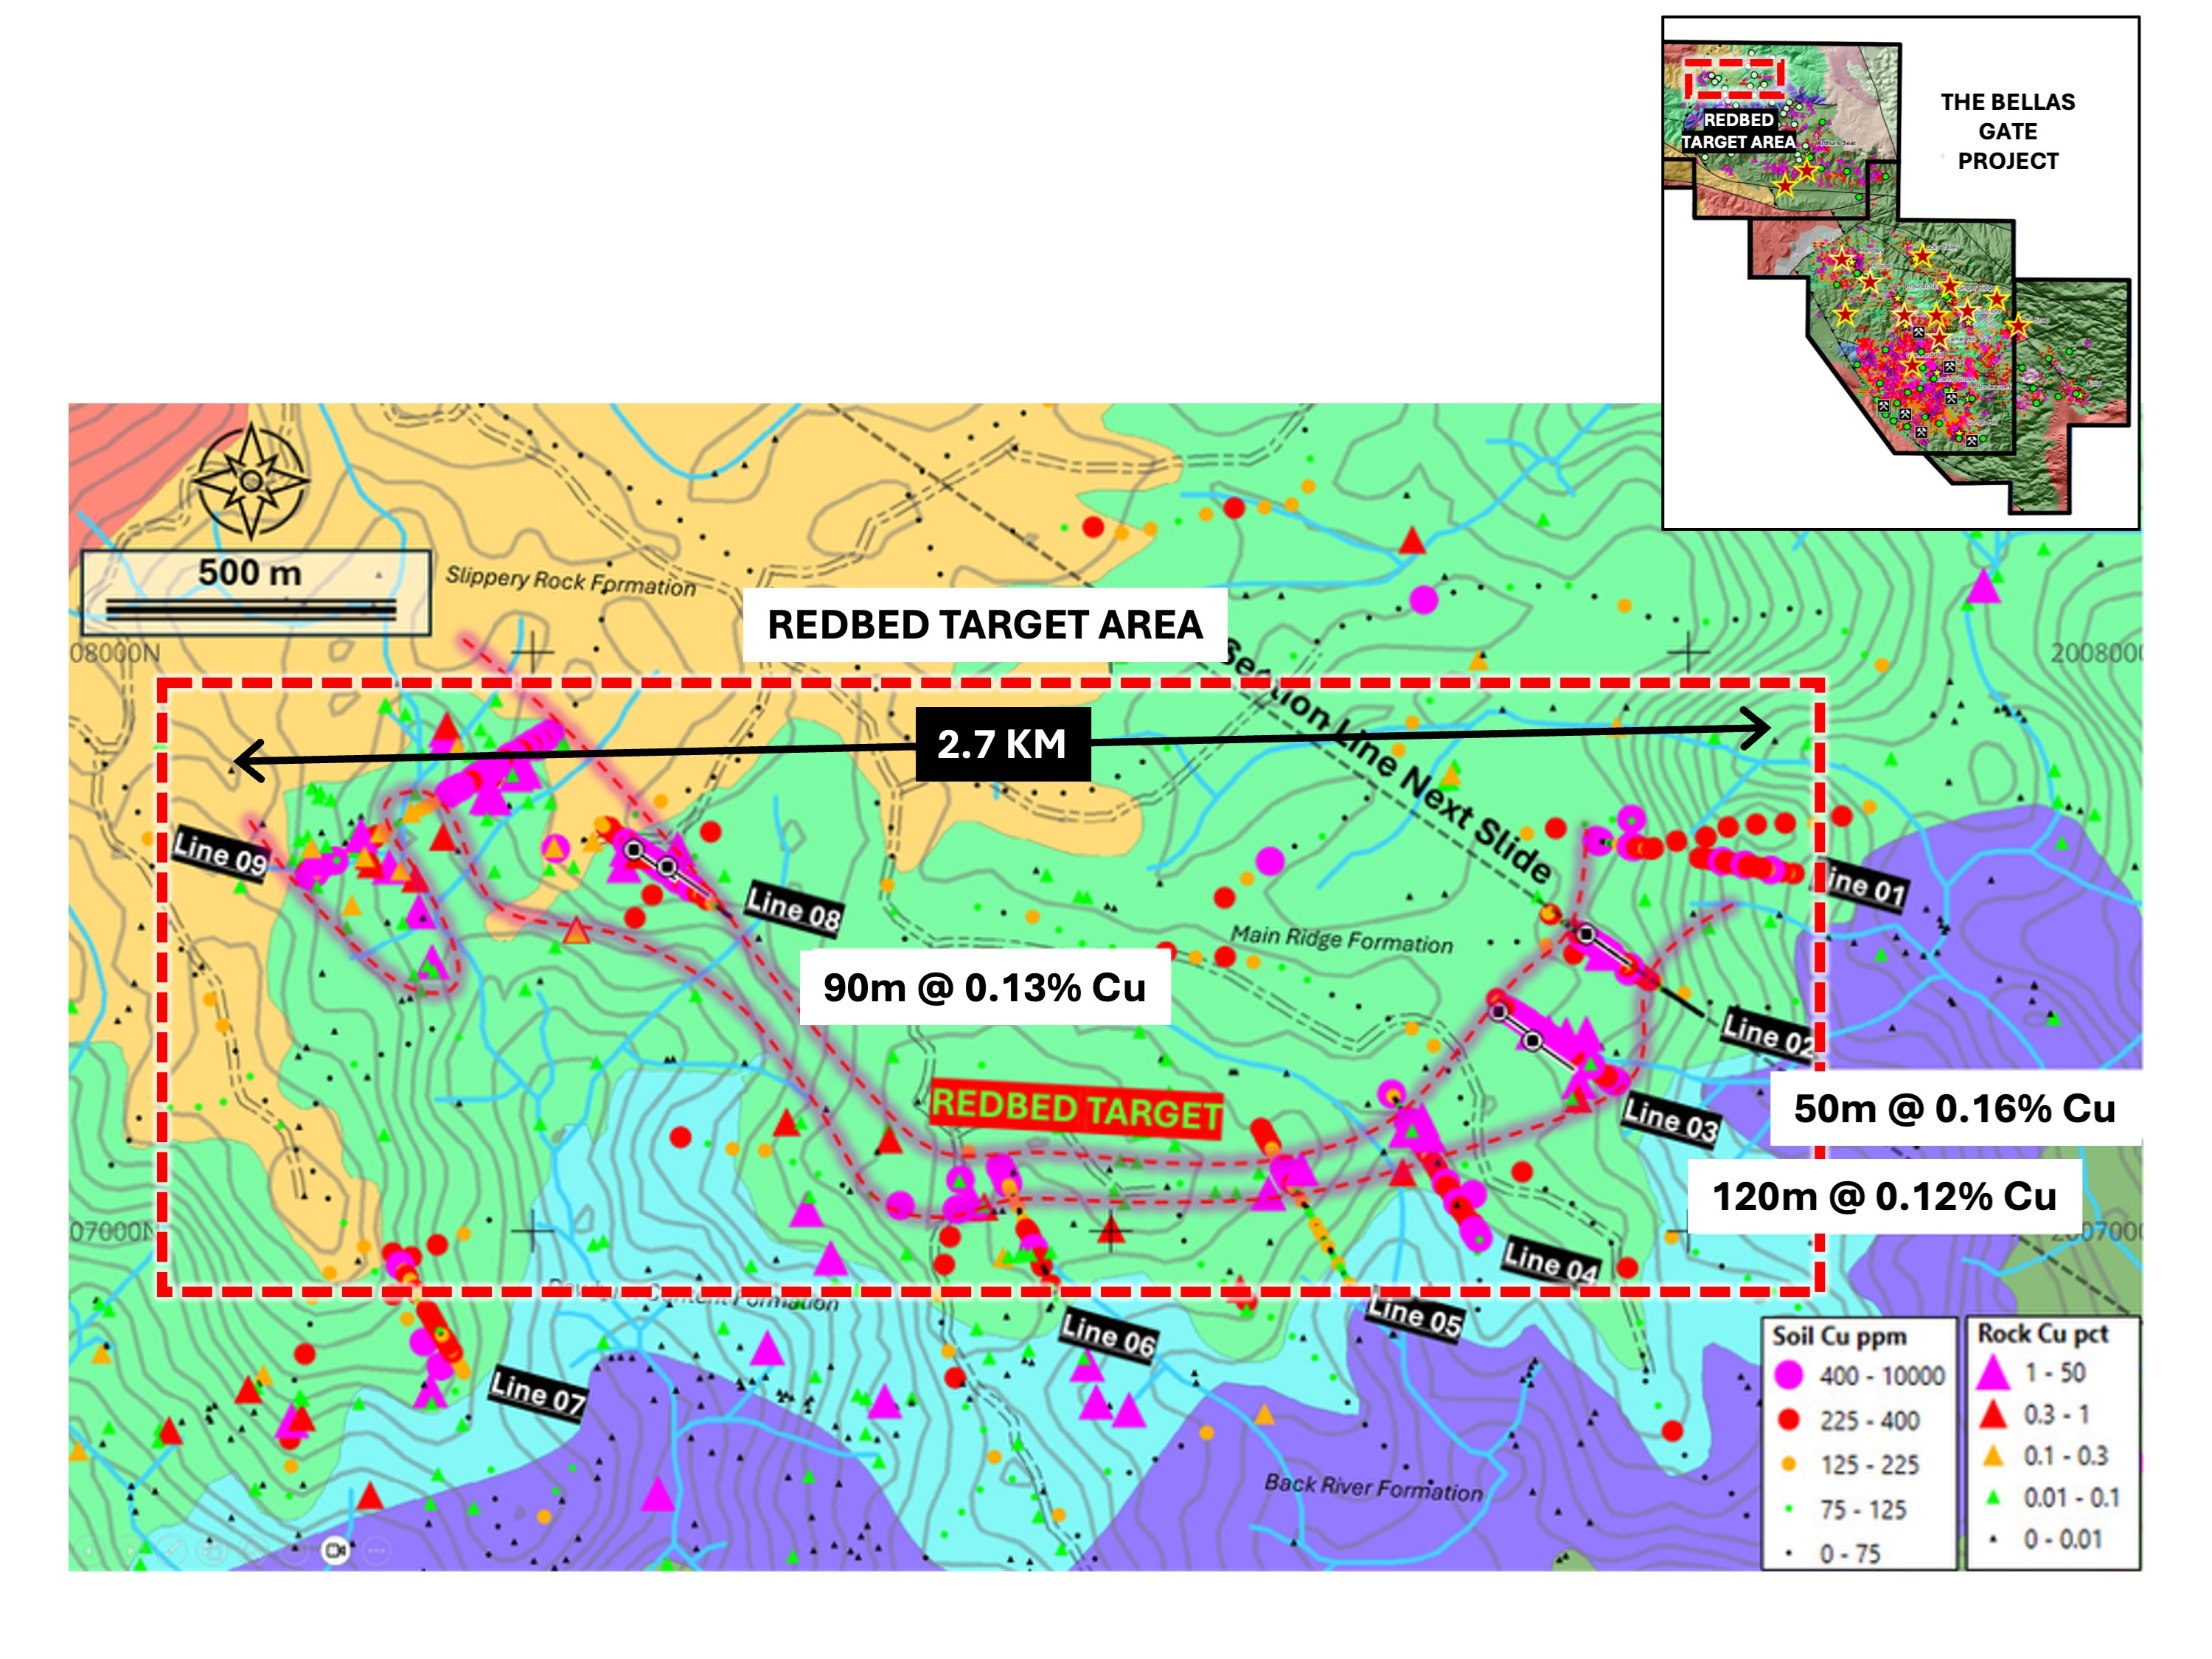