

Gold stocks have defied the odds to blast higher in the early summer doldrums. Investors have flocked back in recent weeks, their heavy buying driving record June-to-date gains. If this newfound momentum continues, gold stocks have the potential to achieve a record summer. With their exceptionally-bullish technicals this is certainly possible, but remains a tall order unless gold’s rare summer rally resumes.
As gold stocks are still the most hated, ignored, and undervalued sector in all the stock markets, the vast majority of traders have no idea they are soaring. But earlier this week, the benchmark HUI gold-stock index and flagship GDX gold-stock ETF were up an amazing 16.5% and 16.8% month-to-date! These are utterly massive gains, demolishing the S&P 500’s 2.0%. Gold stocks should be the belle of the ball.
The main reason the gold miners have rocketed higher is the massive gold short-covering rally that Fed chair Janet Yellen unleashed last week. At her quarterly post-FOMC-meeting press conference, she downplayed the growing inflationary trends by calling that data “noisy”. Gold-futures traders were quick to interpret this as the Yellen Fed being more tolerant of higher inflation for longer than previously expected.
While the primary US gold-futures trading session was already closed for the day before Yellen’s press conference started, American futures speculators reacted in force the next morning. They aggressively bought to cover some of their outsized gold shorts, catapulting gold up 3.4% for its best daily rally seen in 9 months. Investors flooded back into gold stocks on that, driving a really big 5.2% up day in the HUI.
But that Yellen-scoffs-at-inflation surge certainly isn’t the whole story. 3/7ths of the HUI’s June gains had already happened as of the day before that FOMC meeting and Yellen’s subsequent press conference. And 4/7ths were on the books by the end of that press-conference day, the afternoon before gold’s massive short-covering spike erupted. So while Yellen certainly helped gold stocks, there’s more to their rally.
While gold stocks have always been an exceptionally-volatile sector, seeing such gains in June is truly unprecedented. Gold-stock price levels are overwhelmingly driven by the price of gold, which ultimately determines their profits. And gold prices are actually highly seasonal throughout the calendar year. While mined supply is constant, investment demand fluctuates considerably around key cultural events.
Gold’s strong demand-driven seasonality explains the vexing precious-metals summer doldrums. The market-summer period of June, July, and August is simply devoid of regular recurring investment-demand spikes. The leading example of such surges is the autumn Indian wedding season, when vast amounts of gold are purchased. Their absence in summer makes this gold’s weakest season of the year.
This is painfully obvious for long-time gold-stock investors and speculators. Gold stocks can and have surged in major uplegs anytime between September and May when global gold investment demand is strong. But during the summer doldrums, gold stocks usually just drift sideways at best. So hoping for big summer rallies in gold stocks certainly slams into the wall of precedent, a hardcore contrarian bet.
This next chart illustrates gold stocks’ summer-doldrums drift. It takes every market summer in gold stocks, as represented by the HUI, since gold’s secular bull was born way back in 2001. And then each individual year’s summer HUI action is indexed to 100 as of that year’s final trading day in May. This is essential to make each gold-stock summer perfectly comparable percentage-wise despite very different HUI levels.
The HUI summers between 2001 and 2013 are represented by yellow lines. Though they are a spilled-spaghetti mess, it is their central tendency we are interested in. That is distilled down in the red average of the indexed HUI summers over that secular span. And then the superimposed blue line shows this year’s HUI indexed to 100 as of May 30th. June 2014 has seen a record secular-bull gold-stock advance!

In general, gold stocks just drift sideways through the summer doldrums of June, July, and August as the center-mass of their yellow indexed lines reveals. The vast majority of the time, the gold stocks meander between 10% above to 15% below their levels on May’s final trading day. And this drift has a downside tendency, as evidenced by more breakouts below its lower support than upper resistance.
Interestingly last June, when gold was experiencing its worst quarterly plunge in 93 years thanks to epic record GLD gold-ETF selling, gold stocks suffered their worst June of this secular bull by far. At worst in late June 2013, the HUI had plummeted 24.6% month-to-date! Ouch. While that was truly anomalous on all kinds of different levels, gold stocks do tend to drift lower in June and July before bottoming.
This is readily evident in the red line averaging all the yellow ones. Gold-stock seasonals generally deteriorate throughout the summer until they finally bottom in late July. That’s the highest-odds-for-success time to buy gold stocks ahead of their several episodes of major seasonal strength between September and May. So that makes this month’s strong gold-stock rally look even more extreme and atypical.
As a sector gold stocks have never been up 16%+ in June before. The only comparable attempt came way back in 2001 right after gold’s secular bull was born in despair. The HUI enjoyed a quick early-summer gain to +14.8%, but that quickly faded throughout that summer. By the time the end of August rolled around that year, the HUI was merely up 5.2% which is right in line with the subsequent average.
There were a couple more summer-doldrums upside breakouts in 2003 and 2005, but only the former could maintain its momentum. 2003 saw the HUI end August 36.9% higher than it had been at the end of May, a stupendous summer rally. But that was utterly unique, nothing else even comes close. The second-best summer performance happened in 2005, and that was merely a 10.9% 3-month gain.
This market precedent really drives home just how extraordinary the gold stocks’ massive June 2014 rally has been. If they merely drift sideways from here until the end of August, it will easily be the second-best gold-stock summer of this secular bull! But obviously the seasonal odds are weighted heavily against such outstanding summer performance. 13 years is certainly a lot of history to fight.
I suspect the primary factor driving gold stocks’ incredible June 2014 was their atrociously miserable May 2014. Last month the HUI plunged 8.6%, which is extremely atypical since May is the second-strongest month of the year on average for gold stocks. As of 2011, the last time I updated the full gold-stock-seasonals analysis, the average HUI gains in May between 2001 and 2011 were an amazing 7.9%.
This year gold happened to suffer a sharp and anomalous late-May selloff on record levels of gold-futures short selling by American speculators. But since that was a pure sentiment trade totally lacking any fundamental basis, it quickly reversed as gold began rallying the moment that extreme selling pressure started to abate. Markets’ strong mean-reversion tendencies alone can explain June’s big HUI surge.
Last month’s gold-driven gold-stock plunge was only exceeded by May 2006’s, which happened after an epic 42.4% year-to-date surge as of mid-May. That was the last time the gold-stock sector achieved some semblance of popular enthusiasm. Provocatively this year nearly saw comparable out-of-the-gates gains, with the HUI up 30.6% year-to-date by mid-March 2014. But obviously that promising rally stalled out.
And if the gold stocks’ exceptionally-weak May 2014 is indeed the main reason June 2014 has been so awesome, just an oversold bounce, then the odds of this rally’s momentum building throughout summer are low. And before gold stocks’ and gold’s Yellen surge erupted last week, the HUI was merely up 7.0% month-to-date which is well within that normal early-summer center-mass trend. That’s not encouraging.
A normal mean reversion boosted by an exogenous Fed event can easily explain the gold stocks’ whole record June so far. Couple this with this sector’s strong tendency to drift sideways to lower in summer until late July or so, and the smart bet would sure seem to be against gold stocks rallying farther before then at the earliest. Unfortunately I suspect that’s what we’ll see, although there is a chance for a rare summer rally.
As always it hinges on gold, which will have to power higher contrary to its normal summer trend. The one event that could drive a rare summer investment-demand spike for gold is the lofty US stock markets rolling over. And they certainly should given how epically overextended, overvalued, and toppy they’ve become during the Fed’s artificial levitation of the past 18 months. Gold ought to surge in a decisive stock selloff.
And if gold is bid higher, the gold-stock technicals are very bullish and perfectly situated to support serious buying. This final chart looks at the GDX gold-stock ETF over that last year-and-a-half where the general stock markets melted up. Despite facing the fierce headwinds of contrarian investments like gold and gold stocks falling out of favor while stock markets surged, gold stocks have formed a very strong base.

Gold stocks are hated today largely because of their catastrophic drop in the first half of last year. They suffered a free fall during gold’s panic-like plunge of April 2013, and were hammered again last June when gold fell on the threat of the Fed slowing its QE3 bond-monetization campaign. The result was a dreadful 52.1% GDX plunge over the first 5.8 months of 2013! This naturally spawned epic gold-stock bearishness.
But over the past year, gold stocks have stabilized despite the universal calls for them to spiral lower forever. GDX has traded in a year-long consolidation basing zone between $20 and $30. This is actually incredibly bullish performance considering all the factors arrayed against this sector. Everyone hated gold stocks and gold, and the consensus view on gold stocks a year ago was that they were utterly doomed.
No one wanted to touch this pariah sector with a ten-foot pole, and gold remained under heavy selling pressure. Even after GDX’s bottom last June, American stock traders continued to dump GLD shares at staggering differential rates while American futures speculators continued to pare their long bets. If there was ever a year for gold stocks to plunge, their critics are certainly right that this past year was it.
Yet they didn’t, gold-stock prices stabilized in the face of mind-boggling pressure to drop. Only one thing can drive bottoming consolidations, and that is new buyers snatching up all the shares the sellers are jettisoning. Over the past year, brave contrarian investors have fought the crowd to prudently buy low all the gold-stock shares being cast away. This strong basing is the perfect technical foundation to launch a major new upleg.
Gold and gold-stock bearishness peaked in December, when GDX slumped to new lows. But despite the extreme anti-gold sentiment then, they were only marginally lower than late June’s so it was essentially a successful low retest. And then starting this year, gold stocks have enjoyed gradual and sustained buying. This is a big contrast to their sharp short-covering rallies last July and August, much healthier.
While gold stocks carved an interim high in mid-March before drifting lower into late May, they are still in an uptrend as the support line above shows. And this month’s record June surge has catapulted GDX back up to another 200dma breakout and left it on the verge of another Golden Cross. These are some of the strongest buy signals ever seen, when 50-day moving averages cross back above the 200-day ones.
Now there was a gold-stock Golden Cross in March too, that looked very promising. I wrote a whole essay on it and Golden Crosses in general then. But as sometimes happens at major turning points in markets, there can be indecision that leads to a series of Golden Crosses and Death Crosses (50dma falling under 200dma) before the turn is finally decisively carved. Obviously that’s happened this year as well.
Any gold rally at all, which again is highly likely as the lofty stock markets inevitably start selling off soon here, is going to push the HUI higher and trigger this next Golden Cross. That powerful buy signal, one of if not the strongest in all of technical analysis, will attract in a lot of new investment capital. And the fact that gold stocks have been in an uptrend after consolidating near lows for a year will certainly help.
Professional institutional investors like hedge funds are actually starting to get interested in gold stocks again. It’s hard to believe, I know, but they are looking for sectors that are still undervalued in these stock markets full of very-expensive valuations. And gold stocks remain deeply undervalued in absolute terms and more importantly relative to gold, which drives their profits and hence ultimately their stock prices.
These elite traders always look to their peers for ideas. So as they see gold stocks start to show up on the quarterly SEC holdings reports of hedge funds, more money managers are going to want to commit capital as well. This process will feed on itself, with higher gold-stock prices and improving technicals attracting in a wider group of contrarian investors. And it may very well start this summer, despite the weak seasonals.
All this gold-stock strength we’ve seen so far in 2014 in defiance of the extraordinarily bearish sentiment plaguing the precious metals means now is the time to do your homework. There are literally many hundreds of gold stocks out there, but the great majority will never achieve any success. So whether you want to add positions now or wait until the traditional late-July seasonal low, you have to do some research.
The upside potential in gold stocks is vast. Last week I explained why gold stocks in general ought to at least quadruple in the coming years due to their undervaluation relative to gold. And that is in the headline gold-stock measures like the HUI and GDX dominated by slow-moving major gold stocks. The much-smaller junior gold producers’ stocks will see gains amplifying and dwarfing those of the large miners!
And if you want to follow the ready-to-explode gold-stock sector, you can’t do it with mainstream sources. Only contrarians are paying attention today. We publish acclaimed weekly and monthly newsletters that dig into the markets from an essential contrarian perspective. They draw on our decades of hard-won experience, knowledge, wisdom, and ongoing research to explain what’s happening in the markets, why, and how to trade them with specific stock trades. If you like my essays, subscribe today and support us!
The bottom line is gold stocks have enjoyed a secular-bull-record June. While their recent gains can be explained by a mean-reversion bounce after a terrible May accelerated by a Fed chair dismissing any inflation concerns, they still add to increasingly-bullish gold-stock technicals. All gold stocks need to surge is for gold to continue rallying, which is highly likely once the overextended stock markets inevitably roll over.
So now is the time to do your homework, to take advantage of the summer doldrums and learn about the stock markets’ only hyper-undervalued sector. Whether gold stocks continue rallying from here or wait a month until their traditional seasonal lows, they are heading much higher. As always the greatest gains by far will be won by contrarian investors willing to fight the bearish herd to buy out-of-favor gold stocks low.
Summary
- Technical signals have been turning positive for some time in the precious metals and junior miners.
- Record short position may soon need to cover as major accumulation and investment interest has entered the precious metals sector.
- June has been a marvelous month for the junior gold miners (GDXJ) in 2014 which is a rarity as June is usually a slow month for gold.
- Geopolitical tensions increasing worldwide making the appeal of gold and silver as a safe haven greater.
- I give 3 reasons why gold and silver may breakout soaring higher possibly.
- Investment demand is soaring demonstrated in oversubscribed private placements in junior miners.
- Record volume in the market of junior gold mining etf is showing increased accumulation.
- Record short position may soon need to cover.
- Today is a very important day at City Hall in London, England. Central bank research group OMFIF is presenting a blockbuster report on public sector spending. I think that everyone in the global gold community should take note of it.
- OMFIF argues, quite persuasively, that governments, central banks, and sovereign funds are now holding stock market investments worth about $29 trillion.
- The drop in bond yields is likely behind the enormous public sector surge into equity markets.
- To view the OMFIF press release, please click here now.
- While citizens of the world are struggling to make ends meet, governments and banks appear to be engaged in a massive “price chase”, in global stock markets.
- Rather than invest in failing infrastructure, central banks and governments are acting like hedge funds, betting on the stock market and OTC derivatives, using fiat credits that are borrowed or printed.
- The bottom line: While global citizens are told to “grin and bear” austerity, their leaders are having a “good ‘ole time” spending trillions of dollars, at the stock market casino.
- Elderly citizens have invested a lot of money in corporate bond funds, in an attempt to get a decent payout on their savings. That’s a mistake. I’ve argued that an investor should never invest because of a personal or corporate “need”. Investment should be based on a macro view of what an asset is, not what an investor needs from it.
- The 1970s bull market in silver was ended when (crooked) regulators took the market to “liquidation only”. A similar demise may be in store for high-yield bond investors. “Federal Reserve officials have discussed whether regulators should impose exit fees on bond funds to avert a potential run by investors, underlining concern about the vulnerability of the $10tn corporate bond market.” – Financial Times, June 16, 2014.
- If the Fed hikes rates, even modestly, that could crash high-yield bond funds, especially those using leverage to achieve their returns. If the exit doors are locked when a fire breaks out in an elderly investor’s home, how do they get out? The exit fees may be only the beginning of a policy move by the Fed, to lock the exit door on the nation’s most vulnerable investors.
- Please click here now. Throughout 2014, Fed presidents and governors have issued many grand predictions about “powerful” American GDP growth.
- Horrifically, none of their predictions have come true.
- Bank economists have also missed their mark in 2014. They predicted drastic declines in the POYG (price of your gold), based on the same view of soaring US GDP growth, but almost halfway through the year, gold is steady, and their predicted GDP growth has failed to appear.
- First quarter growth was minus one percent. Now, the IMF has lowered its US GDP guidance for 2014 to 2%, and says there is a “halo of uncertainty” about even that paltry number.
- The IMF is adamant that the minimum wage in America must be raised. Just weeks ago, I highlighted the move by Seattle’s government to aggressively raise wages.
- The seeds of powerful inflation in America are being sown by low growth, an aging population, and rising wages.
- On that note, please click here now. That’s the weekly chart for gold. A week ago, I suggested that most precious metals charts looked like “eye candy”. A massive “across the board” rally then occurred.
- The technical set-up on the gold chart was pristine, but this Wednesday’s FOMC meeting and the quarterly FOMC predictions may put a temporary damper on the bullish price action.
- Please click here now. A spectacular bullish wedge is still in play on this daily gold chart, although its boundaries have changed slightly. The Stokeillator (14,7,7 Stochastics series) is only at about 50, and the ultra-bullish posture of the weekly chart suggests that a post-FOMC rally of size is very likely.
- I’d like silver market fans to please click here now. I use sugar as a leading indicator for the silver market, and this weekly chart is very bullish. It suggests a bit more patience is required, as the Stochastics (14,3,3 series) oscillator is close to flashing a key buy signal, but not quite there.
- I believe a rise above $.1950 in the price of sugar, will usher in substantial institutional buying of both sugar and silver, by institutional investors who are concerned about inflation.
- Please click here now. Junior gold stocks are the darling of the gold community, and this GDXJ chart shows how superbly they can perform when the entire precious metals sector is in rally mode.
- From the recent lows, GDXJ has rallied about 15%, and it’s left the Dow in the dust over the past six months. Having said that, this short term “astro blast higher” has taken the lead line of my Stokeillator lead line to the 90 area.
- In the short term, junior gold stock fans should be open to the idea that prices will move sideways or slightly slower. That’s healthy for the market, and I’m projecting a possible surge to the $46 area will begin on the next upswing in the Stokeillator. I’ll be an eager buyer in the $36 area. Despite the apparent multi-trillion dollar efforts of the world’s central bank gamblers, the Western gold community’s gold stocks are handily outperforming the world’s stock market casinos. I expect that trend to intensify, in the second half of the year!
- Increased M&A in the gold mining space and equity investments in junior miners should tell you where the smart money is headed. Take a look at the recent Osisko deal where Yamana outbid Goldcorp for their Quebec mine as a recent example and a straw in the wind. Look at Gold Resource Corp (GORO) and Hecla’s (HL) increased investments in the junior space.
- Gold and silver are trading way below their three year trailing averages which indicates that the price is way oversold and a major bounce is likely. Furthermore, gold is priced below production putting strain on future supply as miners mothball marginal projects.
- The equity markets are too high reaching extreme overbought and speculative levels similar to 2007 before the crash. A correction in equities sparked by fears of deflation could spark the return to gold and silver as a safe haven as Central Banks may continue to push negative interest rate policies similar to what the ECB recently announced.
- Gold and silver have been basing for three+ years and the junior miners have been in arguably a seven year bear market reaching historic oversold levels.
- Watch geopolitics especially the Ukrainian-Russian and the Middle East situation in Iraq, Libya, Syria, Iran and Turkey. If tensions escalate it could send metals, commodity and oil prices soaring. Do not be surprised to see further chaos and increased violence as the U.S. pulls its troops out of the region.
- Liquidity flows into or out of the “love trade” (gold jewelry) and the “fear trade” (inflation and financial system risk), are the two main drivers of the price of gold.
- The strongest gold jewellery buyers are in India, and the election of Narendra Modi has already unleashed a huge wave of confidence amongst jewellers there. ‘Retailers added that the latest steps by the apex bank of allowing banks to offer gold loans and permitting more entities to import the precious metal were signs of encouragement. This could drive up overall demand by 5% to 7% in 2014 from last year’s level of 975 tonnes, said Manish Kedia, bullion retailer. Manoj Thakkar of bullion retailer Amrapali Industries said, “The premium on gold has gone down from $110 per ounce to $35 per ounce. The prices too have come down after the Reserve Bank of India provided conditional relief in gold imports restrictions by allowing Star trading houses to import gold. We are in for better times now.”’ –Mineweb News, Mumbai, June 2, 2014.
- While El Nino could delay the arrival of India’s monsoon season by one or two weeks, an end to the import restrictions could unleash a tremendous amount of pent-up demand, more than offsetting the lost crop revenues.
- In the big picture, foreign investment is pouring into India. Last night, India’s central bank announced policy guidance, suggesting inflation will moderate and GDP growth will improve. As the economy strengthens, spirits are high, and this bodes well for the gold jewellery business during the second half of 2014.
- In America, home of the world’s largest gold fear trade, signs of inflation are beginning to appear. The Fed uses an eight year business cycle, and the last few years of that cycle tend to be when inflation appears.
- The US economy is entering the tail end of the business cycle now.
- On that note, please click here now. Seattle’s enormous increase in the minimum wage could set off a nation-wide surge in wages, which is highly inflationary.
- For a closer look at the Seattle plan, please click here now.
- Currently, most major money managers have a relatively similar outlook on major markets, including gold. If inflation begins to rise significantly over the next six months, significant disagreement about what that inflation means would almost certainly arise.
- In turn, that disagreement would create a fair amount of bond market volatility. Substantial institutional liquidity flows into gold stocks is very likely in that situation.
- Looking out over the next 7 months, both the love trade and the fear trade appear to favour the gold market bulls.
- Please click here now. That’s the GDX weekly chart, and it’s clear that significant summer rallies are the norm for gold stocks, not the exception.
- Look at the position of the 14,3,3 Stochastics oscillator. It’s very bullish.
- I would suggest that aggressive gold stock investors should be postured in a 70% -90% net long position. Personally, I’m 90% net long and in very buoyant spirits.
- Please click here now. That’s the daily GDX chart. Note how little price erosion in gold stocks has occurred on a year over year basis.
- Compared to past years, the erosion is minor, and there’s an enormous (albeit somewhat rough) inverse head and shoulders bottom pattern in play.
- Please click here now. This daily GDXJ chart looks good. There’s a nice bullish wedge forming, and my stokeillator (14,7,7 Stochastics series) has just flashed a crossover buy signal.
- The technical posture of gold stocks meshes well, with the Western world’s transition from deflation to inflation, and with the mindboggling changes taking place in India.
- The exactly launch point of a summer rally is likely impossible to predict, so I find it desirable to maintain a modest number of short positions.
- Also, the monthly US Employment Situation report will be released on Friday, and gold has a rough tendency to decline or trade listlessly in the week leading up to the release of the report.
- Is it possible that a substantial 2014 summer rally begins after the release of this key jobs report? I think so.
- Please click here now. I’ve outlined a rough scenario for summer rally enthusiasts on this daily silver chart. I’ve suggested silver could move up to about $22.
- Much higher prices are possible if Western world inflation and Indian buying increase significantly, and I think that’s exactly what’s going to occur.
- Please click here now. That’s the daily gold chart. Note the bullish position of my stokeillator at the bottom of the chart. A crossover buy signal appears to be imminent, and such signals tend to be followed by $50 – $150 rallies in the price of gold!
June is busting out gold and silver and all over the junior miners (GDXJ) which is up close to 30% this month alone. Are the blacks swans waking you up from the summer doldrums?
The technical signals are turning positive for gold (GLD), silver (SLV) and the junior gold and silver (SIL) miners. The record shorts such as hedge funds and high speed traders who have been manipulating the paper market may soon run scared as major accumulation has entered the sector this month.
Black swans are apparent all over the horizon which could boost gold and silver prices. Look at the news Russia cuts off Gas from Europe, Baghdad May Fall to Jihadists, 3 Bible Students in Israel Kidnapped by Hamas and the list goes on and on. There is a lot of tension and uncertainty that could shake the large cap equity markets which are overbought and inflated.
Look at the increase in volume and price appreciation in the gold junior miners so far in June. The 3 month downtrend has been broken as well as the 50 and 200 day to the upside. Major accumulation in the junior gold miners may be forecasting black swans and higher precious metal prices.

Gold and silver have held the lows and major volume and big money is coming into the sector. The record short position may already be running from cover. The Junior Gold Miner ETF is already up 15% this month.
With geopolitical tensions increasing in the Middle East and Eastern Europe get ready for a big breakout at $1400 on gold. The move in the junior miners and silver could be huge and provide great leverage to the price of gold bullion.
Also watch the oil price (USO) making a big jump as all of Iraq’s oil is at jeopardy of being lost as Al Qaeda takes over key areas which may include the capital Baghdad. Higher energy prices could influence the inflationary forces here in the United States creating a possible stagflation. Investors should keep a close eye on platinum (PTM), palladium (PALL) and uranium (URA).
Remember the US, European and Japanese economies are not growing, yet equity and food prices are soaring. The stock market and US bonds are way overvalued, while gold, silver and junior miners are just beginning to breakout of a multi-year base. As accumulation continues in the precious metals look for the record short position in precious metals to cover.

The accumulation in high quality junior gold miners is happening right before our very eyes. For instance I have shown my readers many different examples of oversubscribed financings in the junior resource sector. For these three factors look for gold to reverse possibly making gains of 4-5% daily to possibly break through $1400 before Labor Day.
This leads me to believe that gold and silver prices are about to take off in a major way and break the critical $1400 mark possibly by Labor Day.
Jeb Handwerger of Gold Stock Trades, Guest Contributor to MiningFeeds.com
Gold has failed to breakdown significantly from the tight coil pattern it created over a 2-month period. Failed breakdowns often mark key reversal points in markets, especially after moves that take a while to play out. In a downtrend, the duration of the move produces the angst and disgust that causes most of the selling. Then the final break of support creates the final flush out of the weak holders who didn’t sell out earlier in the move.
When there’s not enough selling pressure to continue the breakdown, the market often reverses higher in a fast and powerful manner. The selling pressure isn’t there anymore and new buyers push the market rapidly higher. The market basically gets caught looking in the rear view mirror, expecting more of the same thing to happen forever. Meanwhile, quickly and with force things change when many aren’t paying attention and a new trend develops.
After the coil in gold broke down in late May I noticed that sentiment on gold turned very bearish as if everyone was throwing in the towel. I even heard a podcast that I’ve never witnessed bearish on gold, say it wasn’t a good time to buy gold. But as of yet, the breakdown out of this coil has not produced significant follow through selling. Check out the chart of gold below to see exactly how this has unfolded.

Clearly $1280 is an important level going forward for gold since it represents resistance from the coil, and is also where the 50 day moving average sits currently. If gold can surprise the bears to the upside and complete the failed breakdown things could get interesting.
What’s even more interesting than gold though is what has happened in the mining stocks. GDX and GDXJ experienced only two-day breakdowns from their coils. These breakdowns occurred on high volume, but the buyers overwhelmed the sellers after merely two days. Then after drifting sideways for a few days both GDX and GDXJ blasted higher last week. GDXJ was able to get back above the 50 day moving average, above the top of the coil, and is now threatening the 200 day moving average. GDXJ also had record breaking volume in this latest move higher. This is starting to look like textbook failed move to fast move higher material, as just as quickly as the downtrend ended an explosive move higher is starting to develop.
 One last thing to note is what has occurred in the mining stocks, relative to gold. You would expect that if gold was to breakdown out of a tight consolidation, and the bears were to win, that gold stocks would get punished relative to gold since they tend to amplify moves in gold. But exactly the opposite happened on this latest coil breakdown in gold. Taking a look at GDXJ:GLD which compares GDXJ relative to GLD, we can see that immediately after the failed breakdown in gold, gold stocks showed superior relative strength. In fact not only did this ratio blast back higher but it got back above the 50 and 200 day moving averages in a hurry. And on massive relative volume.
 In a healthy gold market you want to see gold stocks outperforming the metal, and this failed breakdown in gold at the end of May is starting to look like it is forming a launchpad for a continued move higher in gold and gold stocks.
Justin Smyth of Next Big Trade, Guest Contributor to MiningFeeds.com. Connect with him on Twitter: @nextbigtrade

Originally published on June 17, 2014.
Stewart Thomson of Graceland Updates, Guest Contributor to MiningFeeds.com
Are the blacks swans waking you up from the summer doldrums? The technical signals are turning positive for gold (GLD), silver (SLV) and the junior gold (GDXJ) and silver (SIL) miners. The record shorts such as hedge funds and high speed traders who have been manipulating the paper market may soon run scared as major accumulation has entered the sector this month.
Black swans are apparent all over the horizon which could boost gold and silver prices. Look at the news Russia cuts off Gas from Europe, Baghdad May Fall to Jihadists, 3 Bible Students in Israel Kidnapped by Hamas and the list goes on and on. There is a lot of tension and uncertainty that could shake the large cap equity markets which are overbought and inflated.
Look at the increase in volume and price appreciation in the gold junior miners (GDXJ) so far in June. The 3 month downtrend has been broken as well as the 50 and 200 day to the upside. Major accumulation in the junior gold miners may be forecasting black swans and higher precious metal prices.
Click here for reference chart.
Gold and silver have held the lows and major volume and big money is coming into the sector. The record short position may already be running from cover. The Junior Gold Miner ETF(GDXJ) is already up 15% this month.
With geopolitical tensions increasing in the Middle East and Eastern Europe get ready for a big breakout at $1400 on gold. The move in the junior miners and silver could be huge and provide great leverage to the price of gold bullion.
Also watch the oil price making a big jump as all of Iraq’s oil is at jeopardy of being lost as Al Qaeda takes over key areas which may include the capital Baghdad. Higher energy prices could influence the inflationary forces here in the United States creating a possible stagflation. Investors should keep a close eye on platinum (PTM), palladium (PALL) and uranium (URA).
Remember the US, European and Japanese economies are not growing, yet equity and food prices are soaring. The stock market and US bonds are way overvalued, while gold, silver and junior miners are just beginning to breakout of a multiyear base. As accumulation continues in the precious metals look for the record short position in precious metals to cover.

The accumulation in high quality junior gold miners is happening right before our very eyes. For instance look at one of our featured companies Integra Gold (ICG.V or ICGQF) who just announced that their Private Placement is oversubscribed due to major demand from investors.
Integra hopes to be Quebec’s next major gold producer and is raising $8 million to advance their Lamaque Project in Val D’or. This is probably the highest grade undeveloped gold mine in Quebec right now with over 3.3 million tones at over 7g/tonne.
Integra came out with a positive Preliminary Economic Assessment (PEA) in April which I was very excited about and shared with my premium subscribers. The numbers look excellent with low capex, quick payback and a high rate of return. The metallurgy is excellent.
The money raised should be able to expand the resource with more drilling and increase the mine life as management continues to actively explore. They are hitting some of the best intersections to date that are thick and higher grade. There are assays pending and over 57,000 meters of drilling has not been added to the previous resource. An updated resource should come public after the next round of drilling later this year which may be exciting for shareholders able to get in at these lower prices.

Integra Gold may be a classic takeover target as they have one of the highest grade advanced stage gold projects in Quebec and is located in the same district as Osisko’s 10 Million gold ounce Malartic Project which is currently under acquisition by Yamana and Agnico Eagle who outbid Goldcorp. Integra’s Lamaque Project sits near Agnico Eagle’s 1.6 Million Ounce Goldex Mine.
With the recent PEA on Integra’s Lamaque Project published I expect some of the majors to show interest in the exceptional high grade gold project with impressive economics. At a base case of $1275 gold, Integra showed an IRR of 51% and a payback of 1.5 years with an NPV of $146 million. This PEA is a major milestone as it shows strong financial returns with quick payback at a relatively low capex.
It must be noted the resource has the potential to grow. Integra has seven exploration drills turning on the property right now. In addition Integra has 30k meters of drilling already completed and 10k meters pending that has not been added to the 2013 resource or factored into this PEA.
One of the most important decisions in investing in a development company is to study the infrastructure and local community support.
Its great to have high grade and fantastic metallurgy but what about the infrastructure and skilled local labor force? Integra’s Lamaque Project is located within 3 km of the city of Val d’Or, Quebec. Val d’Or is a mining community with over 35k people. There is a high level of expertise in underground gold mining. Miners can live and work in the same community which is a major benefit given the fact that it is rare in the industry.
The Lamaque Project is within 200 m of the Trans Canada Highway. The land where the project is located has no homes or businesses which would require relocation. Over the past six months, Integra has been proactive in building a relationship with local community by participating in 25 private and public meeting with stakeholders. The company is encouraged by the support of the local community and is already commencing environmental studies.
Quebec was ranked #11 by Fraser Institute as a mining friendly jurisdiction. Despite the weak junior market, Integra has been able to raise money and attract equity interest from Shandong Gold Group, a $4.7 billion dollar gold producer who owns 5% of Integra and has a seat on the board of directors.

Look for Integra to find support under the 200 day moving average and reverse above it at $.23. Notice the large volume accumulation in 2014 signifying major buying. I expect this to continue as they continue to drill and provide a resource update later this year.
Listen to my recent interview with the CEO Steve de Jong after the recent PEA was published by clicking here…
Disclosure: I own Integra Gold and the company is an advertiser on my website. Be aware of any conflict of interest and always do your own due diligence.
Jeb Handwerger of Gold Stock Trades, Guest Contributor to MiningFeeds.com
The US stock markets’ Fed-driven melt-up has accelerated again in recent weeks, with a string of new nominal record highs. This has reignited truly extraordinary levels of greed, euphoria, and complacency. But for traders who have witnessed past bull toppings, there is an ominous sense of deja vu. It turns out this past year’s strong stock-market action nearly perfectly matches that leading into the last bull-market top in 2007.
This shouldn’t be surprising at all, as topping signs abound. The flagship S&P 500 stock index (symbol SPX, but trades as the mighty SPY ETF) has blasted an astounding 188.4% higher in the 63 months since today’s cyclical bull was born in despair in March 2009. For the second half of this entire duration, the last 32 months, the SPX and SPY have not seen a single 10%+ correction. This has bred euphoria.
The word “euphoria” is widely misunderstood by investors. Most assume it means the stock markets are rocketing parabolic in a popular speculative mania. But euphoria and manias are very different beasts, the former word simply means “a strong feeling of happiness, confidence, or well-being”. That perfectly describes how the vast majority of investors feel about the stock markets today. They really are euphoric.
Valuations, or how expensive stock prices are relative to underlying corporate profits, really emphasize the extremeness and irrationality of this excessively-positive sentiment. At the end of last month, the 500 elite companies of the SPX had simple-average and market-capitalization-weighted-average trailing price-to-earnings ratios of 25.9x and 23.1x! This is far beyond the 14x historical fair value, nearing 28x bubble territory.
Investors utterly loving today’s overextended and overvalued stock markets reminds me of 2007, when the last cyclical bull peaked. Similar conditions existed, as the SPX had just enjoyed a large 101.5% bull market over the past 60 months. There hadn’t been a correction in years, so sentiment was euphoric. And stocks were very overvalued then too, with SPX simple-average and MCWA trailing P/Es of 23.1x and 21.3x.
What happened after that last stock-bull topping is what makes understanding today’s apparent stock-bull topping so critically important. The S&P 500 and therefore SPY rolled over into a brutal cyclical bear that would ultimately bludgeon this mighty index 56.8% lower in just 17 months! While that bear was exceptional, they still cut stock prices in half on average. So stock-bull toppings are dangerous times to invest.
As a professional student of the markets and trader, I remember 2007’s stock-bull topping vividly. It was a miserable time to be a contrarian, to bet against the crowd. Everyone believed “this time it’s different”, that the forever-cyclical stock markets had somehow evolved to a new era of endless rallying. Contrarian views were openly ridiculed and mocked, and it truly felt like the stock markets would keep on climbing forever.
At stock-bull toppings, everything seems perfect and super-bullish. There are no storm clouds on the horizon, and it looks like clear sailing indefinitely. Any economic data that seemingly supports the “all is well” notion is trumpeted, while any opposing data is rationalized away. Mainstream individual investors finally start growing comfortable enough to buy stocks, with the late-bull low-volatility melt-up seducing them in.
While 2007’s last stock-bull topping felt just like today psychologically, I’ve been trying to recall exactly how the SPX/SPY price action looked on a tactical day-by-day basis. Did we have this same low-volatility melt-up, with new highs being seen for weeks on end? Were there few down days then too, with material selloffs nonexistent? The closer this past year matches with 2007, the higher the odds we’re in a topping.
But unfortunately these aren’t easy periods to compare. The SPX is much higher today than it was back in 2007, so not only can these episodes not share a common index-level axis but their percentage changes won’t be comparable. On top of that, the calendar-year positioning of the last bull topping and recent weeks’ SPX highs don’t match either. Both toppings have to be indexed to recast them in common terms for analysis.
So this first chart takes the last SPX stock-bull peak in October 2007, and this week’s latest SPX high, and indexes them both to 100 to make them perfectly comparable. An index level of 90 in either era for example means the SPX was 10% lower than those highs. And the date scale is replaced with months leading up to and after those highs. The result is unequivocal, today’s stock markets look exactly like a bull topping.

There’s much to digest here, let’s start with the big picture. Cyclical stock bulls are born out of cyclical stock bears, which leave stock prices undervalued in price-to-earnings-ratio terms. The SPX and SPY are also very oversold after cyclical bears cut stock prices in half, so the early rallies out of those bear-market bottoms with peak despair are big and fast. Stocks shoot out of their bear-market lows at steep trajectories.
But within a year or so, the easy gains have been won. The stock markets are no longer oversold and have to start advancing based on fundamentals instead of sentiment. The underlying economic outlook has to be good, and corporate profits have to be improving, to attract in additional investors. And since the economy and earnings can only grow so fast, the rate of stock-market gains moderates considerably.
But the deep wounds from the preceding stock bears are still raw, so there is much skepticism in the middle stages of cyclical stock bulls. Thus periodic major selloffs are common, from large pullbacks exceeding 7% to full-blown corrections beyond 10%. These events are very healthy, as they rebalance sentiment away from the excessive greed and complacency rampant after major uplegs have surged higher.
All this is normal bull-market stuff, good for 100% gains doubling the preceding cyclical-bear lows. I visualize cyclical-stock-bull index trajectories like a football professionally passed at a 45-degree upward angle. After shooting up steeply from the quarterback’s hand, the football’s momentum soon starts to fade and its rate of ascent gets ever slower. Its height peaks, and then it noses over to finish its parabolic arc.
The first two stages of cyclical stock bulls, the sharp initial post-bear oversold rallying followed by the normal slow mid-bull uplegs punctuated by major selloffs, follow this football trajectory. But before their arcs peak, the third and final stage of cyclical bulls drives stock prices to break out to the upside. These breakouts are readily evident above, the SPX surging over the normal bull arcs highlighted with large dashed arrows.
Cyclical bulls start accelerating again late in their lifespans, starting around the final quarter, because sentiment once again elbows out fundamentals as stock prices’ primary driver. The longer a cyclical bull propels stocks higher, the more greedy, euphoric, and complacent investors become. This leads to fewer major selloffs that become farther between, so the foolish perception that stock markets are riskless sets in.
Thus capital starts returning to stocks at an accelerated pace, forcing their prices up much faster than the underlying corporate earnings growth which expands their valuations. And since a growing majority of smug investors no longer fear major selloffs, corrections vanish and pullbacks become smaller and smaller. Investors feeling left behind are quick to buy the dips, countering selloffs before they rebalance sentiment.
The resulting late-stage-cyclical-bull stock-market action is readily evident above, a rather-steep low-volatility levitation. Stock prices climb and climb, with far more up days than down days. And though most of these daily rallies are nothing special, they add up to steep tight rises in stock prices. As you can see in this chart, this pattern happened leading into the last stock-bull topping in 2007 and over the past year and a half.
One of the most fascinating things this stock-bull-topping comparison reveals is how similar the late-bull trajectories were in the final 15 months leading into 2007’s top and the past 15 months leading into today. The SPX and SPY surged rapidly in steep late-bull uplegs, but there was relatively little volatility and major selloffs were essentially nonexistent. I was surprised today’s topping tracks the last one so well.
Why? This current bull is exceedingly massive thanks to the US Federal Reserve’s unprecedented QE3 debt monetizations and jawboning. The dominant and likely sole reason the US stock markets took off in early 2013 and have surged ever since was the universal Fed-fostered belief among traders that the US central bank was effectively backstopping the stock markets. If they sold off, it would be quick to ease further.
This has proved to be a powerful psychological force obliterating the prudent knowledge that stock markets are forever cyclical and don’t rise in a straight line forever. It was surprising to see an eerily similar trajectory at the end of the last cyclical bull, which didn’t have the Fed printing money hand over fist. But it did have the US house-price bubble, and the resulting false perception that our economy was booming.
Fueling terminal late-stage melt-ups in cyclical bull markets requires some external factor that is universally perceived as exceptionally bullish to attract in accelerated buying. Investors need to have some way to rationalize their decisions to buy overvalued stocks high late in bull markets. They really need to believe that “this time it’s different” because something new is happening that they think will fire a perpetual bull.
Zooming in on this same indexed comparison offers higher-resolution views of both the breakouts from normal healthy mid-stage bull markets and the final-stage terminal levitations. Provocatively the final 15 months’ gains leading up to the end of the last cyclical bull were more extreme than today’s similar period in some ways. The SPX was higher in indexed terms for most of that run, and witnessed even fewer pullbacks.

This ominous stock-bull-topping pattern is crystal-clear here. Late-stage stock bulls with some powerful external psychological buying catalyst break out of their normal healthy ascent slopes to start levitating. Major selloffs vanish as stock markets melt-up relentlessly. This leads to extremely unbalanced trader sentiment, with greed, euphoria, and complacency growing ever more extreme with each passing week.
In merely 15 months or so, already high and overvalued stock prices can surge by 25% (running from a top-indexed level of 80 up to 100) as measured by SPX and SPY. Investors start fearing being left behind more than anything else, so any selloffs are quickly short-circuited by buy-the-dippers flooding in. This relentless buying pressure leads to the tight low-volatility terminal levitations seen on this chart.
But eventually buying exhaustion sets in. Everyone willing to fight market history and buy high is already fully deployed. And without significant new buying, the tired cyclical bull finally tops and rolls over into a new cyclical bear. This final topping stage is marked by the extreme overvaluations that I mentioned above, as well as epic complacency. This is best approximated with the definitive VIX fear gauge.
Just over a month ago I wrote about the VIX S&P 500 implied-volatility index warning of an impending major stock-market selloff. You can get up to speed on the VIX and how it works in that recent essay. For our purposes today, realize that just last week this VIX fear gauge fell to its lowest level of this entire cyclical bull. In fact, it hadn’t been lower since early 2007 leading into the last cyclical bull’s topping!
An extremely-low VIX reveals extreme complacency, the opposite of fear. The word complacency means “a feeling of contentment, especially when coupled with an unawareness of danger”. Remember that the popular outlook for the stock markets is always the most bullish, always seems the most optimistic, right when stock bulls are topping. The most dangerous time to buy stocks feels like the least dangerous!
That’s why studying and understanding market history is exceedingly important for investors. The stock markets are forever cyclical, an endless parade of bulls followed by bears followed by bulls again. No bull market runs forever, they all fail. And that critical inflection point when they are running out of steam on the verge of rolling over into bears never feels bad at the time. Cycle peaks offer no indication of impending change.
Think of the Earth’s seasons driven by its orbital mechanics. In the midst of July’s triple-digit heat and blinding sun, it feels like winter will never come again. But winter is still coming, we all know that. The stock markets are the same way, bull-market summers lead to bear-market winters. But since those stock-market cycles take far longer than our short seasonal cycles, they are difficult to perceive without diligent study.
Given the extreme size and duration of today’s cyclical stock bull, the extreme euphoria rampant among investors, and the extreme overvaluations of stock prices relative to underlying corporate earnings, there is no doubt we are in a major stock-bull-topping phase. That has been readily evident since last year to every honest student of stock-market history. These technical topping patterns are just icing on the cake.
Both the trajectories and percentage gains in SPX and SPY over the past 15 months have eerily matched the 15 months leading up into that last cyclical stock bull’s topping in October 2007. In indexed terms to make them perfectly comparable, the past 15 months and the final 15 months of the last stock bull are almost interchangeable. They are both low-volatility melt-ups, terminal levitations leading to bull toppings.
This has enormous life-changing implications for stock investors. If Wall Street is right and this bull still has years left to run yet, the best gains you can hope to see in the major stock indexes are probably around 5% to 10% annually. But if the contrarian view overwhelmingly supported by market history once again proves correct, then the elite stocks of SPX and SPY face losses approaching 50% in the coming years!
Is chasing minor gains late in an overextended mature cyclical bull really worth the serious risk of suffering catastrophic losses of half or more of your stock portfolio? If this next cyclical bear unfolds over 2 years, and the cyclical bull after that runs for another 5 years, it will take 7 years just to return to breakeven when stock prices again match today’s topping levels. Can you afford to throw away 7 years?
Prudent stock investors realize they need to study stock-market history and not fight the stock-market cycles. They know after extreme runs they have to take the contrarian view and do the opposite of what is popular. You can’t buy low and sell high if you succumb to herd-mentality groupthink, as stock prices are lowest after stock bears when everyone hates stocks and highest after bulls when everyone loves stocks.
At Zeal we are hardcore students of the markets who actually walk the contrarian walk. Back in March 2009 when everyone thought the stock markets would continue plunging, I wrote the SPX was bottoming and a new cyclical bull was being born. So our subscribers bought low. In October 2011 after the biggest correction of this entire bull when everyone was calling for a new bear, I said that was an amazing buying opportunity and the stock bull was far from over. I was right again.
Contrarian trading works, fighting the crowd is the only consistent way to buy low and sell high. And now everyone thinks this stock bull will power higher for years more to come, but they are wrong again at another extreme. Sadly the vast majority of stock investors, who spend way more time researching some new electronic gadget they covet than planning for their financial futures, are going to get slaughtered.
The bottom line is we are witnessing a stock-bull topping today. In addition to extreme overvaluations and rampant euphoria, the stock markets have experienced a steep low-volatility melt-up in the past year and a half or so. Technically this matches the price action leading into the end of the last cyclical stock bull perfectly. The past 15 months in particular are nearly identical with the last 15 months of the last bull!
This is a menacing portent, as stock bulls are followed by stock bears which cut the headline indexes in half over a couple years or so. Investors fooled by Wall Street’s false hype that bull markets last forever are going to get killed in this next bear. Stock markets are forever cyclical, so it is foolish to buy high late in a massive bull market when topping signs abound. It’s far wiser to sell high, and then buy low later.
The gold (GLD) and silver (SLV) price may be reversing over the next couple of weeks. The junior miner gold ETF (GDXJ) is reversing above the 50 day moving average and breaking above its recent three month downtrend.
Click here for reference chart.
When the huge cash positions waiting on the sidelines or taking profits in the equity market rising on low volume return to the ignored resource sector the gains could be huge. Already the volume in GDXJ in 2014, has jumped outpacing 2012 and 2013. On the other hand the S&P500 has been rising on light volume which is often a warning sign that the extended rally is getting exhausted.

This indicates to me that possibly the large institutions are accumulating the juniors after all the retail investors jumped ship. Prices could jump rapidly in the Toronto Venture Exchange where most of the legit junior miners are traded. These small cap juniors could gap higher as the major institutions are hardly exposed to the mining sector at all.
It appears that some of my charts are showing a potential reversal in the precious metals. Get ready for an incredible bounce higher in precious metals. Here are five reasons why.
One of our long term junior gold mining favorites since 2011, Corvus Gold (KOR.TO) came out with very positive news that they extended the high grade veins at their Yellowjacket Deposit at North Bullfrog and actually may have a new vein discovery. The drilling may be suggesting that their are additional veins around Yellowjacket. The first 5,000 meter program will focus on Yellowjacket and then the second 15,000 meter program will explore district wide for additional vein systems. In addition, Corvus announced positive results of metallurgical studies using gravity which could increase recovery and reduce processing costs.

Corvus owns 100% of North Bullfrog which covers 68 square km in Southern Nevada, approximately 90 minutes from Las Vegas. It is a huge property and there is the potential for additional discoveries.
All of this drilling and metallurgical work will be included in a new Preliminary Economic Assessment and resource update which will be completed after all of the 2014 drilling. This could be quite an exciting time for this high quality junior gold miner Corvus Gold (KOR.TO or CORVF). Remember management owns close to 10% and Anglogold Ashanti (AU) and Tocqueville Asset Management are the largest owners.

Corvus (KOR.TO) appears to be ready to make a reversal above the 200 day at $1.34 and despite recent progress is trading near a six month low. Notice the improving RSI and MACD despite a new low this month. This is usually indicative of a bullish reversal.
Disclosure: Beware of conflicts of interest. I own shares of Corvus and they are a website sponsor.
Jeb Handwerger of Gold Stock Trades, Guest Contributor to MiningFeeds.com
Briefly: In our opinion no speculative positions in gold, silver and mining stocks are justified from the risk/reward perspective.
The precious metals market moved higher yesterday, which was in tune with what we’ve been expecting. The key question is if gold, silver and mining stocks have completed their rally or are they still likely to move higher before turning south again.
Before jumping into charts, we would like to point out that the reasons for which we think the medium-term move is down were covered in the previous Monday’s alert, and if you haven’t had the chance to read it, we encourage you to do so today. Having said that, let’s move to charts (charts courtesy of http://stockcharts.com.)
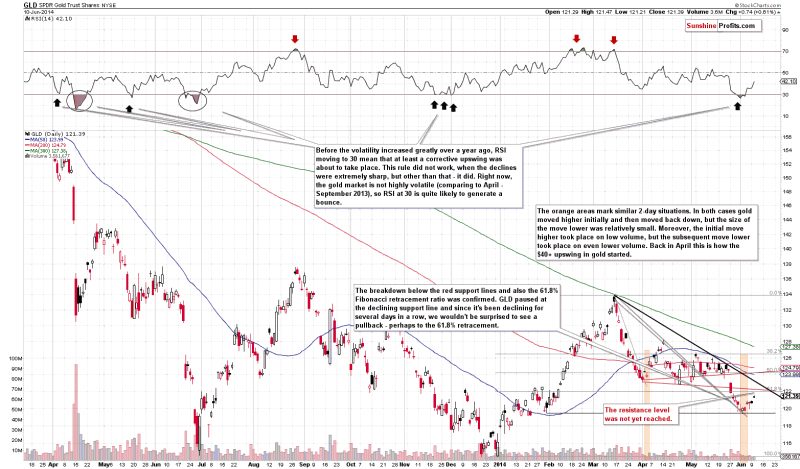
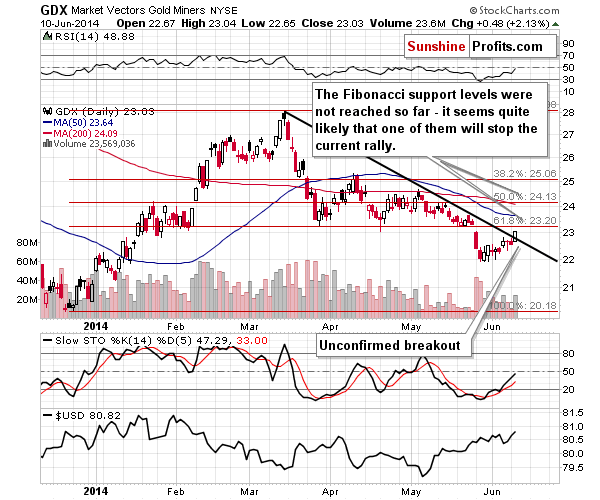
Gold moved higher, but hasn’t reached the levels that we thought were likely to stop the rally.
Quoting our previous alert:
How high will gold rally before turning south again? There are no sure bets, but our best guess is that it will correct to the previously broken 61.8% or 50% Fibonacci retracement levels – which means a move to (or very close to) $122 or $124.50 or so in case of the GLD ETF and $1,260 or $1,290 in case of spot gold. We will be looking for bearish confirmations (signals from indicators, ratios, other markets, etc.) around these levels and we’ll probably re-enter short positions once we see them.
We saw the GLD ETF close at $121.39, so it’s still below the lowest of the above-mentioned resistance levels and thus it seems that the rally will continue for at least a while.
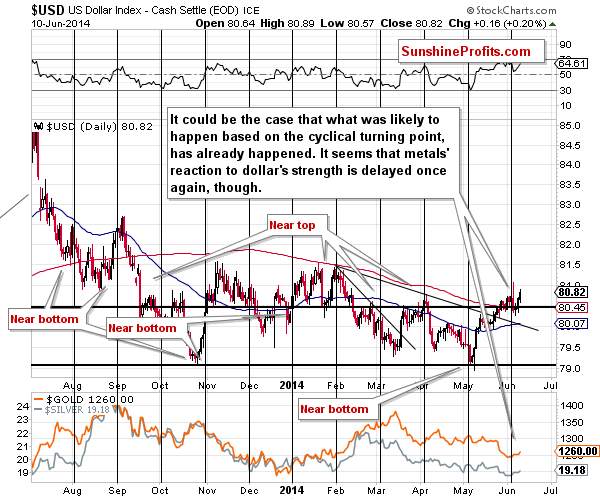
What’s even more interesting, is the fact that gold managed to rally despite a rally in the USD Index.
At this point it’s worth quoting what we wrote in the previous alert:
When a given market refuses to react in a certain way in spite of a visible factor for such a move, it usually means that a move in the opposite direction is likely. At this time, precious metals refused to decline given the move higher in the USD Index, which means that they “don’t want to” move lower and that they are not done rallying.
During yesterday’s session gold has not only not-declined – it actually managed to rally despite USD gains and the short-term implications for the precious metals market are bullish in the short term. There are none in the medium term as metals’ reaction to dollar’s strength can – and likely is – delayed once again.
The situation on the silver market remains rather unclear so we will once again seek confirmations in the mining stock sector.
The situation in mining stocks is even more bullish for the short term than it is the case with gold. Before commenting on yesterday’s price/volume action we would like to quote our previous comments as they remain up-to-date:
Mining stocks declined on Monday, but moved lower on low volume, which suggests that this might not have been the true direction of the move. The move lower was relatively small – compared to the size of the upswing in the USD Index, so the overall implications are overall bullish. (…)
In case of the GDX ETF, the price targets are relatively close as well. The first one is slightly below the $23 level, at the declining resistance line, and the second one is at the 61.8% Fibonacci retracement. The third one is at the 50% Fibonacci retracement slightly above the $24 level. Either way, the upside is rather limited and we don’t think that the GDX will move and stay above $24 for long – if it gets there, that is.
If gold is to double its recent move higher, then we could expect mining stocks to move at least to their 61.8% Fibonacci retracement, slightly above $23.
Miners moved above their initial target level – we saw a breakout above the declining resistance line. The move above it was rather insignificant, so it’s not necessarily really meaningful. The volume accompanying the breakout was not small, but it was not really huge either – we don’t think it was big enough to confirm the breakout on its own. Given the situation on the gold market (the resistance level was not reached), it seems that the mining stocks could see higher prices in the coming few days as well, but we don’t think that this is the start of another huge rally just yet.
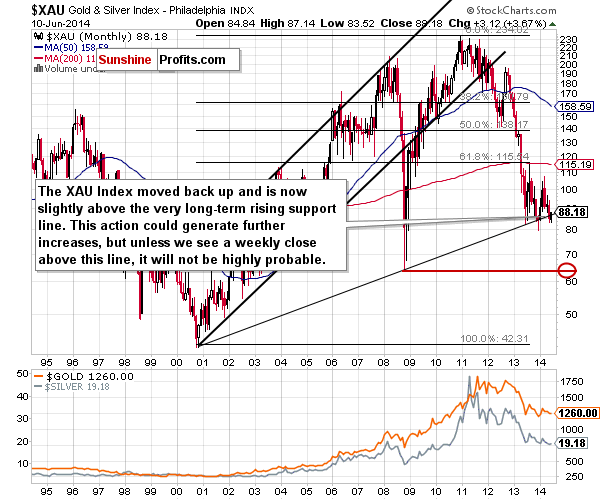
There is one more slightly bullish factor that we saw in case of the XAU Index (which includes both: gold stocks and silver stocks). We are commenting on it because we have previously written that the breakdown in the XAU Index – if confirmed – will be a very bearish factor for the entire precious metals sector. The point is that it was – to some extent – invalidated.
At this point you might be wondering how a breakdown can be “partially” invalidated (just as someone can’t be partly on a plane – you either are on it or not; …OK – we realize that it is possible in the quantum sense, but that’s not what we mean here).
The key thing to keep in mind here is the very long-term nature of the above chart and the support line that we are discussing. Such lines often need something more than just an intra-day move or even a daily close to constitute a meaningful move – be that a breakout or breakdown. In some cases a weekly close is enough and in some cases one would ideally want to see a monthly close before viewing a given move as real. At this time its rather unclear exactly how long should we wait for a confirmation or what invalidates a breakdown, however it’s quite probable that an intra-week move is not enough to change much. Consequently, we don’t view the above-mentioned “invalidation” as meaningful just yet. In other words, the implications are only slightly bullish.
As it is the case with gold, we will be monitoring the markets for signs of weakness and bearish confirmations to estimate at which of these levels it’s best to re-enter short positions. The situation is much less clear in terms of price targets when it comes to silver, so we will focus on other markets to estimate the time when shorting the silver market seems justified from the risk/reward perspective once again.
Summing up, while the medium-term trend in the precious metals market is down, we are seeing a corrective upswing and it doesn’t seem that it’s over yet. It seems quite likely that the rally will be over relatively soon, perhaps when the USD Index reaches the 80 level (however, this level might not be reached based on this week’s rally in the USD, so we will look for other signs that the rally in the metals is over as well).
To summarize:
Trading capital (our opinion): No positions
Long-term capital: No positions
Insurance capital: Full position

Stewart Thomson of Graceland Updates, Guest Contributor to MiningFeeds.com

Gold Standard Ventures (GSV) has received a great deal of attention lately. It all started in March when the company closed on the 100% consolidation of its highly prospective Pinion deposit. Then, in the first week of May, Gold Standard presented at the Gold Forum in Switzerland. Next, a May 21st company interview in the Gold Report continued to highlight renewed interest in this story. Importantly, institutional money appears to be flowing into the name.
On May 27th, a bullish independent research article contributed to a huge spike in trading volume to ~2.3 million shares (for the U.S. and Canadian tickers combined), 10 times the average daily trading volume of the prior 30 days. More recently, on May 30th, a press release was issued announcing the spin-off of non-core exploration assets in exchange for some cash and 60,000,000 shares of a junior mining company.
Why all the excitement? For answers, I turned to Gold Standard’s CEO Jonathan Awde. The following interview was conducted by phone and email in the first week of June.
Your company has released important news this year, most notably the consolidation of its Pinion Gold Project. Please reiterate the importance of this milestone.
Jonathan Awde: Acquiring the balance of Pinion provides GSV with 100% ownership/control of an entire district (the last remaining underexplored district) within the southern end of the world renowned Carlin Trend in Nevada. From about 13 sq. miles in 2009, our total holdings now cover roughly 46 sq. miles. This is a game changer as it’s the first time the entire district has been under one roof. This district had been fraught with multiple ownership interests, mineral and water rights issues. Pinion has a historical (non NI 43-101 compliant), near-surface oxide resource with what appears to be room to expand. The consolidation of the greater Railroad district took 4 years and was an exhausting exercise at times.
In another press release, you announced that gold assays of historic Pinion drill holes not previously assayed for gold yielded positive results. Can you elaborate on the possible significance of that news?
Jonathan Awde: We acquired a huge data set when we closed on the Pinion acquisition. We were pleasantly surprised to receive more core than our records indicated and several core holes and portions of other core holes were never assayed. It’s always nice to essentially get free gold. It should be helpful with the publishing of our first NI 43-101 compliant resource. Over 380 holes have been drilled over the years. We believe that our current drill campaign, some twinning and confirming of historical holes as well as drilling deeper on near surface holes that bottomed in mineralization, will enable us to release a maiden NI 43-101 resource by the end of July. These holes are relatively inexpensive and take just 2-3 days to drill.
Has the newly consolidated Pinion property replaced the North Bullion Fault Zone “NBFZ” as the main focus of the company?
Jonathan Awde: Yes, for the time being. Given the challenging capital market environment and uncertainty with the price of gold, drilling shallow RC holes into a near-surface oxide resource vs drilling more costly, deeper core holes into North Bullion was an easy decision. We strongly feel that making the Pinion deposit NI 43-101 compliant could be a key valuation driver. The NBFZ remains a highly significant target that’s open in several directions. Our last hole that we announced at NBFZ in January was technically a very important hole that extends the mineral system in a west-northwest direction. Our technical team was very encouraged with the results of this hole.
Some pundits compare Pinion to peer Nevada heap leach projects such as Midway Gold’s (MDW) Pan project, Corvus Gold’s (OTCQX:CORVF)North Bullfrog and Newmont’s (NEM) Emigrant mine just a few miles from the Pinion deposit. Do you see any relevant comparisons or takeaways?
Jonathan Awde: Well, all of them are oxide and Bullfrog, Pan and Emigrant have excellent economics. Historical results indicate that Pinion has the highest indicated grade of the 4 deposits; however, I must caution that we do not yet have a NI 43-101 compliant resource at Pinion and have not carried out a preliminary economic assessment or other study thereon. We’ve just started drilling at Pinion for our Phase 1 program but we feel very strongly about the potential.
You mentioned some positive attributes of Pinion (such as private land) that are not necessarily shared by other exploration-stage projects, please elaborate?
Jonathan Awde: Dealing with private ground, which a large portion of Pinion is, is a huge advantage from a permitting/development standpoint. We’ve also secured certain water rights which as you know is a huge plus in Nevada. Finally, Pinion is a near-surface, oxide deposit, so drilling costs and the time it takes to drill holes is favorable compared to some peer exploration-stage projects.
Bald Mountain is your third main target. How does Bald Mountain compare with Pinion and North Bullion?
Jonathan Awde: We’re very excited about Bald Mountain. We made an oxide discovery that was announced in October of 2013. We hit 56m of 1.47 g/t oxide, including 7.3m of 5.66g/t in hole RRB 13-1. The geological setting that exists at Bald Mountain suggests something important could be going on. We weren’t able to do any follow on drilling at Bald Mountain in the fall as there were some land issues that got resolved when we closed on the Pinion acquisition. We will do a follow on program later in the summer into the fall.
A month ago, your company presented at the European Gold Forum in Switzerland. How would you describe the interest in Gold Standard Ventures at that event?
Jonathan Awde: We had several really productive meetings. Interest in our company is picking up. We find that investors don’t know much about Pinion and are kind of taken aback by the fact that a near-surface oxide deposit with good grade was still available in the Carlin Trend. We have several institutions, investors, analysts and companies coming to the see the project over the next few months.
You have plans to release a NI 43-101 compliant resource for both Pinion (July, 2014) and North Bullion (later this year). Does the $11 million you raised in March fund you through both of these key milestones?
Jonathan Awde: Half of the money raised was used to acquire the remainder of the Pinion property; the rest will allow us to publish our first NI 43-101 compliant resource for Pinion. Drilling is well underway and the first program will be finished this month.
Will your maiden NI 43-101 compliant resource compare to historic resource estimates?
Jonathan Awde: The historical resource at Pinion (non 43-101 compliant resource) is based on over 330 holes (318 RC and 12 Core holes). We have over 90% of the RC cuttings and chips and all of the core holes. However, a lot of the historical work never tested the limits of the mineral system at Pinion. Our phase two program is designed to do just that. In addition, past companies that explored Pinion always ran into surface and mineral rights constraints that forced companies to drill portions of sections, not as a district; an issue we don’t face. We also have a new interpretation of the geology. So while I can’t comment on the specifics of historical estimates, we are certainly looking forward to releasing our initial NI 43-101 resource estimate this July.
Please tell us more about your recent agreement to sell non-core assets for some cash and 60 million shares in Tanqueray.
Jonathan Awde: We were looking at ways to monetize those non-core assets. We looked at spinning them out, selling them or JV’ing them. We found in the end that getting an independent valuation done and selling them to the new company was the best option. Gold Standard will retain a large exposure to these assets through our ownership in Tanqueray when the sale completes in or about mid-August.
Some investors might be concerned about the recent departure of David Mathewson. What was the rationale behind his leaving the company?
Jonathan Awde: We thank David for all he’s contributed and the exploration team he helped build and leaves behind. However, please remember that David will remain with us as a technical advisor for at least the next year. In my mind, we get the best of both worlds, he remains a technical advisor to our company AND we benefit from the 60m shares of Tanqueray Exploration stock that we will receive in conjunction with David leaving us. Based on current market prices, our stake in Tanqueray would be worth approximately C$3 million. David always made it clear to us that he greatly prefers doing grass roots exploration– making discoveries. That’s where he excels.
Importantly, we hired another very talented, highly experienced, senior geologist. John Norby has over 35 years of experience as exploration, project and chief geologist. John has extensive Nevada experience including nearly 20 years spent designing and executing exploration and resource delineation programs for Barrick Gold (ABX) and Newmont mostly in the Carlin and Cortez trends.
Can you describe your investor base? For example, last summer Agnico Eagle (AEM) acquired a 5% stake. Who are some other large holders? How much does management own?
Jonathan Awde: We have a solid investor base. Yes, Agnico took a 5% stake last summer after several site visits. It was a great endorsement of the project and our team to receive an investment in a very challenging environment for junior companies. FCMI, American Century, US Global, Royce, Phoenix and Oppenheimer have been very supportive. Management owns in the low teens percentage-wise of our outstanding shares, so a meaningful stake for sure.
Thank you so much for your time this week, I enjoyed talking with you about Gold Standard Ventures. Do you have any final comments to leave readers with?
Jonathan Awde: Thank you Peter, I think we covered a lot of ground. I would simply reiterate that we have a large, recently consolidated, contiguous land package in the Carlin, the most prolific gold trend in the western hemisphere. For the first time ever, the last unexplored window in the Carlin trend is being explored using modern technologies, led by a world-class exploration team. We have near-term catalysts in the form of drill results and maiden NI 43-101 compliant resource reports from Pinion by the end of July and North Bullion later this year. Barrick has made it clear again and again how important Nevada is to its future. We strongly believe that Nevada is the best place to explore for and develop gold deposits.

The precious metals plunged last week, knifing through key support zones to unleash an explosion of bearish sentiment. This troubling heavy selling wasn’t news-driven, it emerged out of the blue. Who was dumping gold and why? Later data confirmed it was American futures speculators short selling gold and silver at record levels. Extreme shorting is very bullish, as these bets soon have to be covered.
The gold and silver price action has been exceedingly anomalous since early 2013. That’s when the Federal Reserve fomented a melt-up in the general stock markets, through both monetizing debt and jawboning implying it was backstopping stock prices. The levitating stock markets gradually sucked all life away from alternative investments including gold, which was crushed by epic selling of gold-ETF shares.
Western investors all but abandoned gold, leaving it solely at the mercy of American futures speculators. Their collective buying and selling always affects the gold price, but its impact is really amplified in this surreal world of withered investment demand. Since 2013’s extreme record gold-ETF selling petered out in early 2014, gold and silver prices have been utterly dominated by trading in the US futures markets.
Speculating in gold futures is a super-risky hyper-leveraged game. Last month the CME Group cut the margin requirements on gold and silver futures by 7.7% and 8.3%. Now traders only need to keep $6000 in their account to control a single 100-ounce gold contract, and $8250 for a 5000-ounce silver contract. And at $1250 gold and $19 silver, these contracts are worth a whopping $125,000 and $95,000 respectively.
Thus a speculator running minimum margin has maximum leverage of 20.8x in gold futures and 11.5x in silver futures. This is astoundingly high. In the stock markets, the Federal Reserve’s Regulation T has legally limited leverage to just 2.0x since 1974. At 20.8x leverage, a relatively small 4.8% move in gold futures in the wrong direction from any speculator’s bet will wipe out 100% of the capital they risked!
So futures speculators simply can’t afford to be wrong for long, even if they aren’t running minimum margin. On Tuesday May 27th, they greatly expanded their bets that gold and silver prices would just keep drifting lower. So gold and silver plunged 2.1% and 1.9% that day, driving the final nail in the sentiment coffin for many precious-metals bulls. At the time, the source of this heavy selling wasn’t clear yet.
Futures speculators can sell PM futures, effectively adding supply and driving down prices, in two very different ways. They can liquidate longs, the worst kind of selling. Once traders sell their long gold and silver futures positions, they have no obligation to return. They can stay out for a long time, certainly not helping the precious metals’ prices. So paring longs can sometimes be a very bearish omen.
Futures speculators can also short sell PM futures, effectively borrowing the metals from someone else before dumping them. They hope to buy back the futures later at lower prices to repay their debts, pocketing the price drop as profit. But unlike long liquidations, short selling is very bullish because traders are under a legal contractual obligation to buy long contracts in the near future to cover their shorts.
Futures short selling is guaranteed near-future buying, as every single contract sold short has to be bought back which adds demand. This bullish covering occurs soon for two reasons. First, given the extreme leverage inherent in gold and silver futures, speculators can’t risk being heavily short for too long. Second, futures contracts have built-in expiration dates. They have to be covered before those.
Thankfully the serious selling that crushed gold and silver last Tuesday was exclusively American speculators’ heavy futures short selling. We couldn’t know that until late last Friday afternoon, when the Commodity Futures Trading Commission released its weekly Commitments of Traders report on futures positions. Until 3:30pm Friday rolled around, I was worried last Tuesday was a long liquidation.
American stock traders, whose epic GLD-share selling was responsible for gold’s entire plunge last year, played no role in last Tuesday’s precious-metals breakdown. That day GLD’s gold-bullion holdings actually surged higher by 1.1% or 8.4 metric tons. That was their largest daily build in percentage terms since August 2011, and absolute tonnage terms since October 2012! Were stock traders buying gold?
I doubt it. The flagship GLD gold ETF’s mission is to track the gold price. So if stock traders weren’t selling GLD shares as fast as futures traders were dumping gold, GLD’s price would have decoupled to the upside. GLD’s custodians had to add new share supply to keep its price falling fast enough to keep pace with gold. So they issued new shares, and used the proceeds to buy more physical gold bullion.
Since GLD didn’t experience differential selling that breakdown day, American futures speculators had to be the culprit. And Friday’s CoT proved they were, on the short side. This first chart looks at the GLD price superimposed over speculators’ weekly total long and short positions in gold futures, taken from those CoT reports. When I saw this latest CoT data last Friday, my eyes nearly popped out of my skull.

In that CoT week ending on Tuesday May 27th, the day gold and silver plunged, American futures speculators sold short an astounding 30.5k gold contracts! This is a staggering number, the equivalent of 94.8t of gold dumped onto the markets in a single week. Global investment demand, which the World Gold Council says averaged 30.2t per week in 2012 and 14.9t last year, simply couldn’t absorb this burst of supply
You can see the sharp jump above in the red line, speculators’ total gold-futures shorts. I couldn’t ever remember such a massive shorting spree, so I checked the CoT data back to 1999. In that entire 15.4-year span, encompassing the end of the last secular bear and this entire secular bull, this was the biggest weekly jump in spec gold-futures shorting ever! It may even be an all-time record, it was that extreme.
In fact, there were only two other times since 1999 when specs’ gold-futures shorts soared more than 25k contracts in a single week. Both were last year, in mid-February and mid-November. During those smaller episodes of extreme shorting (30.1k and 27.9k contracts), gold prices plunged by 2.8% and 3.3% in those CoT weeks. Yet this metal merely slipped by 2.3% in this latest new record CoT week.
The fact that extreme futures shorting is having a diminishing impact on the gold price was a pleasant surprise. Given the universal hyper-bearishness plaguing gold these days, and the total abandonment of it by Western investors, you’d think a record shorting assault by futures speculators would ignite a crash-like plummet. But instead gold only retreated around 2%, not a big move even right near lows.
Why? Gold has spent this past year bottoming and basing. It first hit $1200 late last June, and hasn’t traded much lower ever since despite facing the roaring headwinds of the Fed’s ongoing stock-market levitation. You can see that bottoming and basing above clearly in GLD share prices. And each time gold refuses to break to major new lows, fewer American futures speculators are willing to short it again.
Their total gold shorts hit a record 178.9k contracts back in early July after those initial gold lows. And that massive short ramp hammered gold and GLD prices. In fact, over the entire past year the single most important and dominant driver of GLD has been American speculators’ gold-futures short selling and subsequent covering. There’s been a nearly-perfect inverse correlation between their total shorts and GLD prices!
So if you want to know where gold and GLD are going, you have to watch the speculators’ shorting. They covered aggressively after their extreme bets last July didn’t pan out, driving gold sharply higher. Then they started ramping their shorts again late last year to 150.0k contracts in anticipation of the Fed starting to taper its QE3 bond-monetization campaign. They figured both QE3 and the end of QE3 were bearish for gold!
Yet that bet was again spectacularly wrong, so they soon had to cover again which drove the sharp early-2014 rally in gold and GLD shares. Despite all their sophistication, as a herd American futures speculators’ bets on gold are a powerful contrarian indicator. Right exactly when they are most bearish, having the largest total short positions and lowest total longs, gold is on the verge of major new uplegs.
This latest record surge in specs’ gold-futures shorts last week merely boosted their total up to 121.4k contracts, far below the last two peaks. If gold soon rallies sharply from here, which it certainly ought to given these huge new short positions that have to soon be covered, these peaks in spec shorts form a major downtrend. Each time gold drifts to lows, fewer and fewer speculators are willing to bet against it.
And that makes sense, as gold has stabilized in this past year despite enormous ongoing GLD holdings liquidations in the second half of 2013. That means there are big buyers out there absorbing this supply, Eastern investors. While Americans foolishly like to sell low and buy high, hating cheap gold and loving the dangerously overvalued stock markets right now, Asians play this game the opposite smart way.
Interestingly not all American futures speculators are blinded by groupthink and the herd mentality. A majority of traders have been gradually adding to their long-side gold-futures positions all year, shown above by the green line. In fact when their peers were selling short 30.5k gold-futures contracts last week, they actually added 3.1k long-side ones. This was serious contrarian buying given gold’s plunge!
With the legions of bearish futures speculators failing on three major occasions over the past year to push gold to new lows, I suspect their zeal to short this beaten-down loathed metal is going to soon evaporate. And once they start covering, their buying feeds on itself. The more gold-futures contracts bought to cover existing shorts, the faster the gold price rises and the more it pressures other traders to cover shorts too.
And even with specs’ total shorts now nowhere near last July’s record, there is still an utterly huge amount of short covering left to do. During the normal years of 2009 to 2012 before last year’s extreme gold anomaly, American speculators’ total gold-futures shorts averaged just 65.4k contracts. Merely to mean revert from here, they’d have to buy to cover 56.0k contracts which is the equivalent of 174.2 tonnes of gold!
And mean reversions out of extremes rarely stop at averages, they usually overshoot in the opposite direction. So we’re likely to see specs’ total shorts well under 50k contracts after this coming short covering has run its course. On top of that, specs’ total gold-futures longs at 200.0k contracts remain far below their 288.5k average between 2009 to 2012. A mean reversion there represents another 275.2t of gold buying.
So as American gold-futures speculators unwind and mean revert their extreme bearish bets on gold over the coming year or so, we are looking at a staggering 449.4t of buying from them alone. This isn’t far below 2013’s epic record GLD liquidation of 552.6t, which was responsible for nearly 6/7ths of the total drop in global gold demand that hammered its price 27.9% lower last year. Huge gains are coming.
And once gold’s mean reversion gets underway decisively from this speculator futures buying, other investors will pile in. We’ll see big differential buying pressure on GLD shares from American stock traders as they seek to redeploy in gold, and surging Western physical demand. Major gold uplegs start with futures short covering, continue growing on futures long buying, and then accelerate when real investors return.
With gold low and basing this past year, silver has fared worse in some ways. Super-volatile silver is kind of like a gold sentiment gauge. Speculators and investors only get interested in buying it again once gold is already rallying, gold drives silver. And this same CoT chart substituting spec silver-futures positions and the flagship SLV silver ETF’s price highlights even more extreme futures shorting last week.

Last week as gold plunged on futures short selling, speculators also dumped silver. The resulting 6.4k-contract jump in traders’ total silver short contracts was really big, but not a record. It was still quite rare though, as 6k+ contract weekly leaps in spec shorts have only been seen in 34 of the 804 CoT weeks since the beginning of 1999. And nearly half of these occurred before the late 2001 birth of silver’s secular bull.
But the actual total level of American speculators’ silver-futures shorts did surge to a new record last week of 58.2k contracts! This is at least a 15.4-year high, since early 1999 if not all-time. This trounced the last record of 54.3k in early December 2013. The implications of these epic shorts are even more profound for silver than they are for gold, with the potential to launch a moonshot in this hated metal.
Much like gold, silver has bottomed and based over this past year. But unlike gold-futures speculators, silver-futures speculators have continued to press their outsized bearish bets. The peaks of their shorting are actually still rising, leaving them extremely exposed to a sharp rally in this traditionally super-volatile metal. When gold starts running, silver will follow. And the rush to cover will be savage.
Between 2009 and 2012, total spec silver-futures shorts averaged 21.5k contracts. Merely to mean revert to those levels will require traders to buy back 36.7k shorts, the equivalent of 183.5m ounces of silver! This is an enormous amount. According to the Silver Institute, 2013 global mine production averaged 68.3m ounces per month. We are talking about short covering equivalent to nearly 3 months of world mining!
And this silver short covering will likely happen fast, over less than a month. Not only is silver prone to big and fast rallies when gold runs, but silver futures are highly leveraged making shorting extremely risky when silver rallies. So with American speculators’ silver-futures shorts again at record highs, I still believe a massive silver short squeeze is coming. Futures shorts always have to soon be repurchased.
It’s provocative that silver didn’t plunge far in response to last week’s record spec shorts, a sign that there is big buying out there absorbing this burst of supply. Much of this is for physical bullion, where global demand surged to a record high last year despite the wretched prices. But some is futures buying, where contrarian futures traders have been steadily adding to their long silver-futures holdings all year.
So despite the universal bearishness that flared up in response to last week’s heavy gold and silver selling, it was the best kind of selling. It wasn’t dreaded long liquidations, as long-side bets continued to rise in both gold and silver (also up 3.0k contracts). It was extreme short selling, positions that have to soon be bought back to repay those debts. Extreme futures short positions are very bullish omens.
When the great majority of futures speculators have crowded onto one side of a trade, they are always wrong. They are the most bullish, with high total longs and low total shorts, right when prices are topping after long runs higher. And they are the most bearish, with low total longs and high total shorts, right when a price is bottoming before turning higher again. The latter describes gold and silver perfectly today.
With gold-futures and silver-futures shorts just hitting their own records, it virtually guarantees a frenzy of short covering is nearing. Short covering feeds on itself, driving accelerating rallies that propel gold and silver (and therefore GLD and SLV) higher. Are you ready for this? Do you have the courage to make a contrarian bet, to buy low when others are afraid? Or do you sell low and buy high like Wall Street?
The bottom line is gold and silver plunged last week because American futures speculators doubled down on their extreme bearish bets. They succumbed to today’s universal herd mentality that foolishly believes gold and silver prices fall forever while stock markets rise forever. So they added record levels of gold-futures shorts, and took silver-futures shorts to record levels. This bet has failed for an entire year!
Extreme futures short positions have to soon be covered, and the resulting buying feeds on itself and can spawn stunning short squeezes that catapult prices higher. As traders inevitably soon start to unwind these bets by buying to cover, gold and silver prices are going to surge. There is nothing more bullish than extreme leveraged shorts, as these excessively bearish traders soon become frantic forced buyers.

Barry Ritholtz is out with another article spelling more doom for the precious metals sector and the gold bugs. The self proclaimed “Gold Agnostic” penned a 2500 word missive in January which followed a blog post amid the spring 2013 collapse titled “What are Gold’s Fundamentals.” For the record, Ritholtz’s calls on the markets and Gold have been very good. He was bullish during most of the 2001-2011 advance and sold out prior to the 2013 breakdown. Give credit where credit is due. Yet, while the anti-gold and anti-gold bug mainstream eat up his gold analysis like a lap dog we have to mention some errors and a startling omission of Gold’s key driving force.
Despite having spilled tons of ink on the subject, Ritholtz has continually failed to mention the major driver of Gold which is the direction of real interest rates. Ironically, Ritholtz often writes about following the data and avoiding narratives, yet he ignores this when discussing the yellow metal. Gold rises when real interest rates are negative or declining sharply. Its simple to understand. If investors and fund managers can earn a real rate of return on a money market fund, CD, or bond then there is no need for an alternative currency. If you can’t earn a real rate of return safely then you’ll seek alternative currencies such as Gold and Silver. The following chart from Nick Laird shows real rates and Gold over the last 80 years.

The venerable Ned Davis Research, as reported in Barrons yesterday noted that real interest rates recently have turned favorable for Gold. That is probably why they concluded that the bull is alive but wounded. Capital Economics, as reported by Frank Els also notes in a report that the real yields have declined. I happen to agree with NDR’s view that the short-term technical situation is not conducive to speculative positions. Last week we wrote that Gold could fall to $1080 before the bear ends. A weekly close below $1200 would likely trigger that final washout.
Ritholtz’s arguments for the end of Gold’s secular bull are surprisingly weak. Of course none revolve around the end to negative real rates. He cites a chart and some commentary which regards the dollar rebound as potentially an epic squeeze. This Business Insider style observation bears no reality. The US Dollar index is up less than 2 points in the last month and the commitment of traders report does not show a huge speculative short interest conducive to a short squeeze. Ironically, the epic squeeze is likely to come in Silver and on a lesser scale Gold. Gross short positions in Silver reached a new all time high last week. Further weakness in both metals could setup a large short squeeze in the coming months.
By now you know that Ritholtz’s conclusion (the bullish factors from 2001-2011 are gone) is incomplete and irrelevant. His five points help explain the bear market in Gold but none of them reveal anything about an end to negative real rates, which is the key driving force. If one wants to make a case that the secular bull is over then they need to make the case that real rates have bottomed and will rise indefinitely. This is what happened following 1951 (commodity peak with gold price fixed) and 1980. With the latest uptick in inflation and decline in yields, real rates are again negative and trending favorably for Gold.
Statistically speaking inflation has almost no downside and has in fact started to trend higher. Core inflation in the OECD countries is at an 18 month high while inflation in Canada is at a two year high. The CPI and PCE in the US have started to tick up. MIT’s Billion Prices Project which has led the CPI at key turning points since 2009 has accelerated higher since December 2013. This implies the CPI has further upside. With regard to rates, we know that each 1% rise in rates equates to an additional ~$180 Billion in interest costs. That is over 6% of FY 2013 federal revenue. Policy makers want but more importantly need inflation to get the debt burden under control. Real rates were strongly negative for much of 1942 to 1949. Inflation surged while real growth stagnated but we got the debt burden under control. It led to a tremendous uninterrupted equity advance from 1949 to 1956. However, that was after a rip roaring advance in hard assets.
Hopefully this missive cut through both the bull and bear BS on Gold. Gold bugs will shamelessly promote anything as bullish while gold bears will mention anything but the only fundamental that matters, negative real interest rates. The historical bear analogs, sentiment and negative real rates argue that the precious metals complex is nearing the conclusion to a cyclical bear market within a secular bull. If you’ve followed my work you will know that I have been bearish since the hard reversal in March. Patience and discipline will be the name of the game over the coming weeks. Discipline is required to exit hedges at the right time while patience is required to buy as low as possible. I am looking at JNUG (3x long GDXJ) as well as several juniors I believe have exceedingly strong upside potential over the coming quarters and years.

A few days ago, B2Gold announced a $570 million acquisition of Papillon Resources. This merger seems to me a very bullish sign for emerging gold producers. Papillon was taken out at about $125/oz of gold. That’s $125/oz of Measured, Indicated and Inferred resource. Papillon’s asset is located in Mali. Yes, that’s Mali the country in western Africa. The project could be in production as soon as 2h 2016. Again, I find this deal to be very bullish for the gold sector. Paying $125/oz for a project that’s at least 2 years from initial production and has significant geopolitical risks says a lot about the state of the gold market.
When I read the news, I figured that Papillon’s project must be spectacular in some way, perhaps very high-grade or ultra-low cost…..but it’s not. The ore grade is mediocre at 2.35g/tonne and the all-in-sustainable cost at $725/oz is pretty good, but far from spectacular. These deal metrics for an asset in Mali really surprised me. Digging deeper, I spoke to some analysts who said that although Mali has overall Africa risk and infrastructure challenges, it’s one of the better countries to do business in… for Africa. For some reason, that wasn’t entirely comforting.
Reading between the lines, the real story here is that mid-tier and Major gold producers are starting to look at their production profiles from 2016 on. There are going to be shortfalls as significant amounts of high-cost operations have been curtailed and development of projects with all-in costs north of $1,000-$1,100/oz are on indefinite hold. The one good thing about the Papillon project is that it’s of meaningful size, forecasted to produce 300k ounces per year from 2017 on.
Takeaway?
I think this deal shows that the writing is on the wall….companies need to acquire near-term production. If B2Gold was willing to pay $125/oz for a non-spectacular (my opinion only) asset in Mali, what does that say about the possible takeout value of assets in North America? More specifically, there are a number of highly promising, low-risk, near-production plays in Nevada that really stand out compared to B2Gold’s acquisition of Papillon. Names that come to mind include Pershing Gold and Midway Gold, both in production next year. Pershing already has fully built, 100% owned and paid for processing facilitates and heap leach pads. It should be in initial production in 2h 2015 with a remaining capital cost of under $20 million, (according to a recent research report by Cantor Fitzgerald).
Cantor forecasts all-in costs for Pershing of roughly $750/oz and 85k ounces of production for the full year of 2016, ramping up to 100k ounces in 2017. Call me crazy, but I will take Nevada production all day long over ANY production ANYWHERE in Africa. Pershing’s Relief Canyon project is a past-producing mine, it has 3 open pits, roads and other infrastructure already in place. The overall risk of getting Relief Canyon into production compared to that of Papillon’s project reaching production on time and on budget is like night and day.
Analysts and gold market pundits have noted the increase in suitors kicking the tires of assets in Nevada. It’s merely a question of when, not if, a wave of M&A sweeps over the state. Some deals of distressed juniors may occur at cheap valuations, but companies with highly experienced management teams, strong projects, near-term production and tangible assets will not be sold at fire sale prices. Companies like Pershing that has zero debt and a solid balance sheet and Midway with ample cash after issuing shares and obtaining an attractive debt financing package are gems that should be valued at a substantial premium to emerging producers in Africa.

Though precious metals are rallying on the day we pen this (May 30), we expect more downside before a final bottom or at least before we’ll exit hedges and begin buying. Since the hard reversal in March we’ve had the view that precious metals would decline and the miners could retest their December lows. We’ve held firm on this belief in recent weeks and wrote that a May decline could setup a June buying opportunity. Our analysis leads us to believe we are almost there but not quite yet. A little bit more patience is required.
I want to begin with Silver for several reasons. Recall that Silver peaked in April 2011 while Gold didn’t peak until the late summer. It makes sense that Silver would bottom first. In addition, the turn towards an inflationary environment (rather than a deflationary one) which we’ve discussed recently benefits Silver against Gold. Finally, Silver is giving us clear and strong signals. The bear analog chart below shows that a little bit more downside should mark the end of the current bear (black line).
Click here for reference chart.
In addition, here is a chart we posted in late March when we discussed the coming opportunity in Silver. The chart shows an 11-year trendline marking what should be rock solid support at or slightly above $17. A final decline could touch the trendline and then begin a strong reversal.

Gold’s bear market has been severe to this point but not when judged through the lens of history. The bear analogs below suggest Gold has more downside potential and could easily make a new low. If and when the weekly low of $1200 breaks, Gold could plunge to its bottom within a few weeks. Keep an eye on $1080, which is the 50% retracement of the entire bull market.

The potential decline in Gold sounds severe but consider the following. We already mentioned why Silver should bottom before Gold. Also, the gold stocks began topping in December 2010, well before Gold. Silver stocks and junior miners (SIL, GDXJ, GLDX) peaked in April 2011. Although the large cap miners (GDX) peaked at the same time as Gold in summer 2011, the majority of the mining sector peaked months before. Hence, it would not be a surprise to see the mining stocks or some of the sector bottom before Gold.
History makes a strong argument that this leg down in the miners is the final leg down.

The bears analog chart argues that gold stocks could make a double bottom or perhaps a marginal new low. In my opinion, a new low would be a false new low. The next chart is a weekly plot of the HUI and GDM, the forerunner to GDX. The support (or buy) targets are quite clear.

Although gold stocks are rallying today, my work leads me to believe that there is more downside before a bottom. The good news is the sector is now much closer than it was a few weeks ago. Yet, patience and discipline will be the name of the game over the coming days and weeks. Discipline is required to exit hedges at the right time while patience is required to buy as low as possible. I am looking at JNUG (3x long GDXJ) as well as several juniors I believe have exceedingly strong upside potential over the coming quarters and years.
Article written by Guest Contributor to MiningFeeds.com, Jordan Roy-Byrne of The Daily Gold.

Nickel prices have been trending downwards in recent years, reaching a four and a half year low in December 2013. Since the turn of the year though, that trend has reversed and prices have risen over 47% since January – more than any other base metal on the LME. Given the current good global supply; we must ask ourselves – what is happening to nickel prices?
Click here for reference chart.
Demand developments in recent years
Demand for nickel has grown significantly in the past 20 years, and is generally linked with economic development. Economic growth drives higher demand for stainless steel of which nickel is a key component, with stainless steel manufacture making up half of all nickel use.
As it takes several years to invest and launch new capacity, the industry is slow to respond to demand changes. In addition, the nickel mining process has become more expensive over time as existing mines become less productive and new sites need significant investment to be developed and connected to the global infrastructure network through new rail lines and shipping routes.
After reaching a record high of more than USD 50,000 per tonne in 2007, nickel prices fell dramatically in the following two years as the global economy suffered through the financial crisis since in 2007/08, and prices reached USD 10,000 per tonne by the end of 2008. Demand and prices rose again in 2010/11, driven by improving expectations of global economic recovery, especially in China, which has become the most important demand driver in recent years. This strong growth in demand was partly driven by the economic stimulus launched in China in 2009 to support economic growth.
Asia as a region is now responsible for 65% of global nickel demand, with China alone accounting for close to 44%. China’s share of global nickel imports have grown from 4% to 18% since 2001, as the country’s infrastructure investments raised demand for metals, such as stainless steel.
How supply responded to demand
Nickel production grew strongly until 2007 reaching 1.4m tonnes, supported by rapid global economic growth. Growth in supply was driven by expansion in China, particularly due to the commercial development of nickel pig iron (NPI) which was introduced in 2005. NPI is a cheaper alternative to pure nickel as it makes use of lower grade ores than the traditional nickel production process and is primarily used in the production of stainless steel. NPI production grew slowly in the first few years, but by 2011, it was estimated at around 250,000 tonnes. Commercial NPI production requires low cost nickel ore, cheap coking coal and cheap electricity, a combination that is available in China but not in other parts of the world. China’s NPI production is primarily used domestically to replace traditional products like nickel metal and stainless steel scrap, and so reduces nickel import demand.
Between 2001 and 2011, several other nickel facilities were started, including in Brazil, Madagascar, Myanmar and New Caledonia. Although production fell significantly during the economic downturn in 2008/09, to 1.3m tonnes, production then recovered and reached 1.6m tonnes in 2011.
This expansion in global capacity exceeded the growth in demand and by the second half of 2013, nickel prices had fallen to below USD 14,000 per tonne. This price level had not been seen since 2009 and was estimated to be 30-40% below the cost of production. As a result, production output was reduced by roughly 30%, leading to a drop in supply.
What is behind recent strength in price?
The downward price trend reversed in early 2014 with prices reaching a two-year high in May, fuelled by concerns about supply from Indonesia, the world’s second largest producer and exporter of nickel ore. In January 2014, in a bid to encourage local processing, the Indonesian government introduced a ban on exports of all unprocessed minerals from the country, including nickel ore. Approximately 15% of the total world’s nickel production comes from Indonesia. Recent years saw increasing exports of nickel ore from Indonesia to China, where it is processed into NPI. Nickel ore from Indonesia accounted for almost 60% of China’s nickel ore imports in 2013.
In recent months, prices were further boosted by issues in Russia, home to the world’s top nickel-producing company MMC Norilsk Nickel. Ongoing tension between the west and Russia over the political crisis in Ukraine and the resulting sanctions introduced by the US and EU against Russia have led to concerns about disruptions to supply if the situation continues.
Outlook
Looking ahead, the current rate of price rises may not be sustainable. Global inventories were at record high in March – 285,000 tonnes – as a result of the years of growing supply. Even so, it is likely that the average price seen in 2014 will be higher than in 2013.
Global demand for refined nickel is projected to increase by 6% in 2014 driven by the improving economic outlook in major consuming countries, such as US and Japan, and increasing consumption in smaller markets, such as Brazil. In addition, new stainless steel production capacity is coming on stream in 2014, which will also raise demand for nickel. Global production is expected to be steady or decline in 2014, as the low prices in 2013 resulted in the closure of some production facilities.
The most influential factor on price will be how producers respond to the Indonesian ban on nickel ore exports. In anticipation of the ban, importing countries such as China, built up stocks of nickel ore and metal. Even so, supply is likely to tighten towards the end of the year, as stocks are worked through.

With over thirty years spent in the global resource sector, with a particular focus on mining, there is no doubt that Richard Warke provides an experienced and well-respected voice for the resource industry.
In addition to his experience in mineral operations, Mr. Warke has also spent time in oil and gas, forestry, technology, and manufacturing operations. Currently serving as executive chairman of Augusta Resource, chairman and CEO of Wildcat Silver, and director of Plata Latina Minerals, Mr. Warke, who is also the founder of all three companies, was kind enough to take time out of his busy day to describe some of his notable experiences in the resource sector.
You have clearly had many successful ventures in your career in the mining industry. Can you give us an idea of what, in your mind, was your most notable?
Richard Warke: The most notable would be Ventana Gold. In 2006, as part of Wildcat, I decided to purchase very promising gold/silver properties in Colombia. Given that it was in a different political jurisdiction and the primary metal was gold, I spun out these properties into a separate company, which became Ventana. We kept it private for 2 years and raise $20M for exploration. Then in late 2008 we listed it on the TSX and I served as executive chairman until less than three years later, after assembling a management team and financing exploration and development, Ventana was sold for approximately $1.5 billion, more than 25x its original value.
I would say that Augusta Resource also deserves special mention. I bought the Rosemont Copper project for $20M, and it has advanced from an early exploration property to being recognized as one of the best undeveloped copper projects in the world.
Speaking of Augusta, isn’t there a hostile bid on this company as well like Ventana? That surely shows that this is a coveted asset.
Richard Warke: That’s correct. There currently is an unsolicited offer for the purchase of Augusta. Rosemont is a world class asset on the cusp of some significant value creating events, and the offeror is clearly being opportunistic. As a result of this situation, we are in the middle of a strategic review process as well, with numerous parties actively engaged in due diligence and management discussions which further demonstrates the attractiveness of Rosemont.
You started multiple companies in the space of a year. What was the strategy in that move?
Richard Warke: I discovered some great properties and was bullish on commodities at the time. To those unfamiliar with the industry, it may look as if I was spreading myself thin, but I had a long-term focus and understanding that some projects will proceed faster than others, while others take a longer time to advance. More importantly, it is about putting the right team in place to develop the projects and manage the companies.
Ventana truly was a success story and well known in the industry. Tell us a little bit more about the other companies you have under your umbrella and their achievements.
Richard Warke: There are currently three public companies.
1. Augusta Resource owns the Rosemont Copper Project located in Arizona, USA, when in production it is expected to produce an average of 243M lbs of copper per year over 21 years, and will be third largest copper mine in the USA with industry low cash costs. It’s recognized as one of the best undeveloped copper assets in the world.
2. Wildcat Silver has the Hermosa Project, a silver-manganese project also located in Arizona. This will be one of the largest silver mines and the only electrolytic manganese metal mine in North America, expected to produce on average annually nearly 6M ounces of silver and 110M lbs of EMM, also at industry low cash costs.
3. Plata Latina Minerals is a high-grade silver exploration story, which has a portfolio of silver projects in the Mexican Silver Belt. The principal property Naranjillo already has a discovery in progress with the discovery hole returning 10.95 metres of 3,181 g/t silver and 13.28 g/t Au. Plata Latina is my most recent venture and was IPO’d in April of 2012.
Three very unique companies.
What is the key to your success and do you follow the same strategy?
Richard Warke: I have tried to follow two main guidelines for the business.
Firstly, when acquiring properties or projects, they have to be in mining friendly jurisdiction and political stable jurisdiction. They have to stand up to severe technical due diligence and have significant upside potential, and demonstrate the ability to be a low cost producer.
Secondly, like any business you cannot succeed unless you have a first class dedicated management team. People who know their craft and are not afraid to work together for a common cause. There is no doubt that any successes I have had would not have been possible without a full team effort.
Mr. Warke, we appreciate your insight. Thank you for your time.
Richard Warke: You’re welcome.
If you would like to receive our free newsletter via email, simply enter your email address below & click subscribe.
 Follow us on Twitter
 Become our facebook fan
CONNECT WITH US
Tweets
Tweet with hash tag #miningfeeds or @miningfeeds and your tweets will be displayed across this site.
MOST ACTIVE MINING STOCKS
Daily Gainers
 CMC Metals Ltd. CMC Metals Ltd. |
CMB.V | +900.00% |
 Eden Energy Ltd Eden Energy Ltd |
EDE.AX | +200.00% |
| GoviEx Uranium Inc. |
GXU.V | +42.86% |
| Eagle Nickel Ltd. |
ENL.AX | +41.67% |
| Citigold Corp. Limited |
CTO.AX | +33.33% |
| Mount Burgess Mining NL |
MTB.AX | +33.33% |
| Exalt Resources Limited |
ERD.AX | +31.94% |
| Casa Minerals Inc. |
CASA.V | +30.00% |
| Cariboo Rose Resources Ltd |
CRB.V | +28.57% |
| Belmont Resources Inc. |
BEA.V | +28.57% |


