
Benjamin begins by speaking to the recent news that copper has been disappearing in China. He notes that people have been talking about copper stockpiles in China for years, and how he went to China on a trip to find it. However, when he arrived, the stockpiles always had a smaller amount of tonnage than they actually claimed they did. He then explains how the use of copper to secure loans created over-reporting of the amount of copper being stored, which accounts for this discrepancy. Benjamin notes that when this copper disappeared, the price of copper didn’t go up, which was due to copper no longer being good collateral for Chinese loans. However, the evaporation of copper as collateral for loans and the magical “disappearing” of copper are both going to drive up the price of copper. Benjamin concludes by noting how much he loves copper, and that this development only strengthens Oreninc’s bullish case for copper.
Watch on YouTube: https://www.youtube.com/watch?v=IFeRPVGee8Q

Briefly: In our opinion (half) speculative short positions in gold, silver and mining stocks are now justified from the risk/reward perspective.
Gold and the rest of the precious metals market moved higher on Friday and the volume was not low. It was lower (for the GLD ETF) than what we had seen during Thursday’s decline, so there are some bearish implications. But are they really that important? Let’s take a closer look (charts courtesy of http://stockcharts.com.)
Click here for reference chart.
The very short-term trend remains down (based on July highs), so we can’t say that a lot changed. The analysis of price and volume provides us with bearish implications even though the last move was down. The GLD ETF closed slightly below the 300-day moving average (spot gold closed above it). Gold is declining also today – clearly the short-term trend remains down.
From the long-term perspective – and comparing gold’s performance to that of the bond market – the situation remains bearish.
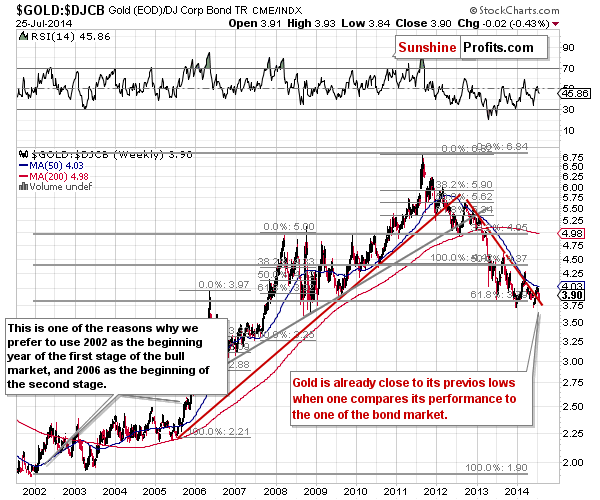
Gold is already very close to its previous lows. It would now take only a little more weakness for gold to break below them, which would likely start a sizable downswing.
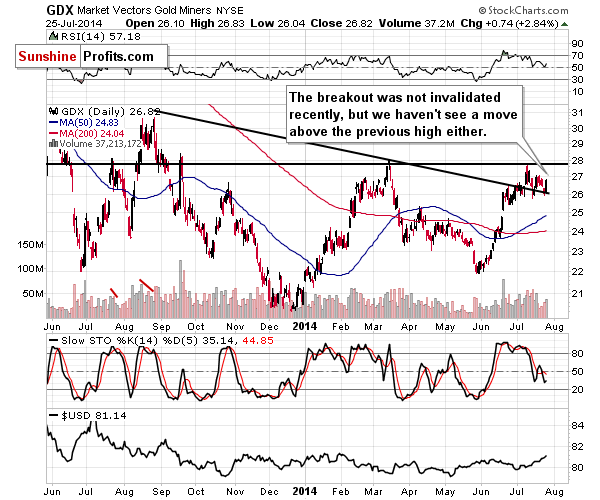
In the case of mining stocks, the short-term trend is more horizontal, but it’s still pointing downward. The volume here was a bit higher on Friday than during the previous daily decline, and it’s a bullish sign. If miners continue to show strength, it might suggest that we will see another rally before a bigger decline.
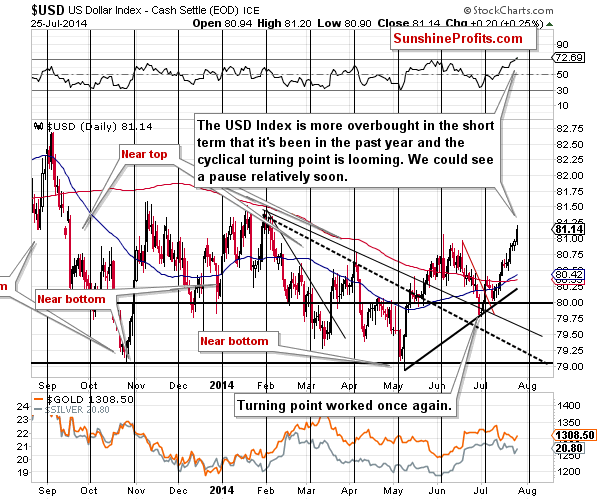
The situation on the USD Index chart is bullish, but we see some caution signs as well. The RSI indicator is above the 70 level, which has previously meant that a local top would be seen shortly. In fact, it was the proximity of this level that was followed by declines, and at this time the U.S. currency is even more overbought – it’s more overbought than it’s been in a year. What we wrote previously about the possible implications remains up-to-date:
We could see a pause here, but we could also see another visible move higher followed by a correction close to the cyclical turning point (meaning in a week or so).
In other words, we are gold fans, but not fanatics. We don’t act in the best interest of gold or silver producing companies. We act in your best interest. We are neither permabulls nor permabears. We don’t believe blindly in gold or any other asset class. We are not against any particular asset class either. We strive to look at the world in the most unbiased way possible (please note that we don’t accept any advertising on our website in order to prevent any conflict of interest), then combine it with our experience in the precious metals market, trading in general and all other linked areas, and provide the outcome of our analysis to you – our subscribers and readers – in order to make your investments and trades more profitable and to help you grow money over time.
At this time, based on the analysis of various fundamental factors including the low interest rates and Quantitative Easing programs, we think that gold and silver are poised to move higher in the coming years. However, markets are only logical and do what they are “supposed to do” in the long run (counting in years, not months or days). We also realize that markets don’t move in one way only – at times even the markets with the most favorable outlook have to correct or decline. In the medium term and especially in the short and very short term, markets are not logical, but emotional. They are also vulnerable to big entities moving the market with sudden sales of assets. Did the fundamental situation change for gold in 2008? No, but it declined very significantly nonetheless. It moved back up and rallied much above the previous high, but not before declining sharply and significantly.
At this time, even though we like gold and silver as very long-term investments, we don’t think that the medium-term decline is already over. We like gold, but based on the information that we have available today, it seems likely to us that it will need to move even lower before it starts its next big upswing.
Summing up, it seems to us that the situation in the precious metals market remains bearish, but it improved a bit based on Friday’s session. While the USD Index is visibly above the June high, gold is not below its June low. This strength could be meaningful, or it could be the case that the metals’ reaction is just delayed. Please note that the major breakdown in the Euro Index has just materialized and it’s quite likely to impact the precious metals market negatively in the coming weeks and months. The short-term outlook for the USD Index is rather mixed. The medium-term trend is down, but the currency is strongly overbought in the short term and the turning point is just around the corner.
While we continue to think that the medium-term trend remains down for gold, silver and mining stocks, the odds for a move higher in the coming days somewhat increased based on the sector’s strength on Friday and the overbought situation in the USD Index. It seems to us that decreasing the size of the short position (at this time the silver market provided the biggest gains) in the sector is now justified from the risk/reward perspective.
To summarize:
Trading capital (our opinion): Short (half) position in gold, silver and mining stocks with the following stop-loss levels:
Gold: $1,353
Silver: $21.73
GDX ETF: $28.30
Long-term capital (our opinion): No positions
Insurance capital (our opinion): Full position
No pain, no gain. That is one comment regarding this seemingly terminal bottoming process in the precious metals complex. Multiple times as soon as conditions have strengthened enough for us to anticipate a breakout, the miners have put in a bearish reversal. At the same time, the metals and especially Gold have failed to gain any real traction. Throughout the past year we’ve been looking for that final low in Gold but it has eluded us multiple times. The recent reversal in the gold and silver miners coupled with a continued technical downtrend in Gold suggests that more pain is coming before sustained gain.
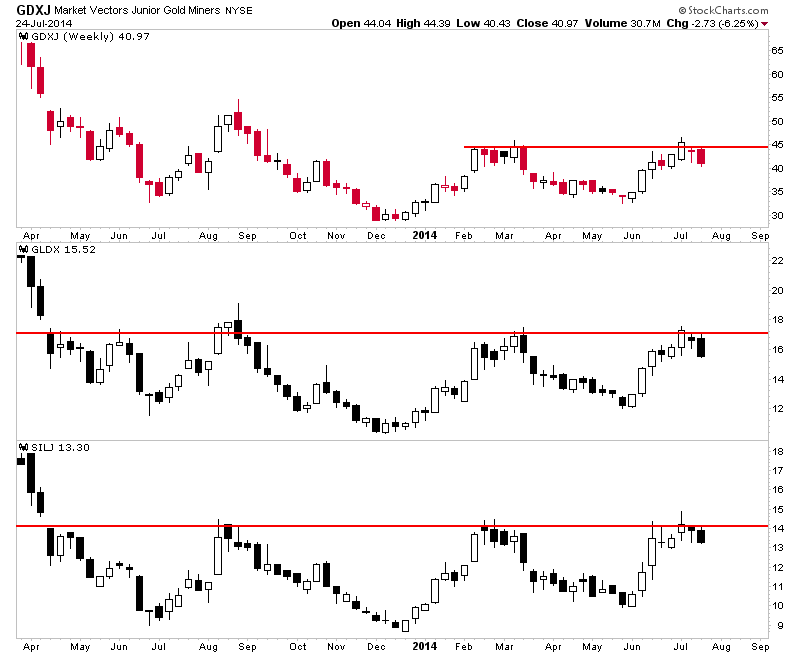
Gold and Silver miners have made some progress over the last year. As evidenced by our top 40 index, the best companies have bottomed with little question. The various indices put in a higher low at the end of May and rebounded with gusto. Daily momentum hit levels not seen since 2012. Meanwhile, the miners have outperformed the metals and closed the recent quarter at the highs. That did not happen in past quarters. However, the miners failed to break resistance and are now reversing their course yet again. We plot GDXJ (large juniors), GLDX (explorers) and SILJ (silver juniors). Note how they’ve reversed a near breakout two weeks ago.
The message of the miners, as we posited last week is that Gold’s final bottom is ahead rather than behind. Had the miners blasted through resistance then it would have indicated a final bottom for Gold was in place. This view is also confirmed by the action in Gold itself. Gold peaked at $1346 and thus failed to come close to its March high at $1392. Last week Gold formed a bearish reversal and engulfed the previous three weeks of trading. A lower high and strong weekly reversal in Gold is a warning that more downside potential lies ahead.
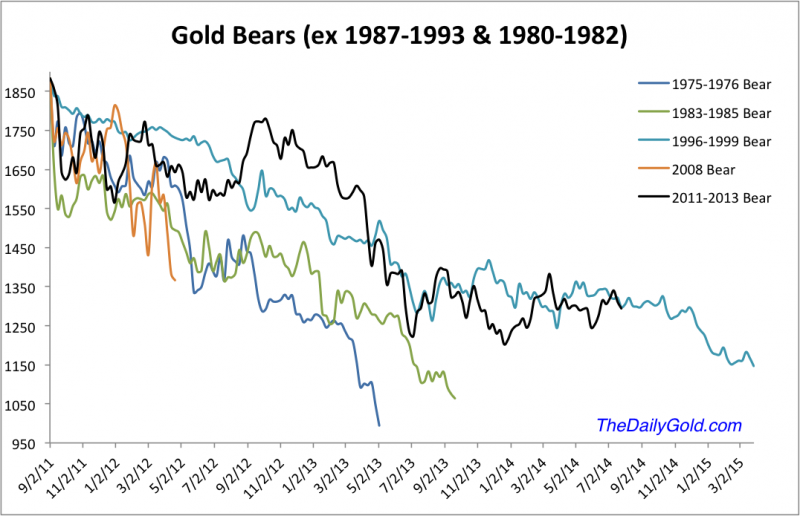
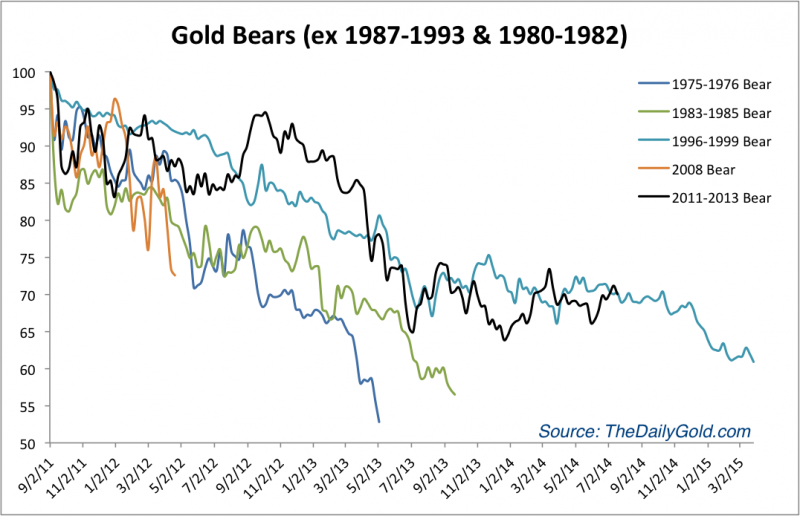
The Gold bears analog chart below (which excludes the most extreme bears in price (1980-1982) and time (1987-1993) shows that the trajectory of the current bear is similar to that of the 1996-1999 bear. In other words, this current bear is in line with history. The most severe bears in price tend to be the shortest while the most severe bears in time tend to be the smallest in price. The current bear is somewhat more severe in time than price.
The key support levels to watch in Gold on a weekly basis are $1250 and $1200. A close below $1250 would bring about a test of $1200 while a break below $1200 could usher in that final capitulation that has eluded us.
With regard to the miners (GDX, GDXJ, etc), keep an eye on the 200-day moving averages as well as the May lows. GDXJ would have to decline 10% to test its 200-day moving average and 20% to fall below its May low. Last week we noted 370 as support for our top 40 index seen below. The weekly chart shows long-term moving averages coalescing near a key pivot point of 353. That is about 11% downside.
This has been a difficult and confusing last year due to the disparity between the leading gold and silver stocks and the metals themselves. More hints of a bottom have come with each successive advance yet Gold in particular has not obliged. Our top 40 index shows that the worst was over for most quality companies a year ago. The index is up roughly 60% from that point and has endured two big corrections while making higher highs and higher lows. Select companies have vastly outperformed the metals.
However, we must give the Gold bears credit. They’ve been on the right track with respect to the metal. The risk has flipped again as Gold has likely started its final decline. This figures to pull the mining stocks down one last time before their fledgling bull market begins in earnest. The stocks that hold up the best during the selloff could be primed for leadership in the fall. We invite you to learn more about our premium service in which we highlight the best junior companies and trade and invest a real portfolio for subscribers benefit.
Since the second half of 2012, I have been bullish on platinum and palladium (PGM). I have focussed on a North American producer Stillwater Mining (SWC) and a junior developer Wellgreen Platinum (WGPLF) in the Yukon. Labor strikes in South Africa combined with economic sanctions on Russia could spark a renewed interest in North American PGM production.
Click here for reference image.
Remember South Africa, Russia and Zimbabwe are the world’s largest supplier of this valuable metal and all these jurisdictions are extremely volatile right now. South Africa is the leading platinum producer and Russia is the world’s leading palladium exporter.
Both these metals are outperforming in 2014 and the rally could just be beginning because demand for these metals are rising annually. PGM’s are both a monetary metal as well as an industrial metal used in catalytic converters to reduce noxious emissions.
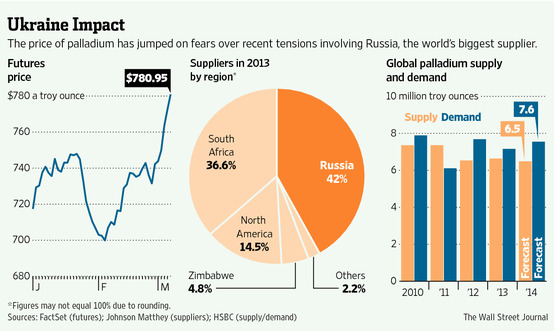
Palladium is outperforming platinum and gold breaking through the $850 mark and platinum is also breaing. Watch nickel which exploded from the $6 area to over $9.50.
The three reasons nickel is soaring in price is because Indonesia the largest nickel producer announced an export ban, Russia a large nickel producer has economic sanctions against it and existing producers such as Vale are announcing production problems. We have already seen nice gains in Royal Nickel (RNX) and Stillwater Mining (SWC) which have already made doubles and triples.
The breakout move in nickel, palladium and platinum is just beginning and incredibly Wellgreen Platinum (WGPLF), which is highly leveraged to all three of these metals is sitting with a market cap below $50 million. Wellgreen has not yet participated with the rally in nickel and palladium, but that could change soon as they just announced a new resource estimate which shows the massive size of this deposit.
Wellgreen released news that they have an updated resource with 5.5 million oz. of Platinum, Palladium and Gold in the Measured and Indicated category and 13.8 million oz in the inferred. The new management and technical team is coming through for shareholders. Despite the low share price Wellgreen is proving to be a massive PGM and Nickel asset with a lot of growth potential as it is open down dip and along trend. Despite being able to purchase Wellgreen near major lows the company has been able to increase the Measured and Indicated Resource to 330 million tonnes from 14 million tonnes. Wellgreen doubled the inferred resource making it one of the largest known PGM projects in the world.
Not only did Wellgreen expand the resources but they improved the grade which could positively impact the upcoming Preliminary Economic Assessment (PEA). I am quite excited for the upcoming PEA which should be published in the next two months. Wellgreen recently raised close to $7 million in June. This demonstrates the institutional interest in PGM and nickel development projects in North America.
See the recent resource update Press Release by clicking here…
This mine has billion dollar potential to be one of the top five mines producing PGM’s and Nickel in North America and could compete with Stillwater one day.
The management team is technically excellent and just announced drill results which showed that some of best mineralization is at the edge of the deposit. The company will be doing step out testing in 2014 as well as advancing metallurgy, engineering and economic modeling for an updated Preliminary Economic Assessment scheduled to be published in the next two months.
Greg Johnson, CEO of Wellgreen Platinum (WG.V or WGPLF) has over 25 years of experience in the development of large scale projects in the mining industry and has been involved in raising over $650 million in financing for 3 different public companies. As co-founder and executive at NovaGold for 12 years, Mr. Johnson was part of the team that grew the market cap from $50-million to more than $2-billion and oversaw the growth of the resource base to over 30 million ounces of gold in 3 world class projects.
Disclosure: Author/Interviewer Owns Wellgreen and the company is a website sponsor.
Be aware of any conflict of interests. Please do your own due diligence. This is not a solicitation to buy or sell stock. For entertainment purposes only.
Briefly: In our opinion (full) speculative short positions in gold, silver and mining stocks are now justified from the risk/reward perspective.
The Euro Index broke decisively below the rising long-term support line (based on the 2012 and mid-2013 bottoms) and this is a major event not only for the currency itself, but also for the precious metals sector. Let’s see why (charts courtesy of http://stockcharts.com.).
Click here for reference chart.
It was only a few months ago that the Euro Index invalidated a breakout above the very long-term resistance line, and at that time it was likely that the next big move would be to the downside. However, as long as the rising support line remained unbroken, there was still a significant possibility that the currency would move higher. This month and – in particular – this week this changed. We saw a key breakdown. Of course, as it is always the case with long-term charts, we would like to see a confirmation in the form of at least a weekly close below the broken line, but it’s already likely that we will see it.
The situation has deteriorated and it will deteriorate further each day the Euro Index remains below the rising support/resistance line.
Why is this breakdown so significant? In short, because previous similar breakdowns led to massive declines in the value of the European currency (and in other currency markets) and they were also followed by huge declines in the precious metals market. These implications are of medium-term nature, so we may not see the reaction on the very next day, but it’s likely to be seen this or next month.
Meanwhile, not much changed from the long-term perspective, so today we’ll focus on the short-term one. On the above chart you can see that we have just seen another sell signal from the Stochastic indicator. These signals were quite useful in the previous months, so it seems to us that paying attention to it is useful also at this time.
We would like to once again emphasize the fact that even though gold rallied last week, it hasn’t moved above the 61.8% Fibonacci retracement level, which suggests that the move was just a counter-trend correction, nothing more. Please note that we can say the same about the June – July rally – it was a correction of the March – June decline.
The situation in silver, mining stocks and the USD index didn’t change yesterday, so our previous comments remain up-to-date.
Summing up, the outlook for the precious metals sector remains bearish.
To summarize:
Trading capital (our opinion):Short (full) position in gold, silver and mining stocks with the following stop-loss levels:
Gold: $1,353
Silver: $21.73
GDX ETF: $28.30
Long-term capital (our opinion):No positions
Insurance capital (our opinion):Full position
1. A number of top bank economists have turned bullish on gold in the past few months. That’s helping to boost confidence amongst thousands of Western gold community investors.
2. Scotiabank and HSBC have lead the way on that front, and now top metals strategist Mike Widmer at Merrill Lynch has thrown his weight behind the bulls as well.
3. Please click here now. Double-click to enlarge. That’s a snapshot of Mike’s analysis, courtesy of MarketWatch.com. Double-click to enlarge.
4. Of particular interest to me, is his view that Western investors can continue to sell gold, but the gold price will rise anyways. That’s a theme I have promoted in my newsletter consistently in 2014.
5. If the “worst is over” for gold now, does that mean the price rises substantially, in a short period of time?
6. Unfortunately, the answer to that question is probably…. No. It’s going to take a number of years for demand from India and China to dramatically overwhelm mine supply, and US inflation won’t become a serious gold price driver until the business cycle peaks out.
7. As the Western business cycle matures, inflationary pressures tend to rise. I’ve predicted that 2014 H2 (2nd half of 2014 calendar year) would see institutional money managers and Fed officials begin to talk about growing inflationary pressures. That’s starting to happen now.
8. Investors should begin to focus more on the CPI (consumer price index) reports, and the next one is scheduled for release today at 8:30am.
9. To view the current CPI chart, please click here now. I’ve highlighted what appears to be an upside breakout on the chart.
10. When the business conditions are improving, as they are now, the Fed is prone to modestly raise interest rates, to cool inflationary pressures. That can impede the upside progress of gold.
11. The eight year business cycle that is used by the Fed means the economy should peak in 2015. As the cycle turns down, if inflation continues to rise, which I am projecting it will, the Fed will have a much harder time raising rates.
12. If they do raise them with the economy in a down cycle, it could create substantial institutional selling of general equities, and substantial buying of gold stocks.
13. Gold is generally well supported here, both by Chindian demand, and by the beginning of an inflationary up cycle in the West. Still, while a geopolitical black swan could easily send gold to new highs above $1923 very quickly, I think most gold investors are perhaps a little overly-enthusiastic about the short term effects of Chindian demand and Western inflation on the gold price.
14. Institutional money managers and large momentum-style hedge funds like to see an asset class in an uptrend, before committing substantial capital to it.
15. On that note, please click here now. I’ve highlighted an important symmetrical triangle on this daily gold chart.
16. Note the highs near $1392 in mid-March and $1410 in the fall of 2013. If gold can trade above $1392 it should draw the attention of large fund managers, and draw their liquidity flows into gold, silver, and precious metal stocks.
17. A further rise to above $1410 could get the attention of powerful bank economists who are still bearish, like Jeff Currie at Goldman Sachs. That could help push gold prices towards the $1500 – $1600 zone.
18. The 14,7,7 Stochastics series lead line is at about 25 now, on that daily chart. Intermediate trend gold rallies ($50 – $150 in size) typically begin when it is near the 20 area. I think a rally to challenge $1392 could begin within just a few days.
19. Are analysts and investors who are trying to identify some kind of “final bottom and then the big one to the upside!” move for gold, making a serious mistake? I think so. It will likely take several years for Chindian demand and Western inflation to rise enough to justify vastly higher gold prices.
20. Investors who end up buying closer to $1500 – $1600, after waiting for more assurance that gold has “truly bottomed” could be very disappointed with how sluggishly gold behaves, for quite some time, after they buy.
21. The time to be heavily invested in the precious metals sector is not later. It’s now. The buying should have been done in 2013, not 2014, and the focus should have been on gold and silver stocks, not bullion.
22. Bullion is the vehicle of choice when the fear trade is front and centre, as it was during the super-crisis that began in 2008. When inflation and gold jewellery are the main themes of price discovery, which they are now, gold stocks are the vehicle of choice.
23. Please click here now. That’s the GDX daily chart. I’ve highlighted a tiny head and shoulders top pattern. It’s only a minor concern, and a rise above the key intermediate trend highs near $28 seems imminent.
24. Please click here now. That’s the daily chart for SIL-NYSE. Silver stocks look set to gain about 3% for every 1% gain shown by gold stocks. Watch the $15.50 area closely. A rally towards that price zone should begin in just a few days. If that rally produces a new high for 2014, I expect substantial institutional capital to flow into silver stocks.
Stewart Thomson of Graceland Updates, Guest Contributor to MiningFeeds.com
After fluctuating around USD 1900 per tonne for the majority of last year, zinc prices started to increase in December 2013 and then continued to follow this upward trend into 2014. Prices are currently around USD 2300 per tonne, up 22% since December.
Zinc prices have been rising as a result of the forthcoming closure of a number of large mines as they reach their end of life, combined with the expectation that global demand will continue to grow. There is an expectation that supply will not be able to satisfy growing demand in coming years, with the supply deficit expected to reach 0.12m tonnes in 2014.
The stock levels held by the London Metal Exchange have also declined, down 46% since January 2013, and by 30% since the beginning of 2014, falling back to the levels last seen in 2011.
About zinc
Zinc is a base metal produced by refining mined ores, which are found across the world, and it is often mined together with other metals like lead, copper or silver. Total world resources are estimated at 1.9bn tonnes, with the largest deposits found in Australia, China and Peru. Zinc’s primary use is in the galvanization industry, which involves applying a protective layer on steel or iron products to reduce corrosion.
Zinc is also used in the manufacturing of alloys like brass, which was the first major application of zinc. Zinc can also be used in a range of compounds, making it very useful in a wide range of different industries.
Around 13.5m tonnes of zinc are produced annually, with about half of this output used for galvanising and about a third in brass, bronze and zinc alloying. The construction and transport industries account for about 70% of zinc consumption.
Supply and Demand
Zinc prices have risen due to both the expected closures of zinc mines reducing global supply growth and also the continual increase in global demand.
One of the largest mines due to be closed as its resources become depleted is in Australia. Century mine is the third biggest open-pit zinc mine in the world and produces nearly 0.5m tonnes of zinc per year (about 4% of world supply). Between now and its scheduled closure in 2016, the mine will be gradually reducing its output. There are plans in place to offset the closure by opening new mines, which should be fully operational next year, but the closure of a site of this importance will inevitably have an impact on the global market.
Growing demand is also influencing prices, driven by the recovering global economy which has led to increased activity in the construction and automobile industries, the major zinc consumers. The continuing economic growth seen in Asian countries, China in particular, is fuelling the expansion of these industries and has led to the rise in demand. For example, automobile sales in China increased by 15% in 2013 y-o-y, and have continued to grow with an 8% y-o-y rise in the first half of 2014. In the construction industry, China, India and Japan are all expected to continue to grow strongly in coming years.
Outlook
Despite the closure of some large mines, the overall supply of zinc is still expected to increase as new plants come online and a number of mothballed plants are due to restart production as the market becomes more profitable. World production of refined zinc is expected to increase by 4.4% to 13.46m tonnes in 2014, with output from China rising by more than 7%. Output will also be higher from the US, where new production units started in May, with the expectation that production will rise by about 10%.
However, demand is expected to outpace supply, and will grow by 4.5% y-o-y to 13.58m tonnes in 2014. China is the largest zinc consumer in the world (accounting for 45% of global annual consumption), and the expansion of demand here has a big impact on the global zinc market. Demand for zinc increased in China, by 8% in 2013 y-o-y, and is expected to be higher by another 6% in 2014. Demand is also expected to see some rises in Europe and the US next year, by 3% and 2% respectively.
With demand expected to exceed supply by 0.12m tonnes in 2014, zinc prices are likely to be shaped by how quickly the new capacity additions come online to replace the lost supply. The market will also continue to be closely tied to the construction and automobile industries, with the continuing growth expected in these sectors likely to support zinc prices in coming months.
We know that the gold and silver stocks lead the metals at key turning points. The stocks started their bear market well ahead of Gold. This year the stocks have exhibited excellent relative strength. Gold and Silver are up less than 10% this year while GDX is up 27% and GDXJ is up 43%. In recent days GDX and GDXJ reached 10-month highs relative to Gold. SIL hit a 10-month high relative to Silver while SILJ, the silver juniors hit an 18-month high against Silver. The outlook for the miners remains positive but the miners are awaiting and need more strength from Gold.
Unlike the gold miners and Silver, Gold never reached a bear market extreme relative to its history. The chart below plots the bear markets in Gold and excludes the most severe bear in terms of price (1980-1982) and time (1987-1993). The bulls can say that Gold has bottomed because the miners did in December 2013. However, the bears can say the current price action is remarkably close to that of the end of the 1996-1999 bear. Until Gold takes out the March highs on a weekly basis then the bears have to be respected.
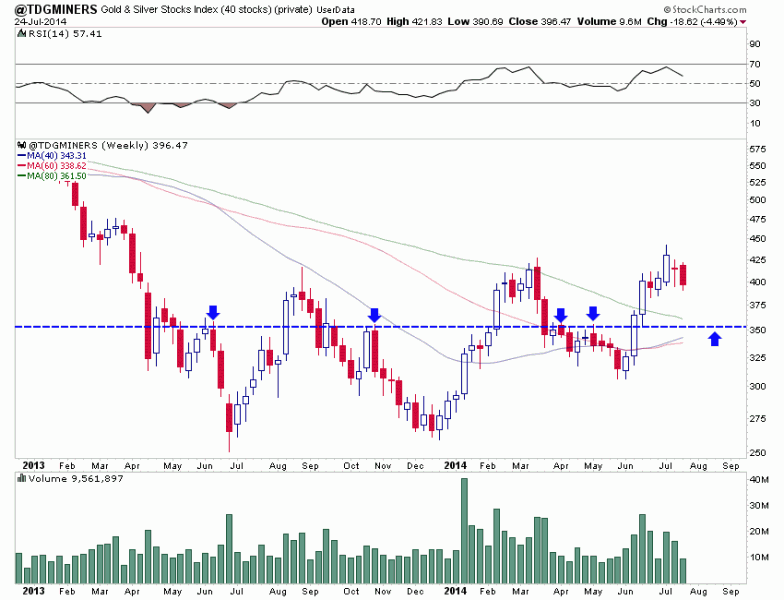
Meanwhile the miners remain in excellent shape beyond a short-term perspective. We’ve already noted their relative strength. The chart below plots several different indices including the HUI Gold Bugs Index. The price action is bullish as the miners bottomed in December, made a higher low at the end of May and rallied back to the March highs. These indices are all very close to a major breakout. They are now in the 15th month of this long bottoming process. The topping process from late 2010 to early 2012 was just as long.
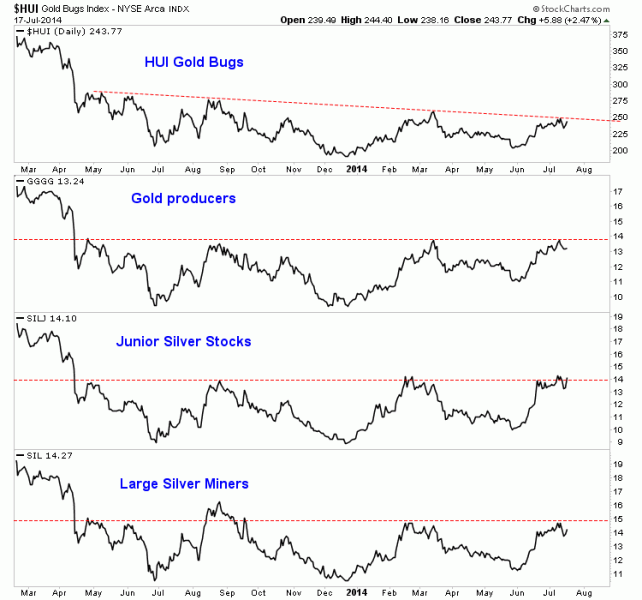
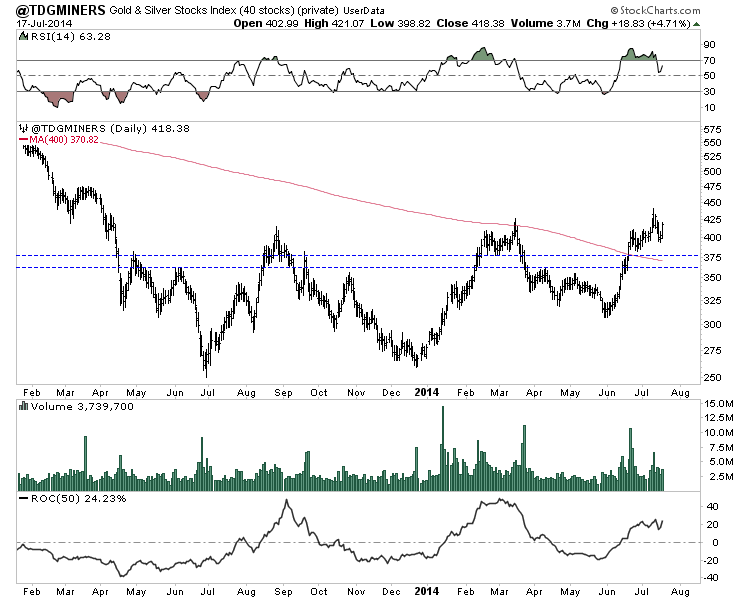
Our top 40 index which has a median capitalization of $750 Million, has already made a higher high and a 15 month high. Though it’s not too overbought it has surged over 30% in about five weeks. The index stopped at the 400-day moving average in March but has advanced above it in recent weeks. On Thursday the index closed at 418. The 400-day moving average is at 371. That is an 11% decline from Thursday’s close. The 50% retracement of the recent advance is at 374.
We know that the miners are very close to a big breakout while Gold could move lower before it moves a lot higher. Back in 2001, the gold stocks bottomed more than four months ahead of Gold. After Gold confirmed its bottom, the miners surged 68% in two months. While the miners are close to a major breakout, perhaps it won’t happen until Gold is ready to rise. The miners could retrace half or even 62% of the recent gains and remain in a strong technical position. That could coincide with weakness in Gold which has formed a bearish reversal on the weekly chart.
Another point is the majority of important breakouts in the miners from 2000 to 2010 occurred in September. Last week we mentioned taking advantage of dips. Now we have one and it could be on the larger side. Taking advantage of upcoming weakness could be critical as it would be in advance of potentially the most important breakout in the miners in many years.
The surreal US stock markets have continued melting up in recent months, spurred ever higher by the Federal Reserve’s money printing and jawboning. The resulting record highs in the headline indexes have been widely trumpeted by Wall Street as evidence of a strong secular bull underway, with years still left to run higher. But these records are misleading, mere illusions conjured by the Fed’s relentless inflation.
The flagship benchmark index for tracking the US stock markets is the mighty S&P 500, often shortened to SPX. The whole financial world literally revolves around this dominant index, with most global equity markets and even some major commodities markets like oil closely mirroring it. American stock traders can directly trade the SPX through a handful of gargantuan ETFs including the leading SPY S&P 500 ETF.
As a broad-based market-capitalization-weighted index comprised of 500 of American’s biggest and best companies, for all intents and purposes the S&P 500 effectively is the US stock markets. So strings of new SPX record highs are widely-celebrated events. This latest stretch started on the last trading day of March 2013, when the SPX broke out above its previous record-high close of 1565 in October 2007.
Since then there have been no fewer than 70 new record closes, out of just 328 trading days. Over a fifth of these have happened since late May 2014, helping to breed the extreme euphoria and complacency rampant today. Wall Street zealously believes these records are a powerful testament to the underlying health and staying power of this bull market. So each new record feeds into the overwhelming optimism.
Record highs necessarily rely on long-term price comparisons. But thanks to the Federal Reserve’s printing presses endlessly spewing out vast torrents of new US dollars, the ultimate measuring rod of the dollar is far from constant. We all instinctively know the value of the dollar is perpetually eroding, but this insidious inflationary process is so slow that it lurks below the perception threshold most of the time.
The longer the timeframe considered, the greater the impact of monetary inflation. Back in January 1980 for example, the US median household income was under $18k. New houses across this nation averaged just $76k, while new cars generally cost less than $6k. With far fewer dollars in circulation then, each one had relatively more purchasing power. But the relevant SPX record-high span is much shorter.
The last secular stock bull crested in March 2000, when the SPX hit the then-staggering level of 1527. But a dollar back then went a heck of a lot farther than one does today, so considering 1527 in today’s dollars is an inherently-flawed and misleading apples-to-oranges comparison. Back at those dazzling SPX record highs, the Fed’s narrow and broad M1 and MZM money supplies were running $1109b and $4463b.
Today, after the epic money printing by uber-inflationists Alan Greenspan, Ben Bernanke, and Janet Yellen, these money supplies have ballooned to $2823b and $12484b! This is staggering growth of 2.5x and 2.8x respectively, vastly outpacing underlying US economic growth. With dollars worth much more back then, any given SPX level was much higher in real inflation-adjusted terms than the same one today.
While the Fed’s money printing is pure inflation, Wall Street has always preferred to focus on the effect rather than the cause. And that’s rising prices. The dominant measure of general price levels remains the US Consumer Price Index, which is published monthly by the Department of Labor’s Bureau of Labor Statistics. Between March 2000 and today, this popular price index merely climbed from 171.2 to 237.9.
This 1.4x growth greatly lagged the source of inflation, underlying money-supply growth. Unfortunately the CPI is intentionally lowballed for political reasons. The BLS systematically employs all kinds of statistical trickery to keep the CPI from revealing the true price picture in America. Have your family’s living expenses merely risen by an average of 2.4% annually since March 2000? The reality is likely double or triple that.
The government actively manipulates the CPI because monetary inflation has such a broad and detrimental impact. If true inflation was reported, stock markets would be radically lower. Americans would believe our economy was far worse, and would kick politicians out of office. The huge welfare payments indexed to inflation, along with interest on Treasuries, would soar. This would threaten to bankrupt the whole government!
Nevertheless, since the myth of low inflation helps boost stock prices Wall Street happily plays along with this political charade. Since it dramatically understates real-world inflation, the CPI is probably the most conservative way possible to view the SPX in constant-dollar terms. So this first chart uses the CPI to show the real inflation-adjusted SPX since 2000 in blue, overlaid on the usual nominal unadjusted SPX in red.

The only honest way to do long-term market comparisons is to use constant dollars. And in real terms, the SPX has not seen a single new record high since March 2000! All 70 of the nominal record closes over the past 16 months are mere illusions driven by the eroding value of the Fed’s inflated dollar. The SPX peaked at 2123 in today’s dollars back in March 2000, and hasn’t returned anywhere near there ever since!
In fact, as of its latest nominal record close of 1985 just a couple weeks ago, the SPX was still 6.9% below that March 2000 record high. The implications of that fact are incredible. In the 14.3 years since the peak of the last secular stock bull, US stock prices have still not recovered! As this chart reveals in stark terms, all the US stock markets have done since early 2000 is grind sideways at best. This is ominous.
The only market environment where stock prices can consolidate and make no progress for over a decade is a secular bear. The stock markets gradually meander in great third-of-a-century cycles that I call Long Valuation Waves. 17-year secular bulls, like the monster ending in March 2000, are followed by 17-year secular bears. Stocks blast higher in secular bulls, and then drift sideways in the subsequent secular bears.
The reason is quite simple. Towards the ends of secular bulls, widespread euphoria catapults stock prices to levels far beyond where underlying corporate earnings can fundamentally justify. Stock prices are driven to such expensive levels that they then need to consolidate sideways for the better part of the next couple decades to give earnings time to grow into those lofty stock prices. Secular bears bleed off overvaluations.
The single-most-important question in all the stock markets today is whether we are still in the 17-year secular bear that started in March 2000 or a new secular bull that was allegedly born in March 2009. The latter is fervently believed by the legions of stock bulls cheering this past year’s long string of new nominal record highs in the SPX. And these very records are trumpeted as some of the best new-secular-bull evidence.
As a professional student of the markets and speculator, I have CNBC turned on all day every day. As usual it has done an outstanding job of chronicling prevailing stock-trader sentiment during this past year’s big streak of new nominal records. And the times I’ve heard analysts and money managers claim these new records confirm a new secular bull is underway are countless. These records greatly fed the bullish sentiment.
But by merely recasting the SPX in constant-2014-dollar terms using the lowballed CPI, this thesis is irrefutably shattered. The SPX’s 70 new nominal record closes since last April are not the product of an exceptionally-strong stock market, but the result of the value of the dollar measuring stick falling thanks to the Fed’s relentless inflation. In real purchasing-power terms, stocks are still lower after 14.3 years!
There have been no real new SPX record highs yet, not a single one, since March 2000. And none are coming before SPX 2123 at best. I say at best because with each passing month’s money printing by the Fed, each dollar’s value keeps falling and continues to push up that March 2000 real high in today’s dollar terms. The bulls’ belief that record highs show how special these stock markets are is total garbage.
These stock markets are indeed special, but only because the Federal Reserve has recklessly and foolishly incited a stock-market levitation. Secular bears, those great sideways drifts, are comprised of an alternating series of smaller cyclical bears and cyclical bulls. The cyclical bears generally cut stock prices in half, and then the cyclical bulls double them again. This continues over the secular bear’s 17-year lifespan.
The stock markets functioned normally between most of 2000 to 2012, consolidating sideways on balance to give corporate earnings time to grow into the lofty stock prices of the last secular bull. Note in particular the normal cyclical-bull advance after the last cyclical bear bottomed in March 2009. It enjoyed a normal healthy ascent in its first four years, strong uplegs punctuated by occasional corrections to rebalance sentiment.
But in early 2013, Ben Bernanke inexplicably took it on himself to convince stock traders the Federal Reserve was effectively backstopping the stock markets. It had to be one of the dumbest things an elite central banker has ever done, crazy-dangerous. The Bernanke Fed fell all over itself communicating that if a significant stock-market selloff arrived, it would be quick to spin up its printing presses and spew money.
So selloffs vanished, with traders quick to buy every slight dip on the belief the Fed wouldn’t let the stock markets fall. Without necessary and healthy selloffs to rebalance sentiment, it soon became wildly euphoric. This led to stock prices being bid up far faster than underlying earnings, pushing stocks back near bubble valuation territory! Stocks just rose and rose, without meaningful selloffs, in a bull-killing trajectory.
And the stock bulls rejoiced! Rather than scold the Fed for single-handedly spawning a dangerous stock-market levitation, they claimed stocks were rallying because the US economy is recovering strongly and corporate earnings are surging. And they claimed the many nominal record highs were evidence of these blatant rationalizations. But the records themselves never really existed, they too were Fed-driven illusions.
This next chart zooms out to a really-long-term view of the real SPX, since the start of the last secular bear before today’s in early 1966. It reinforces the damning perspective that today’s US stock markets remain trapped in a 14-year-old secular bear. And if that is indeed true, then today’s lofty stock markets have a long, long ways to fall once today’s overextended cyclical bull rolls over into the next cyclical bear.

This long-term chart highlights the critical truth that today’s euphoric bulls have totally forgotten, that stock markets are forever cyclical. 17-year secular bulls are followed by 17-year secular bears, and these sideways grinds are made up of smaller cyclical bears and bulls. The last secular bear ran from 1966 to 1982, a period of time where the SPX actually gained 8.9% nominally but lost a staggering 64.3% in real terms!
As the Fed ramped up its printing presses in the late 1970s to try and stimulate a stagnant economy, the value of the dollar kept eroding. So though stocks were flat on balance over that last secular-bear span, the purchasing-power losses investors absorbed were massive. That last secular bear didn’t end until the S&P 500’s trailing price-to-earnings ratio fell below 7x earnings, which signals secular bears have run their course.
The subsequent secular bull was mind-blowingly awesome, catapulting the SPX 1391% higher in nominal terms and 751% in real terms over the next 17 years or so. The final couple years of that secular bull marked its terminal bubble phase, when stocks rocketed straight up on unbridled euphoria to hit an astounding 43.8x earnings in SPX terms. But with valuations so extreme, that secular bull gave up its ghost.
And that ushered in today’s secular bear, which is only 14.3 years old so far. That is well under the 17-year average. And if today’s wildly-optimistic stock bulls are right, then the secular bear actually ended in March 2009 which would have made it last only 9 years. It is hard to imagine a secular bear surrendering after just 9 years, just over halfway into its normal duration. And valuations were far too high to kill it then.
Remember secular bears are valuation phenomena. And near the March 2009 lows the elite 500 component companies of the SPX had only retreated to a trailing P/E ratio of 11.6x. This was still a whopping 2/3rds higher than the 7x levels seen at the ends of secular bears! So the idea that the secular bear magically ended back then makes absolutely zero sense. It is a typical bull fantasy, a rationalization ignoring hard facts.
That leaves us 14.3 years into a not-yet-mature secular bear today, still trading at real levels below those seen at the last secular bull’s peak in March 2000. Even with today’s lofty stock prices, the SPX is only up 30.0% in nominal terms over that entire span. That means the US stock markets have returned a piddling 1.9% annually at best over the decade-plus since the last episode of extreme euphoria, utterly terrible.
How on earth can that excite anyone? Since secular bears are sideways grinds in nominal SPX terms, in real terms they tend to be downtrends. This was readily apparent during the last secular bear that straddled the 1970s. And the same thing happened in today’s secular bear before the Bernanke Fed unleashed its crazy SPX levitation in early 2013. The entire stock rally since then is Fed-manufactured.
While the lack of new real records is damning, that is trivial compared to the extreme overvaluations in the stock markets today. As of late June, the S&P 500 component stocks were trading at a trailing price-to-earnings ratio of 23.5x! That is dangerously high, way above 14x historical fair value. And that is if these components’ individual P/Es are weighted by their market caps, which makes it more conservative.
In simple-average terms, the SPX’s trailing P/E ratio in late June was a jaw-dropping 26.4x earnings. This isn’t far from the 28x historical threshold for bubble conditions! The last cyclical bull topped back in October 2007 at much lower valuations, and the fact that valuations are so extreme today virtually guarantees that we are not midway through a new secular bull as the bulls so desperately try to convince themselves.
Again secular bears don’t end until the general-stock-market valuation falls down near 7x earnings. So if a secular bear remains in force as all the evidence strongly suggests, US stock prices would have to be slashed by a catastrophic 70% to hit those bear-slaying valuations! I really doubt they will plunge that far, as earnings will gradually grow over the next couple years while stock prices slide. But they will get cut in half!
Making long-term stock-market comparisons in nominal terms, which is necessary to declare records, is inherently misleading. With the Fed continuing to aggressively print money like there is no tomorrow, the value of the dollar is not a constant long-term measuring stick. It has to be adjusted for inflation, even if it is lowballed CPI inflation, to get a more realistic perspective on what is really going on out there.
And when you consider the SPX in today’s dollars, the past year’s long string of nominal record-high SPX closes is merely another Fed-conjured illusion. The S&P 500 has not made a single new record close yet in real terms, and remains far from its last secular-bull peak in March 2000. But even more damning than that is the extreme overvaluations, which all but prove we aren’t midway through a new secular bull.
All the stock-market upside of the past 18 months or so, and all the resulting euphoric sentiment, was simply manufactured by a reckless Fed. All investors and speculators have to ask themselves what is going to happen as the Fed’s implied backstopping is soon removed when the QE3 bond monetizing ends later this year. Odds are the levitated stock markets are going to come crashing back down to reality.
The bottom line is this past year’s long string of new record highs in the flagship S&P 500 is merely a Fed-driven illusion. Once this flagship stock index is adjusted for inflation, it reveals that these stock markets haven’t achieved a single real record yet. Even today, stock prices remain way below those seen at the end of the last secular bull in early 2000. All the past year’s euphoria based on record highs was misplaced.
And without any new highs, the case that we remain mired deep in a not-yet-mature secular bear is even stronger. Couple that with the extreme overvaluations rampant in stocks today thanks to the Fed’s crazy levitation, and the markets are perfectly set up for a new cyclical bear. This is going to eviscerate the deluded bulls trapped in their own euphoria, but will offer vast opportunities for prudent contrarians.
Summary
• Contrarian investors buy uranium stocks when the banks and large miners cut their price targets.
• Japan announced that two nuclear reactors were approved for restart.
• The Japanese Nuclear Restart could change the negative and bearish sentiment on the uranium mining sector.
• Uranium decline has been due to Japan shutting down reactors. The price may begin rising as nuclear reactors are turned back on.
• Be prepared for a rally in the uranium mining sector as end user look to once again begin securing long term uranium supply.
Last week I was interviewed about uranium (OTCPK:URPTF) byJapan announces that two reactors are approved to be safe and are able to be turned back on. This is a psychological game changer as the uranium priced has slid for more than three years over 60% as Japan idled their reactors after the 2011 Fukushima Disaster.
Uranium has hit decade lows due to the closures in Japan. Many believed Japan would never return to nuclear. They were wrong.
This approval by the Japanese Nuclear Regulatory Authority signals the fact that major industrial nations require nuclear for cheap and clean energy. This decision by the Japanese NRA tell us the Japanese economy can no longer rely on expensive liquefied natural gas and renewable sources. They must turn to the safer next generation nuclear reactors.
Look for the spot price and the uranium miners (NYSEARCA:URA) to reverse on this fundamental catalyst and the negative sentiment to turn much more positive. The actions of the major producers and banks led me as a contrarian to become more bullish and forecast a bounce off the bottom.
Many of the current producers have had to cancel or mothball higher cost projects due to the low spot price. Before the news today many of the banks have reduced long term price outlooks and were bearish on the sector. The banks and large miners may be wrong about uranium. The current surplus may turn to a deficit very quickly as Japan turns back on the nuclear reactors.
There may be a rally coming up in the junior uranium stocks. The majors such as Cameco and Rio (NYSE:RIO) may underperform as they deal with the many challenges of high cost mines and delays. Cigar Lake has once again been pushed back by Cameco (NYSE:CCJ). The timeline has once again been delayed. For years, Cigar Lake was dealing with flooding problems.

The uranium mining ETF is beginning to breakout from a 10 week base and moving above the 50 day moving average. Look for a new three month high at $15.40 to confirm that the recent approval in Japan is in fact sparking a technical reversal.

1. There’s a widespread belief that Western investors only buy strength, while Eastern investors only buy weakness. That’s not completely accurate.
2. Please click here now. As gold declined towards the $700 area in the fall of 2008, holdings in the SPDR ETF actually began to increase. To view the daily gold chart during that event, please click here now.
3. The decline into the October 2008 lows was accompanied by tremendous fear and liquidation in general equity markets, yet the tonnage in the SPDR fund rose by about 100 tons during the final month of the decline.
4. Please click here now. That’s a snapshot of the current liquidity flows into and out of the SPDR fund.
5. While gold suffered a sharp sell-off on Sunday night and Monday, the price weakness was accompanied by a solid increase in SPDR holdings!
6. Many investors in the Western gold community appear to be looking for something to replace the gold price parabola that the Western super-crisis almost created.
7. That’s probably a mistake. American QE is being tapered to zero, and the Chindian gold jewellery era is now the prime driver of the gold price. As with any era, there will be periods of ecstasy, and periods of bitter disappointment.
8. On that note, while the recent Indian government’s decision to leave gold import restrictions intact may feel disappointing, onshore India’s loss is offshore India’s gain. I’m talking about… Dubai.
9. Dubai is known as “offshore India”. The city’s gold business is run mainly by Indian precious metal industry experts, and Indians dominate the buy-side of the trade. As the gold jewellery era unfolds, Dubai should completely dominate all gold markets. It will be the undisputed king of global gold price discovery very soon.
10. “As much as 40 per cent of all gold flows in the world happen through Dubai and the city is easily the most important hub for the trade. Dubai has the infrastructure and the systems to set benchmarks, and even its own good delivery standards. It is now time for it to start asserting its role and demand recognition for its contributions to the trade. With such major changes happening in every sphere of business, the current age belongs to performers and not consultants, who have had their share of fame but are now ready to be consigned to the dustbins of history. If managing global gold trade is anybody’s business, it is most obviously that of the producers, consumers or those who make trade happen. Any other role is secondary.” – GulfNews.Com, July 15, 2014.
11. The battle for control of gold price discovery is probably best summed up like this: Singapore and Shanghai may talk a good talk, but only Dubai walks the talk. In the supposed battle to overtake London and New York as the prime market of gold price discovery, there is everyone else, and then there is Dubai.
12. Please click here now. I’ve highlighted what is really a majestic symmetrical triangle pattern, on this daily gold chart.
13. Within the pattern is an inverse head and shoulders bottom pattern. It could also be labelled an inverse head and shoulders bull continuation pattern.
14. Fundamentally, yesterday’s price decline was probably caused by the Indian government decision to clamp down on gold installment plans. Many large jewellers get 20% of their revenues from these plans that allow consumers to buy small amounts of gold each month. They get gold grams of “interest” paid to them. The jewellers may have had to sell some gold in a hurry, and that probably caused the decisive sell-off on the COMEX.
15. While it initially looked like the government may be trying to put the installment plans in the hands of the banks, it now appears that the plans are being strengthened, which is good news.
16. “Under the new rules, the effective return on the deposits cannot be more than 12% and the total amount of deposits has to be within 25% of the company’s net worth. In the case of many jewellers, the effective return has been as high as 17% or more.” –Times of India, July 13, 2014.
17. One of the nice features of the gold jewellery bull era that I think Western mining stock investors will come to appreciate, is that bad news doesn’t last long, it isn’t usually as bad as it initially appears to be, and there are always plenty of opportunities to buy modest price weakness with confidence.
18. From a technical standpoint, the current Indian “installment plan reset” is helping building right shoulder symmetry with the left shoulder. Also, during the recent rally I sensed that investors were starting to think they had to “chase price, before it gets away”. A lot of excess greed was cleansed from the market yesterday, and that’s bullish.
19. Please click here now. That’s the GDX daily chart, and it looks superb.
20. In late May, GDX began to rally from the $22 area, and rose to about $27.50 as of last week. That’s a superb performance, but there’s nothing happening fundamentally in the gold jewellery bull era that requires investors to “buy, before it gets away”.
21. That mindset might have had some practical application in the super-crisis, but it’s essentially useless in the gold jewellery era. It will take some time for Western mining stock investors to understand the nuances of the new era, much like it takes time for a soldier of war to adjust to life after combat.
22. Technically, a 50% correction of the recent rally in GDX would put the price at about $25. The chart is “textbook bullish”. GDX has staged a clear breakout from a beautiful symmetrical triangle pattern. The key 14,7,7 Stochastics oscillator that I refer to as the “stokeillator” (or abbreviated as “stoker”) is very overbought. It has been flashing a sell signal for about a week.
23. A pullback to either the green boundary line of the large triangle pattern or to the $25 area would likely put the oscillator in an area where a buy signal would be likely. Overall, gold stocks look set to benefit immensely, as the city of Dubai leads all love trade stakeholders, into a remarkable world of higher gold prices.
24. As good as senior and intermediate stocks look, junior gold stocks look even better. Please click here now. This daily GDXJ chart shows that many junior stocks exceeded their March highs, while GDX and gold bullion did not. That’s bullish for the entire precious metals sector. GDXJ exceeded the $46 area highs, after rallying about 40% in just six weeks. There is enormous support in the $39 – $40 area. That support is defined by the Fibonacci 50% retracement line, the blue triangle boundary line, and the top of the flag pattern, and eager junior gold stock traders should be ready to add to positions there!
Stewart Thomson of Graceland Updates, Guest Contributor to MiningFeeds.com

Both gold and silver have enjoyed massive buying by American futures speculators in recent weeks. It all started with Fed chair Janet Yellen’s cavalier dismissal of inflation, but the buying momentum persisted well after that. Happening in the midst of the summer doldrums when global precious-metals investment demand is weak, this is an exceptionally-bullish portent. It is setting up the PMs for a major autumn upleg.
A little over a month ago, I wrote an essay on the record shorting of gold and silver futures by American speculators. This one group of traders utterly dominates gold and silver price action, and therefore the fortunes of stock traders’ flagship GLD gold ETF and SLV silver ETF. Gold futures had just seen their biggest jump in spec shorts, and silver futures their highest levels of spec shorts, in at least 15.4 years!
As I said then with gold and silver loathed and languishing near ugly multi-month lows, extreme shorting is very bullish. Futures shorts contractually have to be covered before expiration, and this is done by buying offsetting longs. The higher speculators’ futures shorts get, the more near-future buying they guarantee. And since futures are so hyper-leveraged, this buying to cover often happens quite rapidly.
In early June near the gold and silver lows, speculators merely needed to keep $6000 in their account to control a single 100-ounce gold contract, and $8250 for a single 5000-ounce silver contract. But these contracts were worth a whopping $125,000 and $95,000 respectively at $1250 gold and $19 silver. So that represented maximum leverage of an insane 20.8x in gold futures and 11.5x in silver futures!
In the stock markets, leverage has been legally limited to 2.0x ever since the Federal Reserve implemented its Regulation T in 1974. At 20.8x leverage, a mere 4.8% gold-futures move in the opposite direction that speculators are betting will wipe out 100% of the capital they risked. It was only a matter of time until some buying catalyst arrived that would unleash furious short covering, and it happened to be Janet Yellen.
On June 18th after the latest meeting of the Fed’s Federal Open Market Committee, the chair held one of her quarterly post-FOMC-meeting press conferences. CNBC’s economics reporter Steve Liesman asked the first question, wondering if the Fed was “behind the curve on inflation” since its 2% target has already been exceeded recently. Yellen’s response would prove the catalyst to ignite massive PM futures buying.
She replied, “So I think recent readings on, for example, the CPI index have been a bit on the high side, but I think it’s – the data that we’re seeing is noisy.” This “noisy” word would get much play after, as the CPI had just seen its first back-to-back months of 2.0%+ year-over-year growth since early 2012 the morning before. She seemed very out of touch with economic reality and super-tolerant of higher inflation.
She finished by saying the Fed expects to “continue to see a gradual pickup over the next several years toward our 2% objective.” Inflation was already at 2%+ annually on multiple major indicators and the Fed thinks it is going to take “several years” to get there? This shocking revelation to traders indicated the Yellen Fed will tolerate higher inflation far longer than previously thought. Inflation is bullish for PMs.
The reaction that afternoon was rather muted, with gold and silver only up 0.3% and 0.6% on June 18th. But it’s important to remember Yellen’s quarterly post-FOMC-meeting press conferences don’t start until 2:30pm, an hour after the closes of the main US gold and silver open-outcry futures trading days at 1:30pm and 1:25pm. So reactions to FOMC decisions often arrive the next day when full trading resumes.
And futures speculators indeed came out in force early on June 19th. They bought aggressively, catapulting gold and silver 3.4% and 4.8% higher! These were the biggest up days in both gold and silver since the mid-September FOMC meeting where the Fed defied expectations to not start tapering its QE3 debt-monetization campaign. Janet Yellen had managed to trigger the gold and silver short squeeze!
Though such big surges emerging out of record speculator shorting had to be short squeezes, we couldn’t be sure for over a week. Speculators’ futures positions are only reported once a week by the Commodity Futures Trading Commission in its famous Commitments of Traders reports. These are published Friday afternoons, current to the past Tuesday. So we had to wait until June 27th to see what really happened.
And it was far more awesome than I imagined, not only massive short covering but massive new long-side buying! This first chart looks at the GLD gold ETF superimposed over speculators’ total long and short positions in gold futures. The heavy buying unleashed by Janet Yellen’s cavalier dismissal of inflation was incredible, and served to confirm the bullish outlook for gold and silver on multiple fronts.

You can clearly see Yellen’s June 19th gold surge above, though it is certainly overshadowed by gold’s wildly anomalous plunge in the second quarter of 2013. But the futures buying behind that Yellen gold surge was truly remarkable. As expected, there was enormous short covering. American speculators bought to cover 25.4k contracts in the CoT week straddling that surge, the equivalent of 79.0 metric tons of gold!
This represented specs covering over 1/5th of their total short positions in that week alone! Our CoT data goes back to early 1999, an 809-week span. And only 6 of those weeks had seen short covering over 25k contracts, it is exceedingly rare. Since today’s secular gold bull was born in April 2001, there have been only 2 other CoT weeks with such massive short covering. Yellen’s epic dovishness terrified the speculators.
This decisive plunge in their total shorts cemented a critical downtrend in place for an entire year. At each subsequent major gold low, speculators have been less and less willing to take on excessive shorts. They peaked at an at-least 14.5-year-record 178.9k early last July near gold’s initial low, but only hit a substantially-less-extreme 150.0k in early December at gold’s next major low. The zeal for shorting was waning.
And just over a week before Yellen’s short squeeze erupted, the latest peak near the latest major gold low was just 132.8k contracts. This downtrend in peak shorting is very bullish, since major new gold lows are unlikely to be seen without excessive selling by futures speculators. As gold has consolidated over this past year, they are slowly starting to realize the extreme bearish consensus outlook on gold is dead wrong.
That CoT week’s massive short covering straddling Yellen’s press conference was expected. But the big surprise was massive long-side buying as well! Speculator long buying is more important than short covering. Traders contractually have to cover shorts, so that buying is purely mechanical often with no conviction about where gold is heading. But buying new longs is voluntary and requires high conviction.
This is especially true in the hyper-leveraged world of futures trading where being wrong can wipe out traders in a matter of days. During that same Yellen CoT week, American futures speculators added an astounding 27.9k long contracts. This exceeded their short covering, and was the equivalent of 86.7 tonnes of gold buying in a single week! They catapulted their long exposure fully 1/7th higher on Yellen.
Unlike the traders buying to offset and close shorts, the guys buying new longs were not obligated to buy gold futures. They voluntarily chose to risk their scarce capital in a super-leveraged realm on a high-conviction belief gold was heading higher still. While specs’ total longs have been gradually climbing since they bottomed at 170.2k contracts in mid-December, the Yellen buying was still very unexpected.
In the 809 weeks of CoT history since early 1999, only 36 have seen spec longs grow by over 25k contracts. The last one happened back in August 2012, well before last year’s extreme gold selling anomaly. So speculator gold-futures buying of that magnitude is pretty rare and special, something not witnessed very often. Together that week’s long and short buying was the equivalent of a staggering 165.7 tonnes of gold!
Such buying is massive beyond belief. According to the World Gold Council, global investment demand averaged 30.2t per week in 2012 and 14.9t in 2013. The American speculators’ futures buying alone that was unleashed by Janet Yellen’s dismissal of inflation dwarfed that. If it didn’t happen in the summer doldrums when precious-metals investment demand is so weak, gold would have surged far higher on it.
Now with the US stock markets still levitating on the Fed’s epic dovishness, and gold still being totally shunned as an investment class, I figured that Yellen CoT-week spike would be the end of the heavy futures buying for now. So I was very surprised again when the following week’s CoT report was released last Friday. It showed continuing heavy speculator buying momentum in gold and silver futures.
Speculators covered another 9.0k short contracts in this latest CoT week, but also added an incredibly strong 19.8k on the long side! At just 83.9k total shorts in this latest read, these positions are back down to their support over the past year or so. But they still remain well above their average level in the normal years of 2009 to 2012 before 2013’s extreme selling anomaly, which weighed in at 65.4k contracts.
The jump in total spec longs to 244.4k contracts was even more impressive. This was the highest level by far seen since mid-April 2013, in the CoT week spanning gold’s panic-like plunge. That extremely anomalous outlying event destroyed gold sentiment, but futures speculators are as bullish now as they’ve been ever since then. This means they will likely continue buying new longs as gold marches higher.
And there’s a lot of buying left to do. Between 2009 and 2012, average spec longs in gold futures were 288.5k contracts. But after extreme anomalies, mean reversions almost always overshoot dramatically in the opposite direction. So we’re probably going to see spec longs at least return to late 2009’s 376k level over the coming years. All that speculator buying will accelerate gold’s upleg, enticing investors to return.
The yellow line above shows the total deviation of both spec longs and shorts from their 2009-to-2012 normal-year averages. It has been the dominant driver of gold and therefore GLD shares over the past year and a half, with a very strong inverse correlation. So as futures traders continue covering shorts and adding new longs heading into gold’s autumn strong season, gold and GLD will power higher.
The total futures buying in the 2 CoT weeks since Yellen’s inflation dismissal saw new spec long-side buying of 47.7k contracts, and spec short covering of 34.4k contracts. So speculators grew their total gold-futures longs by 24% over that little span while slashing their shorts by 29%! Obviously the idea that the uber-dovish Yellen Fed will tolerate high inflation for a long time really resonated with futures traders.
And Yellen’s attitude on inflation isn’t going to change anytime soon, which is very bullish for the precious metals going forward. Not surprisingly since gold drives silver, silver-futures speculators mirrored gold-futures ones with dramatic surges in short covering and new long buying following Yellen. This last chart looks at the same CoT data for silver futures, with the SLV silver ETF superimposed on top.

The impact of Yellen’s comments and resulting gold surge spread into silver-futures trading as well. Speculators bought to cover massive amounts of silver shorts, and added big new longs, over both of the two CoT weeks following Yellen’s press conference. Together this buying added up to 17.1k contracts of short covering, and 12.0k of new long buying, for total silver-equivalent buying of a whopping 145.6m ounces!
This was over the latest two CoT weeks, so cut it in half to an average of 72.8m ounces per week. The Silver Institute recently reported that global silver demand hit an all-time record of 1081m ounces last year despite the extreme selling. That equates to just 20.8m ounces per week, showing how massive the buying by American futures speculators was after Yellen’s press conference. It was truly enormous.
This buying worked wonders for silver and SLV too. In just 4 CoT weeks, the greater-than-15.4-year-record spec silver shorts were cut in half! And provocatively nearly half of that short covering happened in the 2 CoT weeks before Yellen, so it was already well underway before she goosed gold. As I wrote a month ago, extreme spec shorts have to soon be covered. They are guaranteed near-future buying.
But the new long buying didn’t start until Yellen, and it was massive too with speculators growing their long-side bets on silver by 1/6th in just two weeks. This continued the strong uptrend in silver-futures spec long buying we’ve seen since last September. Speculators haven’t been this bullish, had higher total longs, since back in February 2011 way before last year’s anomaly. And that proved a wise bet.
Over the next couple months, silver would rocket 46% higher to $48 per ounce! When futures traders start piling on to a long-side trade, prices rise which start enticing in the vastly-larger pools of investment capital. And once investors follow futures speculators’ lead and start redeploying, the uplegs take on a life of their own and grow very large before failing. This mid-summer spec silver-futures buying is very bullish too.
The past couple weeks look like a sea-change shift in sentiment among futures speculators! For much of the past year, they remained very bearish on and wary of gold and silver after the extreme selling anomaly in the second quarter of 2013. But Janet Yellen signaling inflation isn’t a concern even as it crosses the Fed’s longstanding 2% target changes everything. Gold and silver are go-to assets in inflationary times.
As everyone who runs a household knows, prices are rising like crazy. Our food, shelter, energy, and necessities for living are getting more expensive. Our health-care, education, and tax costs are getting more expensive. Eventually these relentlessly-rising prices will coalesce into high inflation expectations, which will lead investment capital to pour back into gold and silver to ride the Fed’s money-printing boom.
The massive gold-and-silver futures buying in recent weeks is only the earliest vanguard of the capital flows coming to the precious metals as inflation continues to mount. These capital inflows should really accelerate during the autumn rallying season once we get beyond the usual summer doldrums. Gold and silver, and therefore GLD and SLV, are likely to be among the best performers in the second half of 2014.
But as always, the gold and silver stocks will dwarf the gains in their underlying metals. The profits for mining leverage the precious metals’ prices, rising much faster than the underlying gains in gold and silver. The larger gold and silver miners should at least double the metals’ gains, the mid-tier ones quadruple them, while the smaller miners have the potential to see upside leverage even greater than that.
The bottom line is the gold-futures and silver-futures speculator buying following Janet Yellen’s brazen dismissal of inflation was utterly massive. American traders flocked back to gold and silver at incredible rates, not just covering shorts as expected but adding enormous new long positions. And this all happened in the dark precious-metals sentiment wasteland of the summer doldrums no less, a very bullish omen.
This represents a sea-change shift in sentiment among the futures speculators who have so dominated the gold and silver prices over the past year and a half. Gold and silver are vastly more attractive for broad investment when central banks are willing to let inflation run high for a long time. And the Yellen Fed has fallen all over itself to telegraph just that, heralding a new era of rising gold and silver investment demand.

Those familiar with Jesse Livermore and the book Reminiscences of a Stock Operator know who Old Turkey is. He was Mr. Partridge, an old trader who dispensed great wisdom in few words. Those at the office nicknamed him Turkey because of the way in which he strutted around with his chest puffed out. Livermore gleaned wisdom from Old Turkey which included the importance of never losing one’s position and placing the utmost importance on the major trend. “It’s a bull market,” he often repeated. Precious metals shares are breaking out again after a brief consolidation. It’s time to channel your inner Old Turkey, realize this is a bull market and act accordingly.
The evidence is overwhelming. After rebounding strongly to start the year, the mining stocks corrected through May. The June reversal on record volume created the first higher low. The miners then sustained that strength by closing the month and the quarter with the kind of strength not seen since the bottoming process began in June 2013. In addition to the price action, the miners have outperformed the metals in strong fashion and especially in the last five weeks. These are reliable signals of a new bull market.
Analysts like to be cautious and sometimes prefer to avoid momentum plays but the charts lead me to believe that the momentum is building and has plenty of room to run. From time to time I’ve posted charts of my top 15 index. I wanted to create a much broader index consisting of quality companies with more of an emphasis on larger companies. The first image below is a weekly chart of my new top 40 index. It includes 28 gold stocks and 12 silver stocks. The median capitalization is nearly $750 Million and 15 of the companies are worth $1 Billion or more.
The index appears to be breaking out after a two week consolidation. It closed Wednesday at its highest level in about 15 months. Note that although the index has advanced considerably in the last month and year to date, it is finally emerging from a reverse head and shoulders bottom that lasted 15 months! There is significant upside potential from the pattern and very little overhead resistance until the 2012 highs. Also, note the huge accumulation during the winter and the relative strength against Gold.

Staying with weekly charts, here is a look at the juniors via GDXJ and SILJ. With a bit more strength to close the week GDXJ will form a higher high and reach a 10-month high. The next resistance isn’t until $52 while the next major resistance isn’t until $70. Meanwhile, if SILJ closes the week at the current level then it would mark the highest weekly close in 15 months. SILJ is starting to breakout from a very well defined head and shoulders pattern which projects roughly 30% upside from Wednesday’s close.

In February we argued that the strength in precious metals should not be feared and that there was plenty more upside ahead. That article was premature as its points appear to be more instrumental right now. This is a tough time to buy as miners are no longer dirt cheap and have already rebounded quite a bit. At the same time, there could be a lingering fear that the bear could reassert itself at any moment. That article provides some examples of how markets performed following major bottoms. The rebounds (in miners and general markets) tend to last well beyond one year before there is any significant correction.
The final bottom for miners was in December 2013 and further strength in the coming days and weeks should provide us absolute confirmation. Though the miners have already rebounded significantly, the charts suggest that there is plenty of additional upside potential directly ahead. How do you play it? Focus on quality stocks that are not so overbought and take advantage of dips (5%-10%) when they come. Have an exit strategy just in case and then channel your inner Old Turkey!

Article originally published on July 8, 2014.
1. Recent liquidity flows on the COMEX suggest the gold market may need to retrace some of the recent gains, before moving higher.
2. Please click here now. This snapshot of yesterday’s COT report for gold shows the powerful commercial traders (often referred to as “banksters” in the gold community) selling a lot of long positions and adding short positions.
3. This is the second week in a row that the COT report has shown this type of “bearish” liquidity flows.
4. Please click here now. The COT report for silver shows a situation that is similar to gold.
5. The rally in June may have caused some gold community investors to become a bit complacent. It’s very difficult to build wealth in the market, and even more difficult to keep it. Investors should never feel complacent when banks are placing large bets against gold.
6. Please click here now. That’s the hourly bars gold chart. The FOMC minutes get released tomorrow at 2pm, and I expect the Fed could make a strong statement about future rate hikes. That could hurt gold in the short term.
7. The $1305 area offers decent support, but if bonds sell off significantly on the FOMC minutes, gold could decline towards $1285.
8. Please click here now. The 14,7,7 Stochastics series is flashing a sell signal on this daily gold chart. The picture here also suggests the FOMC minutes release could be negative for gold.
9. The weekly chart is also a bit “concerning”, but only in the short term. Please click here now. Like the tide of an ocean, oscillators rise and fall. The 14,3,3 series Stochastics now has a “nosebleed”, while commercial traders are piling on short positions.
10. The bottom line is that investors in the gold community need to be prepared for a bit of short term pain. The good news is that there’s a massive symmetrical triangle in play for both gold and gold stocks. Gold stocks have already staged an upside breakout. That’s bullish for gold!
11. Please click here now. That’s the weekly GDX chart. A breakout from the triangle pattern has already occurred. Gold stocks are leading gold higher.
12. The FOMC minutes are very important, and most bank economists believe coming strength in the US economy will cause the Fed to raise interest rates sooner rather than later.
13. They feel that will put pressure on gold. Many bank technicians believe the triangle patterns in precious metals will be resolved to the downside.
14. There’s no question that if the US economy improves, that will put pressure on the Fed to raise rates. While some gold analysts argue that the economy won’t improve, I don’t think that’s the key issue at hand.
15. The main problem facing the gold bears is that this is 2014, not 1979. In the 1970s, the price of gold was “all in the dollar”. If the dollar rose strongly against other key Western currencies, gold fell. In 2014, gold is still “all in the dollar”, but it’s not the action of the dollar against the euro that is important, but the action of the dollar against the rupee and the yuan.
16. While the short and intermediate trends for gold are greatly influenced by Fed policy, events in China and India are now the key drivers of gold’s primary trend.
17. As important as tomorrow’s FOMC minutes are, on Thursday the Modi government releases its first budget. The most powerful gold dealers in the world are intensely focused on this budget. Gold’s next primary trend move could be determined by what happens in India on July 10.
18. Since the government there implemented draconian import duties and restrictions about a year ago, India’s gold jewellery industry has been crushed. That hurt demand for gold from Western mining companies, which sent mining stock prices sharply lower.
19. The Indian mafia is now involved in the gold industry. That has created added costs and danger, for the surviving jewellers. The Modi government is widely believed to have serious concerns about the dangers of letting mafia power grow.
20. Mainstream brokers like Merrill Lynch are predicting the government will cut the import duty only slightly on Thursday, while Indian jewellery associations are demanding a complete dismantling of all restrictions.
21. The government itself is extremely tight-lipped about what will happen, and that’s creating the potential for a violent gold price move to the upside or downside, as the budget is released.
22. It’s possible that the FOMC minutes create strong selling, but a gold-bullish budget from India quickly reverses that, and sends gold surging towards my target of $1432.
23. Please click here now. That’s the GDXJ chart. Like their senior brethren, junior gold stocks have already staged a tentative upside breakout from their symmetrical triangle pattern.
24. Regardless of what is in the FOMC minutes, the Fed can’t stop Indian jewellers from demanding massive amounts of gold from Western mining companies. What happens to that demand now, depends on the July 10 Indian budget. A gold-positive budget should create a surge in GDXJ, to above my $46 target. That price level would attract significant buying, by momentum-oriented hedge funds!
Stewart Thomson of Graceland Updates, Guest Contributor to MiningFeeds.com

The following press release came out Tuesday after the market close. This is big news as it proves once again the strong working relationship between Potash Ridge [PRK.TO] & [POTRF] and the State agencies of Utah, most notably the Utah Division of Oil, Gas and Mining, “DOGM.”
Utah is a very mining friendly State and Potash Ridge’s property is on State, not Federal lands. Therefore, final permitting steps are expected to be relatively straight forward as no Federal involvement is required. A lot of minerals are mined in Utah and there is good access to key infrastructure. Roads, power, rail and natural gas are all readily available. Compass Minerals is a long-time potash producer in Utah. In addition to being mining friendly, Utah is better situated to serve west and southwest U.S end markets.
According to CEO Guy Bentinck, the company’s project is now very advanced in its permitting program with only one more major permit remaining. Potash Ridge is not one of the dozens of global junior potash plays looking to produce Muriate of Potash, “MOP.” Instead, the company is one of the few that will be surface mining and processing ore into Sulphate of Potash, “SOP.” The difference between the commodity MOP and the specialty potash SOP is increasingly important.
Not All Potash is Created Equal
Investors in potash may have an inkling that there are 2 main kinds of potash, but they probably don’t recognize the importance. This distinction was driven home in July of last year when the price of MOP began to crash. Most potash consumed around the world today is MOP, a true commodity fertilizer product. The market for MOP was controlled by two giant marketing organizations, one in Canada and one in Russia. These two groups or cartels largely controlled the price, which at the time was around $400 per metric tonne “mt.” When the Russian group broke apart last July, pricing discipline went out the window as a member of that splintered group threatened to flood the global market with MOP. Within months, prices of MOP fell by close to 25% to about $300/mt.
As one can imagine, this was terrible news for most commodity potash juniors, many of which are 5 or more years from first production and require potash prices above $400 or even $500/mt to be viable. As a result of the collapse in MOP prices, several projects are now on hold due to lack of funding. Even giant BHP, which has a massive potash project in Saskatchewan, Canada is moving a lot slower in developing its MOP project. Adding insult to injury, Rio Tinto recently announced that they too are working on a large Saskatchewan potash project. There are a handful of junior potash companies, also in Saskatchewan, that are feeling some serious pain right now. Due to large players like BHP and Rio entering the MOP scene and of course the established giants PotashCorp and Agrium, it appears that robust MOP pricing could be many years away.
Yet, the OTHER potash product, SOP, a specialty potash used for high value crops, was untouched from all the MOP drama. While MOP prices fell 25%, SOP prices remained relatively flat. Therefore, the premium paid for SOP over MOP has grown to its highest since 2008.
Sulphate of Potash “SOP” Fundamentals Remain Quite Strong
SOP pricing was unfazed by the decline in MOP pricing because the two are different products that sell to different end users. There are no cartels controlling the price of SOP. Global demand for SOP would arguably be a lot higher if end users knew that they could get reliable supply. In short, the prospects for MOP and SOP are like night and day– great news for SOP producers like Potash Ridge.
Following is the press release of July 8th…
TORONTO, ONTARIO–(Marketwired – Jul 8, 2014) – Potash Ridge Corporation (“Potash Ridge” or the “Corporation”) (PRK.TO)(POTRF) today announced that the Utah Division of Oil, Gas and Mining (“DOGM”) has approved the Corporation’s Notice of Intention to Commence Large Mining Operations (“NOI”) at its Blawn Mountain Project.
The Corporation filed the NOI with DOGM in December 2013. The approval initiates a public comment period that will end on August 8, 2014. The application has met all the regulatory requirements set out by DOGM for new mining projects in the state.
“The NOI approval is a major regulatory accomplishment for the Blawn Mountain Project and is the culmination of tremendous work effort by our team,” said Guy Bentinck, President and Chief Executive Officer. “We are now very advanced on our permitting program for the Project, with only one more major permit remaining to be addressed as part of the upcoming feasibility study. The receipt of the NOI further evidences the continued efficiency of the permitting process in Utah. We would like to thank DOGM for processing our application in such a timely manner.”
About Potash Ridge
Potash Ridge is a Canadian based exploration and development company focused on developing a surface alunite deposit in southern Utah called the Blawn Mountain Project. It is expected to produce a premium fertilizer called sulphate of potash and a possible alumina rich by-product.
Located in Utah, a mining friendly jurisdiction with established infrastructure nearby, the Project is expected to produce an average of 645,000 tons of SOP per annum over a 40 year mine life. A NI 43-101 compliant Prefeasibility Study completed in November 2013 by Norwest Corporation demonstrated that the Project is both technically and economically viable. The Prefeasibility Study, entitled “NI 43-101 Technical Report Resources and Reserves of the Blawn Mountain Project, Beaver County, Utah” dated effective November 6, 2013 is available on SEDAR.
Potash Ridge has a highly qualified and proven management team with significant financial, project management and operational experience and the proven ability to take projects into production.

Article originally published on July 7, 2014.
I was planning to have a quiet holiday vacation day with my family but one of my favorite junior gold miners in Nevada, Canamex Resources (CSQ.V or CNMXF) was halted by the company pending news.
This morning Canamex Resources resumed trading after they announced a major high grade discovery in the east zone intersecting over 44 meter of close to 7 g/tonne.
These drilling results are some of the best I’ve seen from any Nevada junior as they are high grade and near surface.
Expect to see further results this summer from Canamex Resources (CSQ.V or CNMXF).
See the news below which resulted in a breakout move up to $.17 on 3 million shares of volume.
Press Release – Canamex Resources Corp.
Canamex Drilling Intersects 44.2 Metres Grading 6.97 g/tonne Au and 47.3 Metres Grading 3.4 g/tonne Au at Bruner Gold Project, Nevada
(July 7, 2014) Canamex Resources Corp. (the “Company”) (TSX-V: CSQ) (OTCQX: CNMXF) (FSE: CX6) is very pleased to announce ongoing results from reverse circulation drilling at the Bruner Gold Project located in Nye County, Nevada.RC Hole B-1425Reverse circulation drill hole B-1425, drilled into the East Zone at the historic resource area* intersected145 feet (44.2 metres) grading 0.203 oz/ton Au (6.97 g/tonne Au ) from 40-185 feet (12.2-56.4 metres) depth. Within this zone is a high-grade interval from 60-85 feet (18.3-25.9 metres) that grades 0.81 oz/ton (27.91 g/tonne) Au and 9.55 oz/ton (327.3 g/tonne) Ag. This intercept offsets to the south mineralized intervals drilled in holes B-1408C and historic drill hole BRU-094, which indicated the presence of a zone of gold mineralization that was above the average grade of the historic resource. Drill hole B-1425, along with the other holes reported below that were also drilled into the East Zone of the historic resource area* confirm there is a higher grade zone that needs to be properly quantified with sufficient drilling to include in a NI 43-101 resource estimate. A plan view map will be posted to the web site that displays the location of all holes drilled to date at the historic resource area, along with a cross section displaying the drill holes described in this release.
Mineralized intercepts in hole B-1425 are reported in the table below:

RC Hole B-1424
Reverse circulation drill hole B-1424 was drilled to offset to the north the mineralized intervals drilled in holes B-1408C and historic drill hole BRU-094 of the East Mineralized Zone referenced above. Hole B-1424 intersected 155 feet (47.3 metres) from 75-230 feet (22.9-70.1 metres) grading 0.100 oz/ton Au (3.44 g/tonne Au) and another lower grade intercept as reported in the table below:

RC Hole B-1426
Reverse circulation drill hole B-1426 was drilled above hole B-1425, and intersected the mineralized zone about 75 feet above the reported intercept in hole B-1425. Hole B-1426 intersected multiple mineralized zones as reported in the table below:

RC Hole B-1423
Reverse circulation drill hole B-1423 was drilled below hole B-1424, and intersected the mineralized zone about 75 feet below the reported intercept in hole B-1424. Hole B-1423 intersected one zone of low-grade gold as reported in the table below:
![]()
On the sections containing these holes, the East Zone trends in a northerly direction and is approximately 100 feet (30.5 metres) wide, 200 feet (61.0 metres) thick, and lies within 20 feet of surface.
The East Mineralized Zone of the historic resource area* remains open along strike to the north and south and is largely untested by drilling. Work is underway to assess the best access to drill stations to continue drilling the open extensions of this mineralized zone.
The assay results reported corroborate our interpretation that there are higher grade interior zones along well mineralized faults and fractures within the historic resource area* that have not been fully defined or adequately tested by historic drilling. The best gold intercepts at the historic resource area* lie at very shallow depths below the surface, making it readily amenable to open pit mining. Many historic drill holes penetrated beneath the main mineralized zone and failed to intersect this shallow zone. With ongoing drilling of this exciting mineralized zone we continue to advance our understanding of the host geology and the distribution of gold at Bruner. Once this additional drilling is completed we should have enough detailed information to quantify the historic resource* under NI 43-101 standards for reporting purposes.
Drill hole samples are stored on site and are retrieved by ALS Minerals personnel or an independent contractor and transported in their custody to the ALS Minerals laboratory in Reno/Sparks, Nevada, where they were photographed, sawed, sampled, and analyzed by ALS Minerals laboratory for gold and silver. Duplicates, blanks, and standards were inserted at regular intervals for QA/QC purposes. All drill samples are prepared by crushing the entire sample to 70% passing 2mm size, splitting out 1 kilogram of sample and pulverizing this split to 85% passing -75 microns in size. From the 1 kilogram pulp 30 grams is split out for fusion and fire assay with an AA finish. If results return greater than 3 g/tonne Au another 30 gram split is re-run by fusion and fire assay with a gravimetric finish. Greg Hahn, President and interim CEO and a Certified Professional Geologist (#7122) is the Qualified Person under NI43-101 responsible for preparing and reviewing the data contained in this press release.
* The historic resource area refers to an area on the Bruner property that was the subject of a historical resource estimate reported on the property in a press release by Miramar Mining Corporation in 1993 and is not in compliance with NI 43-101 standards. The non-compliant resource estimate was done by industry professionals in accordance with standard industry practices prevalent at the time, and is believe to be reliable, but with no assurances as to how much of the resource would qualify as measured, indicated, or inferred under current industry reporting standards. A qualified person (within the meaning of NI 43-101) has not done sufficient work to classify the historical estimate as current mineral resource or mineral reserves, and the Company is not treating the historical estimate as current mineral resources or mineral reserves. The historical estimate is relevant solely for purposes of directing target areas for the Company’s current exploration program.
ON BEHALF OF THE BOARD
SIGNED: “Greg Hahn”
Greg Hahn, Interim CEO and President

The Timmins gold district is by far the most productive within Canada’s prolific Abitibi greenstone belt. It has produced in the neighborhood of 70m ounces of gold, and operations are still going strong. Namesake mining company Timmins Gold is forecasting 2014 output of 120k ounces, making it one of North America’s top junior gold producers. But provocatively not one of Timmins’ ounces is coming from within the Timmins district.
Timmins Gold CEO and founder Bruce Bragagnolo did grow up in Timmins, which gives his company roots in this famous Canadian gold district. But TGD is finding its mining success on the other side of the continent, along the Mexican portion of the Mojave-Sonora Megashear. And its San Francisco mine ranks as one of the finest in all of Mexico.
Timmins Gold was one of the first movers into a country that has been party to a massive gold rush. This rush has led to widespread exploration and development, which has translated into production volume that has increased by a whopping 390% over the last decade. With 2013 output that exceeded 3.2m ounces, Mexico now ranks as the world’s 8th-largest gold producer.
Timmins’ Mexican success rests on the shoulders of Bruce Bragagnolo’s partner and co-founder Arturo Bonillas. Bonillas, who is a Mexican national, is a mining engineer with vast experience in his home country. His extensive connections and understanding of Mexico’s social and legal frameworks allowed Timmins to snatch up an advanced-stage project that was primed for development.
The San Francisco project is located in north-central Sonora, only 2km off the Pan American Highway. And this project was the perfect play to get Timmins off the ground to take advantage of the new gold bull market. San Francisco was a past-producing mine, and there were still significant resources in the ground.
One huge advantage to San Francisco was its past production occurred in the not-too-distant past. It ran as a modern heap-leach mining operation, producing 300k ounces of gold up until its closure in 2000. And since this closure was purely for economic reasons as gold dipped to brutal secular-bear lows nearing $250, it would only be a matter of time before San Francisco got another look.
When Timmins gained its initial interest in San Francisco in 2005, it was already known to hold in the neighborhood of 700k ounces of resources. And TGD’s expert geological team aggressively took to the drill bit in order to prove up the resources and ultimately feed a feasibility study.
Timmins did just that, and after delivering a positive study and procuring permits and financing, it built its mine. San Francisco poured its first gold in December 2009. And this mine’s best years were yet to come.
One of the keys to success in this second phase of San Francisco’s mining life involves a major tweak to the process flow. In its past life San Francisco’s recoveries were quite low given its ore was placed on the leach pads with either minimal or no crushing. But Timmins determined that the extra costs involved in systematic multi-stage crushing were more than offset by higher recoveries and thus higher output.
Once it had the process flow dialed in, Timmins wasted no time seeking to expand operations. And affording this was a huge growth to the resource base. TGD quickly discovered that the mineralization in San Francisco’s mesothermal system was still wide open, so it continued with aggressive exploration well beyond mine commissioning.
This project has now seen in excess of 500k meters of drilling to date, including 240k+ meters just since 2012. And this has led to big upgrades and expansions to the in-ground inventory. Per the latest resource estimate, San Francisco’s deposits contain 3.7m ounces of gold in all categories, including 1.6m ounces of proven-and-probable reserves. It now ranks as one of the largest primary gold deposits in Mexico!
Timmins would be foolish not to expand operations considering San Francisco’s large resource base. It thus rolled out a series of expansions, with the latest that was completed in early 2013 increasing throughput by 140% over initial feasibility-study levels.
The San Francisco mine is now producing at a rate of 24k metric tons per day, which yields gold at a rate of 120k ounces per year. Even at this newly-expanded rate, the mining life will still exceed 10 years based on the latest reserve count. But as existing resources are upgraded and new ones are found, we should see a mining life that greatly exceeds this.
On the cost front San Francisco operates in the lower quartile of industry average. In 2013 its all-in sustaining costs came in at an impressive $872/ounce. And in Q1 2014 they continued to impress, coming in at only $790/ounce. Timmins Gold is one of the rare miners with the ability to turn a profit even at today’s anomalously-low gold prices. And with life-of-mine all-in sustaining costs projected at less than $850/ounce, it’ll be doing this for a long time to come.
Looking forward Timmins has its sights set on further expansion. And this expansion would likely come from the La Chicharra pit, less than 2km from the pit that is currently being mined. La Chicharra’s ore would need its own dedicated crushing unit. And it’s been tossed around that this would bring total throughput to 30k tpd. This expansion should only require a modest capex commitment since the existing ADR plant has the capacity to process a much higher throughput rate.
And best of all is this potential expansion isn’t likely to be a burden to investors. Timmins Gold has funded all previous expansions from cash flow. And with a strong balance sheet to support what should be substantial net free cash flow in the future, developing La Chicharra should also be a self-funded endeavor.
Speaking of investors, Timmins Gold has the make-up to be an investor favorite as gold’s bull gets its legs back underneath it. There aren’t many low-cost unhedged gold producers with exceptionally strong longevity. And TGD is among the best. It has performed very well with gold in the past. And it ought to continue to do so in the future.

Interestingly Timmins Gold made a name for itself as one of the top-performing gold stocks following the infamous 2008 stock panic that dragged gold down with it. From its late 2008 low to 2011 high, TGD was up a staggering 1585%. Compared to gold’s impressive 167% gain from its own late 2008 low to 2011 high, I’d say TGD exhibited darned-good positive leverage, a staggering 9.5 to 1 to be exact.
What I’m more interested in though is how TGD has performed relative to gold subsequent to gold’s late-2011 high. This has been a pretty crazy last three or so years for gold and its mining stocks, a period that truly has tested the resolve of this entire sector. It started out with a normal and healthy correction and consolidation period. But then the selling spiraled out of control, underscored by an anomalous panic that made this sector the most hated in all the markets.
Amidst this three-year period, gold stocks’ typical positive leverage to gold has gotten somewhat out of whack. Even stocks that exhibited consistent leverage in the past have struggled. But as you can see in the chart above, for the most part TGD has still continued to deliver.
Gold has had four meaningful uplegs following its 2011 all-time high. And in the first two during 2012 Timmins remained a gold-stock all-star. In each upleg gold rallied 15%, with TGD posting spectacular trough-to-peak gains of 72% and 90%! This represents outstanding positive leverage of a remarkable 4.7x and 5.9x respectively.
Timmins of course tanked with gold like every other gold stock in 2013. There was however one meaningful upleg coming out of the Q2 panic that TGD had the opportunity to participate in. But as you can see, it didn’t. And this disconnect was actually quite perplexing. Yes Timmins had a rough Q2’13 with much lower year-over-year profits along with a small impairment charge. But this was pandemic for the sector. We’ll chalk this up as an anomaly, especially considering the follow-up action.
Things reverted back to normal amidst gold’s latest upleg in early 2014. TGD positively leveraged gold’s 16% gain by 4.4x, soaring 71%! And just over the last few weeks, TGD has really embraced a rare summer gold rally by surging 48% to gold’s 6.7% (stellar 7.2x leverage). Time will tell whether a new gold upleg is being born, but what is clear is that TGD is wound tight and ready to spring on any upward momentum in its underlying metal.
Overall Timmins Gold has everything it takes to be an elite junior gold producer. It has a spectacular mine that will be producing low-cost gold for a long time to come. It has a top-shelf management team adept at exploration and development. It has a solid financial standing. And its stock has demonstrated the ability to superbly leverage the underlying metal.
Timmins is a proven leader of the junior-gold-producer sub-sector. This sub-sector does carry more risk than the larger more-diversified miners, which can lead to sharp downside leverage. But the rewards can be exceedingly great on the upside. These stocks are small enough that it doesn’t take much investor interest and thus capital inflows for them to explode higher. And when gold regains its legs, it won’t take long for this capital to find them.
As to the what, we pull from our expert world-class research, the fruits of which are available via our popular sector reports. And our brand-new report published just a few weeks ago profiles our favorite dozen junior gold producers. Our several months of deep research identified what we believe are the highest-potential stocks out of all those that trade in the US and Canada. If you’d like the full Timmins Gold fundamental profile along with those of 11 other exciting stocks, buy your report today!
The bottom line is Timmins Gold is one of the industry’s top junior gold producers. This company skillfully executed a plan to develop an advanced-stage Mexican project in order to take advantage of gold’s secular bull market. And it did just this with production from what is now one of the country’s finest gold mines.
The San Francisco mine is a long-life low-cost beauty with ample resources and huge upside exploration potential. And for this reason investors have latched on to Timmins’ stock. TGD is a proven high-positive-leverage play that ought to continue to greatly outperform as gold’s bull market presses on.
Scott Wright of Zeal LLZ, Guest Contributor to MiningFeeds.com

Wars are being fought all over the world over control on natural resources. Attention is focussed on Eastern Europe and the Middle East particularly Iraq. I am greatly concerned that not enough is being done by the U.S. to secure critical materials of heavy rare earths needed for cruise missiles and our latest military technologies.
We still rely completely on China despite their export cuts and warnings to the West to mine and refine your own rare earths. Heavy rare earths are increasingly needed in permanent magnets crucial for some of our defense technologies.
China has been warning the world for years that they will cut exports. The U.S. can’t be reliant on another country for these basic elements. One day we could wake up left out in the cold and naked if we don’t start getting our act together.
Don’t believe the naysayers who say rare earths are hype or that they are plentiful and abundant. Many of the heavy rare earth development projects are just too costly to bring into production in a timely manner. Investors are also beginning to realize the Molycorp (MCP) and Lynas (LYSDF) will not solve the heavy rare earth shortage as they are light rare earth projects.
The Alaskans understand the importance of strategic metals. I have maintained my bullish attitude on Ucore (UURAF) for its advantage of having the highest grade heavy rare earth project in the U.S. and incredible geopolitical support. Ucore just released news that Alaskan Governor Sean Parnell approved the financing of Ucore’s Bokan Project near Ketchikan.
Senate Bill 99 which was passed unanimously in the legislature was signed by the Governor in a highly publicized meeting with many government officials and business leaders. Ucore may be the US chance to secure the heavy rare earths instead of being left at the mercy of the Chinese.
Southeast Alaska could see a big boost to its economy should Ucore’s Bokan come into production. The signing of this bill is a huge accomplishment by Ucore and a sign that some politicians in the US understand the importance of this project. The bill would allow Ucore to finance the infrastructure and construction costs up to $145 million by the State.
Ucore has broken above its 200 day at $.27 and 50 day at $.29 as savvy investors may be realizing the significance of de-risking the asset financially and technically.
Ucore recently announced that they awarded a $2.5 million drilling contract that will start in mid July. This is needed for the upcoming feasibility study and it is exciting to see Ucore rapidly advancing this rare asset derisking the asset both financially and technically. This may be the first predominant heavy rare earth mine in the United States.
See my recent interview with Ucore CEO Jim Mckenzie by clicking here…
Disclosure: I am a shareholder of Ucore and Ucore is a website sponsor. Be aware of any conflict of interests. Please do your own due diligence. This is not a solicitation to buy or sell stock. For entertainment purposes only.

1. Has gold topped out, or is it beginning a new leg higher?
2. Please click here now. That’s the hourly bars gold chart. A persuasive argument can be made that gold staged an upside breakout last night.
3. The range of $1305 – $1326 was decisively penetrated to the upside, and gold traded as high as $1335.
4. In 2013, I asked my subscribers, who I refer to as “golden marines”, to focus their buying in the $1228 area, with an emphasis on gold stock. Gold is now about $100 above that key buying area.
5. Please click here now. I’ve highlighted a bull flag pattern breakout on this daily gold chart. Even if the flag pattern fails, and the 14,7,7 Stochastics oscillator suggests it could, that failure would likely create a powerful right shoulder, completing a bullish inverse head and shoulders bottom pattern.
6. I don’t think it’s that important for investors to try to guess whether gold is topping out in the short term, or beginning a new leg higher. I would argue that an obsession with calling minor trend tops and bottoms can destroy wealth, rather than build it.
7. It’s much more important to stay focused on the very bullish big picture. On that note, please click here now. This weekly chart shows the 14,3,3 series Stochastics oscillator in rising mode, and a giant inverse head and shoulders bottom pattern dominates the chart.
8. India’s new government budget is scheduled to be announced on July 10. That’s a key date for any citizen in the world gold community. Many gold dealers believe Prime Minister Modi will announce a significant reduction in gold import duties and regulations.
9. I agree. The current gold price rally could take a needed breather as the budget is announced. It would be a classic case of “Buy the rumour, and sell the news.”
10. Regardless, it’s critical that these restrictions and duties get reduced, and I believe the very bullish picture presented by the weekly and monthly gold charts suggests that Modi is set to release an enormous amount of pent-up Indian demand, over the next six months.
11. Also, the US Employment Situation (jobs) report is scheduled for release on Thursday, and Janet Yellen makes a key speech in Washington on Wednesday.
12. Gold often sells off as the jobs report approaches, but that hasn’t happened this time, adding to the overall bullish sentiment in the air.
13. Please click here now. This monthly gold chart looks spectacular. Note the RSI oscillator at the top of the chart. It is making new highs, and that’s bullish.
14. The 14,3,3 series Stochastics oscillator has burst to the upside, from a bullish inverse head and shoulders bottom pattern.
15. The 8,16,9 MACD indicator is now flashing a key buy signal. Note how rare these signals are, and the size of the price movements that tend to follow them.
16. The key 5,15 moving average series is also on the cusp of a “king kong” sized buy signal.
17. What about geopolitical price drivers? Well, please click here now. While short term oscillators may be overbought, the longer term charts suggest that “team top caller” could sustain a serious beating, particularly if events in Iraq and the Ukraine worsen. On that note, please click here now.
18. Looking at the key geopolitical gold price drivers, it’s apparent that the upcoming holiday week-end may not be a very pleasant one for the gold bears.
19. I want to take a moment to discuss the Bitcoin phenomenon. Please click here now. This daily bitcoin chart is very bullish.
20. Some analysts have tried to compare bitcoin to gold. I think that’s a mistake, but there is a role for bitcoin to play, as a global reserve currency. Here’s why: Central banks generally refuse to be audited, and they have treated gold, generally speaking, with a fair amount of disrespect.
21. Gold is the ultimate form of money, and I’m not sure that central banks deserve to hold any of it. The ultimate form of money should be in the hands of citizens, not governments. Part of the reason I own bitcoin is because I believe central banks will ultimately embrace it as part of a global reserve currency.
22. Regardless, bitcoin is a minor holding for me, and I view it like a junior stock. It’s a speculation. From a perspective of risk, it shouldn’t be compared to gold, any more than a junior gold stock should be compared to gold.
23. The big picture for speculative junior gold stocks is very bright, because inflation is beginning to rise in the West, and India is probably only ten days away from officially ushering in a gold jewellery “bull era”! Please click here now. This monthly GDXJ chart is important. The 5,15 moving average series is on the verge of what could be a “generational” buy signal.
24. Yesterday’s close was critical, because it was not just the end of the month, but the end of the quarter. Junior gold stocks staged a spectacular ending to the first half of the year, on massive volume. This chart suggests the second half of 2014 will be even better!
Stewart Thomson of Graceland Updates, Guest Contributor to MiningFeeds.com

NOVX21, ticker NOV.v is a PGM recycling company that expects to fund and build its first commercial scale facility in 2014. Assuming the first facility gets built this year, the upside for the company is quite significant.
Let’s assume that the Net Present Value, “NPV” of a single 10-reactor facility is $30 million. How do I get that number? Based on the company’s previously reported projections of the economics of a 4-reactor facility, scaled up by a factor of 2.5 (10/4 = 2.5). Using the company’s figures, a single 4-reactor facility was expected to produce $21-$29mm of revenue, the midpoint of $25 million scaled up by x 2.5 = $62.5 million. Gross margin was stated by the company as 33%. Let’s assume on revenue of $62.5 million, the operating margin might be 15% or roughly $9 million per year. The capital cost to build a 10-reactor facility is stated as $10 million.
Assuming a 15-year facility life, and discounting $9 million per year at an 18% discount factor, that equates to about $36 million. Let’s haircut that $36 million to $30 million to account for capital replacement costs over the 15-year facility life. Why an 18% discount factor? I have no specific reason, but I feel that’s fairly conservative for a technology that’s been pilot tested at 1/10th commercial scale for over a year.
Hard to Imagine How (Fully-Diluted) NOVX Shares are Not Worth AT LEAST $0.20….
There are 145 million fully-diluted NOVX shares. If all of the warrants and options were to be exercised, the company would receive proceeds of about $10 million. Let’s assume that the company raises $10 million of convertible debt in July with a convert price at 20c. NOTE: I believe that the company hopes to get a better funding package. Maybe it can raise $5 million of the $10 million as straight debt with no equity component or through equipment financing or community subsidies / tax breaks of some kind. In any event, if it’s a $10 million convert at 20c, that would be 50 million additional shares upon conversion, for total pro forma, fully-diluted shares of 195 million, (call it 200 million so that management can give out share-based bonuses). The valuation of NOVX21 based solely on $10 million of cash proceeds from the exercise of warrants and options, PLUS the NPV of a single 10-reactor facility ($30 million) = $40 million of tangible asset value. $40 million divided by 200 million pro-forma, fully-diluted shares = $0.20 per share.
If the story ended there, that would not be too exciting. Remember, companies frequently trade at valuations below Net Asset Value per share. But, the story doesn’t end there because if the company successfully builds facility #1, more will certainly follow. Assuming that all subsequent facilities could be built from internally generated cash flow and warrants/options proceeds, i.e. no further equity dilution after this imminent capital raise, then there’s a lot more value to be considered.
For example, let’s assume that 2 additional facilities are built in 2015 and that those facilities ramp up so that by 2016 they’re essentially at design capacity. Since cash flow would be set back an additional year on these 2 facilities compared to cash flow from facility #1, the NPVs of those 2 additional facilities would be say $30 million divided by 18% = $25 million each, or $50 million for the 2. Therefore, assuming the first facility is successful, the total value of the company on 3 facilities operating by 2016 might be $40 million plus $50 million = $90 million, which would equal about $0.45 per pro forma, fully-diluted share.
… And, a Valuation Over Time of $1 or More Per Share is Not Unreasonable
One can imagine the blue-sky possibilities. How many facilities could the world absorb? I certainly think dozens over the next 10 years. Even if just 10 are built over the next decade, the NPV of those 10 would reach into the hundreds of millions of dollars, which would equate to a pro forma, fully-diluted share price above $1. Again, assuming no additional convertible debt or equity is raised after this upcoming capital raise.
The magnitude of de-risking that is set to occur by the funding and construction of the first facility is very significant. I would think that the NPV of a second facility (assuming it comes online after the successful demonstration of the first facility) would be higher than $30 million because instead of an 18% discount factor, one could assume a lower rate of say 10%-12%. At a 12% discount factor, the NPV would be $51 million compared to $36 million at 18%. Instead of a NPV of $25 million for facilities numbers 2 & 3, it perhaps could be $35 million each as they would be substantially de-risked units. The valuation would then be $40 million for the first facility + options/warrants proceeds plus $70 million for facilities #2 & #3 = $110 million. $110 million divided by 200 million pro forma, fully-diuluted shares = $0.55 per share. Why am I fooling around with different discount factors? Merely to demonstrate the de-risking upside. Taking that line of thought to the final conclusion, what discount factor would a major PGM company like Stillwater or Anglo American need to apply to a soon to be proven commercial technology like NOVX21’s? A LOT LESS than 18%!
Licensing Opportunity Could be Tremendous as Well
A final thought- the company will be building and operating its own facilities, but may also (eventually) roll out new facilities through licensing agreements. Perhaps the company could collect 7.5% of the top line revenue from a licensed facility that’s 100% funded, built and operated by a third party. 7.5% x $62.5 million of annual revenue = ~$5 million of royalty income per year per facility. A royalty stream like that might be valued in the tens of millions of dollars. Who knows how many licenses could be sold in China alone?
If you’re looking for leverage to a rising gold price then I would stick to the junior miners (GDXJ) over the majors. Many of the large miners (GDX) have had to take huge write downs on some poor decisions in questionable jurisdictions. However, there are a few junior producers and explorers in North America in mining friendly jurisdictions with improving balance sheets and better growth profiles. I believe they are superior bets.
The investment community is beginning to realize gold and silver may be on the verge of a huge move higher. Recently we witnessed the biggest daily gain in more than six months. These sort of moves after a three year base may be indicating short covering combined with major accumulation. The big money value investors may be adding miners to their portfolio. Why is capital finally entering the junior miners? Investors are growing increasingly concerned with geopolitical tensions in the Middle East and Eastern Europe.
Investors need to pick carefully in the junior mining space and research the asset, share structure, balance sheet, jurisdiction, growth profile and investigate to see if management is ethical. Its not easy finding the winners which can increase possibly 500% or more. Investing in junior miners is like Babe Ruth. He was the home run king but also had a lot of strikeouts. In the junior mining space, the more homework you do the better odds of hitting a home run and not striking out.
I have always focused on Nevada which is safe and mining friendly. The two biggest gold producers Newmont (NEM) and Barrick (ABX) make a ton of profit there and are looking for new resources in Nevada rather than Africa or South America. Remember Nevada produces 6% of the world’s gold. That could climb higher as new discoveries are made and as the gold price dropped.

During this gold correction, miners needed to focus on lower cost targets. For Barrick and Newmont their Nevada gold production has the lowest cash costs in the world and are much less risky politically than mines in other locations. Newmont paid high prices for Fronteer Gold (FRG) back in 2011, which I owned and recommended to my subscribers back in 2010 for its Long Canyon deposit. Discoveries in Nevada fetch a high premium compared to assets in more hostile places.
For the past several months and most recently on June 6th, I highlighted Canamex Resources (CSQ.V) who has two NYSE dividend paying gold mining producers as strategic investors. The two largest shareholders are Gold Resource Corp (GORO) and Hecla (HL). Either one of them has deep enough pockets to buy out Canamex who is continuing to hit impressive drill results at their Bruner Project in Nevada. Watch a break through $.14 for its next run which could take it to the next price resistance at $.25. The breakout may be imminent.

As I repeatedly said before in several reports that both NYSE companies have some of the best technical personnel in the mining sector. Canamex’s Bruner Project is one of the few that has passed and scored high on the due diligence examinations of two proven gold producers. I believe with continued drilling success we could see a breakout sooner rather than later. Why does Hecla (HL) or Gold Resource (GORO) like this asset? High grade, near sufarce and heap leachable assets have lower risk and quicker payback. Canamex’s Bruner Project is located in the Walker Lane in mining friendly Nevada. Canamex is actively drilling 10,000 metres and hitting impressive results. Drilling continues to support that there are high grade portions within the historic resource area. In addition, look at the drill result from May 21, 2014 where Canamex Resources (CSQ.V) intersected over 70 meters of 3+g/tonne. This is very positive developments for Canamex and I am delighted to see new results today.
See the press release entitled, “Canamex Drilling Intersects 53.4 Metres Grading 1.84 g/tonne Au within 89.9 Metres Grading 1.21 g/tonne Au at Bruner Gold Project, Nevada
In my opinion, Canamex is undervalued compared to its peers. For instance, a comparable hole was just hit in Nevada by a company with an 80+ million market cap of less than 70 m at .9 g/t gold. Canamex is hitting better results and has a market cap less than one quarter of its peer.
Please see my last interview with Bob Kramer who was passionate about this project and would be proud to see these results. He was so excited by the drilling season this summer before he suddenly passed away.
https://www.youtube.com/watch?v=5MGwSvidbTo
Disclosure: I am a CSQ.V shareholder and the company is a website sponsor.
Be aware of conflicts of interest and please do your own due diligence.
Jeb Handwerger of Gold Stock Trades, Guest Contributor to MiningFeeds.com
If you would like to receive our free newsletter via email, simply enter your email address below & click subscribe.
 Follow us on Twitter
 Become our facebook fan
CONNECT WITH US
Tweets
Tweet with hash tag #miningfeeds or @miningfeeds and your tweets will be displayed across this site.
MOST ACTIVE MINING STOCKS
Daily Gainers
 CMC Metals Ltd. CMC Metals Ltd. |
CMB.V | +900.00% |
 Eden Energy Ltd Eden Energy Ltd |
EDE.AX | +200.00% |
| GoviEx Uranium Inc. |
GXU.V | +42.86% |
| Eagle Nickel Ltd. |
ENL.AX | +41.67% |
| Citigold Corp. Limited |
CTO.AX | +33.33% |
| Mount Burgess Mining NL |
MTB.AX | +33.33% |
| Exalt Resources Limited |
ERD.AX | +31.94% |
| Casa Minerals Inc. |
CASA.V | +30.00% |
| Cariboo Rose Resources Ltd |
CRB.V | +28.57% |
| Belmont Resources Inc. |
BEA.V | +28.57% |


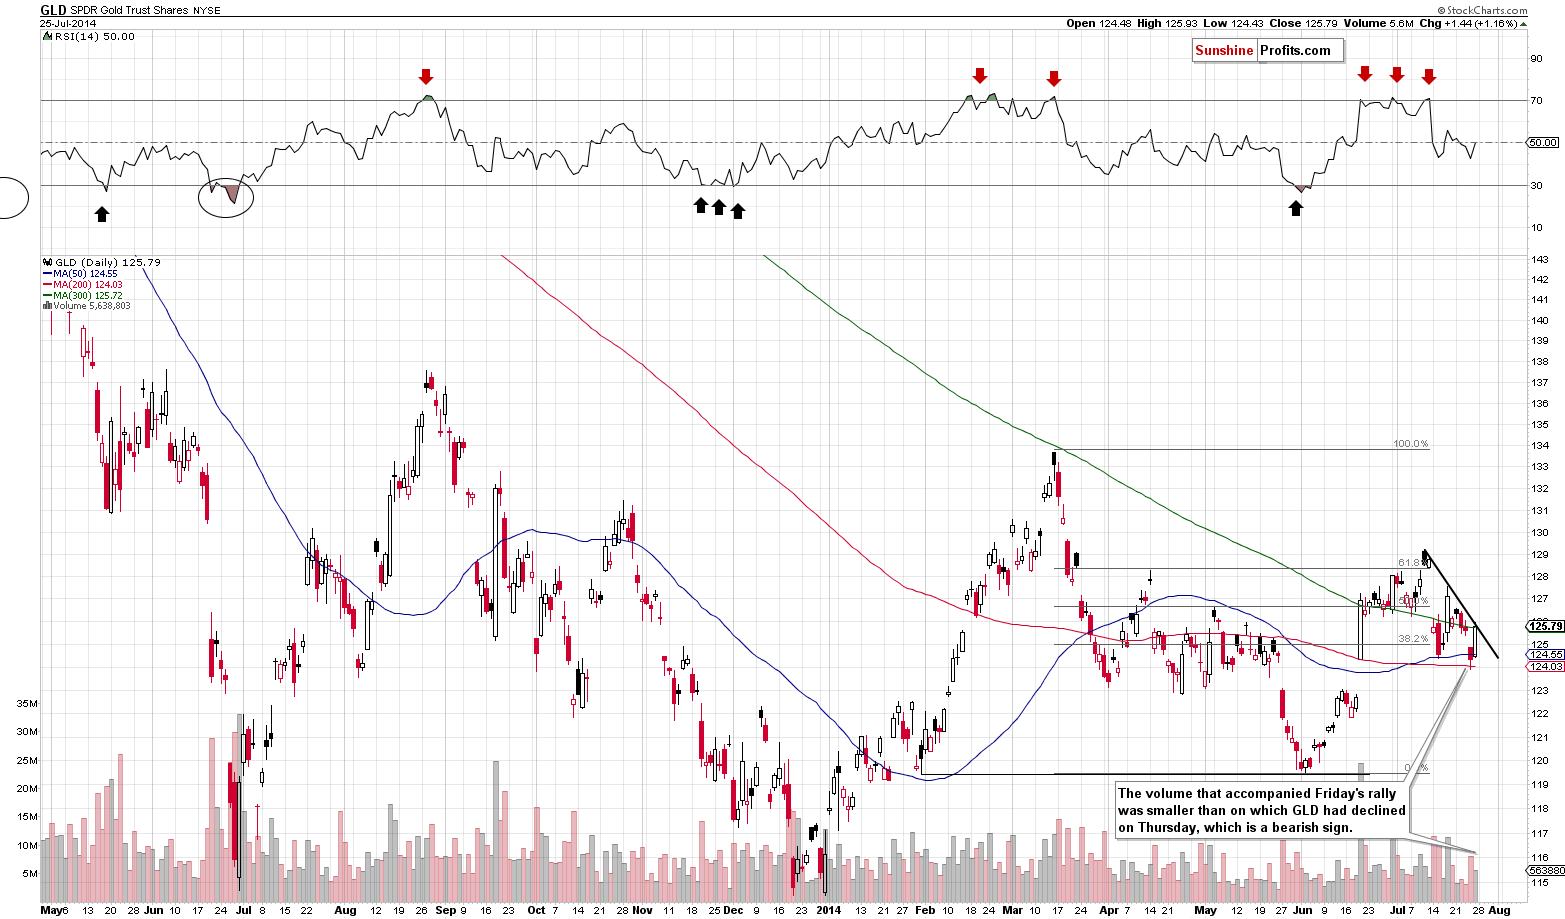
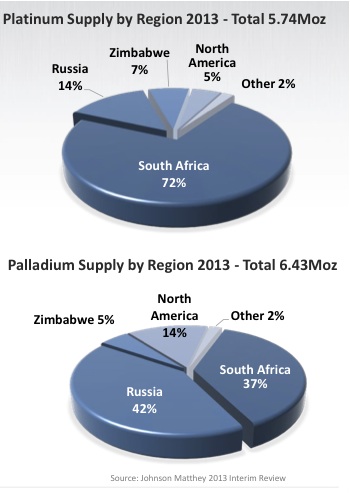
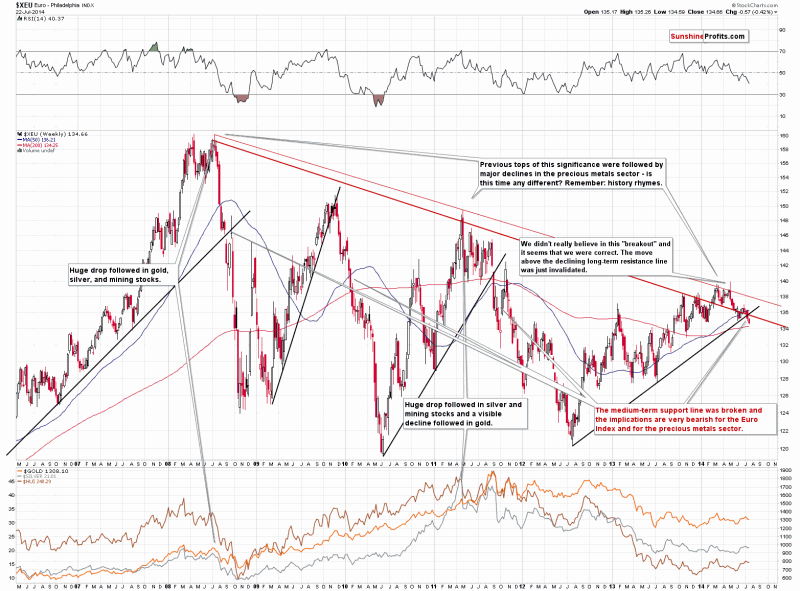