

On April 4th, 2014 I highlighted to my premium subscribers an obscure junior niobium miner which many ignored and was trading at approximately $.26. Niocorp (NB.V or NIOBF) owns a high grade niobium asset in Nebraska and has been hitting the highest grade results to date. See my previous reports on Niocorp from April and June.
The stock is on the verge of its next major breakout at $.80 as it hits the highest grade results to date. Niocorp announced this past week niobium assays in excess of 3% this past week. See news release by clicking here…
This confirms that management is delivering impressive results on this Phase 1 program and is further proving their hypothesis correct that Elk Creek Niobium asset is world class.
Phase 2 drilling has already commenced and six holes are planned to be drilled. I expect these high grade results along with the metallurgical progress could attract a financial partner who wants to be involved with this world class high grade niobium asset which is one of a kind in the United States.
Last month Niocorp retained Mackie Capital to negotiate potential strategic partnerships. I look forward to hear that the pilot plant work has begun and that a potential funding partner has entered into an agreement with Niocorp.
One must remember this is the only niobium deposit under development in the U.S. and the highest grade undeveloped niobium deposit in North America. I expect as investors see the high grade results that Niocorp should breakout above $.80 is imminent. A $1.15 technical target could be reached.
Niocorp CEO Mark Smith believes he can bring Niocorp’s Elk Creek Mine into production and has put his own $2 million into the company as an investment. He has built mines before. Niocorp is now focussed on producing a feasibility study which I think could be very economic with the recent high grade results.
See my recent interview with Niocorp CEO Mark Smith by clicking here.
Disclosure: I own Niocorp and the company is a website sponsor.

1. A week ago, I suggested gold would likely decline from the $1300 area to about $1275 and stop there, adding bullish symmetry to an inverse head and shoulders bottom pattern.
2. Please click here now. That’s the hourly bars chart for gold. It’s clear that gold declined to my targeted $1275 area “on cue”, and then surged higher early this morning.
3. To view the bullish symmetry this price action created on the daily chart head and shoulders pattern, please click here now. This bullish chart looks like Michelangelo sculpted it, from a block of golden marble!
4. Note the bullish action of the price stoker (14,7,7 Stochastics series). My first target is $1325.
5. Given the stunning Indian and geopolitical price drivers now in play in Iraq, Syria, and the Ukraine, I think gold could charge beyond $1325, and on towards the $1347 and $1390 area highs.
6. Silver, which is perhaps better referred to as “gold on steroids”, looks even better. Please click here now. The price stoker sits at an incredibly oversold level of about 10, and is now flashing a crossover buy signal, as it bursts above a key minor trend line. My suggestion to silver enthusiasts, is to be long and strong!
7. The hardline Islamist group commonly referred to as ISIS has created a quasi-nation state of enormous size. It stretches across huge parts of Iraq and Syria. On the week-end, they apparently captured a Syrian airbase, and they have stated plans to capture not only Baghdad, but the entire countries of Spain and Italy. The ISIS leader, “Al-Baghdadi”, has a doctorate degree. It’s probably not a wise idea to underestimate the man’s capabilities.
8. While I don’t think many analysts understand the seriousness of this situation yet, Mid-East geopolitics threatens to become a much bigger gold price driver than QE ever was.
9. Over the past month, bank economists around the world have almost universally dropped their bearish viewpoints on gold, and adopted a generally supportive outlook.
10. A “$1200 floor” is a common expression used by the top economic guns now. That’s a welcome change, and the gold charts certainly support this new and “improved” analysis, of the world’s mightiest metal!
11. I’ve argued that the year of 2014 is a year of transition, from deflation to inflation. As a gold price driver, the economic super-crisis is on the back burner, and strong growth that produces relatively more inflation than GDP is on the front burner.
12. Please click here now. That’s the latest PMI flash report for US manufacturing growth. It’s acting like a hungry pitbull. I’m predicting that it will only take three or four more such reports, to make high quality institutional money managers start ringing their inflation alarm bells.
13. Rising food prices can create huge institutional liquidity flows into gold. Commerzbank agricultural market analysts are amongst the best in the business. To view their current analysis of the wheat market, please click here now.
14. Please click here now. That’s the latest COT report for wheat. The commercials (aka the “banksters”) are net long the wheat market, while the hedge funds are net short! Is wheat on the verge of soaring higher, and will that produce sizable institutional liquidity flows into gold? I think so.
15. In the big picture, India is the most important price driver for gold. The news coming out of the land of the “titans of ton” is now very bullish.
16. Please click here now. While about one third of the entire population of India has no electricity, that state of affairs is changing very quickly. As Indian citizens get access to the internet, they are rushing to buy gold in online accounts. Over the next couple of years, I expect this online buying will go “off the charts”.
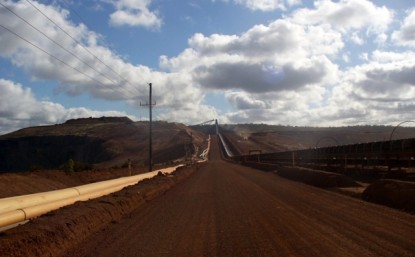
17. Because a picture arguably speaks a thousand words, please click here now. The road sign says “Pot Of Gold Ahead”. I think that applies to any investor who owns shares of gold mining stocks.
18. ‘Gold likely to regain sheen in second half of 2014: Despite the possibility of deficient monsoon casting a shadow on the rural demand, riding on overall better sentiments gold is expected to recover its sheen in the second half (July-December) of the year, Somasundaram P.R, managing director (India), World Gold Council (WGC) said. “The second half will be a better one as compared with the previous year. The first half (January-June) was affected by the 80:20 rule on exports and expectations that there will be a duty cut. “People were hoping that the price will get back to the Rs.25,000 ($413) per 10 grams zone. Then there was election till the second quarter (April-June), which did have its own impact on demand. There were also a lot of operational issues for the trade,” Somasundaram told IANS in an interview.’ – The Gulf Today News, Aug 25, 2014.
19. If anyone deserves the “man of the year” title, it’s probably WGC director P.R. Somasundaram. I’m in complete agreement with his superb assessment of the current gold market.
20. Gold is set to regain its sheen, and so are the mining stocks held by the Western gold community.
21. Please click here now. That’s the GDX daily chart. GDX is in a nice uptrend channel now. In the short term, it’s consolidating in a bullish rectangle formation.
22. My suggestion to Western gold stock investors is to treat the gold bull era like a fine wine. Savour each moment.
23. Out with the old, and in with the new. The new era is not a chug-a-lug contest for “parabola demanders”. Nor is it a QE reunion party. This is a new era of consistently growing demand for gold jewellery, created from gold that is mined.
24. Soon this key source of demand will surpass mine and scrap supply. The man who I’ve dubbed the world gold community’s man of the year, seems to be hinting it could happen right now!
Stewart Thomson of Graceland Updates, Guest Contributor to MiningFeeds.com
Gold has slid during this past week on mounting fears of interest-rate hikes. Between the latest FOMC meeting’s minutes and the Fed’s annual Jackson Hole Economic Policy Symposium, American futures speculators’ rising-rate phobias have been whipped into a fever pitch. They worry gold will be crushed when the Fed eventually starts normalizing rates. But history shatters this fallacy that rising rates are gold’s nemesis.
Today there is a near-universal belief among futures traders that rising interest rates are very bearish for gold. The underlying logic is simple. When interest rates rise, so do yields on bonds and cash in the form of money-market funds. This makes bonds and cash relatively more attractive to investors than gold, which yields nothing. Therefore they jettison their gold holdings to migrate capital back into bonds and cash.
While this thesis may seem sound on the surface, it should be tested rather than being blindly accepted as truth. The financial markets are littered with popular notions that later prove dead wrong. And even the sophisticated gold-futures speculators are not immune. Late last year they scared themselves into a full-blown hysteria over the nearing start of the Fed winding down its massive QE3 bond-monetization campaign.
So they dumped gold futures in droves leading up to that dreaded event, as the mere threat of it in June 2013 battered gold to its worst quarter in 93 years. Yet the very next day after the Fed started its QE3 taper in December, gold bottomed and hasn’t looked back since. Within less than 3 months, gold had surged 16.2% on heavy buying despite ongoing tapering. Conventional “wisdom” in the markets is often mistaken.
The winding down of QE3 was a one-time event, totally unique in history since the Fed had never done such a gargantuan open-ended bond monetization before. That made it impossible to test, leaving the contrarians out on a limb betting that QE3 tapering wouldn’t prove to be gold’s apocalypse. But rising rates are far different, having happened many times in history. We just have to see how gold performed in them.
So this week I built a big spreadsheet including nearly 45 years of daily gold-price and interest-rate data. For rates I used the benchmark yields on both 1-year Treasury bills and 10-year Treasury notes, in order to represent both the short and long ends of the yield curve. The result was fascinating, shattering the popular notion today that rising rates are gold’s nemesis. That is a total fallacy proven false by history.

The past half-century or so has seen two mighty secular gold bulls interrupted by a great secular gold bear. Gold soared in the 1970s and again in the 2000s, but drifted sideways to lower for the intervening decades in between. And during the third of a century since the early 1980s, interest rates have been falling on balance as represented by these benchmark US Treasury yields. This is an exceedingly-old trend.
Right away in this high-level strategic overview, the notion that rising rates are bearish for gold and the necessary opposing corollary that falling rates are bullish for gold starts to crumble. During the mighty 1970s secular gold bull, which dwarfs today’s so far, gold surged while interest rates were rising. And then in the 1990s gold slumped while interest rates were falling. There are plenty of other similar episodes.
So American futures speculators’ staunch conviction today that gold and rates have a strong negative correlation simply isn’t true. The proof is not just visual, but statistical. Over this entire massive span, gold’s correlation with 1-year and 10-year Treasury yields merely ran -0.525 and -0.509. Multiply these by themselves to get each of their r-squares, and they weigh in at merely 27.5% and 25.9% respectively.
This means that only 28% and 26% of gold’s daily price action over the last 45 years was mathematically explainable by changing interest rates! That’s only a quarter, stunningly low in light of today’s universal belief that gold’s fortunes are slaved to rates. Thus nearly three-quarters of gold’s price action over our lifetimes had nothing to do with changing interest rates! They are a minor secondary gold driver at best.
Yes, gold’s current secular bull unfolded in a falling-rate environment. But so did gold’s multi-decade secular bear before that. Interest rates’ impact on gold prices is far more indirect and nuanced than the simplistic up-is-bearish interpretation popular today. Gold prices are dominated by global investment demand. That, not interest rates, is what investors and speculators must focus on to multiply their wealth in gold.
When the world’s investors want gold, they move capital into it which drives up its price. Depending on the magnitude of those capital inflows, this can lead to anything from a single-day rally to a decade-long secular bull. And when gold falls out of favor with investors, their selling forces its prices lower. The interest rates only materially affect gold prices indirectly through their impact on global investment demand.
And since rates have been falling on balance for a third of a century, the last time we saw a secular rising-rate environment was the 1970s. If American futures speculators are right today, gold should have been obliterated then. With yields on bonds and cash high and rising, why would anyone bother holding zero-yielding gold? But instead of crumbling, gold enjoyed its strongest secular bull in modern history!

Interest rates rose consistently throughout the 1970s, as the benchmark yields of 1-year and 10-year Treasuries reveal. And rather amazingly, gold actually had a strong positive correlation with both yields over that entire secular rising-rate span! Its 1-year and 10-year daily price correlation came in way up at +0.797 and +0.910, for r-squares of 63.6% and 82.8%. That is really high and totally contrary to expectations.
Gold was strong in 1973 and 1974 as rates rose, weak in 1975 and 1976 as rates fell, and actually soared in 1979 as rates surged! Is this what’s in store for gold during the coming first secular rising-rate environment since the 1970s? Markets are forever cyclical, and after rates fell on balance for a third of a century they are certainly overdue to rise on balance for at least a decade if not longer. Higher rates are inevitable.
So why did something so radically counterintuitive based on conventional wisdom happen during gold’s last secular bull? If investors and speculators can wrap their brains around this, they will realize that rising rates pose little threat to gold today. Provocatively, just the opposite is true. Rising rates may very well prove to be an exceedingly-bullish force rekindling vast amounts of global gold investment demand.
This heretical assertion hinges on gold being one of the leading alternative investments. These are defined as assets that are not the traditional dominant three of stocks, bonds, and cash. When stocks and bonds are thriving, investors have no need to look for alternatives. But when stocks and bonds roll over into bear markets, alternatives really start to shine. And gold has long been the king of that realm.
Rising interest rates are actually extremely bearish for stocks and bonds! As rates rise, yields on bonds including “risk-free” Treasuries climb. This makes bonds relatively more attractive compared to stocks, especially for those seeking income. And because Wall Street usually includes interest rates when measuring stock-market valuations, higher rates make stocks look more overvalued which leads to selling.
So as rising rates weigh on stocks, reducing investor demand for them, alternative investments look a lot more attractive and return to favor. If the stock selling feeds on itself enough, cyclical bear markets can form. They tend to cut stock prices in half over a couple years or so. And that’s exactly what happened in 1973 and 1974. During those two years, the flagship US S&P 500 stock index (SPX) fell by 41.9%.
So investors looked for alternatives, and flooded into gold. Their buying blasted it up 186.4% in 1973 and 1974 while short rates were surging and long rates were rising! Even though 1-year and 10-year Treasury yields averaged jaw-dropping by today’s standards levels of 7.8% and 7.2% over those couple years in the mid-1970s, investors still didn’t hide out in cash or pour vast sums into bonds. They wanted gold.
Cash wasn’t popular despite high yields because it was far-underperforming gold. Why earn 8% or less in a money-market fund when gold was blasting up 60%+ annually? Even if that number was just 15% a year, it still trounces cash. The same thing will likely happen in the next rising-rate environment. Will a 3% money-market yield, which seems unattainably high today, prove more attractive than gold itself?
Very unlikely. Since its secular bull was born in April 2001, gold has enjoyed a compound annual rate of return of +12.8% as of this week despite being relatively low and out of favor today. Compare this to the S&P 500’s mere +4.2% over that same secular span even at today’s euphoric records. When the stock markets roll over again, gold should have no problem easily achieving annual gains of at least 15%.
And just like in the 1970s, rising rates are likely to be a major driver of stocks’ next cyclical bear. Ironically the same is true with bonds. Higher yields do attract new bond investors, but only if those yields are stable. Why? Bond prices move inversely to yields. As rates rise, the prices of all existing bonds drop as sellers force them to lower levels to make their existing fixed coupons equal current market yields.
The bond markets have enjoyed one of the biggest and longest secular bulls ever witnessed over the past third of a century because rates fell on balance. But when rates start rising on balance, bond prices are going to fall for as long as rates rise. That means all investors who can’t hold every bond to maturity, including bond funds, are going to watch the principal value of their bond portfolios relentlessly drop.
They won’t want anything to do with bonds if their yields don’t handily exceed this erosion of their capital invested. Imagine the Fed hikes rates far enough to see long Treasuries yielding 7%. That is almost inconceivable after years of the Fed’s zero-interest-rate policy. If Treasuries yield 7% but bond investors are losing 5% a year in principal, their net gain is just 2%. That won’t even keep pace with inflation, of course.
So if bonds are falling and stocks are falling, why not buy gold which will be gaining double digits again year after year? Alternative investments thrive, investment demand for them soars, when traditional stock and bond markets are weak. And nothing pushes stock and bond prices lower more effectively and relentlessly than rising-rate environments. Rising rates are likely to drive capital into gold like nothing else can.
Gold was weak in 1975 and 1976 as rates fell, losing 27.8%. Why? Because the SPX shot 56.7% higher in a new cyclical-bull bounce out of the preceding cyclical bear. But soon after the stock markets stalled again in 1976, gold caught another bid. It continued powering higher in 1977 and 1978 despite rates rising relentlessly, especially on the short end of the yield curve. And both rates and gold soared in 1979.
When rates rise fast, not only does their potential downside impact on stock and especially bond prices accelerate, widespread inflation fears are kindled. And neither stocks nor bonds do well in periods of high inflation, but of course gold thrives. So if the markets wrest control of the upcoming rate rise away from the Fed, sharply higher rates are far more likely to push more capital into gold than pull money out of it.
Many traders today believe high rates killed the secular gold bull of the 1970s, but the truth is once again more complex. In less than 6 months between August 1979 and January 1980, gold skyrocketed 200.4% higher! Seeing any already-high price triple in such a short span of time is the hallmark of an unsustainable popular mania. After such a parabolic climax, gold’s bull was due to fail regardless of rates.
Bond demand didn’t surge again until rates stabilized, until investors finally believed that their principal invested would be relatively safe. And even if those ultra-high rates prematurely killed gold’s bull, way up above 16% on the short end and nearing 14% on the long end are radically above anything we are going to see in the coming years. Gold thrived in the 1970s up until 13% in both 1-year and 10-year terms.
Today’s secular gold bull that was stealthily born in 2001 happened in a far-different environment, highlighting that rates are only a secondary gold driver. Over the past 13 years or so, long rates have fallen on balance while short rates have only materially risen one time. And contrary to futures speculators’ outlooks, gold rallied while short rates surged and rallied with long rates far higher than today’s.

Since early 2001 the correlation r-squares of gold with 1-year and 10-year yields have been 43.8% and a high 76.3%. Both are based off of negative correlation coefficients. But with rates falling on balance while gold rose on balance over this span, a negative correlation was inevitable. Focusing on that high-level relationship exclusively masks the true performance of gold in high and rising-rate environments.
Between April 2001 and August 2011, gold’s latest secular-bull high, this metal powered 640% higher. This compares to a horrendous 2% loss for the SPX over that same span, by the way. But during those prime secular-gold-bull years, 1-year Treasury yields averaged 2.24% while 10-year Treasury yields averaged 4.09%. This is 22.4x and 1.7x higher than today’s levels respectively, or many rate hikes higher!
So if gold thrived so incredibly while rates were far higher, why on earth are rising rates perceived as a threat to gold at all as long as they remain below 5% or so? That was the upper range of 10-year yields during gold’s secular bull, and even of 1-year yields. And between mid-2004 to mid-2006, the Fed was on an aggressive tightening cycle. It catapulted the federal-funds rate that it directly controls from 1.00% to 5.25%!
This was a monstrous increase in a short period of time, far more extreme than what the uber-dovish Yellen Fed is expected to do in the next tightening cycle. If American futures speculators are right that rising rates are a mortal threat to gold, it should have been wrecked during that last sharp tightening. Yet this metal actually surged 56.4% higher over that 2-year span where short rates effectively quintupled!
If gold’s secular bull was strong in far-higher rates than today’s, and gold powered higher during the last steep rate-hike cycle, it seems pretty silly for investors and speculators to fear the next round of rate hikes today. Gold and everything it drives including the flagship GLD gold ETF, silver, and the stocks of the precious-metals miners are likely to thrive during the next rate-hike cycle as general stocks and bonds get hammered.
And for several reasons, the Fed’s next rate-hike cycle is likely to be exceedingly gradual. The Yellen Fed has telegraphed this, and stock traders universally expect it. If the Fed hikes rates too fast, it will risk spawning a panic-like selloff in the topping and dangerously overvalued US stock markets. And fast rate hikes risk igniting cascading bond selling too, which would rapidly catapult rates up out of the Fed’s control.
The Fed will also do everything in its power to slow the rise in rates because of the extreme US federal-debt levels. Merely normalizing short and long rates to long-term averages would literally bankrupt the United States government! Soon interest expenses to service Washington’s enormous debt would expand to eat up all discretionary government spending. There is no way the Fed will risk destroying the US government.
Contrary to popular belief, rising rates are no threat to gold. This metal soared in the 1970s during the last secular rising-rate environment as stocks and bonds got hit. Gold powered higher again in the 2000s with both short and long rates far higher than today’s levels. And gold surged during the only major modern rate-hike cycle seen a decade ago, when the Fed more than quintupled short rates.
Prudent investors and speculators study history to test popular opinion, as emotions often cloud the collective judgment of traders. What would you rather rely upon to grow your capital, someone’s mere belief or the evidence from history? American futures speculators are dead wrong today that the Fed’s coming rate-hike cycle is a mortal threat to gold. The weight of evidence strongly supports the bullish contrary view.
Sadly contrarians are hard to come by, very few people are willing to fight the herd and suffer ridicule to buy low and sell high. Yet that’s where fortunes are made, buying things like today’s precious metals that are cheap and loathed and then later selling them when popularity returns. That’s what we do at Zeal. We study the markets and share our valuable contrarian research in acclaimed weekly and monthly newsletters.
They draw on our decades of hard-won experience, wisdom, knowledge, and ongoing research to explain what’s going on in the markets, why, and how to profit with specific trades. Since 2001, all 686 newsletter stock trades have averaged stellar annualized realized gains of +22.6%! We also publish comprehensive reports detailing the fundamentals of the best stocks in key sectors. Subscribe today and start profiting!
The bottom line is the popular notion that rising rates crush gold is totally false. Gold rocketed higher in the 1970s when both short and long rates were already very high and rising. And gold soared in the 2000s when rates were far higher than today’s. It even surged during the Fed’s last major rate-hike cycle a decade ago, which was quite sharp. Rising interest rates are not gold’s nemesis, and not even a real threat.
Rising rates actually help alternative investments. They weigh on overvalued stock markets, sucking capital out of them. And they steadily erode bond investors’ precious principal. As stocks and bonds fall, investors pour capital into alternatives. Gold leads this category. So as the Fed’s coming rate hikes start popping today’s stock and bond bubbles, global gold investment demand and hence gold prices should thrive.
I recently was quoted in this interview with The Gold Report about Nulegacy Gold.
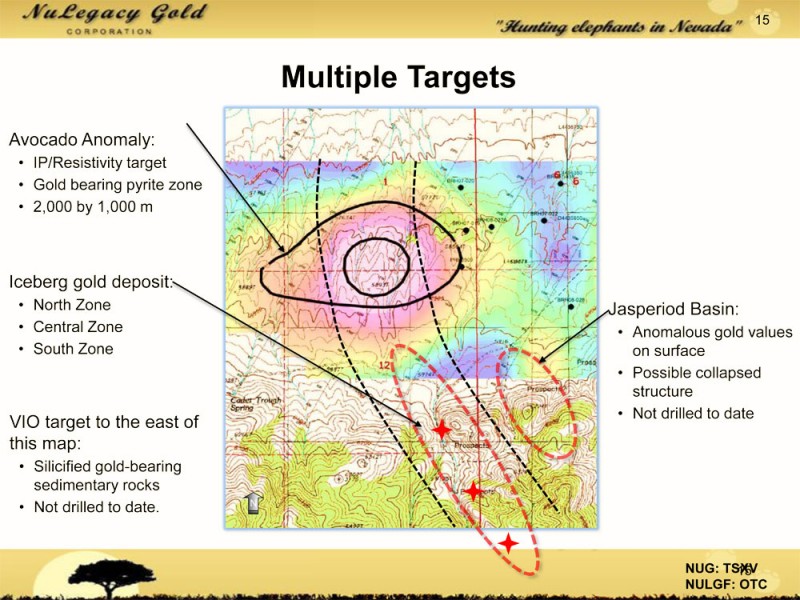
“I recently visited NuLegacy Gold Corporation (NUG:TSX.V; NULGF:OTCPK). The company is sitting next to Barrick’s Goldrush deposit, probably one of the best discoveries in the world at 15.6 million ounces (15.6 Moz) gold in all categories. The company partnered with Barrick, which is rare in the junior sector and only happened because of NuLegacy’s management’s team. COO Roger Steininger was one of the people who discovered the Pipeline gold deposit in Nevada’s Cortez Trend for Royal Gold Inc. (RGL:TSX; RGLD:NASDAQ); the project has since been purchased by Barrick. NuLegacy is beginning to outline a deposit in an area of Nevada where there are potential elephants. I’m excited to see the results of its exploration program, especially the Avocado Anomaly, throughout the summer and fall.”
Click here for reference chart.
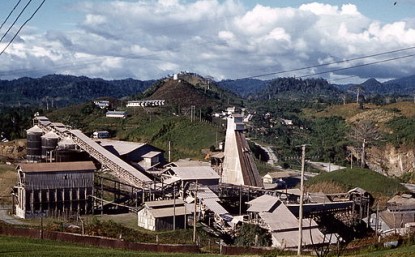
A few weeks ago I travelled to Elko, NV to visit Nulegacy Gold’s (NUG.V or NULGF) Iceberg Project on the famous Cortez Trend and Gold Standard Ventures (GSV) Railroad and Pinion Deposit on the Carlin Trend. Two legendary mining explorers led the tour Dave Mathewson and Roger Steininger. Below is a picture of me with Dr. Roger Steininger outside Barrick’s Cortez Property.

Both Dave and Roger are well known in the Nevada gold community as they both have around forty years of exploration experience in Nevada. Both of these geologists have track records of finding large and profitable mines.
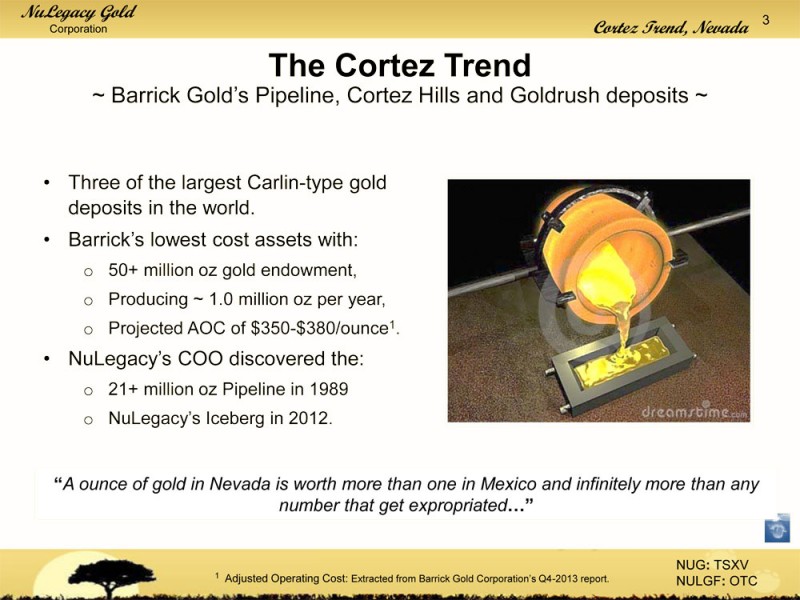
I feel really blessed to spend time learning about these deposits from the best. Dave is well known for directing Newmont’s exploration programs where he found more than 25 million ounces of gold under his leadership. Roger was instrumental in discovering many Nevada gold deposits. The most significant was the Pipeline Deposit on the Cortez Trend. Roger was critical in discovering the Cortez Trend and is one of the foremost experts on the geology.
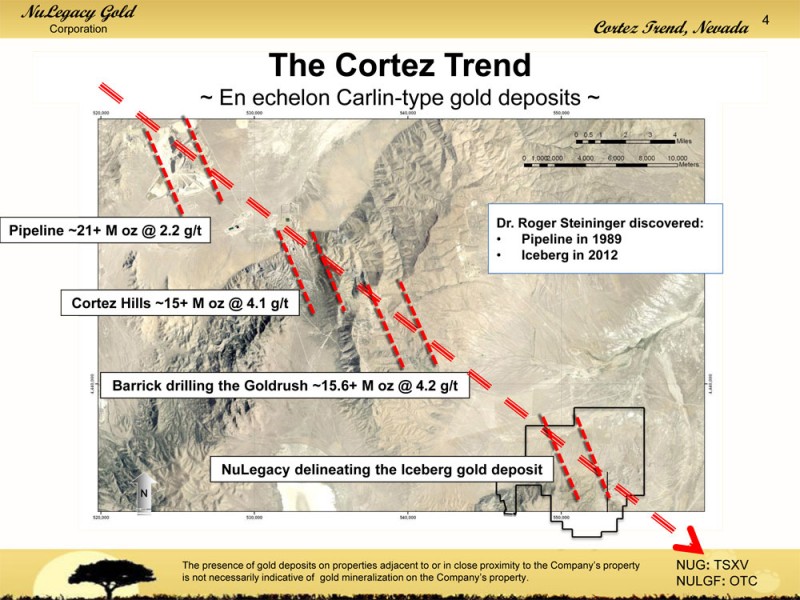
The Cortez District now hosts Barrick’s most profitable mines and exploration growth. Barrick has recently made a huge discovery called Goldrush which is only about a mile from their 1 millon ounce producer Cortez Mine. Goldrush has grown to become a 15.6 million ounce deposit.
Barrick is quickly realizing that this district is where it can make the most money and should focus investment on this area.
Barrick believes in the future growth of this district and is partnering with juniors such as Nulegacy which is managed by Roger to find additional deposits. Nulegacy’s property lies next to Goldrush on the Cortez Trend. I recently went to the property and was amazed to see their land package so close to Goldrush. This is “goldfront property”. Smart money believes they may be onto something big with Barrick as their JV Partner.
Nulegacy just announced an all equity $3.5 million financing with no warrants or fees with a private equity firm. One of the unknowns with Nulegacy was the ability to fund their portion of the partnership. Now this financing provides Nulegacy with more than enough funds to earn their 70% interest with Barrick and to expand their search for the high grade which is characteristic of these Cortez Trend Mines.
Now with this strengthened balance sheet Nulegacy can expand their exploration efforts. I believe NuLegacy is a very interesting buy as they are confirming new areas of mineralization and they are filling in the gaps between zones.
This is elephant country with deposits with 10-20 million ounces of gold. Remember Barrick produces over 1 million ounces of gold annually from the nearby Cortez Mine at an extremely low cash cost. Gold deposits are extremely profitable in this part of the world.
Barrick’s 10+ million ounce Goldrush Discovery on the Cortez Trend is literally a short walk from Iceberg.
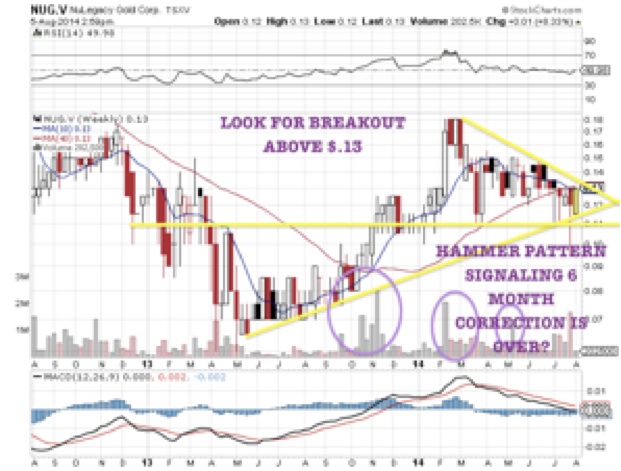
Look for a breakout above $.15 and the 200 day as investors realize that Nulegacy may be in the early stages of the next major discovery on the extremely profitable Cortez Trend.
I expect further activity and upward price movement on exploration news from the Avocado Anomaly along with a better environment for junior gold miners in the Fall. Listen to my interview with Nulegacy’s CEO James Anderson from earlier this year by clicking here…

Briefly: In our opinion no speculative positions in gold, silver and mining stocks are now justified from the risk/reward perspective.
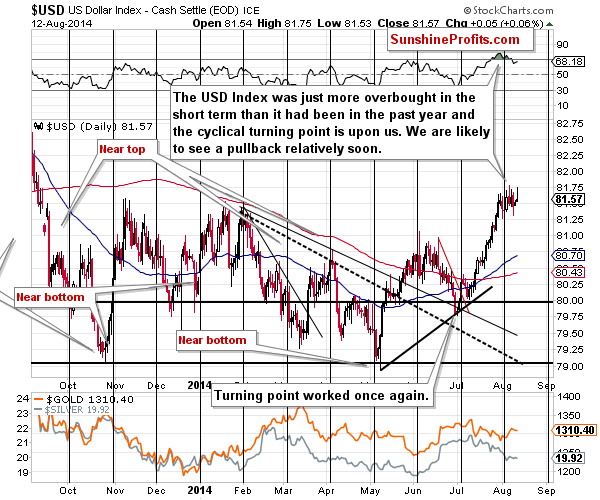
The back-and-forth trading in the USD Index ended as it pierced through the short-term resistance and also above this year’s high. As we have emphasized many times previously, the U.S. currency is after long-, medium- and short-term breakouts so the surprises should be to the upside. Consequently, yesterday’s rally was not unexpected. What was surprising was the lack of real decline in the precious metals sector. Does this mean that the USD rally won’t hurt gold and silver investors? Let’s take a closer look (charts courtesy of http://stockcharts.com.)
Click here for reference chart.
The above chart clearly shows that there was indeed a breakout. At the moment of writing these words, the USD Index is slightly above the 82 level. Is this the time to get excited about the strength of the U.S. dollar? Not really. The breakout will need to be confirmed first. We would like to see 2 additional closes above the broken resistance before we think that the continuation of the rally is very probable. It’s already probable, but the odds will increase once we see a confirmation.
Please note that the U.S. currency was strong enough not to really decline at the most recent cyclical turning point. Instead, we saw only a small local top that was followed by a consolidation. This type of flat correction is something that characterizes strong uptrends, so it seems quite likely to us that the rally will be continued. The odds will further increase if yesterday’s breakout becomes confirmed.
Consequently, the USD Index will likely put bearish pressure on the precious metals sector and once the breakout is confirmed, this will become very likely. Gold and silver are currently at a critical juncture and this pressure might be the thing that “helps metals to decide in which way to go”.
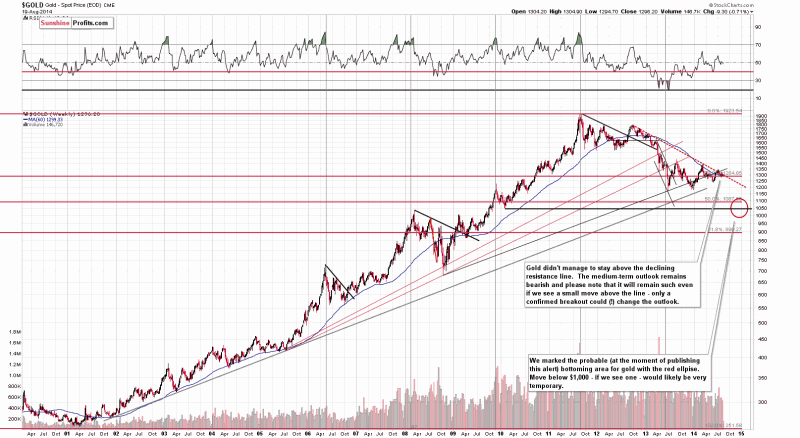
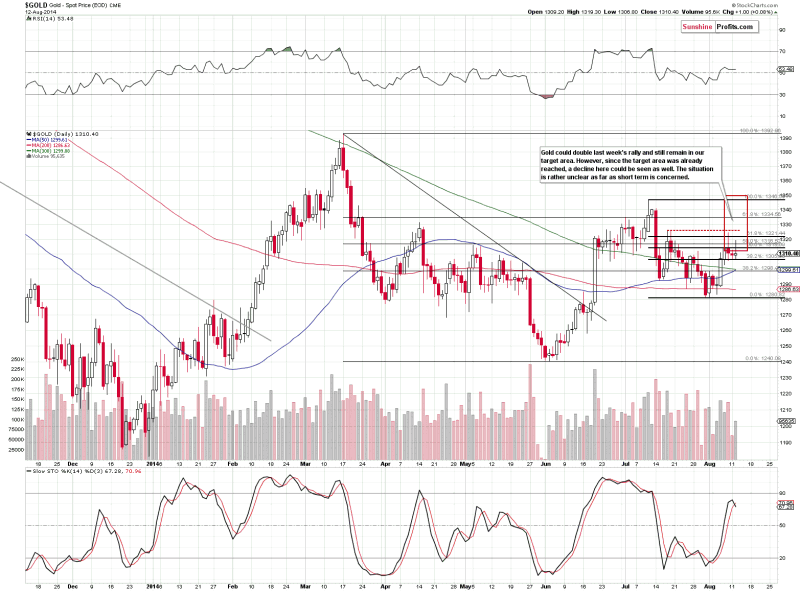
The critical juncture is created by 2 lines that we see in gold and silver. In gold, we have the declining medium-term resistance line. It was broken a few times, but only temporarily – gold moved back below it shortly. Gold would need to verify a breakout (and actually break out first) above this line before a move higher would become probable.
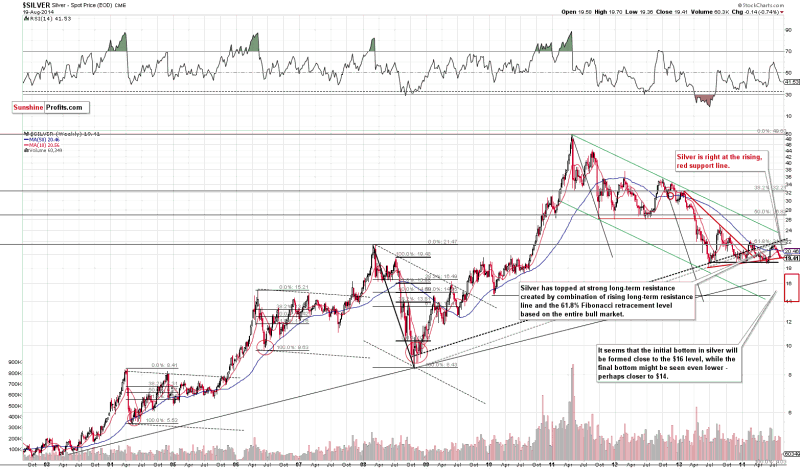
Silver, on the other hand, provides the support line. The white metal is not (yet) at its previous lows, but it’s already at the support line that is created by connecting these lows. Once this support is broken, the decline is likely to accelerate. If silver breaks below the previous lows, we could see a very sharp move into our target area. Will this happen soon? There are no certainties, but it’s becoming more and more likely that we will see this type of action in the following weeks or months.
What’s the most likely outcome for the following days? In our opinion we could see a verification of the breakout in the USD Index in the form of a pullback, which would cause a temporary upswing in gold and – especially – silver. Then the rally in the USD would continue and so would the decline in the precious metals sector. Of course, there are no guarantees, but the above is our best guesstimate at the moment.
The above-mentioned corrective upswing in metals could provide a confirmation that the big decline is about to start – for instance if we see silver’s outperformance and/or miners move higher on tiny volume.
Summing up, the situation in the precious metals market still remains too unclear to open any positions in our view, but it seems that we won’t have to wait too long before things clarify and the risk/reward ratio becomes favorable enough to open a trading position.
To summarize:
Trading capital (our opinion): No positions
Long-term capital (our opinion): No positions
Insurance capital (our opinion): Full position

Benjamin Cox speaks on the state of valuations in the metals and mining space. Currently, junior companies seem to be irrational about their project valuations, whereas majors and larger companies are liquidating decent assets at fair prices and seem to have a good grasp of what their projects are worth in today’s market. Benjamin recommends juniors look at their projects by starting at zero dollars and adding or subtracting value depending on real positives and negatives to give them a basis for evaluation. Next, when finding a buyer — due to market conditions, this is harder and harder to do — it is important to not wildly overvalue projects since potential partners will just move on. Benjamin cautions that, if there is not intelligent valuation, nothing is going to happen and those without it will be left behind.
Watch on YouTube: https://www.youtube.com/watch?v=IFeRPVGee8Q
Big North Graphite [NRT.V] [BNCIF] is a speculative small-cap graphite company that’s unique as it’s one of just a very few companies actually selling graphite in North America. Since mid-2013, Big North has sold a cumulative 1,163 tonnes of amorphous graphite from graphite projects in Sonora, Mexico. Earlier this year the company acquired the El Tejon flake graphite mine an mill in Oaxaca, Mexico. El Tejon is a past producing mine that closed in 2002 due to weak graphite prices. On August 14th the company reported very important news relating to the El Tejon Flake project. The key parts of the press release are as follows,
“An estimate of the initial investment cost required to bring Line 1 to operational status is approximately US$2.25 million which also includes infrastructure requirements, equipment and clean-up of the process plant. A total estimated investment cost of approximately US$5 million will be required to bring the process plant to full operational capability.”
“Following the visual assessment made of the process plant and its facilities during the site visit, the following general recommendations can be made. The initial objective should be the restoration of Line 1 to production status at the nominal rate of 250 t/d within a nominal period of (say) 6 months of receiving the decision for the project to proceed. The additional objective is for Line 2 to be operational within say 18 months of the project go-ahead thereby increasing the plant feed rate to 500 t/d capacity.”
I reached out to Director, Cesar Guajardo for a quote and this was his response, [Note: Please see management bios below]
“The Tetra Tech report confirms the Company’s belief that the El Tejon mill will require minimal capital and time to refurbish. The mill has always been well taken care of – both when I ran it up to 2002, and since we closed solely due to depressed graphite prices. We, as Big North Graphite, are looking forward to working with the people of San Francisco Telix again in the near future.”
Capital Requirement Tiny Compared to Peers
In my opinion, US$2.25-US$5.0 million of capital to reach 500 t/d capacity at the El Tejon flake mine and mill is a very low hurdle to clear. Further, the indicated time frames of 6 and 18 months are simply tremendous. We all know that 6 months could become 9-12 months and 18 months could become 24 months, but still, great news all around. This property is the only flake graphite mine to have produced in Mexico. The mine and mill were built in 1980 by the Government of Mexico. In 1989, a second processing line was installed to increase the capacity to approximately 4,400 tonnes per year of finished graphite. The mine was operated by the Government until 1988 and then run privately until 2002.
The question is, what’s the next bit of news to follow? Well, at some point, (timing unknown) the company will announce an off-take agreement(s) for its amorphous and/or flake graphite. That would be pretty good news. Even better would be a financing package of roughly US$2.25 million to get the first 250 t/d into production. I don’t know if either of these events are a month away or several months away, but I’m hoping both are within 6 months. Long-term investors in Big North, some of them perhaps disappointed with the lack of news flow, should be heartened by today’s news. It should be the start of the rubber hitting the road with regard to further updates and execution in getting the flake graphite mine up and running.Please let me reiterate that Big North’s flake project in southern Mexico will not be capital intensive. Many aspiring graphite players are facing the daunting task of raising upwards of a hundred million dollars and are scrambling to cut corners to bring capital costs down. Further, In my opinion, one should not assume that the next capital raise for Big North will be 100% equity. It could include one or more parts equity, debt, equipment financing and forward sales (perhaps through off-take agreements).
This could mitigate the need for significant equity dilution. Positive cash flow from the sale of flake graphite from the first line will help offset the capital costs of refurbishing the second line at El Tejon.As a past producing mine, a lot of infrastructure is already in place and the operating flow sheet is well established. The risk of restarting El Tejon is far less than the dozens of green field projects around the world, many of which are in inhospitable countries. Therefore, Big North could easily become the next small, but profitable producer of flake graphite in North America. Best of all, the company could achieve 2,500 tpy of finished product within 6-9 months and reach a run-rate of 5,000 tpy 18 months thereafter.
Back of the Envelope Valuation Exercise…
Large flake is currently selling for close to US$1,300/tonne, medium flake approximately $1,000/tonne and small flake at about $650/tonne. Based on an approximate mix of 75% medium flake, 20% large and 5% small, that’s a weighted average price of about US$1,050/tonne. Assuming an all-in cost of US$550/tonne (about US$100/tonne more than it cost to make 12 years ago) a 5,000 tonne run-rate in 2016 from two lines would yield profits of 5,000 x US $500/tonne margin = US$2.5 million. From 2017 on I expect that the company would be able to expand above 5,000 tonnes by adding an additional line, which could possibly be partially self-funded. Over-time, I believe that 10,000 tonnes of finished product per year is a reasonable expectation for profits of US$5.0 million. [Note that’s on currently depressed graphite pricing.] If graphite prices were to rise just 25%, the margin would go from US$500 to US$625 and cash flow to US$625 x 10,000 tonnes = US$6.25 million. Assuming of course that, there are customers for the graphite.
How much is US$5.0 million a year worth? Ascribing a 6x multiple to that high-margin earnings stream would value the company at about US$30 million. Big North has almost 80 million shares outstanding and a bunch of warrants and options that are almost entirely out of the money. The company has minimal debt. If the Big North were to issue 30 million new shares and exercise some of the close-to-in-the money options/warrants, the share count would be about 120 million and the per share valuation US$ 30 million x 1.1 FX rate = C$33 million divided by 120 million shares = C$0.27 per share. However, to be prudent, one needs to discount that pro-forma share price back 3 years at 12% so that the company would be valued on, “next year’s earnings.” That brings the stock price target to C$0.20 per share. At current depressed graphite prices, Big North could be worth C$0.20, about 3x the current price. [Note: This gives no valuation consideration to the company’s amorphous graphite operations of which I have too little information to value].
A Lot Can Go Wrong, But Overall Risk Appears Low Compared to Peer Green Field Projects
Make no mistake, I fully recognize that a lot can go wrong on the way to a $30 million valuation. And, I fully recognize that the $30 million figure is based on somewhat unproven inputs. However, I’m comforted by the fact that my assumptions are not that aggressive AND that Big North’s operations and growth should be relatively simple compared to green field projects in high-risk countries, locations without infrastructure or severe climates where year-round production is impossible. I’m heartened by the fact that I’m only forced to forecast 2-3 years, not 5-10 years as is the case with many other companies. Big North will have very competitive transportation advantages in Mexico and the U.S. and be able to offer security of supply and just-in-time delivery.Finally, I would like to remind investors that Big North appointed to the Board the man who knows more about El Tejon than anyone on the planet! I could go on and on about Cesar J. Guajardo’s credentials, but suffice it to say that he has amazing experience in Mexico, in graphite and with El Tejon specifically. His connections with former customers of this past producing asset and understanding of the project will substantially improve the chances of success.
Management and Director Bios
Daniel Bleak, Chairman–
Mr. Bleak has over 30 years of experience in mineral exploraJon and has developed and managed a broad range of exploraJon projects throughout North America and Mexico. He has been instrumental in the discovery of several producing mineral deposits and has developed decorative rock and industrial materials businesses in the Southwest United States and Mexico. Mr. Bleak has served on the board of directors of several companies and as an officer of a number of mining, mineral exploration and development companies.
Spiro Kletas, President & CEO, Director
Over 10 years of experience in the financial industry, with 7 years in the public capital markets, working for several Toronto Exchange listed companies in project procurement, corporate development and financing. Mr Kletas has been a Director of Big North Graphite since June 2010 and President since Dec, 2011.
Cesar J Guajardo, Director
Mr. Guajardo is a Mexican national and has been involved in the Industrial Minerals and Gases Industries for 40 years. Mr. Guajardo spent 22 years with Praxair Mexico and was the former Managing Director of Praxair Mexico for ten years. Mr. Guajardo has 18 years of experience in the graphite business. He was the former owner and Chairman of the Board of Grafito de Mexico SA de CV, a private company and the former owner of the El Tejon Flake Graphite Mine and Mill in Oaxaca, Mexico that Big North acquired and is re-starting.
Erik Ostensoe, Director
Mr. Ostensoe is a consulting geologist with more than forty years direct involvement with the mining and mineral exploration industries. He is a graduate in Honours Geology of the University of British Columbia and is a member of the BC Association of Professional Engineers and Geoscientists and the Northwest Territories/Nunavut Association of Professional Engineers, Geologists and Geophysicists. Mr. Ostensoe supervises property exploration and development projects from “grassroots” to advanced stages and provides recommendations to management of junior and medium sized public companies.
DISCLAIMER:
Mr. Epstein owns shares of Big North Graphite. This article and all articles written on MyriadEquity.com by Mr. Epstein does not represent investment advice and express his opinions only. Mr. Epstein is not a registered investment advisor. Readers should consult with their own investment advisors before considering buying or selling any securities mentioned in this article. Mr. Epstein has been retained as a consultant for Big North Graphite.

The gold stocks are almost certainly in the early stages of a major new upleg. Given the widespread apathy and antipathy still plaguing this beaten-down sector, that’s hard for most traders to swallow. But the gold stocks’ performance this year has already been outstanding. And heading into gold’s strong season, their gains should only accelerate. Gold stocks’ overdue mean reversion higher is well underway.
Gold stocks are the Rodney Dangerfield of the investment world, they get no respect. Wall Street hates alternative investments that can entice capital away from its beloved stock markets. And since gold not only dominates that category but rallies when general stocks are weak, it is all the more loathed. So it and its miners’ stocks are usually ignored and sometimes ridiculed. Gold stocks just aren’t politically-correct.
But investing is not about popularity, but profits. During gold stocks’ incredible secular bull between November 2000 and September 2011, the flagship HUI gold-stock index rocketed 1664% higher! Over that same span, the broad-market S&P 500 stock index lost 14%. Since general stocks’ secular bear was born in March 2000, the S&P 500 is up 27% as of this week. But the HUI climbed 279% during that time.
That massive gold-stock outperformance is back this year, though you will rarely hear about it on CNBC. Year-to-date, the HUI is up 25.8% despite gold only being up 8.7%. This compares to a rather pathetic 5.3% for the universally-adored S&P 500. Gold stocks have returned from the dead, fighting howling sentiment headwinds to already be one of 2014’s top-performing sectors. And gold’s strong season is just starting.
The dominant fundamental driver of gold-miner profitability and hence ultimately gold-stock price levels is of course the price of gold. Gold-mining profits leverage gains in the underlying yellow metal, often greatly. A $100 gold rally off $1300 gold isn’t big in percentage terms, just 8%. But if a particular miner was only earning $200 per ounce before that, its profits still soar by 50%. Gold stocks blast higher when gold runs.
The worst time of the year for gold is the summer doldrums, a sentiment wasteland devoid of recurring global gold-demand surges. Yet this year, gold stocks as measured by their HUI index are enjoying their best summer ever! That’s despite the Fed’s ongoing stock-market levitation continuing to suck capital and interest away from alternative investments. This outsized performance confirms this sector’s new upleg.
This first chart looks at all the HUI summers since gold stocks’ mighty secular bull’s early days in 2001. To keep the wildly-different HUI prices over the years comparable in percentage terms, each summer is individually indexed. The final trading day of May’s close, just before the market summer of June, July, and August, is set at 100. This renders every summer’s gold-stock percentage moves in common terms.

This spilled-spaghetti mess of yellow lines reveals the HUI’s summer performances between 2001 and 2013. They have a center-mass trading range between 85 to 110 indexed, from 15% below to 10% above where the HUI starts summer. The red line is the average of all these past HUI summers, which tends to drift lower during the dreaded summer doldrums. And the blue line is 2014’s summer gold-stock performance.
Gold stocks have enjoyed a record summer this year, for the majority of it the best of their entire bull! As of the middle of this week, the HUI has surged 20.7% since the end of May! That’s outstanding 4.4x leverage to gold’s 4.7% gain. No other summer has even come close in performance terms, though the gold stocks took off back in mid-August 2003. Why is capital flowing back in during this sector’s worst time of the year?
And this summer has been far more hostile than most for gold. Since early 2013, the stock markets have been levitating on the Federal Reserve’s implied backstopping. The Fed has fallen all over itself to telegraph that if stock markets fall it is ready to step up its money printing. As 2013 proved, stock melt-ups suck vast amounts of capital out of gold. American stock traders dumped GLD gold-ETF shares at epic record rates.
But despite the Fed’s ongoing artificial general-stock melt-up, the extreme differential selling of GLD has vanished this year. Its holdings have stabilized, and thus so have gold prices. Though gold has been recovering on balance in 2014, it’s sure not flying higher. Yet investors and speculators are returning to gold stocks anyway. They are betting on the super-high-potential mean reversion higher in precious metals.
This year’s resulting strong gold-stock buying has radically improved gold stocks’ technicals. And the better they look, the more traders are attracted to this sector. This next chart examines the performance of the flagship gold-stock ETF, GDX. It is a fantastic gold-stock benchmark that tracks the HUI perfectly and is directly tradable. Today’s gold-stock technicals look the most bullish they have been in years now.

Gold stocks remain so unpopular today because they plummeted in early 2013 in a gold-driven free-fall downtrend. First gold’s panic-like plunge last April, and then Ben Bernanke starting to talk about slowing the Fed’s QE3 bond monetizations in June, hammered gold and therefore gold stocks. This sector challenged 2008’s stock-panic lows last summer, which was the greatest market fear event of our lifetimes!
At the time, ominous predictions for gold stocks to continue spiraling lower indefinitely abounded. The bearishness on this sector was universal and extreme. Yet instead of dropping farther, the gold stocks stabilized. They’ve spent the entire year since then in a consolidation basing zone. After essentially a retest of their summer lows last December, capital finally started flowing back into this left-for-dead sector.
So the gold stocks have actually enjoyed a major new uptrend in 2014. And this was driven by gradual and sustained buying. That is much more sustainable and healthy than the sharp short-covering rallies seen last summer that soon fizzled out. Gold stocks’ uptrend is well-defined this year, with higher lows and higher highs. This has attracted the initial vanguard of technical traders to gold stocks, a bullish omen.
Back in March gold stocks flashed a fabled Golden Cross buy signal when GDX’s 50-day moving average crossed back above its 200dma. Golden Crosses usually signal major trend changes, the early days of large new uplegs. This is even true when the 50dma drifts around the 200dma afterwards for a spell, triggering an opposing Death Cross. But that is short-lived as another confirming Golden Cross soon arrives.
The flagship GDX gold-stock ETF broke decisively back above its 200dma in June, and hasn’t looked back despite gold’s inherent summer weakness. And a couple more critical breakouts are rapidly nearing, which will attract in many new investors and speculators. GDX isn’t far from breaking out above its uptrend resistance between $28 and $29, and its entire year-long consolidation basing zone at $30.
It’s no wonder smart traders really like these super-bullish gold-stock technicals. The gold stocks haven’t staged this long of a rally, which is really a new upleg at this point, since before their latest all-time high in September 2011! This sector’s 2014 performance is far different from that witnessed in the preceding couple of years. So contrarian investors and speculators willing to buy early and low are taking notice.
While these bullish gold-stock technicals reveal what is happening, they don’t explain why. We have to turn to fundamentals for that. A massive mean-reversion trade is just getting underway in the beaten-down gold stocks. Their prices plunged way too far relative to the price of the metal that drives their profits in 2013’s extreme gold-selling anomaly. And now they’ve started their long march back to normalcy.
This next chart looks at the most important gold-stock valuation metric, the ratio of gold-stock prices to the price of gold. Using GDX as a proxy for the former and GLD for the latter, the GDX/GLD Ratio reveals how gold stocks are faring compared to the driver of their profits. And the big GGR changes now underway offer near-ironclad confirmation that capital returning has indeed ignited a major new gold-stock upleg.

When the blue GGR line is rising, gold stocks are outperforming gold. When it is falling, the opposite is occurring. For nearly 7 years now, gold stocks have been losing ground relative to gold. Their stock prices have vastly lagged their existing profits and high potential future earnings. The duration of this trend is staggering, as the financial markets are forever cyclical. Prices never move in one direction forever.
Historically gold stocks have oscillated between periods of outperforming and underperforming gold. The longer that either trend exists, a rising or falling GGR, the higher the odds a major trend change is imminent to mean-revert out of that extreme. And the long-overdue reversal out of this 7-year trend of weak gold-stock performance has finally begun this year. And very few traders are even aware of it yet!
For almost 7 years, the GGR relentlessly falling on balance carved a strong secular resistance line. The gold stocks almost broke above it in late 2010 and early 2011, but failed. Another attempt happened in late 2012, after the gold stocks had bottomed prior to 2013’s Fed-driven anomaly leading to extreme once-in-a-lifetime gold selling. But this falling GGR secular resistance had never been seriously challenged.
Until 2014. After bottoming late last year, the GGR has spent this year basing. It is actually rising in a fledgling uptrend much like GDX’s. Gold stocks are outperforming gold again, despite the lingering poor sentiment environment. This 2014 outperformance has been so strong that it just triggered the biggest upside breakout from that GGR resistance yet. And that happened despite the fierce bearish gold headwinds!
The prudent contrarian investors and speculators fighting the herd to buy unpopular gold stocks this year are betting on this young mean reversion in gold-stock prices relative to the gold price continuing. If it does, the upside potential in gold stocks is absolutely massive. They have the potential to be the best-performing sector by far over the next year or two, thanks to the extreme magnitude of 2013’s gold-selling anomaly.
Before 2008’s stock panic, an ultra-rare once-in-a-century fear superstorm, GDX averaged 0.591x the price of GLD over the first 8 calendar quarters of GDX’s existence. That remains the baseline level for the fundamental relationship between gold-stock prices and gold in normal market conditions. But the stock panic shattered that, with gold stocks plunging way faster than gold as traders dumped everything.
GDX plummeted 71% in just over a half-year on that, crazy! And that left the GGR way down at 0.227x at gold stocks’ brutal October 2008 low. Those dismal prices were purely emotional, fundamentals had nothing to do with them. So before the dust even settled that year, I predicted a massive mean-reversion rally in gold stocks based on them being too cheap relative to gold. And that bet proved absolutely correct.
Over the next several years, GDX would more than quadruple. And the gains in the smaller higher-potential gold and silver miners we prefer to trade dwarfed those of the larger miners dominating GDX and the HUI. During the 10 full calendar quarters of that mighty mean-reversion upleg, the GGR averaged 0.419x. So that can conservatively be considered the middle of the normal post-stock-panic gold-stock trading range.
As of late 2013 thanks to the Fed’s extreme market dislocations, precious-metals sentiment was so universally and overwhelmingly bearish that the GGR slumped well below stock-panic levels to ultimately hit just 0.174x. Now if you remember the epic fear of the stock panic, the idea of gold stocks falling below those levels relative to gold was fundamentally absurd. Again they were a screaming contrarian buy.
So they started recovering relative to gold as 2014 dawned despite the ongoing stock-market-levitation headwinds cursing alternative investments. And that necessary and overdue mean reversion back up to fundamentally-reasonable gold-stock price levels compared to the gold price strengthened throughout this year. Not even the summer doldrums slowed it down considerably, which is quite amazing.
If gold-stock prices could quadruple after 2008’s stock panic, surely they were (and are) due for a similar gigantic mean reversion higher after late 2013’s sub-panic all-time-low gold-stock prices relative to gold. The upside potential from here, even after 2014’s rallying to date, is utterly massive. This week the GGR was only back up to 0.217x, still significantly below 2008’s extreme stock-panic levels! Think about that.
Even if the gold price does absolutely nothing, GDX would have to soar 93% higher from this week’s levels merely to return to its initial post-panic GGR average of 0.419x! The major gold stocks are an easy double from here, something that is exceedingly rare in these chronically-overvalued stock markets. But the potential gains of the gold stocks are much greater than that because gold itself is also powering higher.
Gold’s strong season is just getting underway, a series of major income-cycle and cultural drivers of outsized gold demand from around the world. During its entire secular bull since 2001, gold has averaged a strong 15.4% gain over this period. If gold merely enjoys an average seasonal rally this year, it will be challenging $1500 by next spring! That would equate to GLD share prices somewhere around $144.
GDX returning to its initial post-panic-average levels relative to GLD, a GGR of 0.419x, would put GDX over $60 in such a scenario. This week it was trading just above $27, so that lifts GDX’s conservative rallying potential by next spring alone to almost 120%! But gold stocks are likely to head far higher than that, as excitement and greed will come into play sooner or later in a major upleg. They are powerful forces.
It’s rare for more-mainstream investors and speculators to get excited about gold stocks, but when they do capital floods back into a very tiny sector. As of the end of last month, the HUI component stocks had a collective market capitalization of under $110b. This compares to $18,451b for the S&P 500. If even 1% of that capital starts chasing gold stocks as their mean reversion makes them hot again, they’ll skyrocket.
And there’s another major fundamental booster coming into play this autumn too. The ratio of gold-stock prices to the gold price is an unconventional valuation measure, likely to never be widely accepted in the mainstream. Instead gold stocks’ conventional trailing price-to-earnings ratios will come into focus. But over this past year, they haven’t existed due to this industry’s extreme writedowns in Q2’13.
The second quarter of 2013 was actually gold’s worst in an astounding 93 years! The gold miners were so shell-shocked by this that they scrambled to revalue their gold projects as if those super-anomalous gold prices would last forever. These writedowns were so large they dwarfed ongoing operating profits, which left most of this industry with no accounting earnings. This has masked gold stocks’ true profitability.
P/E ratios are calculated on a trailing-twelve-month basis, the last four quarters of results. So starting in last quarter’s results, those massive non-cash writedowns of Q2’13 will roll off. So the past four quarters of solid operating profits will finally translate into serious earnings. And with gold-stock prices so anomalously low, these profits will be relatively large leading to very low conventional gold-stock valuations.
So the vast pools of capital controlled by value investors will join the hardcore contrarians and technical traders already buying gold stocks, accelerating their upleg. Nothing begets buying like higher prices, and the array of factors lining up to push gold and the stocks of its miners higher today is actually unprecedented coming out of last year’s epic anomaly. What an amazing opportunity to multiply your wealth!
The sad part is most investors and speculators won’t get interested until the vast majority of the gains have already been won, when gold stocks are way higher and more exciting. Being in the financial-newsletter business for 15 years now, I’ve seen this many times and it still confounds me. The time to buy into gold stocks’ major new upleg is right now when these stocks are still very cheap, not next spring at far-higher prices.
The bottom line is the beaten-down gold stocks are almost certainly in a major new upleg. This sector has defied the fierce headwinds of the Fed’s ongoing stock-market levitation and the summer doldrums to climb considerably this year. This has led to greatly-improved gold-stock technicals as well as a key fundamental breakout relative to gold prices. And all this before gold’s strong season just getting underway!
As gold rallies in the coming months on the usual seasonal demand surges, the capital flows back into gold stocks will accelerate. Since this largely-abandoned sector is so tiny relative to the broader stock markets, it doesn’t take a great deal of buying to drive outsized gains. Now is the time to deploy in the best of the gold and silver miners ahead of that, when interest and therefore stock prices remain low.
Briefly: In our opinion no speculative positions in gold, silver and mining stocks are now justified from the risk/reward perspective.
When one looks at gold and silver prices and their moves yesterday, it might seem that nothing happened in the precious metals market. That’s far from the truth because the real action took place in mining stocks. Several weeks ago, it was miners’ strength that heralded the rally in the whole sector. Will we see one also this time? Let’s start with mining stocks (charts courtesy of http://stockcharts.com.)
Click here for reference chart.
Miners moved higher and the volume that accompanied this move was rather average. It was not high enough to confirm the direction of the move by itself, but it was not low enough for us to say that the move was fake.
The fact that miners rallied without a rally in gold or a decline of the dollar is bullish for the short term. Consequently, we plotted an additional resistance line on the chart, in case GDX moves above its July high. The next resistance is close to the $28.50 level, at the September 2013 high.
There is little to comment on for gold as far as closing prices are concerned – there was a tiny – 0.08% – move higher, practically nonexistent. The interesting phenomenon was the intra-day decline right before the markets closed in the U.S. It caused the entire day to become a daily reversal – similar to the one that we saw on Friday. These reversals are bearish signs for the short term that contradict the bullish signal from mining stocks.
Consequently, even though the situation for mining stocks improved, it overall remains unclear and, in our opinion, it is still too risky to open a speculative position here. We realize that markets and our take on this situation might seem boring, but ultimately we are not investors and traders for the excitement, but for the growth of our portfolios, and it seems to us that at this time the risk that we would expose ourselves to by opening a position outweighs the potential profits that we could make.
As far as the USD Index is concerned, we can comment on it exactly in the same way as we did yesterday.
The difference is that we are one additional day after the cyclical turning point in the USD Index and, at the same time, the index is one additional day within the horizontal consolidation pattern.
Consequently, what we wrote yesterday is not only up-to-date, but actually, the implications are a bit stronger:
The situation in the USD Index is still a bullish factor for the precious metals sector. The U.S. dollar is after a sizable rally and right after the turning point, which is likely to cause at least a small decline.
If the USD Index doesn’t decline in the next several days, it will prove the dollar’s strength. We saw a sizable rally in July and if the US dollar is able to hold these gains and only correct in a mild, horizontal way, then we will likely see another big upswing shortly. For now, the index is still close to the cyclical turning point, and thus prone to a corrective downswing.
Please note that with each passing day, the USD Index is getting further from the turning point, and the odds for a decline diminish. Another reason is that we are already seeing a consolidation pattern in the index – we are no longer “extremely likely” to see at least a pause, as we are already seeing it. The RSI indicator is once again below the 70 level, so the situation is no longer overbought on a short-term basis.
Taking all the above into account, we can summarize the current outlook in the same way as we did yesterday.
Summing up, it seems that even though the next big move in the precious metals sector is still likely to be to the downside (we have not yet seen actions that are usually seen at important bottoms, like huge underperformance of silver [what we saw this week was not huge enough], and gold is not actively hated in the mass media), the odds for a corrective rally are relatively high.
The USD Index is [still, but less with each passing day] likely to decline at least a little, which is likely to cause a rally in the precious metals sector. However, let’s not forget that the USD Index is after long-, medium-, and short-term breakouts, so this corrective downswing could be small and temporary – the next big move is likely to be to the upside. The opposite seems likely for the precious metals sector.
We plan to re-enter short positions when we see either a small rally an some kind of confirmation that the next local top is in. At this time, we prefer to say out of the market. The situation simply seems too unclear and risky to open a speculative position.
To summarize:
Trading capital (our opinion): No positions
Long-term capital (our opinion): No positions
Insurance capital (our opinion): Full position
Benjamin Cox speaks on the different stages of project review. He mentions that Oreninc currently has an intern working on project review and how this has allowed the intern to do real work. Benjamin frames the intern’s reactions to discuss the process of project review. First is euphoria, where you are magically seeing only the positives. Next is happiness (better than euphoria); further aspects are making even more sense and and, while some things aren’t working out in your brain, it is starting to look like the project could be feasible. Finally comes the reality check; the details that make the project unfeasible appear and the reality that it will have to be killed sinks in. Benjamin notes that he does not mind this and has no issues doing it even after significant man hours have been invested. After all, he concludes, it is better to kill a project early if it has a fundamental reason to be killed than to invest even more time and money into it, only to kill it anyway at a later stage.
Watch on YouTube: https://www.youtube.com/watch?v=IFeRPVGee8Q
1. Most investors buy gold because they are nervous about the financial system, government debt/bureaucracy, central bank money printing, and dangerous geopolitical developments. In a nutshell, that’s the “fear trade” for gold.
2. The fear trade is a great reason to own a core position in gold now, and forever. Gold should be the first item bought in any investment portfolio. That’s because lowest risk assets must be bought first, not the ones that appear to offer the most potential reward.
3. Ironically, it’s probably going to be the “love trade” (gold jewellery), not the fear trade, that makes the Western gold community a lot richer.
4. In late 2013, I suggested that gold would undergo a sea change in 2014. One of the main gold price drivers of the fear trade was quantitative easing (QE). Most analysts believed in “QE to infinity”. In contrast, I argued that a “taper to zero” was coming, and it would be bullish for gold. That’s what has happened.
5. My main theme for 2014 is not how high the price of gold is going, but how calm and confident investors should be about holding it.
6. Suddenly, gold community investors have a powerful and unexpected ally. Over the past month, most bank economists are quickly dropping their outrageous bearishness, and their “gold must be sold right now” rhetoric.
7. Most of the top bank analysts are now calmly rationally embracing gold stocks as assets of quality. “Barrick Gold Corporation (NYSE: ABX) was added to the prized Conviction Buy List at Goldman Sachs….” – 24/7 Wall Street News, August 8, 2014.
8. Not to be outdone, mega-bank RBC recently set a $25 target for Barrick, and gave it an “outperform” rating.
9. I’ve argued that a key leading indicator for gold is the yen. Please click here now: click here now. Double-click to enlarge this key monthly bars char.
10. All of the technical indicators and oscillators are either flashing major buy signals, or very close to doing so.
11. Forex trading is dominated by banks (commercial traders). Again, Western gold community investors may be surprised to find that the banks are allied with them. Please click here now.
12. That’s a snapshot of the COT report for the yen in November of 2011, around the time when gold and the Japanese currency both began a significant decline.
13. To view the current positioning of the banks in the yen, please click here now. The gargantuan net long position held by the banks, suggests they are anticipating a powerful rally in the yen, which I believe will be accompanied by higher gold prices.
14. What about gold itself? Well, please click here now. This hourly bars chart for gold is quite interesting. After breaking out from a bullish wedge pattern, a small head and shoulders top pattern formed. A rally above the right shoulder destroys the bearish implications of that pattern, and that just occurred early this morning.
15. Gold stock charts look solidly bullish, perhaps because of institutional liquidity flows based on bank economist recommendations. Please click here now. This daily GDX chart looks fabulous. There’s a stoker (14,7,7 Stochastics series) buy signal in play, and volume is bullish.
16. I think the growing institutional liquidity flows will push GDX to my intermediate trend target zone of $31, without much difficulty.
17. In the big picture, the recent actions of the Indian central bank to allow non-bank exporters to import gold, has likely strengthened the all-critical Indian market more than the import duty has weakened it.
18. Raghuram Rajan is probably the world’s most brilliant central banker. His superb strategy has quickly cut the Indian gold market bid-ask premiums to almost zero (from $100 – $200 an ounce), and forced the bullion banks to compete with non-banks for import volume.
19. Having said that, a cut in the import duty would simply add to the “gold bull era party” that is in play, so please click here now.
20. Nirmala Sitharaman is India’s Minister of Commerce. She doesn’t wield as much power as Finance Minister Jaitley, but she’s still a strong ally of the gold jewellery industry, which is India’s second largest employer.
21. Please click here now. The world’s most advanced gold processing facility is now in India, and mines have begun sending substantial amounts of ore there for refining.
22. LMBA certified, this refinery is a state of the art operation with 150 tons annual refining capacity, and more like it appear to be on the way. The head of MMTC says he envisions 6 -7 such operations in the coming years, handling about 1000 tons of gold annually.
23. This is a huge game changer, because these refineries could totally eliminate the need for India to import gold bars from Switzerland and other countries. The gold jewellery bull era will feature a much more direct link between the Western gold community’s mining companies and Indian jewellers, a win-win situation for all!
24. Of all the precious metal sectors, silver is the one I like in the most immediate timeframe. Please click here now. The stoker oscillator is flashing a fabulous buy signal this morning, and I’ve set a $23.50 intermediate trend target, based roughly on the 161% Fibonacci retracement line. Hi, ho, silver!
We’ve been very bullish on the miners since January but became concerned recently with the poor technical action in the metals (specifically Gold). Last month the mining indices were very close to a major breakout yet couldn’t punch through. This signaled that Gold could begin a deeper decline and the miners would be vulnerable. However, Gold failed to break below $1280 while the miners have continued to digest their early summer gains and hold support. In addition, Gold is showing increasing relative strength amid US$ strength and equity market weakness. If Gold continues to show this kind of relative strength in the weeks ahead then it raises the odds that the miners will break to the upside in September.
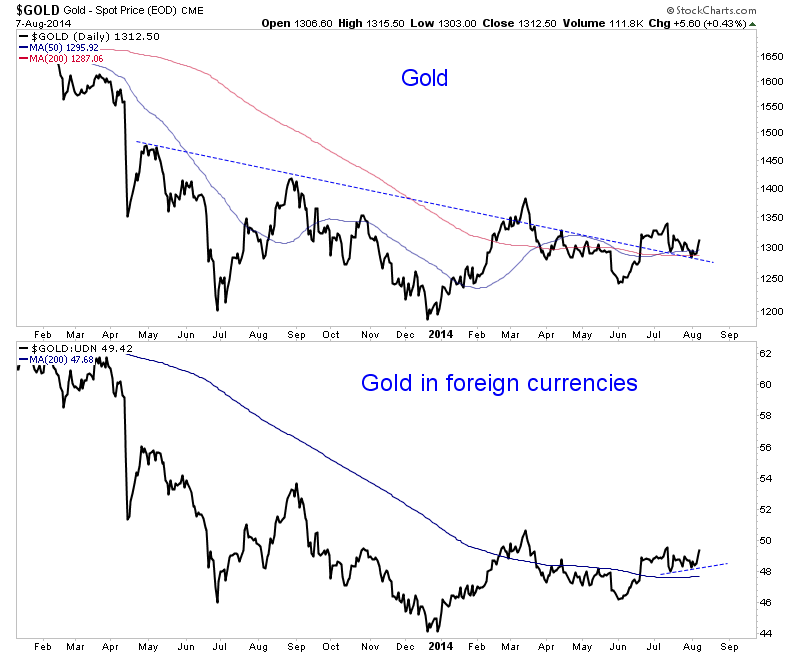
Usually I prefer to focus on the miners as they lead the metals at key turning points. However, I want to present a few charts that focus on Gold. Below we plot Gold and Gold against foreign currencies (using the UDN ETF). We see that Gold is gaining strength against foreign currencies. It’s inches away from a five month high. Moreover, during recent weakness that chart never threatened its 200-day moving average which is starting to slope upward. Gold in US$ is not quite as strong but appears to be following the other chart which made its low in mid July.
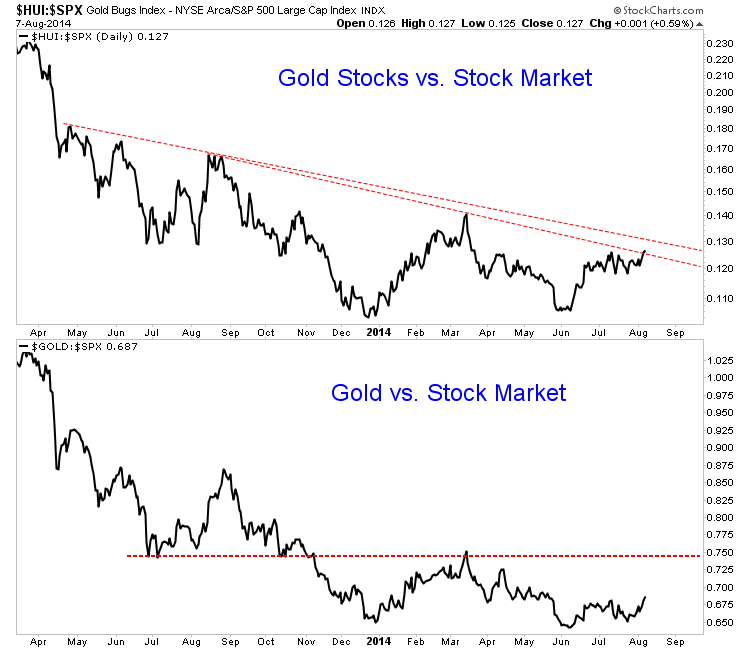
Another very important ratio to watch is Gold against the S&P 500. These two markets have had a strong negative correlation since three years ago. Whenever equities perform well it puts pressure on Gold. For many years in the 1970s as well as 2000 through 2002, Gold performed well when equities did not. We need to remember that Gold is an anti-conventional type of investment or speculation. Gold has trended sharply lower in recent years against both equities and bonds. If inflation expectations rise, capital will move out of those conventional asset classes and Gold would definitely benefit.
In the chart below we plot gold stocks against the stock market as well as Gold against the stock market. The HUI/SPX ratio closed at a five month high today. If one looks at a very long-term chart they’d conclude its possible the ratio made a double bottom in December and June. Meanwhile, the Gold/SPX ratio hit a three month high today. If that ratio advances beyond 0.75 then it’s an undeniable trend change.
Elsewhere, the gold and silver miners have held up well but remain in a consolidation. While they have bounced in recent days, odds favor more consolidation rather than an imminent breakout. Perhaps they touch resistance before pulling back. The miners, even in the bullish scenario probably need more time to consolidate and digest the very sharp gains from earlier in the summer.
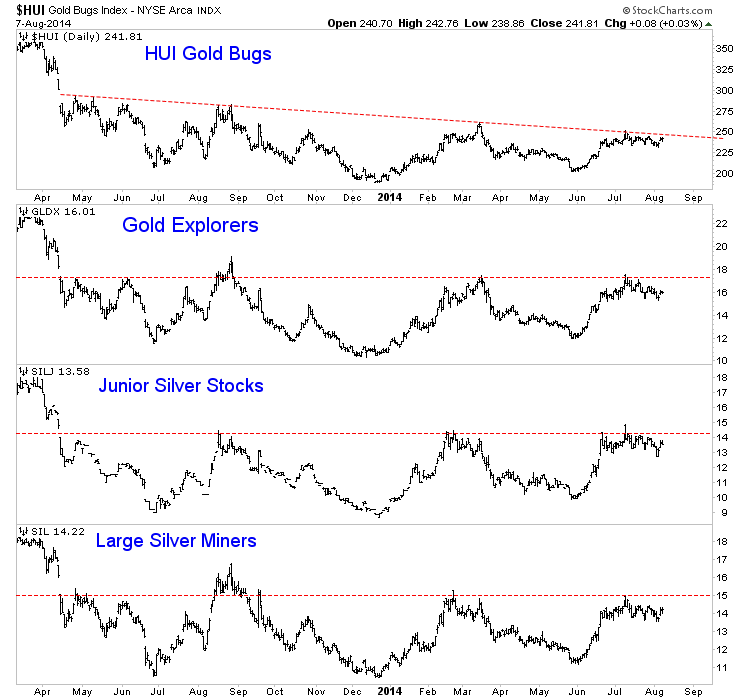
Over the coming days and weeks I’ll be watching if Gold can push above $1320 and if it can maintain its relative strength against currencies, equities and commodities. (Gold is not far from a nine month high against commodities). In addition, I want to see the miners maintain strength against the metals. While Silver has been very weak, the silver stocks (SIL and SILJ) are at 18-month highs relative to Silver.
This is a very interesting time for the precious metals complex which could be weeks away from a major breakout opportunity. Breakouts have often occurred in September so we should be patient. If the stocks break up out of their long bottoming formations then huge upside lies ahead and it will confirm that the sector is back in bull market mode. Investors won’t have to trade in and out of positions as much as they had to over the last 12 months. We are positioned with a bullish bias and ready to tweak that as we get more evidence and hints ahead of the next big move.

The mighty GLD gold ETF’s bullion holdings have remained stable in 2014, an impressive feat. Last year they suffered an epic outlying record plummet as the Fed’s stock-market levitation sucked capital out of alternative investments. This year’s resiliency in the face of the ongoing stock-market melt-up almost certainly means the bottom is in. GLD’s holdings are set to surge as weaker stock markets entice traders back.
The SPDR Gold Shares gold ETF, GLD, is a juggernaut in the gold realm. Now approaching its tenth birthday, it has grown into the world’s flagship and massively-dominant gold ETF. GLD’s impact on the global gold price can be so supreme and overpowering at times that all precious-metals investors and speculators simply have to follow it. Last year was a key case in point, where GLD trading controlled gold.
According to the World Gold Council’s latest estimate, global gold demand fell 514.7 metric tons in 2013, or 11.2%. That was enough to blast gold down 27.9% to its worst annual performance in nearly a third of a century. The problem wasn’t traditional bar-and-coin investment, which soared 31.1% higher last year to 1780.6t. Gold plunged solely because global ETF demand plummeted to negative 879.8t in 2013.
There were gargantuan liquidations of gold-ETF shares worldwide, as traders abandoned gold to chase levitating global stock markets spawned by the Fed’s implied backstopping of US equities. So American traders dumped GLD shares at a staggering pace, forcing its holdings down a radically-unprecedented 552.6t or 40.9% last year! This GLD bullion dumping alone exceeded the global drop in gold demand!
The dominant story of 2013’s downside gold anomaly was extreme gold-ETF-share differential selling, forcing their custodians to spew gold bullion faster than it could be absorbed elsewhere. And over 5/8ths of that total worldwide supply deluge came from GLD alone! There is zero doubt that without the extreme GLD-share selling, gold wouldn’t have plummeted last year. In fact, it almost certainly would have rallied.
GLD has grown so important for global gold prices because it acts as a conduit for the vast pools of US stock-market capital to slosh into and out of gold bullion. GLD tracks the gold price, so traders buy it for instant and cheap gold-price exposure. This flagship gold ETF is the easiest and most-efficient (lowest-cost) way to trade gold. But GLD-share supply and demand rarely match gold’s own supply and demand.
So in order to keep GLD tightly tracking gold, its custodians have to equalize excess GLD-share supply and demand directly into the global physical gold market. When GLD shares are being bought at a faster rate than gold itself is being bid higher, GLD threatens to decouple from gold to the upside. So its custodians issue new shares to offset the excess demand, and use the proceeds to buy more gold bullion.
But this capital link between the stock markets and gold works both ways. When American traders sell GLD shares faster than gold is being sold, like in 2013, this ETF’s price will soon break away to the downside and fail its tracking mission. So GLD’s custodians have to absorb that excess supply to keep GLD mirroring gold. They buy back all excess shares offered, raising the necessary cash by selling gold bullion.
Thus GLD’s gold-bullion holdings, which are published daily in great detail down to individual gold-bar serial numbers and weights, reveal whether stock-market capital is flowing into or out of gold bullion via this ETF. When they rise, stock capital is flowing into gold. When they fall, it is flowing out. And 2013’s extreme outflows have long since vanished, despite serious headwinds still battering gold this year.
This first chart superimposes GLD’s daily holdings in metric tons over the benchmark US S&P 500 stock index (SPX) over the past year-and-a-half or so of the Fed’s surreal levitation. After plummeting last year and crushing gold, this dominant ETF’s gold bullion held in trust for its shareholders has remained stable for all of 2014 so far. This is a very bullish portent for gold heading into its new strong season.

This chart is the key to understanding why gold plummeted in 2013. American stock traders dumped GLD shares at such extreme rates that this ETF’s custodians had to liquidate vast amounts of physical gold bullion to raise the cash to buy back the deluge of excess GLD-share supply offered. Once again this gold that GLD alone was forced to sell exceeded last year’s total drop in worldwide gold demand!
The monthly draws in GLD’s holdings are noted above, and they were relentless and sometimes utterly enormous. April 2013, when gold plummeted in an ultra-rare panic-like event, was the pinnacle. GLD shed over 1/9th of its entire gold-bullion holdings that month alone to absorb the extreme differential GLD-share selling! That was flanked by other monthly draws that were GLD’s next largest ever witnessed.
The drivers of this epic outlying record GLD-share selling are very important to understand, and have major ramifications going forward. Of course GLD was being abandoned because the gold price was falling so precipitously, which created a brutal negative feedback loop. The lower gold went, the more stock traders fled GLD, and the more the resulting ETF gold-bullion selling hammered gold even lower.
But this powerful urge to escape from gold’s downward spiral was alternately accelerated and retarded by the performance of the US stock markets. When the SPX was strong, GLD was dumped at faster rates as traders chased the flying stocks. Their euphoria temporarily blinded them to the ages-old wisdom of prudent portfolio diversification, a role that gold has always proved exceptionally effective at.
But when the SPX was weak, the rate of differential GLD-share selling slowed greatly, stopped, or even reversed! That’s when American stock traders briefly remembered how foolish it is to put all their eggs in one general-stocks basket. The light-red shaded areas above highlight the larger pullbacks of the Fed’s stock-market levitation. Note the very-different behavior of GLD’s holdings during those SPX retreats.
When the SPX surged, GLD’s holdings often plunged. But whenever material bouts of selling hit the SPX, the differential GLD-share selling all but vanished. Alternative investments are the most attractive when the headline stock indexes falter, that’s when investors realize they need them. But they are often ignored as stock markets rally. When everything is climbing, traders don’t bother looking for alternatives.
This GLD-share trading behavior that dominated the global gold market last year has huge implications this year. Gold has always had a strong inverse correlation with the stock markets, which is what makes it such an amazing investment during general stocks’ 17-year secular bears. Even as of this week, with gold still despised and general stocks adored, gold is up 359% since March 2000 compared to the SPX’s paltry 26%!
And incredibly in 2014, the Fed-driven stock-market levitation has continued. This uber-dovish Fed has continued to effectively backstop stock prices, feeding dangerous euphoria by signaling to traders that it is ready to print even more money if the stock markets sell off. This has led most traders to believe the Fed can ward off downside risk, so they continue to buy aggressively while ignoring the extreme overvaluations.
After rocketing 29.6% higher last year, the SPX was up another red-hot 7.6% this year as of its latest nominal record high in late July. And because these melting-up stock markets sucked vast amounts of capital out of gold last year, you’d think GLD’s holdings would keep plunging this year. But they sure haven’t. As of this week, GLD’s holdings are merely down a trivial 0.1% year-to-date. That’s dead flat!
After a minor bounce last August during a sharp SPX pullback, GLD’s holdings finally bottomed in a decisive way in mid-January 2014. They had plummeted a mind-boggling 42.6%, spewing 576.5t of gold supply into the global markets, since their all-time record high of early December 2012! This was so far beyond the realm of precedent that I still contend such an outlying event was impossible to predict.
GLD’s early-2014 bottoming coincided with another sharp SPX pullback, which makes sense. But thanks to Janet Yellen’s uber-dovishness, once again the stock markets’ normal and healthy sentiment-rebalancing process of correcting was short-circuited. But as the SPX started surging again heading into spring, GLD’s holdings didn’t start dropping. They actually continued growing, a sequential build.
In February and March, GLD’s holdings climbed 10.5t and 9.4t. This was their first 2-month build streak in 14 months, stock traders were finally buying GLD shares again faster than gold was being bid up. Then April’s 25.1t draw on weak gold and more SPX nominal records wiped out this progress, and GLD’s holdings slumped to a new low in late May. But it was secondary, just 1.6% under January’s initial bottom.
GLD’s holdings stabilized in May and the builds started up again in June and July. While the amount of differential buying pressure on GLD shares was modest, this was still very impressive. Not only was it in the midst of gold’s weakest season of the year, but the SPX was once again surging to even more extreme record highs. Gold’s summer doldrums plus stock euphoria was the perfect recipe for heavy GLD selling.
But it didn’t happen, stock traders have been slowly accumulating GLD shares instead of fleeing from them like last year. This means GLD selling exhaustion was almost certainly reached, and therefore the holdings bottom seen, earlier this year. The remaining GLD shareholders are likely strong hands, with no desire to exit their gold exposure which provides essential portfolio diversification. That makes lots of sense.
GLD’s holdings have averaged just under 800 metric tons this year, right where they ended 2013. The very first time GLD’s holdings surpassed 800t was back in January 2009 just after that once-in-a-lifetime stock panic. And back then, gold was only trading around $850. So theoretically ignoring churn, the great majority of the remaining GLD investors today are still likely sitting on major unrealized profits in gold.
If the very same Fed-driven stock-market levitation that sparked epic record GLD-share selling in 2013 has had virtually zero impact this year, what does that mean for gold going forward? I suspect the newfound stability in GLD’s holdings is evidence they are set to surge again. GLD ownership remains overdue for a massive mean reversion higher after 2013’s extreme selling anomaly, a super-bullish omen.
Near its latest nominal record late last month, the mighty S&P 500 component stocks had a collective market capitalization of $18,617b. Meanwhile GLD’s market cap, the value of its gold-bullion holdings, was sitting at just over $33b. Thus if the elite S&P 500 stocks are representative of American investors’ stock portfolios, they have less than 0.2% allocated to gold with GLD! That is extremely low historically.
Many battle-hardened and wise investment advisors believe a 5% portfolio allocation to gold is always important to maintain, because gold tends to move inversely to the stock markets. 0.2% is way too low, a reflection of the irrational extreme antipathy towards gold and extreme adoration towards general stocks that 2013’s anomalies bred. As the very-toppy stock markets inevitably sell off, gold will slowly return to favor.
As that happens, stock investors and speculators will feel an increasing need to up their gold exposure. The great majority will do so with GLD, since it is so cheap and easy to trade. As the vast pools of stock-market capital start migrating back into this flagship gold ETF, its custodians will be forced to issue new share supply to meet this excess demand. And all the money raised will be immediately plowed into gold bullion.
So GLD’s holdings will rise again, mean reverting out of early 2014’s extreme lows. Just as differential GLD-share selling crushed gold last year, differential GLD-share buying will greatly accelerate its next upleg. 2009 is a great example. That year a relatively small fraction of elite hedge-fund managers aggressively bought GLD shares. This pushed its holdings 45.3% higher that year, catapulting gold up 24.3%.
And stock capital returning to GLD merely to regain a trivial modicum of portfolio diversification will be marginal gold buying on top of gold’s strong season and American speculators buying gold futures to mean revert their own positions out of 2013’s extremes. Differential GLD buying pressure will supercharge gold’s next upleg, since it is in addition to all the other fundamental investment demand pushing gold higher.
This last chart looks at GLD’s physical gold-bullion holdings compared to the gold price. It highlights the radical change in the way stock traders are treating GLD shares this year compared to last year. Without the extreme differential GLD-share selling that drove the entire drop in global gold demand last year, the yellow metal is advancing again despite the stiff ongoing headwinds from the Fed’s stock-market levitation.

Gold’s woes really started in February 2013 when a crafty bear raid during the week-long Asian market holiday celebrating Lunar New Year ignited a gold capitulation. That soon cascaded, with gold plummeting initially when critical support failed and later when Ben Bernanke began talking about the Fed starting to reduce its QE3 bond monetizations. All this caused gold to plummet between last January and June.
During that time span, this metal dropped 29.1%. This was largely driven by American stock traders selling GLD shares so fast that this ETF had to liquidate 27.4% of its holdings, or 366.4t, to buy back all those excess shares offered. During that once-in-a-lifetime extreme gold anomaly, the SPX rallied by 8.1% thanks to the Fed’s implied backstop. 2013’s first half was an unprecedented disaster for gold.
Thus gold sentiment last summer was the worst it’s been in decades, with everyone loathing the metal and forecasting an imminent plunge deep under $1000. Except me, I thought it was a huge buying opportunity because a massive short squeeze in gold futures was brewing. And that proved correct, gold rallied dramatically out of its late-June-2013 lows to defy the overwhelmingly bearish sentiment.
But soon the SPX melt-up started weighing on gold again, as American stock traders dumped still more GLD shares. Thus gold slumped to a secondary low in mid-December. Between its ugly June and December lows, it merely lost 0.8% despite another 16.6% GLD holdings liquidation of 160.8t! Global physical demand could finally absorb the GLD bullion selling that had overwhelmed it during 2013’s first half.
And that was despite the SPX surging another 12.2% higher. And since that decisive December gold low, the differential GLD selling pressure has evaporated. As of this week GLD’s holdings were only down 1.4% since then, a trivial 11.1t. That was despite the SPX climbing 6.1% thanks to the Yellen Fed’s extraordinarily-reckless dovishness. Without those fierce GLD-liquidation headwinds, gold climbed an impressive 9.8%.
If gold can perform that well in 2014’s first half, just imagine how awesome it’s going to look the rest of this year. As the overvalued and overextended stock markets inevitably roll over, American stock traders are going to return to GLD and force its holdings higher. And this additional gold investment demand will be on top of futures buying and the usual major fundamental drivers during gold’s new strong season!
With GLD’s holdings set to surge again in a massive mean reversion, investors and speculators should be throwing heavily long the entire precious-metals sector. As gold’s new upleg accelerates and the resulting bullish sentiment starts feeding on itself, silver and the stocks of the precious-metals miners will amplify the yellow metal’s gains. The undervalued elite gold and silver stocks should at least quadruple!
The bottom line is GLD’s holdings are set to surge again. After plummeting last year in an extreme once-in-a-lifetime orgy of selling, GLD’s holdings have been stable this year. That’s despite the fierce headwinds of the levitating stock markets continuing to howl, and the recent gold sentiment wasteland of the summer doldrums. As these lofty stock markets inevitably sell off, stock traders will return to GLD.
Their necessary GLD-share buying to re-diversify unbalanced stock portfolios will add big marginal gold investment demand. This is on top of the usual fundamentally-driven seasonal strength starting now. And GLD’s holdings remain so anomalously low that a mean reversion to normal levels will require this ETF to buy many hundreds of tonnes of gold bullion. That will work to supercharge gold’s next upleg.
If you would like to receive our free newsletter via email, simply enter your email address below & click subscribe.
 Follow us on Twitter
 Become our facebook fan
CONNECT WITH US
Tweets
Tweet with hash tag #miningfeeds or @miningfeeds and your tweets will be displayed across this site.
MOST ACTIVE MINING STOCKS
Daily Gainers
 CMC Metals Ltd. CMC Metals Ltd. |
CMB.V | +900.00% |
 Eden Energy Ltd Eden Energy Ltd |
EDE.AX | +200.00% |
| GoviEx Uranium Inc. |
GXU.V | +42.86% |
| Eagle Nickel Ltd. |
ENL.AX | +41.67% |
| Citigold Corp. Limited |
CTO.AX | +33.33% |
| Mount Burgess Mining NL |
MTB.AX | +33.33% |
| Exalt Resources Limited |
ERD.AX | +31.94% |
| Casa Minerals Inc. |
CASA.V | +30.00% |
| Cariboo Rose Resources Ltd |
CRB.V | +28.57% |
| Belmont Resources Inc. |
BEA.V | +28.57% |


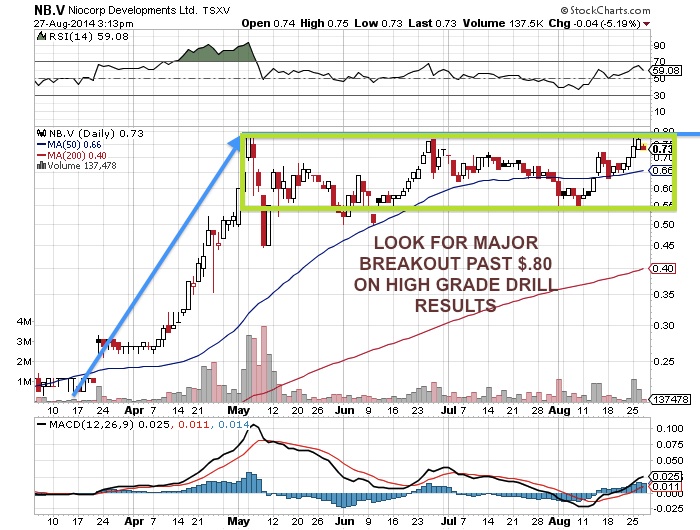
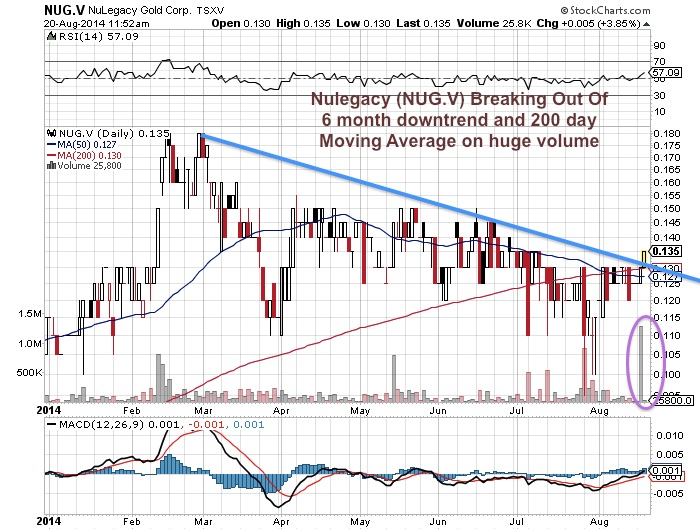
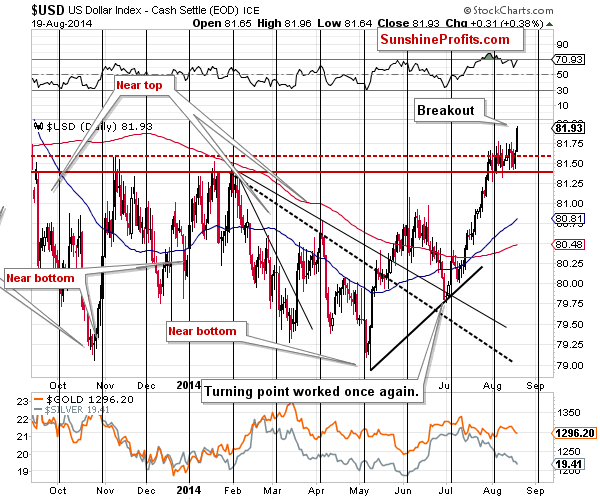
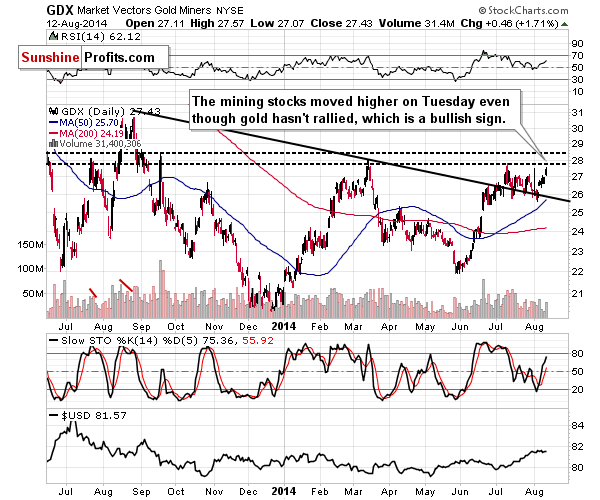