

South America has been a major beneficiary of the 2000s gold bull, party to some big discoveries by the mining companies flocking there. Some of these discoveries have already been developed, with top-three producers Peru, Brazil, and Chile for example seeing their collective gold output increase by 25% since 2001. And some are in the pipeline, with production on the horizon.
These pipeline projects come in all sizes and are scattered across the continent. Naturally there are many located within the borders of the top three. But many reside elsewhere, including such exploration hot spots as Argentina and Colombia. One of South America’s finest development-stage projects belongs not to the aforementioned major countries though. It resides in Guyana, a small sparsely-inhabited nation that many folks are unfamiliar with.
The few people who have heard of Guyana are the ones who recollect a key event in modern US history. But I’m sure the Guyanese aren’t thrilled that the event defining their country was the infamous Jonestown massacre, an ordeal that involved the only-ever assassination of an active-duty US congressman.
Also in the US, reality-TV junkies recently got familiarized with Guyana as the backdrop for a season of Discovery’s wildly popular show Gold Rush. In 2013 Guyana produced in the neighborhood of 450k ounces of gold, mostly from small-scale mines. If the artisanals could do it, so could Gold Rush star Todd Hoffman and team right?
Hoffman’s team failed miserably, producing only enough gold to pay the cab fare back to the airport. Though this failure was mostly self-induced, and entertaining, viewers did get to witness the challenges of mining in a dense tropical rainforest. Guyana’s artisanal miners, known locally as pork-knockers, must work very hard to scrape the gold out of the ground.
Guyana’s artisanal success has attracted more than greenhorns like Todd Hoffman though. It has garnered commercial attention from larger mining companies seeking to find the source deposits. These geologically savvy companies see the big picture of what Guyana has to offer. They understand the prolific Guiana Shield, and its propensity to host greenstone belts full of near-surface mineral deposits highly concentrated with gold. And most importantly, they recognize how vastly underexplored this country truly is.
Aptly named Guyana Goldfields is one company willing to take on Guyana’s challenges in order to score a source deposit. Founder and current Executive Chairman Patrick Sheridan was an early mover into this country, with his team commencing exploration back in the mid-1990s. And their watershed event was the 1998 procurement of the Aurora project.
Gold mineralization was actually discovered at Aurora over 100 years ago. It even saw a bit of mining in the middle of the 20th century, to the tune of approximately 100k ounces. But it didn’t really see any modern exploration until right before Guyana Goldfields took over.
It took several years to build up some exploration momentum considering the state of the gold market around the turn of the century. But when Guyana Goldfields hit its stride, it uncovered a 2.0km-long mineralized corridor that it dubbed the Golden Square Mile. Significant to this was the discovery of Aurora’s flagship deposit just to the east of where historical mining occurred. And in 2007 it announced a maiden resource estimate that showed Aurora to host one of South America’s largest undeveloped gold deposits.
By 2011 Guyana Goldfields had performed numerous comprehensive exploration programs that served to feed a series of positive economic studies. That same year it was able to procure a mining permit, the first large-scale gold-mining license issued by Guyana in 20 years. And within a few months it completed Aurora’s long-awaited feasibility study.
As you can see in the chart below, the markets didn’t take too kindly to the results of this study. And GUY’s stock got simply obliterated, losing a whopping 80% in less than three months to its Q2 2012 low. Though the FS indicated excellent economic potential, even management expressed their overall disappointment with the results.
Aurora was too good of a project for its operators to accept mediocrity though, so Guyana Goldfields grabbed its bootstraps and set out to improve all aspects of the proposed mining plan. As part of its efforts it revised the resource estimate, which now sits at 8.4m ounces in all categories. And it used a core portion of this tally, 3.5m ounces in the proven and probable reserve categories, to feed the updated FS that was announced in January 2013.
The results of this updated definitive study were wildly positive, showing a marked improvement over the previous iteration. And despite this announcement coming at a time of rough sailing for gold and its associated equities, Guyana Goldfields set its sights on developing its gold mine.
Affording this confidence was a buildout that more than halved Aurora’s pre-production capex requirements over the previous study. It made sense operationally too, with projected all-in sustaining costs that’ll have it producing in the lower quartile of industry average. With AISC of only $698/ounce, this mine’s after-tax internal rate of return is calculated at 25% using $1150 gold.
Making the decision to build this mine really was a no-brainer for Guyana Goldfields. Patrick Sheridan thus set the gears in motion to move forward with Aurora’s development. And this included staffing up, with the mid-2013 hires of a new CEO and a new COO who both have developmental/operational experience.
New CEO Scott Caldwell was instrumental in helping to secure Aurora’s development capex. And the first phase of the buildout (~$249m) is now fully funded using a combination of hedge-free debt and equity. Mine construction is now in full gear, and Guyana Goldfields is targeting mid-2015 for commercial production.
Per the mine plan drawn up in the feasibility study, Aurora will produce an average of 194k ounces annually over a 17-year mine life. Mining will initially occur via open-pit methods, and then an underground component will be added in 2018. It’s estimated to cost approximately $151m to develop the underground infrastructure and expand the mill. And Guyana Goldfields hopes a big chunk of this will be funded via cash flow.
As a follow-up to the feasibility study, Guyana Goldfields smartly ran an alternative mining plan in case things really got bad in the gold market. It can obviously remain profitable even at lower gold prices, but it can choose to not go forward with the underground expansion if when the time comes it would be imprudent to expend such capital.
An open-pit-only scenario would obviously reduce the mine life, but it would also reduce life-of-mine AISC since there would be less sustaining capital, which would thus raise the IRR. In this scenario Aurora would produce an average of 177k ounces annually over a 13-year mine life. Guyana Goldfields doesn’t need to make up its mind on this for now, but it’s certainly a nice option to have.
It’ll also likely have more options as it continues to advance exploration at its Aurora project. Not only are there about 5m ounces of resources not included in the mining plan, the deposits are still open in several directions and there are numerous targets that have still yet to see drilling. I suspect Aurora will easily be a 10m+ ounce project down the road.
What an opportunity investors have to take part in one of the world’s premier development-stage gold-mining projects! There aren’t many out there that are fully funded, fully permitted, and that are in line to operate profitably even at lower gold prices. And as you can see in the chart below, investors can gobble up this stock at bargain-basement prices.
This chart plots the daily prices of gold (in red) and GUY (in blue) since 2011. And as would be expected, it’s pretty ugly. Following its 2011 all-time high, gold pulled back and consolidated in healthy fashion. But for a variety of reasons, primarily the Fed-backstopped levitating stock markets, gold crumbled in 2013. This obviously crushed the gold stocks, leaving most of their 4-year charts looking very similar to this one.
Ultimately with gold oversold and the stock markets overbought, a long overdue mean reversion is on the horizon. And when gold does finally come back to life, the radically oversold gold stocks are poised to skyrocket. And the ones that will really thrive are those with quality long-life high-margin assets that’ll greatly leverage a rising gold price.
Research analysts like myself attempt to find these stocks based on their fundamental setups. And one thing that tends to support the fundamentals is recent stock performance. Guyana Goldfields has spectacular fundamentals, but how has its stock done relative to gold?
For a non-producing junior, we need to focus on the future prospectivity of its assets. If the future is bright, then investors ought to bid the stock higher on gold strength. Gold of course hasn’t been very strong lately, but it’s had four meaningful uplegs subsequent to its 2011 apex. And as you can see, GUY’s overall performance amidst these uplegs is very encouraging.
The only chink in GUY’s armor was its performance during the first upleg in early 2012. Its 20% gain to gold’s 15% only gave it 1.3x positive leverage, which is quite pitiful all things considered. To compensate/reward for their many additional risks, gold stocks need to perform way better than gold on the upside, otherwise they’re not worth owning.
Fortunately this upleg was somewhat of an anomaly, one in which most gold stocks lacked meaningful leverage. Any momentum GUY had was also short-circuited by the release of its disappointing feasibility study in February. With gold soon heading back down, investors sold this stock with reckless abandon.
With the weak hands washed out and the prospects for a better-optimized mining plan, GUY performed much better during gold’s second upleg. And its 68% gain to gold’s 15% provided the kind of excellent positive leverage (4.5x) you hope for when you buy gold stocks.
Gold’s third and fourth uplegs came after GUY’s feasibility update. And with the future a whole lot brighter, investors rushed into this stock when the metal was bid higher. Gold’s respective 18% and 16% gains were met with GUY gains of a whopping 96% and 105%, offering outstanding leverage of 5.3x and 6.5x. And though gold has failed again following its early-2014 upleg, GUY has exhibited exceptional strength as seen in an uptrend that’s held for nearly 1.5 years.
Overall Guyana Goldfields’ spring is wound real tight. And its stock is poised to launch when gold finally gets some legs. GUY will likely be an outperformer considering its stellar fundamentals. And investors have a rare opportunity to grab it at bargain-basement prices.
GUY’s ascent will be accompanied by other elite gold stocks. And considering how hated this sector still is, most of its compatriots are also trading at silly-undervalued levels. At Zeal we’ve identified some of these other elites as part of our exhaustive sector-level research. And like Guyana Goldfields, their prospects are great and their stock prices are extremely cheap.
The bottom line is one of the finest gold-mine development projects in all of South America is located in the small country of Guyana. Guyana Goldfields was one of the first movers into this underexplored gold mecca. And its expert team rewarded it with the delineation of a fantastic complex of deposits that now have 10m+ ounce potential.
Guyana Goldfields overcame some adversity in getting to its final mining plan, an operation that is now projected to have stellar economics even at low gold prices. And its Aurora mine is now fully permitted, fully funded, and under construction with a go-live target of mid-2015. Investors can snatch up this stock for cheap right now. And based on its recent behavior, it is poised to pop once gold catches a bid.

On November 17th, Continental Gold Ltd. (TSX: CNL) published a Preliminary Economic Assessment (PEA) of its development-stage Buriticá gold project in Colombia. It was a fantastic report: the mine expected to produce 4.8 Moz of gold, with annual production of 314,000 at industry-low cash costs of US$389/oz over the first five full years.
That meant that at a gold price assumption of US $1,200/oz, the Buritica project was estimated to have a post-tax net asset value discounted at 5% of US$1.08 billion and an after-tax internal rate of return of 31.5%. That’s big news in an industry that has a dearth of significant-size development projects with robust margins and low capital costs.
However, two days later, on November 19th, Mike Hocking of Scotiabank controversially called into question a number of the company’s calculations, suggesting that:
“Either the cut-off grade or the stated dilution number appears to be incorrect. The PEA news release has outlined a resource of 20.1Mt at a diluted head grade of 7.8 g/t Au and 19.4 g/t Ag at a stated COG of 3 g/t and total dilution of 58% at a nil grade. This implies that the mine plan incorporates a small subset (33%) of the total resource at a much higher cut-off grade than 3g/t used for the resource or that the mill feed has a lower quantity of dilution than the stated 58%…
If it is indeed a smaller subset of the resource we estimate that the undiluted ore tonnes total 8.4Mt at 18.6 g/t Au and 46.1 g/t Ag for 5 Moz Au and 12.5 Moz Ag, before recoveries. This implies that the remaining 16.7Mt, containing 2Moz in the resource have an uneconomic undiluted grade of 3.6 g/t Au and 16.5 g/t Ag and will not be included in our valuation, even as near term option value (i.e. on a $/oz basis).”
-Scotiabank research report dated November 19, 2014
But, unfortunately, his argument is based on a misguided understanding of what dilution is.
Leading mining analyst, Daniel Earle, from TD Securities, cleared up the confusion created in a note to clients when he detailed how companies calculate mine plans from existing resource estimates. He pointed out that with a mine plan totaling 20.1 Mt at 7.8 g/t, including 58% dilution at zero grade, the mineable resource pre-dilution would have been 20.1/(1+0.58) Mt at 7.8*(1+0.58) g/t = 12.7 Mt at 12.3 g/t and not the much smaller 8.4 Mt that Mike Hocking came up with.
Daniel Earle concluded that the PEA results did not raise questions relative to the stated resources – that is, if you get the math right.
- While it hasn’t affected gold significantly, the price of oil has fallen quite dramatically over the past couple of months, and that’s bad news for oil companies. Profit margins are shrinking and layoffs could be coming, if the situation doesn’t improve.
- If oil continues to decline, the shale oil producers could get into serious trouble, and that could send America back into recession.
- Mainstream media promotes the idea that lower oil prices are good for consumers, but most consumers are deeply in debt, and it’s questionable whether lower oil prices are going to lead to any increase in consumer spending.
- All investor eyes should be focused on the upcoming OPEC meeting in Austria. It takes place on Thursday, which is Thanksgiving Day for Americans.
- Please click here now. That’s an oil options chart from Goldman Sachs. It suggests that the price of oil will move up or down by about $3.60 a barrel, as the OPEC production decision is announced.
- Please click here now. This chart shows US oil production reaching nine million barrels a day. High prices are needed to keep that production growth in a rising trend.
- Even if OPEC were to announce a major cut in production, that would only create a further rise in US oil production, putting renewed pressure on OPEC to cut production again.
- It’s a self-defeating exercise for OPEC to keep cutting production, while America increases production. Thus, I expect only token action to be taken by OPEC this week.
- How would a failure by OPEC to cut production affect the price of gold?
- For the possible answer, please click here now. That’s the daily gold chart. Note the position of the 14,7,7 Stochastics oscillator. The lead line is near 80, suggesting the gold rally from the $1130 area lows is “long in the tooth”.
- If OPEC disappoints commodity bulls, I think gold could decline, but only modestly, to the $1170 – $1180 area, and it might do so in anticipation of the OPEC decision.
- For any market to continue to rally in a technically overbought situation like gold is entering into now, it needs a catalyst to do so. Is there such a catalyst on the horizon?
- Well, please click here now. That’s the daily chart of the US dollar versus the Japanese yen. There’s a 14,7,7 Stochastics sell signal in play, and the dollar has definitely lost upside momentum over the past week.
- In the big picture, gold has performed admirably, while both the yen and oil have collapsed.
- If the yen can begin to rally, gold could gallop higher, to the $1250 – $1255 area, even while being technically overbought.
- It’s important for Western investors not to get overly-obsessed with the fear trade for gold, and ignore the love trade. Please click here now.
- The city of Dubai has long been recognized as the “city of gold”, and rightfully so. Five hundred jewellers are now in forces to build the world’s longest piece of gold jewellery, to promote the industry.
- The love trade (gold jewellery) has always been the biggest and most consistent driver of the gold price. I don’t expect that to change, regardless of what happens in America.
- The good news is that jewellers in China, India, and Dubai are in expansion mode, and it’s clear that Western mining stock shareholders stand to reap substantial reward from the relentless growth in gold jewellery demand.
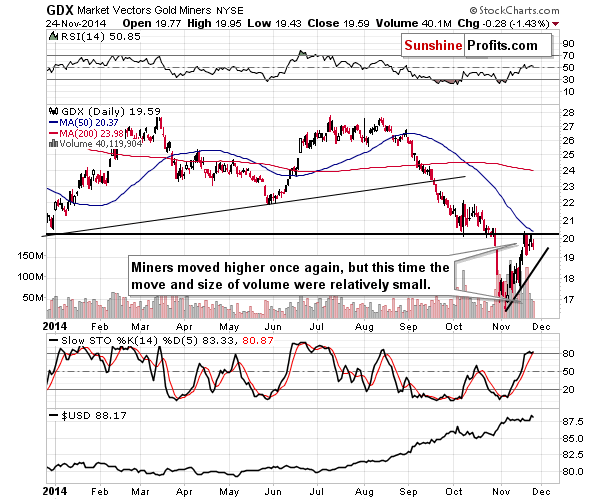
- Please click here now. That’s the daily chart for GDX. It’s performing “according to plan”. There’s clear sell-side HSR (horizontal support and resistance) in play in the $20 area, and the rally has stopped there.
- Simply put, the traffic light has turned red, and the gold stocks sports car has stopped. After a brief rest, I expect higher prices. There’s nothing I see here that is fundamentally negative for gold stocks. Nothing.
- Gold stocks are well supported by the enormous expansion in the global gold jewellery business,and so is silver. To view the daily chart, please click here now.
- Silver tends to substantially outperform gold in the later stages of a rally, regardless of whether that rally is short term or long term. A move above the black downtrend line should attract lots of hedge fund buying, and extend the rally. A two day close above $16.75, should get that job done!
Stewart Thomson of Graceland Updates, Guest Contributor to MiningFeeds.com
Briefly: In our opinion no speculative positions are currently justified from the risk/reward perspective.
Yesterday was a day when the precious metals market took a breather, but it’s not true that nothing changed at all. Friday’s breakout in platinum was invalidated. Is this a “short again” signal?
In short, not really, because this signal – even though it’s bearish – is not enough to make the situation very bearish on its own.
As usually, let’s start today’s analysis with the USD Index (charts courtesy of http://stockcharts.com.).
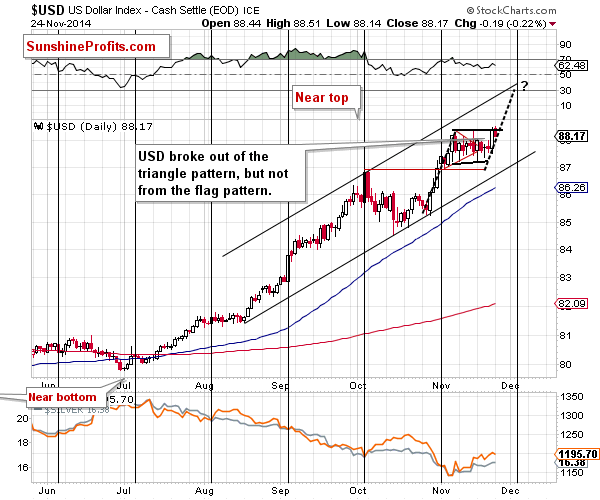
Not much changed from the short-term perspective, as the USD Index simply corrected some of its Friday’s rally and we didn’t see a breakout or breakdown from the flag pattern. Consequently, our yesterday’s comments remain up-to-date:
The USD Index moved visibly higher on Friday, breaking out of the triangle pattern. The implications are bullish but not strongly bullish, as the pattern started to resemble more of a flag than a triangle. Since the flag pattern was not broken, many traders probably thought that the situation hadn’t changed. This could explain the lack of response in the precious metals market. If we saw a strong breakout and metals didn’t react, then it would definitely be a sign of strength, but at this time, it could be the case that the market participants are still not viewing the dollar’s move as a something real.
(…)
The downside is limited in case of a breakdown, and the upside is visibly higher in case of a breakout. If we see a move similar to the one that preceded the recent consolidation, then we could see a move close to the 89 level that would materialize in the first part of December. This scenario seems quite likely also given the resistance line that would be reached (it would simply “fit”) and the cyclical turning point – we are likely to see at least a local top close to it.
We could see a small move lower before the rally starts, though. This means that the above doesn’t invalidate our previous outlook and price targets for the precious metals sector.
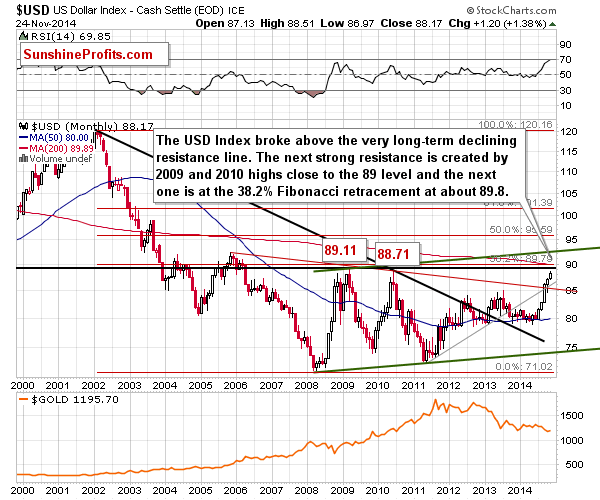
The above long-term chart should help in keeping things in perspective. As you can see, the next resistance level is very close – slightly above the 89 level. However, what’s also important is that if the USD Index moves even higher (for instance based on the expectation that the Fed will be hiking interest rates soon), it won’t be likely to move much higher, as the next significant resistance is just below the 90 level and it’s the 38.2% Fibonacci retracement level based on the entire 2002 – 2008 decline. Until the USD Index reaches at least the 89 level, the precious metals market will be likely to move lower based on the dollar’s future strength. However, if USD manages to rally to 89.8 or so and at that time gold is at one of the strong support levels, then we might consider speculative long positions in the precious metals sector. Would this be the final bottom for the precious metals market? It’s too early to say at this time – we will be looking for confirmations in other markets and ratios and report accordingly.
As basically nothing changed in the silver market (and what we wrote yesterday remains up-to-date) and changes are very similar in gold and mining stocks, we will comment on the last 2 markets simultaneously.
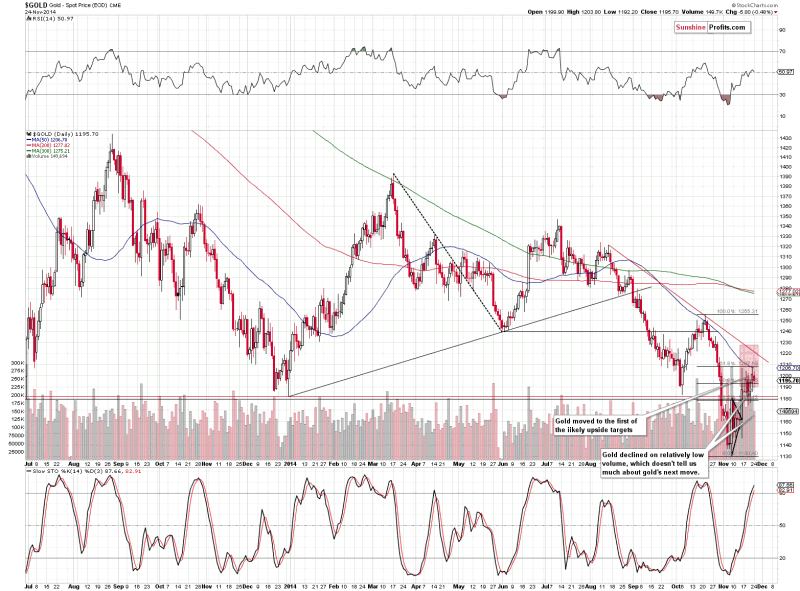
Both gold and mining stocks moved a bit lower yesterday and the move materialized on low volume. This doesn’t have meaningful implications as low volume during declines is something natural. High volume could confirm that the next decline is starting, but we saw no such thing.
Consequently, our yesterday’s comments on gold remain up-to-date:
(…) we can see that gold moved to the lower of our upside target levels. This level is created by the 61.8% Fibonacci retracement level and the 50-day moving average. The last time gold touched its 50-day MA, it was one day ahead of the top.
The implications of the above are bearish, but at this time we can’t rule out another $20 or so move higher, which would take gold to the declining resistance line.
Since gold moved higher along with the USD, we could very well see a further upswing (if the USD declines at least a bit), but if the USD breaks above the flag pattern, then gold will likely decline right away.
What about platinum?

We saw a breakout on Friday, but we warned that acting on this bullish signal might be premature, as the breakout was not confirmed:
We saw a breakout, but the continuation of the rally is still not the most likely outcome in our view. We will get a more meaningful bullish signal if this breakout is confirmed, for instance by 2 more consecutive closes above the resistance line. For now, the breakout remains unconfirmed and thus of limited significance.
Platinum turned south yesterday and the breakout was invalidated. This is a bearish sign, but as we mentioned earlier today, this signal on its own is not significant enough to make the outlook for the entire precious metals sector bearish enough for us to consider opening short positions – at least not yet.
Summing up, we have some signs that the precious metals market is topping at this time (gold at a combination of resistance levels, the GDX ETF at the 2013 low, the USD Index’s rally and platinum’s breakout’s invalidation), but without a clearer and more definitive bearish confirmation it seems that opening a speculative short position is not justified from the risk/reward perspective. For instance, gold’s, silver’s, and miners’ ability not to decline on Friday when the USD rallied strongly is a bullish sign. We are very close to the point when short positions will be justified, but – in our opinion – we are not at it just yet.
As always, we will continue to monitor the situation and report to you – our subscribers – accordingly. We will aim to multiply the recent profits and will quite likely open another trading position shortly – stay tuned.
On an administrative note, the markets in the U.S. will be closed on Thursday and we expect the trading activities to be limited on Friday as well. Consequently, we there will be no Gold & Silver Trading Alerts on Thursday and Friday. The alerts will be posted until Wednesday and will then be posted normally beginning on Monday, Dec 1.
To summarize:
Trading capital (our opinion): No positions
Long-term capital (our opinion): No positions
Insurance capital (our opinion): Full position
You will find details on our thoughts on gold portfolio structuring in the Key Insights section on our website.
We were bullish on gold as far medium-term is concerned for the vast majority of the time until April 2013. After that we have generally been expecting lower prices. Are we gold bears? No – we view this decline as lengthy, but temporary. We expect gold to rally in the coming years, but instead of following the buy-and-hold approach, we exit the long-term precious investments at the most unfavorable times and re-enter when things look good again, thus saving a lot of money. Additionally, our Gold & Silver Trading Alerts help you profit from the short-term price swings.
Disclaimer
All essays, research and information found above represent analyses and opinions of Przemyslaw Radomski, CFA and Sunshine Profits’ associates only. As such, it may prove wrong and be a subject to change without notice. Opinions and analyses were based on data available to authors of respective essays at the time of writing. Although the information provided above is based on careful research and sources that are believed to be accurate, Przemyslaw Radomski, CFA and his associates do not guarantee the accuracy or thoroughness of the data or information reported. The opinions published above are neither an offer nor a recommendation to purchase or sell any securities. Mr. Radomski is not a Registered Securities Advisor. By reading Przemyslaw Radomski’s, CFA reports you fully agree that he will not be held responsible or liable for any decisions you make regarding any information provided in these reports. Investing, trading and speculation in any financial markets may involve high risk of loss. Przemyslaw Radomski, CFA, Sunshine Profits’ employees and affiliates as well as members of their families may have a short or long position in any securities, including those mentioned in any of the reports or essays, and may make additional purchases and/or sales of those securities without notice.
Gold has suffered a rough couple of months, getting pounded below major support. One driver was stock-market capital flowing out of gold again, as evidenced by renewed differential selling pressure seen in gold-ETF shares. But this was minor compared to last year’s, despite extreme bearish sentiment plaguing gold. Gold-ETF selling exhaustion has effectively been hit, paving the way for big rebound buying.
The dominant gold ETF remains the American SPDR Gold Shares, which trades as GLD. This vehicle revolutionized gold trading for stock investors, creating a quick and efficient conduit for the vast pools of stock capital to migrate into and out of gold. And since GLD just celebrated its 10th birthday this week, it’s a great time to take another look at it. Starting from humble beginnings, GLD has matured into a gold juggernaut.
If you weren’t following the precious-metals realm back in the early 2000s, it’s hard to even imagine how different the pre-gold-ETF era was. Before GLD’s introduction in mid-November 2004 kicked it off, stock traders had no easy way to prudently diversify part of their portfolios into gold. Their only options were selling stocks to buy physical gold coins, trading gold futures, or buying gold-miner stocks as a gold proxy.
But for pure stock traders, all these posed real problems. While physical gold is awesome, buying coins is an inefficient and expensive process riddled with high premiums. Gold futures are a highly-leveraged and exceptionally-dangerous game most stock traders avoid like the Black Death. Though gold stocks can be wildly profitable, they are far riskier than gold itself due to an array of serious operational risks.
The gold ETFs led by GLD gave stock traders a cheap and easy way to bypass all these alternatives to gain direct gold-price exposure. GLD held physical gold bullion in trust for its shareholders. And all it took to buy GLD shares was a mouse click and trivial trading commissions. And even with GLD’s 0.4% annual management fee, it is still far cheaper than gold coins given the high premiums they command.
GLD was created specifically for American stock investors by the World Gold Council, the industry group funded by the world’s biggest and best gold miners. It was never intended to replace physical gold for investors, but to open up gold investing to stock traders who would never or could never (due to legal restrictions like in mutual funds) buy gold coins. Despite the silly conspiracy theories, GLD has been a great success.
And its resulting big footprint has forever altered the gold landscape. GLD is a tracking ETF, designed to mirror the gold price. But GLD’s shares trade independently of gold, leading to constant supply-and-demand mismatches. If they aren’t immediately addressed, GLD shares will decouple from gold and this ETF will fail its tracking mission. Literally the only way to maintain tracking is for GLD to act as a capital conduit.
Excess supply and demand of GLD shares from stock traders has to be quickly equalized into physical gold bullion. The mechanics of this are simple. When demand for GLD shares exceeds gold’s own, GLD will be bid up faster than gold and decouple to the upside. GLD’s custodians must step in to supply this excess share demand. They do this by issuing new GLD shares and immediately selling them.
The proceeds from expanding GLD’s share base are then plowed directly into physical gold bullion in a matter of hours. So excess GLD-share demand by stock traders effectively shunts their capital directly into gold itself, bidding it up faster and keeping GLD tracking it. Whenever GLD’s gold-bullion holdings are rising, it always means that GLD-share demand from stock traders exceeds the demand for gold itself.
But conduit ETFs are a double-edged sword. Sometimes stock traders want out of gold, and sell GLD shares at a faster rate than gold is being sold. This excess GLD-share supply will hammer GLD’s price below gold’s and cause it to decouple to the downside. That excess supply has to be quickly absorbed or GLD will fail. So its custodians immediately start buying back GLD shares to sop up the surplus offered.
They raise the capital to do this by selling some of this ETF’s underlying physical gold bullion. And that effectively pulls stock-market capital back out of gold, weighing on its price. Stated another way, excess GLD-share selling pressure is also shunted directly into gold itself. GLD opened up a major highway for stock-market capital to quickly flow into and out of gold, depending on the prevailing whims of stock traders.
When the gold miners launched GLD via their World Gold Council, they sought to address withering criticism from hardcore physical-gold-or-die conspiracy theorists by being hyper-transparent. Thus every single trading day, GLD publishes an exhaustive inventory of every single gold bar it holds in trust for its shareholders. This data includes serial numbers, refiners, weights, and purities. This week it was 863 pages long!
Having GLD’s holdings available daily is a fantastically-useful dataset, because it effectively shows whether stock-market capital is flowing into or out of gold. When GLD’s physical-gold-bullion holdings are rising, stock traders are buying gold on balance. And when GLD’s holdings are falling, stock traders as an aggregate are selling gold. Stock-market capital flows via GLD can greatly affect gold’s prevailing prices.
Differential GLD-share selling by stock traders indeed helped drive gold’s recent sharp selloff and major support breakdown over the past couple months. They dumped GLD shares faster than gold was being sold, forcing this world-leading gold ETF’s custodians to sell gold bullion to buy back the excess share supply offered. But provocatively, excess GLD-share supply was merely a minor factor in gold’s latest selloff.
Before we dig into that, strategic context is essential. Back in September 2012, gold was trading around $1750. That’s when the Federal Reserve launched its wildly-unprecedented third quantitative-easing campaign. QE3 involved the Fed conjuring paper money out of thin air and using it to buy up bonds, monetizing them. Naturally this was highly inflationary, and should have been great for gold like QE1 and QE2 were.
But curiously, QE3’s open-ended nature along with Fed jawboning about backstopping stock markets instead fomented a monster general-stock levitation. Stock traders believed the Fed would step up its money printing to arrest any significant stock-market selloff. And with this effective Fed Put, they aggressively and euphorically bought stocks while ignoring large and mounting fundamental, technical, and sentimental risks.
As the stock markets melted up last year thanks to the Fed, demand for alternative investments led by gold evaporated. Alternatives only shine brightly when conventional markets are struggling. This vexing dynamic led to a massive 22.8% gold plunge in 2013’s second quarter. This happened to be the worst quarter for gold in an astounding 93 years, an extreme once-in-a-century anomaly of epic gold selling!
This unprecedented gold mass exodus primarily came from two fronts. First was extreme futures selling by American speculators, which I’ve written a lot about. Second was extreme selling in GLD shares. Stock traders fled GLD at crazy rates, forcing it to vomit vast torrents of gold supply into the global market. And naturally heavy selling spawns a vicious circle, where lower prices drive more selling forcing prices even lower.
As the Fed-levitated stock markets melted up, GLD’s selling would increase as the desire for alternative investments and prudent portfolio diversification waned. Then when they pulled back periodically, the differential selling pressure in GLD would slow dramatically. The inverse relationship between the benchmark stock-market levels and GLD’s holdings is striking. And so was GLD’s impact on gold prices.
My chart today looks at the last couple years of GLD’s holdings with the gold price superimposed on top. Since GLD’s all-time-record holdings high in December 2012, all monthly draws and builds in GLD’s holdings are noted. And though GLD contributed greatly to gold’s once-in-a-century selling anomaly in 2013, in recent months its impact has been modest. This is actually a very bullish omen for gold going forward!

Not surprisingly, GLD’s holdings have a strong correlation with gold. When stock-market capital flows into physical gold bullion via this conduit, GLD’s holdings rise and that buying pushes gold higher. But when stock traders exit gold, their selling flowing through GLD forces this metal lower. And that’s the whole story of 2013. Extreme GLD-share differential selling spawned by the Fed’s stock-market levitation crushed gold.
The World Gold Council does the best research into global gold supply and demand. According to its latest numbers, gold demand dropped 11.1% in 2013 to 4081 metric tons. That was 509t less than 2012’s. But the largest gold-demand categories of jewelry and physical bars and coins actually grew dramatically last year, up 18.0% and 32.0% respectively. Only one category shrunk, and that was gold ETFs.
Gold demand through ETFs swung from 279t in 2012 to an astounding and probably never-repeatable negative 880t! Differential gold-ETF-share selling in 2013 added 880 tonnes of gold supply to the world markets, far more than that 509t total drop in global demand! So truly without the mass exodus of stock traders from gold ETFs, gold’s price would have actually risen last year instead of plunging by 27.9%!
And of that epic global gold-ETF selling, America’s GLD alone accounted for 553t or 5/8ths of the total. GLD is the dominant gold ETF by far, and can really impact the gold price when there are heavy supply-and-demand mismatches with its shares necessitating gold-bullion buying and selling. GLD’s holdings liquidation alone in 2013 exceeded the total drop in world gold demand, so it’s effectively solely responsible!
That epic outlying record draw was radically unprecedented. Remember that gold ETFs were only first introduced in late 2004, and GLD’s periodic draws before 2013’s extreme anomaly were vastly smaller. So the gold world had never before witnessed American stock traders pulling capital out of this precious metal en masse. Such an event was never even possible before in history before gold ETFs arrived.
While GLD’s epic draws last year were spread across every month of 2013, the second quarter was the epicenter. That quarter alone GLD’s holdings plummeted by 252t, or over 45% of 2013’s total. April 2013 alone, that month gold suffered a panic-like plunge when major support failed, saw a crazy 142.7t draw! That represented over a quarter of last year’s total GLD liquidations, the pinnacle of popular fear.
The inevitable selling exhaustion was finally hit in January 2014, following a mind-boggling 41.7% draw in GLD’s holdings of 564t over 13.2 months. Selling is always finite, there are only so many stock traders who own GLD and are susceptible to being scared into selling low. Thus GLD’s holdings stabilized this year, despite the Fed’s vexing ongoing stock-market levitation. They started grinding sideways.
Until the last couple of months that is. After seeing modest GLD holdings’ builds in February, March, June, and July, differential selling pressure resumed in September and October. The remaining stock traders owning GLD, the strong hands that weathered 2013’s extreme anomaly, were getting scared by gold’s steep selloff. This metal slumped to support in September, and then broke that key support last month.
While it’s never wise to sell into extreme lows, we can’t blame the stock traders for capitulating on gold given the extreme bearishness in recent months. As a full-time speculator, investor, researcher, and newsletter writer, I’m as deeply immersed in the precious-metals realm as anyone. And to me it sure felt like the recent gold bearishness even exceeded that of the spring of 2013 and the end of last year.
In fact fear had grown so crazy-high that gold stocks were recently pummeled to apocalyptic levels. The leading gold-stock index, the HUI, just fell to fundamentally-absurd 11.3-year lows! The last time gold stocks had traded so low, gold was merely $350. But earlier this month it was around $1150, or 3.3x higher. Gold-stock levels are a reflection of gold sentiment, and hadn’t been worse for over a decade.
So the universal fear infecting gold in the last couple months was the most extreme seen at least since its secular bull was born in April 2001. If there was ever an event to drive everyone wavering out of GLD shares, gold’s recent $1190 support break was it. Yet despite this the differential selling pressure on GLD shares remained modest. September and October only saw relatively-minor GLD draws of 25.1t and 28.7t.
For comparison, in 2013 GLD’s monthly draws averaged 46.0t! So the recent GLD-share selling was almost trivial relative to that epic extreme. Between mid-July and early November, gold’s price dropped 14.7% over 3.9 months. In that entire span, GLD’s holdings merely fell by 67.2t. There were multiple single months in 2013 that saw comparable or larger draws. GLD hasn’t been a major factor in gold’s recent selloff!
So why was gold so weak then if American stock traders weren’t to blame? Extreme selling by American futures speculators. Every week, their total gold-futures positions are revealed in the Commitments of Traders reports from the CFTC. And in the CoT-week span that most closely matches that recent gold drop, these guys dumped 36.6k long-side contracts while adding a breathtaking 74.1k short-side ones!
Some perspective is essential on these extreme numbers. Specs slashed their gold-futures longs by 14.8% in that short span, while ramping their shorts by 90.6%. Both moves resulted in heavy gold selling, at a total of 110.7k gold-futures contracts. This is the equivalent of a jaw-dropping 344.3 metric tons of gold supply unleased by American futures speculators alone! Obviously that dwarfs the 67.2t contributed by GLD.
Extreme futures shorting is the best kind of selling, as every single one of those contracts will soon have to be unwound. Speculators effectively borrow gold to sell it short in dangerous highly-leveraged bets, and they legally have to rebuy that gold soon to pay it back. So the near-record gold-futures shorting is super-bullish for gold and portends an imminent sharp short-covering rally. But back to our GLD focus here.
While American stock traders did capitulate as gold swooned to and through $1190 support, they only contributed less than 1/6th of the identifiable American gold selling. And that was in the most extreme fear-laden and hyper-bearish gold environment seen in over a decade! The modest differential selling pressure on GLD shares in light of this reinforces that selling exhaustion has effectively been reached.
Selling low is dumb, there’s no polite way to sugarcoat it. Smart investors and speculators buy low and sell high, and refuse to succumb to popular fear to do the opposite. GLD’s remaining shareholders are far stronger and smarter than the crop that abandoned gold last year. Their holdings are far more sticky, more likely to be permanent portfolio diversification rather than hot money spookable into fleeing on a whim.
Last week GLD’s holdings slumped to 720.6 tonnes, a 6.1-year low! The last time they were down here was September 2008, heading into that once-in-a-century stock panic. And gold was trading around $900. So theoretically ignoring churn, the remaining GLD shareholders are likely still sitting on nice gains in gold. Since they’ve held on this long, they are highly unlikely to join today’s irrational fear-blinded selling.
And if this proves true, GLD’s holdings have finally decisively bottomed and can only go higher. That will necessitate new stock-market capital inflows into gold via GLD. And the catalyst for stock traders returning to alternative investments led by gold will be these vexing Fed-levitated stock markets finally decisively rolling over very soon here. With gold so incredibly loathed, there is vast room for GLD buying.
As of its recent holdings low, GLD was worth about $27b. That same day, the total market capitalization of the elite S&P 500 stocks was $19,030b. If only 1% of that stock-market capital would diversify into gold, GLD’s holdings would soar by 7.1x! That equates to enough stock capital flowing into GLD to force its custodians to buy about 4400t of gold at today’s cheap prices. And 1% is really conservative in the grand scheme.
For decades if not centuries, the most prudent portfolio-construction wisdom advocated all investors holding 5% to 10% of their investable capital in gold for diversification and insurance. So seeing an overall 1% US allocation to gold as the stock markets roll over into what’s almost certain to be a new cyclical bear is a conservative projection. Alternative investments shine the brightest when conventional ones are weak.
The bottom line is the recent gold selloff was not primarily driven by American stock traders dumping their GLD shares. Though they did capitulate a bit, the great majority of the selling came from American futures speculators making leveraged downside bets on gold. The fact that stock traders largely held strong in the most bearish gold environment in at least a decade is a very bullish portent for gold prices.
With GLD’s holdings so incredibly low, there’s vast room for major stock-trader buying as gold inevitably recovers. As the Fed-manipulated stock-market melt-up starts cracking soon, investment demand for gold among American investors and speculators is going to soar. And the torrents of capital that will flow back into GLD shares will be shunted directly into underlying physical bullion, catapulting gold higher.

Gold’s reversal from $1130 to $1200 combined with sharp rebounds in the gold miners has given precious metals bulls some hope that the bottom may be in. A few weeks ago we noted that the sector was extremely oversold and a snapback rally could begin. Gold has been the tell for the bear market and a real bull market throughout the precious metals complex may not begin until Gold’s bear has ended. In this editorial we dig deeper into some things to watch as they pertain to Gold.
First we will focus on Gold’s volatility. The chart below shows Gold and two volatility indicators: the CBOE volatility index and average true range. Peaks in daily volatility have coincided with important peaks and troughs in the Gold price. Volatility declined from summer 2013 through summer 2014 before perking up as Gold declined from $1255 to $1130. Yet both volatility indicators are not close to extremes. Volatility does not necessarily need to reach an extreme to signal a bottom. However, the two biggest volatility spikes were at the 2008 bottom and 2011 peak. A sharp decline in Gold below $1100 towards major support combined with a spike in volatility could signal a major turning point.

I’m also focusing on the COT as its an excellent sentiment indicator. By some metrics (objective and anecdotal) Gold’s bear market has reached extreme territory. However, the COT is presently not at an extreme. We plot (as a percentage of open interest) the net speculative position and the gross short position. If these readings can exceed the 2013 extremes then they would be at 13-year extremes. A spike in the gross short position, while negative in the short-term provides future fuel (short covering) for a very strong rebound off the bottom.

Meanwhile, let’s not forget Gold’s relative strength. We shared the importance in a recent missive. We noted Gold’s relative strength tends to perk up before Gold itself bottoms. The chart below plots Gold against a foreign currency basket (the inverse of the US$ index) and Gold against the S&P 500. Gold is holding up well against foreign currencies but is coming to an inflection point. I don’t think its going to breakout yet but I could be wrong. Meanwhile, Gold continues to be very weak against the stock market.

Gold has been the tell for the bear market and my work leads me to believe the bottom is ahead and not behind us. Last week we noted the likelihood of a test of major support near $1000/oz rather than a bottom at an arbitrary level. In addition, Gold has yet to have a volatility spike on par with the spikes at the 2008 bottom and 2011 top. Moreover, current positioning in the futures market remains below the extremes seen in 2013. Finally, Gold has more work to do on the relative strength front before it can sustain a recovery.
All this being said, it is important to keep an open mind to various possibilities. Silver and the mining stocks are totally bombed out and we should pay close attention if they retest their lows. The weeks and months ahead figure to be enticing and exciting for precious metals traders and investors. Expect quite a bit of day to day volatility as we see forced liquidation and occasional short covering. Be patient but be disciplined. As winter beckons we could be looking at a lifetime buying opportunity. I am working hard to prepare subscribers.
No doubt this has been a tough year for commodities. A bear market like the one gold is experiencing right now hasn’t been seen since 2008. Meanwhile silver has been facing similar doldrums. And let’s not go into oil. Over the past several months, however, a bright light has emerged in the otherwise depressed commodities market. That bright light is uranium.
Over the past three years, or essentially since Japan’s Fukushima earthquake, the uranium market has faced undoubted hurdles. Japan’s earthquake and the damage this caused to the country’s nuclear program put a dark cloud on uranium. Uranium had essentially a PR nightmare, and following Japan’s earthquake in 2011, the price of the commodity dropped from $70 a pound to as low as $34.50 a pound.
November, however, was a different month for uranium, as the commodity enjoyed a fairly dramatic uptick in spot pricing. In fact, the Global X Uranium ETF reported that uranium was up 19 per cent for November and is now trading at its highest level in 18 months. The spot price of uranium as of November 19th is $44 a pound, which has put less pressure on uranium sellers.
There are several reasons for the positive news in uranium prices. One, on November 7th, it was announced that the Kyushu Electric Power Company received the okay to restart its two Sendai nuclear reactors in Japan, which will be the first reactors to be restarted since the 2011 meltdown. Clearly this announcement has helped further ignite activity in the uranium market. Second, China’s continued work in developing its own nuclear energy program will undoubtedly help to increase demand for uranium in the long-term.
But what’s been perhaps most influential in the uptick in uranium prices is the fact that prior to Japan’s announcement, several utilities made large purchases of spot uranium. In November, one U.S. utility purchased 10m pounds of uranium. To put that in perspective that represents about one fifth of the total amount of uranium that U.S. utilities purchased all of last year.
The question now is how to best interpret these facts and what are some of the other things that need to be known in order to make a comprehensive, enlightened decision on how uranium will perform in the future.
Some considerations that perhaps haven’t been given as much attention as they should:
The $65 to $70 a pound mark
The price of $44 a pound for uranium is certainly much better than when uranium was bottomed out at $28 a pound. Keep in mind, however, that we’re in the early chapters of a potential price rebound. Key indicators like the restarting of the nuclear program in Japan and the fact that many utilities long-term uranium contracts are coming to an end bode well for the commodity. Still, this is very early in what may or may not turn out to be a long-term price rebound.
What should also be considered is that in order to achieve profitability, uranium producers need a price level between $65 and $70 a pound, not $44 a pound. Without a further uptick in prices, there’s little incentive for producers to mine more uranium.
Trading so far thin and primarily on the spot market
The uranium market has enjoyed resurgence in part because utilities have re-entered the market. Many utilities established long-term, 10-year uranium contracts in 2006 and 2007. In 2007, about 92 per cent of all uranium was sold under long-term contracts. Utilities need uranium once more, which gives a reason for the utilities re-entering the market in November. That also means that many utilities will be in search of new uranium supplies over the next several years.
However, it’s important to realize that, one, thus far trading on the uranium market has been fairly thin despite the increase in uranium prices. It’s also important to understand that recent purchases of uranium have been made on the short-term spot market, with little or no change on mid or long-term uranium prices. How utility companies will be able to negotiate prices in new long-term contracts will undoubtedly play a role in how much opportunity uranium brings to investors.
The Russian X-Factor
Due to continued diplomatic tensions between Russia and the United States and Western Europe, an agreement has come to end between the United States and Russia allowing Russia to provide commercial grade uranium to the U.S. from dismantled nuclear warheads. This obviously has had an affect on uranium supply. Looking ahead, assuming tensions between Russia and the United States remain, a possibility exists that Russia could put further restrictions on their uranium supply, which of course would have an influence on future uranium prices.
It’s unfortunate that a beginning resurgence in the uranium market represents essentially one of the few highlights in the commodities this year. Be that as it may, there are many factors that play into uranium’s reversal and given the fact that long-term uranium prices remain questionable, how sustained this market reversal will be remains to be seen.
For months I highlighted that the low valuations in the junior resource space will attract large miners especially in the platinum and palladium (PGM) space which has a huge supply demand imbalance. This past week Antofagasta offered $.45 per share for junior miner Duluth Metals Twin Metals Ni-PGM deposit in Minnesota.
The Twin Metals Deposit is similar to Wellgreen’s (WG.V or WGPLF) as they are large PGM deposits in North America. Dundee put out a research note after the transaction which showed if Wellgreen was bought out at the same valuation as Duluth it would be priced at $1.85 share. Today’s price in the mid fifty cent range is quite cheap especially as we see the growing interest in Platinum and Palladium sources outside South Africa.
For many reasons I chose the Wellgreen asset over the Duluth asset. I had some concerns about permitting for Duluth whereas the Yukon is much more mining friendly. Wellgreen has much more exposure to nickel and PGM’s compared to Duluth and a much lower potential Capex. Wellgreen should be considered at these cheap levels especially in light of the recent Antofogasta purchase of Duluth.
I wouldn’t be surprised if Polymet, Stillwater and First Quantum are taking a look at Wellgreen especially as it has a lower capex. The upcoming PEA could be a huge catalyst to bring the project recognition in the eyes of the majors. They will be able to compare it to the recent benchmark of the Duluth transaction.
Wellgreen’s total in situ metal is over 19 million ounces of PGM’s and Gold in the open pit constrained resource. The overhang on the stock from previous management could soon be over and the new PEA could be quite exciting.
Disclosure: I own Wellgreen Platinum and they are a website sponsor.

As a follower and participant in the gold bull market from 2002 until now I can say unequivocally that the two most bearish periods sentiment-wise in the bull market so far are the fall of 2008, and right now. Therefore, by definition, the two most profitable times to buy gold stocks were in the fall of 2008, and right now. This simple concept is incredibly difficult for most people to understand and put into action.
The media will always lead you astray when it comes to these phenomenal buying opportunities. In early-2009 it was an incredible time to pick up just about any asset you could think of: real estate, stocks, commodities, etc. But the overwhelming mood on TV and the Internet back then was bearishness at that epic buying opportunity. My second favorite glaringly wrong example from the media was the end of 2012 when the media was petrified of the fiscal cliff. For a month straight in December 2012 that’s all you heard on CNBC, how the fiscal cliff was going to be terrible for stocks in 2013. But it turns out 2013 was an awesome year for stocks, and the bears in the media were 100% wrong.
What do early 2009 and late 2012 have in common? Both were the ends of periods that were bad for the markets. In 2009 of course it was the end of the epic stock market meltdown, and in 2012 it was a two year period from 2011-2012 where stocks didn’t make a lot of head way. Instead of being bullish at the bottom though the media extrapolated these negative periods out into the future and predicted more bearishness to come. The media is always focused on the short term and in sensationalizing whatever is happening right now. This puts way too much emphasis on the current state of the market and forgets the cyclical nature of the market over the long term. So at the turning point in long term cycles they are always going to be 100% wrong and look foolish.
You can’t listen to the average money manager these days either because like the media they are controlled by the tyranny of the present. They are slaves to quarterly performance, beating benchmarks, and siphoning profits from their customers who will go away if they lose money in the markets. Therefore they can’t be involved in getting in too early in a bear market and sustaining losses over a long period of time. That will ruin their business prospects for the future and they will avoid that whenever possible.
I personally believe what we saw at the end of October was the capitulation of professional money managers who had assets in gold and gold stocks. They finally threw in the towel at a key tax loss selling time of the year and decided to get out of gold and gold stocks. The evidence for this is the surge in volume across gold and gold stocks and massive losses over a short period of time. That usually only happens when the big money gets out all at once. But they are human like everyone else. And combined with the fact that their actions are way more affected by short term performance, it’s not surprising that we see massive liquidations of positions at the bottom of a trend, even by the “pros”.
Let’s talk about the life changing opportunity that those that are tied to the present are completely oblivious. Gold stocks are now at the tail end of a 4-year bear market if you go by the XAU gold stock mining index. Four year bear markets are typically brutal in gold stocks and this is one of the most brutal yet. But we know from the chart below that due to the cyclical nature of markets in general and of the gold market in particular, that what we should expect next is a bull market. And if its a bull market in gold stocks it should offer big gains.

Even during the secular bear market in gold from 1980-2000, the gold market went through cyclical bull markets that offered big gains for gold stocks. The 1993-1996 bull market is shown above and offered more than a 100% gain even though the secular trend for gold at that time was down.
Now starting in 2001 gold had shifted into a secular bull market which caused the bull market in gold stocks that launched in 2001 to be spectacular. This bull leg offered more than a 5-bagger for the XAU and even bigger gains for individual gold stocks. Then we got the 2008 meltdown, which produced the next epic buy point for gold stocks and a 3-bagger bull market. It was incredibly painful to buy at the depths of that 2008 bear market. But not only was there a 3-fold gain in the XAU, some of the individual returns on specific mining stocks during that period dwarfed anything else in the entire stock market. Silver Wheaton and First Majestic Silver are two stocks that come to mine that had 20-baggers from their 2008 lows.
I personally didn’t believe we would get another opportunity like 2008 in this gold bull market but here it is, staring us right in the face. And I think the prospects for this next bull run are truly mind boggling if you think about all the money that is going to come flooding back into this sector when the secular bull resumes.
Justin Smyth of Next Big Trade, Guest Contributor to MiningFeeds.com. Connect with him on Twitter: @nextbigtrade

On October 29th, Lake Shore Gold Corp. (TSX: LSG) reported their third-quarter financial results, boasting continued strong production and financial performance, with a 58 per cent increase in gold production and and a 15 per cent improvement in cash operating costs from the same period last year, among other highlights.
Lake Shore Gold’s CEO and President, Tony Makuch, commented in the company’s news release:
“Q3/14 is our fourth consecutive quarter of generating net free cash flow, a period during which our cash and bullion has increased by over $50 million. We have achieved solid production growth year over year, and are one of the lowest cost producers within our industry. Total cash costs per ounce sold were US$594 in Q3/14 and US$588 in 9M/14, while all-in sustaining costs averaged US$858 per ounce in Q3/14 and US$861 per ounce year to date.”
Several days prior to announcing their third-quarter operating performance, Lake Shore Gold was in the news with another company milestone – the successful results of its mineralization extension of 48 holes at its Timmins West Mine, which confirmed “… the presence of elevated gold values and [which] identified opportunities for extensions and new areas of gold mineralization [at the S2 Fold Nose in its Timmins West Mine].” Growing its resource base and extending its mine life is a critical focus for the company.
Taking a look at Lake Shore Gold’s performance over the past year, one can see that since mid-Q3 2013, the company, which is currently generating free cash flow and has been since Q4 2013, is making a strong case for sustained positive turnaround in operations.
As brief background, Lake Shore Gold is a major gold producer with exploration and development operations centred in the Timmins Gold Camp in northern Ontario, Canada. The company owns and manages two operating mines – Timmins West and Bell Creek – and a central mill, the latter of which underwent a large expansion in October 2013. The mill expansion ended up coming in at over 3,000 tpd, outpacing its nameplate capacity.
Lake Shore’s 50% throughput expansion completed in Q3 2013 can be seen as a genuine turning point in a company that’s historically been an underperformer, a point that’s allowed Lake Shore to generate strong free cash flow from Q4 2013 onward and that’s brought the company out of balance sheet issues.
The subject of Lake Shore’s balance sheet issues. 2013 also signaled the successful restructuring of $35mm in revolving debt, which Lake Shore is to re-pay to Sprott Resource Corp. (TSX: SCP.TO) by January 2015. In December 2013, Lake Shore modified its lending agreement with Sprott Resource and was able to extend its $35mm in revolving credit to November 2016, a move that removed significant stress on Lake Shore stock.
At the end of December 2013, Lake Shore Gold successfully re-paid $5mm of its debt to Sprott Resource, reducing their owed principal to $30mm. Following this, in June of this year, given Lake Shore’s strong operating results and growing free cash flow, the company announced that it had re-paid $10mm of its debt to Sprott Resource, reducing its principal owed to $20mm.
As mentioned, Lake Shore Gold has historically been considered an underperformer, with most analysts covering the stock rating Lake Shore Gold as a SELL. More recently, in December 2013, given Lake Shore’s measurably improved operating performance and its signal of genuine turnaround in operations, one broker updated Lake Shore’s stock from SELL to HOLD. As a sign of sustained and further improved operational output, in June 2014, two of the three banks covering Lake Shore revised their stock to HOLD, with one remaining at a SELL position.

Daniel Earle, who serves as Vice President and Director at TD Securities in Toronto, has provided in-depth analysis on the mining sector and precious metals for TD Securities since 2007, and has been a notable exception among the other analysts covering Lake Shore Gold.
Mr. Earle began covering Lake Shore Gold in August of 2008 and in June 2013, when the LSG stock hit a low of $0.16, Mr. Earle upgraded his recommendation of Lake Shore to a BUY, with a $0.70 target.
Since that time, Daniel Earle’s coverage has continued to be on key with the operational turnaround seen at Lake Shore Gold since the completion of its mill expansion in Q3 2013.
In August 13th, 2013, for example, Mr. Earle provided the following coverage for Lake Shore Gold:
“We believe the company is well positioned to achieve production guidance this year and together with a forecasted decline in capex over the second-half of the year, we believe sustainable free cash flow can be realized starting in Q4/13, marking a major turning point in the company’s history, in our view.”
On October 9th, 2013, Mr. Earle offered continued company coverage, stating:
“We would suggest that the company [Lake Shore Gold] has achieved an operational turnaround and that is a major breakthrough for the company.”
This was a prescient call, especially given that as of this quarter, with 9M 2014 production of 142.5 kozs and cash costs of US$588/oz (AISC of US$861/oz), Lake Shore Gold is on-track to beat its full year guidance of 160-180 kozs at US$675-US$775/oz (AISC of US$950-US$1050/oz). Moreover, this year, Lake Shore increased its cash and bullion by approximately $14mm in Q3 2014 to $67mm ($62mm in cash and $5mm in bullion), while repaying approximately $4.1mm of debt to Sprott Resource in Q3 2014
Given Lake Shore Gold’s sustained improved performance output through to the third quarter of this year, Mr. Earle remains at a BUY for Lake Shore Gold, while some other brokers have stubbornly maintained their SELL ratings as the stock has more than quadrupled in value.
There is no doubt that the current depressed precious metals sector will play its role in how Lake Shore performs for the rest of the year and into Q1 2015. However, the key point to consider is that Lake Shore’s recent exploration efforts have proven justified; moreover, the company operates on a free cash flow basis and remains able to aggressively re-pay its line of credit to Sprott Resource. All this bodes well for the stock, and with continued strong performance from the company, Lake Shore Gold’s stock will increasingly prove an attractive buy opportunity.

In a recent landslide election, Republicans took back control of the Senate and House. President Obama’s approval rating is very low. Although there a few making money in the stock market, the majority of the American people are fed up with close to 100 million people not working. Welfare and entitlement spending is out of control. The debt is still soaring close to $20 trillion and the dollar is rising making it even harder for politicians and banks to avoid default.
Somehow irrationally despite billions of dollars being printed under the guise of QE, the US dollar is rising. The question is how long do you really believe this dead cat bounce in the US dollar will last?
It may be just a bounce in a long term downtrend and is only relative to the other fiat currencies in fast decline. Smart investors should be accumulating gold and silver coins and high quality junior mining stocks trading now at historic lows. It should be noted that coin sales are picking up especially mint grade numismatics.
Avoid the large cap equities like the S&P500 (SPY) making a classic megaphone top, US dollar (UUP) and long term treasuries (TLT) as these are markets overbought and where the fundamentals do not justify the current valuation. I am very concerned about the exuberance in banking and real estate as the numbers of unemployed in America are still at record levels. Avoid “fairy tale” sectors which try to say that Price Earning Ratios do not matter or that we are in a new era which justifies obscene valuations.
The Middle East Arab Spring has turned into an Islamic Winter. Black swans could still be on the horizon. Now the US is looking to team up with Iran to fight ISIS and possibly ignoring the threat of Iran’s nuclear ambitions. Russia just stated What we are seeing with the rise of the dollar and decline in commodities may be part of the war no longer fought with bullets and missiles but with foreign exchange rates. The ruble is collapsing along with the Russian Economy. China and Russia may begin to look to trade in Yuan to avoid the negative consequences of currency wars.
Those with US dollars are able to purchase gold and silver at low prices despite record demand. The US Mint is showing record sales. Many have asked how is gold and silver going down in price when demand is at record levels? The only answer is that some games are being played in the paper market. This week the regulators just fined the major banks for manipulating exchange rates. Investors may be just beginning to lose faith in the manipulated paper markets and are just buying physical coins. Some numismatics such as Mint Grade Morgan and Peace Silver dollars have had a nice rise this past year despite a decline in gold (GLD) and silver (SLV) prices.
The junior gold miners (GDXJ) are hitting record volumes which indicates massive capitulation. The bear may be getting exhausted. We know that bear markets end in panic and many bail at the low. This time of the year the San Francisco Resource Conference was a main gathering for junior mining investors for many years. Now it is cancelled. This indicates to me that the public investor has panicked out chasing the bull market in US large caps, the dollar and long term treasuries.
When the retail investor is gone, the smart money accumulates. Don’t rush, there may be retests of this bottom and long term resource investors should look to add to high quality position on weakness during this tax loss season. Remember that bear market bottoms and tax loss selling season are some of the best times to buy at a discounted price. In this resource bear market over the past four years picking the winners has been challenging, but still I continue to search for the juniors who are the winners.

Gold and gold miners have rebounded but remain in a technically weak position. Both markets have failed to move beyond the highs made last Friday. The same happened to the gold stocks in early October. They exploded higher one day but failed to muster anything after that. At that time Gold continued its rally for a few weeks. This time Gold has struggled to sustain Friday’s gains. While we are coming to the end of the bear market and one should not be too bearish, the downside target of $1000/oz Gold remains well in play.
The chart below shows the weekly Gold close since 1980 and the net non-commercial (speculative) position as a percentage of open interest. From this chart we can deduce the two most important levels: $720/oz and $1000/oz. Give or take $5/oz, $720/oz was the secondary peak in 1980, the peak in 2006, small resistance in 2007 and major support in 2008. Gold’s bottom in 2008 wasn’t random. It bottomed at an important pivot point around $700/oz. Today, Gold is in a downtrend without any major support until the $1000/oz level. That level marked important support and resistance from 2008 to 2010 and is the next major support.

As a percentage of open interest, the net speculative position is 13%. It’s low of 5% in 2013 marked an 11-year low. If Gold declines near $1000/oz, I’d bet the net speculative position would fall below 5% and reach a 13-year low. That qualifies as extreme bearish sentiment. The physically backed ETFs CEF and GTU are already showing sentiment at major multi-year extremes.
The $1000/oz target expressed above also fits very well with history as we’ve shown numerous times in this bear analog chart.

While the downside for Gold and Silver may be limited (in percentage terms), the downside for miners could be quite a bit more. With Gold trading at $1160/oz, it would have to fall about 13% to reach $1000/oz. That is not so bad if you hold Gold. However, a 13% fall in Gold could cause a 20% fall in the miners or more. If a gold producer has a $200 profit margin at $1200/oz then he does not have much profit at $1050 Gold. If a junior has a deposit that can earn good money at $1300/oz then that isn’t worth much if Gold drops to $1050. Thus, a fair amount of downside potential remains in play. On the other hand, it works in your favor if you buy very low and Gold recovers.
In any event the bear market is very close to its end. The weeks and months ahead figure to be enticing and exciting for precious metals traders and investors. Expect quite a bit of day to day volatility as we see forced liquidation and occasional short covering. Opportunities are fast approaching so pay attention. Be patient but be disciplined. As winter beckons we could be looking at a lifetime buying opportunity. I am working hard to prepare subscribers.

Legal marijuana is staking its future in Canada as a rush of investors and venture capitalists compete to win the easy, early profits from medicinal sales.
Yet every one of the hundreds of companies jumping into the fray have their sights set on one development they all believe is inevitable: recreational pot use.
Last year the Canadian government changed the rules around supplying medical marijuana, basically privatizing production. In doing so they created a $140 million a year industry, which Health Canada thinks will be worth $1.3 billion in a decade.
“Very rarely do you have a sector that is going from nothing to a multi-billion dollar industry in no time,” says Khurram Malik, Investment Banking and Equity Research at Jacob Securities, who covers the marijuana industry. He thinks Health Canada is too conservative in their estimate since they haven’t factored in the 40% growth rates of the past couple years.
“We expect it to be a $1.3 billion industry in the next couple years, not in 2024,” says Malik.
Several hundred companies have rushed in to try and get a piece of the weed action, clamouring for one of Health Canada’s much coveted production licenses. So far the government has issued just 13 licenses, with five held by public companies that now range in value from $25 million to $80 million. Those companies include Organigram(OGI:TSXV), Bedrocan Cannabis (BED:TSXV), Tweed Marijuana (TWD:TSXV),Mettrum Health (MT:TSXV), and T-Bird Pharma (TPI:TSXV).
These are impressive valuations for new companies without proven earnings. However, many investors think the prices are justified, in part because of the potential margins. Health Canada has recommended a price of about $7.60 per gram, which is what many suppliers are charging. But production costs are estimated to be around $1.50-$2 per gram.
“People like the sector because of huge potential margins,” says Aaron Keay, an investor, competitive poker player and deal-maker who has previously represented Canada on the soccer field.
Keay ditched the struggling resource industry, where’s he’s successfully raised millions and helped build a few companies, to position himself in the burgeoning medical marijuana business earlier this year.
And he’s not alone. Several resource companies have jumped on the hype, like Affinor Resources becoming Affinor Growers (AFI:CNSX), and Supreme Resources changing its name to Supreme Pharmaceuticals (SL:TSXV). But Keay says the company he’s helped put together, Organigram (OGI.TSXV), isn’t a latecomer or a pretender, as it actually has a production license and some strong differentiators.
Keay and a partner, Panama-based financier Dave Doherty, used their last shell company to help bring Organigram public in August, and put up $1 million in bridge financing to tide it over until the listing. Shares in the shell are up fivefold from the previous financing price, and those investors hold most of the freely-trading stock in Organigram. The rest is locked up for a minimum 4-month escrow period expiring in December.
Company CEO Denis Arsenault also believed enough in medical marijuana and Organigram to come out of retirement and put up $700,000 of his own money in the company. He has seen his investment grow by multiples already too, at least on paper.
The two aren’t the only ones trying to make big returns as first-movers in the medical marijuana industry. With the help of Jacob Securities’ Khurram Malik, and Jordan Securities’ Justus Parmar, Organigram more than doubled its initial $0.85 financing from $3 million to $7.5 million and the issue was still four times oversubscribed. Arsenault says the company won’t need to go back to the market for additional cash before reaching profitability, unless it’s to jump on a consolidation opportunity or to increase production capacity because of higher-than-expected demand.
Keay says interest was high because the company fundamentals are strong.
“Organigram could easily do $40-50M in revenue in a couple years, and they have the management team to navigate the marketing, production, and regulatory challenges,” says Keay.
Where share prices go in the near-term is really anyone’s guess. With no quarterly financials out yet everyone’s guessing at production numbers, profit margins, and just how smoothly companies can expand.
“It’s an industry in its infancy. So there’s going to be a lot of volatility and variability,” says Neal Gilmer, a research analyst at Clarus Securities. “All the companies are scrambling to scale production to meet demand. It’s hard right now to determine which companies will be successful at that.”
Malik says most companies are struggling to meet expectations, like Greenleaf Medicinals, which lost its license in April after it had to recall a shipment of mouldy weed.
“Everyone’s having challenges scaling up. To grow marijuana in general is pretty easy, it literally does grow like a weed,” says Malik. “But to grow it at scale, and to grow it using Health Canada’s protocol and exact standards is a complete nightmare…. One of these companies could blow up. It’s the frank reality that they could realize they just don’t know how to grow.”
Arsenault says Organigram is well set-up for reliable production growth. The company’s master-grower has 21 years of experience (at least half of which was legal), they have the grow operation already set-up and running, with Health Canada approving their first shipment in early September, and he says the company is looking at a 500% increase in production next year.
Looking at the company’s numbers, Malik thinks Organigram’s setup will result in lower costs, too. He figures that it will cost Ontario producers about $1.50 per gram, while Organigram’s lower cost-base in Moncton, New Brunswick means it could produce for about $0.90 per gram. And because the company has a large property, it can expand production capacity without having to apply for a new permit.
“So, on paper, they can have the highest margins, and can keep efficiently growing,” Malik says.
As per the company name, Organigram has also managed to have its growing process certified as organic. Arsenault says customers are interested in an organic product, which will be important as the space gets more competitive. The company also differentiates itself by being the only fully bilingual company, and the only licensed producer east of Ontario.
“Everything’s beneficial when we start fighting tooth and nail for market share in a few years. But for now, we’re all sold out,” says Arsenault. “I’ve made sure we’re branded right, we have competitive advantages, and we have a low-cost environment to be able to function in any market.”
Because demand is so much higher than production right now, Malik says expanding production and getting customers are the the most important goals.
“The companies that can scale up quickly at cost while maintaining brand presence are the ones that are going to win. And it’s not easy to do,” says Malik.
The race is also on to get customers in these early stages, because it’s difficult for customers to switch from company to company. Patients have to sign on to one company and file an application to switch, so it’s important to sign on some of the 40,000-or-so current medical marijuana users now.
Getting to those customers is another challenge, because companies aren’t allowed to market directly to patients. Generally they have to rely on the pharmaceutical industry’s unreliable model of marketing to doctors and clinics. Organigram says it has big plans in the works for getting new customers, starting with a 10-year partnership announced earlier this week with Trauma Healing Centres. Trauma is busy opening 13 centres across Canada. In the deal Organigram will be the preferred marijuana supplier for treatment of post-traumatic stress disorder, and has agreed to supply up to 1,500 kg of marijuana next year, then up to 3,000 kg in 2016, and rising by 20% a year for the 10-year deal. No price was disclosed.
The big question is just how much competition there will be in the industry. Right now there are well over 1000 companies that have applied for production licenses and are eager to compete in the market. Health Canada hasn’t announced any specifics as to when, or how many more licenses might be awarded.
With so much potential competition in such a fast-evolving market, Malik says the next few years will be turbulent.
“In the next five to eight years there’s going to be a lot of carnage in the space, a lot of M&A and attrition,” says Malik. “Then big tobacco and big pharma will come in and pick off the consumer brands.”
Arsenault says that while more supply may be on the way, he’s getting Organigram ready to meet the coming demand.
“We all know it’s going to go recreational legal,” says Arsenault. “When the dust settles, the people with the best product are going to capture a big part of the market.”

With the spot uranium price up to $42/lb. according to Tradetech, up about 50%! from its $28/lb. low, investors should take another look at Anfield Resources (ARY.V) and (ANLDF). Many uranium peers are rallying on the substantial spot price move and on news that 2 reactors in Japan are in the process of restarting. Analysts at Cantor Fitzgerald noted,
“We continue to view the September announcement [by the Japanese Regulatory Authority that two reactors at the Sendai plant have met the safety requirements for a restart] as a positive signaling event for the uranium sector as a significant amount of the current U3O8 inventory is a result of material earmarked for Japan not being used. We estimate that 15 reactors including the Sendai pair will restart in 2015 with an additional four restarting in 2016. Ultimately we expect 32 of the country’s remaining 48 reactors will be restarted by 2018 – amounting to about 14.5 million pounds of annual U3O8 demand on a steady state basis. Prior to Fukushima, Japan consumed 21.3 million pounds U3O8 on an annualized basis. With low uranium prices not incentivizing additional uranium production, a demand environment that is expected to grow continuously (we forecast 17% growth by 2020), we believe uranium equities are well positioned to move higher.”
UR-Energy is up 36%, Uranerz up 59%, Uranium Energy Corp 84% and Energy Fuels 40% since October 15th lows. However, Anfield Resources’ stock is unchanged at C$0.40 per share. This, despite Anfield close to closing a game- changing acquisition of 1 of only 3 licensed conventional uranium mills in the U.S. The increases in the peers’ stocks since October 15th are significantly greater than the entire Enterprise Value, “EV” of Anfield, which is about C$8 million. Anfield is flying under the radar, when it should be soaring with the rest of the industry.
Yet, Anfield will not be unknown forever as it has one of the most leverage to an increase in uranium prices. The company has only 20 million shares outstanding. It wouldn’t take much to get this stock rallying. There may be some investor fears about the acquisition of the Shootaring mill from Uranium One. However, CEO Corey Dias points out,
“Based on a study commissioned by U.S. Energy (the company which sold these assets to Uranium One) in 2005, the replacement value of the mill at the time was US$80.5 million; moreover, the VP Corporate Development of Energy Fuels at a New York conference in September, 2014 was asked why it sold its licensed and permitted mill site in Colorado and he responded that the cost to build a 500tpd mill would be between US$150 million and US$200 million.” (Shootaring is 750tpd, or 50% bigger than that).
On November 4, 2014 the company put out a press release in which it stated,
“Anfield has renewed the nine mineral leases on Utah State Trust Land that were issued to the Company in December of last year. The leases cover over 5,700 acres (2,306 hectares) and lie within past producing uranium mining districts southeastern Utah. The leases are complementary with the Company’s other uranium holdings in the Henry Mountains District, the Montezuma Canyon District, and the Green River District.”
In the same press release, Corey Dias, CEO of Anfield, stated,
“Considering the current positive signs in the industry, we are optimistic that the price of uranium will continue trending upward. With the pending acquisition of both the Shootaring Canyon Mill and the conventional land package from Uranium One, together with Anfield’s existing holdings including the renewed Utah State leases, we feel that Anfield is well positioned to take advantage of burgeoning demand for nuclear power.”
Renewing the nine mineral leases is an important development as it demonstrates continued progress by Anfield in becoming a mid-tier uranium producer by 2017 and it comes soon after 2 press releases dated October 30th and October 8th. On October 30th, the company announced,
“….that the Utah Division of Radiation Control (“UDRC”) has granted conditional approval to transfer ownership of the Shootaring Canyon Uranium Mill radioactive materials license from Uranium One Americas, Inc. to Anfield.”
I like the fact that Anfield is staying in front of investors by putting out press releases and corporate updates on a regular basis. In the October 8th corporate update CEO Dias said,
“Since late 2013, Anfield has both redefined and reinvigorated its corporate strategy as the Company sought to target undervalued assets with near-term, cash-flow- generating potential…Anfield has executed its strategy via the pending acquisition of a number of uranium properties – many associated with past-producing mines – totaling over 17,500 acres in Utah, Arizona and Colorado to become one of the largest owners of uranium landholdings in the Southwestern U.S.”
Anfield has pulled off a tremendous deal with Uranium One that gives it unparalleled leverage to a rebound in uranium prices. Most management teams and pundits believe a continued recovery is a question of when, not if. I agree. We still have a long way to go. However, the long-term contract price of $44/lb. is “only” $20/lb. away from an attractive level for Anfield. The current long-term price at $44/lb. is bound to move higher in short order with a spot price of $42/lb. some now believe we will see the long-term price hit $50/lb. within the next few quarters. Finally, it’s essential to remember that Anfield has just 20 million shares outstanding. As I write this on November 10th, the latest price on the stock was C$0.40. The company has no debt. Therefore, Anfield has a market cap and EV of approximately C$ 8 million. Comparing that to ISR producers Uranerz, UEC and UR- Energy, as well as conventional uranium miner Energy Fuels with Enterprise Values of C$130 million – C$185 million is telling. Anfield has the ability to diminish the gap with these players.
Given the significant stock moves by Anfield’s peers, I would venture to say that Anfield is a prime takeover target. Investors may not know Anfield as well as they should, but peer companies know about the Shootaring mill and the high grade properties that Anfield is acquiring. Any of the four mentioned peers could buy Anfield as a call option on a rebound in uranium prices. The larger peers, presumably with greater financial resources than Anfield, could more easily and cost effectively get the mill back up and running with production as soon as 2017. One might wonder why an ISR player would want to buy a conventional miner. Good question. Diversification and scale is the answer. The Shootaring mill could be upgraded to a capacity of 4 million pounds per year. However, there is already a large mill in the area which doesn’t have enough feed, so that is a fate the Shootaring mill owner would want to avoid.
Diversifying from ISR production to also conventional mining could be deemed a de- risking event. At the very least it represents a call option on uranium prices that I mentioned earlier. If the long-term uranium price bounces back to $75/lb. in the next few years– almost all producers would be happy. At $75/lb. Anfield might be able to generate more cash flow than some of its peers that are currently constrained at 1-2 million pounds per year. Make no mistake, Anfield won’t be producing 4 million pounds of uranium anytime soon unless it acquires or finds more uranium, but Anfield as a long-term call option seems to me to be pretty cheaply priced.

Several years ago when I was considering career choices with the potential to make me rich I was attracted to the mining space because of the extreme volatility of the sector.
In bear markets, or at times when commodity prices are going lower, there is little to no appetite for early-stage mineral projects. But when prices are rising, those same projects can be extremely desirable among investors and producers.
There’s no better illustration of this than the track record of geologist Ross Beaty during the last decade. Ross’s company, Lumina Copper, acquired a portfolio of ten out-of-the money copper projects in 2002-2003 for “almost nothing” only to spend the next 11 years selling those projects off for billions.
Mr. Beaty told us that story in a April 2013 interview, recalling that IPO investors in Lumina, if they held on, made an over 80X return on their money.
I had the chance to follow Mr. Beaty around Europe in January 2012 as he updated investors there about his various companies, including Pan American Silver and Alterra Power. The trip was arranged by a mutual friend, Gianni Kovacevic, a Vancouver-based investor with ties to Europe.
Day one of the trip taught me about Ross Beaty’s work ethic. We flew from Vancouver to Iceland so he could take a few hours of meetings while I went for a swim in the Blue Lagoon. Then we flew to Dublin, Ireland so Ross could meet another potential partner, while I swilled pints and sang songs in a local pub. When I finally rested my head on a pillow that night in Paris, France, having crossed the world that day, I realized that the best entrepreneurs in mining have other-worldly energy.
It was an inspiring trip and evidently Ross’s story had a big impact on our travel companion, Mr. Kovacevic. Fluent in 4 languages, Kovacevic built relationships across Europe and became an important conduit for early stage companies looking to build an audience for their story there.
At home in Vancouver, he became one of the best connected players in the space, and a substantial investor in early stage companies.
He is one of the founders, a large shareholder and Executive Chairman of a new company that started trading on Friday called CopperBank Resources Corp (symbol CBK on the Canadian Securities Exchange).
CopperBank is following the Lumina Copper model by assembling a portfolio of early stage copper projects at a time when there is little to no outside financing available for them.
Their plan is to house multiple projects under one low overhead roof to ride out the bear market before beginning to option off, sell or re-ipo those projects when times are better.
The company has a few things going for it. To start with, it has two established copper projects already that are in line with the company’s strategy. In an email Friday, Kovacevic said these projects were acquired for less than 1/3rd of 1 penny per pound of copper in the ground.
CopperBank’s first two 100% owned projects are Contact, located in NorthEast Nevada and Pyramid, located on the Aleutian Islands of Alaska.
Highlights of Contact:
- 100% consolidated ownership
- 7,000 acres of patented and unpatented mining claims
- 2013 PFS design for 50 million pounds per year of copper cathode production
- Heap leaching with SX-EW to make copper cathode at site
- Located in NE Nevada near the border with Idaho, one mile west of Highway 93
- Excellent infrastructure with available roads, grid power, and water
- Extensively drilled with over 250,000 feet of drilling (329 core and RC holes)
Highlights of Pyramid:
- Porphyry Copper, Moly, Gold discovery
- Extensive supergene copper enrichment blanket
- Near surface mineralization
- Adjacent to tidewater, 25km from SandPoint Alaska
- Completed 7486 metres of drilling in three years with former joint venture partner Antofagasta
- Established an open ended mineralized footprint of 1,800 metres by 1,050 metres
- Situated on Native owned lands (Aleut Corp.), avoids Pebble like project complications
The company intends to use its stock to acquire additional projects in the near future. They are looking for projects with established resources, little to no ongoing work commitments, and obviously, realistic financial terms.
Another strength of CopperBank is its shareholders. Kovacevic has been able to attract some impressive investors, from Chilean-based family owned miner, Antofagasta, to Lukas Lundin’s Denison Mines.
As Executive Chairman, Kovacevic is Copperbank’s driving force. He has a new book out on copper that provides a unique platform for also telling the CopperBank story. The book is called My Electrician Drives a Porsche?, and US Global Investors founder Frank Holmes wrote the forward. Many of the mining industry’s most influential CEOs have already read it, and you can get a copy on Amazon here.
Behind Kovacevic is a team of experienced engineers, geologists and capital markets professionals to help CopperBank evaluate and acquire other projects. The team also includes Rob McLeod, Will Willoughby, Todd Hilditch, and Terry Ortslan. These gentlemen have long track records of accretive mining transactions.
The company raised $1.6 million in cash and has a $13 million market cap, based on roughly 130 million shares outstanding with the last financing price at $0.10.
The mining down-cycle is now almost 4 years old and Copperbank may be early in its strategy. On the other hand, their timing might be perfect.
For more information, visit copperbankcorp.com and add CBK to your watch list.
Disclosure: Author owns shares in CopperBank Resource Corp and they are a CEO.ca conference sponsor. The company had no influence on this story. All facts are to be verified by the reader. Always do your own due diligence as this is not investment advice.

A few days ago I wrote an article entitled “Uranium Spot Price Breaking Out, Junior Uranium Stocks Ready To Bottom?” In the report I said, “There is a lot of buying in the spot market and it should be soon reflected in the performance of the junior uranium miners (URA)… Look for a breakout.”
Now only a week later, the uranium mining etf (URA) is up 11.5% and Uranium Participation Corp (U.TO) up 5% on triple average volume.
Some of our favorite uranium miners are flying such as Uranerz (URZ) up 15%, Pele Mountain (GEM.V) up 14%, U3O8 Corp (UWE.TO) up 33.3% and Laramide (LAM.TO) up 20% and Fission (FCU.TO) up 12%. It seems as if all the institutions are jumping in after the recent capitulation of some major funds in Toronto.
Uranerz (URZ) is leading the sector powering through the 50 day moving average on huge volume. The uranium mining ETF (URA), UR Energy (URG), Kivalliq (KIV.V) and Laramide (LMRXF) all appear to be on the verge of breaking out. The institutions are piling in but have overlooked some smaller cap stories, so there may be some opportunity there for a trade particularly in Anfield (ARY.V) and Pele Mountain (GEM.V). Volume is huge across the board.
The Republicans had a huge victory taking control of Congress and this could give a boost to nuclear power. The Democrats blocked funding for Yucca Mountain, a nuclear waste site. Now the Republicans can push forward a pro nuclear agenda.
Uranerz just announced that they are making progress on permitting the additional Jane Dough Area south of Nichols Ranch. Paul Goranson, President and Chief Operating Officer of Uranerz stated, “Now that the Nichols Ranch facility is fully operational, we see the Jane Dough unit as being the next project to be developed. Given that this application is being filed as an amendment to the existing Nichols Ranch ISR Uranium Project license, we expect to see considerable time savings in both the WDEQ and the NRC review and approval process.”
Uranerz began in-situ mining operations on April 15, 2014 in the Powder River Basin, Wyoming. The management team are well known former Cameco (CCJ) guys and work together with them on the processing. Cameco is the largest publicly traded uranium miner.

The selloff in precious metals intensified over the past week. GDXJ declined 25% in seven days while Gold plunged below $1180 to $1140 and Silver plunged below $16 and to as low as $15.20. Precious metals are becoming extremely oversold and the bear market is clearly in the 9th inning. Be on alert for a snapback rally to repair the extreme oversold conditions. Although we are likely very close to the bottom in the miners, Gold’s current position continues to leave me skeptical.
Below is the updated bear analog for Gold which uses weekly data. Gold has yet to suffer the extreme selling experienced by Silver and the mining stocks. It makes sense given that Gold peaked months after those assets. The chart illustrates how bear markets are a function of price and time. The most severe bears in price are the shortest in time while the longest bears in terms of time are the least severe in terms of price. This bear falls in between. Given that Gold went 10 years without a real bear market it makes sense that this bear could bottom very close to the 1983-1985 and 1975-1976 bears but will have lasted quite a bit longer.

With respect to Gold, another point to consider is the strong supports at $1080/oz (50% retracement of the bull market) as well as $1000/oz. These downside targets continue to align well with the history depicted in the bear analog chart. Moreover, the fact that Gold currently sits well above these support levels is reason to expect more downside.
Silver on the other hand figures not to have the same degree of downside. Silver’s bear began five months before Gold’s and the bear analog below makes a strong case that the current bear will end very soon. Other than the epic collapse from 1980-1982, the current bear is the worst ever for Silver in terms of price and is the third worst in terms of time.

Similar to Silver, the mining stocks which led the bear market are moving from very oversold to extremely oversold. The HUI Gold Bugs Index, shown below closed Wednesday at an 11-year low. As far as the HUI’s distance from its 50 and 200-day moving averages, it is inches from major extremes. Over the past 50 days the HUI has declined 36.4%. That is the second worst performance over the past 20 years. The picture is even worse for the junior mining sector. GDXJ has declined 43% over the past 50 days. It is trading at the lowest level relative to its 50-day moving average since the creation of the ETF.

The worst bear market ever for the gold stocks was the more than four and a half year decline following the junior bubble in 1996. That bear did have a 14 month long respite where the indices rallied as much as much as 70% and 80%. That rally was longer and much larger than the one experienced recently. During the 1996-2000 bear, the GDM index (forerunner to GDX) declined 77.5%. Through Wednesday it was down 76%. The XAU declined 72.5%. Through Wednesday the XAU was off 74.2%. The Barron’s Gold Mining Index declined 75% during the late 1990s bear. Through last week it was down 68%.
The mining stocks and Silver are obviously extremely oversold and very close to the bottom. It could happen any day or any week. However, I’m skeptical because Gold is currently trading so far above its potential bottom. Sure, Gold figures to be the last to bottom but my view is the window for a bottom in the stocks could come when Gold declines below $1080. That being said, we could definitely see a snapback rally of some sort. The mining stocks and Silver are extremely oversold and could pop higher in the short-term.
In any event, the bear market is very close to its end. The weeks and months ahead figure to be very enticing and exciting for precious metals traders and investors. Expect quite a bit of volatilty as we see some forced liquidation from longtime bulls and as the sector tries to carve out a major bottom. Opportunities are fast approaching so pay attention. Be patient but be disciplined. As winter beckons, we could be looking at a lifetime buying opportunity. I am working hard to prepare subscribers. Consider learning more about our premium service including a report on our top 5 stocks to buy at the coming bottom.

1. In January of 2011, I swapped a fair amount of physical silver bullion for physical gold bullion. A couple of weeks ago, I reversed the swap.
2. When I first did the swap in 2011, silver was trading above $30. I wasn’t trying to call any tops or bottoms. Gold simply offered more relative value to me at that period of time than silver did.
3. Likewise, I’m not really interested in predicting that silver has “bottomed” against gold, at this point in time. Silver simply appears to offer more relative value to me now, than gold.
4. While silver is a mighty metal, it’s not for all investors, especially when bought with size. It’s much more volatile than gold. It can trade as wildly as sugar or natural gas.
5. Most amateur investors should invest in gold first, and buy silver after they have built a “foundation of comfort” with gold.
6. Please click here now. That’s the daily silver chart. A rally just up to overhead HSR (horizontal support and resistance) at about $18.70, is quite a sizable move. I’ll be booking some profits in that target area, if it is acquired.
7. Note the position of my price stoker (14,7,7 Stochastics), at the bottom of the chart. Rallies tend to begin from a point below 20, which is where the lead line is now. A post-jobs report rally of size is quite likely.
8. Gold itself continues to face modest headwinds from the crashing Japanese yen. I’ve predicted that a global fiat crisis is coming, and that it would begin in Japan. By 2016, I expect it to begin enveloping most of the Western world.
9. Relatively speaking, Japanese QE is much bigger than American QE ever was, and it’s taking a toll on the yen. Please click here now. That’s the daily chart of the US dollar versus the yen. The price stoker suggests that the dollar’s rally may be peaking, at least for now.
10. While the dollar has mauled the yen, gold has only moved marginally lower. That’s because Chinese jewellery buying has increased again. I trade the leading Chinese jewellery stocks on my junior stocks site at www.gracelandjuniors.com. They have been displaying sideways to bullish price movement. Diwali in India is also in play. Demand there has returned to seasonal norms.
11. Because the US dollar is the reserve currency of the world, it can take the most amount of “money printing damage”, before it crumbles against gold. The US dollar can be viewed as the lead aircraft carrier, in a fiat carrier strike force. The smaller battleships, like Japan and Europe, are now experiencing significant damage.
12. Unfortunately for the fiat carrier strike force, their opponent can be viewed as a gold jewellery bull era starship, with India’s gold-obsessed citizens at the helm. The formation of the gold jewellery era is not an overnight event.
13. The ice age of paper currency has begun, but the movement of the ice is not visible, to the naked fiat eye.
14. In the meantime, please click here now. That’s the daily gold chart. It’s clear that despite the massacre of European and Japanese fiat, the dollar has barely moved gold lower at all. It’s only marginally below the $1180 area lows. That’s the power of gold jewellery demand growth, a power that is in its infancy.
15. Please click here now. That’s the daily oil chart. Profits for Canadian oil producers in the tar sands are shrivelling now, and US “frackers” are entering the pain zone. Canada is America’s largest trading partner.
16. A meltdown in the Canadian economy could kill the US economic rally. Please click here now. That’s the daily chart of the US dollar versus the Canadian dollar. With oil prices falling hard, the Canadian dollar is weakening dramatically.
17. Worse, I expect the Fed to stun global stock markets in 2015, perhaps as early as January, with rate hikes. All roads lead to gold jewellery and the Western mining stocks that source the gold, but does anyone really understand? I’ll be in my favourite Chinese gold jewellery store tomorrow, celebrating the new era with some quality purchases of 24 carat items. In Canada, gold jewellery can be insured and stored in regular safe deposit boxes, without violating any of the terms of storage. It’s best to check with your bank before proceeding with a transaction.
18. Please click here now. That’s the daily natural gas chart. It looks spectacular. To understand why that is, please click here now. That’s a chart from the United States Energy Information Administration. America is entering the winter season with abnormally low natural gas supplies.
19. I bought oil into the 2008 lows. When I swapped that oil for natural gas a few years ago, most observers thought I was a lunatic. To make big money in a market, the investor needs to have a lot of patience, a stomach for enormous drawdowns, and have the intestinal fortitude to accumulate positions into the depths of their “personal surprize zone”.
20. The natural gas asset is potentially poised to move 100% higher, or more, given the supply issues and the long term weather forecasts for another bitterly cold winter on the East coast of the United States. Higher heating costs could also chop GDP, like they did last year.
21. I can’t even imagine being heavily invested in global stock markets in a situation where heating costs are soaring, GDP is tumbling, and the Fed is hiking interest rates, but “to each his own”.
22. Please click here now. That’s the GDXJ daily chart. I’m looking for a sizable rally to begin very quickly. Yesterday’s price action was particularly encouraging, with gold trading about five dollars lower, while junior gold stocks marched nicely higher!
23. Note the position of the price stoker. Not every signal produces a big rally, but if the Swiss vote “yes” in the upcoming referendum, the GDXJ rally that follows could be record size.
24. For 2015, I’m ready for a cold winter, a Fed that electrocutes global stock markets, and the next leg in the gold bull era, featuring higher prices for gold stocks!
Stewart Thomson of Graceland Updates, Guest Contributor to MiningFeeds.com

Gold & Silver Trading Alert originally published on November 3rd, 2014 6:50 AM:
Briefly: In our opinion speculative short positions (full) in gold, silver and mining stocks are justified from the risk/reward perspective. We are adjusting the stop-loss levels (again), so in a way we are locking-in even more of the profits from the current positions and, at the same time, keeping a chance of increasing them.
Gold, silver and mining stocks plunged heavily last week. We saw major events such as breakdowns and we saw some key levels being reached. The miners’ slide and the silver’s and gold’s breakdowns were widely commented, but there are additional developments in the ratios that investors and traders need to consider at the moment.
Before moving to the ratios, let’s start with the U.S. dollar (charts courtesy of http://stockcharts.com).
 In the previous alert we wrote the following:
What’s next? The cyclical turning point is at hand, so we might not see many more daily upswings in the near future. The closest resistance is at the previous October high, about an index point above Wednesday’s close. Consequently, we are quite likely to see another sharp upswing, but it also seems likely that the USD Index will at least pause after reaching its previous high, at or close to the turning point.
We indeed saw a sharp upswing in the USD Index yesterday and also in today’s pre-market trading. Today, the USD Index moved to 86.74, which is very close to its early-October high of 86.87. We could see a pause or another decline from here, especially that the cyclical turning point is at hand. The situation in the currency market is very interesting at this time (especially in the USD/JPY pair) but that’s something that we will discuss in today’s Forex Trading Alert.
The USD Index moved even higher – to 87.25, but closed only slightly above the previously-broken level. It’s still quite likely to decline given the unconfirmed status of the breakout and the cyclical turning point. Consequently, the above remains up-to-date.
Let’s move to metals. Has the outlook become bullish for the precious metals sector based on the above? Just as we wrote in Friday’s alert – not necessarily.

On Friday, we wrote the following about the above chart:
From the long-term perspective we see that this month’s rally was in fact a corrective upswing that took gold to combination of strong resistance lines. It was a breather that we expected to see and as it’s already been seen, so we can now expect the decline to continue. Perhaps the next big slide is already underway.
The big slide is already underway and profits from the short positions have become even bigger. However, could they grow even further before the decline is over? Yes, and the reason for that is that in today’s pre-market trading gold moved below the 2013 low of $1,179.40. The breakdown is not confirmed at this time, but this price level is so visible and profound, and closely-watched that perhaps even an unconfirmed breakdown could trigger further selling, and thus declines. At the moment of writing these words gold is at $1,164 after moving to $1,161 and correcting a bit. There has been no invalidation of the breakdown.
It turned out that gold closed the day and the week below the 2013 intra-day low. The move is not clearly confirmed, but more confirmed than it was before the session started and when we sent the previous alert.
Consequently, the situation is still tense, but the close below the previous lows suggests that the next move will be to the downside. It will be much more certain if we see 2 more consecutive closes below this level.
Please note that the RSI indicator is not at a level that would suggest a major bottom.

Moving on to the silver market, let’s start by quoting yesterday’s alert:
When silver finally gives in and breaks this level [the rising long-term support line], it’s likely to catch up with gold and miners and decline sharply. Please note that once this support is taken out there will be no other support to stop the decline until the white metal moves below $15.
Is silver still a great investment when one takes a few years into account? We think so.
Can silver plunge very low before it starts another powerful rally regardless of its favorable fundamental situation? Yes, it can.
Silver broke below the rising support line and it indeed quickly caught up with gold and miners by declining sharply. Silver closed at $16.17, well below the support. The next strong support is below $15 so we could a see a big slide even without additional bearish triggers (such as a rally in the USD Index).
As you know, miners plunged significantly as well.


Both indices: HUI and XAU moved sharply lower last week. In Friday’s alert we wrote the following:
If they repeat yesterday’s decline, they will reach our initial target levels. Just a few weeks ago some would call 150 in the HUI Index “unthinkable.” It will quite likely be a reality today or in the next few days. The miners’ recent performance suggests further declines especially that there were no big declines in the general stock market.
There is no significant support that could stop the decline before the 2008 lows, so it’s likely that these levels will be reached. Moreover, gold stocks and silver stocks could move even lower without a bigger correction (that’s a bit unclear at this time, though).
The “unthinkable” move to the 2008 lows has indeed become reality. Both important indices moved very close to these lows – close enough to say that they were more or less reached. The key question is – is the bottom in? Our initial target has already been reached, so we could see an upswing, but given gold’s breakdown, we could also see a very sharp downswing. Consequently, exiting short positions here might be premature.
All in all, we have a visible breakdown in silver (declines are likely), small breakdown in gold (declines are likely, but the situation is not as bad as it is in the case of silver) and a move to the initial target in the case of mining stocks (rather bullish implications). Overall, the situation is not crystal clear at this time if we take a look at metals and miners only.
Let’s take a look at ratios.

The silver to gold ratio is one of the things that we are watching closely even when we don’t mention it. What does it tell us at this time? That the final bottom is likely not in just yet. The reason is that the previous declines were usually accompanied by sharp declines in the silver to gold ratio (meaning, extreme underperformance of the white metal) and we have not seen this kind of performance recently. The Rate of Change indicator (bottom of the above chart) didn’t plunge recently, so it seems that the final bottom is still ahead of us.

The gold stocks to gold ratio moved to a major support level – the 2000 low. In other words, if someone purchased gold stocks (on average) at the 2000 bottom in order to multiply gold’s gains and someone else just bought gold, they would both have the same amount of money at this time.
As you may recall, the HUI to gold ratio at its 2000 bottom is one of the things that we were expecting to see as the final bottom confirmation. However, at this time there are not enough additional signs to change the overall outlook (based on the silver to gold ratio, for example, we are likely to see further declines).
Can the above chart not mean that the final bottom is in? Yes. There were generally 2 cases, when the ratio dropped sharply and approached important (not as important as this one, but still), long-term support levels: in 2008 and in early 2013. In both cases the previous lows didn’t stop the decline. In 2008 there was a small move below the support level before gold stocks rallied again and in early 2013 there was only a corrective upswing to the 2008 low that verified the breakdown – declines followed.
Consequently, our reply to the how significant is the move in the HUI to gold ratio to its 2000 low question is: not that significant as it’s not accompanied by many additional signals.

The ratio between gold stocks and other stocks ended the 2014 consolidation and broke below the previous lows. In this case, the next strong support is still very far. The implications for the precious metals sector are bearish. Interestingly, this ratio moved to its support level during the 2008 bottom – something that we have yet to see during this decline.

The ratio between gold stocks and oil stocks is also declining and it’s far from the next strong support.

Before summarizing, let’s take a look at the Dow to gold ratio. It moved close to its resistance level, but it’s not yet at it. Since this level has not been reached yet, we could see some more upside before the top in the ratio and a bottom in gold are in. Still, this ratio suggests that the size of the potential decline in gold is rather small. Since gold has just broken below the major support level and based on the above ratio it’s likely to decline a bit more, it means that the breakdown below the support in gold is likely to be confirmed and more visible. This, in turn, means that gold could drop much more – ultimately a confirmed breakdown in gold will be more meaningful than a move in the ratio based on the yellow metal.
Consequently, perhaps the Dow to gold ratio will move more visibly above the 15 level before it tops. The next resistance is at the ratio’s 2006 low.
All in all, we can summarize the situation in a similar way, as we did on Friday.
Summing up, the situation in the precious metals market was bearish and metals and miners were likely to decline – and they did. Will they decline further based on gold’s major breakdown (after all, gold didn’t break down from more than a yearly consolidation pattern to decline $20) or will the resistance and turning point in the USD Index trigger a bigger upswing in the precious metals sector?
As always, there are no sure bets in any market, but we think that the short-term resistance in the USD Index (given the metal’s negative correlation with the U.S. dollar) is much less important than the breakdown in silver and gold. The critical support in gold and silver was broken and they are likely to decline significantly now. They could still turn around and rally today or in the coming days, but they could also continue their decline and if they do, they could drop fast and far – and it would be a waste not to take advantage of this move.
Consequently, we think that instead of closing the short positions, we will keep them “almost closed”. By this we mean moving the stop-loss orders lower once again. In this way, if gold, silver and mining stocks rebound, the short positions will be automatically closed and substantial profits will be secured anyway. If metals and miners continue to slide, we plan to continue to move the stop-loss order lower and thus make the substantial profits from the current short positions even bigger. Please note that by entering a new stop-loss order, you are effectively making sure that the current trade is profitable no matter what the market does.
The fact that XAU and HUI moved very close to their 2008 lows and the HUI to gold ratio moved to its 2000 low doesn’t have to mean that the bottom is in at this time. Gold moved below its 2013 low and it doesn’t look like it’s ended a huge triangle-shaped consolidation to decline $20 or $30 dollars. If it continues to slide, the move could be very sharp and miners would likely follow.
We will continue to monitor the situation and report to our subscribers accordingly.
To summarize:
Trading capital (our opinion):
It seems that having speculative (full) short positions in gold, silver and mining stocks is a good idea:
Gold: initial target level: $1,107 ; stop-loss: $1,187, initial target level for the DGLD ETN: $96.83 ; stop loss for the DGLD ETN $79.90
Silver: initial target level: $15.07 ; stop-loss: $16.56, initial target level for the DSLV ETN: $93.83 ; stop loss for DSLV ETN $72.29
Mining stocks (price levels for the GDX ETN): initial target level: $14.07 ; stop-loss: $18.33, initial target level for the DUST ETN: $73.11 ; stop loss for the DUST ETN $38.03
In case one wants to bet on lower junior mining stocks’ prices, here are the stop-loss details and initial target prices:
GDXJ: initial target level: $18.57 ; stop-loss: $26.53
JDST: initial target level: $59.49 ; stop-loss: $25.80
As a reminder – “initial target price” means exactly that – an “initial” one, it’s not a price level at which we suggest closing positions. If this becomes the case (like it did in the previous trade) we will refer to these levels as levels of exit orders (exactly as we’ve done previously). Stop-loss levels, however, are naturally not “initial”, but something that, in our opinion, might be entered as an order.
Long-term capital (our opinion): No positions
Insurance capital (our opinion): Full position
We were bullish on gold as far medium-term is concerned for the vast majority of the time until April 2013. After that we have generally been expecting lower prices. Are we gold bears? No – we view this decline as lengthy, but temporary. We expect gold to rally in the coming years, but instead of following the buy-and-hold approach, we exit the long-term precious investments at the most unfavorable times and re-enter when things look good again, thus saving a lot of money. Additionally, our Gold & Silver Trading Alerts help you profit from the short-term price swings.

Elephants are the world’s largest land animals. And though there aren’t many, they can still be found scattered across the planet. In the mining industry, super-large-sized deposits are often referred to as elephants. Like the animal, these deposits aren’t all that common. But also like the animal, they can still be found.
Elephant country is somewhere miners tend to gravitate towards in their hunt for meaningful discoveries, as elephants can usually be found in herds. And one of the world’s most prolific gold herds is found in British Columbia’s Golden Triangle.
The Golden Triangle, also known as the Stewart district, is located in northwestern BC. I’ve seen several different illustrations of this triangle drawn out on a map, but they’re all very similar with the long end stretching south to north from the town of Stewart to Dease Lake, roughly 300km.
I won’t go into a ton of geological detail, but the Golden Triangle resides in what is known as the Stikine terrane. It is generally believed that this terrane’s hydrothermal systems were seasoned longer than most. And the effect is a cornucopia of mineralized deposits including the volcanogenic massive sulfide, alkaline porphyry copper-gold, and transitional epithermal intrusion-related precious-metals types. This favorable geology has yielded several elephants.
The Golden Triangle has seen mineral exploration for over a century. And modern methods over the last half century or so have unearthed some of its greatest treasures. The best known as measured by yield is the famous Eskay Creek gold/silver deposit. This Barrick-run mine was once the world’s highest-grade gold mine (48 g/t) and fifth-largest silver mine by volume. Eskay Creek closed due to depletion in 2008, and over its life produced 3m+ ounces of gold and 160m+ ounces of silver.
While Eskay Creek was quite impressive, the Golden Triangle’s largest elephants are still in the ground. Towards the north are the massive Galore Creek and Schaft Creek projects. These projects, majority owned by Novagold and Teck Resources, hold two of the world’s largest undeveloped copper/gold deposits. Their combined resources of 22b+ pounds of copper and 21m+ ounces of gold, along with substantial byproducts of silver and other base metals, are astonishing.
Moving south closer to Stewart we find the KSM, Snowfield, and Brucejack projects. These polymetallic projects also hold a smorgasbord of metals, but with higher concentrations of gold. Seabridge Gold’s KSM project is the largest of the bunch, a 70m-ounce 23m-pound gold/copper behemoth. Snowfield and Brucejack are much smaller relatively speaking, containing around 30m ounces of gold resources each. But these elephants still rank within the top 5% globally in terms of size.
So as you can see, the Golden Triangle is host to one of the world’s most robust elephant herds. But while elephants are highly desirable assets for miners to have in their portfolios, they do have their drawbacks. And the most onerous is the massive amount of capital it requires to develop them.
In order to profitably mine large lower-grade polymetallic deposits, they typically need to operate on economies of scale (large-scale production). Once up and running proposed operations at such projects as KSM, Galore Creek, and Schaft Creek would indeed deliver high margins/profits, even at today’s metals prices. But getting them up and running is no easy task since large-scale mines come with large-scale price tags.
According to the latest feasibility studies, the pre-production capex required to develop each KSM, Galore Creek, and Schaft would well exceed $3b. It would be difficult to raise this kind of capital when the commodities markets are hot. And in today’s environment, when commodities are highly out of favor, I suspect it would be nearly impossible.
Really the only way an elephant will see production any time soon is if it is developed on a smaller scale, thus requiring less capital investment. But while this unfortunately isn’t an option for most elephants, there is a rare breed where it is. And Pretium Resources has found this breed in its excellent Brucejack project.
Brucejack is located about 20km south of Eskay Creek, in an area that saw its first hard-rock exploration about 50 years ago. Folks were excited early on, but the lower mineral grades didn’t offer much intrigue on the development front. This all changed though upon the discovery of the higher-grade West zone in 1980. And the operators at the time ended up putting about $40m into exploration, feasibility, and development work over the next decade or so.
Brucejack’s West zone had actually seen 5.0km of underground development and was fully permitted for a mine build. But falling gold prices in the 1990s pinched its economics, and ultimately forced the operators to abandon it. Interestingly Silver Standard ended up acquiring Brucejack and the nearby Snowfield project as silver plays. And its exploration work years later uncovered this elephant’s rare breed.
Former Silver Standard CEO and industry titan Robert Quartermain saw something special in the handful of holes that were drilled about 450 meters to the south of Brucejack’s West zone. And his newly-formed company Pretium Resources acquired the project (including Snowfield) in 2010 betting that this high-grade discovery would materialize into an Eskay Creek-type find.
Pretium’s aggressive follow-up drilling delivered one multi-kilogram intersect after another. And after several years and nearly 1,000 holes, Brucejack’s Valley of the Kings zone has grown to become one of the world’s premier high-grade gold deposits.
Per the latest resource estimate, this golden elephant contains nearly 14m ounces of the yellow metal. More impressive than the Valley of the Kings’ girth though is the quality of its ore. Core to this resource is 6.9m ounces of proven and probable reserves that grade an astounding 15.7 g/t.
Pretium was able to recognize the Valley of the Kings’ mining potential very early on. Its transitional epithermal gold occurrence (which is hosted in stockwork veining) had simple incomplex metallurgy. And this as well as the geological model was confirmed in a recently completed 10k metric-ton bulk-sampling program that pulled out 5,865 ounces of gold (thus equating to 18+ g/t!).
The data from this bulk-sampling program along with assays from additional underground drilling fed the Valley of the Kings’ latest and greatest feasibility study, which was announced in June. And it revealed a mining plan with huge economic potential, even at lower gold prices.
Mining would occur via conventional underground methods, with the ore processed at an onsite mill at a rate of 2.7k metric tons per day. With anticipated mill feed grades of 14 g/t and an average gold recovery of nearly 97% (via gravity and flotation), VOK would produce 504k ounces per year over the first 8 years and an average of 404k ounces per year over the life of the mine (18 years).
And VOK’s economics make mine development exceptionally compelling. The super-high grades among many factors allow Pretium to build this large-scale gold mine for only $747m. And with all-in sustaining cash costs estimated at only $448/ounce, VOK would be producing its gold in the lower-cost quartile of industry average.
At $1100 gold this mine comes with an after-tax internal rate of return of 29% and a sub-3-year capital-payback period. With figures like these, I suspect Pretium won’t have a problem procuring construction financing. And it is now pushing forward with the ever-important permitting process, the final step to be completed before closing on financing and mobilizing for construction.
Ultimately with VOK’s straightforward process flow, small footprint, and minimal environmental impact as well as Pretium’s good standing with the regulators and locals, there isn’t expected to be any problems procuring the necessary permits. PVG anticipates the receipt of final permits in H1 2015. And following a production decision and financing, it hopes to be building this mine by mid-year.
If all goes according to plan the Valley of the Kings will pour its first gold in 2017, easily beating out the rest of the Golden Triangle elephants to producerdom. This is one of the most highly-anticipated development projects not only in Canada, but in the world. And if Pretium executes as it hopes, investors are likely in store for a highly-profitable ride.
The best way for investors to play Pretium’s bright future is via its stock. And like nearly all precious-metals stocks, PVG has had a rough ride amidst gold’s post-apex consolidation and ongoing cyclical bear market as you can see in the chart below. But this beaten-down state offers what may prove one of the best PVG buying opportunities ever seen.

Pretium’s stay in the stock markets has mostly been fraught with peril. And this peril was a symptom of gold’s bear-market behavior following its Q3 2011 all-time nominal high. Despite the last few years being its most successful as it grew its elephant, PVG couldn’t break away from gold’s oppressive downtrend.
A junior mining company without cash flow is obviously more susceptible to downward pressure than its producing counterparts, so PVG leveraged gold to the downside. But on the rare occasions over the last few years when gold did show signs of life, it usually provided investors with great positive leverage.
Since its 2011 high gold has had four meaningful uplegs. And in three of them PVG performed like a champion. In the Q1 2012, Q3 2013, and Q1 2014 uplegs PVG positively leveraged gold’s 16.6% average gain by 3.3x, with a 55.1% average gain of its own. It didn’t perform so well in gold’s Q3 2012 upleg. But since this was endemic of nearly the entire mining-stock sector, we’ll chalk it up as an anomaly.
Pretium really is poised to pop as soon as gold pulls out of its funk. It showed incredible strength to soar 200%+ off its 2013 low in this weak market. And I suspect we’ll see positive leverage much better than we’ve seen in recent years once investors return. They’ll find a mining company vastly different than what it looked like the last time gold had a bull run. And they’ll want to get a piece of what has grown to become one of the world’s finest undeveloped gold deposits.
Given their risk/reward paradigms, Pretium Resources and the top gold juniors are in line to outperform the entire PM sector once gold gets rolling. And now is a great time to make the ultimate contrarian bet while they are still universally loathed. Yes the pool of quality juniors has diminished amidst the recent carnage, but there are still plenty of good ones out there.
The bottom line is pretium is the Latin word for “value”. And this is precisely what Pretium Resources will give shareholders as it advances its Golden Triangle elephant. PVG has determined that Brucejack’s high-grade core can be developed at a reasonable cost. And the latest mining plan outlines an operation with huge potential for profits even at lower gold prices.
Pretium is currently awaiting permitting before it can pull the trigger on its mine build. And amidst pre-development work it will continue to explore a Valley of the Kings deposit that remains open to the east and west along strike and at depth. PVG’s near-term prospects are sure to capture investors’ attention once gold turns around. And it ought to be one of the top performers as capital chases the sector elites.
If you would like to receive our free newsletter via email, simply enter your email address below & click subscribe.
 Follow us on Twitter
 Become our facebook fan
CONNECT WITH US
Tweets
Tweet with hash tag #miningfeeds or @miningfeeds and your tweets will be displayed across this site.
MOST ACTIVE MINING STOCKS
Daily Gainers
 CMC Metals Ltd. CMC Metals Ltd. |
CMB.V | +900.00% |
 Eden Energy Ltd Eden Energy Ltd |
EDE.AX | +200.00% |
| GoviEx Uranium Inc. |
GXU.V | +42.86% |
| Eagle Nickel Ltd. |
ENL.AX | +41.67% |
| Citigold Corp. Limited |
CTO.AX | +33.33% |
| Mount Burgess Mining NL |
MTB.AX | +33.33% |
| Exalt Resources Limited |
ERD.AX | +31.94% |
| Casa Minerals Inc. |
CASA.V | +30.00% |
| Cariboo Rose Resources Ltd |
CRB.V | +28.57% |
| Belmont Resources Inc. |
BEA.V | +28.57% |


