

The following interview of Gold Resource Corp.’s (GORO) CEO Jason Reid, CEO President & Director was conducted by phone and email on March 26-27. The company is unique in that it pays a monthly dividend in cash or in physical gold or sliver. The shares currently yield about 4% annually. The company has no debt and tens of millions in cash on the balance sheet, covering the current annual dividend by a ratio of 4 to 1. Mr. Reid believes that GORO is a true success story in an otherwise difficult gold & silver market. Please read this informative interview to learn more.
Can you please give readers an overview of Gold Resource Corp. (GORO)?
Gold Resource Corporation “GRC” (Ticker: GORO) is a gold & silver producer targeting projects featuring low costs and high returns on capital. The Company’s primarily focus is on cash flow, with a history of meaningful monthly dividends. The Company’s “Oaxaca Mining Unit” consists of 100% interest in 6 potential high-grade gold & silver properties in the State of Oaxaca, Mexico. The Company established its, “Nevada Mining Unit” exploration campaign in September, 2014.
GRC declared commercial production July 1, 2010 from a shallow, high-grade open pit at its El Aguila project, enabling GRC to reach production & cash flow rapidly, thereby allowing for a tight capital structure for a producer. In March of 2011, GRC announced production from its polymetallic La Arista vein system. The Arista deposit contains high-grade gold, silver, copper, lead and zinc The Arista deposit is open along strike and at depth. The Company targets extensions of this deposit and is exploring its Oaxaca and Nevada Mining Units to increase production over time.
Please describe your current capital structure.
GRC has one of the tightest capital structures of any gold producer. In an industry where 200-500 million shares outstanding is not unusual, GRC has just 54 million. Having a tight capital structure enables GRC to distribute a monthly dividend, increasingly rare in our industry. Our dividend yield, near 4%, equals or exceeds that of the Majors. Our dividend reminds investors that management has fiscal discipline, a shareholder friendly philosophy. Rest assured, management does not issue debt or shares to pay its dividend or for operations. Our capital structure is not happenstance, but a concerted effort from day one.
Let’s get this question out of the way…what would it take for GRC to raise its monthly dividend in 2015?
GRC’s current monthly dividend is $0.01 per share. When gold and silver prices were in a bull market back in 2011 and early 2012 our monthly dividend grew to $0.06 per share. As metal prices are in a bear market, our dividend has pulled back as a function of less cash flow with which to distribute. When metals prices pick back up, cash flow permitting, we want to increase the dividend. Having said that, we make no guarantees regarding the dividend.
We have a track record that has enabled us to distribute over $103 million to our shareholders since commercial production began in July, 2010. Our “IPO” in 2006 was at $1.00 per share and we have returned ~$1.95 per share. We are very proud of this achievement, let alone for a junior company in the mining space. We have taken GRC’s dividend a step beyond other companies by offering shareholders the ability to convert their cash dividend into .999 fine gold and/or .999 fine silver GRC one-ounce rounds and take physical delivery of those rounds.
In reading through transcripts of a number of Gold Resource Corp’s conference calls, there appears to be reasons other than the gold price that have hurt your share price. Things like water issues, CO2 issues, a lawsuit, a management shake-up, missing production targets and higher costs than expected. Are these issues behind the company now?
The mining industry has challenges irrespective of the recent gold and silver price collapse. There are challenges we can expect and plan for and those that we cannot. When dealing with Mother Nature one creates the best business plan one can, assembles the best team and works hard to achieve Company goals in the safest possible work environment for our employees. As an underground miner operating below the water table, we have to deal with groundwater. We have had challenges at times with excess groundwater that slowed our mine development.
Dealing with unexpected water inflows takes more time and money than one might expect, resulting in less production and missed targets. However, we have also had our share of successes along the way. I can assure you that we pay close attention to this issue and have a handle on it. Water will always be a concern at our Arista Mine and additional pump stations are an integral part of our development plans.
We have also experienced CO2 gas issues in some of our deeper development levels. CO2 gas is not out of the ordinary for an underground miner, but does require additional planning. Development slows when installation of additional ventilation, hinders development time and costs are temporarily higher. We try to plan for it, but not every level or area has CO2 gas, so we deal with it as needed. Our costs vary, but we have been in the low cost peer group over the long term. The last two years, we have focused on cost cutting and we have had success. We continue to evaluate additional opportunities to lower costs.
The Company defended itself against a securities class action lawsuit. We are optimistic that we are close to a resolution. The district court ruling was appealed to the 10th Circuit Court of Appeals, where that court upheld the original decision to dismiss the case. We await any decision by the securities class action case to further appeal the ruling. Once those appeal deadlines pass without further action, the securities class action will be terminated.
Do you have a better understanding of the risks facing Gold Resource Corp today?
Yes. That’s a key takeaway. We think we are better positioned to attack and resolve challenges as they arise. Each mine is different and has unique challenges. The shape and grade of the ore body, metallurgy, rock competency, infrastructure, water, gas and personnel. At the beginning a game plan is set to address all these issues, but as with any business that game plan evolves over time when the business plan meets the reality of operations.
For the fourth quarter of 2014, you released preliminary results that indicated Gold Resource Corp. missed production guidance. Please explain what happened.
We had a great 2014 despite a difficult third quarter with lower than targeted production and an on-site managerial change. We bounced back in the fourth quarter and GRC produced record amounts of both gold and silver. The industry, and GRC, reference a precious metal gold equivalent production total which takes the silver we produce, converts that into a dollar value based on market prices, then converts that dollar value back into gold ounces for a combined number of precious metal gold equivalent ounces. It is a quick way to calculate production using a silver to gold ratio.
The equation hurts production totals when metal market prices fall like they did during the third and fourth quarter as the aforementioned ratio worked against the gold equivalent total. That took place during 2014 as we lost several thousand gold equivalent ounces to the metal price drop. Had the metals not fallen we would have reached the low end of our annual production range even with our tough operational third quarter.
How important were the drill results that went out in your January 27th press release? Roughly how much would it cost to bring Switchback into production, and how many years might it take?
The market gives little credit to good news, while severely punishing bad news. The Switchback news is an example of good news ignored. 500 meters from our largest deposit, our producing Arista mine, we discovered multiple high-grade veins at Switchback in what is either an extension of the Arista deposit or its own significant deposit. This could be very important. We are developing a preliminary mine plan for Switchback to get a handle on costs. It’s too early to give a time frame, but we have a history of advancing projects faster than most. If warranted, we plan to advance Switchback in a similar manner. Operating cash and capital permitting, we would like to advance development at Switchback by year end.
After all drilling, exploration, development, maintenance cap-ex….everything, are you free cash flow positive at $1,200/oz gold? (including your base metal credits)
Our all-in sustaining cash cost per ounce was $1,073 for 2014. We had approximately 6,500 ounces of gold concentrate waiting to be processed into dore at year end. Had we been able to sell those ounces, our all-in sustaining costs would have been under $1,000. We remain among the low cost peer group by anyone’s measure, reflected in our profitability for the last three years during the metal prices collapse. Reporting of costs has been difficult for the industry. It has struggled for years to establish uniform cost metrics.
Every mine has unique characteristics which don’t always fit into a uniform cost metric, like the World Gold Council’s all-in sustaining cash paradigm. Cost metrics and cost are very important, but of greater importance is the question does the company make money? I was on a non-deal road show several years back when a fund manager made the following comment regarding low cost producers saying “I have met many low-cost producers that don’t make any money.” That statement stuck with me and I am pleased to be able to say that not only do we make money, but we continue to pay a monthly dividend. That speaks to our potential when metal prices rebound.
With the gold & silver price depressed, is the contribution from lead, copper and zinc more important? Do those base metals alter your thinking of how to proceed?
Yes. We are focusing primarily on margin as opposed to ounces, and that is reflected in our recent proven & probable reserve report as well as in our 2015 mine plan. We applied a $110 per tonne Net Smelter Return “NSR” break even criteria of all metals, precious and base, in the block model for the reserve report this year. Our production goals and production totals will retain a precious metal gold equivalent, while using base metals as by-product credits. What changes is that the NSR approach focuses on exploiting the Arista’s polymetallic (gold, silver, copper, lead and zinc) deposit, as opposed to our past focus where we targeted gold and silver using a precious metal cutoff grade and then processed whatever base metals happened to be present.
The former approach focusing only on mining precious metals was adequate when metal prices were much higher, but during the current declining metals market the NSR approach aims to extract the greatest dollar value of all metals from each tonne mined. During this volatile metal market we are focused primarily on margin, high-quality ounces, as opposed to chasing ounces and leaving behind valuable metals that make money. We care more about making money and less about the number of ounces we produce.
Management is excited about the prospects for Switchback. However, with the dividend at $0.01, is that a signal that there’s not enough cash flow to support efforts at Switchback and cap-ex at the existing mine?
The dividend is payed after project cap-ex, taxes and exploration. We achieved our entire 2013 mill expansion with our cash flow while still distributing a dividend. While we make no guarantees, we target a similar situation with additional development and cap-ex spending at switchback.
Would Switchback represent a second mine, i.e. distinct from your existing mine, thereby de-risking the overall company?
Switchback would most likely be developed by leveraging the existing depth of the Arista mine development. By doing so, we could potentially advance Switchback much faster and at less cost. However, it would likely leverage Arista’s advancement so it would not be entirely distinct.
If Gold Resource Corp. reached a point where additional capital was needed, would you consider utilizing a moderate amount of debt to mitigate the size of a possible equity raise? What about JV’s or Farm-Outs?
We fought tooth and nail to achieve our tight capital structure. Our goal is to continue development using cash flow from operations as we have for many years. If additional capital is warranted, we would consider equity raises or a combination of cash and equity. We are not fans of debt, hence our zero long term debt status. JV’s and farm-outs don’t excite us much. We are open minded to all options and plan to make decisions based on the best interests of our shareholders. If a deal is accretive and makes good business sense we would take a hard look at it.
Are there any misconceptions about Gold Resource Corp. that you would like to address?
There were many misconceptions around GRC going into production and being in production for years without a formal reserve report. We had internal estimates to justify our decisions, but to advance a project based on that drew staunch criticism. Looking back, by doing so we reached production sooner and diluted our shareholders far less. Though criticism and second guessing surrounded this move early on, we now have one of the tightest capital structures to show for it and we can use that to our advantage.
I think many misconceptions are driven from the that fact we are very different in the mining industry and some assume that is a bad thing. We look at mining as a business and are out to make money. We do make money. This is in contrast to peers that rely on continued equity raises and rolling over debt to stay alive. GRC has zero long term debt. What used to be misconception and criticism is turning into a meaningful positive for the Company.
The precious metals complex has established a floor of support over the past five months. For Gold it is around $1150/oz and for Silver it is around $15.50/oz. Pick any miner index and you’ll see the support at the November and December lows. These lows could mark a base of support from which a new bull market takes hold. On the other hand, they could also mark support that if broken could lead to a final but nasty capitulation.
Below is a weekly candle chart of Gold and Silver. Support for Gold is now well defined around $1150. There is major resistance at $1220-$1240 as well as $1300. Meanwhile, Silver has support around $15.50 with resistance at $17.50 to $18.50. If the metals can takeout their January highs then they would definitely be in a new bull market. Conversely, if metals takeout their March lows to the downside, then it could mark the final breakdown of the bear market.
The miners are now showing relative weakness as they are down for the week while the metals are up. The HUI closed the week at 166. It failed to reach first resistance at 180, though it still could. The HUI has a confluence of strong resistance just above 200 with strong weekly support around 155. A weekly close below 155 could trigger a final breakdown while a surge above 200 would signal a new bull market.
I do see some fundamental positives for precious metals. Real rates and real yields may be headed lower in the future. Yields are declining and Fed hikes could be put off again. Inflation, ex energy seems to be slowly ticking up. Meanwhile, problems in Greece could boost Gold even in US$ terms. Any trouble in US equities could certainly be a catalyst for precious metals.
This being said, we need to respect the charts which can be considered bearish until precious metals take out higher levels or until they breakdown and become extremely oversold. I’m leaning to the latter scenario. Protect yourself and your portfolio so you can benefit from a final breakdown. In that scenario, technical indicators and sentiment indicators would reach major extremes as diehard bulls are forced to capitulate. Those are the conditions for great buying opportunities that can lead to a bear market bottom.
Silver reversed sharply higher over the past week or so, surging dramatically. This was just after it had successfully retested major secular lows, ramping the odds this strong buying is the vanguard of a long-overdue major new upleg. As usual, silver’s coming gains will be fueled by gold’s own advance. As the yellow metal mean reverts higher initially on heavy futures short covering, capital will flock back to silver.
Silver is a fascinating market. It’s undeniably primarily an industrial metal, as the latest annual data from the world’s leading authority on silver supply and demand shows. The venerable Silver Institute reports that fully 54% of global silver demand in 2013, and 62% in 2012, was for industrial fabrication. In those same years, worldwide investment demand (coins, bars, ETFs) accounted for just 23% and 20% respectively.
Nevertheless, for millennia silver has also attracted investors as a precious metal and governments as a hard currency. From time to time silver captivates investors again, and they flood into this relatively tiny market and bid silver prices sharply higher. These large investment-demand spikes quickly overwhelm the normally-dominant industrial demand, which is naturally slow to change. So silver is catapulted higher.
The magnitude of these investment-driven silver surges can be enormous, multiplying fortunes rapidly. The greatest ones are the stuff of legend, and have left silver with something of a cult following. This volatile metal is always being watched by contrarian investors, who are ready to return when it starts running again. And there is a single overwhelmingly-dominant catalyst that brings investors running back.
The price of gold. Almost without exception, all of silver’s biggest and strongest spikes, uplegs, and bull markets in modern history have been fueled by parallel gold rallies. From an investment perspective, silver is ultimately just a leveraged play on gold. If you want to mischievously provoke hardcore silver zealots, call silver “gold’s little lapdog”. Silver investment demand is almost totally dependent on gold’s fortunes.
The historical data proves this in spades, it is unassailable. Gold drives silver, full stop. Silver prices are super-highly-correlated with gold prices over any reasonable period of time. Silver’s rallies, uplegs, and bull markets correspond almost exactly with gold’s rallies, uplegs, and bull markets. Investors return to silver when gold is strong, and abandon silver when gold is weak. Gold is the key to silver investment demand.
This is true even over the past couple years, which have been extraordinarily anomalous. Way back in late 2012, the US Federal Reserve launched its wildly-unprecedented open-ended third quantitative-easing campaign. Nothing like QE3 had ever happened before, and it along with high Fed officials’ associating jawboning epically distorted the stock markets. QE3 is what drove the past couple years’ levitation.
The Fed’s direct QE3 Treasury monetizing held interest rates artificially low. This enabled corporations to borrow over a trillion dollars very cheaply, which they used to buy back their own stocks. These vast buybacks greatly boosted the broader stocks markets. Meanwhile, the Fed kept implying to stock traders that it was backstopping these anomalous markets, ready to ramp up QE3’s size to arrest any material selloff.
Thus the Fed’s QE3 campaign radically altered investor sentiment and capital flows. Everyone wanted to buy high in overvalued, overextended, and euphoric stock markets. The Fed hypnotized traders into believing stock markets only rise, that there was no significant downside risk. And as stocks surged, demand for alternative investments that move contrary to stock markets like gold and silver collapsed.
Since nothing like QE3 had ever happened before, the resulting bear-market slide in precious-metals prices is also largely unparalleled. This first chart looks at silver and gold prices over the past couple years or so, the era of the Fed’s QE3 stock-market levitation. And even in one of the most extreme and artificial environments imaginable for silver investment demand, silver prices still mirrored gold’s nearly perfectly.

Statisticians measure data correlations through a construct known as the coefficient of determination. It’s also called R squared, because it is calculated by multiplying the correlation coefficient, symbolized as R, by itself. I bastardize this to r-square, as it flows better in writing. R-square effectively reveals how much movement in one dataset is directly mathematically related to movement in another dataset.
Since the dawn of 2013 when the Fed’s epic QE3 anomaly got underway, silver and gold have had a correlation r-square of 94.7%! That means nearly 95% of silver’s daily price action is directly explainable by gold’s daily price action, or vice versa. And there’s zero doubt about the direction of causality, gold is driving silver and not the other way around. This truth isn’t evident in a chart, it comes from experience.
I’ve been investing for decades, but have spent the last 15 years or so intensely focused as a dedicated student of the markets. In addition to endless research, data-crunching, and writing, a critical part of this is watching the markets all day everyday. When you spend all those years observing how prices react in real-time, causality becomes readily apparent. While many things move gold prices, only one really moves silver.
Like silver, gold prices are affected by shifting sentiment that alters investment and speculation demand. Major catalysts for this range from stock-market fortunes, to how the US dollar is faring, to releases of major US economic data, to a wide range of publications and comments by the Federal Reserve and its officials. The large gold market moves first when sentiment shifts, then the small silver market follows.
This reaction is usually rapid, happening within minutes when gold moves significantly. And as long as that gold trend lasts, hours, days, weeks, months, even years, silver tends to mirror and amplify gold’s price action. Silver surges when gold is strong, and slumps when gold is weak. In a very real sense, silver is a gold sentiment gauge. Investors and speculators only flood into it when they are bullish on gold.
When gold plummeted in the second quarter of 2013 first on panic selling as major multi-year support failed then later on the Fed’s QE3-taper scare, silver plummeted with it. When gold surged sharply on heavy short covering in the third quarter of 2013, silver surged right along with it. This decades-old trading pattern continued last year, silver dutifully rallying with gold and selling off with gold like always.
Whether you look at the past couple years or four decades, gold fuels silver. And within the Fed’s extreme QE3 anomaly since early 2013, which is starting to unwind, almost 95% of silver’s daily price action was directly explainable by gold’s own. This is stunning, as it necessarily means everything else is in the remaining 5%! Just think of the endless commentaries written on silver, ex-gold they’re barely material.
Because of gold price action’s overwhelmingly-dominant impact on silver sentiment among investors and speculators, gold trumps everything else silver-related. This includes worldwide silver supply-and-demand fundamentals, silver technicals, even silver conspiracy theories. If you want to multiply your capital in silver by buying it low then later selling it high, all that really matters is what gold is going to do.
Back in early November 2014, silver collapsed to a brutal 4.7-year low of $15.37. The Fed’s crazy stock-market levitation had gutted demand for all alternative investments, they were starving for capital and rotting into oblivion. Then just a couple weeks ago, silver slumped again to $15.48. This was less than 1% above that secular low. But silver’s low retest proved successful thanks to gold’s subsequent sharp surge.
In these grossly-distorted markets of the past couple years, the lion’s share of big moves have been driven by the Fed. Its Federal Open Market Committee that manipulates interest rates and prints money meets 8 times a year, and its latest decision was just released on March 18th. And again the Yellen Fed pulled out all the stops to portray itself as dovish, signaling that rate hikes were likely to be delayed and gradual.
The US dollar, which had been rocketing parabolic on rate-hike hopes, collapsed on that. This helped ignite a sharp gold rally as futures speculators scrambled to cover extreme shorts. And naturally as gold surged, silver joined it. Over four trading days starting on that FOMC meeting, gold powered 3.7% higher which silver really amplified to a big 9.8% gain. And I suspect that gold-fueled silver buying is only beginning.
With the Fed’s stock-market levitation seducing investors away, the gold price action in the past couple years has been totally dominated by American futures speculators. When they sell aggressively, gold tanks. When they buy aggressively, gold surges. And since their selling has been so extreme in the past couple of months, they have big near-term buying left to do which will catapult gold and therefore silver higher.
This next chart looks at American speculators’ total positions in gold-futures contracts, both long-side bullish bets and short-side bearish ones. This data is published once a week by the CFTC in its famous Commitments of Traders reports. The latest read before this essay was published reflected these bets as of Tuesday March 17th. And boy were they bullish for gold, which portends a major parallel silver rally.

After its deep early-November secular low, gold was doing really well heading into early 2015. By late January it had powered 14.2% higher to $1303. But then for reasons including the surging US stock markets and US dollar, American futures speculators started to aggressively dump gold. This is readily apparent in this chart, in the recent sharp drop in long-side contracts and sharp rise in short-side ones.
Between late January and this latest CoT report, this single group of traders liquidated an astounding 79.4k long-side contracts. Since each contract controls 100 ounces of gold, this is equivalent to 247.0 metric tons! That is far too much gold supply too quickly for normal gold investment demand to absorb, so gold prices started crumbling. This heavy selling forced speculators’ total bullish bets back under support.
And futures speculators also simultaneously piled on to the short side, exacerbating gold’s sharp selloff. Between early February and this latest CoT report, they sold short 75.8k contracts! They were effectively borrowing gold they didn’t have, dumping it into the market, and hoping to buy it back later at some lower price to repay their debts. This extreme shorting added the equivalent of another 235.8t of gold supply.
Add that up, and in just 6 to 7 weeks American futures speculators alone spewed an astounding 482.9t of gold into the markets! It’s actually an incredible testimony to the strength of latent gold investment demand that this metal didn’t just collapse under such a brutal onslaught. According to the World Gold Council, in all of 2014 global gold investment demand ran 904.6t. Over half of that supplied in weeks is staggering.
Gold only fell 11.8% on that deluge of futures supply, and silver was very resilient with a mere 15.2% loss of its own. Usually silver really leverages gold’s downside too. Silver is looking so bullish today because this extreme gold-futures selling is reversing into buying. We’ve already seen that start since that latest FOMC meeting, which happened to come the very next day after this latest CoT positions data.
The ironic thing about futures speculators, who are considered very sophisticated traders, is they are terribly wrong as a herd at extremes. They are the most bearish right as prices are low and bottoming, as evidenced by high short positions and low long positions. This chart highlights short peaks in red, and all of them occurred when gold was in the process of bottoming right before a major new rally got underway.
While futures speculators have no obligation to reestablish long positions, they are legally required to cover their shorts. The past couple months’ big gold-futures shorting binge was one of the most extreme ever witnessed from a variety of metrics. That left speculators with a whopping 146.2k gold-futures contracts they had borrowed and sold, one of the highest levels in history. These must soon be reversed.
Futures speculation is a radically-riskier endeavor than stock trading. Not only is it a zero-sum game where every dollar won is a direct dollar lost by an opposing trader, but the leverage available is far beyond extreme. The maintenance margin for a single gold-futures contract controlling 100 ounces of gold worth $120,000 at $1200 is merely $4000. That means traders’ leverage can run as high as 30 to 1!
30x leverage is terrifying, as a mere 3.3% move against a futures bet supported by minimum margin will wipe out 100% of a trader’s capital risked. In the stock markets, leverage has been legally limited to just 2x since 1974. Whenever gold started rallying again, which happened in spades after that latest FOMC meeting, these futures speculators would be forced to cover or face catastrophic losses of their capital.
The only way to cover futures shorts is to buy offsetting long contracts to close them. The upside price impact of adding new longs and buying longs to cover shorts is identical. So all the extreme gold-futures short selling of recent months would soon reverse into major buying. And given how high speculators’ total short bets were, the subsequent buying was guaranteed to be big. This chart helps understand why.
The Fed’s anomalous stock-market levitation sparked such extreme short selling that gold suffered its worst quarter in 93 years in Q2’13! Those initial lows around $1200 have essentially held in all of the subsequent speculator gold-futures shorting spikes since. After each shorting binge, speculators were quick to cover and push their bearish bets back down to support. That’s where their exposure wasn’t excessive.
Today that speculator short-position support line is around 60k contracts, or 75k if you want to consider support in horizontal terms. Merely to return to these normal levels, American speculators will have to buy to cover either 86.2k or 71.2k contracts in a matter of weeks to months on the outside. This is the equivalent of 268.2t or 221.5t of gold, both enormous amounts! This will certainly catapult gold sharply higher.
Now remember the latest CoT data by the time this essay was published was as of the afternoon before that latest FOMC meeting ignited this inevitable gold-futures short covering. So some fraction of this has already happened. But we’re only a week into a process that has generally taken a couple months to unfold after the other major shorting peaks of the past couple years. So this gold-futures buying is far from over.
Gold rallied pretty dramatically in the past short-covering frenzies, despite still facing howling headwinds in the form of the levitating US stock markets and the US dollar shooting parabolic. As this latest short-covering episode gets underway, these are shifting to tailwinds as the euphoric US stock markets and US dollar weaken. So this next gold rally initially sparked by futures short covering is likely to grow much larger.
Not only will other futures speculators pile in to chase gold’s upside with new long-side bets, but legions of investors will return via gold ETFs and physical bullion. And as gold powers higher, silver is going to leverage its gains like usual. The first chart illustrated that silver is super-highly-correlated with gold, and mirrors and amplifies its moves. And the second one shows that gold is in for a major short-covering rally.
So with big gold buying fueling silver, the white metal is likely early on in its next major upleg. Investors and speculators alike can capitalize on silver’s next big move in several ways. They can go the traditional route and buy silver coins and bars. Stock traders can deploy capital in the silver ETFs to obtain the same portfolio exposure. These are led by the flagship iShares Silver Trust, which trades under the symbol SLV.
But silver itself and the silver ETFs will merely pace silver’s advance at best. Traders looking to leverage silver’s next upleg can do it with the beaten-down silver stocks. Since silver has fallen so deeply out of favor, the stock prices of the best silver miners and explorers are absurdly cheap. They are discounting a nonsensical future where silver never materially rallies again. So when it does, they’re going to soar.
The bottom line is silver looks to be embarking on a major new upleg, as it just reversed sharply higher after a successful retest of major secular lows. This initial strong silver buying was fueled by major short covering in gold futures, a multi-month process that’s likely just getting underway. Silver sentiment has always been highly dependent on gold’s fortunes, since traders overwhelmingly focus on it to time silver moves.
Over the anomalous past couple years where markets were grossly distorted by the Fed, almost 95% of silver’s daily price action was directly explained by gold’s own. This gold dominance of silver will likely continue as the Fed starts normalizing policy, reversing the market extremes it spawned. So as the gold price mean reverts higher, investors and speculators will flood back into silver and ultimately catapult it to huge gains.

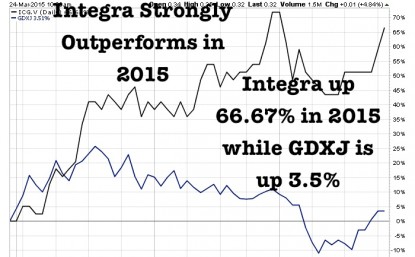
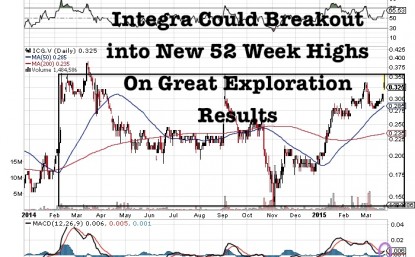
One junior gold miner that I have been very bullish on for many months is outperforming the GDXJ benchmark by a wide margin. Integra Gold (ICG.V or ICGQF) is up over 60% in 2015 alone outperforming the GDXJ by 50 percentage points. This is incredible relative strength and confirms my prediction that this is one of the premier junior gold mining companies on the entire exchange.
They are on the verge of a major 52 Week High breakout as they announce very impressive drill results. These results are significant as they confirm extensions of the Triangle Deposit and show that all zones remain open laterally and at depth. The results are exceptional and I expect more to come as there are eight drills turning on the property with five drills in the Triangle Zone. Look at these high grade results driving the share price to test 52 week highs.
– TM-15-01 (Zone T7) – 14.78 grams/tonne gold (“g/t Au”) over 2.0 metres (“m”)
– TM-15-02 (Zone T1) – 14.79 g/t Au over 10.0 m
– TM-15-05 (Zones T0 and T10) – 8.01 g/t Au over 4.5 m and 11.47 g/t Au over 8.0 m
– TM-15-06 (Zones T5, T10, and T11) – 7.00 g/t Au over 7.0 m, 5.19 g/t Au over 5.0 m and 11.78 g/t Au over 1.0 m; and
– TM-15-08 (Zone T10) – 15.55 g/t Au over 5.0 m
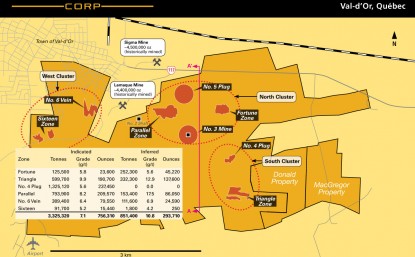
Integra recently announced an updated resource in early February which showed a major increase in the indicated category. Integra Gold (ICG.V or ICGQF) owns 100% of the Lamaque South Gold Project in Val-d’Or, Quebec and is currently drilling 50k meters with eight diamond drills.
If you know of a more active junior in a stable jurisdiction tell me. I can’t find another company as exciting as Integra. Integra recently made a bullish golden crossover of the 50 and 200 day moving average and is hitting new six month highs past $.325 as investors see the significant increase in resource at the highest grade target and the exploration upside on the project.
Integra is a unique junior as they own 100% of a project which has a low cap-ex and high grade returns in an area with a ton of M&A activity. Management has experience operating gold mines in Val D’or and advancing this project into production. It is a dream team of Quebec miners with decades of experience mining in Val D’or.
It appears that the technical team has shown wider zones at depth in the Triangle Zone increasing the overall grade and size of the resource. What is significant about this is that historically the most productive and profitable ore in the neighboring mines were in the lower zones.
This year Integra appears to be extending a number of holes at depths below 900m with up to eight core rigs drilling. I believe the majors are beginning to recognize the growth potential of this high grade gold project in mining friendly Quebec as long as the major institutional funds.
Integra recently appointed Charles Oliver to the board. Charles was the lead portfolio manager for Sprott and has decades of experience evaluating mining investments. He may be an excellent liaison for Integra to gain even further recognition among his network of financiers as they move toward production.
In addition, Integra just added Petra Decher from Franco Nevada to the board and Jacques Simoneau who was the exploration manager for Goldcorp at the Eleonore Mine in Quebec which grew to over 7 million ounces of gold.
Integra is making a bullish golden crossover of the 50 and 200 day and breaking new six month highs made in September of 2014. It could go into new 52 week highs at $.40 once drill results spread through the investment community.
I just interviewed Integra Chairman George Salamis who started his career in Val D’or with Placer Dome. He explains his history working in Quebec and the current technical team assembled to build value and take this asset to the next level. Listen to the interview by clicking here….
Disclosure: I am a shareholder of Integra and the company is a website sponsor. Please do your own due diligence!
1. On March 20, 2015, global gold price discovery changed. Transparency was introduced to the London gold market, as the new “LBMA Gold Price” was launched.
2. In my professional opinion, the changes in London are ushering in an entire new era of gold price stability, consistency, and transparency, and that will attract large money managers to this spectacular asset.
3. The tortoise always beats the hare. Allow me to elaborate: while net gains of $1 – $2 a day in the price of gold may seem boring, with roughly 250 trading days in a year, that can translate into price appreciation of $250 – $500.
4.When the Western fear trade dominated gold, the London gold price was set by shadowy figures making private telephone calls to each other. Volatility was huge, and many money managers used large bank loans to make leveraged bets on the price.
5. Now, the Eastern love trade is starting to overwhelm the fear trade. It’s a theme that will probably accelerate very dramatically in the second half of this year.
6. Also, the transparency in London will attract unleveraged money managers that take a very long term approach to their investments, with a focus on gold stocks.
7. Without the Eastern love trade, gold probably would trade in the $700 – $1000 area, if another financial crisis didn’t occur. That’s because Western fear traders simply don’t buy enough tonnage to overwhelm mine and scrap supply, except in the most extreme and temporary situations.
8. In contrast, the Eastern love trade should produce consistent 5% – 15% annual gold price appreciation, with very limited volatility, for decades to come. I expect to see gold stocks make a “stealth” change over the next 1 -2 years, from being the most hated asset class in the world, to one of the most respected.
9. Please click here now. That’s the daily chart for gold. There’s a strong possibility that an inverse head and shoulders bottom is forming now.
10. Gold may react a bit here in the $1190 area, because of minor trend sell-side HSR (horizontal support and resistance). After the pause/pullback, I expect the rally to continue. Gold should reach $1220, before another pause in the upside action occurs.
11. Please click here now. That’s the seasonal chart, courtesy of Dimitri Speck. Clearly, gold needs to be accumulated, on any short term weakness.
12. There’s more good news in the immediate term, for gold price enthusiasts. March 26 is option expiry day for the COMEX April gold contract. That’s just two days from now, and gold often tends to rally after the options expire.
13. I recently swapped some gold for silver. Silver is referred to as a “game” by many hedge fund managers, but I think they may need to reconsider the use of that moniker. That’s because the increased transparency in the London market applies to silver as well as gold.
14. Please click here now. That’s the daily chart for silver. There’s a great breakout in play, from a bull wedge pattern. Silver could reach the $18.50 area quite quickly, once the March 26 option expiry day is in the past. Traders should book decent profits in the $17.50 – $18.50 zone.
15. A lot of analysts believe that Chinese gold demand is much higher than is reported in the mainstream media. I think they may be looking at a tree, rather than the forest. Here’s why:
16. The London gold market needed to be overhauled, and it was, but Shanghai also lacks transparency. A new “Shanghai Gold Fix” should be operational before this year ends, and I expect it to feature the same transparency that now exists in London.
17. Once the Shanghai market becomes as transparent as London, there will tremendous pressure on the New York COMEX directors, and on US commodity regulators, to bring that market to the level of excellence showcased in London and Shanghai. In 2016, Dubai should also get recognition as another major centre of transparent gold price discovery.
18. Most investors in the gold community believe America will experience another major financial crisis that will result in tremendous money printing, and higher gold prices. Financial meltdowns will occur repeatedly in the future, but when the next one will actually arrive, is perhaps more difficult to discern than most analysts are willing to admit.
19. What is crystal clear, is that the general industrialization of China and India, regardless of economic cycles, is a long term process that is increasing gold demand from both Chindian citizens and central banks. With gold markets around the world entering a fabulous new era of “growth with transparency”, gold stocks are poised to receive enormous inflows of institutional capital.
20. On that note, please click here now. GDX is a key holding for me. This daily chart shows the 14,7,7 Stochastics oscillator in rising mode, with the lead line only at about 38. There’s plenty of room for higher prices before that key oscillator becomes overbought. I think GDX can reach $23.40 if gold reaches $1250. If gold can reach the recent highs of about $1308, GDX should trade near the summer highs in the $27 zone.
21. Please click here now. That’s the daily chart of the Australian dollar, against its US counterpart. There’s a key breakout in play. Please click here now. Australia is viewed as part of the Western world, but its geographic location force the country to benefit from the staggering growth occurring in China and India.
22. A rally in the Australian dollar at the same time as Australian gold stocks rally could createsubstantial profits for investors based outside of Australia. On that note, click here now. That’s the daily chart for Newcrest, one of the world’s top ten gold producers.
23. The company has roughly a twenty-five year mine life, which should produce enormous returns for shareholders, in the Chindian-based “gold bull era”. I recommended buying the stock at $13, $12.25, and $11.50, and two of those three buy points were hit, before the stock blasted higher in the past few days. Still, I will caution traders not to get greedy; some profits should be booked, as the stock approaches the $14.50 area.
24. As this year proceeds, I think Western gold stock investors will find themselves in a fresh new mindset. Fear of lower prices and demands for much higher ones will be replaced with strong confidence, as gold stocks stage a “choo choo train” advance on the price grid, to nicely higher prices!
Stewart Thomson of Graceland Updates, Guest Contributor to MiningFeeds.com
The following interview of Nevada Copper’s CEO & President Giulio Bonifacio was conducted by email and phone in the week end March 19, 2015. The views expressed herein are those of Mr. Bonifacio. The author, Peter Epstein, had no prior or existing relationship with Nevada Copper. Peter Epstein does own shares of the company.
Please provide a description of Nevada Copper for readers not familiar with the story.
We have our advanced stage Pumpkin Hollow project in Nevada consisting of a fully permitted, 6,500 tons/day underground copper mine development, with the main shaft having recently achieved a major milestone by reaching 1,900 feet main haulage level. We expect the nearby 70,000 tons/day open pit copper project to receive permits in June, 2015 as a result of the landmark passage of the Land Bill which was pass by the Senate and signed into law by the President Projected average copper production for the first five years is approximately 75 million lbs/year from our Stage 1 underground mine and an additional 220 million lbs/year from a Stage 2 open pit mine. The project is located near Yerington, Nevada, close to existing infrastructure including road, rail, labor, water and power. We have substantial reserves and resources including copper, gold, silver, as well as a large iron resource all of which have further open extent and upside. [Note: Please visit the Nevada Copper corporate website (www.nevadacopper.com) and review the Pumpkin Hollow virtual tour].
Could you touch upon the highlights of Nevada Copper’s last 2 press releases before I delve more deeply?
Let me start by saying both press releases are important, demonstrating the ongoing de-risking of the company. The February 10th press release offered a detailed update of our progress. Highlights are that the passage of the Yerington land bill was signed into law by President Obama on December 19th. Binding agreements were executed with the City of Yerington to allow for land conveyance from the City to Nevada Copper. This is extremely important because it will consolidate the entire Project on privately held land so that no Federal activities will be needed, just State permitting. Receipt of all State permits for our open pit operation are expected by June.
With the passage of the Land Bill and receipt of permits, the previously announced Stage 2 Open Pit optimization and updated Feasibility Study (see November 4, 2014 News release) is being modified to allow for the inclusion of high grade supplemental mill feed from our East and E2 underground deposits. The results of which will lead to an, “Integrated Feasibility Study.” The February 26th press release announced the achievement of another significant major milestone at our Pumpkin Hollow project, reaching the 1,900 foot main haulage level at its 24-foot diameter concrete-lined production sized shaft. This gives us essential information about the subsurface ground conditions and most importantly we will now move towards a 8,000 meter development drilling program by way of underground drill stations that will commence in early May. This drilling will further test the open extent of the underground deposits and further improve an already high grade profile. Drilling of the underground deposits was suspended in early 2011 in view of the then proven and probable reserve and desire to more effectively and efficiently drill the underground deposits from underground upon accessing the main haulage level..
Again, State permitting for the open pit mining operation will be achieved by mid-2015.
Can you explain the recently announced intention of delivering an Integrated Feasibility Study?
By integrated we mean using a single process facility which would reduce overall cap-ex by eliminating the need for a separate smaller mill. This would allow for synergies and economies of scale with respect to tailings management, permitting, ore stacking and electrical infrastructure, among other things. Integrated also means higher grade in the initial years from the inclusion of underground copper ore averaging about 1.5%-2.0%.
Since we expect to receive permits by mid 2015, we are exploring the idea of reorienting our engineering work on the open pit feasibility study towards a single, large 70,000 tons/day concentrator with dual sources of mill feed. This Integrated Feasibility Study contemplates replacing the staged project (6,500 tons/day Stage 1 underground project followed by a 70,000 tons/day Stage 2 open pit project). Instead, in an Integrated approach, mill feed would comprise an average of 63,500 tons/day of open pit ore blended with 6,500 tons/day of our high grade ore from the Eastern underground deposits.
This is an exciting development which is the result of achieving the landmark passage of the Land Bill, especially as a number of strategic and financial parties have indicated their interest and desire to participate in the Integrated operation. We think the interest we’re receiving in this regard is a vote of confidence in our Pumpkin Hollow project as well as further evidence of the de-risking of our company.
As you said, Nevada Copper has completed the sinking of the shaft at Pumpkin Hollow. It’s been reported that the company will move forward with 800 feet of lateral development? What’s the goal here?
Yes, Nevada Copper is moving forward with approximately 800 feet of lateral development at the 1,900 foot main haulage level and construction of drill stations for purposes of locating and expanding high grade ore to enhance our already high grade profile. A very important step as this will enhance our ability to mine higher grade ore in the early years of production. The lateral development will also establish key work areas for future development and provide for future access to the East ore zones. Of course it will also extend and expand our deposit.
In an integrated Feasibility scenario, how large would the Pumpkin Hollow project be compared to existing or emerging projects?
That’s a good question. In my opinion, an Integrated scenario could result in a substantial new copper producer by North American standards. Estimated production of up to 130,000 to 140,000 tonnes/yr (~280 to 300 million lbs/year) of copper annually in the earlier years. We believe that pulling forward production and mining higher grade copper in the early years could materially improve our project economics. Having said that, we need to see the results of the study before jumping to conclusions.
Roughly speaking, how big a change could these initiatives have on project economics?
Early access to the highest grade ore for the longest period possible would be huge. That’s why Integrating the underground drill program could have a big payoff. We are optimistic and internally we believe that the integrated plan looks promising. All I can say beyond that is we eagerly await the Integrated report results.
Some CEO’s are happy to voice their opinions on future commodity prices, others are content to say, no one can really know. Do you have an opinion?
We follow the major producers statements on future copper prices and, “consensus” prices decks that we see from the research community. We agree with many pundits and industry participants that the copper price will be higher than it is today. We concur with many others that copper is likely to be comfortably above $3/lb, in 2016 and beyond this level as we move to 2017. Below $3/lb there’s zero incentive to bring new copper production online. [Note: copper is up 11% from its January low and has outperformed gold by 15% in the past 60 days–Source Kitco.]
Could you sell or farm out any properties not connected with Pumpkin Hollow?
No, Pumpkin Hollow is our sole asset. However, we might be able to do something with our Iron Ore/Magnetite by-product as a future revenue source. While I can’t reveal details, we have been in serious discussions with a substantial steel player on our iron resource. Please also note that the staged approach allows for a significant growth profile should we move Pumpkin Hollow to production on this basis so effectively one project two mines. With that said and in view of the landmark passage of the land bill the integrated profile is clearly of significance in terms of what it represents both in size, future growth and jurisdiction which is one of best mining locations worldwide.
How advanced are discussions with prospective partners for the Pumpkin Hollow project? Is interest coming from strategic, financial, streaming/royalty hedge fund and private equity sources?
We have been in discussions with all of the above types of funding parties for quite some time. Discussions are progressing nicely, with parties at various stages of due diligence. As I mentioned earlier the impetus to engage in the Integrated Feasibility Study came partly from us, but also from some of these interested parties.
Nevada Copper’s stock is up 28% since the beginning of February and the copper price is up 10%. Are more investors are, “getting it?”
Absolutely, slowly but surely the investment communities are finally getting that Nevada Copper will be a fully permitted project of significant size in an ideal safe mining jurisdiction in one of the best mining States in the U.S. Further, we have infrastructure, no currency risk and all the community and political support possible.
Can you please give readers a snapshot of your capital structure, especially your cash balance?
Sure. We have 80.5 million shares outstanding and US$ 36 million of cash as of December 31st. We have 7.6 million options at an average strike price of C$ 2.25 per share, so we have 88 million shares fully-diluted. [Note: March 19th share price was C$ 1.73 for a market cap of C$ 139 million].
It’s been Management’s goal for the 2015 underground drill program is to find 2%-3% Copper equivalent grades. What would that do for the overall underground grade?
We want to identify additional high grade 3%+ ore blocks for early production and incorporate those prospective intersections into our production plans as the underground deposits are high grade and several drill intercepts have returned value greater than 5%..
How important is the company’s 20,000 meter surface drill campaign, is it largely infill drilling or step out drilling?
I’m glad you asked that. It’s both… and it will provide continued news flow in which we can update stakeholders along the way. The leverage in our project is in the open pits. We think that this drill program could add significant size and grade which we hope could lead to a re-rating of our valuation. This by no means takes away from the 8,000 meters of drilling we are doing underground, which will add size and and grade. In fact, this could be very high grade ore, which would really benefit our operations in the early years.
To the extent that you feel Nevada Copper is undervalued, why might that be?
Well, every CEO believes his or her stock is undervalued! For early stage companies, under or over valuation is really hard to call. For us, we can’t be entirely sure why our advanced stage, development company is undervalued. There may be misconceptions on our land bill and our permitting progress. Or, concern over how we will fund our company through to initial production. We have relatively low daily trading volume in our stock, which could hinder institutional investment. Having said that, our under-valuation comes at a time when many peers are also undervalued. Recent weakness in copper prices has not helped our cause. We have six sell-side analysts covering us with price targets ranging I believe from about $2.5 to $5 per share. I see no reason why our stock couldn’t get into that range this year. Although to be clear, that’s not a prediction on my part.
As we close the gap with producing companies and de-risk our project even more, we think that our current valuation of C$ 0.03 per proven reserve pound in the ground will increase. Consolidation in our sector has frequently been done at valuations of more like C$ 0.10 – C$ 0.15 per proven reserve pound in the ground. There’s plenty of room for that spread to narrow.
Are there any misconceptions about Nevada Copper that you would like to address?
We already touched upon that. I would add that I hope investors know that Nevada Copper should be fully permitted for our large open pit project in the short term. Perhaps some don’t comprehend that we have a project with significant size and grade, especially if our Integrated Feasibility comes in with strong economics. I would remind investors that Pumpkin Hollow is located in one of the safest and best jurisdictions on the planet. I would point out that among the top 10 copper producing countries, there’s China, Russia and the DRC, not to mention one of the worlds’ largest copper mines owned by Freeport-McMoRan in Indonesia that’s been in the news lately. In fact, I would much rather be in Nevada than Chile or Peru, two other top 10 producing countries.
The mining exploration business is very risky, with about 3 out of a 1000 good looking prospects becoming mines.
That’s why some smart small exploration companies follow the “prospect generator” business model of generating ideas and finding more established partners to pay for the drilling. This shares the upside, but more importantly, gives the prospect generator multiple shots at discovery without unnecessary equity dilution.
An example is Vancouver-based, Mexico-focused micro-cap
Evrim Resources (TSXV:EVM), which has 5 partner funded drill-programs planned for 2015.
The company is interesting for a few reasons. To start with, it boasts some impressive backers include John Tognetti (Haywood Chairman) Rick Rule (Sprott USA Chairman), Paul van Eeden (fund manager) and Adrian Day (fund manager).
The company has a roughly $6.2 million market capitalization and about $3.1 million in cash with its shares trading at $0.185. A month ago, Evrim’s CEO told me that cash runway could last until early 2017.
All previous financings done by Evrim have been at much higher prices, with rounds at $0.50, $0.32, and again at $0.32. The company has never issued warrants, which is unusual in junior mining finance and a positive for Evrim as it protects the share structure.
Additionally, the thing about Evrim that really caught my eye is the appointment of Alain Charest as Senior Geologist back in early February. Mr. Charest has made several discoveries in Mexico and is one of the most experienced and active explorationists in the country.
It was for these reasons we asked CEO.ca cameraman Carter Smith to visit the Evrim booth at the PDAC, the world’s largest mining convention, on March 1, 2015 in Toronto. Both CEO Paddy Nicol and Senior Geologist Alain Charest were present to quickly discuss the company’s 2015 plans.
Here is a transcript of the above video:
Paddy Nicol, President and CEO: For 2015, for Evrim, we have 4 drill programs planned on 2 of our projects with one of our exploration partners, Silvercrest. We’ve also got a 5th drill programmed planned with Arcellor Mital down in Sonora. The first four for gold exploration, and the 5th drill program is for iron-ore exploration.
The first set of results came out earlier last week, and it was a discovery on one of our projects. First time ever, we’re looking forward to seeing additional results come from that project over the next little while.
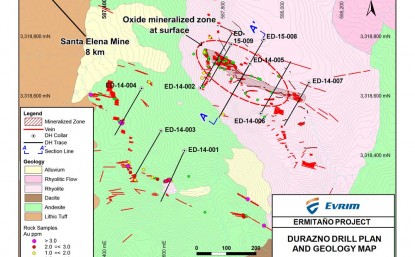
What we’re looking for, is a discovery on our Ermitaño project, and we’re basically looking to build resources now, and step out from what they’ve found already. The first stage program was a success and it’s basically building on what they’ve discovered to date.
Alain Charest, Senior Geologist: I’ve 21 years of experience in Mexico, and a few discoveries behind my belt. Joining the team of Evrim, I think there’s very good opportunity right now to pick up some very high quality projects in Mexico. It’s time to go shopping, be selective, there’s some good stuff out there. I think with the team of Evrim in Vancouver and our team in Mexico, there’s a good opportunity to bring some new projects to the company that’s basically going to give some more value to the shareholders and Evrim itself.
Forward Looking Information
This interview includes certain statements that may be deemed “forward looking statements”. All statements in this interview, other than statements of historical facts, that address events or developments that Evrim Resources Corp. (the “Company”) expects to occur, are forward looking statements. Forward looking statements are statements that are not historical facts and are generally, but not always, identified by the words “expects”, “plans”, “anticipates”, “believes”, “intends”, “estimates”, “projects”, “potential” and similar expressions, or that events or conditions “will”, “would”, “may”, “could” or “should” occur.
Although the Company believes the expectations expressed in such forward looking statements are based on reasonable assumptions, such statements are not guarantees of future performance and actual results may differ materially from those in the forward looking statements. Factors that could cause the actual results to differ materially from those in forward looking statements include market prices, exploitation and exploration successes, and continued availability of capital and financing, and general economic, market or business conditions. Investors are cautioned that any such statements are not guarantees of future performance and actual results or developments may differ materially from those projected in the forward looking statements. Forward looking statements are based on the beliefs, estimates and opinions of the Company’s management on the date the statements are made. Except as required by securities laws, the Company undertakes no obligation to update these forward looking statements in the event that management’s beliefs, estimates or opinions, or other factors, should change.

Billionaire mine developer Robert Friedland has said that real wealth in the mining sector is created by finding something.
Friedland would know this, having driven 5+ world-class mining discoveries in his career. He knows that to find a mine you have to spend a lot of money, and drill a lot of holes.
Another secret weapon of Friedland’s is people; he surrounds himself with impressive technical minds, and provides them with big budgets and plenty of autonomy to test their theories. Statistically speaking, explorationists who have already found mines are more likely to make future discoveries.
I first met Dave Broughton on an Ivanhoe Mines field trip to South Africa and D.R. Congo last year. Friedland stood beside Broughton at the site of Ivanhoe’s world-class Kamoa copper discovery. There, a Broughton led team had chased an exploration concept from stream and soil anomalies to drill targets and eventually, a world-class discovery. Kamoa was the first major copper discovery in the D.R.Congo in a hundred years.
At the 2015 PDAC conference in Toronto, Dr. Broughton and Mr. Friedland received the Thayer Lindsley International Discovery Award for their work finding Kamoa. This was the second time the Ivanhoe Group had won the prestigious award at mining’s largest convention.
Just a few hours before Dr. Broughton received the award, he met up with Exploration Insights editor Brent Cook, CEO.ca cameraman Carter Smith and myself to talk a bit about his exploration methodology, as well as his plans for a next discovery.
David Broughton, Kaizen Discovery, Brent Cook, Exploration Insights, and Tommy Humphreys, CEO.ca discuss Kaizen’s Discovery Trail at the PDAC in Toronto, Mar 1, 2015:
Tommy Humphreys: I’m here with Dave Broughton who is the exploration boss at Kaizen Discovery as well as Ivanhoe Capital Group, a very accomplished geologist, and my friend Brent Cook, editor of Exploration Insights. I wanted to introduce these guys because I think some of the work that Kaizen is doing is very fascinating and Brent hadn’t heard the story yet, and knows more than I do. To start off, what is the award that you’re receiving today and what brings you to PDAC?
Dave Broughton (DB): We are receiving, on behalf of a whole lot of people, the Thayer Lindsay Discovery Award, which is given every year by the PDAC for a significant international discovery. It’s the second time Ivanhoe Group has won this. They won it for OT at the inaugural event when they first awarded it a number of years ago.
Brent Cook (BC): So now you’re up in the Yukon for something different?
DB: Kaizen, late last year, picked up a package of land and took over a small company with an adjoining package of land up in the Western part of Nunavut, and its another stratiform copper play like the won we found at Kamoa [Ivanhoe Mines’ DR Congo copper discovery]. There’s copper everywhere you land, so there are good signs when you just get on the ground and wonder around. That’s been appreciated for a long time, it was discovered initially in the 60’s and some work was done then, but really, nothing’s happened for about 20 years. The last group of people to be in there in a significant way on the play we’re really excited about was Cominco and that was in the early 90s.
There really are two plays, there’s a volcanic hosted copper play, that has a lot of very high grade copper, well known, load copper, I guess you’d call it, in volcanic rocks, and there’s a more, less appreciated play, which is what we’re really excited about, and it’s in the sedimentary rocks overlying it. The rocks are similar in age to those in the copperbelt which is intriguing, and there’s mineralization that’s outcropping and in most places its covered, certainly 95% cover. 150 kilometer strike of these sedimentary rocks with copper showing here and there but it really hasn’t been tested.
BC: How many holes have been put into this?
DB: Well, Cominco put about a half a dozen holes at the far eastern end of the area and the rest is basically untouched.
BC: What did they find?
DB: They hit mineralization, they didn’t hit an ore grade intersection over ore grade widths, but there are lots of holes at Kamoa or Kupferschiefer, or anywhere you want to go in these systems, you don’t always hit ore on your first hole. The usual things right: persistent and all that.
BC: What sort of width and thickness are we talking in this horizon from the drilling you’ve got so far?
DB: You’ve got mineralization over meters in lenses and so on. There is some government geophysical data that gives up some idea as to what the big structures might be that might help control mineralization. We have some old prospecting that we know about. It’s really going to be getting on the ground and walking those contacts and making up our own mind of where we can find mineralization. And then we’re looking at doing a series of widely spaced stratigraphic holes, just like you would in other districts. You’ve really got to step back. These things go for kilometres, Kamoa is 50 square kilometres in area, so you really have to look at it at a base of scale and then narrow in on what you find. We’re going to take a big scaled approach to start with and test as much of the strike length as we can, I think.
BC: What’s the access like?
DB: The access is actually excellent. We’re just south of the old town of Coppermine.
BC: Ah, the old famous Coppermine?
DB: It’s a short helicopter ride from there to the project. There’s an airstrip, regular air service. There’s an old air strip actually on one of the properties we’re going to use for direct access with a fixed wing aircraft, so it doesn’t get much better in that sense.
BC: Conceptually, what do you need to see, what do you need to find there to take it to the Kamoa stage, or up to a stage where its a world class deposit or something that’s really profitable.
DB: Like anywhere, you want to drill a discovery hole that’s got an ore grade and width and then you want to step out from that and build tons. That’s what it’s all about.
BC: What grade do you need?
DB: Up there, good question. Kamoa’s average grade is close to 3%, there are other deposits around the world that have that. If you get 3% copper of sufficient width, you’re in business.
BC: So that’s how we can judge your program. Although admittedly the first round is basic geology which I think is really smart. Get a handle on what’s going on and then zero in. If we’re going to watch this play, it’s about, first off, we get the concept, it’s coming together or it’s not coming together, here’s our targets, next round or two rounds after that, we’re getting low cost minable widths over 3+% copper, okay.
DB: That’s the objective but like anything, you find what you find, and you go with it. They are mining the Kupferschiefer at under 2%. It really depends on all sorts of other factors, I’m not going to be able to predict that.
BC: You’re not that good yet?
DB: Not that good yet, sorry.
BC: What sort of shape is the company in? How much cash do you have and what’s your market cap?
DB: We’re in good shape. We’ve got a unique strategic relationship with the Japanese trading houses, they fund a number of our exploration projects, and we’ve got a long history of relationships with them, going back to the Ivanhoe Group as well. That’s kind of our key strategic difference that we’ve got. In addition, we’ve got a treasury and no debt so that helps too.
BC: They are funding by way of placements, or getting a piece of the project, or an offtake agreement, what’s their relationship?
DB: It varies project to project. We have projects in BC where they are funding the exploration directly. They are interested in the offtake in the long term for Japan that’s really what’s driving them. And we’re interested in the metals that work for that reason.
BC: That was Kaizen. They are looking for stratiform copper in Nunavut. Actually pretty interesting concept. If they can pull together a large enough volume of rock at 3%, which is what they’re after, it sounds like the infrastructure is not too bad, that could be quite significant. They’ve got a good deal structured with a number of Japanese groups, so its worth watching for sure.
Discuss @ chat.ceo.ca
FORWARD-LOOKING STATEMENTS
Statements in this video and article that are forward-looking statements are subject to various risks and uncertainties concerning the specific factors disclosed here and elsewhere in Kaizen’s periodic filings with Canadian securities regulators. When used in this video and article, words such as “will, could, plan, estimate, expect, intend, may, potential, should,” and similar expressions, are forward-looking statements. Information provided in this document is necessarily summarized and may not contain all available material information.
Although Kaizen has attempted to identify important factors that could cause actual results, performance or achievements to differ materially from those contained in the forward-looking statements, there can be other factors that cause results, performance or achievements not to be as anticipated, estimated or intended. There can be no assurance that such information will prove to be accurate or that management’s expectations or estimates of future developments, circumstances or results will materialize. As a result of these risks and uncertainties, the results or events predicted in these forward-looking statements may differ materially from actual results or events.
Accordingly, readers should not place undue reliance on forward-looking statements. The forward-looking statements in this news release are made as of the date of this release. Kaizen disclaims any intention or obligation to update or revise such information, except as required by applicable law, and Kaizen does not assume any liability for disclosure relating to any other company mentioned herein.
Disclosure: Author is a small shareholder in both Ivanhoe Mines and Kaizen Discovery. This is not investment advice. Consult a professional investment advisor prior to making any investment decision.
The following interview of CEO Corrado De Gasperis of Comstock Mining (LODE) was conducted by phone and email over the week ending March 16th. The views and opinions expressed by Mr. De Gasperis are entirely his own. I, Peter Epstein have no prior or existing relationship with any company named herein.
Please describe Comstock Mining (LODE) to readers not familiar with your story.
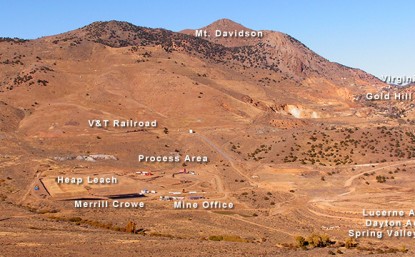
We are a Nevada-based, permitted and producing gold and silver mining company, trading on the NYSE MKT exchange under the symbol LODE. The Company has already achieved unprecedented results, like consolidating substantially all of the historic, world-class Comstock Lode mining district south of Virginia City, with approximately 8,300 acres (over 10 square miles) along an approximately six-mile long, contiguous mineralized trend. The Comstock Lode district is best known for producing over 8 million ounces of gold and 192 million ounces of silver, primarily in the late 1800’s, including 33 bonanzas, but no one has ever been able to take this massive, fragmented, complex property position with all of its dynamics, and put it under one roof, until now (not to mention permitting it and going into production).
There’s been a lot of local press reports about a road adjacent to your property that needs to be re-routed. Is this a big a deal, will it impact production?
The road in question is a state route, SR-342, that was built on loose fill and eroded from weather events to the point that it needs to be re-routed. We will move the road as we were planning on doing anyway, but it will help the State, help the County and accelerate many of our business and reclamation plans. Classic win-win-win.
Some shareholders feel that production growth has been slower (or even much slower) than expected. Do you agree?
Yes, we had originally planned for ramping up Lucerne to a 40,000 gold equivalent ounce run rate per annum last year, but those mine plans, and a lower gold price, required us to modify. We increased our economic cutoff rate and we also invested significant resources on enhancing the geologic controls, resulting in a much more reliable and predictable mine plan. These cumulative changes initially resulted in much higher strip ratios before we worked through that section of the mine and reached the flatter, lower strip sections of the Lucerne Mine.
Concurrently, we also dramatically reduced costs, by over $11 million dollars, year on year. Today, we not only have a drastically improved strip ratio but we can also leverage a much lower and more flexible cost structure as we expand. During this same period, we received permitting approvals to expand the scope of the initial mine area, going from about 180 acres under permit to approximately 1,300 acres under permit. I am proud of how our team responded to the adversity and we feel we are much better positioned for profitable growth by working through that adversity.
Why isn’t your second mine, Dayton, not in production yet?
The Dayton is our second, high priority target area. Our original drilling, although limited, quantified over 0.5 million gold equivalent ounces of initial resource. Last year, we restructured the purchase to completely eliminate the royalty (it’s 100% owned and royalty free) and rezoned all the lands to a mining designation. We have since done geophysical, structural and core drilling, with significant continuity of the mineralized structure confirmed and further discoveries identified. We are planning to complete the exploration and development drilling this year, formalize our feasibility for the full mine plan and facilitate the permitting, all in 2015.
What is the biggest pushback you get from prospective investors in Comstock Mining?
Investors have been waiting for cash flow and are excited to see that cash flow reinvested in exploration and development with positive results. Our recent drill results on the Eastside of Lucerne are the first example of that. The last three quarters, we were cash flow positive from operations, yet the Company was still reducing costs, expanding permits, acquiring and very effectively re-zoning land, developing the mine, and expanding the heap leach pad. With dramatically lower costs, we guided to full profitability for the first half of 2015. The stronger that track record, the stronger the investment interest will be.
Can you give us a snapshot of your latest capital structure including cash, preferred shares and debt?
Our capital base has been strong since we recapitalized in 2010, with an exceptionally high quality base of institutional investors. We have 89.8 million shares outstanding, with $48.6 million of additional permanent equity in a preferred stock, which, if converted, represents another 53.6 million common shares, for a little over 143.4 million fully diluted shares. At the end of 2014, the Company had approximately $1 million drawn on a $5 million Revolver, $6.9 million in equipment financing and $3.6 million for notes payable on land purchases. The Company also had $5.3 million in cash.
What are the terms of the preferred shares? Do you believe the preferred shares are an overhang on Comstock’s stock?
No, not since our preferred stock represents permanent equity capital that has no debt-like features. The holders of the preferred stock have been investors for between 5-10 years, and have provided significant funding for the initial consolidation and production growth phases of the Company. The preferred stock is convertible to a fixed underlying number of common shares. The average conversion price is $1.10 (ranging from $0.65 – $1.65).
To the extent that you think Comstock is undervalued, why do you think that might be?
Investors want to see sustainable positive cash flows. We are confident we are on that mark now and coupled with a better appreciation of our significantly lower costs, driven by improved mine planning, better grades, lower strip ratios and excellent yields, should result in much better valuations. Overall, the market is valuing gold equities as if gold was closer to $850. We feel the best upside will come from those few companies that have their permits, producing with good cost structures and yet retain tremendous exploration upside potential (remember we control the entire district). Its’s these types of companies, like ours, that will deliver the most significant equity upside.
Can you name any of your largest shareholders? What percentage of your shares are owned by management & the Board?
We have one of the strongest capital bases with funds like Van Den Berg Management (Century Asset), US Global Investors, Inc., Sun Valley Gold LLC, The Vanguard Group, Inc., Gabelli Funds LLC, Solus Asset Management, Wedbush Securities, with the largest holder being the Winfield Group. Our management and board have about 4%, and when you include our Chairman, its over 35%.
Please describe Comstock’s all-in costs for gold equivalent ounce for the latest reported quarter or for 2014.
During the fourth quarter of 2014, our all-in cash costs was $1,243, with all cash mining costs at $843 per gold equivalent ounce, general and administrative at $261 and capital at $139 per gold equivalent ounce. In December, we achieved our cash mining cost target of less than $750. For the first six months of this year, we anticipate being below the $750 per ounce with our all-in costs below $1,000 in the second quarter.
What are the catalysts to watch for in 2015?
In Lucerne, we are expanding our mine eastward, based on recently received permits and rapidly developing feasibility for a higher grade, underground operation. We also plan a second expansion in the Dayton Resource Area. For Dayton, we plan on further drilling, expanding the known resource, finalizing a mine plan and permitting and commissioning our second mining operation. Our most important catalyst, is our cash flows. In 2014, we turned positive with cash flow from operations and we are now building on that success with lower strip ratios, better yields and absolute lower costs across all activities.
Assuming smooth sailing in 2015, roughly how many ounces of gold equivalent ounces might you be able to produce in 2016?
Optimally, in 2015, we would have two sources of ore, from Lucerne (surface and underground) and one from Dayton. This would ensure a consistent 40,000 ounce run rate, per annum, scaling up to potentially 75,000 ounces, from all three sources. There is still some drilling and development to do but the path is there. Ultimately, there is capacity to do much more, but it’s a good growth path for 2016.
Are there any misconceptions about Comstock Mining that you would like to address?
The obstacles associated with mining in the historic district had more to do with regulatory complexity and developing a strong social license to operate, more than anything else. We have done that. The historic Comstock Lode’s geology extends much further than previously understood, and by all modern definitions, is significantly under explored. Our land position continues to grow in size and value and we will build on the historical and current geological data to produce a robust model for practical, responsible economic development.

Coming into 2015 and the first month of this year, the resource industry was abuzz with fresh hopes that the price environment was now changing for the better. Two big acquisitions also laid renewed hopes in resurgence in M&A activity. Those headline-capturing acquisitions were Goldcorp Inc.’s (NYSE:GG) half-billion-dollar acquisition of Canada’s Probe Mines in January of this year and Tahoe Resources’ (NYSE:TAHO) billion dollar purchase of Rio Alto Mining a month later.
Prices of the two major metals – copper and gold – have slipped from their highs earlier this year. But, this has not stopped analysts from predicting that 2015 will still see increased merger activity.
There are several reasons for this. One, as intelligently commented on by a recent SilverSeek article, due to the challenging price environment, over the past several years many majors have cut their exploration budgets, in some cases by as much as 75%. That means that majors are at risk of losing product and essentially mining themselves out of business. As a result, we have major miners that are hungry for new supply, which they can get from buying up attractive, well-managed junior mining companies.
Also a factor into the equation is that due to the price climate, junior mining companies are cheap and make for very attractive acquisition prospects.
The question is, which mining companies are the attractive ones? And what makes them so attractive for acquisition?
Answering this question means returning to what many majors need – more resource to replenish their diminishing supplies. So that means that shovel-ready companies are the ones that will be ripe for the picking.
The traditional 3-million-ounce threshold for acquisition is out the window – it’s now quality and grade of product over quantity.
Toronto-based mining consultant Randy Reichert of NW3 Mining Consultants, Inc. has been providing analysis recently on M&A expectations this year. Reichert happens to support the importance of quality of asset over quantity: “Mining companies that have high-grade product, that have low CAPEX and little debt and that operate in politically stable countries – those are the companies that majors will be increasingly targeting … Major mining companies want to have as few roadblocks as possible blocking from production. Companies that have high debt or are in early stages of development will probably be skipped over…”.
Randy Reichert adds, “In certain parts of the world, water rights and a mine’s ability to have ready access to water will also play a key role.”
As a mining consultant, Randy Reichert assists in the coordination of mergers and acquisitions between companies. He also helps miners increase their production efficiency and lower their costs.
Lower development and production costs and increased efficiency are especially critical for miners as the challenging price environment continues.
Small things, seemingly anodyne at first glance, add up. Things like unchecked or unnecessary consultant expenses or misplaced equipment can make a significant impact on a junior mining company’s bottom line and its competitiveness in the industry.
Over the long-term, a mining company’s focus on the wrong type of ore bodies can also risk their competitiveness in the industry.
“Gerald Whittle of Whittle Consulting makes a very poignant point,” says Reichert. “He says that mines should be considered money mines and not gold mines or copper mines or some other precious metal … Mining mangers that can focus on profit, rather than focusing on mining as much metal as possible, will succeed.”
To return to mergers and acquisitions, one company that’s been much discussed as being the next big target is Exeter Resource Corp. (NYSEMKT:XRA), a Canadian gold miner that operates the Caspiche Project in Chile. One of the reasons why the company is such a high-profile M&A candidate is because it fulfills every criterion now important to majors.
Exeter owns its Caspiche mine. The company has over $30 million in the bank and no debt. The Caspiche mine in Chile is also no slouch, offering a resource of 37.9 million ounces of gold. This makes the company very attractive for major bids.
The Caspiche mine also has a high yield of oxide gold resources, roughly 1.7 million ounces over a ten-year timeline. Although it’s of modest grade, what makes it attractive is that the gold is shallow enough in the mine to allow for low mining and processing cost. Modest grade but low production cost is a boon for any major company searching for a takeover prospect.
“The fundamentals of Exeter Resources does make it a very attractive acquisition potential,” adds Randy Reichert. “But, what I like most is the current management at the company. Based on past performance, Exeter management understands how to run an efficient, cost-conscious company. Moreover, having sold Extorre Gold Mines several years ago, they understand what it takes to facilitate a successful merger and acquisition in the current market.”
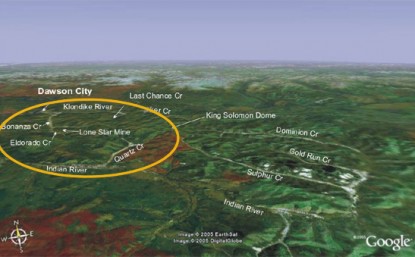
Tonight is the season finale of the popular Discovery Channel program Gold Rush, and viewers are set to find out how much gold the Hoffman family dug up this season.
Klondike Gold Corp (KG.TSXV), a fledging junior miner I own stock in and have worked with, will receive 15% of whatever Gold the Hoffman’s produce this year.
Klondike’s a rare junior in that it earns cash flow from a television deal and gets free exposure to millions of viewers.
The company needs all the help it can get to convince investors its not another Klondike Gold Scam. Previous promoters who operated the property vastly over promised and under delivered. Millions of investor dollars were lost to questionable related party transactions, and many exploration dollars never made it into the ground.
Popular exploration analyst Brent Cook is not yet convinced Klondike Gold Corp represents a good opportunity.
Cook and I were walking around the floor at PDAC last Monday with cameraman Carter Smith, making short films with some friends and business associates.
Peter Tallman, President and CEO of Klondike Gold, and Cook linked up to discuss how Klondike has been restructured and what its exploration potential is.
The fast pace, at times awkward meeting captures the experience of junior mining CEO trying to pitch recognizable mining analyst for a coveted endorsement, which he is ultimately unsuccessful in doing.
Exploration industry insiders say Brent Cook uses the word “no” more than anyone in the business. That’s why his newsletter is the most expensive ($140 per month here) and highest valued among high-up mining and investment industry executives.
I think Peter did a good job of keeping up with Brent and will be watching him on tonight’s season finale of Gold Rush.
Recent news: Klondike Gold Approves $800,000 Yukon Exploration Budget for 2015
Please support CEO.ca by sharing this article.
Discuss with die hard junior resource investors at http://chat.ceo.ca
I am biased and financially exposed to Klondike Gold Corp and do not intend this article to be investment advice of any kind. Speak to a licensed investment advisor before making any investment decision, as well as read the risks in Klondike Gold Corp.’s Annual Information Form filed on SEDAR.
ABOUT KLONDIKE GOLD CORP.
Klondike Gold Corp. is a Canadian exploration company with offices in Vancouver, British Columbia, and Dawson City, Yukon Territory. The company is focused on exploration and development of its Yukon gold projects located in the historic Klondike region covering 25,000 hectares of hard rock and 2,000 hectares of placer claims including “McKinnon Creek” leased to Todd Hoffman/Jerusalem Mining LLC and featured on the Discovery Channel show “Gold Rush”.
Disclaimer for Forward-Looking Information
This video and article contains “forward-looking information” and “forward-looking statements” within the meaning of applicable securities laws. This information and statements address future activities, events, plans, developments and projections. All statements, other than statements of historical fact, constitute forward-looking statements or forward looking information. Such forward-looking information and statements are frequently identified by words such as “may,” “will,” “should,” “anticipate,” “plan,” “expect,” “believe,” “estimate,” “intend” and similar terminology, and reflect assumptions, estimates, opinions and analysis made by management of Klondike in light of its experience, current conditions, expectations of future developments and other factors which it believes to be reasonable and relevant. Forward-looking information and statements involve known and unknown risks and uncertainties that may cause Klondike’s actual results, performance and achievements to differ materially from those expressed or implied by the forward-looking information and statements and accordingly, undue reliance should not be placed thereon. Risks and uncertainties that may cause actual results to vary include but are not limited to the availability of financing; fluctuations in commodity prices; changes to and compliance with applicable laws and regulations, including environmental laws and obtaining requisite permits; political, economic and other risks; as well as other risks and uncertainties which are more fully described in our annual and quarterly Management’s Discussion and Analysis and in other filings made by us with Canadian securities regulatory authorities and available at www.sedar.com. Klondike disclaims any obligation to update or revise any forward-looking information or statements except as may be required.
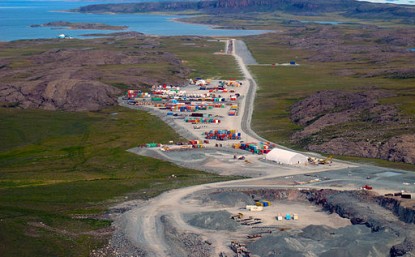
Briefly: In our opinion speculative short positions (full) in gold, silver and mining stocks are justified from the risk/reward perspective. We are keeping the stop-loss levels at their current levels, which means that we are effectively keeping some gains locked in and at the same time we’re allowing the profits to increase.
Gold moved a little higher yesterday only to disappoint in the following part of the session. Gold stocks plunged without looking back. The decline continues – will it end soon?
Not likely. Let’s see a few reasons why we think this will be the case, starting with the short-term gold chart (charts courtesy of http://stockcharts.com).
Click here for reference chart.
Our yesterday‘s comments remain up-to-date:
Gold moved decisively lower last week and the final closing price of the week was only $2 higher than the lowest weekly close of the entire 2011-today decline. The previous lowest weekly close formed on Nov. 28 2014 at $1,165.80 and last Friday gold closed at $1,168.20. If gold closes just a little lower this Friday, we’ll have a breakdown in terms of weekly closing prices with very bearish implications for the following weeks.
It could be the case that gold bottoms in the May – June time frame close to the $1,000 level.
On a short-term basis, we see that gold dropped sharply and significantly on Friday. The volume was high, so it doesn’t seem that the decline was a fake move. Naturally, we could see some sideways trading here (gold is already moving a bit higher today, which is in tune with the above) as gold is likely to take a breather, but it doesn’t seem likely that the decline is over yet.
Gold remains in a declining trend channel and its likely to continue declining without a bigger counter-trend upswing until reaching our next interim target level based on the previous major lows.
Gold moved a little lower yesterday but we would not be surprised to see a small rally in the coming days, which would not take gold above the declining trend channel and thus would not change the bearish outlook.
Since not much changed in the silver market (the medium-term outlook remains bearish), we will move right to the mining stock sector.
Click here for reference chart.
The HUI Index moved lower once again and is even closer to its 2008 and 2014 lows, which has bearish implications as it increases the odds of a confirmed breakdown below them. Our yesterday’s comments remain up-to-date:
Gold stocks plunged sharply on Friday and are now well below their 2013 lows. It seems that they are back in the decline mode and their previous outperformance was indeed a very temporary phenomenon, as we expected. Once miners move below their 2008 and 2014 lows at about 150, we’ll likely see a slide below 120, perhaps even (very temporarily) below 100. Our target area in this range remains up-to-date.
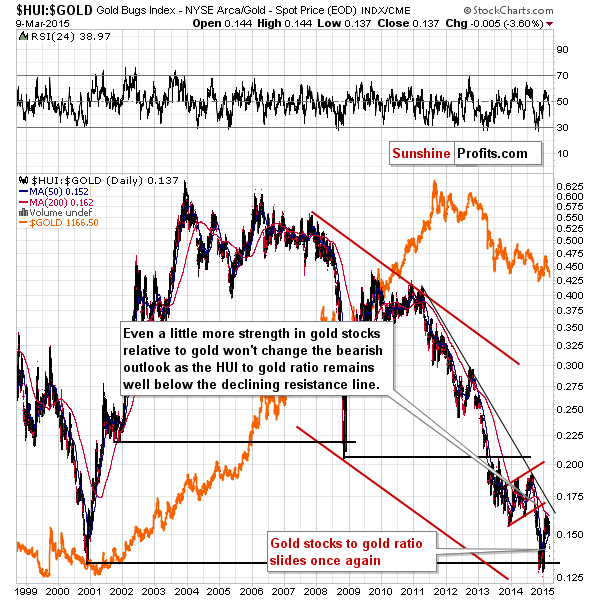
On the above chart we see that the gold stocks‘ previous outperformance didn’t invalidate any trends – the decline remains in place and the outlook remains bearish.
Interestingly, given the current value of the HUI to gold ratio, the size of its decline on Friday and the fact that we are likely to see more declines in the coming weeks, it seems likely that the ratio will move below the previous 2000 and 2014 lows. In other words, gold stocks will quite likely be cheaper relative to gold than they were at any point during this entire bull market. It seems that we will have an extremely favorable buying opportunity in the following months – it’s definitely the right time to be paying attention to what’s going on in the precious metals market.
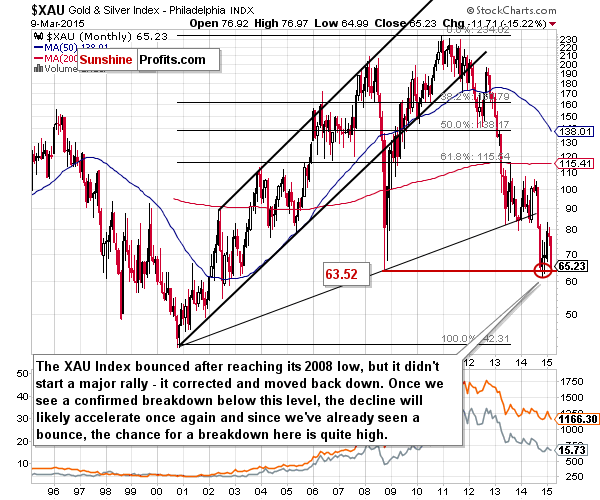
The XAU Index (that includes both gold stocks and silver stocks) is already extremely close to its 2008 and 2014 lows. Only a little more weakness is needed for this index to break below these lows and to move even lower. The next major support is very low – close to the 42 level – so there will be significant downside if the breakdown is confirmed. It will be critical to watch the situation develop in the upcoming weeks and react to breakdowns and their confirmations.
Overall, yesterday’s session confirmed what we wrote previously.
Summing up, the precious metals sector moved much lower on Friday and it seems that it was another step in the current true direction of the market. We are likely to see a small corrective upswing here, but it doesn’t seem that we will see a more visible correction until we see gold close to its 2014 low. Gold stocks are now once again underperforming gold, which serves as a confirmation that the correction is over and the decline will now continue.
Even though the size of the profits on the current short position may suggest that’s it’s worth taking them off the table (we opened the short position on Jan. 23 when gold was at about $1,300), it seems that the risk/reward ratio still favors keeping the position open as it doesn’t seem that the decline is over. Even though gold has already fallen significantly, it’s still likely to decline even more in the coming weeks and it is this outlook that makes us think that the short position remains justified at this time.
To summarize:
Trading capital (our opinion): Short positions (full) in gold, silver and mining stocks with the following stop-loss orders and initial (!) target prices:
Gold: initial target level: $1,135; stop-loss: $1,234, initial target level for the DGLD ETN: $85.48; stop loss for the DGLD ETN $65.45
Silver: initial target level: $15.10; stop-loss: $17.23, initial target level for the DSLV ETN: $74.05; stop loss for DSLV ETN $48.36
Mining stocks (price levels for the GDX ETN): initial target level: $17.13; stop-loss: $21.17, initial target level for the DUST ETN: $23.49; stop loss for the DUST ETN $11.35
In case one wants to bet on lower junior mining stocks’ prices, here are the stop-loss details and initial target prices:
GDXJ: initial target level: $22.13; stop-loss: $27.38
JDST: initial target level: $14.58; stop-loss: $7.10
Long-term capital (our opinion): No positions
Insurance capital (our opinion): Full position
Disclaimer
All essays, research and information found above represent analyses and opinions of Przemyslaw Radomski, CFA and Sunshine Profits’ associates only. As such, it may prove wrong and be a subject to change without notice. Opinions and analyses were based on data available to authors of respective essays at the time of writing. Although the information provided above is based on careful research and sources that are believed to be accurate, Przemyslaw Radomski, CFA and his associates do not guarantee the accuracy or thoroughness of the data or information reported. The opinions published above are neither an offer nor a recommendation to purchase or sell any securities. Mr. Radomski is not a Registered Securities Advisor. By reading Przemyslaw Radomski’s, CFA reports you fully agree that he will not be held responsible or liable for any decisions you make regarding any information provided in these reports. Investing, trading and speculation in any financial markets may involve high risk of loss. Przemyslaw Radomski, CFA, Sunshine Profits’ employees and affiliates as well as members of their families may have a short or long position in any securities, including those mentioned in any of the reports or essays, and may make additional purchases and/or sales of those securities without notice.
Gold had held up well in recent months considering the upside explosion in the US$ index. That is because Gold surged nearly 21% against foreign currencies in three months. Yet, this is not enough to carry Gold. Its rebound petered out (in nominal and real terms) after the Swiss news and has growing downside momentum due to the surging US$ index. We’ve seen some positive developments under the surface for precious metals but its clear the sector won’t begin a sustained rebound until the US$ reaches its next peak.
Gold priced in foreign currencies (FC), as discussed repeatedly is often a leading indicator for Gold as shown below. Gold/FC led Gold higher during the 2001 and 2008 bottoms and led Gold to new highs in 2001, 2005 and 2009. The current period could be similar to 2000-2001 during which Gold/FC trended higher as Gold trended lower. Then, the first divergence showed up in February 2000. Gold stocks bottomed nine months later and Gold bottomed 13 months later. The first big divergence this time around was near the end of October 2014.
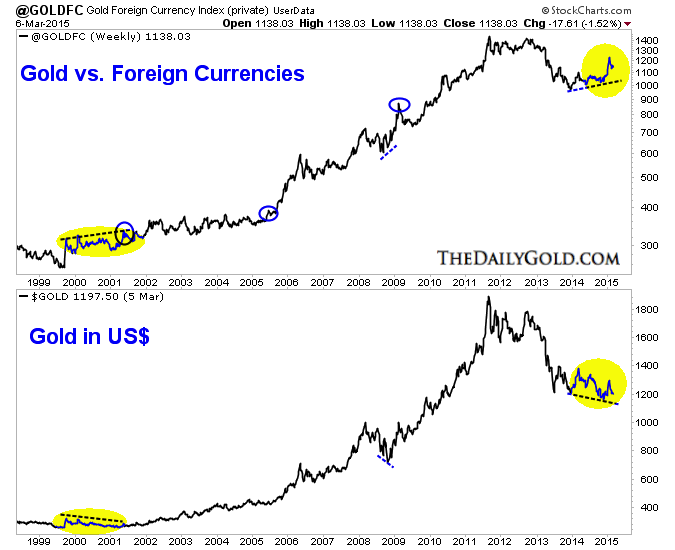
Turning to currencies, in recent weeks we noted that the US$ index had reached its third most overbought point since 1971. First it was Yen weakness driving the US$ higher. Recently it was both the Yen and the Euro. In recent weeks the Yen has not made a new low while the Euro has plummeted. Clearly, the US$ index won’t correct until the Euro’s decline finishes.
Below we plot a weekly chart of the Euro that includes indicators showing the Euro’s distance from various exponential moving averages (20,40,80). We mark and highlight the rebounds from the most oversold points. A few weeks ago the Euro was arguably at its second most oversold point since 1990. Considering the depth of the Euro’s decline and its current standing it appears in a somewhat similar spot to early 2000. See the arrow.
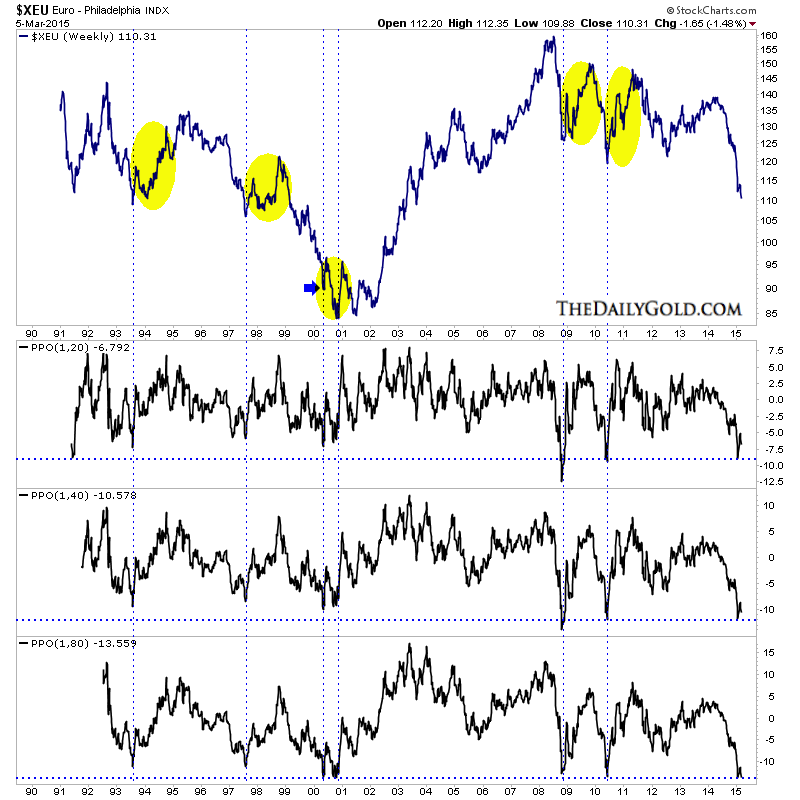
In considering the extremes in the currency markets, we are looking for big counter trend moves in the months ahead. However, in the short term the Euro which we think is the key lacks major technical support until parity. It has room to fall further. While a major snapback is likely ahead (and the reverse for the US$) it is not necessarily imminent.
As I penn this Gold is trading at $1167 and GDX has 12% downside to test its daily low. Don’t be surprised if precious metals bounce next week as Gold has support at $1160. That being said, Gold looks like it’s headed for a test of at least $1080 (the 50% retracement of the bull market) while the miners are headed for a retest of their lows. That is the bad news but the good news is precious metals are finally moving closer to the end of the seemingly forever bear market.
The latest record highs in the US stock markets have unleashed astounding complacency. Traders are utterly convinced that the past couple years’ massive Fed-fueled rally will continue indefinitely. But with today’s lofty stock markets extremely overvalued, wildly overextended, and rampantly euphoric, a serious selloff is looming. The prudent contrarians preparing for this inevitable major reversal are going to earn fortunes.
Though you wouldn’t know it from recent history, stock markets rise and fall. They are forever cyclical, an endless parade of alternating bulls and bears. Market history simply couldn’t be clearer on this. Yet ironically after long bull or bear markets, the great majority of traders forget this. They get caught up in their own emotions, and wrongly assume the long-in-the-tooth trend is the new norm that will endure perpetually.
That perfectly describes American stock traders’ worldview today. After one of the biggest cyclical bull markets in history, a huge 213% march higher over 6 years in the flagship S&P 500 stock index, investors and speculators alike fully believe this bull has years left to run yet. They cavalierly dismiss even the mere possibility of a serious selloff, hubristically assuming fundamentals, technicals, and sentiment no longer matter.
But they always do, this time is never different. After running too far for too long, stock markets always reverse. It’s as inevitable as winter following summer, or night following day. The greed and fear that dominate traders’ hearts never change, and as long as these warring emotions reign there will always be stock-market cycles. And given today’s stock-market extremes, there’s no doubt a trend change is long overdue.
Fundamentally, the S&P 500 (SPX) is trading at an exceedingly-expensive 25.9x earnings! That is the simple average of all 500 elite SPX component stocks’ trailing-twelve-month price-to-earnings ratios. Historical fair value is 14x, while 28x is bubble territory. Study any broad swath of stock-market history, and it quickly becomes apparent that buying expensive stocks high soon guarantees serious losses.
Wall Street is so afraid of investors learning how expensive stocks are today that it is aggressively trying to mask valuations by using fictional forward earnings. These are merely analysts’ guesses about the future profits of companies, something they are forever excessively optimistic on. Provocatively, stocks are so overvalued today that they are even very expensive on that forward basis! This is super-ominous.
Meanwhile after more than tripling in the past 6 years, the SPX is radically overextended technically. We are now in one of the longest cyclical bulls in history. Interestingly if you crunch the numbers, average bull markets at this stage in the stock-market cycles end at merely a doubling in less than 3 years. Like a rubber band stretched farther and farther, the bigger and older a bull the higher the odds it’s soon going to fail.
It’s been a dumbfounding 41 months since the end of the SPX’s last correction, a selloff that exceeds 10%. On average in healthy bull markets, they happen about once a year or so. These extremes are the direct product of the Fed’s wildly unprecedented open-ended QE3 debt-monetization campaign and its associated jawboning. The Fed implied it was backstopping stock markets, so traders threw caution to the wind.
And on top of these grave fundamental and technical concerns, traders’ sentiment is epically bullish. They are euphoric, feeling great happiness at today’s stock-market levels. They are complacent, very satisfied with the current situation and smugly unconcerned it will ever change. And they are hubristic, arrogant and proud in their overwhelming bullishness. All this adds up to totally unsustainable greed.
The endless war between popular greed and fear among stock traders is like a giant pendulum. When their emotions get too extreme on either end of that spectrum, the too-high pendulum soon slows and reverses and starts swinging the other way. The more extreme the emotion, the greater the momentum in that backswing to the opposite extreme. So exceptional greed is always followed by exceptional fear.
While there’s no way to empirically measure emotions, many great tools have arisen over the decades that approximate them. The leading one is the VIX, the CBOE’s Market Volatility Index. It measures the implied volatility of S&P 500 index options over the coming month. The higher the volatility implied in speculators’ aggregate bets, the greater the fear. This works because greed and fear are very asymmetrical.
Greed grows gradually, slowly mounting as stock markets climb on balance for years. Traders want to buy stocks, but aren’t in any hurry as a herd to do so. But fear is just the opposite, a sudden and flaring emotion that demands fast action. The more greedy traders are, the lower the VIX because they expect the stock markets to rally forever. The more fearful they are, the higher the VIX as they rush to sell and flee.
This first chart looks at this VIX fear gauge with the dominant S&P 500 ETF, State Street’s SPDR that trades under the symbol SPY. During the Fed’s extraordinary SPX levitation of the past couple years, the stock markets rallied with only minor pullbacks from time to time. This unnatural behavior has left complacency extremely high as measured by the VIX. A low VIX is usually a warning of an imminent selloff.

Stock-market selloffs are categorized by size. Anything under 4% on the SPX or SPY doesn’t have a name, it’s just normal market noise. From 4% to 10%, selloffs become pullbacks. There have been 7 of these since the Fed’s surreal stock-market levitation got underway with QE3 in late 2012. But most were on the small side, which means they did little to accomplish selloffs’ primary mission of rebalancing sentiment.
Between 10% to 20%, selloffs grow into corrections. These major selloffs are actually very important for the health of bull markets. They serve to quickly ramp fear, which rapidly bleeds away excessive greed and complacency. Restoring sentiment balance keeps stock markets from getting too overheated, which happens if they rally for too long without corrections. There hasn’t been a single one during the Fed’s levitation!
Not only was QE3 massive and open-ended, but Fed officials fell all over themselves successfully trying to convince stock traders that the Fed was effectively backstopping the stock markets. They implied that if any major selloff happened, the Fed would be quick to ramp its money printing to arrest the weakness. So stock traders bought and bought, growing ever greedier as they ignored all risks and historical indicators.
The problem is excessive greed sucks future buying forward. Investors who would’ve bought in later in normal market conditions grow excited and plow all their capital in earlier to chase the gains. This leads to a temporary surge, but it soon runs out of steam. Once everyone interested in buying stocks anytime soon is in, there are no more buyers. So starved for new capital inflows, the lofty stock markets soon start reversing.
But the Fed went even farther than that during QE3. Not only did its excessively-easy stance convince stock traders to buy high, but QE3’s debt monetizations decimated yields in the bond markets. This forced investors who would prefer bonds at normal fair yields to begrudgingly migrate into far-riskier stocks to chase reasonable returns through dividends. The result is SPY’s incredible 56.2% surge in just 27.5 months!
Without any healthy rebalancing corrections, sentiment got extreme. Over that QE3 span since the Fed hatched that scheme in late 2012, only one pullback even remotely challenged correction magnitude. That was last September and October, when SPY dropped 7.7% in less than a month. And ominously, this largest pullback of the levitation had no single catalyst. The toppy stock markets simply rolled over.
Corrections are inevitable in stock markets, as all but the most irrational bulls acknowledge. But after such an incredible span of time without a 10%+ selloff, traders have forgotten what they are like. This chart notes where SPY would be trading after 5%, 10%, 15%, and 20% selloffs. At the bare-minimum 10%-correction threshold, it would slump under $191. This would erase all the gains over the past year!
At an unremarkable 15% correction, SPY would plunge to $180. That would unwind the entire move higher since late 2013. And to hit a full-blown 20% correction, SPY would have to fall all the way under $170. All the stock-market gains since the summer of 2013, nearly the entire past couple of years now, would vanish! Stop and think about the psychological impact of such a perfectly normal stock-market selloff.
Since late 2012, the Fed has aggressively conditioned traders to believe that stock markets don’t sell off anymore. How many investors nearing retirement age are going to get nervous when the SPX crosses that 10% correction threshold? How many fund managers desperately trying to beat the performances of their peers are going to freak out when the next selloff crosses 15% heading towards 20%? Most of them!
Since it has been so long since the last rebalancing selloff, the impact of the coming one on sentiment is going to be very outsized. Selling will beget more selling as traders almost start panicking at seeing the first real selloff in years. The longer it’s been since the last major selloff, the bigger the next one tends to be. My favorite analogy for this is wildfire suppression, as its dynamics work in a similar way.
Brave firefighters quickly arrest any fledgling wildfires to protect homeowners. But the longer that any forest grows without suffering significant fires to clear out its flammable underbrush, the more fuel exists to feed future fires. Fire-suppression efforts, however noble, simply guarantee that a future wildfire is going to erupt into a hellfire conflagration. Denying rebalancing simply delays and enlarges its ultimate magnitude.
It’s been so long since stock traders have felt any real fear that collective sentiment is choked with tinder-dry underbrush. This is evidenced by the extremely low VIX of the past couple years. Note above that pullbacks during the Fed’s QE3 levitation erupted when the VIX was in the ultra-low 12-to-13 range. That’s right where it was again as March dawned. One unpredictable lightning strike, and fear is going to ignite.
Since the Fed has artificially suppressed stock-market corrections for so long, I strongly suspect the next one is going to be a doozy. The catalyst is irrelevant, as one always arrives when market extremes demand a correction. Once this selling gets underway, the odds are very high the resulting fear surge will be really hard to stop. Stock traders are going to freak out when the SPX selloff passes 15% and nears 20%.
With today’s stock markets being so fundamentally expensive near bubble valuations, and this cyclical bull market being so abnormally large and long, the probabilities heavily favor the next major selloff not merely stopping at 20%. Once an SPX selloff exceeds that correction limit, it formally becomes a bear market. And cyclical bears following cyclical bulls average 50% declines, something unthinkable to most today.

Zooming out to this entire cyclical bull since early 2009, it wasn’t always artificial. It followed a normal trajectory between its birth and the Fed’s gross QE3 distortions starting in early 2013. The SPX and SPY would rally sharply and then suffer major corrections to rebalance away the excessive greed. These last two healthy events happened in mid-2010 and mid-2011, when SPY sold off by 16.1% and 19.4% respectively.
Imagine the fear conflagration that would ignite today if the stock markets sold off by 16% to 19% over a matter of months. It would certainly be extreme and self-feeding given all the complacency fuel the Fed has foolishly allowed to choke the stock-market forest over the past couple years. And provocatively, these last two major corrections erupted right as the Fed’s earlier QE1 and QE2 debt-monetization campaigns ended.
The Fed stopped the new bond buying of its far-more-potent QE3 just recently in late October. The stock markets have coasted higher on pure momentum since then, but their rate of ascent is moderating as they run out of new buyers. Given the fundamental, technical, and sentimental extremes associated with these markets today, history would overwhelmingly argue that they are in the process of topping.
It was only 13.5 months after this mighty stock bull was born that its first correction arose, and only 9.9 months between the end of that and the start of its second correction. As of this week, it has been an astounding 41.0 months since the last correction. This is now one of the top-few longest correction-less spans in all of US stock-market history! So a major selloff is desperately overdue, and absolutely coming.
It’s funny how herd psychology works at major toppings. Traders become so complacent, so blinded by their own rampant greed, that they assume the longer that stock markets go without a major selloff the less likely one is. Nothing could be farther from the truth! The longer it’s been since the last major selloff, the greater the odds the next one is imminent. The risks balloon the longer that major selloffs are suppressed.
Again that wildfire analogy applies. If it’s been 30 years since a major fire cleared out underbrush in a particular forest, the risks of the next hellfire erupting are far higher than if it’s only been 10 years. So euphoric stock traders who believe long correction-less spans lower downside risks are fools, history could not be clearer on that. And our current incredible 41-month span is among the longest ever witnessed.
So at absolute minimum, the full-blown correction approaching 20% the Fed has been suppressing is rapidly nearing in the SPX. But again after such artificially-distorted markets spawned so much complacency tinder, a new bear is far more likely. A mere 30% bear, which is very trivial as far as stock bears go, would erase the Fed’s entire QE3 levitation since early 2013! 40% would return the SPX to late-2010 levels.
But stock bears tend to cut stock markets in half, even after merely normal bulls which our current one certainly isn’t. A 50% decline would drag SPY all the way back down to $106, a level first seen near this bull’s birth all the way back in mid-2009. American investors and speculators alike shouldn’t take this very real risk for granted. Getting caught on the wrong side of bears has wiped out countless retirements.
Another funny thing about major stock-market toppings is the euphoric bulls dismiss bearish talk as the realm of crackpots. Rather than consult market history themselves, they ridicule the messengers that are pointing to it. One way they do this is to confuse any prediction of a cyclical bear market with a stock-market panic or even crash. But that just highlights their extreme emotionality and naivety on market cycles.
Stock-market crashes are 20%ish plummets in a couple trading days, and panics are 20%ish plunges over a matter of weeks. These are super-fast and exceedingly-rare selloffs. Cyclical stock bears are far different beasts. While they tend to cut stock markets in half, they take a couple years to unfold. So their rate of decline is vastly slower and harder to detect than crashes’ and panics’. Stock bears have different functions.
They exist to drag overvalued stocks back to normal or cheap price levels, which takes time. And they unfold slowly so the euphoric stock investors and speculators at major tops are lulled into complacency for as long as possible. Without rapid declines, they aren’t spooked into selling high. Instead they keep on holding out hope that the gradually-sliding stock markets are right on the verge of soaring again.
It won’t be safe to return to general stock markets until we see a major VIX spike up near the 50 level, which signals extreme fear. That happened after the two earlier corrections in this bull, and it is going to happen again even if this next selloff is merely a major correction approaching 20% within an ongoing magical bull. But major VIX spikes are also seen at the capitulation climaxes of cyclical bears when fear peaks.
Friends, I urge you to take today’s endless stock-market-topping warning signs very seriously. Realize that Wall Street never calls tops, it always says stocks are a great buy regardless of market cycles. It lives on percentage-of-assets-under-management fees, so it wants to keep investors fully invested no matter what the downside risks are. Wall Street was euphorically bullish at the major 2000 and 2007 toppings as well!
The bottom line is the stock markets have rarely been riskier. Thanks to the gross distortions by the Fed, they are super-overvalued fundamentally, far overextended technically, and exceedingly euphoric sentimentally. That’s the perfect breeding ground for the long-overdue major selloff, which is destined to be a full-blown correction at best but far more likely a new cyclical bear that cuts these stock markets in half.
Since the Fed has worked to suppress major selloffs for so long now, the coming one is going to prove a doozy. With so much complacent underbrush choking sentiment, it won’t take much of a spark to ignite it all into a major fear conflagration. Prudent investors and speculators are either already selling high or are on a vigilant hair trigger ready to exit on short notice. Fight the euphoria and protect your scarce capital.

Pretivm Resources Inc. (PVG.TO) – Bob Quartermain Interview
Of undeveloped gold projects globally, few have the grade, size and potential of Pretium Resources’ Brucejack gold project, and specifically, the Valley of the Kings area, near Stewart, British Columbia, which contains 6.9 million ounces of gold at 15.7 grams per ton and is open for expansion.
Pretivm is among the most valuable non-producing gold companies in the world currently, worth roughly $1 billion, a sign that investors recognize the potential in Pretivm, and consider it a frontrunner for a takeover by another large mining firm in the intermediate future.
Being the highest valued junior gold company can also attract unwanted attention, as was the case when a 2013 dispute between two mining consultants over the resource model being used by Pretivm caused an investor panic and shares in the company to fall by nearly two thirds. The stock has mostly recovered thanks to strong bulk sample test results in 2014, and strengthened by a recent $81 million strategic investment in Pretivm by ZiJin Mining, China’s largest gold company.
Pretium Resources is led by a highly experienced geologist and mining company builder, Robert Quartermain, who for 25 years was President and CEO of Silver Standard Resources. Mr. Quartermain generously agreed to spend 20 minutes with EnergyandGold.com this week to go over the company’s challenges and expectations for 2015.
Scott Armstrong: Thank you for joining us Mr. Quartermain. Please describe the Brucejack gold project. How does it stack up to other development stage gold projects globally?
Bob Quartermain: The Brucejack Gold Project and specifically the Valley of the Kings is one of the highest grade development stage gold projects currently in the world. Our reserves grade 15.7 grams of gold per tonne, so approximately a half ounce of gold per tonne, and we have defined 6.9 million ounces of gold in the Valley of the Kings. The mineralization remains open in all directions so we can certainly add to the reserve. We undertook deep drilling last year, drilling 500 meters below the known extension of mineralization and continued to encounter high grade mineralization. So not only is it a defined resource, it’s one that we can add to.
The metallurgy of the reserve is simple; the gold occurs as electrum which is a gold/silver alloy with 65% gold / 35% silver. As a result we get very good recoveries, approximately 97% of the gold by way of gravity. We merely crush the rock and recover the electrum from it. Being located in British Columbia, Brucejack is in a known mining jurisdiction – a mining friendly jurisdiction where mines continue to be built. We have a rule of common law so we know the framework for taxes and payments that are going to be made. All in all, we think the Brucejack Project stacks up quite favourably to other development stage projects globally.
Scott Armstrong: What are the major milestones that Pretivm hopes to accomplish in 2015?
Bob Quartermain: One of the current key milestones of course is that we have been in the permitting process for over 2 years since filing our project description starting the process in January of 2013. We have held open houses to ensure that local residents are aware of what we plan to do. We entered into the more defined federal and provincial process when we made our application for our Environmental Assessment (filed in August 2013). There is an approximate 180 day review period after which time the file is referred to the ministers, so the total review period to the ministerial approval is approximately 225 days which means we would hope to be advised on our project by the government in late March or early April.
With the environmental approval from the province then we would expect to receive the federal approval a reasonable time after that. This is similar to the approval timeline of Seabridge and their KSM project; it was approved by the province and the federal approval came a short time after that. The fact that the KSM project was permitted and it is a much larger project and impact, we expect to receive our certificate in a timely manner.
With certificates in hand, we can then conclude financing. Debt financing that we’re arranging for the project would be conditional on permits, and we would hope to be able to conclude the entire financing package, that we require for the US$746 million capital, sometime in the 2nd quarter of this year. This will allow us, with the appropriate permits, to commence site construction which is largely leveling the plant site area for the milling facility. This should commence sometime in June, which allows us to be much more efficient at site as we’re not dealing with the colder weather conditions in doing civil works. With construction commenced we are then in that process for the next 24 months, targeting production sometime in mid 2017.
Scott Armstrong: What are the biggest challenges facing Pretivm?
Bob Quartermain: When you look at the evolution of the Brucejack Project and specifically the Valley of the Kings, we IPOed Pretivm in 2010 as a concept; a concept that there would be high-grade gold resources in the Valley of the Kings. Here we are not even 4 years from when we commenced our initial drilling in 2011, which really defined the Valley of the Kings, and we are targeting construction this summer. So this project has advanced because of its grade, its location and its limited environmental impact.
The only real challenge for Pretivm is the gold price. Having said that, because of the high-grade gold nature of Brucejack, we have been able to continually fund the project and advance it. When we launched the company four years ago, we IPOed at $6/share; here we are four years later in a much more challenging gold price environment and our shares are trading approximately 30% above the IPO price. So I think that speaks very well of the project. I don’t see any specific challenges, we’re just going through the permitting process, maintaining our timeline to raise our development capital. As I indicated, those are specific timelines I believe we will achieve and advance the project through the rest of the year. If we get an enhanced gold price it will make development and financing that much easier.
CEO Technician: What is your vision for Pretivm 2-3 years from now? And what is your outlook for gold & silver prices? I know you are not a trader or a market commentator but you have extensive experience in the gold industry so it would be interesting to hear where you think we are in the gold market cycle.
Bob Quartermain: To answer your first question, 3 years from now the project would be in production. We will be paying our debt back and at some point in time we will pay a dividend back to shareholders. Shareholders have been very supportive in funding us through equity and so we need to return something back to shareholders, so a dividend is something that we could look at down the road. This of course is my personal opinion, not one of the Board’s. Doing any M&A activity at our stage is unlikely, when you have such a good quality asset, the best way to return value back to shareholders is through dividends.
With respect to the gold industry, I’ve been in the resource industry for 40 years now. For 30 years I’ve been running precious metal public companies. I ran Silver Standard for 25 years and now Pretivm for almost 5 years. I continue to be a long term gold bull. What I think is key to the gold market, is this movement of the physical metal from the West to the East. We continue to see China as one of the world’s largest consumers of physical gold. I was recently to China a few times over the last few months, mainly because we have a new strategic investor who has acquired an approximate 10% interest in Pretivm (ZiJin Mining). In these two visits I took a wander around jewelry stores and what I noticed in both Hong Kong and Shanghai was a lot of people were buying physical gold, either gold jewelry, small bars of gold or figurines. So we continue to see strong gold demand in China and also India, and at some point I think we’ve got to see the physical market align with the paper market.
With current gold prices, mining companies find it more challenging to develop projects, as the average grade of gold mines is approximately 1 gram/tonne. I think physical demand and lower grades speak to a continued gold uptick. Long term I believe we are going to continue to see a more robust gold price than we’re currently seeing.
CEO Technician: What’s your feel for the global marginal cost of pulling an ounce of gold out of the earth? How will smaller or higher cost producers be affected if gold prices remain around $1,200 or fall further?
Bob Quartermain: If you assume that gold could move lower in the shorter term it will lead to challenges in which companies with higher costs will look to companies with quality assets and lower costs to merge with and ensure that overall the corporation will have a stronger gold balance sheet. We have already begun to see this sort of M&A activity and we could see more of it down the road.
Chuck Jeannes, President of Goldcorp, made a comment in the fall that the gold industry has reached peak gold production. We are now seeing some of the major mining companies curtailing production and not producing as much gold as they historically. We just aren’t seeing those new high-grade gold discoveries anymore and current industry all-in cost of production is estimated around currents levels.
Our Brucejack Project has a positive rate of return, even at $800 per ounce gold and our all-in sustaining cost of production based upon the 2014 Feasibility Study is under $500/oz. It’s these types of low cost stand alone projects that can weather these times of metal price downturns.
Scott Armstrong: What events are required for sentiment to turn in favour of the junior mining market again?
Bob Quartermain: Success. I think that we need to see drilling success for juniors who have been exploring to discover some new deposits. I’ve been working in the junior space since 1980, or about 35 years. I worked in the Hemlo Camp back then and those Hemlo discoveries, the discovery of Corona and subsequently Goliath Gold Mines, attracted a lot of risk capital because there was such reward from discovery. So one of the drivers for investor sentiment will be success in the space through discovery. And obviously a stronger gold price will also bring investment back to the juniors space.
I personally haven’t been investing much in the junior space, but I am now looking at projects and resource professionals who have had success. I am looking at potential opportunities where they have hit a low share price in the cycle in gold and copper projects.

CEO Technician: How did ZiJin Mining address the continuity of grade concerns in their due diligence process before making their large recent investment in Pretium?
Bob Quartermain: The comment I can make, is that we have had a dialogue with ZiJin for a number of months. ZiJin sent two teams to review our project, one of which was led by Chairman Chen. ZiJin is China’s largest gold producing company, it produces 2.5 million ounces of gold per year, it’s got 25,000 employees and a market cap of over $10 billion US. Chairman Chen is a geologist like myself, and he’s taken that company from its inception to where it is. He and his team visited our office and reviewed our model, went to site and visited the underground. They also had a group that reviewed socioeconomic aspects by meeting with some of the First Nations and visiting local communities. I can’t specifically speak to how they got their comfort level but as we often find with people who visit the site, they are better able to understand the distribution of the gold mineralization at Brucejack. Obviously ZiJin was comfortable with our resource to make its investment.
Scott Armstrong: How do Chinese investors differ from North American corporates and institutions?
Bob Quartermain: I think it’s their view on gold. China has had gold as part of its currency for centuries and with China now the largest consumer of gold they have more of an affinity for it as opposed to just a pragmatic trading basis as we see more in North American. As gold moves from the west to the east, we will probably see a continued increase of China in its investment strategy in companies such as Pretivm. I think the Chinese are generally more bullish on the commodity (gold) than those in North America, and they view the commodity favourably long term.
Cautionary Note Regarding Forward-Looking Statements
This website contains “forward-looking information” within the meaning of applicable Canadian securities legislation. Forward-looking information may include, but is not limited to, information with respect to the anticipated production and developments in our operations in future periods, our planned exploration and development activities, the adequacy of our financial resources, the estimation of mineral resources, realization of mineral resource estimates, costs and timing of development of the Snowfield project and the Brucejack project (together, the “Combined Project”), costs and timing of future exploration, results of future exploration and drilling, timing and receipt of approvals, consents and permits under applicable legislation, our executive compensation approach and practice, the composition of our board of directors and committees, and adequacy of financial resources. Wherever possible, words such as “plans”, “expects” or “does not expect”, “budget”, “scheduled”, “estimates”, “forecasts”, “anticipate” or “does not anticipate”, “believe”, “intend” and similar expressions or statements that certain actions, events or results “may”, “could”, “would”, “might” or “will” be taken, occur or be achieved, have been used to identify forward-looking information.
Statements concerning mineral resource estimates may also be deemed to constitute forward-looking information to the extent that they involve estimates of the mineralization that will be encountered if the property is developed. Any statements that express or involve discussions with respect to predictions, expectations, beliefs, plans, projections, objectives, assumptions or future events or performance (often, but not always, using words or phrases such as “expects”, “anticipates”, “plans”, “projects”, “estimates”, “assumes”, “intends”, “strategy”, “goals”, “objectives”, “potential” or variations thereof, or stating that certain actions, events or results “may”, “could”, “would”, “might” or “will” be taken, occur or be achieved, or the negative of any of these terms and similar expressions) are not statements of historical fact and may be forward-looking information. Forward-looking information is subject to a variety of known and unknown risks, uncertainties and other factors that could cause actual events or results to differ from those expressed or implied by the forward-looking information, including, without limitation: risks related to commodity price fluctuations, including gold price volatility; risks related to the development and operation of a mine or mine property; risks related to the fact that we are a new company with no mineral properties in production or development and no history of production or revenue; risks related to development of the Combined Project; uncertainties related to title to our mineral properties and surface rights; risks and uncertainties relating to the interpretation of drill results and the geology, grade and continuity of our mineral deposits; risks related to governmental regulations, including environmental regulations; increased costs and restrictions on operations due to compliance with environmental laws and regulations; uncertainty regarding unsettled First Nations rights and title in British Columbia; increased costs affecting the mining industry; increased competition in the mining industry for properties, qualified personnel and management; risks related to some of our directors’ and officers’ involvement with other natural resource companies; uncertainty relating to potential inability to attract development partners; risks related to the delay in obtaining or failure to obtain required permits, or non-compliance with permits that have been obtained; risks related to integration and transition of the Combined Project; risks related to Silver Standard Resources Inc.’s share ownership, ability to influence our governance and possible market overhang; risks related to our ability to obtain adequate financing for our planned exploration and development activities and to complete further exploration programs; risks related to general economic conditions; recent market events and conditions; and currency fluctuations.
This list is not exhaustive of the factors that may affect any of our forward-looking information. Although we have attempted to identify important factors that could cause actual results to differ materially from those contained in forward-looking information, there may be other factors that cause results not to be as anticipated, estimated or intended. There can be no assurance that such information will prove to be accurate, as actual results and future events could differ materially from those anticipated in such information. Forward-looking information involves statements about the future and is inherently uncertain, and our actual achievements or other future events or conditions may differ materially from those reflected in the forward-looking information due to a variety of risks, uncertainties and other factors, including, without limitation, those referred to above. Our forward-looking information is based on the beliefs, expectations and opinions of management on the date the statements are made, and we do not assume any obligation to update forward-looking information, whether as a result of new information, future events or otherwise, other than as required by applicable law. For the reasons set forth above, prospective investors should not place undue reliance on forward-looking information.
Scott Armstrong of EnergyandGold.com, Guest Contributor to MiningFeeds.com
1. From a seasonal perspective, gold tends to be a bit weak from late February until the end of the first or second week in March. I see nothing out of the ordinary with gold’s current price action.
2. Please click here now. That’s a seasonal chart for gold, courtesy of Dimitri Speck.
3. Note the black arrow that I put on the chart. Also, the US Employment Situation report is scheduled for release on Friday, and gold has a tendency to often decline going into that report, and then rally nicely for several weeks after the report is released.
4.Investors in the global gold community should be steady buyers in March, in anticipation of the rally!
5.Please click here now. That’s the daily gold chart. I’m looking for a two day close over $1217, to ignite a rally towards $1252.
6. Note the buy signal that is flashing now, on the key 14,7,7 Stochastics series at the bottom of the chart. It’s normal for the price to gyrate a bit as a fresh signal is generated, and that’s happening now.
7. Many economists appear to be unaware that most of gold’s seasonal price action is dictated by events in the Indian and Chinese jewellery markets. That’s logical, since it’s where the most tonnage changes hands.
8. Key religious and cultural events in China and India often produce enormous surges in demand that completely overwhelm supply.
9. I think the technical situation I’ve highlighted on my daily chart fits nicely with the current seasonal action in those key markets.
10. On that note, please click here now. The next big event for gold is the Indian wedding season and the key Akshaya Tritiya (Akha Teej) religious event on April 21.
11. Indians are essentially mandated by the Hindu religion to buy significant amounts of gold in the period leading up to Akha Teej. That buying should help create a nice leg higher, in Western mining stocks!
12. It’s unfortunate that there are no dates on the Western calendar where citizens eagerly race to buy gold, to celebrate life.
13. Regardless, gold stocks do look set to rally further, so please click here now. That’s the GDX daily chart, and it looks superb.
14. After rallying in late December, from the $17 area to above $23, GDX has been consolidating, in a drifting bullish rectangle pattern.
15. Note the beautiful 14,7,7 Stochastics series buy signal now in play at the bottom of the chart.Gold stocks tend to lead gold bullion, and I expect the traditional April rally in gold to be preceded by a rally in GDX.
16. Please click here now. That’s the GDXJ daily chart. I’m looking for a two day close over $27 to reinvigorate the rally.
17. GDXJ is also close to breaking out to the upside, above a significant downtrend line. Junior gold and silver stock enthusiasts should be eager buyers in the current price area!
18. Please click here now. This daily silver chart looks spectacular. The bullish wedge pattern has a really nice shape to it. The more aesthetic a price pattern is, the more reliable it tends to be, and this is a particularly good one.
19. Silver should easily outperform gold, if the April rally proceeds in its normal seasonal fashion.
20. Please click here now. The new London gold fix launch is just a few weeks away, and it will bring substantial and much-needed transparency to the global price discovery process.
21. One of China’s banks is already the world’s largest gold retail bank, and its entry in the London market should enhance that powerful position, which is great news for the entire global gold community.
22. Please click here now. Stan Druckenmiller is an influential hedge fund manager. He’s concerned that a delay in raising rates could result in a stock market crash, which is something that Alan Greenspan has also talked about. My suggestion is to avoid the US market for now, but to buy it if there is a crash, which seems more and more likely as time progresses.
23. Please click here now. Apple has a major news conference scheduled for March 9, about its special new watch. The Wall Street Journal has stated that while the standard watch will sell for about $350 – $500, a special gold watch will sell for about $5000, and may contain as much as two ounces of gold in it.
24. JP Morgan has predicted Apple will sell about 25 million of the standard watches in 2015, and the Journal suggests that the company has plans to build a million gold watches a month, and sell them in Asia. On March 9, the world will likely learn more about what the actual gold content of each watch is, and that time period is roughly when gold makes its March seasonal low. If the Journal’s statements are even partially correct, the demand from Apple could be the catalyst that ignites the greatest gold market rally in a number of years!
Stewart Thomson of Graceland Updates, Guest Contributor to MiningFeeds.com
The miners will typically lead Gold at major turning points. We say typically because the trend in the relationship is hardly exact or precise. There can be times when the miners are simply showing their beta (not leading) and there can be times when the miners are leading but their leadership suddenly halts or reverses. The miners peaked five months before Gold and are now one month from the 4-year anniversary of their market. The time seems ripe for the miners to lead Gold into the next bull market.
In the chart below we plot GDX/GLD, GDXJ/GLD, XGD.to/GLD and Gold. With the exception of GDXJ/GLD, these ratios climbed strongly. Of more important is that the ratios have held near their recent highs while Gold corrected nearly its entire advance in January. Gold lost roughly $100/oz and is threatening the $1100s again yet the miners have maintained most of their gains.
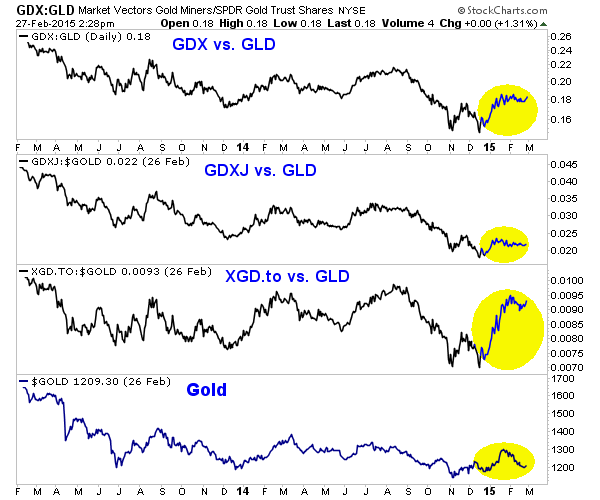
The relationship between the miners and Gold threw us a major head fake last summer. The miners were trading near 12-month highs relative to Gold and on the cusp of a major breakout. That potential head and shoulders breakout for GDX and GDXJ completely failed. Gold’s relative weakness proved to be a bad omen for the miners.
Why might things be different this time around?
The miners are far more oversold now compared to then. At present the miners are just about four years into a bear market that is undoubtedly the second worst of the past 70 years. Last August the miners were eight months into a rally. If the bear had ended in December 2013 then it would have only been slightly more than two and a half years old (versus four years now).
Two other things bode well for continued leadership from the miners. First, the collapse in Oil is a huge boon for mining companies. Energy can account for 25% or even as high as 30% of a miner’s costs. Second, foreign currency weakness is positive for some companies. This has to be examined on a case by case basis. If the Gold price in US$ is stable but foreign currencies such as the loonie lose value then it is another benefit to the mining company (that pays its workers in loonies).
The fact that the bear market in miners began five months before the bear in Gold and is nearly four years old gives us reason to anticipate leadership from the miners in 2015. Macro developments in the energy and currency markets have catalyzed a better fundamental environment for miners and their potential to outperform Gold. In the scenario that Gold makes a new low, GDX would have to decline 22% to test its daily low. Because of the stronger fundamentals for miners and the extreme long-term oversold condition, I don’t think miners would make a new low. That means the next leg higher could take miners into a new bull market.
If you would like to receive our free newsletter via email, simply enter your email address below & click subscribe.
 Follow us on Twitter
 Become our facebook fan
CONNECT WITH US
Tweets
Tweet with hash tag #miningfeeds or @miningfeeds and your tweets will be displayed across this site.
MOST ACTIVE MINING STOCKS
Daily Gainers
 CMC Metals Ltd. CMC Metals Ltd. |
CMB.V | +900.00% |
 Eden Energy Ltd Eden Energy Ltd |
EDE.AX | +200.00% |
| GoviEx Uranium Inc. |
GXU.V | +42.86% |
| Eagle Nickel Ltd. |
ENL.AX | +41.67% |
| Citigold Corp. Limited |
CTO.AX | +33.33% |
| Mount Burgess Mining NL |
MTB.AX | +33.33% |
| Exalt Resources Limited |
ERD.AX | +31.94% |
| Casa Minerals Inc. |
CASA.V | +30.00% |
| Cariboo Rose Resources Ltd |
CRB.V | +28.57% |
| Belmont Resources Inc. |
BEA.V | +28.57% |


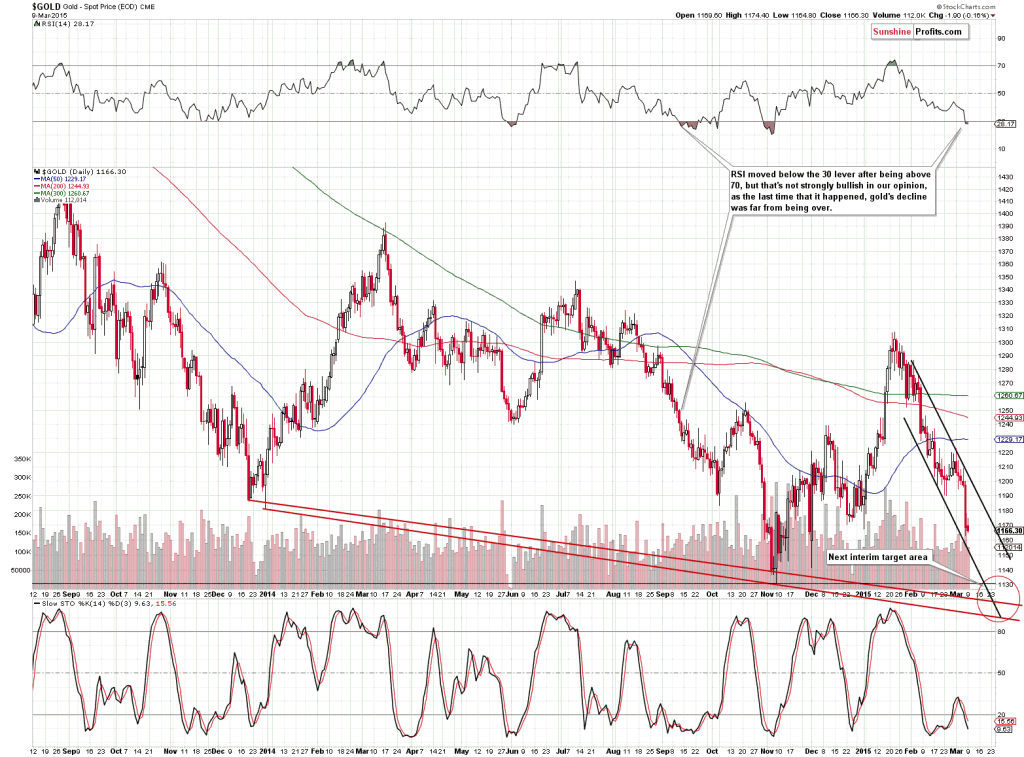
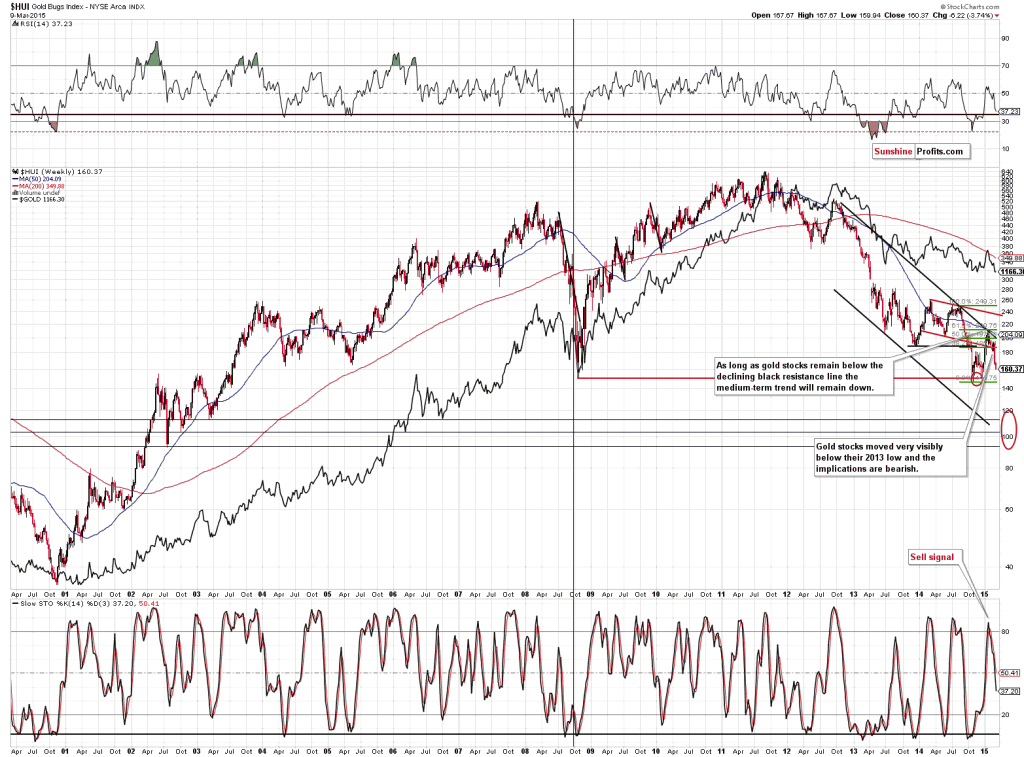