
In this article I present a bullish thesis on the demand for lithium, but not by naming the usual suspects of batteries & large scale grid storage. Please read this article and visit the websites of two of the companies mentioned herein.
Dajin Resources (DJI.V) / (DJIFF) and Pure Energy, (PE.V). As or April 29, 2015, I have no prior or existing relationship with any named company. Note: I believe that Dajin has one of the best website & corporate presentation of any I’ve seen in a junior company.
Buying shares in small cap companies is not suitable for all investors. Readers should consult with their own investment advisors before buying or selling small cap companies.
As We’ve all Heard, Lithium Demand Poised to Take Off
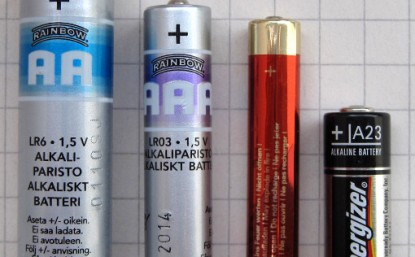
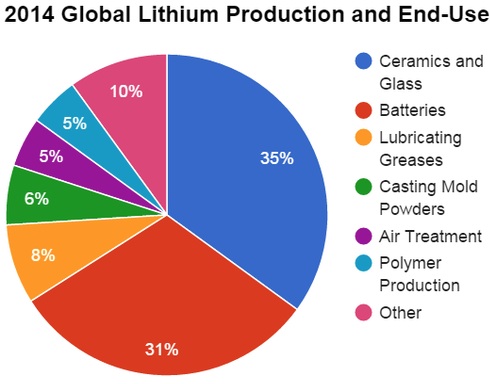
Investors are aware of the growing need for the metal lithium in automobiles & large-scale energy storage of renewables such as wind & solar. But few may realize that lithium-ion batteries are also key in portable dog showers. Does this represent a, “tipping point?” Perhaps a tipping point for the dogs! The main uses of lithium in 2014 were ceramics and batteries. [see pie chart]. However, the “other” slice of the pie represented just 10%. No one mentions the “other” category because there’s no blockbuster products in it. Notice that large-scale storage does not have its own slice of the pie. I think at the very least, 41% of the pie will grow at a CAGR of at least ~15% (see quote below).
 The incremental uses of lithium-ion batteries in power tools, vacuum cleaners, cell phones, cameras, lap tops, dog showers, etc, etc. products in the, “other” category, will be ongoing for years and years to come. I think the, “other” category will become a more meaningful slice of the lithium pie. And let’s not forget electric bikes, of which there are 200 million, yes million, in China alone. Why does China dominate the electric bike market globally? For one, Chinese air pollution is a terribly embarrassing problem for China’s leading officials. Assuming the lithium in 350 electric bikes equals that of the average EV, that equates to the equivalent of about 600,000 EV’s.
Are Pundits Factoring in All of the Potential Demand Factors?
Finally, I point to hybrid p-EVs, (plug-in hybrids) there’s a growing number of them… In a few short years there will be less hybrids coming off the assembly lines, replaced with 100% EVs. I’m not sure how that presumption on my part factors into the demand picture. Plig-in hybrids on average use roughly 1/3 the amount of lithium as full EVs. Another angle not appreciated is the replacement of lithium-ion battery packs in existing EVs and bikes. Aside from Tesla, most EVs will need replacement battery packs after 5-10 years. Replacements could add significantly to overall demand for lithium.
In a surprising and controversial move, I’ve waited until the 4th paragraph to introduce an exclusive quote from industry guru Simon Moores of Benchmark Mineral Intelligence,
“Since the boom and fall in lithium carbonate prices between 2005-2010, prices have slowly been creeping up. In 2013-14, Benchmark Mineral Intelligence estimates that average lithium carbonate prices have increased by 10% a year and now stand in the $5,000/metric tonne (equivalent) region. Battery demand from Asia is rising, contributing to global annual lithium demand of ~15%. With at least 5 battery mega-factories announced or under construction, we expect this rising price trend to exceed $5,500/tonne by the end of 2015, possibly in excess of 20% this year. Lithium hydroxide, used as a raw material by companies such as Panasonic and Tesla, is seeing an even tighter situation with average prices around $8,000/tonne. Lack of new capacity and availability of the required battery grade material means hydroxide prices are expected to be more erratic than carbonate, particularly in the last three months of this year as new battery projects come on stream.”
How does one articulate exposure to this theme? With few exceptions, it’s best to invest in lithium juniors that control properties in key basins, two of which being Nevada and (Argentina / Chile) South America. Roughly 75% of lithium supply comes from South America, a disturbing fact given that Argentina is in the mix. Resource nationalism is not unknown in that country. Recent severe flooding in the region raises questions of security of supply. Lithium is deemed a critical metal in the U.S. due to its increasing use in military hardware. Juniors offer compelling risk/return investments. Playing the top three lithium producers is not going to help much. One derives just 10% of its revenues from lithium and all three have multi-billion dollar market caps. Hard to move the needle on those three.
Instead, companies like Venture Exchange-listed Dajin Resources (DJI.V) & OTC:Pink Sheets (DJIFF) and Venture Exchange-listed Pure Energy (PE.V) have strategically located exploration targets, tiny market caps and blue-sky potential if lithium prices continue to move. Well managed and funded juniors offer investors long-term call options on the demand / price for lithium. Select lithium juniors will face ample opportunities to be acquired. Dajin & Pure Energy are worth considerably more to a Compass Minerals, Agrium, Cargill or Mosaic, any of which would benefit from geographic diversification, could advance projects faster and have lower costs of capital.
Dajin has staked claims near Rockwood Lithium’s Silver Peak mine, the only producing brine-based lithium operation in North America. Dajin’s Teels Marsh property is located 50 miles northwest of the Clayton Valley deposit at Silver Peak, while its recently staked Alkali Lake claims are just 7 miles northeast of the mine.
Dajin Resources is especially interesting in that it has property in BOTH highly prospective Nevada & South America. While early stage, it has one of the smallest market caps of a pure play lithium company and could therefore be one of the greatest percentage gainers. Neither Dajin nor Pure Energy will double or triple over night, but within 6-18 months, gains could be spectacular for patient investors.
Staking ground in highly perspective areas is the name of the game in depressed markets. We see it in junior uranium and gold plays all the time. The key difference with lithium is that it’s not engulfed in a fundamentally depressed pricing / demand / supply environment. Lithium is one of the very few sectors that looks promising. When the market for juniors rebounds or if lithium prices talk off, Dajin Resources’ stock and select junior lithium plays will benefit immensely.
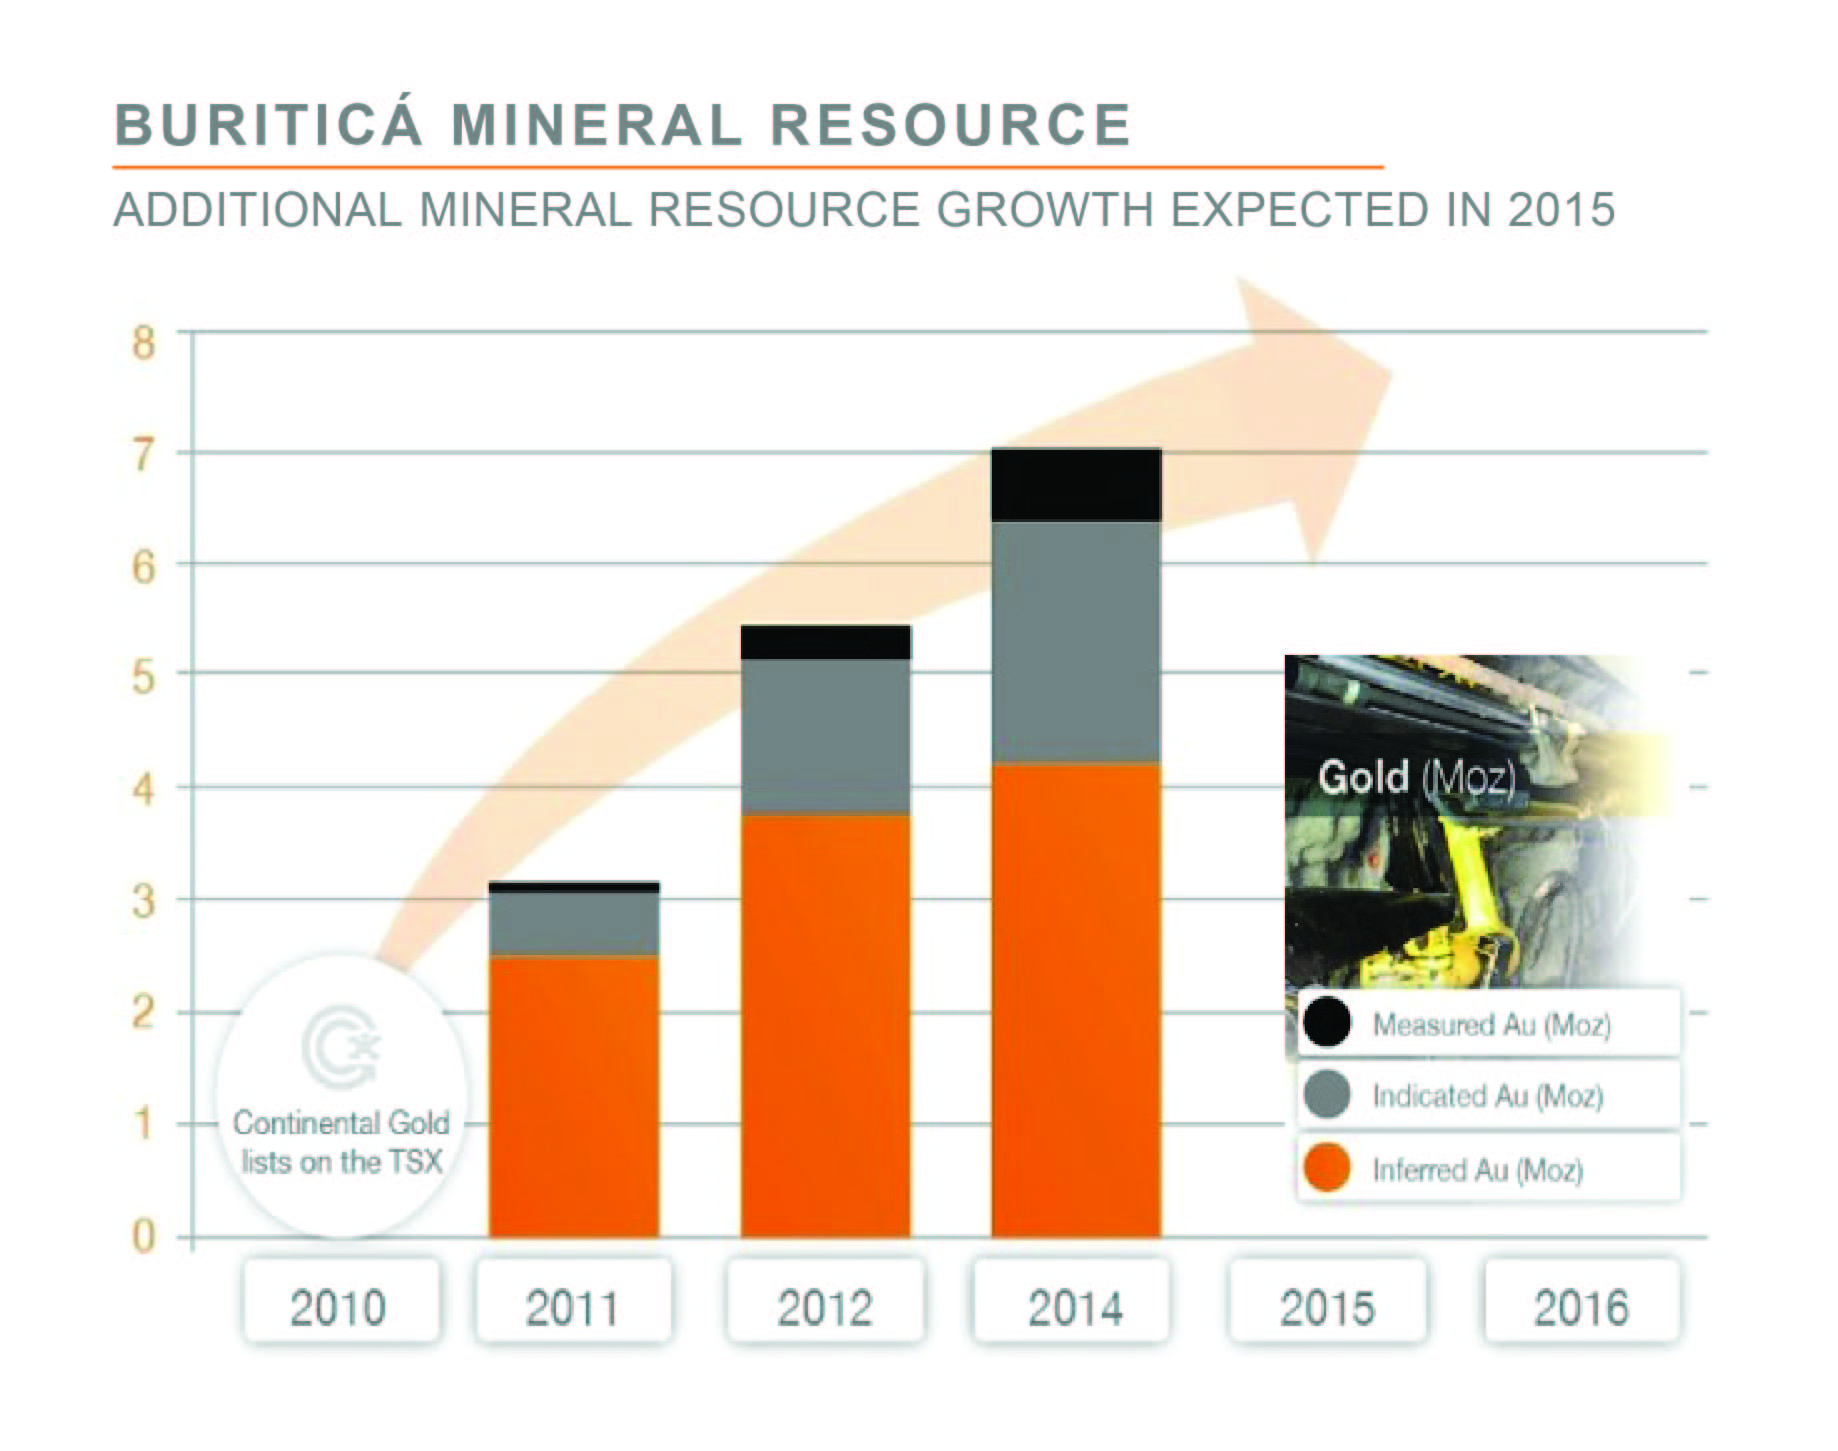
On the back of a positive Preliminary Economic Assessment (“PEA”), one that demonstrated robust economics even at today’s gold prices, Toronto’s Continental Gold (TSX: CNL; OTCQX:CGOOF) is readying itself for another milestone at its flagship Buriticá mine – the completion of permitting by the end of Q2 2015.
If you’re unfamiliar with Continental Gold’s Buriticá mine, there are reasons you should know it. Buriticá has two qualities that are becoming scarcer in today’s world – size and grade. The underground Buriticá project boasts both of these qualities, and more.
Located in northwestern Colombia, approximately two hours away from the country’s second largest city, Medellín, Buriticá is a 100%-owned project with a paved road traversing the property and abundant electricity and water available nearby.
The mine is composed of two major vein systems named Veta Sur and Yaraguá, both of which have recently yielded excellent drilling results. In 2015, Continental Gold has announced results for numerous infill and extension drill holes, most of which intersected multiple vein families at substantially greater grades than what the existing mineral resource model predicted.
With an updated mineral resource estimate expected for release at the end of Q2 this year, Continental Gold has an internal target of seeing the mineral resources grow by up to another 1 million ounces overall, with a measured and indicated (M&I) resource goal of 3+ million ounces.
All this positions Continental Gold very well as it looks forward to its next development milestone – the final environmental permit for Buriticá. It already has its exploitation license at Buriticá, which it received in March of 2013, and which provides the company a 30-year license to mine.
Later that year, in December 2013, Continental Gold formally applied for its final environmental permit for the Buriticá mine with Corantioquia, the government agency in Antioquia, Colombia responsible for environmental permitting.
Following the submission of the application, Continental Gold communicated in their guidance that they would expect to receive the permit by the end of Q2 2015, which would then allow the company to begin construction at the mine.
Continental Gold remains fully confident in this timetable, and if you examine the current business environment in Colombia and how Buriticá fits in with Colombia’s ambitions as a country, one can see that Continental’s confidence is fairly well-founded.
Recently, we reached out to Ari Sussman, Continental Gold’s President and CEO. Sussman highlights two key points with regards to the mine: how serious Colombia is as a country in attracting foreign investment and, at the same time, how interested Colombia is in spurring additional business interest (there was a recent article in the The Northern Miner elaborating on just how organized Colombia has become in supporting “Projects of National Interest”).
“Colombia is today, and has been for many years now, a country with pro-business and right-wing elected governments,” Sussman comments. “The country enjoyed enormous growth in the early 2000s and that growth has only continued. Additionally, Colombia’s security has improved nation-wide leading to a tourism boom; in all major cities, foreign hotel chains like Sheraton, Hilton and Holiday Inn are suddenly appearing. The country really is transforming itself.”

Ari Sussman adds, “What makes the country particularly convenient for miners is that Colombia, which has always been friendly to direct foreign investment into its economy, has become much more secure in the rural areas since the turn of this century. Being the richest producer of gold in Latin American history, the future for precious metal projects looks bright within a mining industry presently dominated by coal production.”
Sussman also describes how the Buriticá mine fits in with Colombia’s national interests. In 2013, Colombia began a strategic infrastructure initiative called Projects of National and Strategic Interest, or PINES, as a way to strengthen the nation’s infrastructure and meet increasing energy demands. Projects included in the PINES initiative had to be of a certain scale in size and benefit the surrounding communities in Colombia.
In 2014, Continental Gold was included in the PINES initiative, giving the company one more bullet of confidence that it will receive full environmental permitting by the end of the second quarter this year.
Following the completion of permitting and an updated mineral resource estimate by the middle of this year, Continental Gold might initiate a feasibility study on Buriticá, with the goal of completing the study by the middle of 2016. If completed, and assuming the study yields positive economics, financing and construction would take place ahead of planned production in 2018.
When asked if Continental Gold would entertain being acquired by a larger gold mining company, Sussman said that all options would be put on the table in the interest of creating shareholder value.
“It is our preference to ultimately build and operate Buriticá,” Ari Sussman says. “However, we recognize that great gold mining companies can be born through strategic mergers, particularly during the bottoming process of a cyclical industry. The 2002 through 2005 period yielded some great companies through M&A activities, and that is not lost on us as we believe we are now entering a similar phase. However, we did not survive this four-year bear market (and counting) as a stand-alone company only to be acquired for cash at a multi-year low valuation. It would be far more attractive to us to review interesting merger concepts as a path forward to the future.
“Even though Colombia has a long-standing established mining industry, it is still a virgin frontier for discoveries, primarily due to the 25-year security-related exploration lapse that took place during the end of the 20th century. However, I believe we will see a strong mining renaissance over the next 25 years led by grass roots exploration discoveries. It takes perseverance to work in Colombia as a miner as it is still early days in the maturation process for the mining industry, but for those who endure and adhere to proper standards for environmental and social management, the rewards will be plentiful,” adds Sussman. “Continental Gold is at the forefront of this renaissance, in part because we have been in Colombia for so many years and have been able to position ourselves at just the right time.”

What if I told you that one country alone controlled the world’s food supply and its ability to feed growing populations? I think that’s something you’d want to know more about.
Tracking prices of gold and silver and understanding fluctuating supply and demands of mined commodities like uranium and copper are an essential part of the mining industry. But, sometimes we forget just how important mining is to agriculture and to putting food on our plates. After all, the three essential components of modern fertilizer – nitrogen, phosphate and potash – are mined.
It’s the world’s supply of phosphorus that demands this article’s attention.
How critical has phosphorous become to crop production in today’s modern agribusiness?
Absolutely critical.
Soil needs a certain amount of phosphorus in order for crops to grow – that’s an undisputed, unchanged fact. The change has come in how we’ve obtained our phosphorous over the past century. Prior to the twentieth century, farmers enriched their soil with phosphorus through composting plant waste or distributing phosphorous-rich manure over their soil. However, the introduction of mined phosphate rock half a century ago brought a sudden change to modern agriculture. With the introduction of mined phosphate rock – as well as mined potash and nitrogen – farmers for the first time had easy, cheap access to phosphorus.
So long were the days of farmers using plant waste or manure to enrich their soil, especially as farms grew in size and became increasingly dominated by corporate stakeholders. Mining gave farmers a new and revolutionary access to fertilizer that would allow them to produce more crops and feed more people. That’s good, right?
To a certain extent.
The problem is that mined phosphate rock, something that farmers across the globe now heavily rely on, is a depleting resource. “Peak phosphorus” hasn’t reached buzzword status yet. But, when you compare the current rate of phosphate rock extraction with the proposed levels of supply that can still be mined, the term will undoubtedly enter media discourse.
A few graphs provide a little more context to the issue. The chart here, produced by the U.S. Geological Survey, demonstrates just how much our use of phosphorous has grown over the past century. Another chart from the Global Phosphorus Network shows more specifically the dramatic increase in phosphorous consumption since 1960.
As our use and dependence on phosphorous has grown, studies have also shown just how much phosphate rock we have left, which is alarmingly little compared to our consumption rate. In fact, in 2009, a group of academics published a report asserting that, at our current rate of phosphate consumption, its mining production would peak at 2030, after which it would precipitously decline.
An unbalanced, unsustainable level of supply and demand of phosphorous is certainly problematic and will only cause price issues in the future. What’s perhaps more problematic is the fact that phosphate mining is nearly monopolized by the nation of Morocco. Because of the simple fact that most of the world’s phosphate mines are located in that country and in the Western Sahara, phosphate has become Morocco’s “white gold”. In a recent U.S. Geological Survey report, Morocco’s contribution of the world’s supply of phosphorus went from 5.7 billion metric tons to 50 billion metric tons. That’s 85 percent of the world’s total phosphorus.

Certainly when you have a monopoly of this size over a commodity of this much global importance, trouble is looming. Everyone knows the kind of control that OPEC and Saudi Arabia has, or at least had, over oil. After all, oil and gas enjoy consistent pen time from journalists. But, what makes Morocco’s control of phosphate even more troublesome is that not everyone is aware of it, nor is everyone aware of the impact it will have in coming years.
But, is mined fertilizer the only option there is to feed the world’s growing populations?
The answer is no.
The world’s fertilizer industry is currently dominated by large fertilizer corporations, like Mosaic and PotashCorp and Canadian-based Agrium Inc. (TSX: AGU). These are companies that supply mined inorganic fertilizer to farmers around the world, and in doing so, feed into the unsustainable system of farming that depends on phosphate rock. Moreover, these are the companies that feed into Morocco’s control over the world’s supply of phosphorus.
This leads to a second question: if there was another option besides mined fertilizer that could be used to feed growing populations, is the agriculture industry set up right now in a way to let this opportunity in?
Unfortunately, the answer to that seems to be also a no.
The fact of the matter is that agriculture’s domination by mega corporations has made the industry dangerously closed off to new innovation and technology.
Particular demonstration of that came several years ago in the failed business relationship between Agrium Inc., Crop Production Services (or CPS), and a little known company called the EarthRenew Corporation.
EarthRenew, a company that is now in receivership, was a Canadian-based business that, like Agrium, produced fertilizer for farm use. However, unlike Agrium, which produces mined fertilizer, EarthRenew produced organic fertilizer using cow manure in a highly innovative production process.
EarthRenew developed a way to produce organic fertilizer pellets or granules by cooking cow manure at very high temperatures using natural gas. The production process carried with it a number of benefits. The process produced electricity as a byproduct, enough in fact to return a portion of it to the community. EarthRenew’s fertilizer also held advantages in the farm. For one, since EarthRenew’s pellets were cooked at such high temperatures (temperatures over 500 degrees Celsius), the process killed off things like herbicide and pesticide residue, a common problem in organic fertilizer mixtures. Even better, the form of EarthRenew’s fertilizer — its pellet form — made it optimal for delivering nutrients to farm soil in an even and sustained way.
All this from unwanted cow manure.
In a world of increasing populations and an agricultural industry drunk on mined phosphate, this was the kind of innovation that’s needed.
So, what happened to EarthRenew then, a company that showed such promise?
In 2009, the future looked bright for the company. It was in the process of developing a prospectus, with the ambition of eventually going public. More than that, EarthRenew was looking to expand its operations from Canada into the western United States and was even beginning negotiations with the Royal Bank of Canada to finance the expansion.
It was then, in 2009, that EarthRenew began business negotiations in the form of a purchase agreement with a retail company called Crop Production Services, or CPS.
Crop Production Services is a large retail outlet that sells farm supplies and materials to farmers in the United States and Canada. With over 1,250 retail locations in three continents, CPS represents a significant force for any new fertilizer supplier looking to gain a foothold in the market.
It has to be noted that Crop Production Services is also a subsidiary company of the large international fertilizer production corporation, Agrium Inc., having been taken over by Agrium in 2008.
According to court documents, in early 2009, EarthRenew and CPS entered into negotiations with each other in the form of a an Initial Purchase Agreement, one inspired when CPS informed EarthRenew that it wanted to purchase EarthRenew’s entire inventory of fertilizer. What followed was a product offtake agreement and a licensing agreement that gave CPS the exclusive right to retail EarthRenew’s fertilizer in the western United States, with the obligation that CPS would purchase a minimum of 80 percent of EarthRenew’s product on a monthly basis.
This was seemingly a perfect business agreement – EarthRenew was producing a fertilizer that would be in demand with CPS’s retail customer base, while EarthRenew needed CPS’s buying power to secure financing it need to expand its operations.
According to court documents, EarthRenew even made it clear to CPS that the agreement would play a significant role in securing its financing.
To the detriment of the agriculture industry as a whole, the agreement between CPS and EarthRenew, despite it being a legally-binding contract, fell through. The question is why.
Shortly after publishing a press release describing their new business relationship, CPS backtracked out of their agreement with EarthRenew. CPS explained that the executive who signed the agreement with EarthRenew did not have the authority to do so; CPS then initiated a legal proceeding declaring the contract legally invalid.
In the end, the agreement between CPS and EarthRenew failed, leaving EarthRenew unable to secure the financing it needed to expand into the western United States. Agreeing to sell 80 percent of its fertilizer production to CPS and then seeing this agreement crumble was something it seemed EarthRenew couldn’t recover from and the company went into receivership.
All of this is now a lawsuit between Crop Production Services and the EarthRenew Corporation, as described in court documents.
But again, the question is why did CPS suddenly backtrack out of purchasing EarthRenew fertilizer. Is it because CPS is owned by and a subsidiary of Agrium? Is it because EarthRenew, a company that was bringing to market a new way to produce an organic fertilizer, represented a direct threat to Agrium’s main line of business? Did Agrium force Crop Production Services to cuts its purchase contract with this potential competitor as a way to protect its own business?
These are all very good questions and, in the end, for the benefit of the agricultural industry as a whole, they deserve consideration.

Ucore Rare Metals Inc. is a development-stage mining company focused on establishing rare metal resources with the potential for near-term production. Ucore’s primary focus is the 100% owned Bokan – Dotson Ridge Rare Earth Elements “REE” property in Alaska, located 60 km southwest of Ketchikan, Alaska. Approximately 40% (by weight) of the rare earth elements contained in the Dotson Ridge deposit are Heavy Rare Earth Elements, “HREE.” The Bokan Mountain project covers 30 sq. km (19 sq. miles). Bokan is the only REE deposit worldwide with immediate deep water access.
Molecular Recognition Technology, “MRT,” a Potential Game-Changer
Ucore Rare Metals, Inc. (TSXV: UCU | OTCQX: UURAF) is rare in a number of ways. Rare for its meaningful skew towards Dysprosium, Terbium & Yttrium; among the most critical, high-demand HREEs on the planet. Rare by securing a pre-approved $145 million long-term loan from the State of Alaska, representing 2/3’s of Ucore’s upfront capital requirements. Rare in sitting on the largest NI 43-101 compliant HREE deposit in the U.S. Rare because Ucore could possibly generate cash flow next year from the use or sub-licensing of its game-changing MRT technology, “MRT.” Rare with a stamp of approval from globally renowned REE expert Jack Lifton. Mr. Lifton has nothing but praise for the tremendous announcements made in press releases on March 2nd & March 3rd. I submit that Ucore offers a rare and quite compelling, investment opportunity.
If nothing else comes across or is remembered, please understand the significance of the March 2nd press release stating that Ucore successfully separated each of the REEs at high purity and high recoveries from its own Bokan Dotson-Ridge feedstock in Alaska. In a must see, March 24th, 12 minute interview, Jack Lifton **, [see disclosure below] Founding Principal of Technology Metals Research, LLC said, quote,
“I’ve heard in the last day or so that people refer to this technology [MRT] as revolutionary, in fact it’s evolutionary…. This is so logical, to apply this kind of technology to the separation of the rare earths….quite frankly I am very optimistic that [Ucore] will be able to scale this technology up. It is not new, it’s not revolutionary, this is a logical, additional application of MRT.”
Mr. Lifton said A LOT more than that…. I urge readers to click on the link above to hear the entire video interview. Also completed at about the same time, an excellent interview of CEO Jim McKenzie. Essentially, Ucore Rare Metals has obtained exclusive rights to a proven technology that’s been successfully deployed at commercial scale at roughly 40 metals processing facilities around the world. Ucore is scaling up MRT to process its own resource in Alaska as well as offering to toll process/refine third-party REEs. As Mr. Lifton said, this is evolutionary, not revolutionary. From an investor’s point of view, the March 3rd press release is equally important. Why? Ucore has, quote,
“…entered into an agreement with IBC Advanced Technologies Inc. (“IBC”) to acquire the global exclusive rights to IBC’s Molecular Recognition Technology (“MRT”) for rare earth separation and recycling applications, in addition to tailings processing.”
U.S. Based Ucore Could be Part of the Solution in Mitigating the World’s Reliance on China
Ucore has exclusive worldwide rights to use MRT not just for REEs, but also for remediation of tailings ponds and waste dumps containing previously unrecoverable (uneconomic) metals and minerals. MRT has been short-listed to help remediate radioactive water at the contaminated Fukushima site in Japan. If one doesn’t believe the CEO or Mr. Lifton, consider that the initial version of MRT received the 1987 Nobel Prize in Chemistry. Not only is Ucore in an enviable position with regard to its Alaskan property and MRT, the implications for MRT for the REE sector are potentially huge. For example, think about China’s chokehold on REEs (and other metals & minerals). CEO McKenzie points out that,
“Global manufacturers like Siemens and ThyssenKrupp will accelerate the current movement to source Rare Earth Elements from resources outside of China. Security of supply, environment concerns and fears of Chinese ‘resource nationalism’ will continue to steer this development. Every major global manufacturer is deploying similar strategies. Even the Chinese are developing these ‘primary resource’ relationships in the rest of world, “ROW”. There have been 4 or 5 ROW-Chinese deals in 2015 alone. This trend will continue to drive up the value of HREE projects, especially near-term projects like our Bokan-Dotson Zone deposit in Alaska.”
The reason I’m going on and on about MRT is quite simple. The near-term application of MRT could enable Ucore to generate cash flow next year. Beyond that, the company’s flagship project is expected to reach production 1h, 2018. With Ucore’s pre-approved $145 million long-term loan from the State of Alaska, these developments greatly de-risk the company. I believe that the company’s rights to deploy MRT at Bokan Dotson-Ridge and elsewhere could, alone, be worth Ucore’s total market cap. And, the value of Ucore’s Alaskan HREE-skewed deposit could, alone, also cover the current market cap. Either way, investors have a very compelling opportunity to participate in a potentially substantial increase in the stock price.
Market Largely Ignoring the De-Risking of Ucore & the Blue-Sky Upside Potential, Well Beyond the Use of MRT Internally
To say that the market is ignoring recent developments would be an understatement. Instead of the valuation moving higher on these key events, the stock price since March 3rd is down 15% from $0.33 to $0.28. The current valuation could easily move higher upon ongoing advances. Near-term catalysts include demonstrating MRT at, “semi-commercial” scale, testing peer REEs company material, reclamation opportunities and submitting a Plan of Operations.
Digging a little deeper, it seems reasonable that additional debt capital could be arranged after the $145 million long-term loan. Lenders and strategic partners would take that as a meaningful vote of confidence. Therefore, equity dilution in coming years should be relatively small compared to the hundreds of millions facing most aspiring REE juniors. Debt capital from a friendly lender is increasingly difficult to come by. If the State of Alaska is willing to dole out a $145 million long-term loan in support of this project, what does that suggest about Ucore’s ability to secure the necessary permits and approvals?
Conclusion
Briefly: In our opinion, a speculative short position (half) in gold, silver and mining stocks is justified from the risk/reward point of view.
The situation in the precious metals market is quite specific at this time. We have gold moving higher on low volume and moving lower on increased volume (which is bearish), but during the last few weeks miners have outperformed gold which seems to indicate strength. One of the signals that help to decide what the outlook really is comes from silver stocks.
Before we move to silver miners, let’s take a look at gold and silver (charts courtesy of http://stockcharts.com).
Click here for reference chart.
As mentioned above, the price of gold moved back and forth and the corresponding action in volume was bearish. Volume very often confirms the direction in which the market is going and it allows to differentiate between true rallies (that are likely to be followed by even bigger rallies) and corrections (that are likely to be followed by declines). In this case, we saw the latter type of action.
Gold is after a confirmed breakdown below the rising support line and after reaching the 50% retracement based on the February – March decline, so it’s been likely to decline and the price-volume action makes this even more likely.
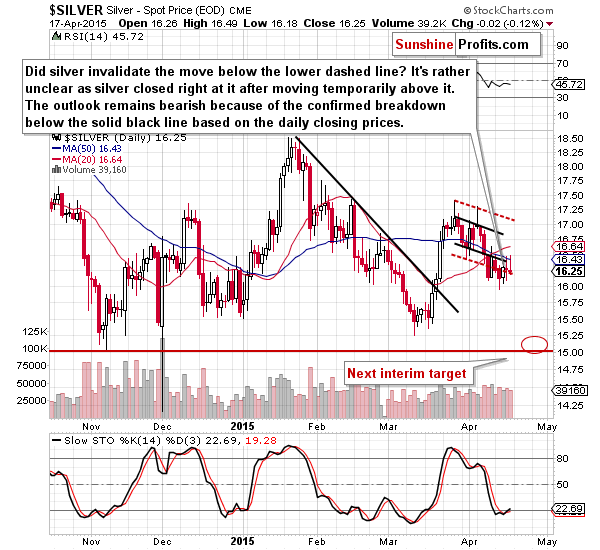
Silver’s bearish outlook also remains unchanged as the price didn’t do much on Friday. Silver tried to move above the previously broken black support/resistance line, but was only able to move to it on an intra-day basis and decline shortly thereafter.
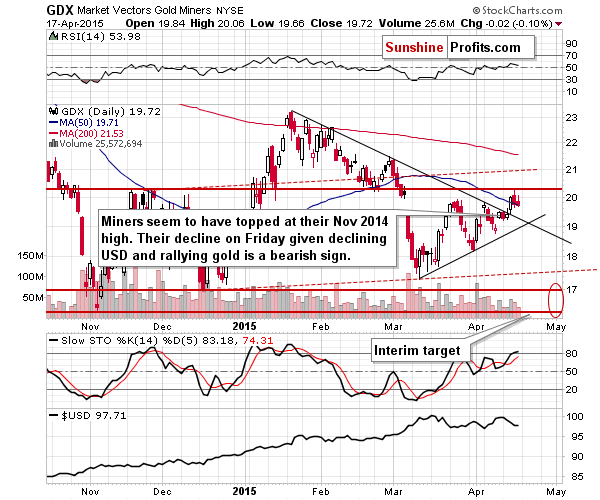
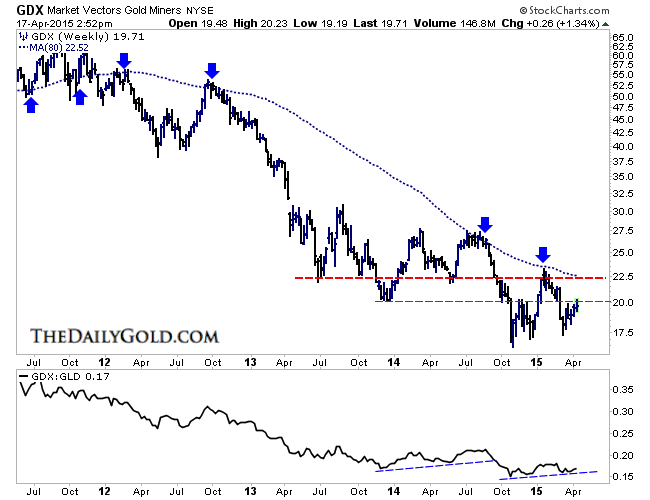
Yesterday’s price action in mining stocks (the GDX ETF includes both gold stocks and silver stocks) might seem surprising to those who believed that miners would soar right after the breakout as miners refused to rally even despite the gold’s rally on Friday. That’s a bearish sign.
Have we just seen another top? Based on the Nov. 2014 highs being reached – yes. However, we wouldn’t rule out a move to the $21 level as such a move would make the head-and-shoulders pattern more symmetrical. Please note that we don’t have to see this type of move for the pattern to have bearish implications – the pattern doesn’t have to be perfectly symmetrical and a top (right shoulder of the pattern) at exactly the previous top (left shoulder of the pattern) would very much make it meaningful anyway.
Our previous comments about the head-and-shoulders pattern’s implications for mining stocks remain up-to-date:
The red resistance lines that you can see on the chart are based on the possible head-and-shoulders pattern. If we see a move to the Nov. high or even to the $21 level but without a visible breakout above them and then see a decline, the implications will be very bearish. If we don’t see such upswings and miners decline before these levels are reached (which seems likely), then the implications will be very bearish anyway, because the head-and-shoulders pattern will continue to be formed. If it is completed, the decline following the breakdown below $17 could take the GDX ETF below $13.
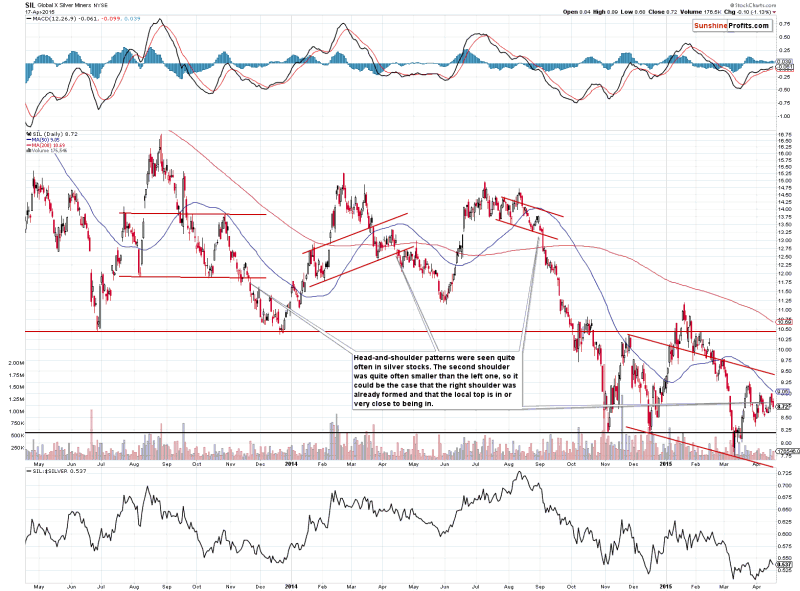
What about the silver stocks?
Silver stocks formed bearish head-and-shoulders patterns a few times previously. In each case, these patterns resulted in much lower values of silver stocks and the rest of the precious metals sector. What’s particularly interesting about these patterns is that the right shoulder was quite often (2 out of 3 cases) smaller than the left one. Consequently, a move higher here is not required for the right shoulder of the current head-and-shoulders to form. In fact, it’s top could be already behind us.
All in all, the thing that silver stocks tell us is that we can really see a move lower right away, without another small upswing (hence, exiting the small short positions at this time seems premature).
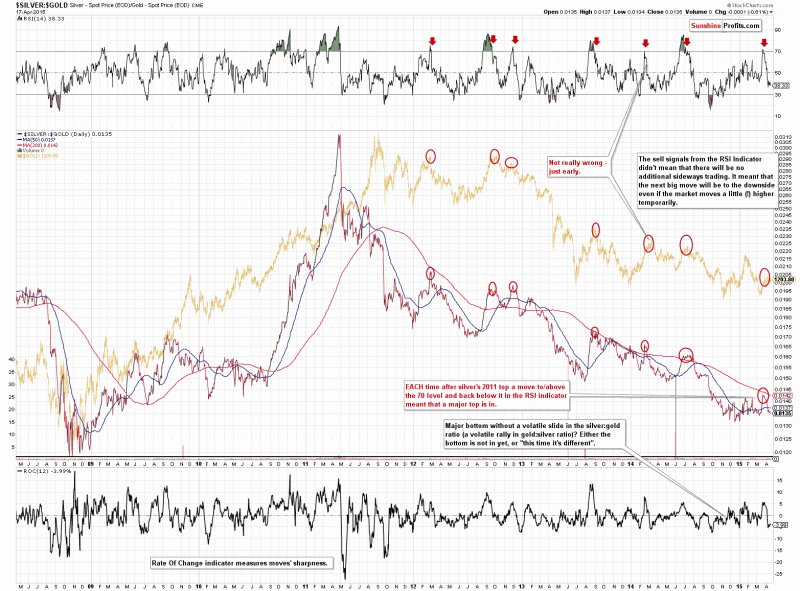
Furthermore, let’s not forget that the silver to gold ratio has recently moved sharply higher, causing the RSI indicator based on it to become overbought. In EACH case that we saw this development a major decline followed (at times we had to wait for it a few weeks, but it ultimately happened without a bigger rally before it). We have not seen a major decline so far, so the bearish implications remain in place.
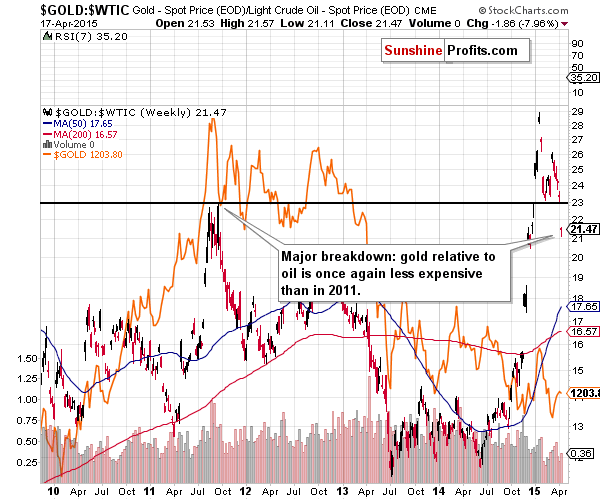
The gold to oil ratio closed the week well below its 2011 high, and – because of the size of the move and the weekly close – we consider the breakdown to be confirmed. The implications are bearish and our previous comments remain up-to-date:
We think that there’s nobody in the precious metals market that needs to be convinced that the 2011 top was a major event. However, it was not only major in gold itself, but also in the case of its ratios, including the gold to oil ratio.
This ratio peaked in 2011 as well and it was not until this year that it was broken. The initial move lower in the ratio earlier this year and a rebound from the 2011 high proved that this is indeed a major support/resistance level. This important level was just broken yesterday in a very profound way.
The gold to oil ratio moves in tune with gold, so such a major breakdown in this ratio has bearish implications for gold as well.
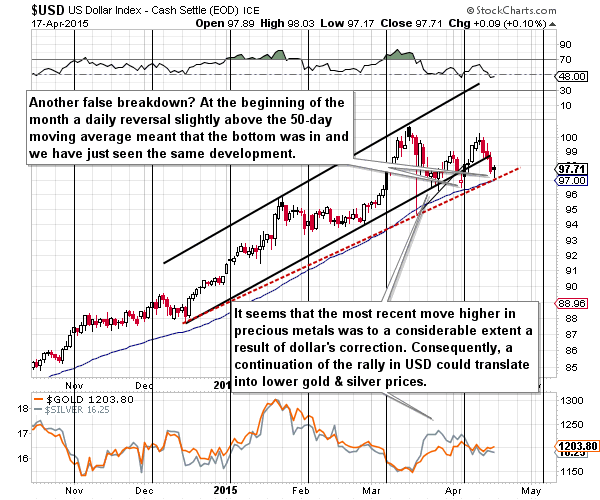
The USD Index declined on Friday, but only initially – it came back up in the following part of the session. Will the USD decline based on the breakdown below the rising trend channel? It’s possible, but it’s not very likely. Please note that this line was invalidated a few times in the past and in each previous case the USD rallied back above it.
Moreover, the 50-day moving average provides support (just like it was the case in mid-March and early April) and so does the red dashed support line based on the December and March lows. Consequently, the outlook did not deteriorate significantly – we can still see much higher USD values in the coming days and weeks.
Summing up, even though it seems that the situation in the precious metals market is improving based on last week’s strength in mining stocks, we think that this is not the case – in fact, the opposite might be taking place. The strength in miners was no longer present on Friday and practically no other market or ratio (i.a. gold, silver, silver to gold ratio, gold to oil ratio, silver stocks, USD Index) is confirming it. While we could see some more strength in miners, it’s not likely to be significant and – more importantly – we don’t have to see more strength for the bearish head-and-shoulders pattern to be completed. The right shoulder has already been formed (it’s after the right shoulder’s highest point) in the case of gold and silver and it seems that it’s about to be formed in the case of mining stocks. The implications are very bearish and it seems that exiting small short positions in the precious metals sector at this time would be premature. If we see an invalidation thereof, we’ll close the positions, but it seems more likely that we will see a bearish confirmation, which will likely result in increasing the size of the short position.
To summarize:
Trading capital (our opinion): Short (half position) position in gold, silver and mining stocks is justified from the risk/reward perspective with the following stop-loss orders and initial (!) target prices:
Gold: initial target price: $1,115; stop-loss: $1,253, initial target price for the DGLD ETN: $87.00; stop loss for the DGLD ETN $63.78
Silver: initial target price: $15.10; stop-loss: $17.63, initial target price for the DSLV ETN: $67.81; stop loss for DSLV ETN $44.97
Mining stocks (price levels for the GDX ETN): initial target price: $16.63; stop-loss: $21.83, initial target price for the DUST ETN: $23.59; stop loss for the DUST ETN $12.23
In case one wants to bet on lower junior mining stocks’ prices, here are the stop-loss details and initial target prices:
GDXJ: initial target price: $21.17; stop-loss: $27.31
JDST: initial target price: $14.35; stop-loss: $6.18
Long-term capital (our opinion): No positions
Insurance capital (our opinion): Full position
Disclaimer
All essays, research and information found above represent analyses and opinions of Przemyslaw Radomski, CFA and Sunshine Profits’ associates only. As such, it may prove wrong and be a subject to change without notice. Opinions and analyses were based on data available to authors of respective essays at the time of writing. Although the information provided above is based on careful research and sources that are believed to be accurate, Przemyslaw Radomski, CFA and his associates do not guarantee the accuracy or thoroughness of the data or information reported. The opinions published above are neither an offer nor a recommendation to purchase or sell any securities. Mr. Radomski is not a Registered Securities Advisor. By reading Przemyslaw Radomski’s, CFA reports you fully agree that he will not be held responsible or liable for any decisions you make regarding any information provided in these reports. Investing, trading and speculation in any financial markets may involve high risk of loss. Przemyslaw Radomski, CFA, Sunshine Profits’ employees and affiliates as well as members of their families may have a short or long position in any securities, including those mentioned in any of the reports or essays, and may make additional purchases and/or sales of those securities without notice.
Precious Metals continue to be a conundrum. While Gold has trended lower it has failed to break below $1100 as so many expect. It is very strong against foreign currencies and did not break to a new low even as the US$ index rallied from 87 to 100. On the other hand, Gold has failed to sustain any bullish momentum. The gold stocks are even more oversold and have formed some higher lows since last November. Yet, they have failed to sustain any bullish developments and are far from reaching a higher high. Only time will tell which way the sector will break and how its bear market will conclude.
There are several things in the chart below to discuss. Aside from the price action in Gold, we plot the net speculative position in the COT and Gold’s volatility index (GVZ). The immediate weekly resistance for Gold is $1220 followed by $1250-$1260, where there is a strong confluence of resistance. Support is at $1180 and $1150.
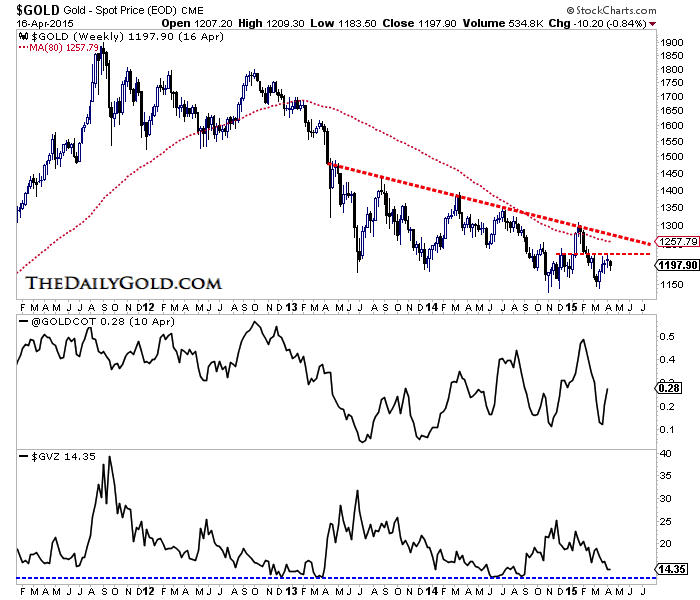
One reason Gold has struggled to get traction to the upside could be the relatively high net speculative position. If the net position was much lower then Gold would encounter much less selling after every rally or pop higher. Whether by time or price, the speculative position needs to decline for Gold to have a better shot at sustaining a rebound.
Gold’s volatility has declined since last November and is nearing the important lows seen in summer 2014 and early 2013. Periods of low volatility will ultimately lead to periods of rising volatility. That can accelerate market moves. Keep an eye on May and June as to when volatility could begin to increase.
Meanwhile, the gold miners are looking more constructive than Gold and that should not be a surprise. The mining sector peaked months before Gold in 2011 and also should benefit from the collapse in Oil as well as severe weakness in local currencies.
The key for the miners (GDX in this case) is the confluence of resistance at $22.50. The 80-week moving average has been very important support and resistance dating back to 2010. If GDX can break above $20 then it would have a chance to test the 80-week moving average for the third time in the past 11 months. That would be the sign of a market transitioning from bear to bull.
The bear market in precious metals is essentially four years old and a change is soon to be at hand. The question is will it end through a slow transition in the months ahead or will it end soon after Gold loses $1150 and plunges below $1100? Either scenario presents an opportunity. If Gold breaks lower, that would ultimately provide an excellent buying opportunity. If the miners can rally up to the 80-week moving average then that would indicate the sector is in gradual transition from bear to bull.
For weeks I have been highlighting that the uranium spot price (URPTF) has been outperforming oil and the S&P500 (SPY) in a major way indicating that there were significant catalysts on the horizon which could boost the uranium miners as well. This week major news has come across the wire that Canada and India has agreed to a major bilateral agreement over the sale of uranium.
India is moving ahead with nuclear development and needs to source uranium for their reactors. Australia has been problematic with permitting issues hurting the junior uranium miners attempting to develop projects there. However, Canada is open for business and optimistic that it can deliver millions of pounds of uranium from their high grade, uranium rich Athabasca district in Saskatchewan.
Canada could become the Saudi Arabia of the 21st century as the world turns from dirty coal into clean nuclear power generation. This India and Canada agreement could mean the green light is on to finance uranium exploration and development. The pessimism from Fukushima is old news for the nuclear sector and has been replaced with the optimism of major growth from emerging economies such as India and China who are building nuclear reactors at a record pace.
![]()
Canadian Prime Minister Stephen Harper who is up for election in 2015 is a great supporter of nuclear energy and expressed his delight to reporters about the deal which has broad popular support both in Canada and India. India is the second most popular country and they may be at the beginning of a nuclear renaissance.
Similarly, China’s stock markets are soaring as investors believe the economy may be turning higher. They may be on the hunt for acquisitions to secure long term supply as well. It will be hard to find as many of the marginal producers have already shuttered mines and the low uranium spot price has made it challenging to finance development projects.
There could be a coming spike in the uranium price. Investors should look at the uranium miners ETF (URA), low cost producers such as Cameco (CCJ) and Uranerz (URZ), which is merging with Energy Fuels (UUUU).
For investors looking for greater leverage they should focus on Fission Uranium (FCU.TO or FCUUF) which is continuing to grow and expand the Patterson Lake Discovery, a once in a generation high grade discovery which has already over 110+ million pounds of uranium. As soon as it breaks out and continues its upward trend I expect either Cameco, Rio or the Chinese look to chase it.
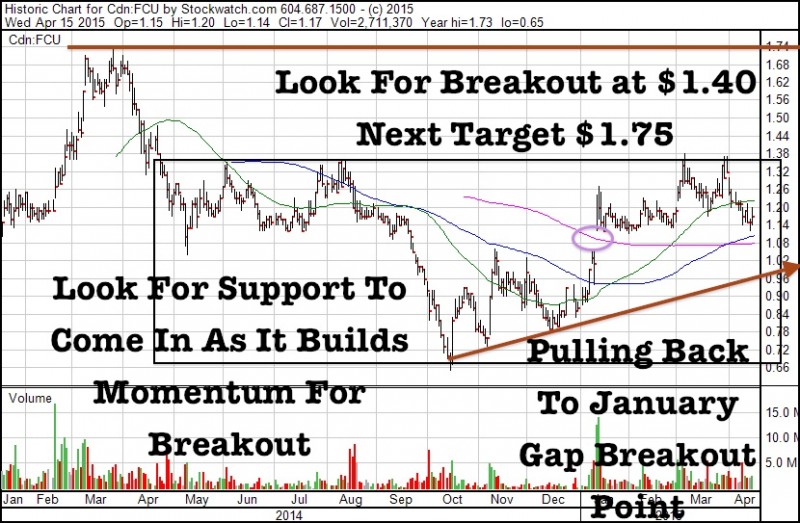
Look for a breakout at $1.40 which should lead to an eventual move to test 2013 highs around $1.75. Fission recently raised $17.4 million and I believe support and accumulation should begin as it pulls back to the January Gap Breakout Point.
The uranium sector has been beaten to a pulp over the past four years. Despite the once in a millennium Fukushima disaster which pummeled the nuclear sector, uranium spot price and the uranium mining sector (URA), Fission has been able to outperform and build a market cap of over $460 million CAD.
Fission Uranium (FCU.TO) is continuing to advance one of the greatest uranium discoveries in the Athabasca Basin. The huge high grade resource of around 110 million lbs with most of the deposit extremely shallow less than 250 m deep should provide huge leverage if the sector begins turning higher and as sentiment changes more positive.
The company recently made an investment in Fission 3.0 (FUU.V) a spinout which holds 18 exploration properties in the Athabasca Basin. Using a prospect generator model, other junior uranium explorers are partnering with Fission’s management to advance these targets. As the uranium sector turns around I expect Fission Uranium’s PLS discovery to be sold to a major such as Cameco, Areva or Rio Tinto and interest could turn to the next big discovery. Capital will seek out the talented management team which has a track record of building shareholder value.

1. Almost every day, bank economists are making more positive statements about the outlook for gold prices, and rightly so. “Money printing had almost always resulted in inflation but in today’s excess global production capacity environment and with the oil price having collapsed, that inflation has been deferred….” – Jon Bergtheil, Citigroup, April 13, 2015.
2. Jon suggests that the 2016 – 2020 period should support higher gold prices, because the inflation that has been deferred will arise.
3. Barron’s also posted a very positive report on Newmont on the weekend, stating that Newmont shares will rise substantially, even if gold declines.
4. I agree, and in 2014 I predicted that 2015 -2016 would see many gold stocks outperform gold, regardless of where gold trades.
5. Merrill Lynch analysts predict gold could rise to $1500 by 2017. They are joined by economists at ANZ bank and HSBC. The list of bank analysts that are warming up to gold is getting larger all the time!
6. I think it’s important for investors in the Western gold community to give careful thought to these very rational statements made about gold and gold stocks, by top bank economists.
7. That’s because the love trade in China and India has experienced astronomical growth in the past several years, as signs of wage price inflation in America are appearing.
8. These two events are highly supportive for gold prices. With all due respect, most of the amateur analysts still regularly drawing arrows to Pluto or Hades on their gold charts may need to take a large “chill pill”. Here’s one reason why: The current issue of Barron’s quotes JP Morgan fund manager Bob Michele stating, “Although some past hiking cycles have proved disruptive (1994 is a case in point), others, like 2004-2006, are more muted and manageable. We think the coming cycle will fall in that second camp. The Fed will be cautious—that is key.”
9. When the fundamentals of the US economy and the statements of Janet Yellen are weighed rationally, it’s clear that the Fed intends to raise rates, but not until there is more evidence of wage inflation, which is itself very supportive for gold.
10. In regards to US interest rates, gold responds more to changes in long term T-bond rates than to short term rates, and the Fed seems focused mainly on the rates of short term bonds.
11. My suggestion to the Western gold community is to adopt an “eager” mindset about gold; modest price declines should be bought aggressively, but modest rallies can also be sold aggressively, because the fundamentals suggest gold will continue to trade roughly sideways, with a growing upwards bias.
12. On that note, please click here now. That’s the daily gold chart. It’s clear that minor price declines are less worrisome than a fly to most bank economists now, and I think it’s time for the entire Western gold community to adopt that mindset.
13. It’s the greatest time in history to own gold, with inflation creeping higher in America, and the love trade growing like a tidal wave in Dubai, China, and India.
14. I’ve been a seller of some gold around $1217, and a buyer at $1185, with a smile!
15. When the price fell in 2013, many amateur analysts rushed to say, “Gold is an insurance policy, so you shouldn’t have more than 1% – 5% of your net worth in it”. Gold isn’t just an insurance policy. It’s the greatest asset in the world, and investors can invest large amounts of their net worth in it.
16. It’s the outrageous expectations of obscene profits and fears of price collapse that cause problems for investors in gold, not the asset itself. Gold should only be bought in size at major HSR zones (horizontal support and resistance), and the focus now should be gold stocks more than gold.
17. On that note, please click here now. That’s the daily chart for Newcrest, one of the world’s top gold producers.
18. The chart looks superb, and so do the charts of many gold stocks. Please click here now. That’s the daily chart of AuRico, which is a GDX component. The stock is gapping higher on awesome merger news:
19. “Miners Alamos Gold Inc. and AuRico Gold Inc. said Monday they have agreed to merge, creating a gold producer with a combined market capitalization of around $1.5 billion and key producing projects in mining-friendly jurisdictions in Canada and Mexico.” – Wall Street Journal, April 13, 2015.
20. Many gold stocks have staged spectacular rallies in 2015, and held their gains, but that’s not reflected in the GDX and GDXJ ETFs because other component stocks have languished. As the love trade intensifies and US wage inflation becomes widely recognized, top bank analysts will inspire mainstream money managers to buy more gold stocks. The ETFs will begin to stage bigger rallies as that happens, and hold the gains.
21. Please click here now. That’s the GDX daily chart. It looks like a “wet noodle”. My suggestion is to approach it, as with gold, somewhat aggressively on the buy side on small declines, and almost as aggressively on small rallies. The tactics used should reflect a sideways market that has a mild and growing upwards bias.
22. Please click here now. That’s the daily chart for silver. The main point I want to make here is not that silver could decline to a new low, but that it is tremendously well supported by love trade and wage inflation fundamentals, and it tends to track gold.
23. So, minor weakness needs to be bought aggressively and without fear, and minor strength can be sold without fear that the price is “getting away”.
24. The tactical reality for silver is not that it is about to rocket higher or crash, but that the asset has never been as fundamentally solid as it is now. Greed and fear in the Western gold community will go the way of the dodo bird, as investors see more and more top bank economists and fund managers embrace gold, silver, and mining stocks…. as assets of quality.
Stewart Thomson of Graceland Updates, Guest Contributor to MiningFeeds.com

Ten years ago, Andrew Pollard recruited his first CEO of a publicly traded mining company. He was 20 years old and bought himself a Porsche to celebrate, despite living with his parents at the time. In the decade since, he has built Mining Recruitment Group (MRG) to be the industry leader in executive search for the mining industry.
Today Andrew’s talking about the ebbs and flows of his MRG business. He tells me President and CEO searches are not where he’s making his money these days, it’s the operational roles. According to Pollard, a marginal, small gold mine may need $300,000 USD annually to recruit a solid general manager, while the president of the same operation may only be earning half that.
“Running a profitable gold mine is a lot easier at $1900 an ounce than $1200,” Pollard says. “Managers with a track record of cutting costs and raising output really are the white buffalos of the mining sector today.”
The irony is these managers are brought in to cut costs, but the companies have to pay a small fortune to get them on board, and may need the services of someone like Pollard to lead an international search.
Pollard is not only talking up mining general managers, he thinks the market for all mining executives is about to get extremely tight. According to a Fall 2014 MRG survey, 39% of mining executives plan to retire from full-time employment within the next four years.
“The mining industry is currently dealing with four years of declining commodity prices, share prices, financing activity, exploration activity, etc,” remarked Pollard. He continued, “as soon as the industry works its way past those challenges, it will be staring down the barrel of a demographic shotgun.”
Pollard is optimistic for a steady wave of mergers and acquisitions in the mining business, not only to replenish its reserves but talent as well.
“Talent-driven acquisitions in mining will be as common as they are in technology.”
Miners looking to discuss talent with Mr. Pollard, mention this article in April 2015 to receive 10% off an executive or board search.
www.MiningRecruitmentGroup.com and email: apollard@miningrecruitmentgroup.com
Here’s a quick video with Andrew taped at Cambridge House in January.
Gold’s bottoming consolidation grind continues, with investment demand still garroted by sky-high world stock markets and the parabolic US dollar. With investors missing in action, gold prices remain totally at the mercy of American futures speculators. These perpetually-bearish traders are once again heavily short gold, which has led to sharp short-covering rallies in recent years. The latest one has just started.
In normal markets, gold prices are determined by global investment demand. This certainly isn’t the biggest source, running at just under a quarter of world gold demand last year according to the World Gold Council. But it’s the most volatile by far, changing dramatically with the shifting winds of investors’ favor for gold. When they want to diversify into gold, their extra buying inexorably pushes gold prices higher.
But unfortunately the last couple years have been anything but normal for gold. Back in early 2013, the Fed started augmenting its young QE3 debt-monetization campaign with aggressive jawboning. It kept implying to stock traders that it was ready to quickly ramp up money printing if the stock markets sold off materially. This short-circuited normal healthy sentiment-rebalancing selloffs, as traders feared nothing.
Since they figured the Fed had their backs, why even worry about such trifling things as dangerously-high valuations and radical overextension? Thus the stock markets levitated, powered higher without normal material selloffs. Since gold is an alternative investment that moves contrary to stock markets, this slowly strangled gold investment demand. Investors gradually abandoned it, leaving this metal for dead.
Their absence left gold prices utterly dominated by American futures speculators. Because of futures’ inherent extreme leverage, a relatively small amount of capital has a wildly-disproportionate impact on price action. While investors usually buy gold outright, or at most run 2x margin through gold-tracking ETFs like the flagship American SPDR Gold Shares (GLD), it takes far less capital to game gold via futures.
Each COMEX gold-futures contract controls 100 ounces of gold, which was worth about $120k with gold meandering around $1200 this week. But the minimum maintenance margin required to own that single contract is merely $4k. That means American futures speculators can run extreme 30x leverage to the gold price! That is incredible, as leverage has been legally limited to 2x in the stock markets since 1974.
With each dollar of futures speculators’ capital controlling up to $30 of gold, their trading naturally has a super-outsized impact on gold’s price. Every dollar they deploy effectively has 15x to 30x the price-moving firepower of an identical dollar invested! That’s a powerful force even in normal times, and with the Fed frightening away investors in recent years futures trading has become overwhelmingly dominant.
This first chart really illustrates this. It looks at the daily gold price superimposed over speculators’ total gold-futures positions as reported by the CFTC in its famous weekly Commitments of Traders reports. Large and small speculators’ total long gold-futures positions are shown in green, and their short ones in red. And it is their short selling in particular that has manhandled gold in these surreal Fed-distorted markets.

The strong inverse correlation between the gold price in blue and speculators’ total gold-futures shorts in red is nearly perfect in recent years. When speculators are effectively borrowing gold they don’t own to sell it in the futures market, the gold price falls. Then later when they fulfill their legal obligations to buy back those same shorted contracts to cover and close them, the gold price rallies. Like clockwork!
Provocatively that’s the lion’s share of gold’s pathetic story in recent years. With investors largely gone thanks to the Fed, American futures speculators’ short selling effectively controlled the gold price. This metal hit major lows when their short-side bets were high, and major highs when their shorting was low. While other factors like epic record gold-ETF liquidations came into play, futures shorting dominated gold.
Given this ironclad precedent, it’s very clear there’s nothing more important to watch for investors and speculators looking to game gold. At least until these lofty artificial Fed-levitated stock markets inevitably roll over and restore some semblance of normalcy. As long as the majority of investors shy away from gold, American futures speculators will continue running amuck with its price. They’ve got the helm.
So it’s absolutely essential to follow their gold-futures short selling and subsequent covering to gain the best idea of where gold is likely headed next. And speculators’ total gold-futures shorts recently soared to a major high. As of the second-to-last CoT report before this essay was published, speculators’ total shorts climbed to an enormous 150.6k contracts! That is a massive amount of gold borrowed and sold.
With each futures contract controlling 100 ounces of gold, 150.6k contracts is the equivalent of 468.4 metric tons of gold. To put this into perspective, in all of 2014 global gold investment demand was just 904.6t. So American futures speculators, just one group of traders in a big world, have borrowed and sold the equivalent of over half an entire year’s gold investment demand! No wonder gold has been weak.
This is actually the third-largest spike of speculator gold-futures shorting on record. Our Commitments of Traders data at Zeal goes back to early 1999. And over the entire span since, there have only been two other episodes of more extreme speculator shorting. The big one was back in early July 2013, after gold had just plummeted 22.8% in the second quarter of that year. That was its biggest quarterly loss in 93 years!
What was essentially a once-in-a-century extreme gold selloff was driven by a combination of extreme gold-futures shorting and extreme gold-ETF liquidations. That ill-fated disaster of quarter initially saw panic selling as gold’s major multi-year support failed. Another brutal leg down happened a couple of months later when Ben Bernanke started talking about the Fed slowing down its QE3 bond buying.
The resulting epic bearishness led American futures speculators to ramp their short contracts to what was at least a 14.5-year high (since early 1999) and likely an all-time record of 178.9k contracts! That was the equivalent of 556.4t of gold. While gold’s prospects certainly felt bleak back then just as they do today, speculators’ gold-futures shorting is a powerful contrarian indicator. These shorts must soon be covered.
As you can see in this chart, gold bottoms near major shorting peaks without fail. And indeed these speculators soon rushed to cover after their epic shorting spree leading into mid-2013. There are two reasons why extreme shorting presages major buying. First, borrowing something from its owner to then sell it requires that debt to be repaid. So futures speculators are legally obligated to effectively do just that.
The way speculators repay their gold-futures shorting debts is to buy offsetting long contracts for each contract sold short. That erases the short, closes the trade, and effectively repays that debt. Thus every contract shorted soon reverses into perfectly-equivalent buying. And in the futures markets, the upside price impact of buying a new long contract or buying a long to cover a short is identical. It pushes gold higher.
That leads to the second reason why major buying follows big shorting, the extreme leverage inherent in futures speculation. Today’s maximum margin available in gold-futures trading isn’t an anomaly at all. At 30x leverage, a mere 3.3% move against a speculator will wipe out 100% of their capital risked! They face total losses, and even more with margin calls, if gold manages to stage even a relatively-small rally.
Speculators’ short covering itself fuels this. As the short selling forces gold lower, some traders start to buy to cover and realize their profits. This reverses gold higher, putting other speculators’ shorts at risk of rapidly becoming big losses. So they rush to cover too, sparking even more widespread buying to cover shorts. The more buying, the bigger and faster the potential losses, the quicker speculators exit.
So once short covering starts from a major shorting peak, it tends to feed on itself and unfold rapidly. After that record shorting in early July 2013, American speculators bought to cover 95.3k short contracts over the next 16 CoT weeks. That was the equivalent of an incredible 296.4t of gold purchased by this one group of traders in a matter of months. Their initial surge catapulted gold 18.2% higher in just 8.6 weeks!
Gold’s short-covering rally would have been even bigger if it hadn’t been retarded by the ongoing heavy differential selling pressure in GLD gold-ETF shares back then. That contributed to more bearishness on gold, so futures speculators soon started ramping their downside bets again. By early December 2013, they had soared to 150.0k contracts. Provocatively that is just under today’s recent levels of 150.6k.
And that extreme shorting spree also soon gave way to major short covering. Speculators bought back 72.3k contracts in 15 CoT weeks, the equivalent of 224.7t of gold. That fueled another big 16.2% gold rally over 11.4 weeks. The best time to be bullish on gold is when American futures speculators are the most bearish as evidenced by their shorts. They will soon have to become big buyers and catapult gold higher.
The third big shorting spike of the recent Fed-distorted years crested in June 2014, but at a much-lower 132.8k contracts. Still, that resulted in 60.9k contracts of short covering in 9 weeks, helping to propel gold a very respectable 7.6% higher in just 5.6 weeks. But that young upleg was soon battered back down by the Fed’s surreal ongoing US stock-market levitation and the mighty US dollar’s parabolic surge.
So American futures speculators again piled on the bearish bandwagon, and ramped their total shorts to 162.5k contracts by mid-November 2014. This was their second-highest spike since at least 1999, and more than likely ever. But like all extremes of leveraged gold-futures shorting, it wasn’t sustainable. As soon as gold naturally started to reverse, speculators scrambled to buy to cover. Again this unfolded rapidly.
They would buy back 92.1k contracts in the next 12 CoT weeks, the equivalent of 286.4t of gold. And that would fuel a sharp 14.2% gold rally in just 10.2 weeks. See the pattern here? When speculators get too bearish and push their leveraged downside bets too high, they will soon be forced to buy back most of those shorts which blasts gold higher. These averages prove a compellingly-bullish case for gold.
Those previous four major shorting spikes during the Fed’s QE3-fueled stock-market levitation subsequently averaged 80.2k contracts of speculator short covering unfolding in 13 CoT weeks. They helped propel gold an average of 14.1% higher in just under 9 weeks. That’s not trivial by any means. From prevailing $1200 levels today, a 14.1% gold upleg would blast this metal to $1369! That would really excite traders.
This crucial background on the interplay between American speculators’ gold-futures shorting and the gold price brings us to today. In last CoT week’s report, this group of traders’ total shorts had surged back up to 150.6k contracts. That barely edged out the late-2013 shorting spike to become the third-largest on record. This meant major short covering was imminent, as I told our subscribers at the time.
And indeed it has already started. In the latest CoT week before this essay was published, speculators covered a massive 25.9k short contracts. That is the equivalent of 80.5t of gold in a single CoT week! The magnitude of this is stunning. In the 117 CoT weeks since early 2013 when the radical gold-market distortions started thanks to the Fed’s QE3 stock-market levitation, only 2 others saw short covering exceed 25k contracts.
With such a massive initial short-covering frenzy, odds are this latest buying has lots of room to run. If it lives up to the previous averages after recent major shorting spikes, this portends 80.2k contracts of buying unfolding over 13 weeks. That means only about a third of the likely short covering has already happened, leaving much more gold-futures buying in the next few months. That’s very bullish for gold!
Interestingly that 80.2k-contract average of post-spike short covering also fits in nicely with a couple of other key metrics. The first is the support line of speculators’ total gold-futures shorts. Note above that after each earlier short-covering frenzy, speculators’ total shorts bottomed at decreasing levels. Gold’s $1200 support was effectively holding, so the wiser speculators started to give up on continuing to short it.
Today that support line is down around 60k contracts. The average 80.2k of covering would take total shorts down to the 70k range, getting in the region of support. Second, the last normal years before the Fed’s gross market distortions starting in early 2013 were 2009 to 2012. During that secular span, the total gold-futures shorts held by American speculators averaged 65.4k contracts. Perfect for average covering!
So seeing this latest third-highest speculator gold-futures shorting spike on record yielding to average short covering of 80.2k contracts in 13 CoT weeks isn’t a stretch at all. And that easily has the potential to drive an average short-covering gold rally of 14.1% over 9 weeks. Measuring from gold’s recent mid-March low, a successful major retest of its deep early-November-2014 lows, this implies $1311 gold.
But that target is likely too conservative. In the past, speculator short-covering frenzies have pushed gold high enough to ignite new long-side buying by speculators and investors alike. If this next short-covering gold rally coincides with the lofty US stock markets and/or parabolic US dollar finally rolling over, there will be a big resurgence in gold investment demand way beyond speculator short covering.
Only time will tell exactly when the stock markets and US dollar inevitably reverse, but the current first-quarter earnings season is a risky time. Overall US corporate earnings are actually forecast to shrink year-over-year for the first time since soon after 2008’s stock panic! That would make these already super-overvalued stock markets look even more expensive, likely triggering long-overdue major selling.
In that environment, a rare alternative investment like gold that moves contrary to the stock markets will be in high demand again. And speculators and investors alike today have forgotten just what gold looks like in normal times. This final chart zooms out to the past 7 years or so, showing how anomalously low the gold price has been and how anomalously high the speculators’ gold-futures short positions remain.

With the Fed’s gross financial-market distortions, there is nothing at all normal about 2013, 2014, or early 2015. With the Fed done with new QE3 bond buying and threatening to start winding down its zero-interest-rate policy this year, markets are finally going to start mean reverting back to normal. And for gold, that means much-higher price levels partially driven by speculators covering shorts and adding longs.
Despite all the extreme bearishness, gold has actually been extraordinarily resilient in recent years given the dire circumstances. Between its initial June 2013 low and its latest March 2015 one, gold merely slumped 4.2%. Yet over that same span, the flagship S&P 500 stock index and US Dollar Index blasted higher by 28.6% and 20.2% respectively! Enough latent investment demand still existed to stabilize gold.
That is going to explode when the stock markets and US dollar mean revert lower, portending far-higher gold prices in the coming years. The initial spark for this mighty mean-reversion upleg will likely be the American futures speculators covering their shorts. Buying begets buying, so the longer and higher gold rallies to convince investors its uptrend is sustainable, the more of them will return and amplify gold’s gains.
Investors and speculators can certainly play this long-overdue normalization in gold price levels with the physical metal itself or gold ETFs like GLD. But those will merely pace gold’s gains at best. Investors and speculators who want to leverage those gains should look to the left-for-dead gold stocks. No sector in all the stock markets is cheaper and more despised, and no sector has greater upside potential going forward.
The bottom line is American futures speculators have dominated gold action in recent years thanks to the Fed’s wild market distortions scaring away investors. In particular the gold price has a nearly-perfect strong inverse correlation with speculators’ total gold-futures shorts. And in recent weeks, these just surged to what’s very likely their third-highest spike peak in history. That’s a very bullish omen for gold.
Big gold-futures short covering naturally follows extreme shorting, which catapults gold higher. Thanks to the incredible leverage inherent in gold futures, speculators betting against gold can’t afford to be wrong for long. So they rush to buy to cover, a process which is already underway and feeds on itself. Gold easily has $1300+ potential in the coming months, and much higher if the stock markets roll over on weak Q1 earnings.
For weeks I have been telling subscribers that I have been waiting for a bullish reversal on volume to enter the precious metals market. That time may have come on March 18th when I sent out a report to my premium subscribers that gold turned bullish as The Fed was much more cautious about raising interest rates than the market expected due to the weakening of the overall global economy. This is the chart I sent them indicating gold was due for a major bounce and strong follow through accumulation.
Click here for reference chart.
Gold bounced off November lows on good volume on March 18th. Since then we have witnessed strong accumulation days signaling follow through. The US Dollar may have recently topped with heavy duty selling.
This may have been a classic double bottom in gold as investors realize that the Fed may not move quickly to raise rates as the overall economy is weak and unemployment remains high.
Oil is in a downtrend crashing to the low 40′s and copper prices are near multiyear lows but that may change soon as well. I expect a major relief rally in commodities as the majority of investors who went to cash expecting a commodity crash on higher interest rates will have to panic back in as they realize that the exact opposite may occur.
Precious metals and commodities could be forming a major bottom as the Central Banks will be forced to keep the printing press churning devaluing the US dollar to keep pace with the moribund Euro and Yen. The global economy is under pressure according to these metals and most fiat currencies will continue to decline.
A highly valued US dollar and stock market is not a reflection of the underlying fundamentals and an economic recovery. Large cap S&P500 companies are soaring to new highs on the back of higher profit margins due to cutbacks and layoffs. The Fed continues to point to weaker economic data most notably from the shell shocked energy sector which has been a big driver of the recovery up until this point. This is suggesting that rate increases may be much farther off than most expected.
Gold is in the midst of a major rally, which may turn into a major trend change where capital flows from overvalued US stocks, dollars and bonds into commodities, precious metals and energy. Now it is time to look at the high quality junior gold miners. I like to see serious up-trends trading above its 50 and 200 day moving average.
These are some of my junior gold stocks that I own and investors are taking seriously right now as they could outperform the Junior Gold Miner ETF (GDXJ) in the 2nd Qtr . They are also sponsors on my website.
1)Many junior miners are trading with no cash and for literally pennies of a penny on the dollar. This junior in Nevada is cash rich with 3 open pit mines and a state of the art, fully permitted and constructed heap leach processing facility with a huge capacity. The plant could process ore from new high grade discoveries which the company is currently finding. They have been hitting some exciting drill results recently. The recent permitting, drill results and potential uplisting to a larger exchange could be a major catalyst for this company in 2015. I first highlighted this company when it was trading at all time lows, however, now it is trading above the 50 day moving average which has already crossed the 200 day moving average. Its a very bullish chart.
2)One junior gold miner that I have been very bullish on for many months is outperforming the GDXJ benchmark by a wide margin and is demonstrating incredible relative strength. It may confirm my prediction that this is one of the premier junior gold mining companies with takeout target potential. They just announced an updated resource which showed a major increase in the indicated category. The stock is trading above its 50 and 200 day which has already made a golden crossover. A breakout could be imminent as they are aggressively exploring one of the premier Quebec gold properties.
3)Production could begin in 2016 for this permitted junior gold miner in Colombia and dividends could come quickly as cash costs lead the industry below $600 an ounce with a high IRR of 52%. They just finished the debt financing and a $65 million construction financing. As soon as the equity capital is raised and as gold turns higher this junior could lead the pack higher. It already has been one of the top performers making the exclusive TSX Venture 50. Don’t let Colombia scare you! It is the longest democracy in South America, the closest ally of the US in South America, has an established rule of law and have never expropriated mines before in its histroy. In addition, the Antioquia District would love to see the economic benefits which a mine brings including high paying jobs and increased taxes.
4)This junior just put out a maiden 43-101 gold resource in Nevada which was mostly ignored by the market and unfortunately the stock is lagging. I am not giving up and either is one of the insiders Mike Stark who continues to be buying the stock in the open market. Management is encouraged and believes they are at least on par with higher valued peers in the neighborhood. The company is finding about 1,000 ounces of gold per hole drilled. In addition, the mineralization is open in all directions at three separate resource areas.
5)This junior gold miner has been busy exploring its Nevada Project for a few years now. They have been targeting the high grade Yellowjacket Zone. They have attracted some of the smartest gold funds to invest in this project such as Tocqueville and Van Eck Funds. They recently raised money at higher prices. Its a great opportunity when one can buy at a discount to some of the top US gold funds such as Toqueville who have the top technical teams in the business. This junior gold miner has made new high grade discoveries which is currently being incorporated into an update resource estimate which could be exciting.
6)Although this stock is lagging due to the correction in gold it deserves to be mentioned to the investors looking for leverage as they own one of the largest gold resources in the world right in mining friendly Alaska. The asset needs higher gold prices however in a recent interview, Toqueville Gold Management, one of the most respected precious metals funds in the world identified this company as a real contrarian play and stated, “When people talk about five-or tenbaggers, this is a name that should come to mind. But it takes time.”
Disclosure: I own all the companies mentioned and they are all website sponsors. This is not a recommendation to buy or sell securities. I am not a registered financial adviser. Conflicts of interest apply as I would benefit if these stocks move higher. Please do your own due diligence.
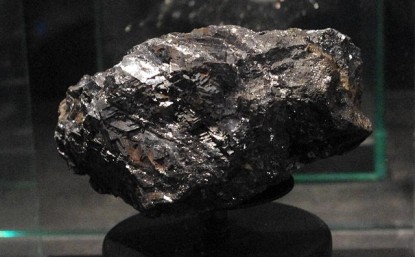
The Spaniards of centuries past controlled the world’s elite maritime fleet. And this fleet’s colonization of the Americas is well-documented. The Spanish Crown would have told you their primary mission was to convert the indigenous people to Catholicism. But in reality it was trade and a craving for all things exotic that ultimately supported this campaign.
And perhaps the one thing that the Spaniards couldn’t get enough of was silver. In Mexico and Peru in particular they found hoards of this shiny-white metal. And via both conquest and discovery they quickly gained control of the world’s silver trade.
Though Spain no longer controls the trade today, Mexico and Peru are still atop the silver rankings, collectively responsible for about one-third of the world’s mine production. And this allows for fortunes to be made by the mining companies on the ground in these two countries. In Spanish the word fortune is translated as fortuna. And Fortuna Silver Mines is poised to live up to its name as one of Latin America’s premier primary silver producers.
Fortuna was founded in 2005 by CEO Jorge Ganoza. Ganoza is a geological engineer by training, but more importantly he’s a fourth-generation Peruvian mine-builder. With this kind of pedigree, not many people understand Peru’s geology better. So naturally Ganoza’s first major play was in his home country.
With silver prices on the rise Ganoza and team sought an advanced-stage project that could quickly be brought into production. And what better project than one of Peru’s finest historic silver mines, the Caylloma mine located high in the Andes Mountains of southern Peru.
Caylloma’s namesake district had seen mining since the times of the Inca Empire over 500 years ago. And most of the 250m+ ounces mined there have come from the formal Caylloma mine. This underground operation pulled from a rich intermediate-sulfidation epithermal deposit, and had made a lot of money for its owners over the years. But when Fortuna took over it had recently been placed on care-and-maintenance, essentially left for dead.
Ganoza and team’s due diligence obviously saw great potential in reviving Caylloma. And a big factor would be Fortuna’s unbiased approach to its polymetallic veins. Previous owner Hochschild Mining was really only interested in Caylloma’s silver-rich veins, and thus ignored the veins that had higher concentrations of gold and base metals in addition to silver.
Fortuna was all too happy to accept what Caylloma had to offer though. Not only did it see potential in continuing to mine and grow the resources in the silver-rich area, it would develop the other polymetallic veins deemed to have positive economics.
Fortuna’s mine-revival plan included drilling in the highest-prospective areas to prove up resources, as well as mill upgrades and enhancements. And in less than a year it was able to resume production. Fortuna has since transformed Caylloma into a long-life low-cost mine that has produced over 13m ounces of silver since 2007.
And this mine will be producing for many more years to come with a silver resource base that includes 36m ounces per the latest estimate (including 13m ounces of 2P reserves). Caylloma is currently producing at a consistent rate of just over 2m ounces per year. And with strong byproducts of zinc, lead, and gold, its all-in sustaining costs are under $13/ounce.
For its Caylloma encore, Fortuna Silver Mines ventured up north into Mexico. And its expert exploration team found a fascinating project in the historic Taviche mining district in central Oaxaca. The San Jose project had seen intermittent small-scale mining since the mid-1800s. And what piqued Fortuna’s interest was not only the past mining success, but positive exploration results from a junior miner that was already on the scene.
This junior had outlined a small high-grade resource. But more importantly, exploration showed that only a small portion of San Jose’s low-sulfidation epithermal vein system had been exploited. Fortuna ended up acquiring said junior, and it proceeded to aggressively drill its exciting new silver/gold deposit. The assays delivered one bonanza-grade intersect after another, and within a few years Fortuna completed a prefeasibility study that showed the potential for smashing economics.
With a price tag of only $55m, Fortuna needed no more convincing to move forward with mine development. And in 2011 San Jose poured its first silver following a methodical on-time on-budget build. Mining occurs from the underground via ramp access. And following a 2013 expansion that doubled capacity at the flotation mill (2.0k tonnes per day), production now yields about 4.3m ounces of silver and 33k ounces of gold annually.
This expansion was supported by a very strong resource base. And thanks to another recent jolt to this project’s inventory, Fortuna already has its sights on another expansion. This latest expansion will increase mill capacity by 50%, and it’ll be fed by the exciting Trinidad North zone.
Fortuna made the recent Trinidad North discovery down-dip and to the north of San Jose’s main Trinidad zone. TN’s system of veins, stockworks, and hydrothermal breccias were found to be very wide and of much higher grade than the rest of the deposit. And after extensive drilling TN added 50m ounces of silver and 320k ounces of gold, bringing San Jose’s total to 90m/644k ounces respectively.
The expansion to 3.0k tpd is expected to cost approximately $30m. And Fortuna is targeting mid-2016 for its completion. Once at full capacity San Jose will produce in the neighborhood of 7.5m ounces of silver and 54k ounces of gold per year, making it one of Mexico’s largest primary silver mines.
San Jose is also a low-cost producer that ought to thrive even in this lower-silver-price environment. Its cash operating costs are typically among the lowest in the industry at under $4/ounce after the gold credit. And although its 2015 all-in sustaining costs will be on the high side at $16/ounce, greatly inflated by a $6/ounce non-recurring capital investment to build a dry-stack tailings disposal facility, in general they’ll be in the lower quartile of industry average (sub-$9/ounce projected after the expansion).
Overall Fortuna’s spectacular Peruvian and Mexican assets make this company quite attractive to investors. And they also fancy its financial standing, with one of the strongest balance sheets in its peer group. As of its latest filing, Fortuna had no debt and a working-capital position of $82m (including $77m in cash). And with this capital, sustainable free-cash-flow generation, and a $60m credit facility, it’ll easily be able to self-fund the dry-stack tailings and expansion projects.
Given Fortuna’s all-around fundamental and financial strength, investors should be confident that its stock will be among the sector’s best performers when silver runs higher. Even over the last few years as FSM has suffered with its sector, it didn’t let investors forget what it was capable of when the metal rallied.

This chart looks very similar to most precious-metals mining stocks over the last 4+ years, ugly. Since silver’s 2011 high, it has suffered a brutal cyclical-bear market. And naturally the mining companies at the mercy of this metal’s prices have suffered in sympathy. Silver, in red, is still hovering around bear lows, $30 or so away from its high. And FSM, in blue, is nowhere near its 2012 high.
Despite the carnage, this chart does offer some nuggets for investors to chew on as they await silver’s all-but-certain mean reversion much higher. Amidst this bear the metal has had 5 meaningful uplegs. And FSM’s response to these uplegs provides a preview of what’s to come once silver really gets some legs.
When silver does run higher it’s natural to expect positive leverage for the mining stocks given their inherent risks. And as you can see, FSM has indeed provided great leverage to its underlying metal.
Measured by leverage to silver, the first upleg in early 2012 was the most underwhelming for FSM. It wasn’t a huge leverage upleg for the sector in general as investors coped with the year-long consolidation grind off the highs. And while 44% is impressive, it only leveraged silver’s gain by 1.2x.
Upleg #2 later on in 2012 was much better for FSM. It powered 80% higher over only about three short months, outpacing silver’s gain by 2.4x. The next upleg also delivered excellent gains, to the tune of 64% over which time silver gained 33%. Interestingly FSM started recovering well before the metal amidst 2013’s bloodbath. So the gain from its Q2 low to upleg #3 high was actually even better.
FSM’s gains over these first three uplegs were indeed great compared to silver. But they’re even more impressive when compared to those of silver’s driver, gold. In uplegs #1, #2, and #3 gold gained 15%, 15%, and 18% respectively. FSM thus leveraged gold 2.9x, 5.3x, and 3.6x. This is spectacular positive leverage that ought to get any investor excited!
Silver’s latest two uplegs rounding the corners of 2013/2014 and 2014/2015 didn’t positively leverage gold like the first three. But this didn’t stop FSM from performing exceptionally well. In upleg #4 FSM soared 83% higher compared to silver’s 14% gain (awesome 5.9x leverage). And in upleg #5 it blasted 55% higher, over which time silver gained 19% (2.9x leverage).
In all it’s apparent that FSM is spring-loaded and ready to pop any time silver moves higher. And as you can see, this stock has gathered some inspiring momentum over the last 1.5 years. While silver has trended lower since its 2013 low, FSM has actually trended higher. This upward momentum has defied the underlying metal, exhibiting impressive relative strength in a still-weak precious-metals market.
While overall this chart is still ugly, it speaks of good things to come from FSM once silver starts to run higher. And FSM won’t be the only silver stock charging higher upon silver’s next upleg. Though this industry has experienced extreme carnage, an elite group of silver miners are still well-positioned to thrive.
The bottom line is silver fortunes are still to be made in two of the top silver-producing countries in the world. The Spaniards were the ones to put Mexico and Peru on the silver map. And generations since have carried on the tradition of major discovery and development. And Fortuna Silver Mines is finding its fortunes in some of these countries’ finest mines.
Both of Fortuna’s mines are long-life low-cost producers. And an expansion at its flagship Mexican mine is poised to boost FSM to major-producer status. This stock has a great history of positively leveraging its underlying metal. And it ought to continue to be an investor favorite upon silver’s overdue breakout.
The following interview of Ucore Rare Metals’ (UCU.V) & (UURAF) Jim McKenzie, President, CEO & Chairman was conducted by phone & by email over the course of several days ending March 31st. The opinions and facts contained within this article/interview are entirely that of Ucore’s senior management. The management team is excited about recent developments that they feel are worthy of attention. Please continue reading to find out more.
Disclosure: Please see applicable disclosures here.
On March 2nd, Ucore (UCU.V) & (UURAF) announced it had successfully separated individual rare earths at a high purity level. Many were excited, some were skeptical. Can you explain the skepticism?
Any time a new and potentially disruptive technology is introduced, the initial reaction is often denial. Separating the lanthanide suite of metals, without the use of expensive and environmentally invasive Solvent Extraction methodologies, is the holy grail of the REE sector. The MRT technology has a long pedigree in the metals processing industry. As pundits and investors in the REE space come to understand the technology and its attributes they will accept it very quickly. In hindsight, MRT’s applicability in the REE sector will seem like an obvious solution. Readers should understand that the MRT technology is already deployed commercially in 40 locations globally, just not for the purpose of separating rare earths….yet.
Your deposit is in Alaska, do you expect to be able mine year round? Will infrastructure and manpower be a significant challenge?
Our location at the southern most tip of the Alaskan panhandle has a temperate climate. The weather is in the same system as Vancouver with lots of rain and little snow. The Bokan Mountain project and Kendrick Bay port will operate year round. Key to our story is that our deposit is on a previously mined property. Thus, a road network and other infrastructure is already in place. Our site is less than 1 km from a deep water port facility.
Please describe, in layman’s terms, how the MRT process works and why Ucore thinks it could be a game-changer?
The secret sauce in the MRT process is the high selectivity of the IBC designed ligands. The ‘Superligs’ (IBC engineered molecule) are designed to use chemical attributes of the target elements to ensure the ‘selection and capture’ process is accurate and complete. The process by definition puts the complexity of the separation process into the upfront engineering and design of the ligand. Because the ligand works so well, the system does not need heat or pressure, making it incredibly fast and clean. The pregnant leach solution “PLS” is run through columns that contain Superligs. The Superligs are ligands tethered to solid beads that form a filter in the column. As the PLS is flowed through the column, the target element is trapped and held by the Superlig. Importantly, only the target element is trapped, giving us +99% purity and all of the target element is captured, giving us +99% recovery.
The chemicals used in the system from start to finish are innocuous. There is usually a trade off between % purity and % recovery in any separation process. However, the unprecedented selectivity factor resident in IBC’s technology has delivered performance metrics previously unavailable in the REE sector. The nature of the process, fast, small, clean and accurate contributes directly to the technology’s cost effectiveness. Think of it this way, if one had a barrel of M&M’s, using the MRT technology would be like capturing (or recovering) virtually all of a single color M&M. Amazingly, it would pull out 99+ / 100 of that colored M&M. By comparison, solvent extraction, like that used in China, has closer to an 85% recovery. The difference between 85% and 99%+ recovery is staggering as our superior recovery is a pure margin boost.
I read that Ucore owns the global rights for MRT in metals recycling & tailings processing. Could you generate cash flow before the Bokan Mountain project begins?
That is correct and there is tremendous interest from mining and processing parties globally. We are currently focused on progressing the Bokan project but we have capacity to do some development work in collaboration with the owners of other compelling projects. Largely ignored by the investment community is that we will have the ability to remediate and even create new revenue streams from tailings ponds and waste dumps. Make no mistake, we remain laser focused on Bokan, but we feel that use of MRT technology in other applications could result in significant nearer-term cash flow. Ucore shareholders could benefit from spin-off opportunities.
How does Ucore’s Bokan Mountain project compare in size and importance to existing and emerging global peers?
Bokan Mountain is very much a ‘right-sized’ project. We have drilled enough of a resource to give us a compelling 43% IRR with an 11-year mine life according to our PEA. The products that we will produce will supply the critical requirements of American industry. There is tremendous ‘blue-sky potential’ to grow our resource but our engineers believe that our cash is better spent on advancing our project to production.

Which key Rare Earth Elements will Ucore produce? Which will be the greatest contributors to project economics?
We feel our products are exactly what the U.S. market requires, 90% of our revenue will come from CREO’s. CREO’s are a term coined by Jack Lifton for Critical Rare Earth Oxides, Dysprosium, Terbium, Yttrium and Neodymium.
Can you explain the US $145M that Ucore is slated to receive? Who it is from and what form it will take?
We are confident we can overcome the most daunting hurdle, financing our CAPEX. With 70% already covered by the State of Alaska through the Alaska Industrial Development & Export Authority “AIDEA” we have tremendous interest from other financiers to partner with Ucore and the State to expand the risk profile of the proposed bond issue to cover the full CAPEX requirement of $221M. Another advantage is the method in which the loan will be deployed. The State issues a bond and uses the proceeds to build our surface infrastructure. AIDEA then leases the infrastructure back to Ucore. This turns the $145 M expense in year -1, and 0 into an operating expense spread over up to twenty years. This is a huge asset to the feasibility of the project. The payback period will be shortened and the IRR will increase dramatically.
What are some of the most important uses of your main Rare Earths?
Quite simply our ore basket has been referred to as a virtual permanent magnet recipe. The demand for permanent magnets is forecasted to grow by 8-11% CAGR until 2020. This will create a serious supply deficit as the Chinese Heavy Rare Earth Elements “HREE” resources are depleted. We are already seeing signs of Chinese ‘Resource Nationalism’ where end users in China are getting access to HREEs at the expense of Rest of World (ROW) customers. Permanent magnets are largely responsible for miniaturization. They are often referred to as ‘The Magic Metals’ because of their unique properties including incredible strength to weight ratios. They are very important in all high tech, green tech, and military systems industries.. Specific products are EV/HEV automobiles, wind turbines, smartphones, missile systems, drones….
Where do you expect to ship your products? Who are the logical end-users?
Direct shipping will be to metal, alloy or magnet manufacturers unless of course those production systems come to us. Alaska is very interested in creating industrial clusters where industry verticals can be developed. There is developing technology in the U.S. for metal making and the manufacture of permanent magnets that could well complete a secure domestic supply of permanent magnets for American industry.
What are the catalysts to watch for this year?
We have a number of key catalysts this year. First, a resource upgrade with potential expansion. Next we have our Pilot Plant development. The Pilot Plant will demonstrate to strategic investors, skeptics and shareholders alike that the MRT technology scales up from lab to Pilot scale as expected. Then, a Plan of Operations filing, “POO” filed shortly kicks off the final permitting process. That should take 12-18 months. By the first half of 2016, a Feasibility Statement should be completed. Finally, winning MRT processing clients. Contracts could come later this year, or in 2016.
Will you need to raise additional capital this year?
We have a multi-million dollar treasury and have reduced our cash burn dramatically now that our major technical projects have been completed. Part of our ongoing function is to effectively manage our capitalization on the road to production. As of September 30th, 2014, we had 4.7mm in cash. We are comfortable for the time being, but if the need arises, we might have to issue more shares, hopefully at a higher stock price.
Where does Ucore stand regarding partnerships, JVs, strategic investors, off-take agreements, etc?
We have a number of JV opportunities under development. The only one I can discuss is with IBC as previously mentioned. We have been in ongoing off-take discussions with major American, European and Japanese parties over the last two years. These discussions are protected under non-disclosure agreements. We are well supported by our shareholders including Canadian and European resource funds and key local business leaders in South East Alaska. Ucore’s management team and Board are also significantly invested.
Please comment on the current prices of Ucore’s Rare Earths, where prices have been and where they might be headed.
As we predicted, there’s increased pressure on HREE pricing in China. Huge stockpiles were created during the crisis in 2010-12. These stockpiles are starting to be depleted. With growing demand for permanent magnets in concert with declining supply of HREEs from China, we have seen a steady increase in Magnet material prices since November, 2014. As GDP growth in the U.S. and China recovers we expect these pricing metrics to continue to improve.
What is your view on China’s role in the Rare Earths sector today? How do you see China’s evolving over time?
China is working hard to get their Rare Earths industry under control. The 13th, 5 year economic plan begins in 2016. A pillar of this plan will be to address environmental issues. This will require the implementation of improved mining and processing techniques as well as significant work on remediation. This will increase the overall production costs of REE operations. China was early in recognizing the importance of REE’s in the modern world. They have a distinct advantage in production and processing because of their experience. They will continue to dominate the market and attract downstream producers due to their resource advantage. On the HREE side however, the Chinese recognize that they will require more magnet input materials than they can possibly produce. In my view, China would already be a net importer of HREE except there is no significant production outside the country. We are starting to see Chinese investment in HREE projects outside of China such as in Northern Minerals, in Australia. That took the only HREE resource, at a similar development stage to Ucore, off the market.
Are there any misconceptions about Ucore that you would like to address?
We have always had our naysayers but we continue to deliver. We have the right product, in the right place and it looks more and more like our timing is right as well. The quality of our ore and the tremendous logistical advantages of our jurisdiction are enhanced by the financial support from the State of Alaska. We cannot overstate the importance of the support we receive from Alaska and their funding arm AIDEA. Our new partnership with IBC giving us access to MRT will unlock tremendous value in the Bokan project. Not only will it lower our costs but it will enable us to sell pure oxides that have a 40% revenue uplift compared to our competitors that contemplate selling a ‘mixed mineral concentrate.’ This technology will also enable us to consider adding scandium, niobium, tantalum, and halfnium to our value basket.
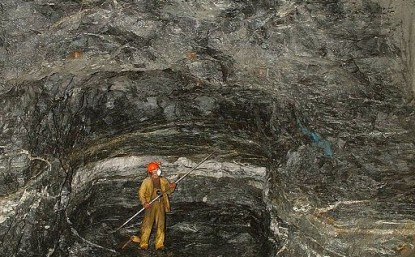
Via Penny Mining Stocks, I have been buying Midway Gold (MDW.T).
*This is not investment advice. This article is my own thoughts and I could easily be wrong. Please do your own due diligence and talk with a licensed financial advisor before making any investment decision. The author of this article owns Midway stock purchased in March in the open market and is therefore biased. All facts are to be verified by the reader.
I have bought Midway Gold stock twice in the last 10 trading days at CA $0.45 and CA $0.$415. Midway stock has had a tremendous sell off in the last couple months and is currently trading at a 52 week low of $0.375 (Friday March 28th close). The stock was as high as 93 cents on March 3rd. I believe the stock offers a terrific risk/reward scenario at these levels. Midway will be Nevada’s next gold producer (any day now). The stock does have some issues but I will explain those as well.

Here is why:
1. Low volume – The sell off has been on extremely low volume with only 2.98 million shares traded since March 3rd. 31% of that volume was done on Friday with 989,000 shares trading hands. Midway stock has high institutional ownership with 13 funds holding ~44% of the stock. One or more of these funds could possibly be unloading shares for a variety of reasons that could include MDW stock does not meet their minimum criteria (mandate) any more (share price to low or market cap below certain levels). The end of the first quarter is Tuesday so funds could also be rebalancing (moving positions) around before quarter end.
2. Production (days away) – Midway announced on Friday testing of the refinery and a gold pour of 100 ounces ($120,000 at $1200 gold). I am expecting an announcement early this week as the company has announced that the first commercial scale production is expected for Monday, March 30th. History shows according to US Global research shows that when a company begins production (cashflow) the share price responds positively. See below chart.

3. Additional Projects – Midway has a plan to use future cash flow from Pan to bring a pipeline of projects in to production including Gold Rock and Spring Valley (JV with Barrick Gold). These are excellent projects in their own right and investors can read more at the Midway Gold website.
Issues
A couple problems that may be causing of some of the sell off in the stock.
- Midway due to delays in reaching production has experienced an estimated US $5 million dollar shortfall. I believe although this is an issue to be concerned about it will work itself out soon. The lender would be crazy at this point and so close to production not to extend more money. Lenders tend to be sharks though and hopefully production can start pouring some gold and Midway can meet covenants.
- Midway has drawn $47.5-million (U.S.) of the $53-million (U.S.) project finance facility held with Commonwealth Bank of Australia (CBA). The company is required to satisfy certain covenants, tests and obligations related to the facility, including schedule and other contingencies, in order to continue to draw amounts available under the facility and to remain in compliance with its terms. Based on current projections, a two-week delay from an internal targeted mid-March pour will likely now result in a working capital shortfall of about $5-million (U.S.). In addition, Midway is working through the terms of a credit amendment with the lender. As a contingency, these terms may require the company to finance project working capital for a scenario under which first production is assumed to be May 1, 2015, and potentially defer project distributions that could increase corporate working capital needs from prior estimates. The company’s performance in the coming weeks will affect the amount of these contingencies, and Midway is evaluating alternatives to finance working capital needs.
Note: Midway Gold’s new CEO is William (Bill) Zisch who recently was VP one of the largest gold streaming companies in the world (Royal Gold). As VP of operations for Royal Gold Mr. Zisch will have plenty of experience and contacts with financing and funding deals so I expect this to be very beneficial with the current situation Midway is in.
2) Ore grades – This is also a worry for investors. It is too early to say whether or not this will be an ongoing issue and Midway has been very quiet on details.
- Early sampling of ore grades have generally been below modelled grades, with tonnage variances being both positive and negative. As is appropriate during the start-up of a mine when observing initial variances averaging below expectations, the company has engaged an independent engineering firm to review modelling, sampling and assaying practices to gain an informed understanding of tonnage and grade variances to date. Sustained gold production from the heap will provide an additional data point from which to complete an assessment of initial model performance, and will provide the first estimate of actual gold recoveries.
Initially this was a big concern of mine until I did some more research on the project economics.

These economics are some of the best of any current development project and gives Midway a little breathing room if grades are lower than expected. The following chart provided by Midas Gold shows the Pan project as a low cost producer.

Obviously if the grade is lower this will have a big effect on the cash cost but at this point we do not have enough info from Midway to make an educated guess on how much. I did pull the following sensitivity analysis chart from the 2011 Feasibility Study to have a look at though.

At these prices I believe the opportunity is there for investors to buy Midway stock. I have purchased shares and am therefore I am biased. I easily could be wrong but I have a hard time seeing Midway at these levels 6 months from now unless something crazy happens. That being said quite often something crazy does happen with mining stocks but I am comfortable taking that risk in this situation.
Article written by James Fraser, Mining Analyst (ccd).
If you would like to receive our free newsletter via email, simply enter your email address below & click subscribe.
 Follow us on Twitter
 Become our facebook fan
CONNECT WITH US
Tweets
Tweet with hash tag #miningfeeds or @miningfeeds and your tweets will be displayed across this site.
MOST ACTIVE MINING STOCKS
Daily Gainers
 CMC Metals Ltd. CMC Metals Ltd. |
CMB.V | +900.00% |
 Eden Energy Ltd Eden Energy Ltd |
EDE.AX | +200.00% |
| GoviEx Uranium Inc. |
GXU.V | +42.86% |
| Eagle Nickel Ltd. |
ENL.AX | +41.67% |
| Citigold Corp. Limited |
CTO.AX | +33.33% |
| Mount Burgess Mining NL |
MTB.AX | +33.33% |
| Exalt Resources Limited |
ERD.AX | +31.94% |
| Casa Minerals Inc. |
CASA.V | +30.00% |
| Cariboo Rose Resources Ltd |
CRB.V | +28.57% |
| Belmont Resources Inc. |
BEA.V | +28.57% |


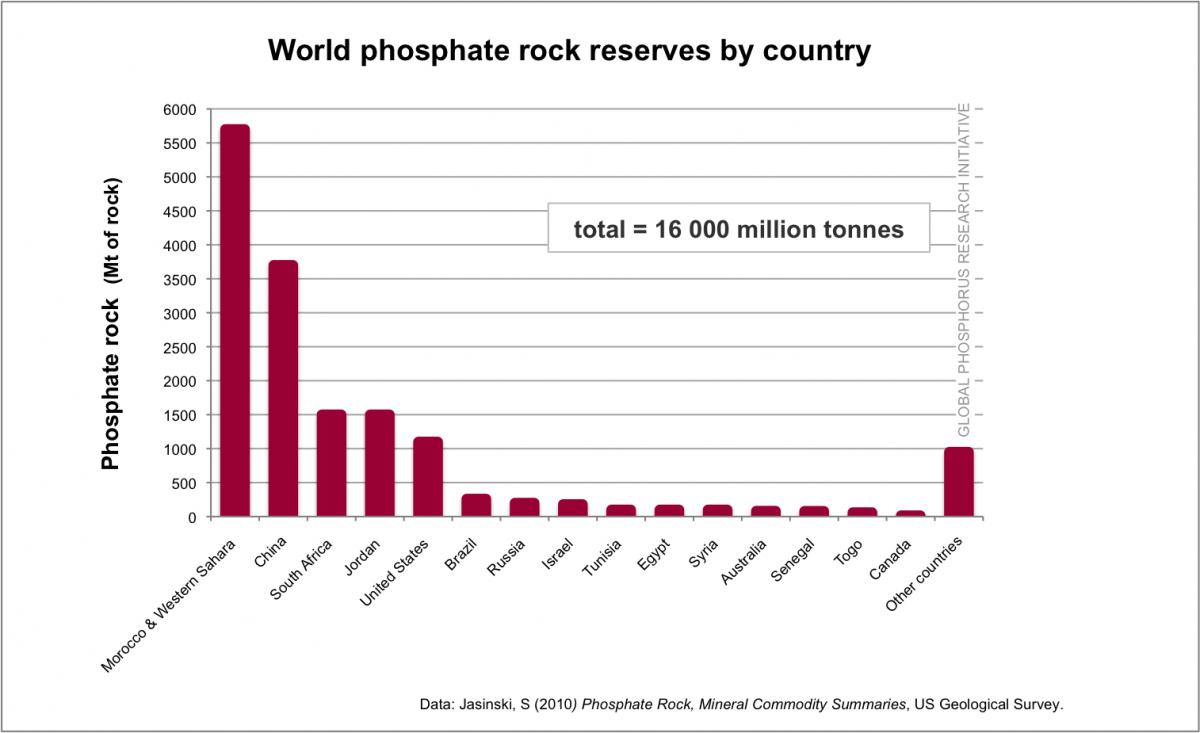
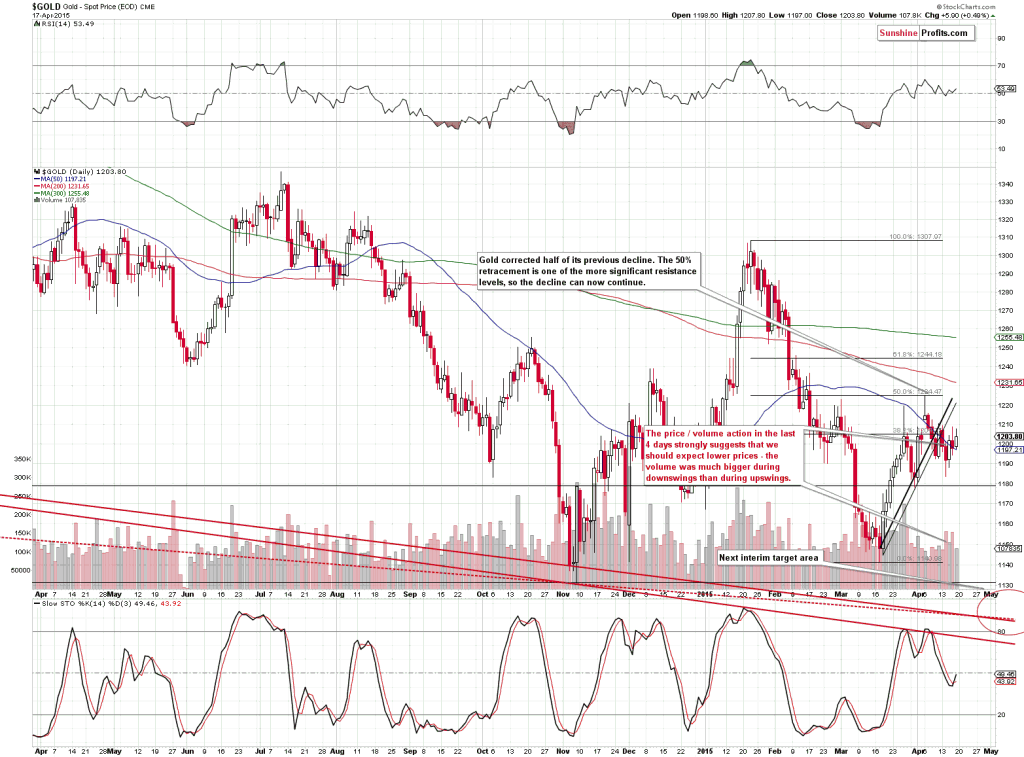
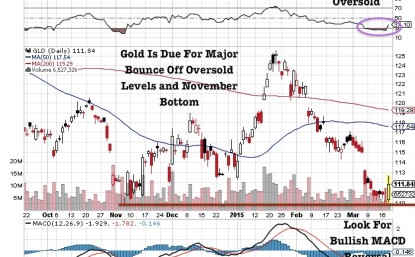