

The following interview was conducted on May 15th-18th via phone and email by Peter Epstein, CFA, MBA. The opinions expressed herein are entirely those of the three named individuals. Please see a direct link to applicable disclosures and two excellent links regarding Ucore & MRT at the bottom of the interview. Ucore Rare Metals is a speculative, small cap company that may not be suitable for all investors. Readers should conduct their own due diligence, including visiting the company’s website and consulting with their own investment advisors.
I would like to thank Steve & Reed Izatt, PHD of IBC Advanced Technologies and Mark McDonald of Ucore Rare Metals (UCU.V) (UURAF) for taking a considerable amount of time answering follow up questions I had about Molecular Recognition Technology, “MRT.” I grilled the Izatts about Ucore’s proposed use of MRT because my prior article on Ucore Rare Metals attracted some criticism. Skeptics are to be expected and management, technology partners and independent advisors are available to discuss opposing points of view. Over the decades, “new” technologies in the processing of metals & minerals have been fraught with failures. I believe some of the pushback on MRT might be from painting all new technologies with the same brush.
In doing research on peer REE juniors, several propose the use of their own separation technologies. My view on MRT is that it’s one of several that might come to fruition in coming years. However, MRT appears to stand out in that it could be used for third-party processing or reclamation applications. That would allow Ucore to generate revenue this year or next. Other company’s proposed separation technologies seem to apply solely to their own projects.
My intent in interviewing the Izatts and Mark was to better understand what they believe, (biased as they are) and convey that view so that readers can make their own judgments.
Peter: There’s been both skepticism and supporters of MRT. Have you received more or less skepticism than you expected?
Steve: I think that people have their own agendas. I don’t mean that in a disparaging manner, just that potentially revolutionary technologies always face skeptics. The REE investment space has historically not been populated by people with scientific or engineering backgrounds. It’s easy to say something won’t work. But the discussion should center on chemical and engineering principles. Persons with processing and technical backgrounds have spoken favorably of our technology and its scalability.
We have separated the entire suite of individual rare earths. This offers incontrovertible proof that our MRT process works at lab scale. We have scaled up numerous other projects outside of REEs based on our proprietary SuperLig® products. The proven separation characteristics of MRT, coupled with our actual accomplishments in scaling up similar processes should give investors significant confidence.
Peter: It’s my understanding that the MRT process is more of a physical or mechanical process?
Steve: The MRT process uses selective SuperLig® resins incorporated in columns through which REE-containing, Pregnant Leach Solution(s), “PLS” are pumped. We have designed proprietary SuperLig® products consisting of silica or polymeric beads to which selective chemical ligands are attached. These ligands selectively coordinate (or bind) the metal of interest based on coordination chemistry principles. Unwanted metals pass on to the raffinate. Once bound to the SuperLig®, the targeted metal can be stripped (or eluted) off the column in pure form through contact with dilute acid, which causes the ligand-metal bond to part.
The SuperLig® beads are contained within columns. The PLS is pumped through the columns and the REE are selectively separated, first from the gangue metals such as iron, aluminum, uranium, thorium and then from each other. IBC has been installing similar processes for over 25 years. We’re confident about the scalability of the process and that it will be green and low cost.
Peter: Does anyone have reasonable skepticism about aspects of MRT that you believe have merit?
Steve: The science underlying MRT is sound, evidenced by hundreds of peer-reviewed publications and prestigious awards from the American Chemical Society and others. The 1987 Nobel Prize in Chemistry went to three pioneers in the field of molecular recognition: Pedersen, Lehn and Cram. Dr. Reed M. Izatt and his co-workers at Brigham Young University made key advances in MRT. Dr. Izatt’s team proceeded to establish the thermodynamic properties of selective metal interactions with a wide range of novel macrocyclic ligands, including those involving attachment of the ligand to solid supports or beads.
This ground-breaking work allowed for commercialization of MRT in the metallurgical industry. MRT is supported by world-class science in its development and commercial applications. Both the chemistry and engineering of the MRT processes is well understood. We are very familiar with the key parameters necessary for successful scale-up and commercialization. In the case of the lanthanides, it is critical to first separate the REEs, as a group at high recovery and high purity. This preserves the value of the REEs contained in the PLS, as essentially all of them are recovered, and allows for subsequent simplified separation of the individual REEs at high purity from a solution that does not contain impurity metals.
Reed: The thing that people might not understand is that initial separation of the suite of REEs from the PLS is crucial, otherwise you have metals and materials from the original ore that follow through and must be separated in subsequent steps. If you have already removed the impurity metals, subsequent separation of individual rare earth metals is simplified (fewer steps).
In the cases I’m familiar with, the selectivity and recovery of the REEs from pregnant solutions that other technologies treat come in at far less than 99+%. Some in the low 90%’s. Even then, one still has to deal with an appreciable amount of junk material complicating the separation process. Further separation of individual REEs is greatly simplified once you’ve gotten rid of the deleterious materials. Less selective methods such as solvent extraction, ion exchange or chromatography, strongly bind the target metal and let the other metals flow uninhibited. This is especially true for metals such as REEs that are chemically very similar to each other. This problem is avoided using IBC’s proprietary SuperLig® resins because the ligand is pre-designed to be highly selective for only the target metal so that the target metal remains stuck to the resin until released with an eluent (or stripping agent).
Peter: Without naming any names, how aware are you of other REE separation technologies?
Steve: With our long history in separations chemistry we are, of course, familiar with most of the different technologies currently being evaluated. These technologies can be very effective in specific environments in the broad field of chemical or biological processing. However, in the world of metals processing and separation, where we have focused our careers, we believe that the most important attribute of any technology used for separating metals is selectivity. This is especially true with highly similar groups of metals such as platinum group metals (PGMs) and rare earth elements (REEs). IBC uses multiple chemical parameters to create ligands that are extremely precise. These proprietary ligands, attached to solid supports or beads (SuperLig®) provide the basis for the superior selectivity used in the MRT process.
Our company would not view a purity or recovery number in the 70%, 80% or even 90%+ range as a ‘true separation’. In our world, separation means that one does a complete separation i.e., > 99%. Once you’re at >99% you can increase purity to as many 9’s as you want to meet commercial requirements. The importance of high selectivity can easily be seen by simple math. If a process achieves only 75% separation then it must take the 25% and get 75% of that, this process must then continue for many stages to arrive at a purity of > 99%. In contrast, one of the main advantages of MRT is that it maintains high separation coefficients (binding constants) even at very low concentrations. Thus, high purity can be achieved cost-effectively and quickly.
Peter: With MRT, you guys have put it out there, >99% purity & >99% recoveries….
Steve: Yes, and the purity results obtained by IBC have been validated by an independent laboratory.
Peter: In the case of solvent extraction, one gets 99% purity but only 60% or 70% recovery, is that right?
Steve: Yes, even if it’s more like 70%-80% recovery, recoveries are very low compared to MRT. Although commercial purities are ultimately achieved, hundreds of separation stages are required. This means high cap-ex and op-ex as well as long processing times and the generation of large amounts of waste.
Peter: So, are you saying that you’ve achieved the target purities for potential customers of Bokan REEs?
Mark: We have been testing MRT specifically on our Bokan ore. The goal to prove the process on Bokan ore has been met. Our testing of the MRT separation process has gotten us plus 99% purity, which was the objective. The next step is get the purities needed for specific customers. We’re talking to lots of different customers. We have already produced the full lanthanide suite at + 99% (at lab scale) which would be a very salable purity for all rare earth metals.
Steve: The MRT system can achieve the required purity at lab scale, but it’s wasteful to get purity for purity sake. We believe the best approach is to survey customers and understand their needs. It may be that certain customers can tolerate certain impurities but not others.
Reed: The rare earths are a unique set of elements, some are very valuable to certain customers and others are hardly valuable to any customer. When one separates them one will get a number that are not of much value and one has to worry about what to do with those. Having a process, such as MRT, that’s able to selectively pull out some, but not others, is a very valuable proposition.
There has been quite a bit in the literature about this point, the fact that low-value REEs are being produced and there’s really no market for them and they just pile up. It’s only a few of the REEs that are needed. As Steven points out, different customers will need different REEs at different purities. It’s wise to do as Ucore hopes to do, from a base purity of >99% ask customers what their specs are and tailor-make the separation.
Peter: Say you’ve got 99.9% purity, but a customer wants 99.99%. Does that mean you run it through MRT one more time?
Steve: Yes, the MRT system can easily be engineered to achieve additional separation stages. However, depending on customer requirements, a different type of SuperLig® that selectively extracts the specific impurity can be used as well. This is one of the great advantages of MRT. We have multiple SuperLig® products that can be used in concert, to meet customer requirements.
Peter: If you’re toll milling REEs from around the world, how different is each PLS, and does that require making a lot of changes?
Steve: Remember that the first step in our process is to separate the REEs from the gangue metals. Once the REEs are separated, as a group, we would apply the same SuperLig® products to their individual separation, regardless of the source. Now you’ll probably have different percentages of each individual REE in different feeds, but the MRT system can be engineered to handle varying percentages. Different sizes and numbers of SuperLig® columns can be used, as needed.
Peter: Circling back, is that to say that in other technologies no matter how good they are, recoveries would be less than 99%?
Reed: We assume so. Without the numbers we can’t tell. However, some of the other technologies appear to have low selectivities and weak metal-ligand binding constants or separation factors, suggesting they will have materials, such as iron, aluminum thorium, etc. as impurities, as well as mixing of the rare earth metals. They might not be able to selectively remove those impurity metals and get pure individual rare earth metals without added costs, substantially longer processing times, and generation of appreciable waste.
Peter: Steve and Reed, how much of your time is devoted to the development of MRT for REEs? Is this just one of many projects that you’re working on?
Mark: IBC is in business to make a profit. Because we have such a lucrative opportunity, they’ve been good enough to give us as much capacity as we’ve required. Our assessment is that IBC has all of the laboratory and production capability needed to fully capitalize on the opportunities. The next major priority for us is the pilot plant. We’ve been inundated with opportunities since our early March announcements about the success of MRT at lab scale. Immediate opportunities to use MRT, not only in the rare earth space but in recycling and tailings processing, have been presented.
There’s potential for near term revenue to be generated from MRT. However, our number one priority remains moving ahead on the Bokan HREE project. IBC and Ucore have been able to work very effectively together to this end. We have met with potential customers and are actively discussing opportunities. We’re already under contract with numerous Fortune 500 companies that want to move their separation programs forward inside an ongoing testing phase. So we’re very engaged.
Steve: I would think this fact would be very interesting to investors. Ucore is now, as far as I know, the only junior REE company that can realistically state that it has an additional technology-based revenue model, other than the basic supply of mixed rare earths. What’s more, that revenue model has already been proven up in numerous other mining sub-sectors, from PGM’s to specialty metals. So, Ucore is essentially taking a proven business model, one with a decades-long track record, and transposing it into the rare earth sector. I think this is fantastic because I know how much money a model like that could possibly generate.
Peter: Thank you so much, Steve, Reed and Michael for your time and insightful answers to my questions.
Ucore Rare Metals (ticker UCU.V) (UURAF)- Mr. Epstein had no prior or existing relationship with Ucore Rare Metals before April 10, 2015. For Any article(s) written on EpsteinResearch.com, or posted on other websites, subsequent to 4/10/15, Ucore Rare Metals was/is a sponsor of EpsteinResearch.com on a month-to-month basis. As of the latest updated Terms of Use & Disclosures, and at the time article(s) was/were on EpsteinResearch.com, or posted on other websites, Mr. Epstein owned/owns no shares of Ucore. Investors should consult with their own advisors before making investment decisions. Mr. Epstein is not an investment advisor. The article(s) on this company on EpsteinResearch.com, or posted on other websites, should be viewed in this context. Ucore is highly speculative and not suitable for all investors. A link back to this continually updated disclosure page will be included at bottom of any article(s) that appear(s) on EpsteinResearch.com or posted on other websites.

Gold may be in a bearish slump right now, stuck in the $1,200 USD range. But, without sounding like a gold bug, the precious metal still has plenty to offer for traders. Gold is one of the most stable long-term appreciating assets. Today, gold is trading at roughly $1,204 an ounce. If you take a look at historical prices, ten years ago, in 2005, gold was trading at around $500 an ounce level. If you go back sixty years, the price of gold was at around $35 an ounce. That’s an incredible price appreciation over the past half-century.
That’s of course good news for long-term investors of the metal. Unfortunately, current gold prices prevent many traders from being able to enter the market; after all, capital requirements to begin trading in the gold market can be in excess of $10,000 on the retail side of the market. Many private investors cannot afford this kind of capital requirement.
Binary options are a fairly new financial investment market, and what’s useful to know is that binary options provide a way to invest in gold (as well as other asset classes, like silver, petrol, the forex market, and stock markets) without relying on large capital investments.
Functionally and conceptually, binary options are fairly simple. There are several different types of binary options. However, the most common is the “high-low” binary option, also known as a fixed-return option. A binary option trader will make a purchase based on how he or she believes the market will perform within a given time period. To return to gold, if an investor believes that the price of gold will close for the day at or above, for example, $1,204 an ounce, he or she will buy a call option on that outcome. On the other hand, if an investor believes that gold prices will worsen within a given time period and fall below $1,204 an ounce, he or she will buy a put option on gold.
There are only two possible outcomes in binary option trading (hence, the ‘binary’ description). If the trader’s put or call option ends up agreeing with the market price at the end of the given time period (also known as a strike price), then the trader enjoys a return on his or her investment. If the trader’s purchase does not agree with the market price, then the trader loses his or her investment.
Unlike traditional options, there is no range of payouts based on accuracy of market projections. By the same token, binary option traders do not have to worry about things like spreads, stop losses or erratic intraday volatility. Simply put, if a trader accurately predicts where the market will go (i.e. if it will close either below or above a given price), then he or she enjoys a return on their investment.
As many gold investors know, gold prices began strong this year, rising to $1,300 in January. Since then however, gold prices have frustratingly remained stuck at the $1,200 level. What’s more, a number of analysts (see here and here) are predicting bearish trends in gold before a final bottom is reached and a sustainable recovery begins.
There are several factors making it very difficult for gold to overcome its current bearish trends. First and foremost on investor’s minds is the upcoming decision by the Federal Reserve. When will the Fed raise interest rates? Any increase in interest rates will push investors away from gold. At the most recent Federal Reserve meeting, it was made clear that an interest rate hike is still on the agenda. That should undoubtedly keep gold in firm bear territory. Still other factors are playing their part in keeping gold prices pinned to the $1,200 mark, factors like the ongoing strength of the dollar and the continued strength of the American economy.

With that said, even with a bearish gold market, one that’s now lasted for the greater portion of this year, opportunities for investment in the metal are plentiful. And binary options provide a very realistic way to make a successful investment, even in a non-volatile, bear market.
“The gold market right now provides an ideal environment for binary options trading.” This coming from Deborah Byrley who leads an interactive broker that offers binary trading accounts. “Binary option traders can focus on major indicators in their short-term analysis of the gold market. These indicators are exactly what you encounter when trading on other financial markets.“
Continuing on, “The one exception with binary options is that, due to their simple investment structure, gold investors can enjoy a return on investment, even in a bear market that is experiencing little price movement.”
Last week we wrote that the precious metals complex had not broken out yet and had more work to do before it could attempt a true breakout. The metals had some more upside and so did the shares. However, the poor performance of the shares this past week could warn of a larger reversal.
We thought the gold miners could rally up to resistance at the 400-day moving average. Instead of pushing a bit higher, their rally reversed course at the 200-day moving average. Note the action since last summer. The miners had a strong rally up to the 400-dma and later recovered to both moving averages when they were quite close in January. This recent rally did not reach the 400-dma and that signals weakness.
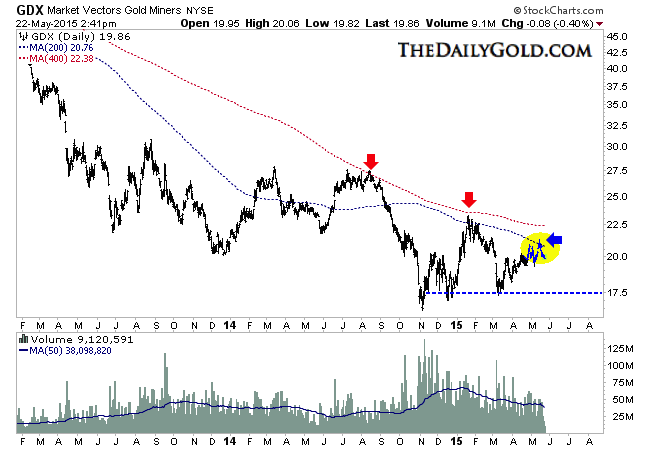
The weakness in the shares is a warning sign for the entire complex and could also be a signal that the metals have not bottomed yet. Over the past eight months Gold and Silver have essentially traded in a tight range (except for several weeks). Gold has spent most of that period between $1150 and $1225 while Silver has spent most of that time between $15.50 and $17.50. The metals’ failure to extend recent strength could signal a move down to the bottom of those ranges and threaten a breakdown.
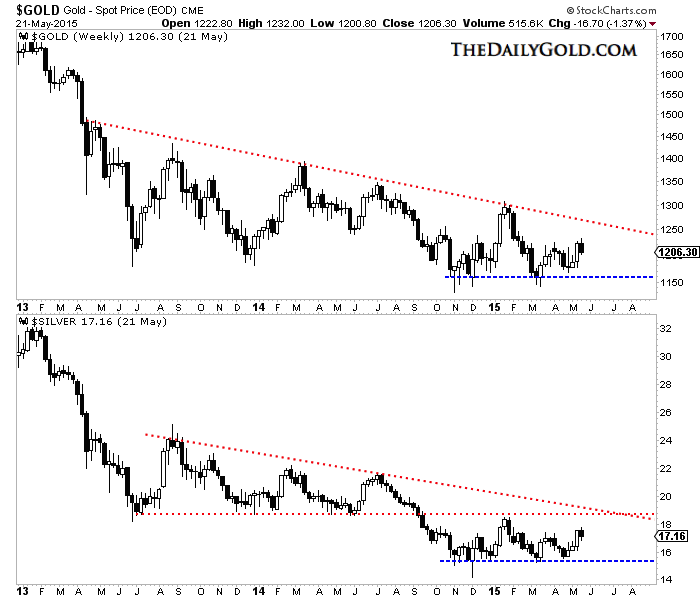
Last week we noted that gold miners would only truly breakout (above their 80-week moving averages) if metals were to surpass their January highs.
I’m skeptical metals will do that on this rebound as their relative performance is weak considering the big drop in the US$. The worst is likely over for the miners but if Gold can’t reach or takeout its January high then the miners are at risk for remaining in the range they have been in for the past eight months. Until something changes, buying support and oversold conditions works better than chasing strength.
GDX has 12% downside to strong support and 17% downside to its daily low. Be patient and use support to your advantage. If metals are heading to new lows then it would likely create one last chance to buy miners at fire sale prices. Consider learning more about our premium service including our current favorite junior miners which we expect to outperform in the second half of 2015.

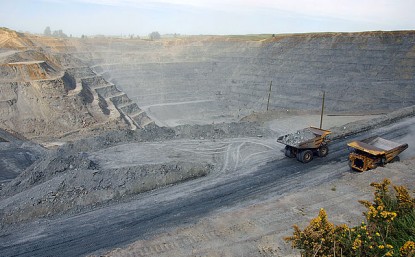
It’s widely known that average copper grades have been falling for decades. The conventional wisdom is that the average grade from producing mines is down from about 1.0% to roughly 0.60%. That trend is likely to persist. Labor, energy, water, legal, local populations, compliance and environmental challenges and costs are up, resulting in the time from discovery to production nearly doubling since the year 2000. This suggests that a number of mid-tier and major base metals players could be looking at acquisitions to offset ongoing depletion. As I hope to demonstrate, Nevada Copper (NCU.TO) (NEVDF)leads the pack in this regard.
An example of what’s going on in the copper space can be found by highlighting Chile’s Escondida mine, operated by BHP. According to reports,
“the project includes construction of a seawater desalination plant and the piping and electrical infrastructure needed to transport water to the mine, 114 miles away and 10,170 feet above sea level.” More astonishing, according to an April, 2015 FT article, “…Chile State-owned Codelco, plans to spend $25bn over the next five years just to maintain current production…”
Time is Approaching for Potential Suitors of Nevada Copper to Step Up
Everyone agrees that Nevada is a safe and attractive jurisdiction. The same can no longer be said about Peru. That country’s rankings have collapsed as chronicled in the 2014 Fraser Institute Mining Index. In 4 categories Nevada ranked on average # 6 out of roughly 125 countries/territories. By contrast, Peru ranked # 33. Why pick on Peru? It was the 4th largest copper producer in 2014. Even as I write, escalating protests against the $1.4 billion Tía María copper mining project in southern Peru is in the news again.
Also in the top 10; China, the DRC, Russia and Zambia. So much for security of supply! Half of the top 10 are in unstable countries (my opinion only). Compare those with others in the top 10, the U.S., Canada, Mexico, Chile and Australia. With this in mind, it may be no surprise that I believe Nevada Copper is reaching a critical stage where a number of acquirers might be circling.
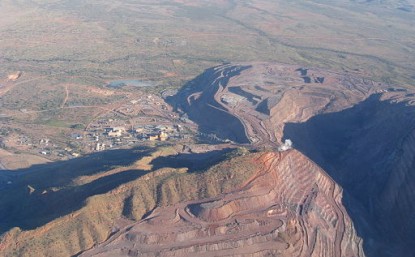
Nevada Copper’s flagship Pumpkin Hollow project is a high-grade Iron Oxide Copper Gold deposit within a porphyry copper district located in Nevada, not in a some scary country. As it stands, the combined 1 & 2 Stages represent a highly attractive, large, long life asset. The company’s upcoming Integrated Feasibility Study, “IFS,” has the potential to both expand reserves and resources and enhance the combined grade. The identified proven and probable reserves approximately 5 billon pounds of copper, plus gold and silver at a copper equivalent grade of 0.49%. This is a solid grade for a new entrant and compared to many depleting mines.
Tremendous Capital and Managerial Resources Soon to Pay Off
Given extensive knowledge of the project as evidenced by years of work on both Stages, key risks factors have been mitigated or removed entirely. Nevada’s known and consistent permitting regime and other elements of the combined project delineate many of the cost estimates and other forecasted operating metrics. This is due to Nevada Copper’s Pumpkin Hollow, having been continuously explored and developed for the past decade.
The remaining factors in moving the project into production are well understood by Nevada Copper’s experienced management team and Board. This is not conjecture, this is fact, supported by both internal and external studies. The Pumpkin Hollow project has the potential to be a significant mine in North America commencing as soon as late 2016. Exploration upside by Nevada Copper or a buyer of the company makes the opportunity even more compelling.
Brief Review of Pumpkin Hollow
Pumpkin Hollow is more than a near-term development asset. It also boasts substantial exploration opportunities, excellent infrastructure including power, rail, roads, labor, water and meaningful local and State support. As mentioned, the copper equivalent grades are attractive and poised to move higher with the inclusion of additional drill holes, especially from Pumpkin Hollow’s high-grade underground endowment.
Having reached a shaft depth of 1,906 feet, significant underground drilling will commence shortly. With all required permits for Stage 1 in hand and Stage 2, permitting expected by mid-year, Pumpkin Hollow is well on its way to becoming North America’s next mid-tier, high margin mine. Please visit CaesarsReport for excellent information and commentary on Nevada Copper, including a recent site visit.
More Than Ever Companies Need a Strong Management Team & Board
In looking at Nevada Copper’s excellent website, it’s notable that 16 of 16 profiledmanagement and Board members have specific mining experience across a wide range of disciplines. Many with decades of global experience and proven mine building backgrounds including senior roles at much larger mid-tiers and Majors. This is one of the best pre-production management & Board I’ve ever seen.
The reason for Nevada Cooper’s recent increase in news flow is due entirely to the past decade of hard work by the company’s management team and Board. This highly experienced team is led by the Mr. Giulio Bonifacio, the Founder, President, CEO and Director of Nevada Copper. The following is a brief description of accomplishments.
He has over 28 years in senior executive positions in the mining industry, and has been instrumental in providing over $400 million of capital to projects of merit. Mr. Bonifacio is a professional accountant with extensive experience and knowledge in areas of corporate finance, securities matters, project finance and mergers & acquisitions. This makes him ideally suited to get Pumpkin Hollow over the finish line on time and on budget as he has in the past.
His team has the collective vision that Nevada Copper will become the next producing mid-sized, copper-focused mine in North America. The team has stated in interviews that it will continue to advance Pumpkin Hollow in a robust yet prudent manner creating stakeholder value, mitigating the need for near-term equity raises and engaging with strategic and financial investors.
Nevada Stakeholders in no Rush to Sell
The stakeholders of this company are looking for bigger and better outcomes. I for one believe that a takeout of the company (at a much higher valuation) could be coming next year, with pivotal events in the second and third quarters of this year. Readers are encouraged to take a virtual tour of Pumpkin Hollow to see what an advanced development project looks like. Notice the extensive equipment and personnel? Not an open field with tumbleweeds, like so many other stranded green field exploration companies around the world.
Nevada Copper is a relatively low-risk emerging, mid-tier copper company in one of the best jurisdictions on the planet. M&A is picking up in the gold sector and copper M&A could soon follow. A number of companies have signed Confidentiality Agreements to take a closer look. A reason for Nevada Copper switching gears and generating an IFS is in part due to requests from suitors already kicking the tires. In previous periods of healthy M&A activity, near-term producers have been snapped up relatively soon after releasing a Feasibility Study. Nevada Copper’s IFS will almost certainly show materially improved economics, (my opinion only) why else do it? For more detail on the Nevada Copper opportunity, see this excellent SeekingAlpha article.
Nevada Copper is blessed with a tremendous management team and Board, highly skilled in taking prudent steps in dealing with potential takeover attempts. With many potential buyers interested in Nevada Copper, the chance of competitive tension, i.e. more than 1 bidder, appears to be a reasonable assumption. M&A begets M&A. Once PE firms like X2 Resources, run by former Xstrata CEO Mick Davis or industry leaders get the ball rolling, a handful of companies, especially Nevada Copper, will be prime targets. The longer the wait, the higher the takeout valuation. The beauty of the Nevada Copper takeout thesis is that if the company were to be acquired in the next 6-12 months, the acquisition could come before the need of further equity dilution. What backs my takeout thesis?
Near-Term Catalysts
A prime reason for writing this article is that there are a number of near-term catalysts. Upon completion of the land transfer and conveyance, expected in 3q 2015, all project activities will be regulated under Nevada State and local regulations. Permitting for the underground mining and processing component of the project has been completed and shaft sinking to the 1,906 foot depth is complete and underground development continues to advance.
As of May 8th, all permit applications necessary for the large open pit and underground IFS have been submitted and are progressing according to plan. Also, the underground drill program from the 1,906 foot level and the new IFS results are expected by the end of May. These are truly near-term catalysts, any one of which could cause the stock to move higher as soon as this month.
Conclusion
As the above-mentioned catalysts come to fruition. Nevada Copper is truly in the sweet spot. It has a talented management and Board with proven mine building experience as well as a diversified skill set. The company has an advanced development project in Nevada, one of the best jurisdictions in the world. Pumpkin Hollow is close to world-class infrastructure and skilled labor. It’s one of a few near-term copper producers boasting both size and grade, with both still growing.
What is the market missing? Nevada Copper maintains blue-sky exploration potential, a fact not lost upon parties that have signed Confidentially Agreements. All of this, yet the stock price is lower today than it was a year ago. Despite weak copper prices, Scotiabanks’s analyst recently reiterated his $4 price target on the company. More than double the current stock price. I believe that Nevada Copper should be trading a lot closer $4 per share than $2. As mentioned, time is money. Less time to production can only lead to one thing, a higher valuation.
Disclosure:
Nevada Copper (ticker: NCU.TO) (NEVDF)- At the time article(s) was/were written on EpsteinResearch.com, or posted on other websites, Mr. Epstein had no prior or existing relationship with this company. As of [4/1/15] Nevada Copper is a Sponsor of EpsteinResearch.com on a month-to-month basis. As of the latest updated Terms of Use & Disclosures, and at the time article(s) was/were on EpsteinResearch.com, or posted on other websites, Mr. Epstein owned/owns no shares of this company. Investors should consult with their own advisors before making investment decisions. Mr. Epstein is not an investment advisor. The article(s) on this company on EpsteinResearch.com, or posted on other websites, should be viewed in this context. This company is highly speculative and not suitable for all investors. A link back to this continually updated disclosure page will be included at the bottom of any article(s) that appear(s) on EpsteinResearch.com or posted on other websites.

I highlighted several weeks ago the rising concern by the US public about our mineral dependance on foreign entities. Important national news has just crossed our wires this morning as two of our featured Alaskan junior miners were mentioned in testimony on May 12th in front of the US Senate Energy and Natural Resources Committee as being two critical domestic mining projects for our most strategic metals and minerals.
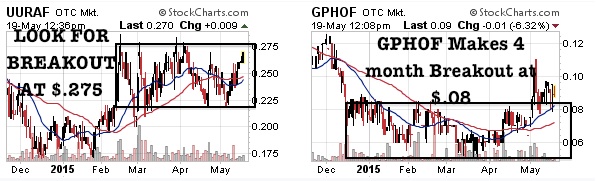
For weeks I have highlighted Graphite One (GPH.V or GPHOF) and Ucore Rare Metals (UCU.V or UURAF) as strategic mineral projects for the future of US mineral independence. The US is totally dependent on Graphite and Heavy Rare Earths from overseas. Graphite is important for the nascent Lithium-Ion Batteries and the heavy rare earths are important for smart bombs, clean energy and electronics. The full testimony can be read at the U.S. Senate Energy and Natural Resources Committee site: http://www.energy.senate.gov/public/index.cfm/files/serve?File_id=863857df-210f-4f99-821b-793db9ae0a4a.
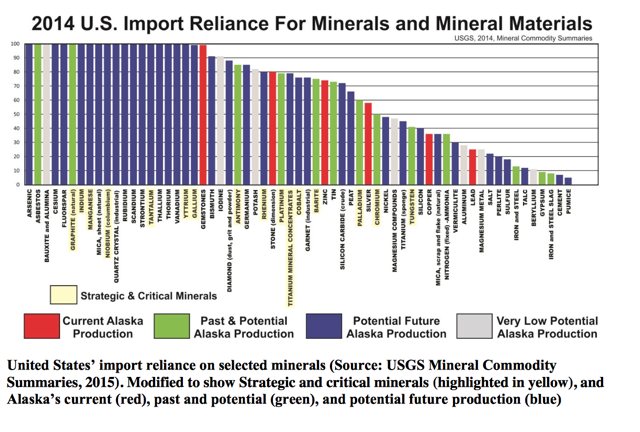 Graphite One owns the largest natural flake graphite deposit in the United States and is working on publishing a Preliminary Economic Assessment (PEA). Ucore own the highest grade heavy rare earth deposit in the United States and is advancing towards publishing a Bankable Feasibility Study.
Ucore (UCU.V or UURAF) recently released news that they secured the rights to SuperLig® Molecular Recognition Technology (MRT) which is used to separate the rare earths. Work is underway for a fully operation Pilot Plant which should be constructed in Houston, Texas. Even more crucial is that if the Pilot Plant is successful a joint venture will be formed that could be used by other rare earth developers for processing using this technology.
See my recent interview with Ucore COO Ken Collison, an experience mine builder by clicking here…
Disclosure: I own Ucore and Graphite One. Graphite One is a current sponsor and Ucore was a past sponsor. Conflicts of interest apply so do your own due diligence.

1. In the Western gold community, there seems to be a fairly widely held view that gold prices can’t rise much higher, unless confidence in central banking is lost.
2. I beg to differ. Investors who bet against central banks generally don’t fare very well. The 2008 crisis saw the Fed use some of its tools, but not all of them. The Fed’s most powerful tools, gold revaluation and money printing, were never employed in that crisis.
3. Until the Fed has used all its most powerful tools, and those tools have clearly failed, a “loss of confidence” event that creates massive gold buying is highly unlikely.
4. What is likely in 2015, is that the bond market won’t crash, but will modestly decline, as the Fed raises interest rates later this year, in a calm and rational manner.
5. It’s important to understand the effect on the US economy of absolute changes in bond yields, versus relative changes in yields. Please click here now. That’s the monthly T-bond chart. I would expect to see T-bonds decline towards the 120 area by 2016.
6. The dollar is unlikely to rally much as bonds decline, because the rate hikes will provide incentive to commercial banks to increase their loan activity, increasing money velocity.
7. That increase in velocity will produce a noticeable rise in inflation, putting upwards pressure on commodity prices and downwards pressure on the dollar.
8. The upwards pressure from rate hikes and downwards pressure from inflation should produce sideways to lower price action in the dollar. At a price of 120, absolute T-bond yields are still historically low, but the large spread between loan and deposit rates at that price would create enormous profits for the banks, and noticeably higher inflation.
9. Even without factoring in the staggering growth of the Chindian love trade, gold should be generally well supported… just by the US inflation created by heightened bank loan activity.
10. Analysts who are trying to use the 1970s gold bull market as a “template” for the current period of time are probably making a horrific error. Unlike the late 1970s and early 1980s timeframe, when the Fed used dramatic rate hikes to curtail inflation, the Fed will now use modest rate hikes to create inflation.
11. Heightened bank loan activity can extend the business cycle. QE4, if used to fund government infrastructure spending, can be inflationary, but if the next crisis is severe, only gold revaluation will work to end it.
12. Gold trades mainly in dollars, so it doesn’t have to be the US central bank that orchestrates a gold price revaluation. I expect the next global super-crisis to be resolved by a PBOC (Chinese central bank) publicly announced gold buy program. It could be announced even before the next crisis occurs, to prevent it from happening.
13. Please click here now. This daily gold chart looks good. Gold clearly penetrated resistance at $1220 yesterday, with a spike to the $1232 area.
14. Unfortunately, the current rally is getting “long in the tooth”. Note the lead line of my key 14,7,7 Stochastics oscillator, at the bottom of the chart. It’s close to the overbought zone at 80. Gold has rallied about $80 since that oscillator bottomed.
15. I’m open to a minor trend surge to the $1240 – $1252 area, before the gold community has to feel some price pain. Light profits need to be booked into this strength.
16. When gold does decline, albeit in a minor way, I expect numerous gold stocks to rally throughout the sell-off. That’s because more and more institutional investors are embracing the idea that Janet Yellen will be successful in her reflationary mission.
17. Please click here now. Clearly, top economists and analysts at major banks are not betting against Janet and her reflationary mission! That’s good news for gold stocks, and bad news for the general equity markets.
18. Please click here now. That’s the GDX daily chart picture, and I certainly think it speaks a thousand “bull era” words. Unlike most analysts, I think GDX and most gold stocks will display this type of upwards price grind for not just weeks or months to come, but for many years and probably forseveral decades.
19. That’s because gold is driven by three key themes now; Indian demand that is in its earliest stages of massive growth, Chinese gold market infrastructure growth, and US reflation. Simply put, there’s never been a better time in history to own gold stocks, from both a risk and reward standpoint.
20. Key individual gold stocks are leading the gold stock indexes higher. Please click here now. That’s the daily chart for Agnico Eagle. When the fear trade (system risk) dominated price discovery for gold stocks, the “Eagle” soared, and then crashed. In the love trade era, fuelled by Chindian jewellery demand and modest US reflation, I expect Agnico to glide higher steadily, rather than soar or crash.
21. Outrageous returns can be produced by this kind of “stealth rise” in the price of a gold stock, particularly when the rise in price is relentless. A pullback to the blue uptrend line would be normal after the recent price advance, but a successful breakout above the $35 area is likely imminent.
22. Please click here now. This daily chart of Barrick Gold looks spectacular. Investors need to “kick their fears to the curb” and boldly buy this stock on all two and three day pullbacks in the current price area.
23. There’s a chance of a bigger pullback towards $11, but the odds of that happening are fading. A two-day close above $13.70 should herald a much stronger advance, towards the $20 area!
24. Please click here now. That’s daily HUI chart, a widely-followed gold stocks index. Note the nice position of the 14,7,7 Stochastics series, and the gentle rising price channel. The HUI index is a great golden tortoise, plodding her way to much higher prices!
There are many good signs for a major bullish breakout in the beaten down precious metals, energy and commodity sector which may be bottoming as the general equity, bond market and US dollar appear to have recently topped a couple of months ago. Rising interest rates and the specter of higher inflation with anemic growth in the US could cause a return to the deeply discounted commodity sector. I have encouraged patience in our wealth in the earth sectors and continue to search for the highest quality situations where we witnessed major gains despite an incredibly challenging bear market in mining.
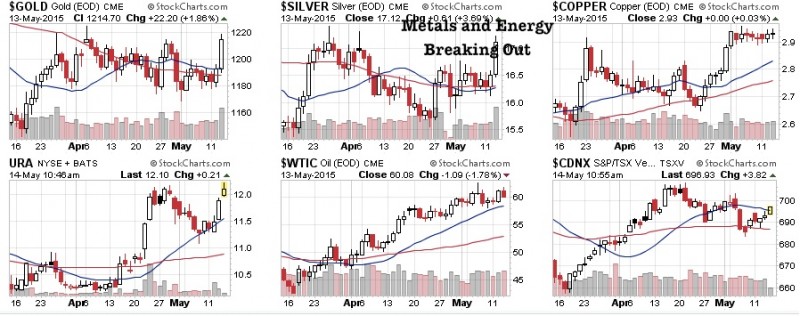
Technically precious metals could be on the verge of a major breakout. Gold (GLD) is breaking above $1221 and its 200 day moving average. I believe it could test January highs at $1310 in the next few weeks. I am closely following silver (SLV) and the increased volume breakout at the 200 day at $17.15. If it can clear that the next test is $18.25 which was the January high which could be hit this summer. Copper (JJC) looks very strong holding the 200 day moving average as the 50 day rapidly moves higher attempting to make a bullish golden crossover. Look for this to take place over the next month. Similarly, I think oil (OIL) could bounce to the 200 day moving average following copper which would be around $68. Currently its trading around $60. Watch the uranium mining ETF (URA) which is quite possibly breaking through major resistance at $12.15. Investment dollars are clearly coming back into mining, metals and energy. Mining is not dead and still leads to the best outsized gains if you do your homework as evidenced by two of our top recommendations in 2014.
Two of my Junior Mining Stocks lead the entire OTCQX in 2014, a global marketplace with over 10k public companies in all sectors. This is amazing as it occurred during the worst bear market in mining history and the huge bubble in biotech, housing and financials.
I wish I could say it was good luck, but the skill to pick the best has been crafted for over 20 years of following the junior mining markets. Despite this macro trend against wealth in the earth assets two of our featured companies rose to the top of the entire marketplace. Anyone can make money in stocks during a bull market, but being a good stock picker during a bear market separates the professionals from the amateur.
The top two stocks on the entire OTCQX is:
#1 Western Lithium (WLCDF)
#2 Niocorp (NIOBF)
Western Lithium had a 2,566% increase in daily traded volume in 2014 while Niocorp gained 394% in market cap value on the year.
Disclosure: I own URA, WLC and NB and WLC and NB were sponsors of my website in the past.

It all started with Tesla’s announcement of its battery giga-factory in February, 2014. That news was discussed endlessly with breathless excitement. The news sparked a revival in lithium, cobalt and graphite juniors. For example, Western Lithium USA Corp. (WLC.TO) based in Nevada, more than doubled that month. At the time, I wrote a few articles saying that the giga-factory was great news for select graphite companies. I didn’t mention lithium or cobalt, simply because I was less fluent in those. Today, I’m better prepared to articulate the lithium story, one of the hotter sectors in the natural resources space. Why now? I think that the lithium-ion battery might be reaching a “tipping point,” the phrase made famous by Malcolm Gladwell. Please note, I don’t use catch phrases loosely, lithium’s spike in demand is no, “black swan” event, and we’re not near “Peak Lithium,” although we could see supply shortages on the horizon. Not only did Tesla’s giga-factory catch everyone’s, the idea caught on so well that there’s already 5-6 announced or in construction giga-factories, (Tesla’s is the largest).
Lithium demand, “is spiking,” for several reasons, again heavily influenced by the $5 billion dollar Tesla facility. Interestingly, the original concept was that the Tesla facility would be completed by 2020. Now conventional wisdom says 2017-18, another bullish data point. Tesla’s fully electric car was way too awesome for its own good. It guaranteed that new competition would enter the space and it has. Get ready for it, an abbreviated list of 15 automakers in the plugin-EV (hybrid) or fully EV market….BMW, Mitsubishi, Toyota, Nissan, Honda, Tesla, GM, Ford, Kia, Fiat, Mercedes, Porsche, Volkswagen, Audi and Hyundai. This list probably doesn’t even contain all of the well known brands. Many of these automakers had no offerings of plugin-EV (hybrid) or fully EVs until after Tesla’s. Here’s another fact, not my opinion, there are dozens of less well known brands diving into the race. China and Europe have plenty of them. China is trying mightily to cut down on air pollution and European cities are small enough to be quite amenable to EVs. Check out this article if you don’t believe me! And, just wait until ALL hybrids become full EVs. A certainty in my mind.
So many uses, hard to follow demand, harder to forecast
Above, I mentioned Western Lithium, that has a well deserved market cap of $105 million. Lithium America’s Corp. (LAC.TO) has a $70 million market cap. Before moving down the list, please also consider Australian-listed Orocobre Limited (ORE:ASX) with a market cap of $425 million for a pure-play, producing lithium company. Of course, Orocobre is several years ahead of small cap companies like Dajin Resources (DJI.V) & (DJIFF) (which trades a combined 365k shares per day) and Pure Energy (PE.V). However, we’ve seen this movie before. When a commodity is in high demand, this is what happens. Small companies acquire or get options on prospective deposits, they stake new ground, they explore and develop as available capital prudently allows.
Time is money. Do new entrants really want to start a green field project? Or might they prefer to save 2-3-4 years time, money and leg work provided by a well-run junior? I believe that in a strong market, or dare I say a bull market in lithium, companies with the lowest market caps, solid management teams and highly prospective deposits will be sought after. I submit that lithium companies with market caps of $5mm to $15 million today have stocks more likely to double, triple, quadruple, quintuple, sextuple, septuple or octuple than some of the above mentioned plays. Sorry, I had to use the word, “septuple” at least once in my life.
For example, for Dajin Resources, a 10x return on its market cap would still place it at a discounted valuation to Western Lithium. Don’t get me wrong, Dajin has considerably more risk, but also considerably more upside. If one shares my bullish view on lithium. Even though Dajin & Pure Energy are behind peers in reaching initial production, they are actually well ahead of new entrants in terms of permitting, environmental studies, seismic, drilling, community relations, access to infrastructure and mining officials, etc.
I wonder if pundits looking at lithium demand are capturing all of these booming markets, or if it’s even possible. Make no mistake, many experts are no doubt better equipped than me. However, even if 2015-2016 runs at less aggressive annual growth rates, 2017-2020 could still be blockbuster years. A key to the tipping point debate is not necessarily when lithium reaches a certain penetration, but when it becomes the go-to standard, which appears to be happening. Beta-max or VHS? Streaming video or videos from the local video store? Penetration will follow. My final point, I swear, consider this– My 79 year old mother has been asking me about lithium-ion batteries, what’s so good about them? Why am I reading so much about lithium in the New York Times. My answer? “I don’t know mom, who said you could come down into my basement room? Go cook my dinner….”
Disclosure:
At the time article(s) was/were written on EpsteinResearch.com, or posted on other websites, Mr. Epstein had no prior or existing relationship with this company. As of [5/1/15] Dajin Resources Nevada is a Sponsor of EpsteinResearch.com on a month-to-month basis. As of the latest updated Terms of Use & Disclosures, and at the time article(s) was/were on EpsteinResearch.com, or posted on other websites, Mr. Epstein owned/owns no shares of this company. Investors should consult with their own advisors before making investment decisions. Mr. Epstein is not an investment advisor. The article(s) on this company on EpsteinResearch.com, or posted on other websites, should be viewed in this context. This company is highly speculative and not suitable for all investors. A link back to this continually updated disclosure page will be included at the top and bottom of any article(s) that appear(s) on EpsteinResearch.com or posted on other websites.
Tin prices started falling in 2014 and are now close to a 5 year low. Although prices have seen some recovery from the lowest point reached in April, the LME cash price at the beginning of May was just over USD 16,000 per tonne, down 30% y-o-y and nearly 20% down since the start of the year. So what has caused the fall and what is happening now?
In May 2014, the tin price had been relatively stable between USD 21,000 and USD 24,000 per tonne for about 8 months. The regulations that the largest tin exporter Indonesia had in place were constraining exports and maintaining the price despite falling demand. But then falls in the economic growth outlook in China, the country that accounts for 50% of global tin imports; combined with a change in the way China bought its tin, a fall in crude oil prices and a strong US dollar created a downward trend in prices.
As Indonesia placed restrictions on tin ingot exports to encourage more processing in the country, the tin producers in the country saw a loop hole and exported more non-ingot tin in the form of solder and alloys. Consequently, the export of tin in Indonesia didn’t fall as expected. In addition, Chinese investment in mining in Myanmar started to pay dividends and imports from Myanmar grew steadily, reducing the Chinese reliance on refined imports. This all happened around the same time as the Chinese economy was slowing, reducing demand overall. In July last year, the Indonesian government announced further restrictions to the export of non-ingot tin to start in November 2014 to try and encourage a drop in production.
In September, with the price of tin still falling, Indonesian tin producers stopped all trade in an attempt to slow the decline. This may have also been in part due to certification inspections of tin exports by police. Over 90 containers of tin were detained early in the month, with over 80 being released quickly and 9 being held back suspected of illegal tin exporting. This was a clear signal to the tin producers that the new regulations were being enforced in a stricter manner than previously.
Even so, the price of tin carried on falling. The continuing drop in the price of crude oil was making production costs cheaper and the strengthening of the dollar was making imports more expensive, reducing demand further. Rustam Effendi, the governor of the Bangka Belitung province – the region with the largest tin production, called a reduction in production but received little response with the largest producer stating that they would continue fulfilling contracts.
In January it was reported that China had imported a record 28,875 tonnes of tin ore, mostly from Myanmar, during November. This took total imports in January to November to 153,229 tonnes, up 88% y-o-y. The influx of tin ore from Myanmar resulted in the Chinese refiners producing more domestically refined tin. This led to the imports of refined tin to fall to 7,771 tonnes, down 41% y-o-y. Approximately 30% of refined tin imports into China come from Indonesia.

Rustam Effendi renewed his attempts to reduce production in February, and the producers, worried about the continuing fall in prices, began to take notice and agreed that there should be some efforts to reduce tin exports; however the negotiation and discussion took several months to complete. It wasn’t until the end of March that an agreement was reached to restrict tin exports to 4,500 tonnes per month starting in April 2015. The move was met with scepticism, however as previous effort to reduce trade had not lasted long.
However, after falling to a low of USD 14,765 per tonne on 17th April, Indonesian tin producers announced that they would reduce production whilst the price was below USD 17,000 per tonne. It is estimated that average operating costs of the main Indonesian producers PT Timah are USD 16,000 per tonne, and although cost saving practices are now being put into place to reduce this, only half of the 12 furnaces are now in operation.
The weakening of the dollar in the last half of April plus the cuts in production and exports sales has seen the market rally slightly, and at the start of May the LME cash price stood at USD 16,200 per tonne, a rise of 6% in 2 weeks.
Gold stocks’ reign as the most despised sector in all the stock markets remains unchallenged. They’ve even been abandoned by contrarians. But such universal antipathy and apathy is the breeding ground for major bottoms. And despite gold’s lackluster performance, gold stocks have actually been rallying on balance for 6 months now. Given their extreme undervaluations relative to gold, this strength is likely to persist.
The gold miners’ stocks are essentially leveraged plays on the price of gold. The fortunes of this prized precious metal determine their profitability, and those earnings fundamentals drive their ultimate stock-price levels. And gold’s been deeply out of favor, languishing at relatively-low price levels. This has put great pressure on gold-mining operations, slashing ongoing profits and seriously clouding their future outlook.
This undeniably dark time has swung sentiment on this sector to extreme bearishness. Out of the small fraction of investors and speculators who’ve even considered gold stocks, the great majority are totally convinced this sector is doomed to fade into oblivion. Popular consensus believes gold mining simply can’t be profitable at prevailing or lower gold prices, and doesn’t see gold recovering anytime soon if ever.
Both these notions are pretty silly though. For nearly the entire history of the modern era of gold mining, this industry thrived with gold well under $1000 let alone $1200. There aren’t as many deposits that are economically viable at lower gold prices, and the miners have to target higher-grade ores, but they can adapt. A great example recently came from Newmont Mining, one of the world’s largest gold miners.
Newmont reported its Q1 operating results late on April 23rd, and they were excellent. Adjusted earnings per share of $0.46 doubled both the consensus expectations of $0.23 and the prior year’s $0.24. And sales surged 12% year-over-year. Most of corporate America would die to report earnings and revenues like that! Newmont’s profitability was mostly the result of it driving down all-in sustaining costs to $849 per ounce.
Annualize that Q1 profitability, and Newmont stock is trading at a 2015 P/E ratio of 13.8x even if gold continues to languish around $1200. That’s quite cheap compared to the simple average trailing P/E ratio of all the elite S&P 500 component companies, which was way up at 26.0x as April ended! And it’s surprising how many smaller gold miners are trading at similar or lower P/E ratios today, truly dirt-cheap.
But when gold inevitably mean reverts higher, gold-mining profits are going to leverage those gains to soar dramatically. That will make gold stocks even cheaper fundamentally. Today’s weak gold levels are the result of the extreme stock-market levitation fueled by the Fed’s QE3 campaign and all its associated jawboning, and the universal but-totally-false belief today that the coming rate hikes will slaughter gold.
Rate hikes are actually bullish for gold investment demand because they hammer general stock markets, leading investors to seek alternatives. During the 1970s gold super-bull which saw it skyrocket over 24x higher, the Fed hiked its benchmark Federal Funds Rate from 3.5% to an astounding 14.0%! Yet gold still soared in its biggest bull of modern times. It had another major bull in the 2000s, again during higher rates.
In particular during the Fed’s last rate-hike cycle between June 2004 and June 2006 where it more than quintupled the Federal Funds Rate from 1.0% to 5.25%, gold surged 50% higher! Gold’s lack of yield has nothing to do with it being in or out of favor. Rising and high-rate environments are great for gold because they seriously damage conventional stocks and bonds forcing investors to diversify into gold.
So beaten-down gold prices are almost certain to power higher in a major new bull as the coming Fed rate hikes deflate the lofty, overvalued, and overextended general stock markets. This is likely one of the main reasons gold stocks have been recovering over the past half-year. This first chart looks at this sector as seen through the lens of the GDX Gold Miners ETF, the leading gold-stock benchmark today.

With all the gold-stock hate out there, you’d think these miners’ stock prices were still plummeting into the abyss. But nothing could be farther from the truth. Since bottoming at an extreme 6.0-year low back in early November, the gold stocks have been climbing on balance. This was despite gold being weak for most of the period since, largely languishing around or under that bearish-psychology-feeding $1200 level.
This entire sector has actually enjoyed a strengthening uptrend in the past 6 months, carving higher lows and higher highs. And while gold did surge in early January which sparked a really impressive 38.3% GDX rally in 2.5 months, that was certainly the exception. Most of the time since GDX started recovering in this young uptrend, gold was drifting sideways to lower near $1200. Yet investors bought gold stocks anyway.
April’s action was a great example of this disconnect. After gold enjoyed an initial surge, it drifted lower to finish that month dead flat in the low $1180s. There was not only nothing going on to encourage investors to return to gold stocks, the weak gold action actively discouraged it. Yet GDX still powered a very impressive 10.3% higher last month, ranking gold stocks among the best-performing sectors in all the markets.
This young sector uptrend may be nearing a major technical breakout too. That sharp January rally in GDX collapsed at this ETF’s 200-day moving average. That’s an important level that many technically-oriented traders watch closely. GDX’s sinking 200dma has now converged with this ETF’s young uptrend channel. So even a conservative within-trend rally could easily break GDX back above its 200dma.
And once that buy signal triggers, contrarian traders sitting on the sidelines waiting for a clear catalyst to buy gold stocks are going to start redeploying capital. It’s hard to believe, but there is still a small group of investors and speculators interested in this ultimate contrarian sector. This is evidenced by the sharp GDX rallies that erupt whenever gold shows signs of life. Gold-stock buying will surge on a GDX 200dma breakout.
This sharp buying also emerged the last couple times GDX retook its 200dma in February and June 2014. And those strong gold-stock rallies would have kept running if not for big gold-futures shorting soon slamming the metal. But given the extreme levels of gold-futures shorting in recent years, that trade is gradually exhausting itself. Financial markets are forever cyclical, no price runs in one direction forever.
It’s this very core tenet of contrarian investing that strongly argues why gold stocks’ recovery has likely only just begun. This next chart looks at the key fundamental relationship between gold-stock prices and the price of gold which drives their profits. The GDX gold-stock-ETF price is divided by the flagship GLD SPDR Gold Shares gold-ETF price. This GDX/GLD Ratio shows the extreme anomaly in gold-stock pricing today.

When this GDX/GLD Ratio is rising, gold stocks are outperforming the gold price. This is normally the way gold stocks act when gold prices climb, due to their inherent profits leverage to gold. Consider an example. If a miner can produce gold for $1000 per ounce, and sell it at $1200, it earns a $200-per-ounce profit. If gold rallies 25% to $1500, this miner’s costs are still $1000. So its profits greatly leverage gold’s gains.
They soar to $500 per ounce, which is a massive 150% increase compared to gold’s 25% increase! All throughout the stock markets, stock prices are ultimately dependent on earnings. So gold-stock price levels are bid up to reflect their much-higher profitability fueled by higher gold prices. Naturally this is a double-edged sword though, when gold prices drop gold miners’ profits fall far faster amplifying its losses.
When the GGR is falling, gold stocks are underperforming gold. And as this chart reveals, incredibly this happened on balance between late 2007 and late 2014. Around 7 years is an extraordinary span for any market to move in one direction! Markets are forever cyclical, sentiment and therefore price levels ebb and flow. Gold stocks can’t fall out of favor relative to gold forever, they are overdue for a massive recovery.
And it looks to be already underway! The past half-year’s stealthy gold-stock uptrend has broken this GDX/GLD Ratio back above its long-term secular resistance that dominated since late 2007. This is a major trend change that is likely to prove pivotal. Back in mid-December, the GGR fell to its lowest level ever at 0.149x. A share of GDX was worth just 0.149x a share of GLD, an extreme never before witnessed.
But since then the GGR has been regaining ground despite deeply-out-of-favor drifting gold prices. The GGR climbed to 0.185x in late January after that sharp gold-stock rally, a 24.2% gain in a single month. And despite gold drifting sideways to lower since then, the GGR had clawed back up to 0.179x as May dawned. Gold stocks are showing impressive relative strength in the face of hyper-bearish gold sentiment!
And with gold-stock price levels still at such fundamentally-absurd extremes relative to gold, their mean reversion higher is only just starting. Before 2008’s stock panic, the GGR averaged 0.591x. In the initial post-panic years between early 2009 and mid-2011, it averaged 0.419x. Both baselines of gold-stock prices relative to the metal which drives their profits are far higher than prevailing levels. But let’s be really conservative.
Gold stocks’ current woes began in early 2013 as the Fed ramped up its wildly-unprecedented open-ended third quantitative-easing campaign. As that goosed already-toppy stock markets, while short-circuiting all meaningful selloffs, demand for all alternative investments including gold withered. In fact in Q2’13, gold suffered its worst quarter in an astounding 93 years! It was essentially a hundred-year storm.
So the last “normal” years in the markets ran between 2009 to 2012. Over that span, the GDX/GLD Ratio averaged 0.381x. Merely to mean revert back up to those average post-panic levels relative to the gold price, GDX would have to soar 120% higher from today’s levels! The upside from here given how far gold stocks are out of favor is massive. No other sector has such great potential in today’s overvalued stock markets.
And this conservative comparison greatly underestimates gold stocks’ upside for a couple reasons. First after any price and sentiment extreme, a sector tends to not only mean revert but overshoot towards the opposite extreme. So once gold stocks really get powering higher again and excite traders, they are going to pour far more capital into this sector than is necessary merely to regain average levels relative to gold.
Although exactly where the GGR could peak in this highly-likely gold-stocks-regaining-favor scenario is impossible to predict, mean-reversion overshoots tend to be inversely proportional to the extreme that triggered them. So the GGR could easily temporarily shoot as far above average levels as it has been below them in recent months. That effectively doubles the upside potential of the gold stocks from here!
And we can’t forget that gold prices drive gold-stock earnings, which ultimately determine gold-stock price levels. There’s no way gold is going to stay around $1200 once the super-toppy global stock and bond markets roll over in the face of the coming rate hikes. Gold itself is going to mean revert far higher as demand for alternative investments and prudent portfolio diversification comes roaring back in a stock selloff.
So what’s an average gold price? Between 2009 and 2012 before those extreme Fed-fueled distortions, gold averaged $1361. That’s 14% higher than today’s levels. But in 2012 alone, the last normal year prior to QE3 and its associated jawboning ramping up, gold averaged $1669. That’s 40% above current prices. Let’s just take a midpoint around $1500, which again is merely a relatively-small 27% gold upleg.
While gold too is almost certain to proportionally overshoot in its coming mean reversion back into favor, even $1500 drives home gold stocks’ vast upside potential. $1500 gold equates to about $144 in GLD terms, since this ETF’s operating expenses have required a 0.4% annual fee since its inception back in late 2004. Using that 2009-to-2012 average GGR of 0.381x, $1500 gold yields a GDX target near $55.
That’s a whopping 178% higher than today’s gold-stock price levels, nearly a triple! And it is based on the unlikely assumption that neither gold prices nor the GDX/Gold Ratio overshoot on their long-overdue mean reversions. Whatever reasonable assumptions you make about future gold prices and gold-stock price levels relative to the metal they mine, the gold stocks are epically undervalued today.
And I suspect the past half-year’s impressive contrary gold-stock buying is coming from a small fraction of contrarian investors’ growing realization that gold stocks are exceedingly cheap with amazing upside potential from here. Gold stocks’ recovery is already underway, and the capital flowing into this sector and bidding it higher is going to mushroom once gold itself finally starts moving decisively higher as well.
Investors and speculators can certainly play gold stocks’ young upleg with GDX, which is a fine gold-stock ETF containing the world’s best gold miners. That’s certainly the easiest way for traders of any size to gain gold-stock exposure in their portfolios. But as always, a carefully-handpicked portfolio of the best of the gold miners should see gains well exceed this sector’s as a whole. That’s what we specialize in.
The bottom line is gold-stock prices are recovering. Despite gold drifting sideways to lower for the most part, gold stocks have carved a strengthening uptrend over the past half-year. This loathed sector is just starting to outperform gold again, driven by hardcore contrarian buying. The gold stocks have broken out of their exceedingly-old downtrend relative to gold, and a massive mean reversion higher is inevitable.
Since gold stocks were forced to such extreme lows relative to gold, their upside potential from here is vast. This forever-cyclical market will gradually see trader sentiment shift from today’s despair to neutral to eventually greed. And every step along the way, more investors and speculators will buy in to ride the growing upleg. There is no other sector in these overvalued stock markets that’s as undervalued and bullish.
In April this year, Rio Tinto (RIO), the globally known mining company that owns and operates the equally renowned Argyle diamond mine, announced that its first quarter diamond production was up 14 per cent on a year-to-year basis, a notable increase that many have attributed to increased diamond production at Rio Tinto’s Argyle mine.
For those not familiar with the diamond and gemstone industry or those who are unfamiliar with the prominence of the Argyle mine, a brief recap may be in order. The Argyle mine is located in the remote East Kimberley region of Western Australia. After discovery of the Argyle pipe in 1979, commercial mining of the deposit began in 1985. Certainly, there were hopes that this mine would have a successful production life. However, many did not expect anywhere near the kind of output that the mine has produced over the past thirty years.
In the world of diamonds and precious gemstones, the Argyle mine has assumed a brand of its own.
The Argyle mine is the fourth largest diamond mine in the world by volume and averages an annual production of 8 million carats, or 1,600 kilograms. Additionally, the mine has been the largest and most significant source of rare pink diamonds, producing more than 90% of the world’s supply. Admittedly, pink diamonds have been found in other mines, in Brazil, Russia and India for example. But, the Argyle mine is unmatched in the sheer quantity and quality of pink diamonds it’s produced over the years.
It’s clear that the Argyle mine occupies a special, not to mention influential, spot in the diamond and gemstone industry. Which has led to much speculation over the past several years as to what will happen when production at the Argyle mine ends. All mines eventually burn out, that’s a given. And the Argyle mine, despite its success and renown, is no exception.
So, the question is, how will the global diamond and gemstone marketplace react when this happens?
This question is especially pertinent considering that only three years ago, in 2012, Mining.com published an article describing how the Argyle mine would largely be depleted within a decade.
Admittedly in 2013, Rio Tinto announced that it had extended the life of the Argyle mine by opening a new underground portion of the mine. But, when taking in consideration the full life of the mine, this extension is fairly minor and the reality remains that by 2019, or perhaps a little later, the Argyle mine will either be closed or sold off.
This will be a major milestone and its significance hasn’t been lost on the jewelry community or investors of hard assets.
“The fact of the matter is that another mine hasn’t been found yet to take the [Argyle] mine’s place.” This is a comment coming from Geoff Black who operates Griffin and Highbury, Inc., a natural colored diamond and precious gemstone dealer based out of Toronto, Canada. Geoff Black and his team at Griffin and Highbury specialize in acquiring, educating and even re-marketing gemstones and diamonds for their clients. Griffin and Highbury is also a firm that assures that all its diamonds come from conflict-free mines, like the Argyle mine.

“The diamond and gemstone market really follows the supply and demand model, perhaps even more closely than other precious resource sectors”, says Geoff Black. “So, when the Argyle mine closes, the supply of diamonds, and particularly the supply of pink diamonds, will be even more limited. That will undoubtedly decrease global supply.”
As if already anticipating the Argyle mine’s closure, recently there have been record sales of pink diamonds. For example, this week it was reported that a rare pink diamond would break record sales when it goes to Sotheby’s auction later this month. Other data also demonstrates the steady appreciation of pink diamonds over the past decade.
")
Geoff Black of Griffin and Highbury provides a final comment, “There’s no doubt it will be the end of an era when Argyle closes. But, I’m eagerly anticipating what the future holds. Either way, I tell my clients and other investors – now’s the time to get in on diamonds and gemstones because we really don’t know if there will ever be another Argyle mine again.”
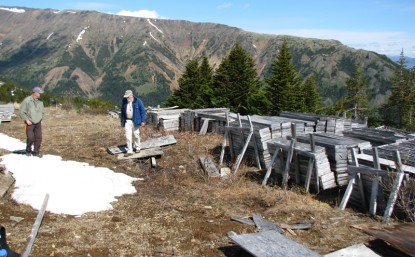
It’s difficult to overstate the importance of Skeena Resources’ (SKE.V) latest upsized, non-brokered capital raise. Instead of $4 million, the company raised $6.5 million and it could have raised more. The raise was done at the market. Best of all, no warrants were needed. I honestly can not think of a single capital raise in this forsaken sector that did not include a half or full warrant. Why am I excited about this? It’s yet another vote of confidence in the blue-sky potential of Skeena’s Spectrum Project in the Golden Triangle of northwest British Columbia. It’s one thing for management and the Chairman of the Board Mr. Ron Netolitzky to have strong conviction that Skeena may be onto something meaningful, but having a number of existing and new institutions step up is another thing entirely. All institutions from the prior round participated in this round, except for one. Importantly, Skeena picked up three new institutional supporters. The company now has ample funding for two drill seasons on Spectrum (2015 & 2016).
Most institutions do a tremendous amount of due diligence before investing in a junior gold company. Although there’s been a rash of Canadian gold M&A among larger companies, takeouts of juniors typically occur later in the cycle. Skeena, cashed up for the next 18-24 months even after targeted drilling in 2015-16, is setting up to become a prime takeout candidate. This could occur sooner rather than later. By sooner, I mean by mid next year. Having said that, two things come to mind. First, if Skeena drills a few more high grade holes in the right places, interest from suitors could come before the confirmation of a NI 43-101 report. That’s what can happen in a more, “normal” gold market. My second point, I don’t want Skeena to be taken out too soon! If Skeena is sitting on a viable high grade mine, (still an open question) it’s worth a multiple of its market cap, not merely a 50% premium above the current price.
Regarding the capital injection, Mr. Walter Coles, Jr. CEO of Skeena commented,
“Our Chairman, Ron Netolitzky likes to say that the only way you really make money in this business is by taking shots. That means getting the drills turning so you have a chance at a big discovery. This summer Skeena will be one of the few, well funded junior exploration companies that will be taking the shots [drilling] and hoping to score big.” [See short video clip]
To be clear, finding 1 million ounces is not a sure thing, it’s a question of both “if” and “when.” Still, there’s no mistake that among the several dozen gold juniors in Canada, Skeena is clearly one investors are watching. I received a few emails from readers of my Skeena articles. The gist being that Skeena remains too early stage and that the thesis of finding 1 million ounces lacks adequate support. My answer? That’s largely correct, but with caveats. At risk of beating a dead horse for readers who have consumed my work [here] & [here] each of which contains valuable information. In my opinion Skeena is much more than a greenfield play because it has substantial historical data and the single best geologist in the Golden Triangle. Both factors, and ongoing strong financial support, suggest that this speculation that institutions embrace is a speculation others should carefully consider. Is finding 1 million ounces going to be difficult? Perhaps, but if Skeena can deliver, then the stated goal of reaching 2-3 million ounces over time becomes substantially more likely. Blue-Blue-sky potential!
I now revisit an earlier comment, that there’s been a slew of M&A activity. It’s been chronicled several times, but a good concise mining.com article can be found here. The article starts with, “investors in Cayden Resources saw their shares swell by 300% in price late last year, when Cayden received a takeover offer from Agnico Eagle Mines” So, there’s the hook to draw us suckers in. There are a few takeaways from this article, first that M&A in Canada is on the rise, which has been documented in several other places. Second, a possible reason is that the weak Canadian dollar is boosting interest in Canadian assets as costs are in C$ and gold is priced in US$. I agree. However, a takeaway not fully appreciated is that upon a rebound in the gold price, mid-tiers and Majors will not do what they did last time– take unwarranted risks in challenging countries. Stakeholders would never allow it.
What this implies (in my opinion) is two things. First, there will be a lot more attention on U.S and Canadian juniors. Second, the natural culling of unviable companies that routinely occurs in bear markets will leave far fewer juniors to choose from. Even juniors with decent projects could be gone if they run out of money one too many times. To reiterate, fewer juniors to shop for and a clear trend of gold companies shoping in Canada. This could fuel a perfect storm of bidding for companies like Skeena. I used one of my less liked phrases, “perfect storm,” but have so far managed to avoid, “re-rating,” “de-risking,” and “black swan event.” Back to Skeena…
Conclusion:
New investors are frequently a catalyst to send a stock higher. Skeena has new investors. Top geologists are frequently an important reason for to investors to remain patient, check that box. Ample cash in the bank comforts shareholders. Absolutely. Blue-sky upside excites investors. Proof of Skeena’s thesis without incremental equity dilution is a good thing as well. High grades mitigate fundamental downside and contribute to potential upside. Access to a treasure trove of historical data got Skeena into the game in the first place. Ron Netolitzky has stated that he’s drawn to three dominant themes. Blue-sky upside, historical drill holes and data with which to formulate attractive new drill targets and most importantly, grade, grade, grade. Mr. Netolitzky is not Chairman and 2nd largest shareholder on a whim, he continues to see great potential and new and existing shareholders share his vision.
Disclosure:
At the time article(s) was/were written on EpsteinResearch.com, or posted on other websites, Mr. Epstein had no prior or existing relationship with this company. As of [4/1/15] Skeena Resources was/is a Sponsor of EpsteinResearch.com on a month-to-month basis. As of the latest updated Terms of Use & Disclosures, and at the time article(s) was/were on EpsteinResearch.com, or posted on other websites, Mr. Epstein owned/owns no shares of Skeena Resources. Investors should consult with their own advisors before making investment decisions. Mr. Epstein is not an investment advisor. The article(s) on this company on EpsteinResearch.com, or posted on other websites, should be viewed in this context. This company is highly speculative and not suitable for all investors. A link back to this continually updated disclosure page will be included at the top and bottom of any article(s) that appear(s) on EpsteinResearch.com or posted on other websites.

1. The price movement of gold and silver bullion continues to disappoint both the bulls and bears. “Key” upside and downside breakouts are followed by more sideways action.
2. It’s not just gold and silver that are acting like slugs in the mud. Bill Gross has just echoed my view that the US stock market is entering a price area where it will perform much like a wet noodle.
3. Please click here now. Bill suggests, as I have for more than a year, that rather than surging higher or blowing up in a fireball, the US equity market will simply fade away.
4. The big action now, is not in the US stock or bond markets, and it’s not in gold and silver bullion. It’s in gold and silver stocks.
5. The US business upcycle begin in October of 2008. It’s almost 7 years old now. The average upcycle lasts about 8 years, and signs of modest inflation and sluggish growth typically appear at the end of the cycle.
6. That’s exactly what’s happening now. It’s a generally supportive environment for gold and silver, and an ideal one for gold and silver stocks.
7. Please click here now. That’s the daily gold chart. The price continues to grind sideways. Gold is clearly ignoring the parabolic catcalls of wild bulls, and frustrating the vociferous bears who promise “final capitulations” and gigantic “new legs down”.
8. I expect gold bullion will continue to frustrate the bulls and bears for several more years, as will silver. Please click here now. That’s the daily silver chart. Like gold, silver is treading water, and I expect it to continue do so throughout 2016, with a mild upwards bias.
9. How does an investor make money in a sideways market? The answer is: Short term trading and dividend-oriented investment. When prices are volatile, range trading can be quite profitable, When it isn’t, juicy dividends can bring tremendous satisfaction to any metals-oriented investor. I have a huge focus on dividends in my own investing.
10. In regards to the US dollar index, many analysts are trying to call a top or a new leg higher, and relate that to a big move in gold prices. I don’t see a top, or a new leg higher. I see a drift sideways in the dollar, a drift in bonds, a drift in bullion, a drift in the Dow, and much higher gold and silver stock prices!
11. Fresh signs of inflation are imminent, and that will bring the first rate hike. That rate hike is supportive for the dollar and negative for gold, but the inflation itself is supportive for gold. So, sideways price action will be the result, with a very mild upwards bias, because of the growth of the Chindian love trade.
12. Please click here now. Mainstream media is starting to pick up on the inflation theme.
13. It’s a relatively tame theme, and I expect it to stay that way, until the banks begin aggressively loaning out the QE “money ball” they are sitting on. They won’t do that unless higher rates come into play, making those loans, at least initially, very profitable.
14. In 2016, I expect the US government to begin directing monies away from their useless wars in the Mid-East, and towards giant infrastructure projects, and that will add more inflationary pressure. Gold stocks should do well in 2015, and “rock” in 2016, as more mainstream analysts join the reflationary bandwagon.
15. Please click here now. Heavyweight mainstream money managers like Jim Paulsen are clearly aware of the potential for inflation. Economists at Bank of America, HSBC, and Commerzbank are also “bullish” on gold, but looking for only slightly higher bullion prices in the next few years, which is the same view I have.
16. With US stock markets fizzling and talk of inflation growing, gold and silver stocks are set to take centre stage as the best performing asset class, for years to come.
17. Please click here now. That’s the daily GDX chart. It’s working its way over the key green downtrend line. A three day close above that line should trigger a rally towards $21.50, and maybe all the way to the $23.30 area.
18. While fear trade enthusiasts may be disappointed with the prospects of sideways action in bullion prices for years to come, that’s sideways action with an upwards bias, and much higher prices in gold and silver stocks. With asset classes like the Dow, T-bonds, and the dollar, I think the sideways action will carry a downside bias.
19. The gargantuan growth of the Chindian trade is changing the nature of gold, and the nature of gold investors. Historically, fear of lower prices is a key tool in the tool kit of every fear trade investor. That’s because when good times returned to Western economies, gold prices declined, and usually crashed. In contrast, the world is entering what I call a bull era, lead by China and India.
20. In Chindia, gold is bought both when times are good, and when times are bad. Chindian gold jewellery demand is already enormous. It’s mostly inelastic in China, fully inelastic in India, and growing at 8% – 15% a year in both countries, with mine supply struggling to grow at 2%. The bottom line: The Western gold investor now can get all the potential upside benefits of the fear trade, with a huge “love trade floor” cushioning current prices. Gold has never had a better risk/reward profile than it has now, and fully deserves its “ultimate asset” moniker.
21. Please click here now. This is a very important chart. It’s the ratio chart of GDXJ compared to US T-bonds. Wealth is built and retained by buying one asset class when it is significantly on sale, compared to another one. GDXJ has declined by about 90% against T-bonds.
22. Borrowing money from banks to buy silly items like DUST-NYSE with leverage now, is not how to build wealth in a great asset class like junior gold stocks. I want to discuss asset ratios in relation to wealth building in more detail, because it’s one of the key tools that a wealth builder should have in their toolbox.
23. When the Dow:gold ratio declined from above 40 to 8, a lot of analysts brought up the theory that gold bull markets end with a Dow:gold ratio of 1:1. In contrast, I argued that when a major asset class falls from above 40 to 8, it needs to be bought systematically. The Chindian love trade has essentially destroyed the Dow:gold indicator’s relevance to gold investing. After touching about 6:1 at the recent lows, the current Dow:gold ratio is currently at about 15:1, the time to sell a bit of gold and buy the Dow is gone. The new major wealth building opportunity is showcased on the GDXJ-T-bond ratio chart. Please click here now. That’s another look at the GDXJ:T-bond ratio chart, using monthly bars.
24. I’m looking for two things to send both junior and senior gold stocks soaring against T-bonds, and if they soar against T-bonds, I think they’ll soar against everything. First, I’m looking for a crossover buy signal of the 5,15 moving averages on that GDXJ chart. Second, I’m looking for a great US jobs report to stun mainstream media, and cause a rally in gold prices due to money manager concerns about inflation. The next jobs report comes out this Friday.Whether this is “the big one” or not is unknown, but all serious gold stock investors should have more confidence in their holdings now, than at any point in the history of gold stocks!
Stewart Thomson of Graceland Updates, Guest Contributor to MiningFeeds.com
The U.S. dollar is currently at a five-year high against other major currencies. Meanwhile, the roughly $1,200 per ounce price of gold is one-third of what it was in 2011. Even as things that normally cause the price of gold to rise are occurring, due to the strength of the dollar they seem to be having little effect on U.S. gold markets. Factors like loose monetary policy, high rates of currency printing, 0% short and long-term interest rates, rising debt and debt ratios in the public and private sectors are not raising the price of gold as in years past.
The main factors that affect gold prices in the short term are inflation expectations, interest rates, liquidity, and the U.S. dollar. When it comes down to it, the strength of the U.S. dollar is the factor that is currently having the greatest effect on the price of gold. There are several other forces putting downward pressure on the price of gold, including the expectation that the U.S. Federal Reserve will soon begin raising interest rates. Most estimates are forecasting this to begin occurring in June. This is keeping gold prices low because higher interest rates increase the cost of holding assets that don’t bear interest. In turn, low interest rates cut the opportunity cost of holding gold.
Some analysts are warning that if the price of gold doesn’t rise soon, gold production will fall dramatically, perhaps to levels not seen in over half a century. While investor demand for gold remains low, and most analysts predict this will continue, some others are forecasting an improved climate for gold, and perhaps an end to the bear market in early 2016.
Countries like Russia have tripled their gold holdings since 2005, though this is mostly due to political reasons and their avoiding the U.S. dollar. India, the world’s largest gold consumers, removed import restrictions last year, and are continuing to buy up gold in droves, mostly in the retail sector.
Stock traders have been wary of gold as an investment for a while, in part because the bear market gold has been experiencing has been longer than average. Commodity traders are now closely watching the price of gold and the strength of the U.S. dollar. Kavan Klein is the founder of Trade with Kavan, an interactive stock trading platform. Besides advising his Trade with Kavan members on how to successfully trade stocks, he is also an investor who recommends keeping an eye on gold. “Along with the strength of the dollar, I’ll be watching the price of gold closely throughout the year, especially during the fourth quarter,” Klein comments, “and in 2016 I’ll hope to be getting back into supporting gold.”
Economic forecasts seem to support his position, as analysts are predicting that the strong U.S. dollar will cause U.S. economic growth to slow. Klein explains that, since gold as an investment is a hedge against economic weakness, it is expected that increased interest in gold will serve to drive the price up in the coming year or two.
The strong dollar makes U.S. goods more expensive relative to other goods, and because the dollar is so strong right now compared to weaker currencies, multinational companies based out of the U.S. are essentially selling their goods at a discount overseas. Goldman Sachs is recommending traders focus on U.S. stocks with high proportions of domestic sales, as multinational conglomerates like McDonald’s and Coca-Cola have been negatively affected by the strength of the dollar. The euro is expected to drop even further over the next year or two, which doesn’t improve the outlook for multinationals, and means the dollar could stay relatively strong.

As Trade with Kavan’s Kavan Klein adds, since gold and other precious metals are trading at bear market levels, they do offer a great opportunity for investors who have patience and are looking for long-term investments. Because gold prices are measured in U.S. dollars, the price of gold rises as the strength of the dollar falls, and vice versa. Kavan recommends that investors looking for long-term gains buy up gold at the current bear market levels, but for those looking for shorter-term gains, stick to Goldman’s recommendation and focus on U.S. companies with mostly domestic sales.
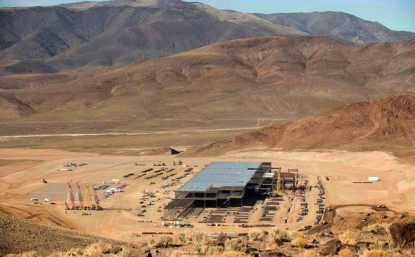
Lithium Ion batteries aren’t just for cars and mobile computing. For months, I highlighted the growing use of lithium-ion batteries for energy storage solutions. Tesla Motors (TSLA) known for making top notch electric cars is making a major move into building battery systems aimed at residences, commercial buildings and for power companies.
These batteries could provide the answer for intermittent energy sources like sun or wind which is dependent on the weather. Solar or wind is great but what happens when the sun goes down or the wind isn’t blowing. Tesla believes they can provide the solution through rechargeable lithium ion batteries that can be placed in homes or businesses storing energy and providing stability for intermittent renewable sources. Tesla has spent millions of dollars in battery research for their electric cars, now management believes that they can use that technology outside of the automobile sector.
Last night, Tesla announced the Powerwall, derived from the batteries used in the Model S car that can be bought for $3,500. The batteries are connected from one’s residence to Tesla through the web in case power goes out.
Tesla is showing the world that their ambitious battery technology research could be disruptive across many sectors including the auto and energy space. Tesla Motors could be soon known as Tesla Solutions, not only disrupting the car industry but completely changing homes, businesses and utilities.
Many investors ask me have they missed the boat when it comes to the battery sector. I believe the market is still in its stage of infancy and should ramp up quickly once the $5 billion battery plant aka “GigaFactory”, is built near Reno, Nevada. Below is a recent photo of the beginning of the construction in the middle of the Nevada desert.
Tesla believes that this large factory could bring down the cost of the lithium ion battery packs to make it more affordable for the average consumer. Its hard to compete with Tesla (TSLA) and that is why it is such a high price stock. So where does the real opportunity lie? The real question is where will the raw material needed for these Tesla batteries come from? Does Tesla have any off-take arrangements yet?
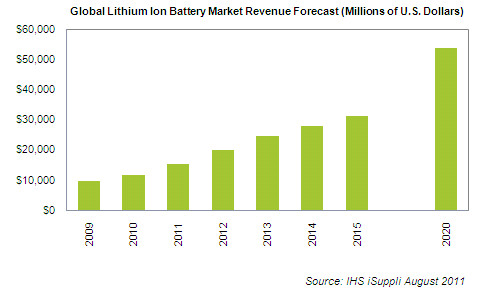
To my knowledge I have not heard any deals between the giant Tesla company and the small junior lithium and graphite miners trading at miniscule valuations. I expect that to change in the near term as junior lithium and graphite companies receive capital for development from deep pocketed end users such as Tesla and Samsung.
Major investment interest for the junior lithium and graphite miners as battery makers look to secure supply of the raw materials needed to make a battery work. Demand could double over the next decade for these batteries. What junior lithium and graphite miners should you consider?
In the lithium sector, my only holding over the past couple of years has been Western Lithium. For years I have told you that Western Lithium (WLC.TO or WLCDF) could be the major source of lithium for the electric batteries used in cars and smart grids. Western Lithium owns the Kings Valley Lithium Deposit in northern Nevada which is one of the largest assets in the world of this critical resource.
Western Lithium recently released an important development on the lithium processing. They produced 99.8% high quality lithium carbonate in the first trial run at its demonstration plant. This could cause major interest from potential strategic partners who have already expressed interest to partner with the company to accelerate development of the asset. These end users need a domestic and secure supply.
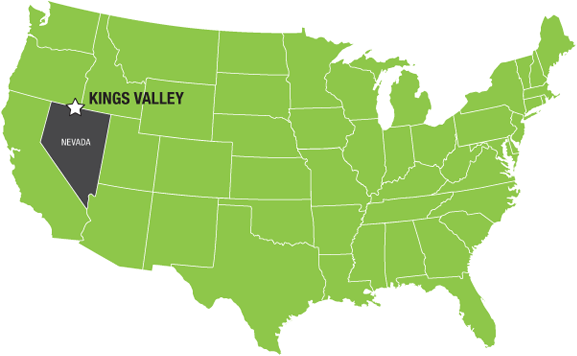
Western Lithium’s CEO Jay Chmelauskas said, “…The lithium market now appears ready for Western Lithium to accelerate the development of its Nevada lithium deposit as a new major supply source. Nevada is emerging as the world’s largest lithium battery manufacturing center and provides potential synergies for Western Lithium to establish its business locally and to become integrated with the global battery supply chain.”
See the full news release on the lithium carbonate produced at their demo plant by clicking here…
The chart on Western Lithium is excellent over the past two years and appears to be forming a classic bullish flag. Another round of accumulation like we saw in 2014 could be on the agenda. The base is almost one year in the making. The stock is just beginning to come off the bottom of the flag and breaking over the 200 day moving average. Look for a golden crossover of the 50 and 200 day moving average to confirm the next move higher. The recent breakout at $.60 could mean the consolidation over the past six months is over.
In graphite, I have been accumulating Graphite One (GPH.V or GPHOF) who owns the largest published graphite resource in the United States.
Watch Graphite One (GPH.V or GPHOF) in Alaska who just released an updated mineral resource estimate of an indicated 17.95 million tonnes of 6.3% graphitic carbon (Cg) and 154.36 Million tonnes of 5.7% Cg. This news makes Graphite One the largest published graphite resource in the United States. The grade improved considerably and so did the indicated resource. There is high grade graphite at the surface and the deposit remains open. Graphite One is planning to use this resource to publish a maiden NI 43-101 Preliminary Economic Assessment on the Graphite Creek Deposit. See the full resource estimate news release byclicking here.
I became interested in their Graphite Creek Project near Nome, Alaska. Alaska is financially supportive of mining and with the case in other junior developers has pledged to finance the infrastructure capital expenses.
Investors can purchase Graphite One near all time lows and get it near the cheapest prices to date. They have put a lot of work into potentially one of the biggest large flake graphite deposits in North America which is amenable to low cost open pit scenarios. Look for a breakout above the downtrend on GPHOF at $.08.
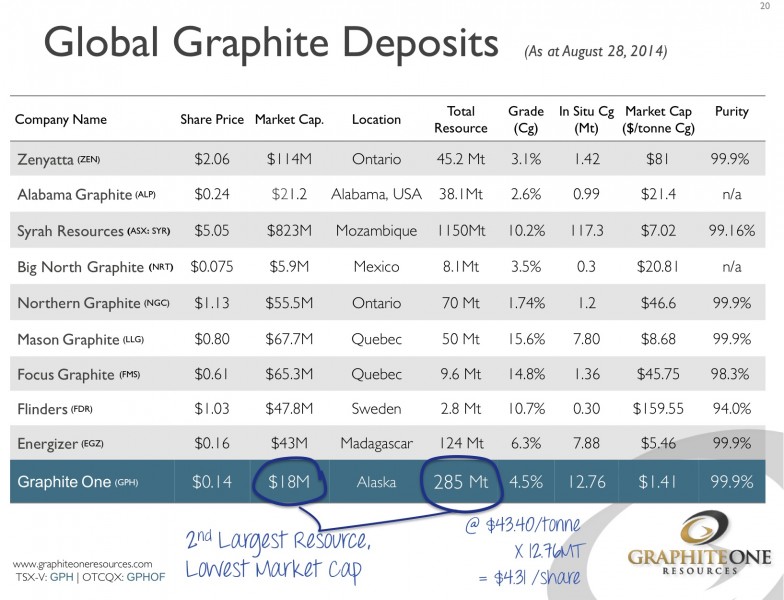
Graphite One just announced that they received a report on the distinguishing features of their large flake graphite which could have a positive impact on the upcoming PEA. Significant research will need to be followed up to confirm these findings on the graphite which included that “naturally occurring graphite in the shape of spheres and close to the size ranges of interest for lithium ion battery-grade graphite was seen in all drill-hole concentrate samples…As this may impact the strategic direction of the Company, Graphite One is now assessing the Stage B Report to determine the next steps in incorporating the results into the PEA.” See the full news release on these findings by clicking here…
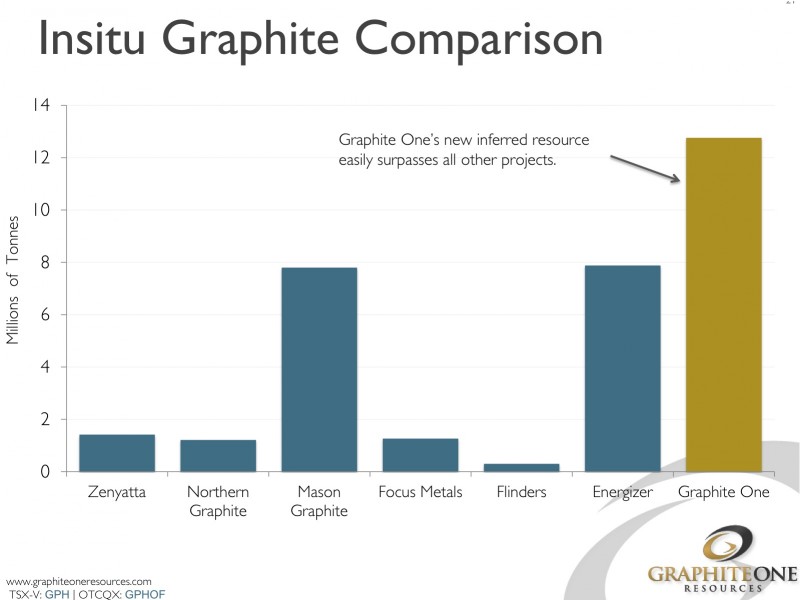
Graphite One may be undervalued as it owns the 2nd largest resource in its peer group yet has a ridiculously low market cap located in the US which sources all of its graphite supplies from foreigners.
In conclusion, Tesla (TSLA) is building a $5 billion battery factory in Nevada as they see huge growth. They must secure the raw materials specifically lithium and graphite. Undervalued mining equities may soon see injections of capital for secured off-take of the materials in the near term.
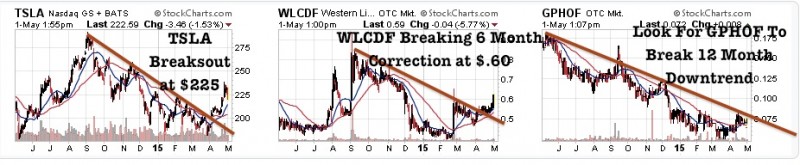
Disclosure: I own Western Lithium and Graphite One. Graphite One is a current website sponsor, Western Lithium was a website sponsor. Please do your own due diligence as conflicts of interest apply. This is not a recommendation to buy or sell any securities.

Testing for extension and continuity of historical high-grade.
In the last ten years, new discoveries in the gold mining industry have been declining. So far this year, explorers are nowhere near matching the 89 million ounces of gold produced in 2014. There’s never been a greater need for junior companies to find new deposits and sell them to majors, despite what their shaky share prices are telling you.
Redstar Gold Corp (RGC-TSXV) is a re-organized venture-stage explorer that’s trying to cash in on the global mining industry’s never-ending appetite for large and high margin deposits. With a roughly $7.2 million market cap, Redstar has about $1.4 million in cash (March 2015 corporate presentation), and is 48% owned by institutional investors.
The company has gold projects in Alaska, Ontario and Nevada, but its focus is the high-grade Unga gold project in Alaska’s Aleutian islands.
Unga Island was home to Alaska’s first gold mine, the Apollo Sitka mine, which produced about 150,000 ounces of gold with an estimated grade of 10 g/t Au* between 1886 and 1922. Note these are historical and not 43-101 compliant figures.
A few junior companies have explored it since and turned up some very impressive, high-grade, near surface intercepts, including:
- 29.65 m of 14.98 g/t gold and 11.5 g/t silver (Redstar hole 11SH010);
- 4.0 m of 11.70 g/t gold and 10.2 g/t silver (Redstar hole 11SH009;);
- 1.0 m of 43.90 g/t gold and 18.5 g/t silver (Redstar hole 11SH007).
This morning, Redstar announced the commencement of a 1450 metre drill program at Unga. They’re targeting the Shumagin gold zone, part of the Shumagin Trend, which extends ten kilometres and parallels the ten kilometre long Apollo-Sitka Trend, three kilometres to the south.
The drill program is testing for continuity and expansion of the known high-grade mineralization within the Shumagin gold zone along strike and at depth.
Over 1700 soil and rock chip samples were collected at Unga in 2014, which along with a re-interpretation of previous exploration results, are guiding the current program.
Redstar has a management team and board of directors with considerable mining experience for such a small company.
Jesse Grady, B.Sc., M.Sc is an Alaskan-native and Vice President of Exploration at Redstar. He is at Unga Island overseeing the drilling.
Ken Booth is the Interim President and CEO at Redstar. Mr. Booth is an experienced geologist, investment banker and mining entrepreneur from Vancouver, Canada.
Mr. Booth told CEO.CA last month that he intends to stay in the interim CEO role until the company is well capitalized to explore Unga. He sees the project as a unique high-grade epithermal-style target with district potential that warrants aggressive exploration. The optimistic CEO believes Unga has similarities to Kinross’s Kupol deposit in Russia, one of the world’s largest and most profitable gold mines, despite its remote Northern location.
Jacques Vaillancourt, CFA and Chairman is a veteran UK-based mining investment banker. He’s been involved in natural resources financings and transactions worth $30 billion over his career with leading financial institutions like HSBC, BMO and RBC. Mr. Vaillancourt is the second largest shareholder in Redstar with 25.4 million shares or 15.4% of the company, according to a March 2015 corporate presentation.
Boston’s Geologic Resource Partners is the largest shareholder with 28.3 million shares, representing 15.7% of the company.
Here are Redstar’s objectives at Unga from the March 2015 presentation:
- Expand & extend known mineralised zones
- Discover new zones along both trends
- Preliminary NI 43-101 compliant resource in 2015
- Build toward a high grade reserve base
- Leading to Robust Feasibility Study.
And here is a link to today’s drilling news: Redstar Gold Corp. starts drilling it’s 100% owned High Grade Unga Gold Project, Alaska
Follow Redstar Gold #RGC in CEO Chat for the latest updates and visit www.RedStarGold.com for more information. Also consult the company’s profile on www.SEDAR.com to fully understand the risks of investing.
*Redstar cautions Investors that a Qualified person ( within the meaning of NI 43-101) has not done sufficient work to classify these historical estimates of production or resources as current mineral resources and or mineral reserves and should not be relied upon until they have been verified and supported by a compliant NI 43-101 technical report.
Redstar Gold is a CEO.CA sponsor. This article is not a recommendation to buy or sell any security. Always consult a licensed investment advisor before making any investment decisions.
If you would like to receive our free newsletter via email, simply enter your email address below & click subscribe.
 Follow us on Twitter
 Become our facebook fan
CONNECT WITH US
Tweets
Tweet with hash tag #miningfeeds or @miningfeeds and your tweets will be displayed across this site.
MOST ACTIVE MINING STOCKS
Daily Gainers
 CMC Metals Ltd. CMC Metals Ltd. |
CMB.V | +900.00% |
 Eden Energy Ltd Eden Energy Ltd |
EDE.AX | +200.00% |
| GoviEx Uranium Inc. |
GXU.V | +42.86% |
| Eagle Nickel Ltd. |
ENL.AX | +41.67% |
| Citigold Corp. Limited |
CTO.AX | +33.33% |
| Mount Burgess Mining NL |
MTB.AX | +33.33% |
| Exalt Resources Limited |
ERD.AX | +31.94% |
| Casa Minerals Inc. |
CASA.V | +30.00% |
| Cariboo Rose Resources Ltd |
CRB.V | +28.57% |
| Belmont Resources Inc. |
BEA.V | +28.57% |


