
Gold and silver are languishing near major lows, trudging through the barren sentiment wasteland of the summer doldrums. The major factor behind this weakness is extreme shorting by American futures speculators. But their heavily-bearish bets are actually very bullish for both precious metals. Not only do these traders as a herd always bet wrong at price extremes, their shorts are guaranteed near-future buying.
American futures speculators’ trading has utterly dominated gold and silver price action in recent years. This single group of traders doesn’t normally wield such outsized influence. But with Western investors largely missing in action since early 2013, futures speculators have gone unchallenged. Couple this with the extreme leverage inherent in futures trading, and its stranglehold on gold and silver prices is ironclad.
This vexing anomaly started when the Federal Reserve’s third quantitative-easing campaign spun up to full speed in early 2013. Unlike QE1 and QE2, QE3 was open-ended with no predetermined size or end date. The Fed deftly used this to its advantage, working overtime to convince traders that it would ramp up QE3 to arrest any material stock-market selloff. They came to believe the Fed was backstopping stock markets!
So traders were quick to buy every minor selloff, forcing the stock markets inexorably higher. Traders started to abandon everything else to chase these extraordinary Fed-levitated stock markets. They forgot about prudent portfolio diversification, and shunned alternative investments led by gold. So it suffered its biggest quarterly plunge in 93 years in Q2’13, as American stock traders jettisoned GLD gold-ETF shares.
That once-in-a-century hellstorm was so brutal that the vast majority of Western investors have yet to return to gold. They remain radically underinvested in this essential portfolio diversifier, one of very few assets that moves contrary to stock markets. And without normal investment demand, American futures speculators have had free reign to effectively hold precious-metals prices hostage to their bearish psychology.
This epic Fed-spawned anomaly has created a quandary for contrarian commentators like me. The small fraction of investors and speculators still interested in gold and silver these days want to hear about fundamentals like Chinese and Indian demand, traditional drivers. But in today’s unprecedented environment, all that matters for price action beyond ETF capital flows is American futures speculators’ trading.
When they buy gold and silver futures, the precious metals’ prices rise. When they sell, gold and silver fall. The correlation between recent years’ price action and American futures speculators’ holdings is incredibly high. While I can’t wait for this anomalous dominance to fade again as investment demand finally normalizes, today it remains the overwhelmingly-controlling driver of gold and silver price action.
This is crystal-clear when charted. American speculators’ total positions in long and short gold-futures contracts are published once a week by the US government’s Commodity Futures Trading Commission in its famous Commitments of Traders reports. And when gold and silver prices are superimposed on this futures-holdings data, the results are striking. All contrarians have to understand this stranglehold on prices.

This chart may look complex, but it’s quite simple. Humorously, a Polish university professor in South Korea has been trying to get a previous iteration of this chart accepted by Wikipedia as its “busy graph” example! All it shows is the daily gold price in blue overlaid on the weekly CoT futures-positions data. American speculators’ total long positions in gold futures are shown in green, and their total shorts in red.
Finally the yellow series shows the total deviation of these holdings from their average levels between 2009 to 2012. Those were the last normal years before the Fed’s wildly-unprecedented QE3 campaign radically distorted the global markets. But our focus today is on the strong inverse correlation between the gold price and American speculators’ gold-futures short positions. They have become gold’s entire story.
Whenever this single dominant group of traders has significantly ramped their leveraged downside bets on gold, this metal’s price has fallen. And then as soon as these guys hit selling exhaustion and their shorting peaks, gold bottoms. The light-red vertical bars above mark major peaks in speculators’ gold-futures short selling, and they closely match gold’s major bottoms. The only reason it’s not exact is data resolution.
American speculators are actively trading gold futures every day the markets are open, yet the CoT only reports their positions once a week. But near major reversals in gold’s fortunes, futures trading becomes fast and furious within CoT weeks. So the apparent precision of gold-futures shorting in driving gold’s price action of recent years is obscured. In this information age, the CFTC really ought to release daily CoT reports.
The extreme shorting of recent years began in early 2013 as the Fed ramped QE3 to full steam. While that particular once-in-a-century gold plummet in Q2’13 was also driven by extreme gold-ETF selling by American stock traders, futures shorting played a majority role. That quarter’s GLD liquidations soared to an epic record 251.8 metric tons of gold! But even that colossal sum was actually exceeded by futures dumping.
In that same quarterly deluge of torrential gold selling, American speculators liquidated 58.8k gold-futures long contracts while adding 76.9k short contracts. Since each contract controls 100 troy ounces of gold, this equates to 183.0t and 239.1t respectively. So the 422.1t of gold supply spewed into the markets by futures speculators in that climactic gold-selling quarter dwarfed the monster selling pouring in via GLD!
By the time the dust settled in mid-2013, American speculators had ballooned their total gold-futures shorts to an astounding 178.9k contracts! That was the highest level witnessed since at least 1999, the extent of our historical CoT data. And it was very likely an all-time record. Gold bottomed right as these traders’ bearish downside bets in this metal peaked. And then a massive short-covering rally ensued.
Shorting anything in the futures markets is extraordinarily risky due to their inherent extreme leverage. In the stock markets, leverage has been legally limited to 2 to 1 since 1974. The Fed instituted that 50% margin rule in response to a near-panic in the US stock markets, and it’s never been changed. But in the futures world, normal limits don’t apply. These speculators can run leverage that is quite frankly crazy.
This week with gold trading near $1175, the minimum maintenance margin required to hold a single gold-futures contract is just $3750. But each contract controls 100 ounces of gold worth $117,500. That means futures speculators can run leverage up to an absurd 31.3x! 31 to 1 is enormous beyond belief, giving the capital these traders risk a radically-disproportionate and totally unfair impact on the gold price.
Every single dollar bet on gold futures by American speculators has the same impact as up to $31 in the underlying physical gold market or up to $15 in the gold ETFs! So it’s no wonder futures trading has utterly dominated gold in recent years, especially with Western investors largely abandoning alternative investments. But such extreme leverage leaves little margin for error, as losses can mount at dizzying speeds.
When the gold price moves against a fully-leveraged futures speculator’s bet, their entire capital risked can literally be wiped out within days. At 31.3x, a mere 3.2% adverse move in gold would devour 100% of the money bet on that contract. And a total loss isn’t even the worst of it. If traders can’t exit their trades quick enough, they are subject to margin calls requiring them to immediately deploy even more capital.
So once short covering gets underway, this process quickly feeds on itself and accelerates. In futures markets, the only way to close a short contract is to buy a long contract to offset it. And the upside price impact of buying longs to close shorts or buying new longs is identical. So the more speculators who rush to cover their shorts, the faster gold’s price rallies. The quicker it surges, the more it forces others to cover too.
Thus American futures speculators’ short covering fuels sharp rallies in gold. After growing their shorts to record highs in mid-2013, this perpetually-wrong-at-price-extremes group of traders covered 95.3k contracts in 16 weeks. That was the equivalent of 296.4t of buying, and it catapulted the gold price 18.2% higher in less than 9 weeks leading into the autumn of 2013. Extreme gold-futures shorts are very bullish!
But with investors still missing in action in late 2013 as the US stock markets continued levitating, American futures speculators couldn’t resist returning to their bearish ways. They effectively borrowed and sold gold futures aggressively, catapulting their total downside bets back up to 150.0k contracts. That turned out to be a super-important level, defining major overhead resistance for gold-futures shorts.
But selling exhaustion was reached even as gold plumbed new lows below mid-2013’s. And once the futures speculators are done selling gold, it quickly surges higher since that fierce supply headwind vanishes. So they bought to cover 72.3k contracts over 15 weeks leading into early 2014, which helped propel gold 16.2% higher in about 11 weeks. Are you starting to see the pattern here? It’s very relevant today.
Covering short positions is not optional for futures speculators. They borrowed gold futures that they did not own, sold them, and are legally obligated to soon repurchase these gold futures to repay these debts. So extreme gold-futures shorts held by speculators is guaranteed near-future buying for the gold market. Self-feeding short covering all alone is actually all that’s necessary to rapidly catapult gold higher.
This trend continued last year, with this group of traders waxing super-bearish and ramping their shorts. But they soon hit selling exhaustion, reaching their limits for making hyper-risky downside bets against a deeply-out-of-favor asset that refuses to tumble significantly lower. So they soon rush to cover and the resulting gold-futures buying rapidly pushes the metal higher again. These sentiment-driven cycles are common.
Even in this grossly-distorted QE3 era thanks to this uber-dovish inflationist Fed, speculators’ total gold-futures shorts have carved a very-definite trading range. Their zeal for shorting gold futures dwindles whenever their total short contracts near 150k, regardless of gold’s price level. And then they soon scramble to cover, buying enough long contracts to push shorts back down near their 75k lower support level.
Provocatively in the latest CoT week’s data available before this essay was published, speculators’ total gold-futures shorts ballooned to 148.3k contracts. That is right at the 150k resistance that has proven so bullish in recent years! This implies major short covering is coming soon. And once this process gets started, it rarely stops until these traders’ total short holdings are driven back down to their 75k support.
That will require an incredible 73.3k contracts of short covering alone, the equivalent of 228.1t of gold buying! And a range of catalysts could spark it anytime. With gold’s seasonals bottoming right now, we are on the verge of this metal’s major seasonal rallies driven by various demand surges in late summer, autumn, and winter. Seasonal tendencies shifting from very weak to very strong alone could spark short covering.
Plenty of other potential gold-buying catalysts exist too. The lofty Fed-inflated US stock markets are on the verge of rolling over decisively as the threat of imminent rate hikes looms. The euphoric US dollar that has kept a lid on gold investment demand is weakening. The Greece nightmare could hammer the European stock markets anytime, and the popular speculative mania in the Chinese stock markets is failing.
Regardless of the triggering catalyst, with speculators’ gold-futures shorts so extreme today serious short covering is imminent. And that is going to propel gold dramatically higher. In the 3 prior times these traders’ total gold-futures shorts challenged or exceeded 150k contracts in recent years, gold powered higher an average of 16.2% in just 10 weeks! And that was even with the stock markets still levitating.
Apply this merely-average gold-short-covering rally to this metal’s price as of its latest CoT report, and we would be looking at $1375 gold by its next major seasonal peak in early October! And that is so much higher than today’s dismal levels that it will probably even motivate Western investors to start returning. I suspect that process has already begun, as gold-futures shorting is losing its efficacy in battering gold lower.
Despite speculators’ downside gold-futures bets nearing 150k resistance twice this year, extreme levels by any measure, gold has not fallen significantly this quarter. When taking on such hyper-dangerous leverage, speculators need to quickly see profits on their trades. Their increasing inability to force gold lower is going to make them nervous, as they have to start wondering if super-cheap gold warrants selling low.
And contrary to the totally-false popular belief today, the Fed’s coming rate hikes are no threat for gold. Yes gold yields nothing, but rising-rate environments are very damaging to stocks and bonds. So when the Fed hikes rates, investors tend to flock back to alternative investments led by gold. Since this hard historical truth is absolutely essential for contrarians to understand, I’ve written important essays exploring it.
During the Fed’s last rate-hike cycle from June 2004 to June 2006, it more than quintupled its Federal Funds Rate to 5.25%. Yet over the exact span of those rate hikes, gold blasted 50% higher! A similar gain from this week’s levels would catapult gold well over $1750. And that’s not farfetched. In all of 2012 before the Fed’s gross QE3 distortions began, gold averaged about $1675. It will certainly mean revert back up.
And the last time the Fed was forced to seriously hike rates to atone for excessive easing was in the 1970s. It raised its FFR from 3.5% in early 1971 to an astounding 20.0% by early 1980! Yet gold didn’t collapse as yields soared as naive analysts argue today, it skyrocketed an epic 24.3x higher on surging Western investment demand! Rate hikes are very bullish for gold since they are so damaging to lofty stock markets.
Provocatively the situation in American speculators’ downside bets on silver is even more extreme than gold’s! While silver is driven by gold, it too is on the verge of a major frenzy of short covering. This next chart reveals the same CoT data for silver, and it is dazzlingly bullish. So when the inevitable next gold-futures short-covering spree gets underway, this same fast-buying phenomenon will also ignite in silver.
According to the latest CoT data, American speculators’ silver-futures shorts have soared way back up to 66.4k contracts. That is nosebleed high, not far below their all-time record peak of 70.0k contracts back in early November 2014. Incredibly in the last two CoT weeks alone, this group of traders grew so bearish that they ramped their silver-futures shorts by a breathtaking 132% or 37.7k contracts! Talk about extreme selling.

Yet silver barely budged, which is a big warning sign to these futures speculators that their leveraged downside bets are far riskier than they thought. In order to return their current extreme shorts back down to support near 27k contracts, they are going to have to buy to cover around 39.4k contracts. Since each contract controls 5000 troy ounces of silver, that is the equivalent of a staggering 196.8m ounces of buying!
So once gold starts moving decisively higher on short covering, the speculators heavily short silver will be forced to cover too. Since the extreme shorting in both precious metals represents legally-mandated guaranteed near-future buying, the coming months ought to see major rallies in this deeply-out-of-favor sector. Contrarian traders smart, courageous, and foresighted enough to buy ahead of the crowd will reap big gains.
The coming short-covering-fueled gold and silver rallies can be played in the metals themselves or their leading ETFs. These are of course the GLD SPDR Gold Shares and the SLV iShares Silver Trust. But these precious-metals gains should be really amplified by the left-for-dead stocks of their best miners and explorers. No other sector in all the stock markets has greater potential for monster gains in the coming years!
At Zeal we’re veteran contrarians specializing in this realm, and we have been aggressively adding trades in outstanding gold and silver stocks in recent months. These companies are doing fine despite the super-low metals prices, and will see their profits and stock prices soar as gold and silver inevitably mean revert much higher. Now is the time to get deployed, not later after the coming gains have largely been won.
We’ve long published acclaimed weekly and monthly newsletters for contrarian speculators and investors. They draw on our exceptional market experience, knowledge, and wisdom forged over decades to explain what’s going on in the markets, why, and how to trade them with specific stocks. Since 2001, all 700 stock trades recommended in our newsletters have averaged annualized realized gains of +21.3%! Subscribe today before the gold and silver short covering starts, and save 33% off regular prices!
The bottom line is American speculators’ short selling in gold and silver futures has reached extremes in recent weeks. This single group of traders commands a wildly-disproportionate impact on prices due to the absence of investors and outsized leverage inherent in futures trading. But extreme shorting is a very bullish indicator, as offsetting long futures contracts must soon be bought to cover these excessive shorts.
Even in the recent years grossly distorted by the Fed, major short-covering rallies have erupted in the precious metals from speculators’ same extreme short levels as today’s. Taking up to several months to unfold, these short-covering frenzies lead to double-digit-percentage gains in gold and silver prices. And there’s a great chance these coming rallies will grow much bigger as the stock markets start rolling over.
I, Peter Epstein, CFA, MBA have no prior or existing relationship with Pershing Gold (PGLCD) or any company mentioned herein. Readers should be aware that an investment in Pershing Gold is a speculative one. Readers should consult with their own investment advisors before buying or selling any speculative stock. I, Peter Epstein, own no shares of Pershing Gold at this time. I have owned shares in the past and might buy shares in the future.
Nevada’s Past Producing Pershing Gold, Pouring Gold Next Year, Up-Listed to NASDAQ, New Resource Reports Imminent, Economic Study by Year End
Pershing Gold (PGLCD) has had its fair share of skeptics. I hope that skeptics are falling silent. Why? Look no further than the demise of Allied Nevada and Midway Gold (MDW). By no means did I forecast that either would fail. However, with 20/20 hindsight, each relied to heavily on debt or debt-like capital. As a reminder, Pershing Gold has no debt. Midway and Allied Nevada have larger resource endowments than Pershing, growing their ounces in lock step with their debt. Little good it did them in the end. I’ve said in the past that Pershing continues to take measured, prudent steps towards production. Naysayers took this to mean that the company was moving to slowly. I disagree.
Critics conveniently ignore the fact that gold was near ~$1,800/oz in early 2013, fell to ~$1,225/oz within 6-7 months, rebounded briefly to ~$1,400/oz and dropped to the $1,200/oz range. Instead of moving too slow, Pershing stepped back its exploration and development pace, leaving under-valued ounces in the ground. An internal economic scoping study this year with details of proposed production, costs, life-of-mine metrics, NAV, etc., the recently completed uplifting to NASDAQ and production next year should revitalize investor interest. The pudding from which the proof will be found is in the oven.
To be clear, I don’t mean to pick on Allied Nevada or Midway. Others that have struggled mightily. For example, Nevada Sunrise Gold (NEV.V) is down 81% from its 52-week high. [I own a modest number of Nevada Sunrise shares due to an analyst I respect recommending it]. Canamex Resources (CAC.V) has an option to acquire up to a 75% interest in the Nevada Bruner Gold project located in Nye County, Nevada. That stock has lost 78% of its value. I could list more fallen angles, but why kick Nevada dogs when their down?
Pershing Gold’s key assets, the past producing Relief Canyon Mine and its 100% owned processing facility, includes three open-pit mines, roads and power. The company’s state-of-the-art, fully permitted and operational heap leach facility would probably cost $30-$40 million to replace and several years to permit. The plant has the capacity to process gold bearing solutions from the leaching of 8 million tons of ore per year and is permitted to stack 21 million tons. The facility is ideally situated to process ore from Relief Canyon and potential discoveries of satellite deposits on Pershing’s 25,000+ acre property.
Pershing’s processing facility and existing infrastructure suggests both low remaining cap-ex and a shorter timeline to production. Not to state the obvious, but as Pershing’s management says, the three easiest ways to achieve a higher valuation are near-term production, a growing resource and high leverage to the price of gold. Not only does Pershing have no debt, it has no streaming or royalties encumbering its flagship Relief Canyon Mine and no hedging of the gold price.
Importance of Pershing’s Growing Ounces to be Replaced With Key Operating Metrics as the Valuation Driver vs. Peer Producers
Speaking of growing resources, not only is the number of ounces increasing, but the weighted average grade is improving as well. For those not paying close attention to recent drill results, suffice it to say that the grades in each set of reported assays has been getting better and better. That’s no stroke of luck, but the work of one of the best development teams in Nevada. Notice that I haven’t mentioned the name Steve Alfers? Relief Canyon is taking on a greater importance, carrying its own weight. Don’t get me wrong, Alfers and two key financial backers got us this far, but Relief Canyon is poised to steal the limelight.
Long-term and prospective investors alike should review Pershing Gold’s new corporate presentation. It has been updated and enhanced significantly since I last wrote about the company. Pershing expects an upgraded resource report in a few weeks and another one within about six months. By then, the combined NI 43-101 compliant Measured, Indicted & Inferred resource should be in excess of 1 million ounces, most of which should be in the Measured & Indicated categories. A knock against Pershing has been a sub 1 million ounce resource. Once past 1 million ounces, detractors should move on to other gold companies. More important in my mind is that 1 million + ounces supports many years of production at an initial run-rate of 50k oz/year, growing over time to 80k oz/year.
Cash flow from initial years could be used to self-fund additional drilling at Relief Canyon and searching for discoveries elsewhere on Pershing’s property. The number of delineated ounces is rapidly becoming less crucial as a valuation benchmark. Once in production, Pershing will be compared on operating metrics, all-in costs, margins and production volumes, coming out of low-risk Nevada, to peer small and mid-tier producers globally.
Finally, I point to the silver and gold colored Elephant in the room. Rarely is much ink spilled on the topic of Coeur Mining (CDE) possibly acquiring Pershing Gold, but I continue to believe it makes sense. Now that the Paramount Gold & Silver acquisition is largely out of the way, Coeur should be (in my opinion) looking at its closest neighbor. Coeur can afford to outbid others because of the synergies the combined company would be able to achieve. Perhaps Coeur is waiting for production to start? If so, the acquisition price will only move higher. Coeur has done a commendable job at righting its ship. The stock price is up 71% from its low and debt is down modestly. If Coeur waits too long, it could face find itself in competition as the existing list of potential suitors is getting larger.
Is Pershing Gold’s (PGLCD) stock a triple from here? No. A double? Perhaps, depending on progress made and takeover interest over the next 6-12 months. Is the company going to fall off a cliff without a net, parachute or bungee cord? Not a chance. Unlike Midway and Allied Nevada, Pershing Gold retains considerable upside (with no debt) with minimal fundamental downside. I like the risk reward of that proposition.

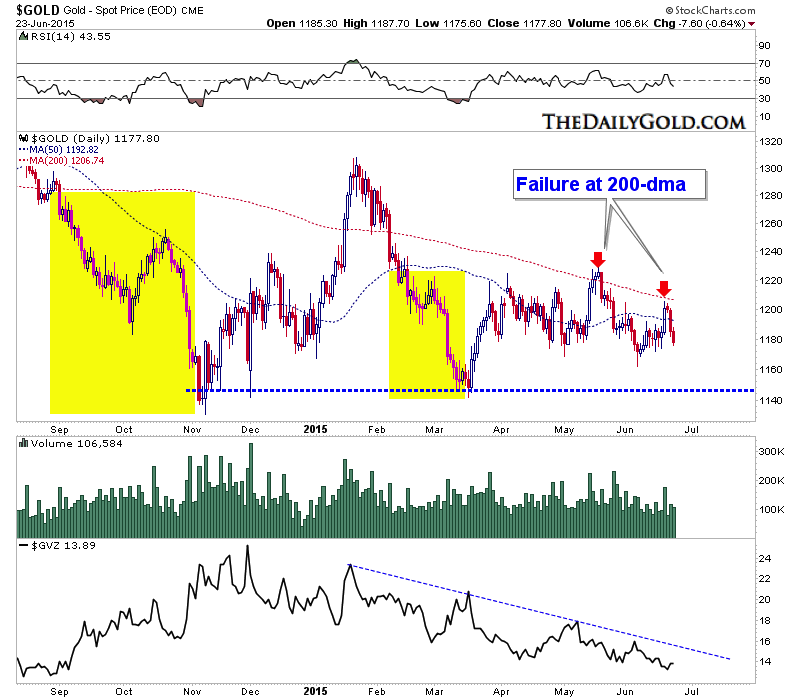
Gold and Silver rebounded following the Fed minutes released last Wednesday. However, one week later both metals are back below pre-Fed levels and moving dangerously close to important support. Silver fell 2% on Tuesday to $15.81/oz, which is only 2.2% above its lowest weekly close of $15.46 which occurred seven months ago. Meanwhile, Gold closed at $1177/oz, which is only $20/oz from its lowest weekly close. In short, precious metals are flashing code red as a breakdown could begin in the next few weeks.
Gold has held in over the past few months but its recent price action suggests trouble is ahead. Take a look at the daily chart below. Gold has failed twice in the past five weeks at its 200-day moving average. First at $1220 and a few days ago at $1207. Gold is now trading below its 50-day and 200-day moving averages and both are sloping down. We highlight the last two times Gold traded below both moving averages. A previous case was in 2015 right before Gold crashed below $1500/oz.
I’m hearing from some that sentiment is too negative and the bear has gone on too long for Gold to breakdown. The problem with that is the data argues otherwise.
We plot a weekly line chart of Gold and we include its volatility index ($GVZ) as well as the net speculative position (bottom). Gold’s volatility peaked above 60 during its 2008 bottom and above 30 at its June 2013 low. At present its near multi-year lows. Meanwhile, the net speculative position which fell to 5% and 6% during 2013 was last at 18%. There are still speculators in the market who can sell and drive Gold lower.
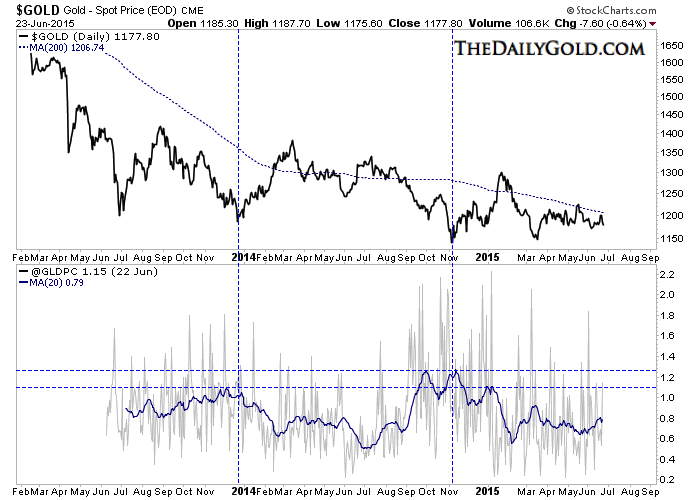
Staying with sentiment, we recently collected all global put-call data for GLD, SLV, GDX and GDXJ. Its another data point we provide to subscribers. We plot Gold and GLD put-call data (smoothed with a 20-day moving average) in the chart below. No indicator is perfect but lows in Gold have corresponded closely with peaks in the 20-dma. The 20-dma has started to rise but remains quite a distance from those previous peaks.
Simply put, the price action in Gold is very bearish and current sentiment (not big picture sentiment) is nowhere near an extreme. This is potentially a very dangerous time for gold and silver bulls. At somepoint (perhaps in a few months), the switch will flip and we could have some epic buying opportunities in the precious metals complex. We are positioned to take advantage of this decline so that we can take advantage of those future opportunities

1. I realize that most analysts in the gold community are nervous about gold, and nervous about China’s stock market. In contrast, I think this is the greatest time in history to own both gold and the Chinese stock market.
2. Within a few years, I expect the mantra “Don’t fight the Fed” to be about as important as a rotary phone. I’m not predicting that the Fed will fail as an entity, but the new mantra of global money managers will be “Don’t fight Beijing”.
3. Please click here now. Chinese A-shares are widely followed by amateur analysts. The H-share market is dominated by professional investors, analysts, and major money managers. H-shares are Chinese companies that trade on the Hong Kong market, and that’s my focus.
4. Chinese financial shares are not overvalued. They are undervalued and I would describe them as a “roaring buy”. Globally, the financial sector has a P/E ratio of more than 15. In China, it’s less than 8.
5. Please click here now. That’s a snapshot of President Xi Jinping. He was apparently born in the “year of the snake”. My suggestion to the gold bears and Chinese stock market bears betting against him is to… cancel their bets.
6. The drivers of higher Chinese stock prices are monetary easing/fiscal stimulus, reform in Beijing, and a structural change in small investor focus from real estate to the stock market.
7. Chinese stocks that are listed in Hong Kong sport an average P/E ratio of about 11. Also, Chinese stock market indexes comprise less than 2% of global indexes. Morgan Stanley creates the biggest indexes, and there are strong rumours that they are going to soon increase China’s share significantly.
8. Institutional money managers would be mandated by the index shuffling to reduce holdings in other markets, and buy China. That could cause a gargantuan surge in Chinese stock prices, and I think most of the Western gold community should be poised to profit, when that happens.
9. I think Beijing wants slower GDP growth, a yuan that becomes a major global reserve currency, and higher stock prices for Chinese and Hong Kong markets.
10. As Chinese citizens and institutions build wealth, they will buy more gold. I’m predicting that within five years, Chinese mining companies will control 70% of the world’s gold production.
11. On that note, please click here now. A week ago, I highlighted this bull wedge pattern, and predicted that an upside breakout was imminent.
12. The breakout occurred, as did a “textbook” pullback. The appearance of the bull wedge isn’t a guarantee of higher prices. It’s simply one of many positive events occurring in the precious metals sector.
13. Western gold community investors should probably decide if they are invested in precious metals to benefit from the next $100 gold price event, or if they are focused on the “bull era” that is unfolding in China and India. My focus is the bull era.
14. Please click here now. That’s the ratio chart of silver versus gold. Gold is the ultimate safe haven for investors when financial system risk is high. Silver is the ultimate asset when inflation rises without posing immediate risk to the financial system.
15. Silver now looks poised to outperform gold in all time frames.
16. Please click here now. That’s a long term US money velocity chart. Velocity has been in a downtrend since about 1995.
17. Silver has generally underperformed gold during that time. There have been periods of outperformance, but that’s been short-lived. It could be argued that M2V has broken its downtrend, and is set to begin a major uptrend.
18. From a fundamental perspective, there’s no question that global wage pressures are building, and rising wages in China could bring inflation to America that is higher than expected.
19. Silver is the asset that will benefit most in this situation. India’s citizens are the world’s largest buyers of both gold and silver. As eager as Chinese citizens are to hold these mighty metals, India’s “titans of ton” spend an average of 400% more of their income on gold and silver, than China’s citizens do!
20. Incredibly, the average wage of hundreds of millions of Indians is only about two US dollars a day. Over the next five years, I expect atenfold change in those wages. The ramifications of that wage price inflation for America, and for the price of silver, needs to be givenserious consideration.
21. The Bank of China has joined the new ICE/LBMA gold fix in London, and Zijin Mining, the largest gold miner in China, has launched an aggressive mine acquisition program in Australia. These facts are much more important than anything that short term timers see on their gold charts.
22. Charts don’t predict fundamentals. Fundamentals make charts, and the gold bears have a choice of learning that the hard way, or the easy way. As a nation, America is more than 200 years old. The sun is setting on the aging empire of the West, and rising in the East. That is creating a bull era for gold and silver enthusiasts around the world!
23. Drawing arrows on the gold and silver charts to prices that many Western analysts appear to fear, is not a professional way to build wealth. Please click here now. That’s the monthly chart for gold. Note the huge support zone created between the late 2009 highs near $1228, and the lows near $1045 in early 2010.
24. The entire price range of $1045 – $1228 is a major accumulation zone for gold. Rather than using questionable tactics to predict whether gold moves a bit higher or lower now, all members of the Western gold community should now be focused on the theme of accumulation, especially for silver!
Stewart Thomson of Graceland Updates, Guest Contributor to MiningFeeds.com

There has been a solid but quiet performer in the commodities sector recently. Flying largely under most investors’ radar is zinc, up 3.9% in 2014. It’s often overlooked because as an “industrial” metal it doesn’t have the same shine as “precious” metals. According to many analysts, zinc is setting up nicely to continue its upward run in value, and at today’s levels offers an interesting option for savvy investors to enjoy potentially substantial returns.
The zinc market demand is currently between 13-14 million tonnes a year, with projected growth of 5% a year. Roughly half of all zinc is used for protecting steel from corrosion (galvanizing). It’s an overlooked but important end use: industry experts estimate that if steel was left unprotected it would cost an industrial country’s economy at least 4% of GDP each year.
About 17% of zinc demand comes from zinc-based alloys that support the die casting industry. From bathroom fixtures and door and window hardware to office equipment and tools as well as automotive and countless electronic components, zinc castings are everywhere.
Zinc Price
The market is already in a supply-demand deficit and has been for the last couple of years. Stockpiles are rapidly declining. In 2014, zinc output lagged consumption by 296,000 tons, according to the International Lead and Zinc Study Group.

Scotiabank commodities analyst Patricia Mohr has a price forecast of $1.60 per pound for zinc in 2016 as the deficit increases. That’s 72% higher than today’s price of $0.93 cents per pound and could have investors scrambling for zinc names.
Zinc stockpiles have already been cut in half in the last year and currently sit at ~458,000 metric tonnes.
Upcoming zinc mine closures will certainly hasten the decline in stockpiles. Of particular importance will be the closure of MMG’s Century Mine in Australia, which is winding down at the end of June. In 2014, Century supplied 465,696 tonnes into a market size of 12 million tonnes (3.8% of world supply).
Later this year, Vedanta Resources’ Lisheen mine in Ireland will also close, removing ~150 thousand tonnes from the market.
Don Lindsay, CEO of Teck Resources, one of the world’s largest zinc producers, recently stated, “It’s starting to look like 2006 all over again.” He’s referring to a powerful move that took place with the zinc price that year. Stockpiles went from the 600,000-tonne level to below the 100,000 -tonne level briefly before rising again during the financial crisis. Zinc was up 51.6% in 2005 and 125.7% in 2006. It may be setting up for a similar price move in the near future.
Pipeline
Zinc exploration and development companies must fill the pipeline for future zinc demand. But there are only a handful of quality zinc development projects in the world, which could very easily lead to takeovers in the space at significant premiums – especially for higher-quality names. (Note: most zinc development companies have issues, be they metallurgical, permitting, capex or grade.)
In 2011, with zinc down 25%, Nyrstar Resources saw an opportunity and decided to go shopping. Nyrstar understood that the fundamentals for zinc were setting up favourably so the company purchased two Canadian-listed zinc companies: Breakwater Resources and Farallon Mining. Breakwater was taken over for $663 million in cash (a 44% premium) while Farallon was purchased for $443 million in cash (a 23% premium). Nyrstar may have jumped the gun a little but zinc has had three straight years in the green since the acquisitions.
With the aforementioned two takeovers, Nystar essentially cleaned out the primary zinc producers on the TSX, leaving only Trevali Mining (TV:TSX) as the pure production play.
John MacKenzie, Anglo American’s former head of copper, is planning to launch his own public vehicle soon – and is eyeing zinc. He is reviewing takeover targets ahead of a planned $300m to $700m mining float later this year.
“Because zinc has been so unfavoured there’s been very limited development, particularly by the majors, so there’s relatively little high-quality supply coming online,” MacKenzie told Global Mining Observer.
Next down the food chain for investors are the zinc development companies.
Canada Zinc Metals (CZX:TSXV)
Canada Zinc Metals is one investment option for those looking into the zinc space. Here are four reasons why investors might want to consider CZX:
- Primary commodity (zinc) has strong fundamentals for a price rise.
- Strong management with a proven track record of success.
- A high-quality project with expansion potential.
- A solid balance sheet with no need to raise money anytime soon.
Let’s delve a little deeper into these factors:
Supply Crunch
The fundamentals for the zinc price look extremely strong in the next 6-24 months. Large zinc mines are beginning to close down and it’s likely we will see the deficit in the zinc market begin to grow. No new large mines are in the pipeline to replace those coming offline.

Demand is expected to remain strong at 5% growth per year for the next couple of years, underpinned by continued growth in the Chinese steel sector and a trend towards value added steels.

If these forecasts hold true, the market will need to somehow find the production equivalent to what the Century mine put out last year (465,696 tonnes) just to keep up with demand.
Glencore, a large zinc producer, stated at its recent AGM ”An additional 3-3.5Mt of zinc supply (is) needed over the next 5 years to balance the market.”
China, the world’s largest zinc producer, is still a wildcard in the zinc market but many analysts do not believe that the Chinese can increase production enough to replace the mines coming offline. China is very secretive when it comes to publicizing production numbers of commodities. What we do know is that China wants to reduce its pollution issues, but to what extent this effort slows down mining is anyone’s guess.
Economics 101 holds that when demand exceeds supply the price of whatever is in demand will rise. The zinc market has been in deficit for the last couple of years. Stockpiles have been rapidly declining and are half of what they were last year. Zinc has had a 16% move in the last 3 years but many analysts believe that is just the beginning.
Zinc’s last major supply/demand deficit occurred in 2004 with zinc quadrupling in 2 years (going from $0.50 to $2).

Management
Canada Zinc Metals is founded by Varshney Capital Corp – a Vancouver based merchant bank and venture capital firm. The group has had plenty of success in the resource space and in other investments.
The group is one of the founding shareholders of Mountain Province Diamonds (MPV:TSX), a soon to be diamond producer. Mountain Province is partnered with De Beers on the Gahcho Kue Project in the Northwest Territories. Construction is well underway with production expected in the first half of 2016. Gahcho Kue will be the world’s largest and richest new diamond mine. For those who invested in Mountain Province in the early 2000s, the stock is currently a 13-bagger.
The team at Canada Zinc Metals has all the members needed to bring this project through the development phase. Ken MacDonald, VP Exploration, recently led the team responsible for all mine permitting to bring the Mt. Milligan copper-gold mine in B.C. into production.
On the board of directors CZX can rely on the experience and expertise of Henry Giegerich, who played a key role in the development of the Red Dog mine in Alaska. Teck Resources Red Dog is currently one of the largest and highest grade zinc mines in the world.
Management has made it no secret that a takeover is a possibility. The shareholder base is among the strongest in junior mining with four major companies holding positions – Tongling Nonferrous Metals Group, Lundin Mining, Teck Resources and Korea Zinc.
The Akie and Kechika Regional Projects
Canada Zinc Metals owns a large land package in northeastern British Columbia in the Kechika Trough. British Columbia is known as one of the top mining jurisdictions worldwide. The Kechika Trough hosts several zinc-silver-lead projects and is an extension of the world class Selwyn basin from the Yukon. This is a district-scale play as management has locked up close to 140 square kilometers of land in the belt.

The Akie property hosts the Cardiac Creek deposit, which is one of the top undeveloped zinc-lead-silver projects in the world. A 2012 NI 43-101 resource shows an indicated resource of 2.35 billion lbs of zinc at 8.38%, 470 million lbs of lead at 1.68%, and 5.6 million ounces of silver at 15.30 g/t, as well as an inferred resource of 2.65 billion lbs of zinc at 7.38%, 480 million pounds of lead at 1.34%, and 6.05 million ounces of silver at 11.6 g/t.
The deposit is open for expansion in all directions . An aggressive 5,000-metre drill program is planned for this summer. The drill program will focus on two main goals:
- Increase the size of the deposit.
- Increase the confidence in the current indicated and inferred resources.
Grade is a very important characteristic to keep in mind when investing in mining projects. The chart below shows that the Akie project is one of the highest-grade undeveloped projects in the world.
The Akie project is 116 sq km in size and is located within 20 kilometres of Teck and Korea Zinc’s Cirque deposit.
Also take note that the Cirque deposit, owned by Teck and Korea Zinc, is next to Akie on the chart. It would not be a stretch for either of these companies or both these companies to be thinking of taking over Canada Zinc Metals to consolidate the area.

Infrastructure for the project is very good and is an advantage over a majority of its peers. A 50-person modern facility camp was built a few years ago. The project is accessible year round by road which connects to the town of Mackenzie. The easy access to Mackenzie is strategic because the town has access to rail that connects to Teck’s smelter in Trail. The Teck smelter is one of the largest integrated zinc-lead smelters in the world. As well, rail access is available from Mackenzie to Prince Rupert which is home to a deep-sea port that would allow for shipping of concentrates overseas. With respect to power, B.C.’s largest hydroelectric dam is located just south of the project on Williston Lake.
Canada Zinc Metals’ largest shareholder, Tongling Nonferrous Metals Group (35%), is hungry for concentrate and owns a zinc and lead smelter in the city of Tongling (Anhui Province). The smelters are located right on the banks of the Yangtze River with direct ocean access to and from Prince Rupert.
Other CXZ regional claims in the area have been optioned to JV partners Teck and Korea Zinc. The partners are expected to spend ~$1 million on the optioned claims this year (Pie, Yuen, and Cirque East). Teck has the option to earn up to 70% on these claims by spending $8.5 million in exploration by September 2019.
The entire 140 sq km belt is highly prospective for new discoveries. Several of the properties have had significant historical drill results. The focus for the moment remains on Cardiac Creek and letting JV partners drill some of the optioned regional claims.
Financial Position
Canada Zinc Metals has a strong balance sheet with ~$10 million in working capital. This summer’s work program is expected to total $2 million which will leave CZX with $8 million in the bank. In an extremely weak financing environment for junior mining companies, this is a tremendous advantage.

Canada Zinc Metals is trading at 23 cents, close to a 5-year low. The share price was 55 cents back in September and has been more than cut in half with no fundamental reason for the sell off.
Investors should watch zinc inventory levels as they will drive the zinc price, but as mentioned earlier, the commodity looks set to see a major increase in price. With the space looking like it’s going to heat up, Canada Zinc Metals (CZX:TSXV) should definitely be on a zinc bull’s watchlist.
Symbol: CZX:TSXV
Share price:$0.23
Market cap: $35.1 M
Working capital: ~$10 million
Shareholders: Tongling Nonferrous Metals Group,Lundin Mining,Teck Resources and Korea Zinc
Here is a link to today’s drilling news: Canada Zinc Metals Commences 5,000 Meter Drill Program at Akie
CEO.CA is proud to have Canada Zinc Metals as a sponsor and this makes us biased in our coverage of the company. Junior mining stocks such as Canada Zinc Metals are highly volatile and risky. They are not suitable for most investors. This article is not a recommendation to buy or sell any security. Always do your own due diligence and consult a licensed investment advisor before making any investment decisions. Visit Canada Zinc Metals‘ profile on www.SEDAR.com for important information and risks.
Disclaimer and Information on Forward Looking Statements: Please read carefully before proceeding. All statements in this report, other than statements of historical fact should be considered forward-looking statements. These statements relate to future events or future performance. Forward-looking statements are often, but not always identified by the use of words such as “seek”, “anticipate”, “plan”, “continue”, “estimate”, “expect”, “may”, “will”, “project”, “predict”, “potential”, “targeting”, “intend”, “could”, “might”, “should”, “believe” and similar expressions. Much of this report is comprised of statements of projection. These statements involve known and unknown risks, uncertainties and other factors that may cause actual results or events to differ materially from those anticipated in such forward-looking statements. Risks and uncertainties respecting mineral exploration companies are generally disclosed in the annual financial or other filing documents of those and similar companies as filed with the relevant securities commissions, and should be reviewed by any reader of this article. In addition, with respect to any particular company, a number of risks relate to any statement of projection or forward statement.
Cautionary Note Concerning Estimates of Inferred Resources: This article may use the term “Inferred Resources”. U.S. investors are advised that while this term is recognized and required by Canadian regulations, the Securities and Exchange Commission does not recognize it. “Inferred Resources” have a great amount of uncertainty as to their existence, and great uncertainty as to their economic and legal feasibility. It cannot be assumed that all or any part of an Inferred Resource will ever be upgraded to a higher category. Under Canadian rules, estimates of “Inferred Resources” may not form the basis of feasibility or other economic studies. U.S. investors are also cautioned not to assume that all or any part of an “Inferred Mineral Resource” exists, or is economically or legally mineable. Mineral resources which are not mineral reserves do not have demonstrated economic viability. The estimate of mineral resources may be materially affected by environmental, permitting, legal, title, taxation, socio-political, marketing, or other relevant issues.

Via EnergyandGold.com: Yesterday, a Vancouver-based mineral exploration company drilled one of the best holes in the history of uranium exploration. NexGen Energy’s (NXE.TSXV) AR-15-44b resulted in 56.5 meters grading 11.55% including 20 meters at 20.68% U3O8, and shares in the junior company soared 10.45% Monday. The result was widely hailed by the analyst community. Cantor Fitzgerald’s Rob Chang now estimates NexGen’s Arrow resource to be 114.8 million pounds of uranium at an average grade of 0.89%. Mr. Chang has a Speculative Buy rating and no price target on NexGen’s shares, which closed at $0.74 Monday. He did however speculate that on a takeout, quality projects in the area could fetch $6-8 per pound of uranium in the ground, or $2.34-$2.73 per NexGen share. While Mr. Chang’s resource model is early-stage and speculative in nature, we share the analyst’s enthusiasm for NexGen. EnergyandGold.com was fortunate to get on a call with NexGen CEO Leigh Curyer to discuss drilling progress and get an update on the company.

Scott Armstrong: Great to have you here Mr. Curyer. Could you start by describing what makes NexGen unique in the uranium space?
Leigh Curyer: Throughout the management and board of NexGen we are uranium professionals with a long history in the uranium sector. We have a very focused approach on the type of mineralization we are looking to develop, and in a very short period of time we have discovered what looks to be a world class uranium discovery in the Athabasca Basin.
The management and board of NexGen have a lot of experience in the uranium industry. Our chairman, Christopher McFadden, used to be head of corporate development for Rio Tinto’s energy division. We also have uranium geologist Craig Perry, who was previously at Rio Tinto and Oxiana (which was sold to Zinifex for $6 billion in 2008). Also, our Jim Currie just won AMEBC’s award for mining engineering excellence for his contribution to the developing of the New Afton mine in Northern BC. Richard Patricio has over 15 years in the corporate sector in mining. I should also mention Garrett Ainsworth, who won AMEBC’s Colin Spence award for his contribution to the discovery of the Patterson Lake South deposit while he was the project manager for the Alpha Minerals/Fission JV.
Another differentiator of the company is our focus on having a high ratio of dollars in the ground compared to our overheads. We are currently exploring at a ratio of 8:1 ($8 in the ground for every $1 of overheads). No one competes with us on that basis, not only in uranium development & exploration but amongst all of the commodities. What sets us apart is that we are onto a world-class uranium project, we are uranium professionals, our team has been in the industry for a long time, and covers all of the disciplines from discovery all the way through to production.
Scott Armstrong (E&G): Can you tell us about your summer drill program?
Leigh Curyer (LC): It’s 25,000 meters, we’ve got 5 drill rigs of which 3 will be focused on looking for extensions of Arrow which remains open in every direction and at depth. Also we will be focusing on delineating the high grade core within Arrow. Two other drill-rigs will be focused regionally, one on our Bow discovery which is 3.7 km northeast of Arrow but is still in the early stages. Then the other rig will be drilling target areas about 10km away from Arrow to the southeast, along the Derkson Conductor Corridor, which has historically been identified as a potentially uraniferous corridor. So we’re looking forward to not only developing Arrow but also in parallel getting a sense of how good the broader Rook I project is. When you look at the geophysical signature of Arrow, it’s actually replicated many times across the Rook I property package. We’re not suggesting that all those geophysical targets will be mineralized like Arrow is, but needless to say we’re incredibly encouraged by that prospect if indeed one of those targets is mineralized similar to Arrow. If we can prove this, the value of the Rook I project will be challenging for the top project in the entire Athabasca Basin.

To add to that we’re using directional drilling this summer, so basically we’re getting 25,000 metres equivalent at Arrow alone by utilizing directional drilling. This enables us to accurately drill out the high-grade core zone of the Arrow project whilst maximizing the number of holes that enter the mineralization. This allows us to focus the other rigs on trying to get a handle on the prospectivity of the entire Rook I land package which remains largely unexplored.
E&G: Where do you see the company 3-4 years from now and what is your long-term vision for NexGen?
LC: 3-4 years from now we will likely have the Arrow resource estimate updated a few times by then and be well into the economic studies and development of the project. We will have a lot of work done with respect to the environmental studies and licensing and we will be well into the permitting process. In 3-4 years we should have a solid understanding of the scale of the mining footprint of the project, and I’m just talking about Arrow specifically there. We also would hope that we will be onto another mineralized zone nearby to Arrow on one or more of the multiple targets we have on the Rook I package.
We are not just looking at Arrow as the future of the company, we are also looking at developing the Rook I project overall and understanding just how mineralized it is. We believe the land position, as large and prospective as it is, has the potential to have a series of projects that develop well into the future.
E&G: I know you have no control over what the uranium market does but I would like your insights into where uranium is going and what the key catalysts are. There was a report out from Morgan Stanley over the weekend highlighting the potential for large uranium supply shortfalls beginning in 2030 as more reactors come online in China and India, however, that’s at least 15 years away and doesn’t exactly help the NPV of a resource project today. What is your outlook for uranium over the next 5 years and what are some catalysts that could really send the uranium spot price soaring back above $50/pound?
LC: I think the fundamentals are very strong with respect to demand and supply. On the demand side it is actually quite predictable given the lead time to permitting and building reactors across the world. So I see the demand for nuclear fuel increasing at a steadily growing rate. China, India, the Gulf countries, Japan, Europe, South Korea, etc. are all focused on attaining a lower carbon footprint while demanding higher energy consumption per capita. This require nuclear energy.
On the supply side I think that is actually going to be one of the drivers for the price of uranium. I have looked at all the projects around the world from a technical, financial, and sovereign risk perspective when I was at First Reserve International and there is no meaningful production that can come online to fill that supply gap over the next 5-7 years. The WNA predicts a supply shortfall starting before 2020 now there are no mines that can deliver that supply gap that will be ready to produce before 2020. Mines can not just switch on, even mines on stand-by take a few years to ramp back up to full-scale production. The sector as a whole has stated that they will not be deploying capital in an environment with sub $70/lb uranium because the returns on capital cannot justify it. On top of that you’ve got current existing mine supply under stress and rotting; Rossing, Olympica Dam and other projects have had technical challenges which have cut supply. More recently Rio Tinto announced the Ranger expansion will be put on hold which removes 7-8 million pounds per annum from the supply forecast. I think it’s going to be more supply driven than it is demand driven; roughly 80-90% of the world’s uranium supply is under a severe technical or sovereign risk.
E&G: What are NexGen’s next major milestones?
LC: We’ll be looking to publish a maiden resource estimate on the Arrow project before the end of the year or during the first quarter of 2016. That will be purely dependent on the assays of the summer drill program coming back, if we get them back early enough we will have a resource estimate published before the end of the year. More immediate to that, we have begun our aggressive 25,000 meter summer program where we will attempt to find the extent of Arrow’s mineralization and also zap the heart of Bow as well as hopefully hit another mineralized zone on the Derkson corridor.
E&G: According to a recent news release, NexGen has approximately $30 million in its treasury. How long do you see this capital lasting NexGen?
LC: With that money we are set until the end of 2016. We are basically financed for the next 18 months with our current drilling campaign which is one of the largest in the Basin. We don’t expect to go back for financing until the end of 2016 by which time we will have a resource and be well into economic studies as which point we will be attracting the financing interests of the financing firms that look to invest during feasibility through to production. We are already drawing the attention of those private equity firms with respects to development financing and continue to build on those relationships as we move closer to that stage.
E&G: Could you please tell us about the infrastructure at the Rook 1 property as well as what it will it take to get Rook 1 into production?
LC: About 70 kilometers northwest of Arrow is AREVA’s former Cluff Lake mine and mill which produced over 60 million pounds through the 90’s at a grade of roughly 0.9%. From a permitting perspective, the area is familiar with mining. The fact Arrow is land-based means we don’t have a to permit or move a lake which is something that other deposits in the Basin historically have had to work around. That is clearly advantageous from a development economics point of view but also from a permitting and social impact perspective.
Closing statement from NexGen Energy CEO Leigh Curyer: We are well very capitalized. With regards to people, we have the team from discovery through to production and intend to bring Arrow the entire way. Finally, the project: Arrow is a land based, high-grade uranium project in one of the best jurisdictions for uranium mining in the world and is hosted in competent basement rock. It really couldn’t get better than that.
To put some of this into perspective, the global average resource grade is 0.1% and the Athabasca Basin is known for having 100 times that average grade production. Its the highest grade uranium district in the world. Unfortunately a lot of the deposits and projects have technical risks even though they have such high grades because of this Athabasca sandstone formation which is porous and allows water to seep into it. You’ve seen this at Cigar Lake where water ingress has been a serious challenge for them, although they have successfully been able to develop a solution to that. At Arrow because the mineralization is completely hosted in the basement and starts at only 100 meters from surface means that these types of technical challenges seen at Cigar won’t be an issue at Arrow.
E&G: Thank you Mr. Curyer for the update on NexGen. Readers, add NXE.V to your watch-list and follow NXE in CEO.CA Chat.
Scott Armstrong of EnergyandGold.com, Guest Contributor to MiningFeeds.com
Disclosure:
This is not investment advice. At the time of publication, author is a shareholder in NexGen Energy but has no business relationship with the company. He reserves the right to trade shares in NexGen, on a long or short basis, without notice to readers. All facts are to be checked and verified by reader. As always please do your own due diligence. The author of this post owns shares of this company. This article contains forward-looking statements that are based on NexGen Energy LTD current expectations and estimates. Forward-looking statements are frequently characterized by words such as “plan”, “expect”, “project”, “intend”, “believe”, “anticipate”, “estimate”, “suggest”, “indicate” and other similar words or statements that certain events or conditions “may” or “will” occur. Such forward-looking statements involve known and unknown risks, uncertainties and other factors that could cause actual events or results to differ materially from estimated or anticipated events or results implied or expressed in such forward-looking statements. Such factors include, among others: the actual results of current exploration activities; conclusions of economic evaluations; changes in project parameters as plans to continue to be refined; possible variations in ore grade or recovery rates; accidents, labour disputes and other risks of the mining industry; delays in obtaining governmental approvals or financing; and fluctuations in metal prices. There may be other factors that cause actions, events or results not to be as anticipated, estimated or intended. Any forward-looking statement speaks only as of the date on which it is made and, except as may be required by applicable securities laws, NexGen Energy LTD disclaims any intent or obligation to update any forward-looking statement, whether as a result of new information, future events or results or otherwise. Forward-looking statements are not guarantees of future performance and accordingly undue reliance should not be put on such statements due to the inherent uncertainty therein.
Briefly: In our opinion, a speculative short position (full) in gold, silver and mining stocks is justified from the risk/reward point of view.
We have previously commented on the mining stocks’ underperformance relative to gold and its bearish implications. Last week, however, we saw something even more profound. The HUI Index broke below the 2014 low in terms of the weekly closing prices and it was the lowest weekly close since 2003. Does this major sign signal the beginning of the final major slide in the precious metals sector?
Let’s take a look at the chart featuring gold stocks (charts courtesy by http://stockcharts.com):
Click here for reference chart.
The HUI Index didn’t close much below the 2014 low, but still, it happened. The breakdown is not yet verified – it’s not significant (the HUI didn’t close the week much below the lowest weekly close of 2014) and it was not confirmed in terms of time. Moreover, we have yet to see a breakdown in terms of daily closing prices and intra-day lows. Consequently, the weekly breakdown doesn’t have very (!) bearish implications just yet, but it does indicate that the odds for a continuation of the decline have further increased.
What’s more significantly bearish, is the completion of the head and shoulders pattern and the analogy seen in the Stochastic indicator.
In our previous Gold & Silver Trading Alerts we described the situation in the following way (and it remains up-to-date also today):
The head and shoulder pattern that took about 6 months to complete is something that could trigger another major slide in the precious metals sector. The target based on this formation is at about the 120 level for the HUI Index, which is the upper border of our target area. The targets based on the H&S pattern tend to work on an “at least” basis, so it seems that our target area is even more likely to be reached.
The important thing is that the HUI moved below the neck level of the pattern, and based on the short-term H&S, it’s likely that the move below the neck level of the bigger H&S will be clearly visible and thus much more meaningful.
As far as the Stochastic indicator is concerned, please compare the current situation with the 2 previous periods when we saw similar performance – we marked these cases with green rectangles. In both cases big declines followed. Consequently, there is another factor pointing to lower mining stock prices (which is in tune with the medium-term trend).
Not much happened in gold and silver on Friday, so we will not describe them once again in greater detail (however, comments from our previous Gold & Silver Trading Alerts remain up-to-date).
There is one thing that we covered previously that we would like to bring up once again.
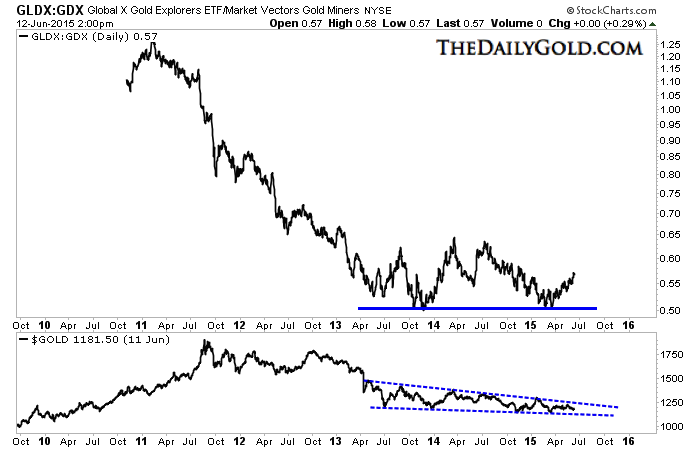
On June 5 we commented on the above chart (referring to it as “the little-known signal”) in the following way:
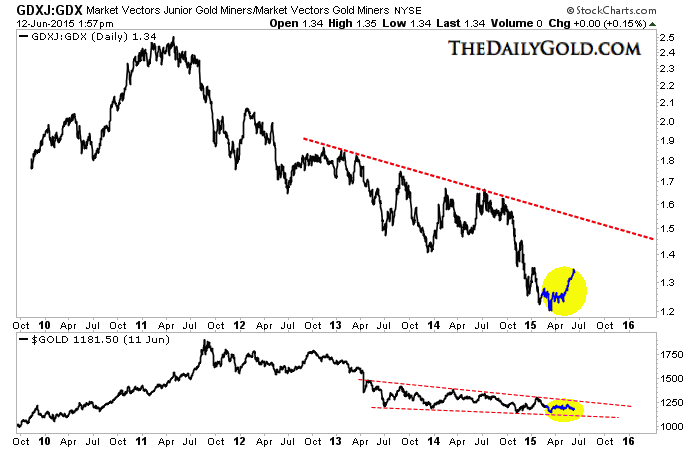
The above chart features junior mining stocks’ performance relative to the performance of the general stock market. This ratio moves quite in tune with gold, as when we take out the link between juniors and other stocks, the main driver of their prices is the underlying metal (either gold or another metal that moves in tune with gold anyway). The bottom line is that since this ratio moves in line with gold (but slightly differently) it can be used as a confirmation of gold’s moves.
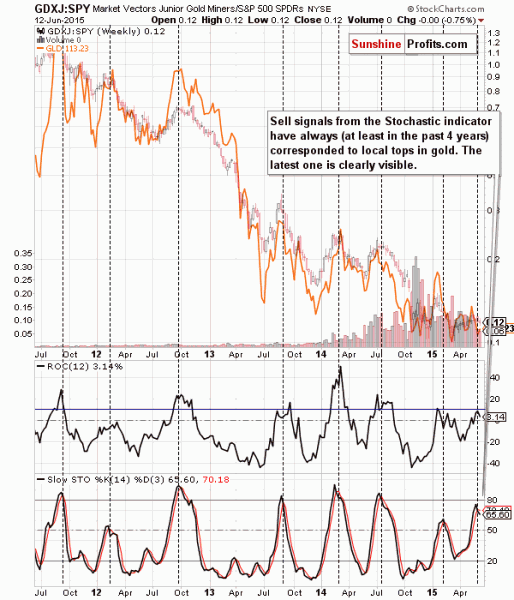
The way that we can use the above knowledge is to apply the Stochastic indicator to the ratio. In each (!) case when the Stochastic indicator flashed a sell signal it was either at or close to a major top. If gold was moving higher before this signal it suggested that the top is about to be formed and if gold was moving lower before the signal, it confirmed that the top was indeed formed. We have just seen this little-known but very accurate signal and the implications are very bearish.
The reason that we’re bringing this up once again is that the sell signal from the Stochastic indicator is now even more clearly visible and thus what we wrote above is even more meaningful than it was previously.
Summing up, more and more signs seem to confirm our outlook for the precious metals sector – it seems that the final bottom is still ahead of us. The current short positions in the precious metals sector are already profitable but it seems that they will become much more profitable in the future, so we are keeping them intact.
To summarize:
Trading capital (our opinion): Short (full position) position in gold, silver and mining stocks is justified from the risk/reward perspective with the following stop-loss orders and initial (!) target prices:
Gold: initial target price: $1,115; stop-loss: $1,253, initial target price for the DGLD ETN: $87.00; stop loss for the DGLD ETN $63.78
Silver: initial target price: $15.10; stop-loss: $18.13, initial target price for the DSLV ETN: $67.81; stop loss for DSLV ETN $38.44
Mining stocks (price levels for the GDX ETN): initial target price: $16.63; stop-loss: $21.83, initial target price for the DUST ETN: $23.59; stop loss for the DUST ETN $10.37
In case one wants to bet on lower junior mining stocks’ prices, here are the stop-loss details and initial target prices:
GDXJ: initial target price: $21.17; stop-loss: $28.68
JDST: initial target price: $14.35; stop-loss: $5.65
Long-term capital (our opinion): No positions
Insurance capital (our opinion): Full position
You will find details on our thoughts on gold portfolio structuring in the Key Insights section on our website.
Despite three consecutive weeks of losses precious metals have failed to mount much of a rally. Gold closed last week above $1170 and may close this week below $1180. Meanwhile, Silver has struggled to mount any rebound and appears to have lost $16 as the week comes to a close. While the risk of a final breakdown is growing, one positive we see is the relative strength in the riskiest parts of the mining sector.
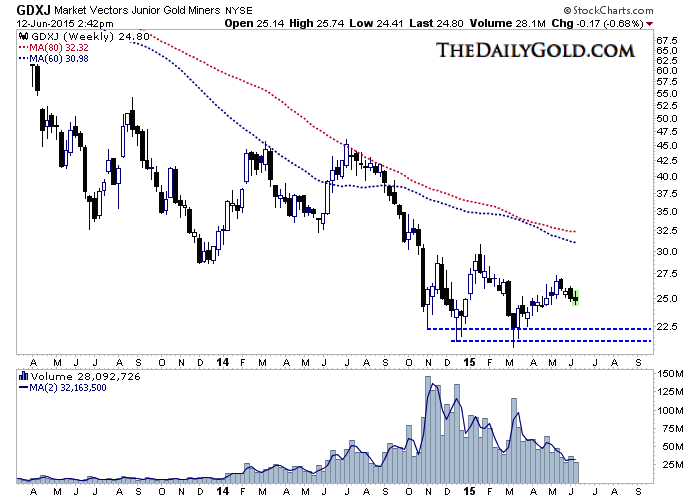
GDX tracks the senior miners (including royalty companies now) while GDXJ tracks what we would term “the largest juniors.” When the sector is performing well, we’d expect GDXJ to outperform and when the sector is performing poorly, we’d expect GDXJ to underperform.
The chart below plots GDXJ against GDX. The ratio peaked in April 2011 and may have bottomed in March 2015. Even as the spring rally in precious metals fizzled GDXJ continued to outperform. A few days ago the ratio reached a 5-month high.
Take a look at GLDX against GDX. GLDX tracks exploration companies which are much smaller in market cap than those in GDXJ. The ratio has formed a 2-year base and rounded bottom that appears to be quite strong. Last week the ratio touched a 7-month high.
Stepping back from relative strength, I want to take a look at GDXJ in nominal terms. GDXJ is far more liquid and therefore relevant than GLDX. The chart below is the weekly candle chart for GDXJ. Note that GDXJ has made three lows in the past eight months. Volume has decreased at each subsequent low. This indicates that the strength of the selling has abated. It will be interesting to see how GDXJ performs if and when Gold breaks below $1150. GDXJ is trading near $25 and has good support at $21-$22.
While not a buy signal, the relative strength in GDXJ and GLDX tells us a few things. It argues that the bear market is likely to end soon and that with respect to all mining stocks, GDXJ and GLDX could lead the recovery. However, in the meantime we are waiting for Gold to break below $1150 and then $1100 and we are waiting for GDXJ to retest its lows. Be patient as those developments would bring about better and safer opportunities. Consider learning more about our premium service including our favorite junior miners which we expect to outperform in the second half of 2015.
Before launching into a comparison of hard rock lithium mining vs. harvesting lithium brines, it’s important to point out that hard rock mining can be preferable to alternative methods, but usually only where hard rock mining is already entrenched in places like the Greenbushes mine located in south Western Australia… Also, I use the word, “lithium” loosely to describe lithium carbonate, lithium hydroxide and other forms of lithium. Please see disclosures at the bottom of this page.
Conventional wisdom suggests that hard rock lithium mining occupies a much larger environmental footprint, takes a longer time from exploration to production and is more expensive than brine harvesting methodologies.
This alone makes old fashioned hard rock mining less and less popular around the globe. Materials like lithium are undergoing a paradigm shift, (a well regarded infographic sponsored by Dajin Resources Corp. (DJI.V) (DJIFF), created by Visual Capitalist describes this topic in depth). The case in favor of hard rock mining in most extractive industries is crumbling.
A number of annual reports from consulting groups point to, “resource nationalism and a, “social license to operate” as substantial risk factors facing large-scale projects. As I hope to demonstrate, harvesting lithium brines is not only less expensive (possibly far less) it’s more environmentally friendly, less energy intensive, reaches small commercial scale production faster, is preferred by locals, has more predictable op-ex and is easier to remediate at completion.
Hard Rock Mining
Starting at the early exploration stage, a geologist must begin spending time, energy and capital right away. Expensive and potentially many deep drill holes must be punched into the ground. After months of analyzing the drill data, if promising results are inferred, the best case scenario is more drilling. The goal is either a, “discovery,” which could make the deposit appear economically viable. More likely, additional exploration dollars, drilling and dreaming is required. If the next drill campaign is successful (far from a sure thing) it might be followed by infill drilling to generate a resource estimate (not yet a, Preliminary Economic Assessment, “PEA”).
All of this takes years to accomplish and yet the odds of an economic deposit remain surprisingly low. Once a potentially economic deposit is found, crucial metallurgical work is undertaken which can kill the, “project” on the spot. Despite tremendous capital and managerial resources, a mine is not yet economically demonstrated…. until the all important Preliminary Feasibility Study, “PFS.” Even that report sometimes fails to definitively move the potential project out of the exploration stage. Astute readers see where I’m headed with this. “Every failed mine is the result of a, ‘successful’ Bank Feasibility Study!” (attributable to multiple parties).
With continuous headlines regarding fatalities in hard rock mining, it’s clear that abandoning this archaic pursuit is not merely a dollars and cents proposition. Hard rock lithium mining entails a number of the above mentioned challenges. With the harvesting of brines, human and economic costs are mitigated. The time and cost to produce commodities and specialty chemicals is undoubtedly more onerous today than just a decade ago. Consider the myriad of challenges not even mentioned. Compliance, legal, environment baseline studies, a slew of environmental reports, permitting, wage inflation, availability of skilled labor, approval of local communities, power, water, roads, reclamation plan, permitting of tailings ponds, permits, approvals, deals with political figures and infrastructure to expand. The list goes on and on.
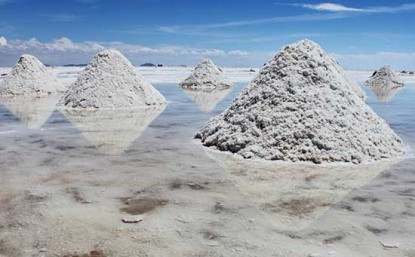
Lithium Brine Mining
As described by the USGS, (paraphrased) lithium brine deposits are accumulations of saline groundwater that are enriched in dissolved lithium. Although abundant in a nature, only select regions in the world contain brines in closed basins in arid regions, where lithium salts can be extracted at a profit. Brine, typically carrying 200–1,400 milligrams per liter of lithium, is pumped to the surface and concentrated by evaporation in a succession of ponds, each in the chain having a greater lithium concentration. After 9-12 months, depending on climate, a concentrate of 1 to 2 percent lithium is further processed in a chemical plant to yield various end products, such as lithium carbonate and lithium hydroxide.
Back to my own analysis, drilling for a lithium brine deposit involves fewer steps, roadblocks, delays, time, surprises and capital compared to hard rock. Far fewer and typically shallower holes are required. With modern imaging and mapping technologies and without nearly as much effort or expense, a possible deposit is identified. A key attribute is that delineating size, grade and composition of favorable and unfavorable elements (akin to metallurgy) can be accomplished by pumping up brine samples. Many of the detrimental things about hard rock mining alluded to are avoided.
Small cap lithium plays
Consider the following quote about lithium brine opportunities, once up and running, the op-ex and production profile of brine projects are more easy to forecast and less prone to cost inflation from ore depletion and other known unknowns. According to a Credit Suisse report,
“Lithium brine deposits typically outperform hard rock and clay lithium sources on cost, sustainability and permitting. This gap is becoming more pronounced when we take into account technological advancements in brine processing….even though lithium is relatively abundant, it’s the 33rd most common element — it’s very diffuse throughout nature, meaning that collecting and concentrating it is a very difficult task.”
Yes, it still takes years to go from exploration to initial production, but the cost, managerial resources and time of proving up an economically viable project is considerably less. Time is money in both methods of extraction. Dajin Resources Corp, (DJI.V) (DJIFF) is an example of an early-stage company with substantial, 100% owned lithium brine prospects in both Nevada and Argentina. In Nevada, Dajin’s owns two properties, one of which is 7km from the only producing brine project in North America. In Argentina, Dajin has a large, strategic property that could be explored, especially if lithium prices continue to increase.
Funding large-scale projects of any sort, iron ore, copper, gold, etc has been a tremendous problem for the past few years. It seems that, “PEAs” done in 2010-2012 are routinely recast to show stronger economics and lower upfront costs. With large checks for huge projects nearly impossible to secure, it’s no wonder companies are trying to deliver exactly what strategic and financial investors demand, lower risk projects. What makes a project less risky? Smaller scale, green, (less fossil fuel use / emissions), a predictable and sustainable plan of action to share with local communities and government agencies, a clear path from exploration to reclamation and therefore a better chance of obtaining project financing. That is exactly what Dajin Resources aims to do.
Dajin has demonstrated, solid financial backing allowing for the possibility of (Joint Venture) partnering with peers, and farming out minority interests in their 100% owned properties. Dajin has both time and options, a rare combination in this brutal natural resource downturn. Dajin trades at one of the lowest market caps of the very few viable (my opinion only) lithium plays. Those looking for pure-play lithium exposure should include Dajin on their watch lists and due diligence review. A good place to start is at Dajin’s excellent Corporate Website (Dajin.ca) and their blue-skyed S&P Market Access Profile.
Traditional hard rock mining, is time-consuming, energy and cost intensive. Recall that I described a number of factors supporting a less risky project? (harvesting brines in Dajin’s case) A less risky project is more attractive to potential partners and investors. Riskier projects warrant a lot more due diligence, time and money to properly evaluate. A brine project, quicker into production at an initially smaller scale, with the above mentioned attributes, would have more appeal to a wider audience of interested parties.
Disclosures
Dajin Resources (ticker DJI.V) (DJIFF) – At the time this article was written, Dajin Resources was a sponsor of EpsteinResearch.com. Mr. Epstein owns shares of Dajin Resources. Investors should consult with their own advisors before making investment decisions. Mr. Epstein is not an investment advisor. The article on this company should be viewed in this context. This company is highly speculative and not suitable for all investors.

1. Please click here now. That’s a seasonal chart for gold. I’ve highlighted my key buying and profit booking areas.
2. June is the most important time of the year to buy gold.
3. Unfortunately, by the time this vital month gets underway, most gold analysts and investors are too afraid to take any action.
4. They are forced to buy at much higher prices. Religion-oriented buying in India pushes gold relentlessly higher into August and September, in what is typically the year’s most powerful rally.
5. This has happened for decades. Clearly, the more things supposedly change, the more they stay the same.
6. Timid investors tend to fail, and brave ones tend to prosper. That’s a key part of “financial life”, and I don’t see any event on the horizon that will change it.
7. Technically, gold’s daily chart is in “textbook” sync” with seasonality. Please click here now. Note the fabulous position of my 14,7,7 series Stochastics oscillator, at the bottom of the chart.
8. Gold also tends to sell off going into the US jobs report, and then rally nicely in the days following the report.
9. On that note, please click here now. That’s the hourly bars chart for gold, with Friday’s “jobs report low” highlighted.
10. Contrary opinion is a key indicator I use to suggest whether the next trending move is up, down, or sideways. I would estimate that about 70% of gold analysts are too afraid to buy any gold right now. That’s the kind of number that typically fuels solid gold price rallies!
11. Amateur investors need to think carefully about how to apply contrary opinion to their own investing. Most investors are usually wrong about market direction. Thus, it’s important for the amateur investor to bet against their own analysis. That’s a hard thing to do, but it’s a critical part of successful investing.
12. Please click here now. That’s the daily chart of the US dollar versus the Japanese yen. The price action of this currency cross has historically been a key indicator of future gold price action.
13. My Stochastics sell signal in play on that chart should provide comfort for the professional investor who buys gold in June. As China and India play an ever-bigger role in daily gold price discovery, the importance of this dollar/yen chart is waning.
14. For now, it’s still a decent gold price forecasting tool, and it suggests a nice gold rally is beginning!
15. Please click here now. That’s the Dow Transports monthly chart. Horrifically, when I look at it, the story of Icarus comes to mind.
16. Rules aren’t made to be broken, and Dow Theory has certain rules that are time-tested. When the Dow Transports disintegrate,it’s a dire warning for global stock market investors.
17. Note the emerging sell signal on the TRIX indicator on that Transports chart. The key 5,15 moving average series is also verging on a massive sell signal.
18. Please click here now. It’s imperative that Janet Yellen hikes rates soon. The “real” economy has been disintegrating since the late 1990s, because money velocity has been tumbling since then.
19. QE only added to the deflationary fire. The money supply has been dramatically enlarged because of QE, but the banks need higher rates as an incentive to make aggressive loans to businesses. Until Janet hikes rates, M2V will continue to languish, and so will the economy.
20. Also, America’s population is aging. Savers have been destroyed by the low interest rates. Only the US government has really benefited from these rates, as it has been able to expand exponentially in size, like a bully expanding his reach on a school playground.
21. The technical deterioration of the Dow Transports suggests that Janet’s patience with government over-spending and size is wearing thin. The market appears to be anticipating rate hikes. The US government is becoming the single largest component of the US economy. Horrifically, the main product of the American empire is now red tape. Janet makes her next FOMC announcement on June 17. I doubt she hikes rates then, but I hope she does.
22. Borrowing costs will rise for the US government as Janet hikes rates, and I’ll clap enthusiastically as she makes that move. Global stock markets could crash, but the only way to raise the employment participation rate and the inflation rate is to increase the velocity of money.
23. All roads lead to gold, silver, and gold mining/jewellery stocks, in the coming reflationary era. Please click here now. That’s the daily chart for silver. Look at the position of my Stochastics oscillator, with lead line at nine! Silver is my favoured metal in the “reflationary era”.
24. Please click here now. That’s the GDXJ chart. It’s no secret that junior gold and silver stocks are the darling of the Western gold community. Arguably, America was built by men and women in overalls, and destroyed by bankers wearing suits. Junior gold mining companies give investors a chance to relive what made America an empire, and bet against what is probably going to burn it down. From a short term technical perspective, GDXJ looks spectacular. Note the bullish hook appearing on my Stochastics oscillator. Gold stocks swoon going into June, much like America swooned going into the year 1776. Was America a buy in 1776? Are gold stocks a buy in June? The answer to both questions is obviously… yes!
Stewart Thomson of Graceland Updates, Guest Contributor to MiningFeeds.com
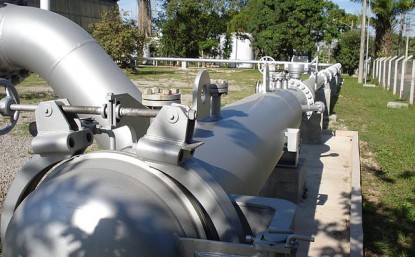
Gold remains deeply out of favor thanks to global central banks’ extreme money printing. This fueled a global stock-market levitation that has temporarily short-circuited normal market cycles, leaving investors infatuated with stocks to the exclusion of prudent portfolio diversification. This has left them radically underinvested in gold, which sets the stage for massive mean-reversion buying when they inevitably return.
Portfolio diversification is an absolutely essential tool for investment risk management. This simple and powerful wisdom is ancient, as a three-millennia-old quote from the Israeli king Solomon reveals. He advised, “Invest in seven ventures, yes, in eight; you do not know what disaster may come upon the land.” Indeed history has proven countless times that putting all one’s eggs in one basket is foolish.
And that doesn’t just mean diversifying portfolios across individual stocks, but entire asset classes. The vast majority of stocks are highly correlated with each other, and the general stock markets. So when the next major selloff inescapably arrives, individual stocks are all going to spiral lower together. While owning different stocks mitigates individual-company risks, it has very little diversification value in major selloffs.
So throughout the dozens of centuries since the super-wise Solomon opined on portfolio diversification, the truly smart investors have diversified across asset classes. While they owned stocks or whatever the equivalent ownership stake in businesses was in their time, they also owned the local bond equivalent, real estate, and precious metals. Because of its unique behavior, gold is the most important diversifier of all.
Stocks are highly correlated with each other, and the stock markets as a whole are highly correlated with the broader economy. And so are bonds and real estate. So when the market cycles inexorably turn and a new bear market begins, these portfolio mainstays all drop together. The precious metals are the only major asset class with a strong inverse correlation to stock markets, they thrive when stocks are weak.
Prudent investors have always understood gold’s indispensable roll in portfolio diversification. The best financial advisors throughout history have recommended all investors have 5% to 20% of their portfolios in gold. It is the ultimate portfolio insurance, tending to rally dramatically when everything else sells off. But thanks to the extreme central-bank distortion in the stock markets today, gold has been left for dead.
Stock markets normally meander in endless bull-bear cycles, driven by valuations. But in early 2013, the Fed’s unprecedented open-ended third quantitative-easing campaign started short circuiting them. The Fed was aggressively conjuring money out of thin air to buy bonds. And Fed officials kept on hinting that they would ramp up these debt monetizations if the stock markets fell materially, greatly altering psychology.
Normally investors are wary of periodic healthy selloffs that rebalance sentiment, and act accordingly. But with the Fed effectively backstopping stock markets, this prudence vanished. Every selloff since early 2013 was quickly nipped in the bud. Buy-the-dippers rapidly flooded back in, usually on direct Fed-official jawboning. Eventually, investors started believing that serious stock selloffs can’t happen anymore.
So they forgot about prudent portfolio diversification, and moved all their capital into that stocks basket. They bought into the Fed-fostered fantasy that the stock markets were essentially riskless as long as Fed policy remained super-accommodative. So they abandoned gold, leading to today’s situation of radical underinvestment in this essential negatively-correlated portfolio asset class. This extreme anomaly won’t last.
American investors have probably never been close to even having 5% of their portfolios in gold, the lower end of the historical best practice. But we can still approximate how much their gold exposure has plunged in these recent Fed-distorted years. This is evident through comparing two key metrics, the capital invested in the GLD gold ETF and the collective market capitalization of the elite S&P 500 companies.
GLD is the world’s dominant gold ETF, and acts as a conduit for the vast pools of stock-market capital to flow into and out of physical gold bullion. It is the cheapest, easiest, and fastest way for stock investors to get gold exposure in their portfolios. And of course the S&P 500 (SPX) is the flagship benchmark US stock index, containing the biggest and best US companies. The contrast between the two is illuminating.
This week, the gold bullion held by GLD on behalf of its shareholders was worth $27.1b. Meanwhile the total market cap of all SPX companies was $19,729.8b. Run these numbers, and it suggests American stock investors’ total portfolio exposure to gold is just 0.14%. That’s far too trivial to offer any portfolio diversification at all. And such radical gold underinvestment is very atypical, even in the gold-agnostic US.
Back in December 2012 just before the Fed’s incredibly-manipulative QE3 campaign kicked into full gear, GLD’s holdings were worth $74.1b. That worked out to 0.56% of the SPX components’ market cap. While still low, that was a whopping 4.1x higher than today’s anomalous levels. And back in August 2011 the last time gold was really in favor, this GLD-holdings/SPX-market-cap ratio climbed to 0.79%.
So even in recent history, relative gold investment as a percentage of stock investors’ portfolios was 5.8x higher than today’s levels! This reveals how extreme today’s gold underinvestment by American stock investors is. Their portfolio gold exposure today via GLD is only around 1/6th of peak levels relative to stocks, and about 1/3rd of absolute levels in terms of capital invested in GLD. This is super-bullish for gold!
At some point soon here, these central-bank-levitated world stock markets are going to roll over hard. History is crystal-clear in proving that central-bank money printing can only amplify and stretch market cycles, it can never nullify them. And as investors face the first major stock-market selloff since way back in late 2011, they are going to scramble to buy gold. It will be rallying strongly while everything else is falling.
As the vast pools of stock capital start migrating back into GLD, it will be forced to shunt these inflows directly into physical gold bullion. GLD acts as a conduit for stock-market capital to flow into and out of physical gold. That’s the only way GLD can maintain its mission of tracking the gold price. Since the supply and demand for GLD shares is independent of gold’s own, GLD’s managers have to actually buy and sell gold.
When GLD shares are being bought faster than gold itself is being bought, this ETF’s price threatens to decouple to the upside and fail to mirror gold. So GLD’s managers must offset this differential buying pressure by issuing sufficient new shares to satisfy this excess demand. The capital raised is then used to buy physical gold bullion held in vaults for GLD’s shareholders. Stock capital flows into gold via GLD.
But capital pipelines work both ways. When investors sell GLD shares faster than gold is being sold, its price will disconnect to the downside. GLD’s managers have to buy back enough shares to sop up this excess supply. They raise the necessary capital to do so by selling some of GLD’s holdings of gold bullion. So stock capital also flows out of gold through GLD, which is what has happened in recent years.

Since the dawn of full-strength QE3 in early 2013, investors have wholesale abandoned gold in favor of Fed-levitated stock markets. This chart shows the quarterly changes in GLD’s holdings, reflecting the massive outflows of stock investors’ capital from gold. This extreme selling peaked in Q2’13, when GLD’s holdings plummeted by 251.8 metric tons as investors fled. That drove gold’s worst quarterly loss in 93 years!
Overall between December 2012 and GLD’s recent extreme 6.3-year holdings low in January 2015, investors dumped so many GLD shares that it was forced to liquidate 648.5t of gold! That works out to about 25.9t of gold per month. These epic outflows were so great that they overwhelmed normal gold investment demand, forcing gold’s price sharply lower. Gold was above $1700 right as GLD’s epic selloff started!
Gold investors need to realize how incredibly important stock-market capital flows have become for prevailing gold prices. The amount of capital invested in the stock markets is enormous, dwarfing gold. So when stock investors are buying or selling gold in a big way via GLD, the resulting capital shunted into or out of physical gold bullion has a dominating price impact. This is readily evident in this chart.
Note how closely the red gold price correlates with the blue GLD bullion holdings in recent years. Gold could only rally significantly after GLD’s holdings stabilized and started rising again. This proved true in Q3’13, Q1’14, Q2’14, and Q1’15. Whenever GLD’s holdings were falling, indicating differential selling pressure on GLD shares, gold slid in unison. The additional gold supply spewed by GLD came too fast to absorb.
So if you want to know which way gold is likely heading next, look to GLD. When stock investors have high gold exposure via this ETF, that indicates that gold is likely in favor and in danger of topping. And when they have low gold exposure like today, gold is out of favor and likely bottoming. So the best time to invest in gold is when GLD’s holdings are low, since stock investors have little portfolio-diversifying gold.
And that describes today’s conditions perfectly, as the radical gold underinvestment has manifested in GLD. Thanks to the euphoric global stock markets in recent months, and investors’ irrational belief that central banks have miraculously eradicated stock-market cycles, GLD’s holdings have slumped considerably. This week they were just 0.7% above their extreme early-January-2015 low, which is intriguing technically.
GLD’s holdings look to be carving a massive double bottom. Even though gold was weak while central-bank-goosed stock markets surged to record highs as 2014 ended, GLD’s holdings stopped falling. That strongly suggests stock investors reached selling exhaustion on gold. All of them susceptible to being scared into selling low had already done so, leaving only buyers. This next chart zooms in on that bottoming.

As gold fell deeply out of favor in early January 2015, bearish commentary abounded. Everyone, even most of the long-time gold bulls, was forecasting major new lows soon. Sentiment was overwhelmingly pessimistic, with all hope seeming lost for gold. Yet the darkest, most-out-of-favor times are right when markets are ripe for sharp reversals. And that’s exactly what happened in GLD as investors flooded back in.
As gold itself started surging higher on heavy buying by American futures speculators, stock investors quickly pounced on this momentum and aggressively bought GLD shares. Their serious differential buying pressure catapulted GLD’s holdings higher as its managers shunted all those excess capital inflows into physical gold bullion. So January enjoyed GLD’s best monthly holdings build since November 2011!
And with GLD’s holdings once again slumping back down near those same early-January levels that marked a selling-exhaustion bottoming, another sharp reversal is likely imminent. Some catalyst is nearing that is going to reignite stock investors’ demand for gold. I suspect it will be a sustained and decisive selloff in these wildly-overextended and overvalued US stock markets, which is long overdue.
While the Fed hasn’t started unwinding any of the past 6.5 years’ extreme bond buying yet, it is rapidly nearing the end of its zero-interest-rate policy launched in December 2008. This will begin the Fed’s first rate-hike cycle in 9 years. Higher interest rates are very damaging to overvalued stock markets, and this coming rate-hike cycle is exceptionally risky. The Fed has never before normalized out of zero rates!
As the resulting adverse stock-market reactions and sheer uncertainty mount, stock investors are going to remember that ancient wisdom of prudent portfolio diversification. They are going to try and mitigate the growing losses in their stock-heavy portfolios by shifting some capital back into GLD. And since the gold market is so small relative to the stock markets, it won’t take much capital inflows to catapult gold higher.
Once this whole mean-reversion process gets decisively underway for the stock markets and gold, it isn’t likely to stop until it has fully run its course. That means investors have a long ways to go to return their gold portfolio allocations to more reasonable levels. While gold-skeptic American stock investors will probably never get to 5% of their portfolios allocated to gold, they will go far higher than today’s dismal 0.14%.
Remember that GLD’s holdings have been up to 6x higher in recent years relative to the S&P 500 components’ collective market capitalization. I have no doubt we will see those 0.79% levels again in the coming years. GLD’s holdings will almost certainly exceed 1% of the SPX’s market cap the next time gold really returns to favor. But to be super-conservative, let’s just assume this allocation grows 3x to 0.42%.
It will probably at least take a full-blown correction approaching 20% in the S&P 500 to drive stock investors’ demand for portfolio-diversifying gold via GLD that high. It’s been far too long since hyper-complacent stock markets have seen one thanks to the Fed’s gross distortions. That would drag the S&P 500’s market cap back down to $15,905.8b. Multiplying that by 0.42% gold exposure via GLD is very bullish for gold.
This yields GLD’s holdings climbing back up to $66.8b. That is nearly 2.5x more capital invested in GLD than today’s levels! And as the sharp gold rallies in recent years partially fueled by GLD buying proved, that would really light a fire under gold. Assuming gold was about 25% higher than today near $1500, still way below its pre-QE3 2012 average around $1675, would yield GLD holdings back up near 1385 tonnes.
That is nearly double today’s levels, yet still barely above December 2012’s record of 1353.3t. And even if an SPX correction is not sufficient to drive this, even if it takes an overdue 50% bear market, so much GLD buying will massively boost the gold price. Stock bear markets take about a couple of years to unfold. And even at that pace, this mean reversion higher of GLD’s holdings works out to 28.1t of new monthly buying.
According to the World Gold Council, in all of 2014 global gold investment demand averaged 68.4t a month. So American stock investors ending their radical gold underinvestment and returning to GLD could boost this on the order of 40% for a long time. And that doesn’t include the big coming buying from American futures speculators, another large pool of capital with an outsized influence on gold price levels.
So as today’s radical gold underinvestment as manifested in GLD’s holdings inevitably reverses and mean reverts back to normal levels, gold investment demand is going to soar. This will naturally power gold’s price much higher, unleashing gold’s first major upleg of this post-QE era. And the Fed’s coming rate hikes are nothing to fear, as gold actually thrives in rising-rate and high-rate environments!
While gold and GLD will enjoy great gains as stock investors inevitably return, they will be dwarfed by those in the left-for-dead gold miners’ stocks. Late last year they were battered down to fundamentally-absurd levels relative to the gold price which drives their profits. So they are poised to rally dramatically as soon as gold turns around, with the greatest potential gains by far of any sector in all the stock markets.
The bottom line is American stock investors are radically underinvested in gold, as evidenced by GLD’s low gold-bullion holdings. This is a result of the Fed’s artificially-levitated stock markets of recent years, which duped investors into forgoing prudent portfolio diversification. As the stock markets roll over, gold is going to return to favor in a big way. It is the only major asset class strongly inversely correlated with stocks.
As these lofty stock markets sell off, stock investors will flock back to GLD. All their differential buying pressure will force this ETF’s managers to shunt great amounts of capital directly into physical gold bullion. That will really accelerate gold’s coming upleg, triggering even more GLD buying. Investors who buy in ahead of this coming major mean reversion in gold investment demand stand to make fortunes.
Ucore Rare Metals Inc. (UCU.V) / (UURAF) has released a plethora of good news since early March, yet the stock price is virtually unchanged, at $0.35. But up from 30% from early May. Intuitively and fundamentally this makes little sense. In an article I wrote on April 22nd, I listed 10 reasons to buy Ucore’s stock. As a reminder for those who read it, the 10 reasons were listed in the final paragraph. This time, spoiler alert be damned, I’m listing the top 3 reasons right here. Rest assured, I still believe in my, “10 compelling reasons to buy” thesis.
Have investors forgotten about the US$145 million AIDEA loan?
The top 3 reasons to buy Ucore stock sooner rather than later are 1) the AIDEA loan of up to US$ 145 million, old news? 2) very significant progress on Ucore’s and technology partner IBC Advanced Technologies’ “IBC” Molecular Recognition Technology, “MRT,” and 3) an unwarranted cheap valuation. Diving right in, lost in the shuffle of the MRT excitement and debate is last year’s news that Ucore obtained what appears to be a pre-approved loan of up to $145 million from an Agency in the AAA-rated State of Alaska. For those skeptical of the State of Alaska’s “AIDEA” willingness to move forward, consider that,
“Ucore is pleased to comment on the passage of Senate Bill 99 by a unanimous vote, with all 38 representatives in attendance voting in favor of the bill. SB 99… would authorize the Alaska Industrial Development and Export Authority ‘AIDEA” to issue bonds to finance the the infrastructure and construction costs of the Bokan-Dotson Ridge rare earth element project up to a principal amount of US$ 145 million…”
The key progress made since early March de-risks the Bokan-Dotson Ridge project and the company as a whole. The faster Ucore advances towards pre-construction, the more rapidly the AIDEA loan will be disbursed. The progress of Ucore’s MRT segment could help self-fund the development of Bokan-Dotson. Assuming the AIDEA loan comes through, shareholders’ equity committment is likely to be a lot smaller than that of peers. To reiterate, the potential $145 million AIDEA loan is quite valuable to shareholders. Other lenders might be interested in co-investing with the State of Alaska. That would suggest the possibility of less equity dilution down the road.
Another vote of confidence in MRT
Reason # 2 regards MRT news, namely that it, “…successfully separated each of the rare earth elements (“REE’s”) at high purity.” How high? 7 of the 14 reported results came in at 99.9% with the single lowest purity at 99.0%. For skeptics of these lab-scale results, this was no magic trick. This is the culmination of years of hard work, spearheaded by IBC. The following day’s news was highly significant as well. Ucore entered into an agreement with IBC to acquire exclusive rights to IBC’s SuperLig® MRT for rare earth separation, recycling and tailings processing applications.
The latest newsworthy event is a vote of confidence in MRT. Ucore entered an agreement with a high net worth U.S. (full disclosure, it wasn’t me!) Investor in which the Investor will pay US$ 4.0 million (approximately C$ 4.9 Million) to Ucore for a royalty on the sale of products and services related to the processing of rare earth elements and other specialty metals utilizing, “MRT.” This deal means that shareholders are not initially diluted and probably never will be (my opinion only). Even though the investment can be converted into common shares, the higher the stock trades, the less likelihood of conversion because a higher share price would presumably mean a successful pilot plant, putting MRT a leap closer to commercialization.
An investment at this early stage of MRT’s rare earths development is telling. The high net worth Investor did substantial due diligence, including retaining experts in fields applicable to the separation of rare earth elements. More experts, investors and interested parties are kicking MRT’s tires. In a recent interview of Ucore’s Mark MacDonald, and Reed and Steve Izatt of IBC, the following quote by Steve Izatt is instructive,
“We have separated the entire suite of individual rare earths. This offers incontrovertible proof that our MRT process works at lab scale. We have scaled up numerous other projects outside of REEs based on our proprietary SuperLig® products. The proven separation characteristics of MRT, coupled with our actual accomplishments in scaling up similar processes should give investors significant confidence… MRT is supported by world-class science in its development and commercial applications. Both the chemistry and engineering of the MRT processes is well understood. We are very familiar with the key parameters necessary for successful scale-up and commercialization…”
In other words, MRT has been scaled up in many applications, just not in rare earth elements yet. IBC and Ucore have already done the heavy lifting, separating rare earths at high purity and 99% recoveries. The pilot scale project is a stage that IBC experts have been through dozens of times. In my opinion, Ucore’s eventual use of MRT at commercial scale is an exercise in engineering, not contingent on technological advances or chemistry. See full interview here.
Is Ucore’s valuation too low?
Reason #3 to buy Ucore’s stock is valuation, a topic subject to many opinions. I believe Ucore controls three valuable assets. A highly perspective rare earth deposit, skewed meaningfully towards heavy rare earths, a potentially game-changing separation technology and (in my opinion) the expectation of obtaining the US$ 145 million AIDEA loan based on the unanimous vote by the Alaskan Senate. In Ucore, the whole is worth considerably more than the sum of its parts. Assuming that Ucore’s development of Bokan-Dotson is reasonably valued at C$65 million, i.e. the market cap of the company, then investors get a free option on MRT.
Why should one assume that the valuation of Bokan-Dotson is fair? Look no further than the proposed AIDEA loan. As far as I know, no other emerging rare earths company has that magnitude of potential support. Again the whole is worth more than the sum of its parts. Therefore, the assumption that investors get a free option on MRT is not an aggressive one. The question of how to value MRT is the most subjective of all. One could point to the high net worth Investor’s royalty deal as an indication. C$4.9 million for a royalty in a single, “Tier 1″ MRT project. Not multiple projects, not exclsuvie rights in a jurisdiction(s), one MRT project. Due to my bullishness on MRT, I think that the high net worth Investor is getting a good deal, and won’t convert into common shares of Ucore. However, Ucore is not giving away all that much if MRT scales up to become a viable solution to rare earth peers and in hundreds or even thousands of tailings and remediation applications. The Net Present Value, “NPV” of steady, recurring income from royalties and/or leasing MRT could be quite large over time. That’s why I mentioned the NPV.
Conclusion
There are comparable companies much, more advanced than Ucore, that have steady, recurring revenues, one is Franco-Nevada, (FNY) and another is Silver Wheaton (SLV). These two royalty / streaming companies trade at 14x-16x trailing 12 month revenues. By no means do I forecast or expect MRT to command that type of valuation, I mention this simply because investors love steady and recurring revenues. The quicker Ucore / IBC can move through the pilot plant stage and construction of their first commercial scale rare earths separation facility, (not a sure thing) the more self-funding of Bokan-Dotson and an increasing understanding of how to value MRT on its own. I submit that shareholders and prospective investors are getting a free option on MRT, an option with several years until expiry, a valuable option.
Disclosures
Mr. Epstein had no prior or existing relationship with Ucore Rare Metals before April 10, 2015. For Any article(s) written on EpsteinResearch.com, or posted on other websites, subsequent to 4/10/15, Ucore Rare Metals was/is a sponsor of EpsteinResearch.com on a month-to-month basis. As of the latest updated Terms of Use & Disclosures, and at the time article(s) was/were on EpsteinResearch.com, or posted on other websites, Mr. Epstein owned/owns no shares of Ucore. Investors should consult with their own advisors before making investment decisions. Mr. Epstein is not an investment advisor. The article(s) on this company on EpsteinResearch.com, or posted on other websites, should be viewed in this context. Ucore is highly speculative and not suitable for all investors. A link back to this continually updated disclosure page will be included at bottom of any article(s) that appear(s) on EpsteinResearch.com or posted on other websites.

1. The month of June is typically a boring one for gold and silver price action, although the latter half of the month tends to be a bit better for gold.
2. Please click here now. That’s the seasonal chart for silver, courtesy of Dimitri Speck.
3. India is the world’s main market for silver, and demand shrivels a bit during the May – June timeframe.
4. As a result, the silver price usually swoons, and frustrated investors can make irrational statements about this mighty metal.
5. It’s just a seasonal swoon, like an ocean tide change. The silver price tide will come back stronger than ever, because demand from the Hindu religion is cyclical and inelastic.
6. India is now the world’s fastest growing major economy. As the citizens get “richer”, they celebrate key gold and silver buying festivals with bigger purchases.
7. Please click here now. That’s a five minute bars chart for silver (July contract), highlighting yesterday’s price action.
8. Without the bedrock of strong seasonal demand from India right now, news like the upcoming US jobs report on Friday can create a lot of intraday price volatility.
9. Please click here now. That’s the seasonal chart for gold. Gold typically bottoms around mid-June, after peaking around mid-May.
10. In my professional opinion, as demand in India wanes a bit, amateur technical analysts in the Western gold community tend to get somewhat overly-nervous about what is really just a short term lull in demand.
11. Unfortunately, I think a lot of the spike in fear each May and June may be related to their excess use of leverage.
12. There’s no need to point gigantic arrows towards drastically lower prices on the gold and silver charts now, regardless of what shapes, patterns, and signals appear to be there.
13. Charts don’t make fundamentals. Fundamentals make charts.
14. On that note, please click here now. That’s the daily chart for gold. The recent price action has been “seasonally perfect”. A peak occurred in mid-May, and gold has drifted lower, logically, since then.
15. The bottom seasonal line: Eager gold and silver price enthusiasts should expect a major rally to begin in about two weeks, and continue for several months.
16. Please click here now. Gold jewellery is the biggest source of demand for gold, and most jewellers in China, Dubai, and India are in “expansion mode”.
17. Indian gold jewellery demand is growing about 15% a year, while mine supply grows at about 1% a year. Looking at these numbers alone, it doesn’t take a rocket scientist to see why borrowing money from banks to bet on lower gold and silver prices, is not very wise.
18. Gold jewellery was never taken by the US government during the last bout of confiscation/revaluation. It can be insured and stored legally in safe deposit boxes. So, it’s truly great news to see the World Gold Council taking concrete steps to further expand demand for the “ultimate asset”.
19. While demand for gold and silver are soft due to the Hindu calendar, the US stock market is beginning to look a bit like an old sailboat manned by heroin addicts, heading into a hurricane.
20. Please click here now. In the big picture, QE has been tapered to zero, inflationary rate hikes are imminent, US frackers are counting on OPEC to bail them out, and yet mainstream media continues to call the US economy’s minus 0.7% performance in 2015 Q1 a “world leader”.
21. Goldman Sachs economists are calling the US stock market overvalued by almost every metric they use. They’ve lowered their long term forecast to under 2% GDP growth.
22. Alan Greenspan, who has no “book to talk” now, has called the US government’s general approach to building a welfare state “unsustainable”. When considering the current minor cyclical lull in gold and silver demand related to the Hindu religion, against the background of the dire need for an America soaked in “debtaholic napalm” to reflate itself, any sane investor is going choose the mighty metals as their prime investment vehicle of choice in the coming years.
23. Please click here now. That’s the daily chart for Barrick Gold. I’ve highlighted the main recent intermediate trend movements with solid green and red arrows. The arrows are nicely in sync now, with the seasonal gold chart trends. Note the excellent position of my key 14,7,7 Stochastics oscillator, at the bottom of the chart!
24. I use Newmont as a leading indicator for the entire gold mining stock sector, and Barrick as a confirming indicator. Also, I suggested a few months ago that Barrick was likely to form an interesting right shoulder of a complex inverse head and shoulders bottom pattern, and drop towards the $11 area. That’s in play now, and all gold mining stock fans should highlight the mid-June timeframe on their calendars. It’s a highly likely turning point for Barrick, and for the entire sector!
Stewart Thomson of Graceland Updates, Guest Contributor to MiningFeeds.com
If you would like to receive our free newsletter via email, simply enter your email address below & click subscribe.
 Follow us on Twitter
 Become our facebook fan
CONNECT WITH US
Tweets
Tweet with hash tag #miningfeeds or @miningfeeds and your tweets will be displayed across this site.
MOST ACTIVE MINING STOCKS
Daily Gainers
 CMC Metals Ltd. CMC Metals Ltd. |
CMB.V | +900.00% |
 Eden Energy Ltd Eden Energy Ltd |
EDE.AX | +200.00% |
| GoviEx Uranium Inc. |
GXU.V | +42.86% |
| Eagle Nickel Ltd. |
ENL.AX | +41.67% |
| Citigold Corp. Limited |
CTO.AX | +33.33% |
| Mount Burgess Mining NL |
MTB.AX | +33.33% |
| Exalt Resources Limited |
ERD.AX | +31.94% |
| Casa Minerals Inc. |
CASA.V | +30.00% |
| Cariboo Rose Resources Ltd |
CRB.V | +28.57% |
| Belmont Resources Inc. |
BEA.V | +28.57% |


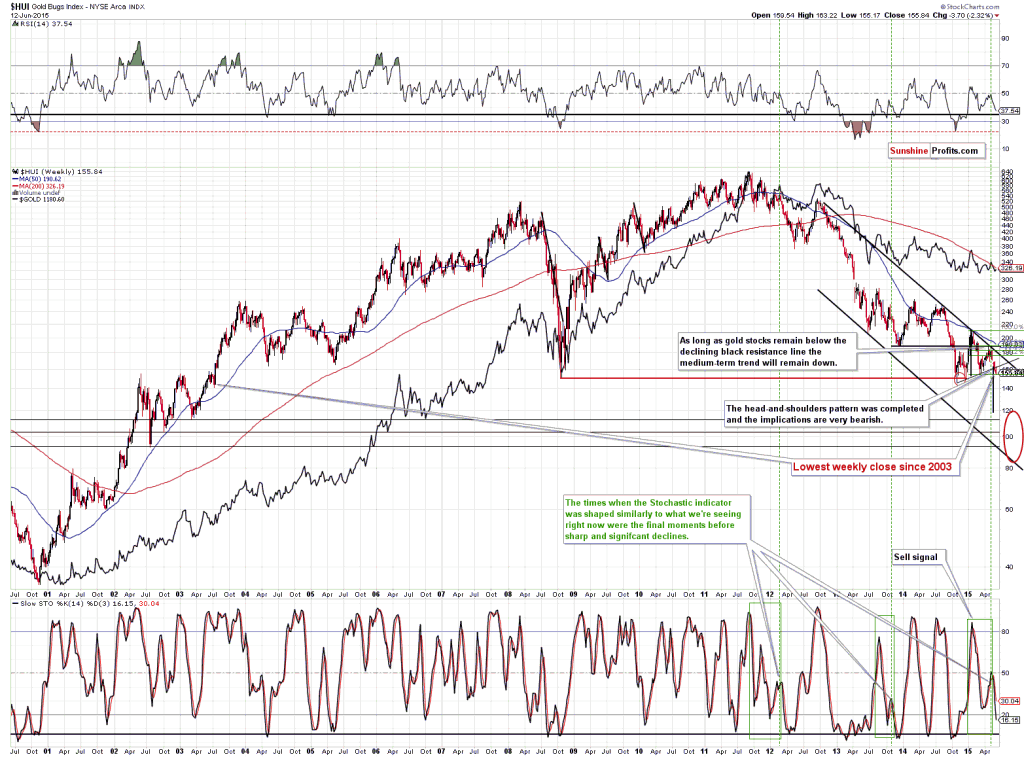