

Last month, the 2015 edition of the In Gold We Trust report was released. What can we learn from this publication?
As always in June, Incrementum AG (an independent asset management & wealth management company based in the Principality of Liechtenstein) published its annual “In Gold We Trust” report, the extended version of which can be downloaded here. We know that it was published one month ago; however, it took a while to dig through the 140-page text. Because it offers many interesting insights into the current global economy and the gold market, we provide a short summary for you today.
The main idea of the report is that there is a constant struggle between deflationary and inflationary forces. Since 2011, disinflationary forces have clearly dominated the market (think about the declines in commodity prices). According to the authors, this is why so many market participants have lost faith in gold. However, if the inflation trend reverses, excellent opportunities in inflation-sensitive investments such as gold will emerge. They point out that we now actually witness inflation, not consumer price inflation, which occurs always later, but rather asset price inflation. The authors believe that governments and their central banks will eventually tackle the increasing debt problem with money printing and inflation.
We doubt that inflation is the main driver (especially in the short term) of the price of gold (in 80s and 90s the price of gold was falling despite inflation). We argue that the price of gold reacts more to the faith in the current monetary system, and it is in a sense a reciprocal of the credibility of central banks. The authors agree with that, since they explain the disappointing gold performance in dollar terms last year, by pointing out that “at the moment, it appears as though faith in the omnipotence and infallibility of central banks is at an all-time high”. They also mention other factors behind the weak trend, such as strong disinflationary trends and the associated increase in real interest rates, the Fed’s tapering and declining money supply growth rate, rising opportunity costs due to a rally in stock markets, increase in risk-appetite, and rising expectations of a Fed’s rate hike.
Although the report seems to attach too much importance to the relationships between debt, inflation and gold, and to Asian demand, and it incorrectly predicted China’s official reserves (“we believe it is realistic that China now holds 4,000 to 6,000 tons”), it provides interesting information. For example, the global gold price (gold price not in US dollars, but in the trade-weighted foreign exchange value of the dollar) already entered a new uptrend in the autumn of 2014, gold exhibits clear seasonal trends with the second half of the year being the strongest, and the global gold trading volume amounted to 550,000 tons last year, which is roughly equivalent to 188 times annual mine production (this fact explains why the mine production does not drive the price of gold).
In the context of the FOMC July meeting and the Fed’s possible hike, they point out that although the federal funds rate and gold prices exhibit clear negative correlation, some periods can be observed during which the relationship collapses (indeed, three of the largest gold rallies of the post-1971 era occurred in rising nominal rate environments).
To sum up, the last edition of the In Gold We Trust report is a very lengthy, but interesting publication. Although we recommend skepticism on the authors’ long-term gold price target of $2,300 per ounce within three years (it seems that they have stuck to this target since 2007), they properly define gold as an “antithesis to paper money” and a monetary asset (not as just another commodity), realize gold’s safe-haven and portfolio diversification features, and cite convincing explanations for the relatively weak performance of the price of gold (in U.S. dollar terms) last year.
Disclaimer
All essays, research and information found above represent analyses and opinions of Arkadiusz Sieron and Sunshine Profits’ associates only. As such, it may prove wrong and be a subject to change without notice. Opinions and analyses were based on data available to authors of respective essays at the time of writing. Although the information provided above is based on careful research and sources that are believed to be accurate, Arkadiusz Sieron and his associates do not guarantee the accuracy or thoroughness of the data or information reported. The opinions published above are neither an offer nor a recommendation to purchase or sell any securities. Mr. Sieron is not a Registered Securities Advisor. By reading Arkadiusz Sieron’s reports you fully agree that he will not be held responsible or liable for any decisions you make regarding any information provided in these reports. Investing, trading and speculation in any financial markets may involve high risk of loss. Arkadiusz Sieron, Sunshine Profits’ employees and affiliates as well as members of their families may have a short or long position in any securities, including those mentioned in any of the reports or essays, and may make additional purchases and/or sales of those securities without notice.
Peter Epstein, CFA, MBA conducted the following interview by phone and email in the week ended July 28th. The views expressed herein are entirely that of Pure Energy Minerals’ management team and Board. To the best of Mr. Epstein’s knowledge, the facts presented by CEO Robert Mintak in this interview are accurate. Mr. Epstein owns no shares of Pure Energy Minerals at this time. Mr. Epstein may or may not acquire shares in the open market at a later date. Please see further disclosures at the bottom of this interview.
Please explain Pure Energy Minerals to readers unfamiliar with your Company?
Pure Energy Minerals [ TSXV: PE; OTC: HMGLF; GR:AHG1 ] is a lithium-brine resource company with a goal of becoming the lowest cost lithium supplier in North America. We are focused on advancing our Clayton Valley Lithium Brine Deposit, “Clayton Valley,” in Nevada. Pure Energy recently released a NI43-101 compliant Inferred Resource Estimate of 816,000 metric tonnes of Lithium Carbonate Equivalent, “LCE” over 8,000 acres across our claim area, inferring a globally significant resources adjacent to the only lithium production facility in North America, Albemarle’s Silver Peak Lithium Mine. [Note: See next question.]
The Company is aligned with global technology partners focused on innovative solutions for lithium brine processing. Based in Vancouver, Pure Energy has a highly experienced management team with backgrounds in finance, exploration, geoscience, lithium processing, permitting and construction. [Please See links to Management Team Below]
On July 28th, Pure Energy filed a NI compliant 43-101 Inferred Resource report (warning 100 pages +) on the Company’s Clayton Valley, Nevada, lithium brine deposit. Please explain its importance.
Yes, this is a key milestone for our Company. The report outlines a NI 43-101 compliant Inferred Resource estimate of 816,000 tonnes of LCE present as easily-extractable brine in two aquifers beneath the Company’s 8,004 acres of claims. We are extremely pleased with this report and believe this deposit to be one of the more important lithium exploration opportunities globally due to its size and location in Nevada.
To advance Clayton Valley to an Inferred Resource, we completed an intensive exploration program including drilling new boreholes to a maximum depth of 970 feet, (296 m). All boreholes drilled encountered lithium-brines, however, they did not encounter the base of the lithium-bearing zones. Thus, the zones that host the brines appear to extend much deeper into the basin and extend laterally, throughout the whole 8,000 acres claim area. As a result, we believe that the Inferred Resource of 816,000 tonnes was estimated using conservative parameters. Pumping tests show that the brine can be sustainably pumped at rates equivalent to those used at Albemarle’s adjacent Silver Peak property.
[NOTE: From the July 28th press release] CEO Mintak states, ‘This initial resource estimate is an important step in validating Clayton Valley and its potential. The estimate is based on an average thickness of just 300 meters. The next drilling stages will test the depth and potential extension of the deposit and test recently discovered zones from our seismic survey. This is a very exciting time for us as we successfully complete key milestones on our resource on-time and on-budget and are able to communicate the tremendous potential of this resource.’
According to your July Corporate Presentation, “lithium brine outpaces hard rock and clay sources on cost, sustainability and permitting with recent technological advancements in processing.” How much of Pure Energy’s story relies on new technology and advancements in processing?
Conventional lithium extraction techniques developed in the 1960’s (at Silver Peak and used globally) involve the use of massive evaporation ponds (4,000+ acres) to concentrate the brines prior to processing. The ponds are expensive to build, only recover ~40%-50% of the available lithium, and require a 12-24 month production (evaporation) cycle, are subject to weather uncertainty and produce large waste piles. In short, evaporation ponds are expensive, unpredictable, harmful, and do not optimize the resource. Although conventional techniques are available, there are several credible organizations committed to developing solutions that have the potential to outperform conventional practice on cost, speed, predictability and sustainability.
Can you please expand upon your prior answer? Emerging lithium players are all turning to enhanced or, “game-changing” lithium extraction processes.
Pure Energy has evaluated a number of lithium extraction technologies. Our research has focused in on two technologies: 1) The LiSX process developed by Israeli mineral processing company Tenova Bateman Technologies, and 2) the lithium extraction technology developed by Korean heavyweight POSCO.
Tenova Bateman’s LiSX technology modifies an existing commercialized solvent extraction process to target lithium, and is capable of producing the various customized high-grade specialty lithium products required by modern industry. This process outpaces its conventional peers because it is environmentally friendly, cost effective, weather-independent, has a process time of <8 hours, and has a much smaller footprint (about 100m by 100m). Tenova Bateman’s process is capable of recovering lithium from waste and by-products, such as spent batteries. Fundamentally, this technology presents the possibility of a viable cradle-to-cradle solution for the use and re-use of U.S. lithium resources.
Pure Energy engaged Tenova Bateman to conduct bench scale testing of their technology using brine produced in Clayton Valley. The results of these tests exceeded our expectations: effectively 100% lithium recovery and production of a very high purity lithium chloride (>99.9%). If viable at commercial scale, this technology could be disruptive and unlock significant value in brine resources. The successful results of this test gets us a step closer towards proving the technology commercially, and Pure Energy intends to continue working with Tenova Bateman to develop the technology for use at Clayton Valley.
The POSCO process is intriguing because it has been proven at pilot scale in Argentina. The development team at POSCO is very credible and of course backed by an entity with a strong balance sheet. So we see value in the application of POSCO’s technology. We have recently shipped brine samples to POSCO for process testing. Ultimately, Pure Energy will complete a technology evaluation that will scrutinize all aspects of these technologies, and perhaps others, and select the best application(s) for our project.
To what extent might Pure Energy’s economics rely on other products besides lithium?
Pure Energy’s primary focus is lithium. There may be other complimentary by-products contained within our Clayton Valley brine, however, these are not currently a factor in our internal preliminary project economics. The Clayton Valley Project will be strongest if the economics prove out based on the lithium resource alone, and that is simple to explain to our shareholders and potential investors. We consider potential by-products and waste recycling as blue-sky opportunities that will be fully considered as the project advances.
What are key corporate developments that investors should watch for this year and next?
Pure Energy is active on a number of fronts and we expect a very busy year ahead. The Company intends to commence exploration work to collect data to support the process of potentially obtaining a NI 43-101 compliant indicated and Measured status report. We will be advancing our technology assessment process with our technology partners. Pure Energy remains very focused on finding a strategic partner to work with to advance the progress of Clayton Valley. The quickest way to possibly commercialize Clayton Valley would be to join with a strategic partner, or to potentially achieve a comprehensive off-take agreement containing development funding and debt financing provisions. Pure Energy is focused on finding the right strategic and/or off-take counter-party that would add maximum value to our project and shareholders.
Do you envision risks to lithium supply over the next 5-10 years? If so, what might they be?
Lithium producers are broadly sophisticated global organizations that have historically performed well to meet global lithium supply. However, demand is increasing substantially, and there are concerns about supply keeping pace, especially for specialty lithium chemicals such as lithium hydroxide.
The biggest risk to mid-term lithium supply is primarily geopolitical. A significant portion of global lithium production is located in countries with high inflation, complex taxation systems, concession limitations, volatile politics and corruption challenges. We are seeing large producers and some developers experiencing headwinds in Chile and Argentina due to some combination of the reasons listed above. For example, in their 2014 year-end earnings statement, FMC forecast a drag on 2015 earnings created by the marco-economic challenges of operating in Argentina. The current annual inflation rate in Argentina hovers around 20%, compared to near 0% in the U.S. In addition, Chile has struggled to execute a clean and transparent concession expansion process. These issues highlight the value of working in stable and supportive jurisdictions such as Nevada.
There are dozens of uses for lithium today, focusing on just two, how does the EV battery opportunity compare to that of the large-scale energy storage opportunity?
Both of these stories hold tremendous promise. Grid storage coupled with renewable energy creates exponential value by smoothing out production and providing electricity when renewables are not available. Growth in this sector is expected to be very healthy at utility, commercial and residential scale. In 2013, California created a mandate pursuant to Bill 2514 calling for 1,325 megawatts of energy storage projects to be procured by 2020, with installation no later than 2024. As of mid-2014, more than 2,000 megawatts of energy storage projects have applied to interconnect with the state’s grid. (California ISO, Energy Storage Interconnection, June 24, 2014.) Most of these projects are lithium storage facilities.
Tesla has also recently announced their residential and commercial stationary storage devices (Powerwall and Powerpacks), which have experienced tremendous uptake by customers with an estimated $800 million in sales in the first week. The energy storage market in 2015 is on pace for a record breaking year, and GTM Research expects the US to deploy 220 MW of energy storage in 2015. To put this in perspective, there is approximately 600-800 kg of lithium carbonate equivalent in every 1 MW of storage capacity.
Lithium-ion battery demand is also being driven by the electrification of the automotive industry, and there is unprecedented investment by the world’s major manufacturers into battery manufacturing facilities in anticipation of the forecast demand. The electric vehicle market continues to present new offerings as electric vehicles transition into the mainstream. The low price of oil could temporarily impact demand for electric vehicles in North America, however, air quality concerns continues to drive the huge market growth in China and to lesser extent, European cities. The Chinese government is pushing to promote cleaner modes of transportation through subsidies and exemptions from restrictions on vehicle registrations.
Can we get a snapshot of your capital structure including cash and debt?
Pure Energy has a very healthy capital structure. We have no debt.
Capital Structure (July 26, 2015)
TSXV: PE; OTC: HMGLF; GR:AHG1
Share Price: C$0.27 Shares on issue: 53.7 million Market Cap: C$14.5 million Debt: Zero
Warrants & Options: 23.6 million 52-week range: C$0.11 to C$0.38 Cash (3/31/15): C$ 1.3 million
Corporate Presentation July 28th press release
Management Bios 2-Page Info Sheet
Pure Energy Minerals TSXV: PE; FWB: AHG; OTC: HMGLF is a speculative, small cap company listed on the Canadian and U.S. markets. An investment in Pure Energy is not appropriate for everyone. Readers and investors are encouraged to do their own due diligence before buying of selling and stocks, especially risky small caps. Due diligence should include consulting with your own investment advisor. The author, Peter Epstein, owns no shares of Pure Energy. Mr. Epstein is not a registered financial advisor. Readers should take this fact into careful consideration.
A new treatise by Christopher Ecclestone on Ucore Rare Metals (UCU.V) / (UURAF) was released on July 15th. The report is from the very well respected Hallgarten & Company. Readers be warned, the report is filled with words that I could neither pronounce, spell or understand, words like, “bedeviled,” “impelling,” “capricious,” “stymied” and “eschewed.” Even the author’s last name is hard to spell. Further, I think I found a spelling error in the dissertation. If true, that’s disheartening to say the least. Ecclestone’s 10 page report can be grasped by the layperson, as long as he/she skips pages 2-7. For those brave souls attempting to consume the entire report, rest assured, there are pictures. Here is a July 23rd Video Clip of Mr. Ecclestone from InvestorIntel.
Seriously though, I believe that getting the gist of the report is achievable. It’s tough sledding, but maybe that’s a good thing. Ucore’s Molecular Recognition Technology, “MRT,” continues to be successfully operated at commercial scale, in a number of other applications, just not for Rare Earth Elements, “REEs,” yet. Importantly, the entire technology / flow sheet is fairly intuitive, albeit not necessarily easy to replicate. For those possessing the requisite kill set, or as Steve Izatt said, not just those with chemical backgrounds, but, “persons with processing and technical backgrounds,” virtually all fall in line. I for one think it hardly matters how complex (or not) MRT actually is. I’m excited and indebted to the experts who DO know how and why MRT works, and have become true believers. That list is growing. Therefore, I’m not a believer in MRT per se, but a believer in the dozens of highly experienced experts using it in the field and others who are confident that MRT will be successful at commercial scale for REEs.
Common words in reports and investment articles include the ubiquitous, “derisked,” with the phrase, “re-rating of the stock” a close second place. For Ucore Rare Metals, these words actually apply, consider the following Ecclestone quote,
“The real problem (and expense) was in the chemistry…. Rare Earths presented as a whole new level of trouble altogether. The requirement in most cases to process all the material through a myriad of chemical phases to get at the more valuable components was mind-boggling and expensive. Moreover it quickly became clear that dealing with substantial amounts of noxious by-products was the price miners would have to pay to achieve commercial product of a desirable product range.”
As Ecclestone explains, the process currently used (solvent extraction) is highly energy intensive, polluting and time consuming. A process that’s been used largely unchanged for decades. Over the past few years, new proposed technologies and flow sheets have come to the fore that show great promise. I’ve said that there’s room for more than just one improved separation solution. However, what helps make Ucore, “derisked” is that MRT is at a more advanced stage, thereby attracting investment dollars.
Notably, the recent injection of C$4.9 million from a high net worth investor in the U.S. When I say, MRT is more advanced, I point to the proposed semi-commercial scale pilot plant expected within six months. Use of the word derisked is appropriate again as MRT has the possibility (some would say likelihood) of not only enhancing the economics of its flagship Bokan Mountain project, but the Company has the exclusive rights to separate all REEs globally. In fact, Ucore also has the exclusive rights to, “mine” tailings ponds and conduct reclamation activities that don’t necessarily retrieve commercially valuable materials, but would still be profitable as a much needed service.
The evidence described above has the potential to, dare I say, “re-rate” Ucore’s stock price. As investors a) see a pilot plant in action, b) Ucore potentially obtaining tolling mandates, c) possibly attract additional non-dilutive investment capital and d) enter into tailings/reclamation contracts, RE-RATING could be at hand! The bottom line on the preceding awkward sentence is simply that cash flows could be coming in faster than investors had hoped, minimizing the need for death by a thousand cuts of equity dilution. Even when the bigger checks need be written, with the warranted excitement around MRT, investors should not forget about the promising US$ 145 million (what I call pre-approved) low-cost loan by Alaska’s AIDEA. Please view these excellent video clips of Jim McKenzie, President & CEO, Ucore Rare Metals Inc. in which he interviews Nobel Laureate Dr. Jean-Marie Lehn.
I’m impressed by Mr. Ecclestone’s report, I know him and believe he’s one of the best writers on a number of natural resource subjects. The fact that he’s on board with MRT and therefore sees great upside in the Company’s valuation is yet another vote of confidence. The more eyes on MRT the better, turning skeptics into believers is the name of the game at this stage. I can’t think of any cogent arguments against MRT that give me pause. Remember each set of eyes that end up believers will both “derisk” and “re-rate” the stock, hopefully at the same time, and sooner rather than later!
For further information on REEs, Please Click Here. For Ucore’s corporate presentation, Please Click Here. For Ucore’s guide to understanding MRT, please Click Here
Ucore Rare Metals is a speculative, small cap company with Canadian and U.S. listed stocks that could continue to be volatile. An investment in Ucore Rare Metals is not appropriate for everyone. Readers and investors are encouraged to do their own due diligence before buying of selling and stocks, especially risky small caps. The author, Peter Epstein, owns shares of Ucore Rare Metals, bought in the open market. Mr. Epstein may buy or sell Ucore Rare Metals stock in the future. Mr. Epstein is not a registered investment advisor. Readers and prospective investors should take that fact into consideration. This article reflects facts and opinions that are entirely my own and not necessarily the views of Mr. Ecclestone or his firm. I have no prior or existing relationship with Mr. Ecclestone or his firm Hallgarten & Company.
Neither is this article necessarily representative of the facts and opinions of any person at Ucore Rare Metals. I wrote this article entirely on my own. I can not verify that the facts and opinions herein are accurate. Mr. Epstein believes the information contained in this article is fair and accurate. As of the date of this article, Ucore Rare Metals is a sponsor of http://EpsteinResearch.com For more information about http://EpsteinResearch.com and to sign up for free, instant article that appear on my website, please simply provide an email on the home page of the website. This is a free email alert, I do not send out more than 3-4 emails per week.
Recently we’ve been writing about the downside potential in precious metals and the danger for precious metals bulls. The gold miners and Silver have led the rout while Gold finally cracked support ($1140-$1150/oz) last week. That led to a severe selloff across the complex. As we pen this on Thursday evening it appears Friday could be a nasty day if Gold breaks below $1080/oz. Nevertheless, the odds now favor a rebound in the weeks ahead and especially in the gold miners.
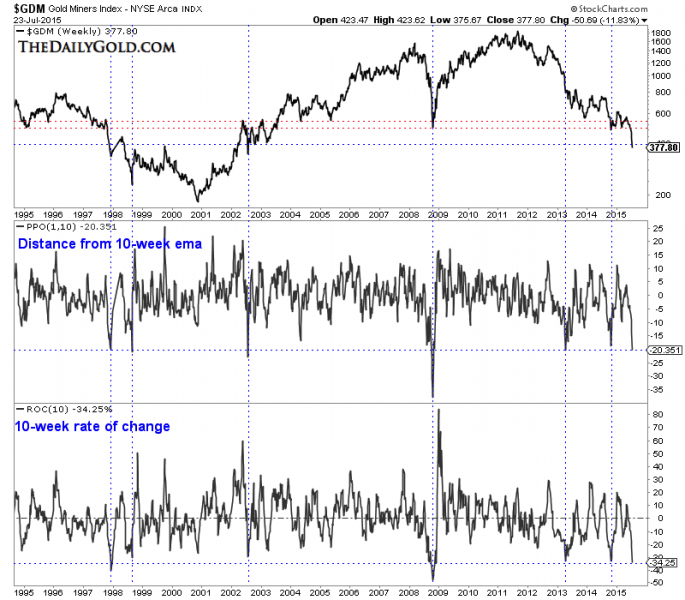
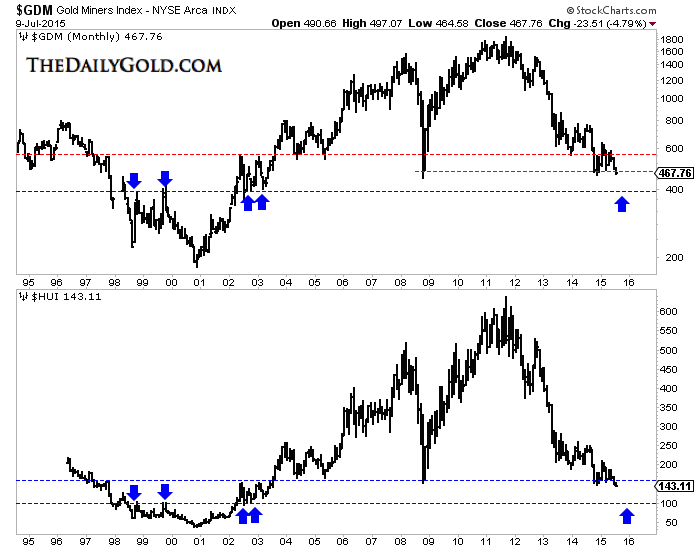
Though GDM (GDX) has closed below support at 400, it has done so in an extremely oversold state. In the first chart we plot GDM with its distance from its 50-week exponential moving average and its 50-week rate of change. If we count the two oversold instances in both 1998 and 2013 as only one then GDM is at one of its five most oversold points in the past 20 years. With a down day on Friday GDM would be at its third most oversold point in the past 17 years.
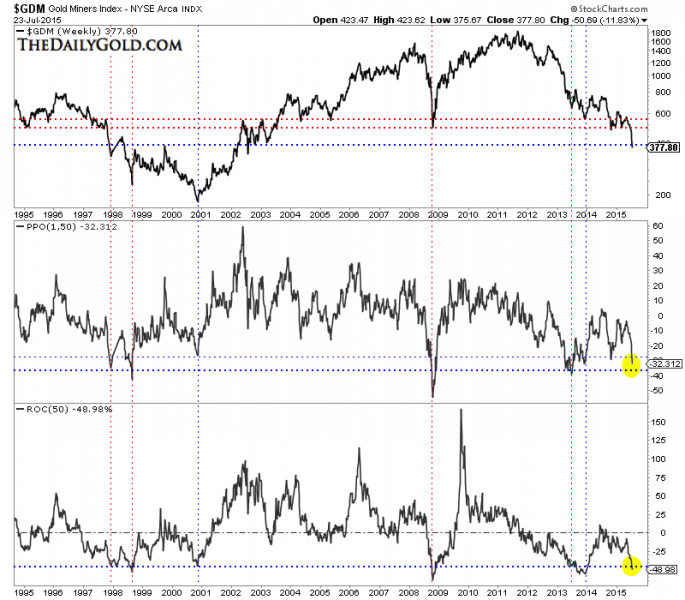
In the next chart we use the same indicators but use 10 weeks instead of 50 weeks. It gives us a medium term look. The oversold dates are nearly identical to those based on 50 weeks. If GDM has a down day on Friday to close the week then it could reach its 2nd most oversold point in the past 17 years.
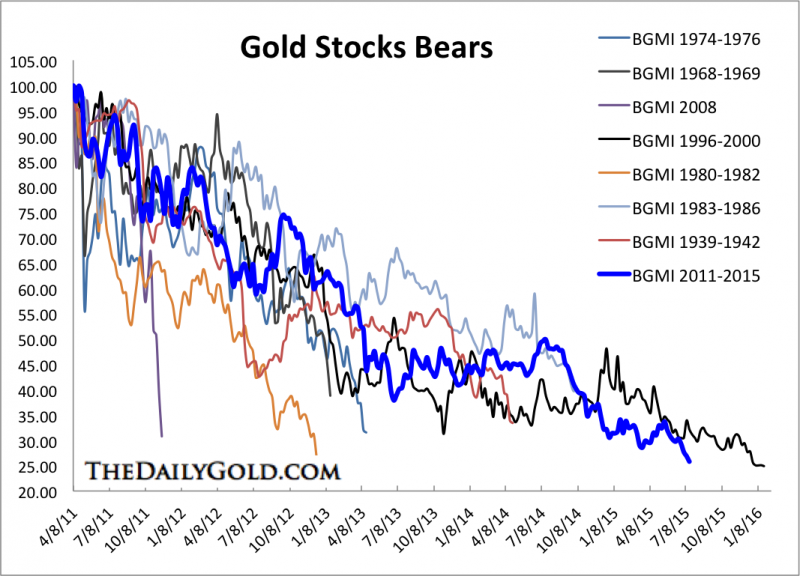
On a cyclical basis, gold mining stocks are arguably the most oversold ever. GDM and XAU have already surpassed their 1996-2000 bear markets. The next data point in the Barron’s Gold Mining Index (whose bear market analog is shown below) will show the current bear surpassing that of 1996-2000. The HUI needs to close at 100 to equal its 1996-2000 bear. Any low in the gold miners weather it occurs in the coming days or next few months has a chance to mark the end of the bear market.
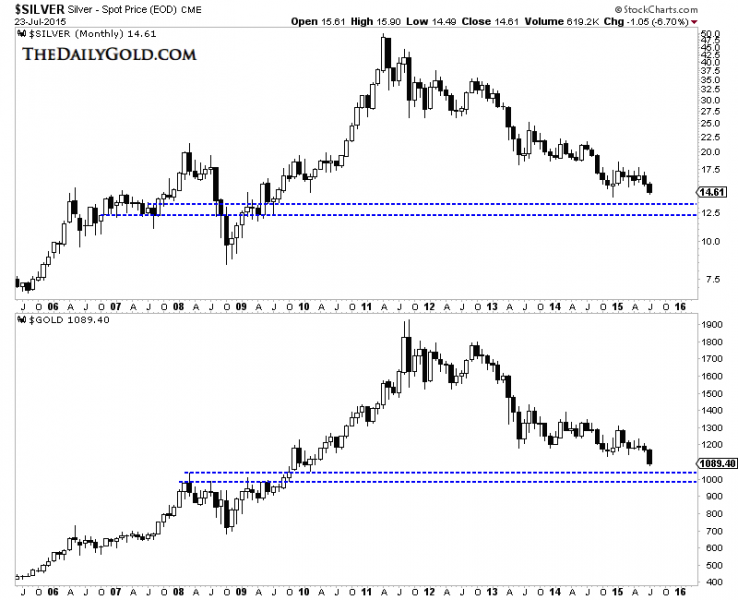
Another reason the miners are close to a rebound is Gold is (unlike in recent weeks) closer to important support. We’ve frequently mentioned targets of $1080/oz (50% retracement) and $1000 to $1040/oz. Below we plot the monthly candles for Silver and Gold. As we pen this article Thursday evening Gold is struggling to hold support at $1080/oz. A breakdown would create more selling but could quickly lead to a rebound from stronger support around $1040/oz.
The miners are now extremely oversold across all time frames and in position for a good rebound. Gold and Silver are not as oversold as the miners but that can certainly change within a few days. While we are unsure if the next low will mark the end of the bear market we can say that regardless, odds favor a big rebound. Consider learning more about our premium service including our favorite junior miners which we expect to outperform in the second half of 2015.
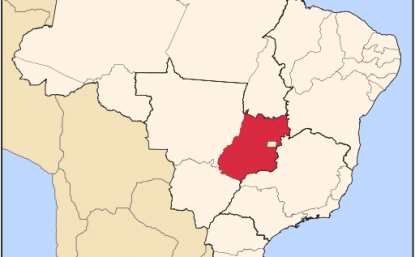
The following interview of Managing Director Mark Papendieck of Orinoco Gold was conducted by Peter Epstein, CFA, MBA over the week ended July 20th. Orinoco Gold is an interesting gold junior with a soon to be producing mine in the Brazilian State of Goias. Without further ado, let’s jump right into the interview. NOTE: Click here for bios of [Management & Board members]
Please describe Orinoco Gold (OGX:ASX) in a single paragraph.
Orinoco Gold (OGX:ASX) is an Australian listed, high-grade gold developer and explorer with a dominant land position in the Faina Greenstone Belt in the central Brazilian State of Goias. The Greenstone Belt has been under-explored, despite hosting a past producing high-grade gold mine (Sertão 250k oz production at 25 grams/ tonne gold, “Au,” now owned by Orinoco Gold). Due to the coarse nature of the gold occurrences in the belt, conventional sampling is difficult and costly. Orinoco is developing its high-grade, low-cost Cascavel Gold Mine, with first production from the gravity processing circuit expected in 1st quarter, 2016. The development of Cascavel is the first stage of turning the Company’s Faina Goldfields project into a high-grade, multi-mine operation.
What makes the Cascavel project so exciting despite the lack of a JORC Mineral Resource report?
In the Faina Goldfields Project, Cascavel will be our maiden gold mine, scheduled for first quarter, 2016. It’s an elongated mineralized belt in which Orinoco has recently made important discoveries including Cascavel (15 m @ 88g/t Au from underground sampling) and Tinteiro (17.5 m @ 1,293g/t silver,”Ag”). These discoveries illustrate the prospectively of Orinoco’s tenements and the significant potential upside beyond the imminent production from Cascavel.
With Cascavel’s development, with remaining cap-ex of a US$ 7 million, Orinoco is poised to demonstrate just how profitable the Greenstone Belt can be. The past producing Sertão Gold Mine, now owned by Orinoco, had a shallow oxide zone mined by Troy Resources in 2003. At the time it was the lowest cost gold mine in the world with cash costs of US$ 53 an ounce!
Regarding Cascavel, the mineralized structure that hosts the gold has been intercepted in widely spaced drilling over 1.5 km of strike and over 700 m down dip. The system remains open along strike and down dip, and additional gold lodes parallel to (above and below) the main zone have been discovered. These parallel gold lodes are not part of our initial mine plan. This is a large system!
The structurally controlled and geologically continuous nature of the gold vein system combined with the drilling and underground sampling completed at Cascavel would ordinarily allow for a JORC Mineral Resource. While drilling provides an effective measure of the geological continuity of the Cascavel veins, the coarse nature of the gold prevents a reliable grade estimation amenable for JORC purposes. Given the difficulty and expense of defining JORC compliant resources through drilling, the Company is of the view that establishing a low-cost gold operation, and rapidly growing it, is the best way to create shareholder value and mitigate risk.
So, why is Cascavel so exciting? It’s a large gold system with 90% gravity recoveries, Bonanza grades, very low remaining capital costs, expected to have low operating costs and in production in the first quarter of next year.
Brazil is not the first place that comes to mind when thinking about gold producers. What’s it been like working there and what could go wrong down the road?
Although not many people have heard of it, Goias State, where our Faina Goldfields Project is located, is actually the second largest gold producing State in Brazil. Large companies such as Anglo Gold, Kinross and Yamana have successfully operated there for years. It’s a great State to operate in, without the logistical issues and environmental sensitivities that come with more remote parts of Brazil. We benefit from a mining friendly government, evidenced by the fact that we went from discovery to mine development in under three years. A skilled labor force and a supportive set of local communities doesn’t hurt either.
What could go wrong? Well we carry all the usual mining related risks, but I dont think any specific ‘Brazil’ factors will come into play. When you look at the projects that have succeeded and failed in Brazil – they have done so on the merits of the Projects and management teams – not sovereign Brazil factors. Additionally, the local currency has devalued significantly against the U.S. and Australian currencies, helping to lower our costs, while enjoying locally priced gold close to all time highs.
Are there other jurisdictions with high-grades that you might consider expanding into?
At this point we think our property, with a 100 km radius, has sufficient scope for discoveries that could make Orinoco a meaningful mid-tier producer over time. With low sovereign risk, a Heads of Agreement in place with the State Government and a highly prospective land package, we hope to leverage our strategic advantages and the infrastructure associated with our first gold mine, Cascavel.
Is the Company fully funded to reach production, retaining a margin for error?
We are fully funded to take Cascavel into production. As all of our mine development is on the orebody, for every tonne of dirt we move, every dollar spent on underground development, will have a revenue component. When the plant is commissioned, Orinoco will have an existing stockpile to treat and we will gradually ramp up to full capacity of the plant of roughly 100,000 tonnes per year.
Regarding funding, we entered into a forward gold sale agreement with Cartesian Royalty Holdings leaving us with over US$ 6 million undrawn and US$ 3.5 million in the bank. This facility is quite flexible, we don’t have fixed interest rate or gold deliveries to make, rather we must deliver 20% of our production to Cartesian for the next three years (subject to a minimum of 16k oz and a maximum of 24k oz).
Orinoco Gold’s trailing 3 month trading volume is increasing, now standing at ~500k shares. On July 15th, more than a million shares traded hands. Is Orinoco attracting a new set of investors?
A fully funded Cascavel Mine, soon into production, alerts investors to the potential there. Add to that the prospective upside at the Faina Goldfields Project to host further high-grade gold deposits. This is a perfect time for us to be introducing the Orinoco story to a new set of global investors, which is exactly what we are doing.
Everything appears to be on track. Still, there’s always a chance something could go wrong. Besides real or perceived country risk, what are the two biggest risks facing the Company?
Although both the gravity only plant and the room and pillar mining operation are technically very simple – this is still a mining operation and things can certainly go wrong. At the moment the biggest risks lie in execution. Little things like the importation of the gravity circuit into Brazil and making sure that we have adequate spare parts on site are things keeping me awake at night. We have done significant metallurgical testing so we’re pretty comfortable that we can get 80-90% gravity recoveries. With over 8,000 m of drilling completed in and around the initial mining area at Cascavel and several hundred meters of underground workings sampled, we feel there’s the potential of plenty of high grade gold in the initial mining area at Cascavel.
How much capital has been deployed on this property over the years?
Prior to commencing the development of the Cascavel Gold Mine and processing plant, we spent on the order of $12m on getting Cascavel to the stage where we were comfortable to invest a further US$7 million in turning our discovery into a mine.
Can we get the latest snapshot of Orinoco’s capital structure?
Orinoco has 197 million shares on issue with 120 million options. The options were mostly issued attached to previous share issuances and are widely held (with the largest option series traded on the ASX) with exercise prices ranging from A$0.11 to A$0.35.
Do you believe your Company’s valuation might be hindered by it being solely listed on the ASX?
That’s something we look at closely all the time. At the moment there’s no doubt that being ASX listed is a positive in the sense that quality gold developers and producers are being recognized and rewarded for their achievements. Aided by a good understanding of the positive effect that a depreciating currency like the AUD or the BRL has on the locally denominated gold price. On the flip side, there’s no doubt that North American markets understand South America better than Asian markets. As the Company continues to grow we will monitor the appropriate places to maintain a listing.
Speaking of valuation, most CEOs believe their companies are undervalued. Any thoughts on that subject?
I think the market is beginning to recognize the potential of Cascavel. We don’t appear to be getting attributable value for the potential upside there and at nearby projects. This is something we are addressing at our Sertão Gold project by obtaining a JORC Mineral Resources report. Sertão is on a fully permitted Mining Lease, and although the gold there is coarse, it’s not as coarse as Cascavel, leading us to believe that we can establish a resource inventory at Sertão.
Clearly, if we can demonstrate the potential of Sertão to also host significant high-grade resources only 28 kms away from our Cascavel processing plant, that should show the market the blue-sky potential of our overall property. After we drill Sertão we have two other targets ready to test for potential production. We really think the market should begin to recognize that we’re not a single mine Company. We believe our existing land package has the potential to become a significant Gold Camp with several mines.
Would you like to address any misconceptions about Orinoco Gold?
Yes, investors should avoid confusing short term, low-cost production at Cascavel with the idea that Cascavel must be a small mine. The area of known gold mineralization at Cascavel is large. As is case with many high-grade, coarse gold mines, the most prudent way to mine these systems is to start modestly and grow steadily. We are confident that the mine can feed the plant’s capacity with +12g/t mill feed and it’s just a matter of sensibly ramping up to that throughput. From a steady state, we can add a leach circuit, reduce bottlenecks or add processing plants, if the economics from our other sites such as the Sertão Gold mine warrant it.
Orinoco Gold (OGX:ASX) – This article was written by Peter Epstein, CFA, MBA. Orinoco is highly speculative and not suitable for all investors. Readers should consult with their own investment advisors before making investment decisions. Mr. Epstein is not a licensed investment advisor. The article should be viewed in this context. The opinions and assumptions are solely that of Mr. Epstein. At the time this article was written, Mr. Epstein, CFA, MBA owns shares of Orinoco Gold. Orinoco is a sponsor of EpsteinResearch.com.
“In our business, you make it taking shots.” Ron Netolitzky, 2014 Canadian Mining Hall of Fame inductee
Prospector Ron Netolitzky found his footing exploring for uranium in the northern Saskatchewan muskeg while oil patch consulting on the side, but it was in the mountains of northwestern British Columbia that he found his fortune.
In the late 80s, the geologist discovered the rich Snip and Eskay Creek mines in northwestern B.C.’s Golden Triangle, sparking both a staking rush on the ground and a trading frenzy on the old Vancouver Stock Exchange. Here—through a junior called Delaware Resources—Netolitzky and his partners optioned the Snip property from Cominco, who had held it for around twenty years but had never drilled it.
“We had enough money in the company to do the first drill program. We didn’t have enough for the second phase of the same year. Thank goodness, the holes ran,” Netolitzky recalls.
As did Delaware’s stock price. The company—and its 40% interest in Snip—was taken over by Pezim and rolled into Prime Resources. The mine eventually produced about a million ounces for Cominco, then Barrick, at grades averaging 25 g/t.
After Delaware, Netolitzky turned his attention to nearby Eskay Creek, a prospect he secured through a company called Consolidated Stikine Resources. His partners at Eskay were John Toffan, George Oughtred, Larry Nagy, and Marguerite Mackay. Eskay had previously been staked in the 1930s by prospector Tom Mackay and drilled by several majors, but with no success. Netolitzky’s group ran out of money to drill, though, so they went to Pezim, who invested $900,000 through Calpine Resources.
And when Hole 109 hit 682 feet averaging 25 g/t gold and 27 g/t silver, Netolitsky told us it was game on.
By the time a bidding war between players like Canadian mining legends Pezim and Ned Goodman had come to an end, shareholders of penny stock Consolidated Stikine sold for $67 a share to International Corona.
Eskay went on to churn out 3.3 million ounces of gold at 49 g/t and 160 million ounces of silver at 2,400 g/t for Homestake and Barrick, and Netolitzky left the discoveries a multi-millionaire.
“I guess I could say I got lucky in northern B.C.,” Netolitzky said.
Now Netolitzky, who was inducted into the Canadian Mining Hall of Fame earlier this year, has his sights set on a third Northwestern BC discovery.
Netolitzky has consolidated the Spectrum gold property due west of Imperial Metals’ Red Chris copper-gold mine in his Skeena Resources (TSXV:SKE), where he serves as chairman. After a promising drill program last summer, Skeena raised $8.1 million for a 10,000-metre-plus summer drill program that is now underway. Turns out the rich Snip and Eskay Creek strikes didn’t dampen Netolitzky’s enthusiasm for the treasure hunt, or for the Golden Triangle.
As he put it twenty-five years ago in a Report on Business magazine feature: “I guess it’s like the lottery—we’ve won twice. Now we’re going for a third time. You must think we’re crazy.”
 Must read from 1990
But unlike the quick wins at Snip and Eskay Creek, securing the Spectrum property would require persistence. Over the next twenty-five years, Netolitzky’s bid for Strike No. 3 in the gold-rich mountains was continually derailed by a combination of events that began with a political earthquake.
In October 1991, after sixteen years of pro-development Social Credit party rule, B.C. residents elected the left-wing New Democrats. The political shakeup and resulting land-use changes carried implications for the B.C. mining industry, and for the Spectrum property Netolitzky was eyeing.
Provincial park and right-of-way issues made exploration of Spectrum—located in the shadow of dormant volcano Mount Edziza—all but impossible. The property was eventually picked up by a Milwaukee-based businessman who didn’t spend a dime on it, says Netolitzky, so he left the province to explore other parts of the world.
“What struck us with that property, it was a similar style to the other discoveries. It was essentially left sitting there from 1990 to 1991, lost in the paperwork, lost in people’s files, lost. And the owner was not the kind of guy who was easy to find,” Netolitzky said.
But Spectrum’s park and right-of-way issues were eventually resolved, and Netolitzky tracked down the owner and was able to negotiate a 20% stake in the property through a private company.
Last year, Skeena acquired 100% of the property through an agreement that sees the prior owner retain a 24% ownership stake in the company.
 Source: Skeena presentation
Netolitzky was back in the game.
Spectrum has an existing historical resource that is non-compliant with NI 43-101 regulations. To firm up the resource, Skeena completed a limited drill program last summer that yielded some of the hits that the Golden Triangle has become renowned for. Those included intercepts of 23.8 g/t gold over 6.5 metres, 10.6 g/t over 27 metres, and 254 g/t over 2 metres.
But then came the hard part: raising money for a substantial 10,000-metre drill program in a junior resource financing wasteland.
“I’ve spent a lot of my career raising money for little companies,” Netolitzky told us. “It’s something you had to do. I’m always happier if somebody else does the job that I don’t like doing and lets me do what I like to do, which is spot drill holes.”
That “somebody else” is Walt Coles Jr., Skeena’s president and CEO. Coles, a native Virginian, came to Skeena after a decade on Wall Street working as an equity and research analyst for both UBS and hedge fund Cadence Investment Partners.
While Netolitzky prefers jeans and a rock hammer, Coles—at 43, a generation younger than Netolitzky—is comfortable with a suit and briefcase. More importantly, his relationships with institutional investors played a significant role in Skeena’s $8.1 million financing, which turned heads in the junior mining world. Cash-rich Boss Power, another Netolitzky play, also chipped in $1.5 million.
While gold is their goal, it was uranium that brought the unlikely duo together.
Coles’ family owns a swath of Virginia farmland that hosts a large uranium deposit, which was developed by a Venture-listed play called Virginia Energy Resources. Coles Jr., Virginia’s executive vice-president, recruited Netolitzky as a director.
Though that project floundered, the veteran geologist and the young analyst established a strong working relationship that persists today. Coles’ institutional connections have proved vital for Skeena in a landscape that is unrecognizable compared to the retail-focused markets where Netolitzky was comfortable raising money.
“When institutions start showing up, that’s when we’re all exiting stage left. That’s our win, right?” said Netolitzky. “If we needed to try to get the kind of money that’s now been raised on a retail basis, there’s just no way people like me would ever be able to find it.”
In a business all about taking shots, Skeena also structured the financing in a way that gives retail investors a shot at share price appreciation. There were no warrants attached to the deal—a move that encourages long-term shareholders who believe in the story and are willing to give the company reasonable time to deliver, and discouraged “flippers” who rent capital for four months, then sell and get a free ride on the warrants.
“Too often, investors are trained to wait for private placements so they can receive a half-warrant or warrant. The problem is when they want to sell, they’re going to go to the open market to sell,” said Coles. “But if every investor is waiting for a private placement to buy so they get the warrant, it’s a toxic structure that never lets a share price go up.”
Two drills are turning as part of the Skeena program, which should yield regular drill results over the coming months, and—hopefully—some positive surprises.
“These are areas where you can get pleasantly surprised instead of unpleasantly surprised,” Netolitzky says of the Golden Triangle, where vein systems can go down thousands of metres.
The goal of the summer drill program is to establish continuity and trace the systems down. “Prove the theory,” as Netolitzky puts it. Skeena will also continue its metallurgy work, following its initial studies that showed gold recoveries over 90% from combined gravity recovery tests and cyanide leaching.
Skeena aims to come out of the summer drill program with a one million ounce resource. Another underground drill program next summer is a possibility as well, Netolitzky said.
Eventually, “we think we’ve got a shot at a couple million ounces” of high-grade gold, he told us.
It’s been a wild ride for Netolitzky, who describes himself as a “prairie-type geologist” more used to flatlands and muskeg than the steep, snowy slopes of northwestern B.C., where mountain goats and grizzlies roam.
“I actually get vertigo on a stepladder,” he quipped.
Skeena has solidified good relationships with Tahltan First Nation, having gone through a Tahltan company for a recent archeological impact assessment that uncovered no archeological sites in the proposed drilling areas.
“Spectrum’s biggest challenge might be mother nature treating us right,” Netolitzky remarked.
“It’s interesting, when you look at ore bodies and deposits—some of them treat you real good and don’t hurt you. Other deposits give you a lot of work, and you almost make it, but you never really get a good deposit out of it. This one looks like it’s going to treat us right.”
CEO.CA is proud to announce Skeena Resources President and CEO Walter Coles will be presenting at our October 8, 2015 Subscriber Summit in Vancouver. He’ll be talking about Skeena’s ongoing summer drill program, with assay results expected August 2015 through January 2016.
Follow Skeena Resources at http://chat.ceo.ca/SKE for coverage from our community and insider trade notifications from SEDI in real-time.
DISCLAIMER: The work included in this publication is based on SEDAR filings, current events, interviews, and corporate press releases. It may contain errors, and you shouldn’t make any investment decision based solely on what you read here. The views expressed in this publication and on the CEO.CA website do not necessarily reflect the views of Pacific Website Company Inc., publisher of CEO.CA. Pacific Website Company Inc. provides advertising and multimedia creation services to Skeena Resources which makes CEO.CA biased in its coverage of Skeena Resources. This publication is provided for informational and entertainment purposes only and is not a recommendation to buy or sell any security. Always thoroughly do your own due diligence and talk to a licensed investment adviser prior to making any investment decisions. Junior resource companies such as Skeena Resources can easily lose 100% of their value so read Skeena’s profile on www.SEDAR.com for important risk disclosures. It’s your money and your responsibility.

I’m on record as stating that demand for lithium will grow faster than most believe. Conventional wisdom seems to say that overall lithium demand will grow by 8%-12% annually. I understand why that range has been adopted, it’s already a fast growth rate by historical standards. Commodity and natural resource demand is frequently said to increase at, “the rate of GDP growth.” I wonder which country’s GDP rate is being referred to, hopefully not the U.S. A prime reason for my bullishness on lithium demand, with overall growth closer to 20% a year, is that Tesla is attracting A LOT of attention and competition. I will spare readers the obligatory rattling off a list of Tesla’s growing competition. But there’s much more to the story than Tesla.
I believe that hybrid and plug-in hybrid vehicles will be phased out sooner rather than later. Any manufacturer that can’t deliver a full EV within the next 2-4 years might as well start working on flying cars, previously known as airplanes. This paradigm shift to EVs is not 5-10 years away, it’s right around the corner. Hundreds of millions or even billions of dollars are deployed on new car platforms, why would it be any different for the builders of EVs? A short time ago, manufactures released hybrid gasoline-electric cars so that they could claim to be, “green” companies. That’s completely changed, now the race is on for market share, volumes and profits.
RANGE ANXIETY!!
“Range anxiety.” That’s the cool way of saying that prospective buyers of EVs are on the fence, until they’re confident that a massive infrastructure of electric charging stations is in place. Guess what? That’s nonsense. According to the U.S. Department of Transportation, average daily driving per capita is about 40 miles. Commuters that drive 100-150 miles or more round trip are the exception, not the rule. Does 40 miles per day sound too low? That’s the U.S. average, the range around that average is probably fairly large. Take for example city dwellers that don’t drive daily.
If one were talking about natural gas stations, “range anxiety” would be a serious concern. Recall that T. Boone Pickens has been calling for the replacement of gasoline and diesel fueled cars with cleaner burning natural gas. In that highly unlikely scenario there would have to be a huge build out of natural gas stations. Not so with EVs. Electric Vehicles won’t require an epic rollout of thousands upon thousands of charging stations. As EVs evolve, there will be dozens of models with driving ranges in excess of 100 miles. By then, range anxiety will disappear. Instead of searching for a charging station, one’s garage electricity outlet will do the trick.
Everything’s going electric, lithium-ion batteries large & small will reign supreme
Admittedly there are occasions when long distances are called for. In this circumstance, let’s assume that a gasoline powered vehicle remains the best alternative. That still allows for EVs to potentially become 1 of the 2 vehicles in a suburban family. That equates to a staggering amount of lithium demand without the need of ubiquitous charging stations. The same will be the case for bikes, motorcycles, mail delivery vehicles and buses, (among others). That’s why I believe that the annual growth rate of lithium demand for EVs alone could be as high as 30%, a tripling in 5 years. If the fastest growing segment were to triple (30% growth annually from 2016-2020), that suggests 20% overall demand growth for lithium is not a crazy assumption.
Without range anxiety, EVs will become ubiquitous, not charging stations! This is especially true given that Nissan, Ford, GM and Toyota, (among others) will be coming out with a number of inexpensive EVs with price tags in the $20k-$25k range sooner rather than later. That’s before considering favorable State and/or Federal tax treatment. Importantly, the lower price point EVs will not necessarily use less lithium. Not if they want to achieve high milage per charge. Miles per charge will be a key determinate of customer preference. Note that inexpensive EVs will benefit as much as high end EVs, from lower annual operating expenses by plugging in instead of filling up.
Dajin Resources Corp. (DJI.V) / (DJIFF) a high risk / high return opportunity
While the available supply of lithium is difficult to forecast, and will come on-stream unevenly, demand growth for EVs alone could be two or three times that of today’s consensus. Clearly, the demand for lithium will be lower or higher than expected. Readers probably know which side of the coin I’m betting on. That’s why I like a small cap, pure-play lithium company named Dajin Resources Corp. (DJI.V) (DJIFF). Combined U.S. and Canadian trading volume is averaging roughly 625,000 shares per day. The company has no debt and a solid balance sheet. Warrant exercises have been helping to maintain adequate cash balances.
Taking a contrarian view by being substantially more bullish on lithium demand from EVs, calls for an investment approach that differs from those who follow the crowd. Following the crowd is prudent if conventional wisdom prevails. However, for those like me who believe overall demand for lithium could grow by 20% annually, (30% for EVs alone), a way to articulate a bullish position is through juniors such as Dajin Resources. Taking a contrarian view entails both higher risk and higher reward. Unlike following the crowd though, an investment in Dajin Resources could play off quite handsomely. With properties in both Nevada’s Lithium Hub, located approximately 12 km northeast of Rockwood’s decades long Nevada operations and a very large land position in Argentina’s, Lithium Triangle. This company’s tock is strongly positioned to move considerably higher upon an increase in lithium prices and/or a rebound in the morbid TSX Venture Exchange.
Disclosure:
Dajin Resources (ticker DJI.V) (DJIFF) – Mr. Epstein owns shares of this company. Investors should consult with their own advisors before making investment decisions. Mr. Epstein is not an investment advisor. The article on this company on EpsteinResearch.com should be viewed in this context. This company is highly speculative and not suitable for all investors. As of [5/1/15] Dajin Resources is a Sponsor of EpsteinResearch.com on a month-to-month basis.

After a two year consultation process, Canada’s new Extractive Sector Transparency Act came into effect in early June. The Act is part of an international effort underway in the EU and the United States aimed at combating corruption, while increasing transparency in the mining space. Dubbed the ‘Publish What You Pay’ initiative, the newly-enacted legislation will take effect at the beginning of a mining company’s 2016 fiscal year, requiring all Canadian owned companies making payouts of 100,000 dollars or more to submit reports no later than 150 days after the end their 2016 year; “This means that entities with a financial year ending December 31 will have to comply for the financial year starting January 1, 2016, and file a report by May 29, 2017, for payments made during 2016,” Eden Oliver of Bennett Jones reports.
As mentioned earlier, Canada’s initiative is part of a widespread effort to hold not only mining companies accountable, but also governments around the world. “The enhanced transparency will help reduce instances of corruption by enabling citizens around the world to hold their governments accountable for how they allocate and spend mining revenues,” the Engineering and Mining Journal recently reported. “It will also help to ensure that these revenues contribute to sustainable development and poverty reduction.”
Financial reports from all extractive companies will be posted on SEDAR, the Canadian Securities Administrators official filing website. Enhanced transparency not only benefits governments, companies and citizens, it also benefits company shareholders. Increased access to financial payments and records allows shareholders to be more informed when deciding to sell or retain shares and can make a miner more attractive to those looking to invest in the resource sector.
With 47 years experience in law including his years as counsel to The Saskatchewan Mining Development Corporation, Regina lawyer Tony Merchant is familiar with the legal requirements involved for company public disclosures and adds insight into the Extractive Sector Transparency Act, stating: “With any new measure, there is an adjustment period and learning curve that is required. While we know that it is mandatory that companies comply with the new act, we are still unaware of what exactly will be made public.”
The list of what must be disclosed is broken into categories including: Taxes, royalties, fees, including rental fees, entry fees, regulatory charges as well as fees for licenses, permits or concessions; bonuses, including signature, discovery and production bonuses; dividends other than dividends paid as ordinary shareholders. A complete list can be found on the Justice Laws website.

While what will be made public remains vague, penalties for non-compliance are firm, “Federal fines can total 250 thousand dollars a day until compliance is met,” Tony Merchant adds. “The Ministry of Resources has also been given extensive investigative tools and can conduct on-site inspections and detailed audits.”
The new act will work in accordance with the 1999 Corruption of Foreign Public Officials Act, an act that criminalizes the bribery of foreign officials. To date, the Corruption of Foreign Public Officials Act has yielded three corporate convictions and is currently investigating 30 more.
The new legislation places Canada ahead of other nations developing the same protocols, securing our status as a global powerhouse in the resource sector.

1. Most gold analysts think that gold is in a bull market, or a bear market. They use charts and US economic reports to try to prove that the gold price is ready to move substantially higher or lower.
2. In contrast, I’ve argued that the world gold market is in a state of transition. It’s transitioning from a Western fear trade orientation, to an Eastern love trade orientation, and thus gold is on the cusp of a “bull era”.
3. The last century was dominated by the America. During America’s “heyday”, companies like Xerox and General Motors staged relentless increases in quarterly earnings, and this was consistently followed by massive increases in their stock prices.
4. That’s because institutional money managers base their liquidity flows on earnings reports. They don’t care if a chart looks bullish or bearish.
5. They care about earnings growth and cash flow growth.
6. Even more importantly, mainstream money managers look for consistency of earnings growth, and consistency of cash flow growth.
7. Price drivers like QE, Greece, and OTC derivatives don’t create cash flow and earnings growth consistency for gold stocks. They create volatility, and that’s not something that an institutional money manager likes to see.
8. I don’t think most investors realize what kind of sea change is taking place in the gold stocks sector right now. It’s a process that can turn gold stocks into one of the most stable cash flow cows… in the history of investing.
9. In China and India, good economic news is a reason to buy gold, and bad economic news is also a reason to buy gold. The steady rise in demand created by industrialization in these countries, coupled with static mine supply, is poised to turn the gold stocks sector into an institutional darling.
10. Please click here now. Double-click to enlarge. That’s a snapshot of recent quarterly earnings for Newmont.
11. Once a company starts to show sizable increases in quarterly earnings and cash flow, institutional money managers of size begin to pay serious attention to that company.
12. Newmont is a gold stock sector leader, and it’s staged some phenomenal and consistent growth in quarterly earnings. That has stunned institutional money managers, and brought them to the investment table.
13. The next Newmont earnings report is scheduled for July 22. If there’s another upside surprise, institutional money is going to pour into Newmont,and the stock should begin a new leg to the upside.
14. Please click here now. That’s another look at Newmont, using the weekly chart. Chindian demand can realistically add about $100 – $200 to the gold price floor, over the next 18 months. It can do it in a very stable manner.
15. To most amateur investors living in the legacy of fear trade era, that might not seem like much of a price spike. To an institutional money manager following earnings reports from companies like Newmont, Barrick, Agnico Eagle, and Goldcorp, it turns those companies into consistent cash cows.
16. Gold stock charts can’t be used in isolation from earnings reports. The reason that most investors were so negative about gold stocks at the end of 2014 was because they were focused on things like QE and rate hikes, rather than corporate earnings.
17. That’s why they missed the boat with Newmont, and it’s why they may miss the entire gold stocks sector boat, as it sails up the chart, in 2016!
18. Newmont is probably going to move steadily towards the $40 area in 2016. Investors who waste time waiting for some magical “chart breakout” will never make any serious money in the market, and certainly not with a key stock like Newmont.
19. As Newmont moves towards $40, I expect GDX will rise towards $38. On that note, please click here now. That’s the weekly chart for GDX.
20. No chart formation is going to move GDX higher or lower. It’s institutional liquidity flows that matter, and as mining costs stabilize, and Chindian demand is already quantified by top bank economists as steadily rising, good earnings reports will make the entire Western gold community happy, and GDX will move towards $38!
21. When the fear trade dominated gold price discovery, it was very difficult for money managers to make long term projections about the gold price.That’s changed with the rise of the love trade, and the rise in oil supply.
22. As Iran is welcomed back into the international community, even more oil supply will make its way onto the market. Also, China may have large reserves of oil and gas that can be tapped by the use of fracking. Fuel prices for gold mining are becoming incredibly stable, and the love trade is creating stable and consistently growing demand.
23. The bottom line is that here’s never been a better time in history to confidently invest in gold stocks, than right now! On that note, please click here now. That’s the daily chart for GDXJ. Junior and intermediate gold stocks that have decent AISC (all-in sustaining costs) can do extremely well in the bull era.
24. Yesterday’s price, volume, and oscillator action was impressive. Note the beautiful position of the 14,7,7 Stochastics oscillator, at the bottom of the chart. The traditional summer rally for gold stocks may now be in play!
Stewart Thomson of Graceland Updates, Guest Contributor to MiningFeeds.com
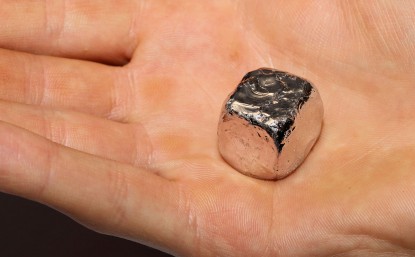
Rhodium is a rare metal, and the silvery, corrosive resistant metal is most commonly used in catalytic converters for automobiles, where it competes with platinum, despite platinum production being 12 times larger than rhodium production. It is generally produced as a by-product of platinum and nickel mining; there are about 10 mines in the world that can produce it. As rhodium is so rare it cannot respond to changes in demand easily and therefore the price is driven by supply and demand factors.
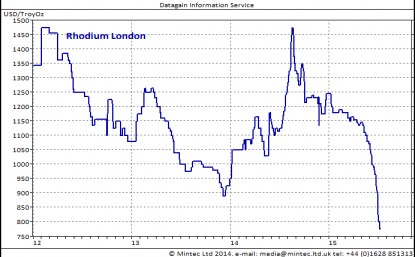
Most of the mines producing rhodium are in South Africa, 80% of global production; however it is also produced in Russia and North America in smaller quantities. The 5 month long platinum miner’s strike in South Africa last year reduced production of platinum and rhodium. The strike over pay ended in June 2014, and a year on, supply of rhodium has jumped to levels not seen for 3 years. Whereas platinum has been in a supply deficit for the past 3 years, rhodium is forecast to be in supply surplus in 2015. In addition, the mines need to sell their stocks quickly in order to increase cash flow to finance their operations and the raised pay of their workers. This has resulted in prices falling to the lowest level in 11 years.
The other factor influencing prices of rhodium is the weakness of the South African Rand (ZAR). The ZAR has been weakening steadily for 4 years and is now worth nearly 45% less than it did at the beginning of 2011. Part of this weakening has to do with the recent strength of the USD, and as metals are traded in dollars, this has resulted in the price of rhodium being under more downward pressure.
Global economy and vehicle demand
The global economy has also had an effect on the price of rhodium. As the global economy weakens; so does the demand for vehicles and therefore, the demand for rhodium. China has the fastest growing car market but their economic growth has slowed in the past few years and consequently so has the appetite for new cars. Even though the global production of new cars is increasing year on year, this increase has slowed to 2.5% y-o-y in 2015 from an increase of 2.9% in 2014. China is forecast to increase the number of motor vehicles produced by 6% in 2015 but that is down from a 7.4% increase in 2014. In Europe, the world’s 2nd largest car market, concern over Russia, the Greek crisis and poor economic growth has led to a similar slowing of growth in the production of new cars in 2015, down from a 5% increase in 2014 to a 3% increase in 2015. Although strong US economic data has led to an increase in consumer confidence resulting in the highest growth in car production since 2001, this has not been enough to pull global car production out of slowing growth. Consequently, global demand for the platinum and rhodium has fallen from 9.31m ounces in 2014 to 9.30m ounces in 2015, down 0.1% y-o-y.
Competition with platinum
As rhodium competes with platinum in the car market, the price differential between these will influence demand for rhodium. Platinum is more widely used by car manufacturers due to the wider availability, however recently rhodium has had a cost advantage. The price of rhodium was lower than platinum for all of 2012/13 and into 2014, but the strike in South Africa caused the prices of rhodium to rise and the price advantage that rhodium had enjoyed narrowed to virtually nothing. In fact, the price of rhodium has been higher than platinum at several points since August 2014. Consequently, whilst demand for platinum has fallen by 5,000 ounces in 2015, down 0.06% y-o-y, demand for rhodium has fallen by 8,000 ounces, down 0.8% y-o-y.
Supply surplus
Now that the South African platinum miners have been back at work for a year, rhodium supply has increased back to levels seen in 2012. In 2013, there was a supply deficit of 28,000 ounces rising to 72,000 ounces in 2014; whereas the forecast in 2015 is a surplus of 62,000 ounces. This would initially seem like a good thing for rhodium, but the supply deficit for platinum has fallen from1.1m ounces in 2014 to a deficit of 284,000 ounces in 2015. This has caused prices of both metals to fall, and rhodium has borne the brunt of this due to the surplus.
Russia
The final piece in the rhodium price weakness puzzle is Russia. Although Russian production accounts for just 11% of global production, it can still affect prices. Crude oil is a crucial part of the Russian economy as they are a major producer. The fall in price of crude oil resulted in a rouble than was weaker even than in the midst of the global financial crisis in 2008. Add in western sanctions and the country is having difficulties in attracting international investment. Any investment that is coming into the country is likely to be aimed at mines that produce metals that have not had such large drops in prices, such as gold. Rhodium production in Russia is forecast to fall to 80,000 ounces in 2015, down 8% y-o-y, however with the strong dollar and weak rouble, Russian mining companies can tolerate a lower dollar price.
All in all, there are many things driving down the price of rhodium. The biggest by far is a surplus in supply for the first time since 2011 and the slowing of car production growth. Unless there is a disruption to production or a much higher than expected increase in vehicle production, it seems unlikely that the price of rhodium will rise much in 2015.
The looming skilled labour shortage was addressed by Canada’s Employment Minister Jason Kenney at an annual skills summit last month in Toronto. Kenney reiterated the growing concern that Canada will lack approximately one million skilled labourers by 2020. He also pointed out that some industries will be harder hit than others and face a greater challenge filling their rosters. “The construction, mining and petroleum sectors are examples of industries that will face serious shortages of skilled workers over the next decade,” Kenney said to the crowd of stakeholders.
Analysts have been predicting the skilled labour deficit in the mining sector since 2011 when baby boomers began reaching the age of retirement. Referred to then as a “talent gap”, the gap has grown into a cavern that will require an estimated “100,000 mostly skilled new hires to sustain even modest growth,” reported the Mining Industry Human Resources Council in 2011. This is a number that will continue to grow in the following years.
Companies have been employing a variety of methods to find the trained labourers they need, from enticing bonuses, promises of on-the-job training for the enthusiastic yet skill-lacking, to hiring temporary foreign workers.
This influx of new hiring practices is creating legal concerns for companies that are used to hiring highly-trained employees right out of trade schools. For example, recent changes to the Temporary Foreign Worker program has reduced the maximum foreign workers both medium and large-sized companies may employ, as well as placed stricter enforcement and harsher penalties for those caught violating the program parameters.
The most recent study from the Mining Industry Resources Council forecasts the national mining industry needing to hire 86,000-127,000 trained professionals to meet growing demand in the sector. The skills required to work in the extractive sector are also evolving; once heavily focused on miners, the shift towards skilled machinists and speciality mechanics is changing the industry. New developments in technology coupled with a potential employment boom means it is imperative that mining companies are aware of their legal responsibilities when it comes to new employees.
With these trends in mind, David Costa, lawyer and founder of Costa Law Firm, advises that those in the mining and resource industry carefully review the Ontario Labour Relations Act, The Employment Standards Act, as well as Ontario’s Occupational Health and Safety Act.
“Companies need to do their due diligence and be up-to-date with the latest versions of these acts to ensure they are meeting all their legal obligations,” comments David Costa.
Each of the three Acts has very specific guidelines pertaining to the mining industry in Canada, and specifically Ontario. “For example, safety regulations regarding explosives, equipment and transportation may vary from country to country,” notes David Costa. “So an employer hiring temporary foreign workers must ensure each worker is well versed and knowledgeable about them to ensure safety and avoid penalties.
While the Temporary Foreign Worker program remains a contentious subject, Ryan Montpellier, executive director of the human resources council, told Maclean’s magazine’s James Keller in 2013, “The industry and governments must ensure they have a long-term vision for attracting and retaining workers from a broad spectrum of society.” He suggests companies invest in long-term training programs and consider hiring more aboriginals and women to fill the projected gap.
What is being done in Alberta on the oil patch is innovative and helping to get the skilled-labour the gas industry needs. Companies are no longer strictly hiring locally, they have begun to source labour from across the country which has birthed the ‘skilled-labourer commuter’. A trained labourer who works for an extended period on site then returns to their hometown for downtime returning to the oil patch for the next scheduled shift.
David Costa acknowledges that this is helping the gas sector in Alberta, but urges Ontario companies who might want to implement this model to again thoroughly understand labour laws, in this case those laws describing maximum hours of work permitted in a day and a week. “These employees may want to work extra hours to make up for the days they will be off, but without explicit consent in writing the 48 hours cannot be exceeded,” adds David Costa.

The precious metals sector is enduring losses for the third straight week. The gold miners and Silver have led the way down, though Silver has rallied over the past two sessions. Gold has also rallied yet remains dangerously close to making a new weekly low for the bear market. While the metals recovered some losses on Wednesday and Thursday, the gold miners failed to generate anything positive and closed near their lows for each session. The inability of the miners to recover to even a small degree augurs badly for the entire sector in the days ahead.
Continued weakness in the miners is not much of a surprise considering they are breaking down from their 2008 and 2014 lows. We plot monthly bars below for GDM (forerunner to GDX) and the HUI. GDM closed at 468 and lacks strong support until 400. The HUI is in full blown breakdown mode and does not have strong support until the low 100s.
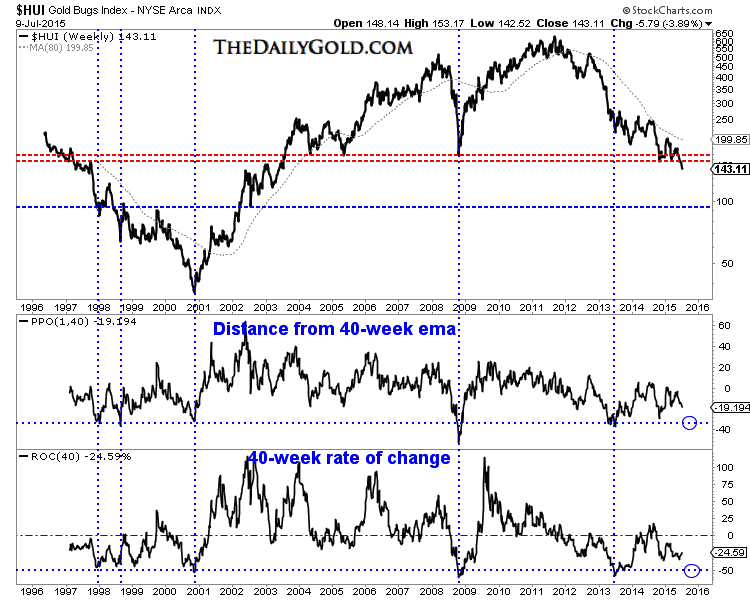
In the chart below we plot the HUI’s weekly price going back 20 years and two oscillators which can serve as overbought and oversold indicators. We plot the HUI’s distance from its 40-week exponential moving average and its rolling 40-week rate of change. The HUI is certainly oversold but these two oscillators argue the HUI is some distance from reaching the extreme oversold condition seen in spring 2013, late 2008 and late 2000.
Turning to Gold, it appears ripe for a breakdown below $1150/oz in the days ahead. If that comes to pass, then the focus should be on its next strong support around $1000/oz to $1040/oz. The chart below includes the weekly plot of Gold as well as the net speculative position as a percentage of open interest. The net speculative position will be updated Friday and figures to be close to 10%. In our view that needs to go below 5% (the 2013 low) for sentiment to be considered extreme. A reading below 5% would mark a 14-year low.

We appear to be in the early stages of the final act in this precious metals bear market. Gold breaking below $1140-$1150/oz could put us in the middle stages. Our work shows that miners are not yet extremely oversold and have room to fall before reaching strong support. Gold breaking below $1150/oz and then $1100/oz would initiate further losses in the miners and bring them very close to that extreme oversold condition. It is the combination of an extreme oversold condition coupled with strong technical support that creates a very favorable buying opportunity.
A few weeks ago we noted that it was potentially a very dangerous time for bulls. It still its. However, the closer the miners get to extremely oversold and the closer Gold is to $1000/oz then the closer we are to risk favoring the bulls. It is always darkest before dawn. At somepoint within a few months, the switch will flip and we could have some epic buying opportunities in the precious metals complex. Consider learning more about our premium service including our favorite junior miners which we expect to outperform in the second half of 2015.

1. The pressure on the US stock market continues to grow. Please click here now. Note my red annotations on this key S&P500 earnings chart.
2.With QE gone, rate hikes on the horizon, wage pressures growing, and the business cycle peaking, it’s a “no brainer” that US corporate earnings are disintegrating.
3. Also, the ongoing American government attempts at regime change in the Mid-East have turned into a nightmare. It’s likely just a matter of time before a horrific attack on American soil causes another 911-style US stock market crash.
4. The US stock picker can do well, even in a down market, but the focus for the index investor needs to be China and India, with some caveats.
5. Please click here now. This Dow Jones chart compares the price action of Chinese A shares, where Chinese gamblers operate, to the Hong Kong H shares market that I focus on.
6. Price to earnings ratios on the A shares market are the highest of any major market in the world, and they are the lowest for the H shares market. Clearly, Hong Kong has barely “yawned” over the past few weeks.
7. It’s important for the Western gold community to understand that China is home to the world’s biggest gambling community. The average Chinese A shares investor holds a stock for about two to three weeks. Then they sell it, and take another gamble.
8. In the West, this magnitude of gambling is unheard of and difficult to conceptualize, but it’s nothing out of the ordinary in China. To keep the gamblers reasonably happy at the tables, the PBOC (Chinese central bank), Chinese brokerages (bookies in suits?), and the country’s sovereign wealth fund have all recently committed various types of support to the A shares market.
9. I make such large dividends from my Chinese H shares that capital gains are irrelevant. The bottom line is that the A shares market is a fabulous casino for the world’s biggest gamblers, while the H shares offer value-oriented Western investors outstanding long term value for conservative investors.
10. What about gold? Well, please click here now. That’s the seasonal gold futures chart, courtesy of Dimitri Speck. I’ve highlighted the typical “triple bottoming action” that tends to occur in the June – August timeframe.
11. Please click here now. That’s the daily gold chart. I’ve highlighted the seasonal price action on it. This year, the gold chart looks like it came out of a seasonal chart textbook. Gold made a low in mid-June, briefly rallied, and has declined, in typical seasonal manner, into the first week of July.
12. Another short rally can be expected from “about now”. That rally should be followed by a slow decline into a final seasonal low in the first week of August.
13. There’s more good news for gold investors. Please click here now. This spectacular chart from Saxo Bank shows the action of leveraged hedge funds on the COMEX. Conspiracy buffs often refer to it as the “CRIMEX”, partly because a lot of the trades put on by banks classified as “commercial” traders appear to be more speculative than commercial.
14. Regardless, the Saxo chart is a contrarian gold investor’s friend. I’ve highlighted the peaks and troughs of hedge fund buying with green and gold circles, and done the same thing with the gold price.
15. It’s clear that the funds have been major gold buyers at market highs, and major gold sellers at market lows. Right now, the funds are holding a record short position, just as gold tends to make a major seasonal low!
16. Please click here now. Fans of central bank action in the gold market should repeatedly read this key document from Yao Yudong of the PBOC. Note the critical importance he assigns to gold for the internationalization of the renminbi (yuan). Of the seven key points Yao makes, two of them focus directly on gold.
17. Gold can play a key role in solving the global liquidity problems that will occur in the expanding sovereign debt crisis. Western media focuses on the role of government, committees, and banks. China focuses on the role of gold. As more socialist governments get elected around the world, I suspect China’s focus on gold will be the one ultimately chosen by the rest of the world.
18. Government committees can’t even handle the Greek sovereign debt crisis. How will they handle a Spanish crisis, an Italian crisis, a Portugal crisis, and, ultimately, an American crisis?
19. Please click here now. That’s the daily silver chart. Silver looks better than gold right now, but rallies and declines are ultimately determined by gold itself. As with gold, silver investors probably need just another month of patience, before the good times begin to roll!
20. Attention gold stock enthusiasts, please click here now. This Goldcorp daily chart is very important, for a number of reasons.
21. First, Goldcorp is the largest holding in the GDX ETF. It has swooned while competitors like Agnico Eagle and Newmont have rallied. I think that’s about to change, and so does Swiss monster bank Credit Suisse.
22. Their analysts have just issued a $24 target for Goldcorp, and have rated it “outperform”. From a technical perspective, amateur chartists may tend to think the recent decline below the late December lows in the $16.77 area was a “breakdown”.
23. Support and resistance zones are not “black and white” affairs. Goldcorp appears to be successfully testing the December lows, and the enormous bull wedge pattern puts the stock in sync technically, with the fundamental analysis from Credit Suisse analysts.
24. Please click here now. That’s the daily GDX chart. Note the great position of my 14,7,7 Stochastics series oscillator, at the bottom of the chart. If Goldcorp begins to rally, and I think it will, GDX could stage a powerful rally, even in the face of a modest seasonal decline in the gold price!
Stewart Thomson of Graceland Updates, Guest Contributor to MiningFeeds.com
As reported, Skeena Resources (SKE.V) (SKREF) announced an up-sized, non-brokered C$8.1 million capital raise with no warrants attached. This is a tremendous outcome that de-risks Skeena’s Spectrum project by eliminating funding risk for the next 12-18 months. A number of institutions invested in this round and the prior one, and allows the company to actively pursue its dream list of drill targets with a comfortable cash cushion. On June 29th, Skeena received a 3-year drilling permit, began field work and camp construction, and is mobilizing two drills to the Spectrum high-grade gold project. Fieldwork, which commenced June 15, includes re-sampling of historic core, soil sampling and prospecting under the direction of Jacques Stacey, MSc, PGeol, Project Manager.
In addition, geological mapping is being led by Dr. Jim Oliver, PGeo, consultant. Camp and drill pad construction is underway, and drilling is expected to begin on or about July 2nd. A total of 10,000 to 12,000 m of drilling in 50 to 60 holes is planned for this season, with holes averaging 200 m, and ranging from 50 m to 350 m in depth. The drill program has been designed to expand the historic resource, while other holes will test the East Creek zone and other outlying targets. A NI 43-101 resource estimate is expected to be completed in the fall of 2015.
I see a good chance of Skeena delivering a solid maiden resource in the next 6 months and possibly a second one within 6 months of the maiden resource. In my opinion, if 1 million + ounces in a first or second resource report is achieved, the stock price of C$0.065 could double or triple by then, $0.065 would be a distant memory. Further, it’s my understanding that due in part to the historic data, a meaningful portion of the next two NI 43-101 reports could be in the Indicated category. Readers of my prior articles [Here], [Here] and [Here] know the following. Skeena is drilling on a site with a non NI 43-101 compliant historical resource of 244k ounces of gold and has confirmed high-grade gold with its own drill campaigns (see below). The company’s very valuable database of geological mapping, geochemical sampling, trenching and more than 100 diamond drill holes (>14,000 metres) and one adit on Hawk vein (278m of workings) makes the Spectrum Project more than merely an early-stage prospect. One of the foremost geologists on the planet, Ron K. Netolitzky, M. Sc, with extensive knowledge of the Gold Triangle of Northwestern British Columbia, is the Chairman and second largest shareholder. Add to the above facts, a large pile of cash on the balance sheet.
Although I’ve mentioned Mr. Netolitzky in prior articles, I’ve not explicitly stated his claim(s) to fame. Please consider the historic mines in NW B.C. where Netolitzky was the driving force behind.
Snip Gold Mine
1 million oz. Au (gold) produced at 25 g/t
Eskay Creek Mine
3.27 million oz. Au produced at 49 g/t AND 158 million oz. Ag (silver) produced at 2,406 g/t
Those mines sported bonanza grades, an indication to me that Skeena’s longer-term goal of 2-3 million ounces at a grade of 12+ g/t is not a pipe dream. Evidence of Skeena’s potential can be found in the drill results completed in 2014.
[NOTE: For convenience, highlights of Skeena’s drill results are as follows]
14-SP-003: 23.84 g/t Au over 6.5 m, including 40.43 g/t Au over 3.5 m
14-SP-004: 10.63 g/t Au over 27.0 m, including 66.00 g/t Au over 2.0 m and 20.4 g/t Au over 2.0 m, 9.2 g/t Au over 2.0 m, 8.0 g/t Au over 2.0 m and 22.7 g/t Au over 2.0 m
14-SP-005: 18.60 g/t Au over 2.0 m and 7.32 g/t Au over 2.0 m
14-SP-006: 43.80 g/t Au over 2.0
14-SP-007: 9.50 g/t Au over 2.0 m
14-SP-008: 4.58 g/t Au over 9.0 m
14-SP-009: 13.70 g/t Au over 4.0 m and 254.50 g/t Au over 2.0 m.
How Does Skeena Compare to Peer Junior Gold Companies?
For junior gold companies there are more differences than similarities. Jurisdiction, grade, depth of deposit, infrastructure, balance sheet, capital to reach production, strength of management and Board, etc. Instead of ticking off Skeena’s boxes on those metrics, I refer readers to page 18 of the company’s new (June) corporate presentation. In my analysis I replaced Pretium, Roxgold, Continental and Rubicon with much smaller companies Unigold, Nio Gold and Goldstrike Resources. I derived an average EV/oz of $47/oz. That figure does not include Goldstrike, an early-stage company in the Yukon, with no defined resource yet having an EV of $20 million. Skeena has an EV of $7.8 million. Assuming that company achieves a NI 43-101 compliant resource of 1 million + ounces on its first or second resource estimate, the company would be trading at an 83% discount on an EV/oz comparison.
Of course, Skeena has not booked 1 million ounces, it has ~244k ounces of historic non NI 43-101 compliant resource. That’s why it’s trading at an 83% discount! Still, if Skeena can step up with a solid maiden resource and if coming up short, a second resource report delineating 1 million + ounces in the next 6-12 months, I believe that the huge Ev/oz chasm would narrow. As a valuation exercise, if one gives the company credit for 1 million ounces and cuts the cash liquidity from $8 million to $4 million, (due to ongoing drilling) the pro forma EV of $11.8 would trade at an unwarranted 75% discount to peers. However, peers will presumably be spending cash, and raising capital, both of which would increase their EVs. Therefore, the pro forma discount could remain at 80% or more for a company possibly endowed with a NI 43-101 compliant resource of 1 million + ounces in the next 6-12 months.
For those skeptical of my pro forma 1 million ounce + resource premise, viewing it as too aggressive, I argue that one is getting that outcome virtually for free due to the massive valuation discount. This is where leverage comes into play, no not debt leverage, Skeena has no debt. If the company’s stock price were to double implying a $23.6 million EV, SKE.V would still be trading at a 50% discount to the peer $47 EV/oz metric. Clearly, there’s ample room for improvement in Skeena’s valuation relative to peers without suggesting that the entire valuation gap will be erased. Most of the peers are pre-PEA, unlike Skeena, most are not privy to very extensive historical data. Unlike peers, most don’t have a lead Geologist, Mr. Netolitzky, as capable, with proven success in the region. As mentioned, unlike Skeena, most don’t have a fully funded balance sheet with a 12-18 month liquidity runway.
Conclusion
With an admittedly unproven thesis on my part that Skeena Resources will achieve a NI 43-101 complaint resource of 1 million + ounces in the next 6-12 months, i.e. upon the first or second delivered resource report, I stand by my valuation exercise. Junior miners are inherently difficult to value, However, there’s only one key assumption, the million + ounce resource. I realize of course that this presumption is not just a key assumption, but the most important one. Given the luxury of being able to deliver not 1 but 2 NI-43-101 compliant resource reports in the next 6-12 months, supported by the unparalleled historical database, Mr. Netolitzky expertise and drilling results in 2014, I consider the overall risk/reward proposition as quite compelling.
Disclosure:
I, Peter Epstein, CFA, MBA, do not currently own any shares in Skeena Resources (SKE.v) or any other company listed herein. I have owned shares of Skeena Resources in the past and I may acquire share in the open market in the future. Investors should take care to conduct their own due diligence on small cap, speculative stocks. An investment in Skeena Resources may not be appropriate for all investors. Readers should review Skenna Resources’ website and corporate presentation as part of proper due diligence. The company’s Enterprise Value, “EV,” was derived by taking Skeena Resources’ outstanding shares, (including recently issued shares) and multiplying that number by the share price of $0.06 at the time this article was written. From that result, $8 million of cash was subtracted, equating to an EV of $7.8 million. Readers are reminded that Skeena Resources does not have a NI 43-101 compliant resource. It has a non 43-101 compliant historical resource of approximately 244k ounces of gold. The company hopes to provide readers and shareholders with a maiden NI 43-101 compliant resource before year end. The commentary in the article is based both on facts and opinions. All opinions are entirely my own and are not necessarily the same of Skeena Resources’ Management and Board. Skeena Resources is a sponsor of epsteinresearch.com., however readers please note that Mr. Epstein is not an investment advisor.
The demand for diamonds continues to grow as the world population now exceeds 7 billion people and consumer demand from rising global incomes looks to diamonds both for enjoyment and investment. The two largest consumers of diamonds are the US (no surprise) and China (perhaps more surprising to some). These countries lead jewellery demand for diamonds, with the US at 40% of demand and China in second-place at 16%.
Make no mistake, diamonds are big business. In fact, De Beers reports that the global diamond demand for jewellery was up 3% in 2014 to $81 billion.
With growing demands and a reduced supply from current mines exploration for future diamond mines is needed more than ever. But diamonds are elusive beauties to find and indeed there has been a decline in diamond exploration worldwide as exploration efforts have failed to pan out (See: http://ceo.ca/2015/01/12/jason-stevens-why-i-believe-diamonds-are-a-good-5-year-play/). But the good news is that Canada is brimming with diamond exploration and now a new diamond district at Pikoo (something we’ll get to shortly).

Diamond companies have had their eyes on Canada since the early 1990’s when diamond rich areas were discovered in the Northwest Territories.
Canada is now the 5th largest producer of diamonds in the world behind producing 8% of all diamonds worldwide in 2013.
A quick snapshot of current Canadian Diamond Production
Four diamond mines are currently operating in Canada.
Diavik – The Diavik Mine is located in the Northwest Territories and is 60% owned by Rio Tinto and 40% by Dominion Diamond. Diavik commenced production in 2003 and produces 6-7 million carats annually. Discovered by Aber Diamond, which was led by mining Hall of Famers Gren Thomas (who now is Chairman at North Arrow Minerals), Diavik continues to have an indicated mine life through 2023 with potential for future expansion.
Ekati -The massive Ekati mine was discovered by Chuck Fipke and Stewart Blusson. Discovered at Lac de Gras, it kicked started the Canadian diamond business and resulted in the biggest land staking rush ever seen in Canadian mining history. With production dating back to 1998, the mine has already produced over 50 million carats. Ekati is Canada’s first surface and underground diamond mine. Dominion Diamond is the 89% percent owner of the mine. Projected closure is scheduled for 2020 but it is likely the Jay open pit will extend operations an additional 11 years.
Snap Lake – Snap Lake is expected to produce 1.4 million carats annually and have an approximate lifespan of 20 years from its opening in 2008. Snap Lake was De Beers’ first mine outside of South Africa.
Victor – Victor is also owned by De Beers and is Ontario’s first diamond mine. Annual production is ~600,000 carats. Victor is an open pit mine and approximately $1 billion was spent on the construction of the mine.
Diamond Investing With the Lundins
One of the most successful investing families in the resource markets the Lundin family is bullish on diamonds. Lundin’s first investment in diamonds has turned out extremely well with Lucara Diamonds (LUC:TSX) being one of the best performing resource stocks during the past couple of years.
The Lundin family through Zebra Holdings & Investments has also taken a nearly 20% stake in North Arrow Minerals (NAR:TSXV), a junior diamond company with a portfolio of diamond exploration projects in Canada.
Where will future Canadian diamond production come from?
Currently two companies are building diamond mines in Canada.
Stornoway Diamonds (SWY:TSX) is well under way on constructing the Renard Mine in Quebec, which once constructed will be Canada’s newest mine with initial production expected in 2016. This will be the first diamond mine ever in Quebec and is expected to produce 1.6 million carats a year over an 11 year mine life.
Mountain Province Diamonds (MPV:TSX) will be one of the world’s largest and richest diamond mine with production scheduled to commence in Q3, 2016. The project is a joint venture with diamond giant De Beers owning 51% and MPV 49%.
The two new mines once in operation are expected to boost Canada’s market share in world production to 15.1%.
Finding Canada’s Next Diamond Hotspot
Recent diamond exploration in Canada has turned to the province of Saskatchewan.
Saskatchewan is already well known in mining circles as the home of the Athabasca basin where the richest uranium deposits in the world are found. As well as having rich uranium deposits, Saskatchewan is also the world’s largest producer of potash
Saskatchewan was recently rated the second-best jurisdiction in the world for mining investment, according to a 2014 survey conducted by the Fraser Institute
Diamond exploration companies are hoping add diamonds to the resource rich province as the geology also looks promising for diamond deposits. Saskatchewan has some highly prospective areas of Archean rock which have proved to be successful targets areas for diamond discoveries elsewhere in Canada.

North Arrow Minerals (NAR:TSXV) is the most advanced exploration company in the newly-established Pikoo District, located midway between the well-established gold belt near La Ronge and the long-lived base metals camp near Flin Flon.
In 2013, North Arrow made a significant discovery at Pikoo finding diamondiferous kimberlite and thus making Pikoo in the process one of the world’s newest kimberlite discoveries. A distinct advantage over other diamond regions in Canada is that if an economic diamond deposit can be defined then the infrastructure is excellent by comparison. As example, the Pikoo district already has power lines and a highway.
So what is it that makes Pikoo such an exciting exploration prospect and who can investors look to for exploration opportunities?
The Pikoo Discovery
“The Sask Craton tectonically has some real similarities to the Slave Craton, which already hosts the three producing mines in the NWT.” Ken Armstrong, CEO, North Arrow Minerals
In 2013, assays from the PK150 kimberlite returned 23 diamonds > 0.85mm from a 209 kg sample. PK150 is estimated to contain 1.34 carats per tonne.
This led to a declaration by the North Arrow team that Pikoo was Canada’s newest diamond district. That’s a big statement given that much of the team was responsible for some of the most successful diamond companies in Canadian history including such gems as Aber Diamonds and Lucara.
After some extensive till sampling summer work, which is a process of looking for indicators in soil that may have originated from up-ice kimberlites, a recent Spring 2015 drilling program by North Arrow was successful in discovering three more kimberlites and doubling the size of PK150.
PK134 currently has 475kg in for processing micro diamonds with results expected in July 2015.

For those who recognize an opportunity at Pikoo, North Arrow is likely to focus even more resources on their Pikoo discovery as a flagship asset going forward. A recent bulk sample from Qilalugaq was below market expectations, which is likely to push more of their $5.5M working capital as of May 31 to the Pikoo region.
Pikoo District Player
Strike Diamond (SRK:TSXV) is an early stage (grassroots) diamond exploration company exploring a large land tenure in Northern Saskatchewan. Strike has a large mineral tenure position in the Pikoo camp which was established shortly after the North Arrow discovery. As a result, it has some highly prospective tenure which is up-ice of recent indicator discovery suggesting that the kimberlites discovered by North Arrow so far in the Pikoo region may be widespread.

Important take-away: Strike has key land tenures that are located up ice from the discoveries made by North Arrow.
Strike has completed till sampling on the project in 2014 with encouraging results.
Till sampling in the Pikoo diamond district has proven highly effective at identifying diamondiferous kimberlite bodies (as it has elsewhere in Canada).
Strike currently holds an 80% working interest in the Sask Craton projects where it is Operator (the remaining 20% is held by the group that staked the property).
SRK Management
Strike Diamond is led by newly-appointed CEO and serial entrepreneur Ryan Kalt. Most recently, he successfully built and sold then publicly-listed Gold Royalties Corporation to Sandstorm Gold (SSL:TSX) in April 2015, which provided shareholders a 91% takeover premium.
Mr. Kalt a lawyer by background is a young aggressive CEO who has one focus which is to create value for his fellow shareholders. He has his money where his mouth is and as of the end of June 2015 he owns 18.4% of Strike and has been buying more SRK shares recently in the open market.

What’s equally promising is that Ryan seems to be running the company the way old-school successful mining juniors were built. Put the money into the ground, not into management pay cheques. Unlike most CEO’s, Kalt isn’t drawing (or accruing) any salary, which means he’s working for free for the company with 100% shareholder alignment. The only way he will make any money is if the stock goes up.
Another key piece to the Strike team is Vice President, Exploration Jody Dahrouge, P.Geol. Dahrouge has owned a geological consulting company since 1998 which counts a staff in excess of 50 employees. He and his team have evaluated hundreds of projects for public and private companies and he has also been involved in several major projects and companies including management or exploration roles with companies such as Fission Energy and Niocorp as recent examples. Like Strike’s CEO, Mr. Dahrouge also has significant skin in the game owning 18.5% of Strike’s issued float. It is rare for a VP, Exploration for the most part to even own a single share of a company they are working for. So combined, the CEO and VP, Exploration own nearly 40% of the company! That’s a big vote of confidence by Strike’s management in both their own company and their confidence in the Pikoo diamond camp.
Dahrouge boils his interest in Strike and their Pikoo ground quite effectively. “North Arrow’s discovery has remarkable similarities to the early days of the Lac Des Gras discoveries, which ultimately resulted in four diamond mines and one other slated for production, all within the Archean Slave Craton,” noted Dahrouge.
To top off share ownership by management, Blair Way, who is a Director at Strike Diamond also owns 1,400,000 common shares, representing roughly another 5% of the outstanding stock. Way is well known as the CEO of Flinders Resources (FDR:TSXV), which is a producing graphite company with an operating mine in Europe.
Like North Arrow, Strike Diamond is also going to be active this summer exploring the Pikoo camp.
“As we recently announced, Strike Diamond will be following-up our promising indicator sampling program from last fall (which included the discovery of a G9 on our tenure), with an ambitious airborne program this summer. This will allow us to peek beneath the surface on our Pikoo claims and develop additional targeting for more indicator sampling and ultimately drilling,” stated Kalt.
To recap, Canada has quickly put itself on the map for diamond production and discoveries. At Pikoo, North Arrow looks to have established a promising new diamond district.
Companies on the hunt there would appear to have some exciting exploration projects and they are well worth having on your radar.
As to Strike Diamond itself, shareholders could benefit significantly from a tightly held share structure of only 30.0 million outstanding shares (38.0 million fully diluted). By comparison, North Arrow has approximately 54.0 million shares outstanding (still low by standards in the current market). So of course, when looking for stocks with home run potential it is important to take a look at the share structure (along with the people and project). Given that nearly 43% of the float held by insiders, positive exploration news could potentially see rapid share price appreciation.
Key data
Symbol: SRK.V (Toronto), QSG (Frankfurt)
Share price: $0.04
Shares outstanding: 30.0M
Fully diluted: 38.0 million
Market Cap: $1.2M
Insider ownership: 43%
Website: http://www.strikediamond.com
Disclosure: Strike Diamond Corp. is a sponsor of this website.

1. As the crisis in Greece (and now Puerto Rico) intensifies, Global markets (except gold) are tumbling. Please click here now. Greek banks are closed,and the situation looks grim.
2. Incredibly, the enormous volatility seen in US stock markets yesterday could intensify, when the US jobs report is released around 830AM on Thursday, just a few days ahead of the Greek referendum! Gold and silver have a rough general tendency to decline ahead of the jobs report, and rally following its release.
3. In my professional opinion, Greek citizens will probably vote “Yes” to stay in the EU, but will leave anyways in a few weeks. Their sovereign debt crisis won’t be solved by borrowing even more money. Also, once today’s payment deadline passes, it appears that the referendum becomes a vote on something the IMF by-laws prevent it from delivering!
4. The good news is that I expect Chinese corporations and banks to engage in serious buying of Greek assets if/when Greece leaves the EU. Greek stock markets could rally strongly, as that happens.
5. The Greek government is running a balanced budget now, but its overall debt is an overwhelming burden. Likewise, the US government is working towards balancing its budget, but it also has massive debts.
6. The poorest citizens in America are burdened with what I call “shadow taxation”; the cost of living is extremely high for most people, relative to their income. The US government and the Fed are probably mainly to blame for this situation, but greedy corporate directors are also at fault.
7. Rather than paying themselves fairly and paying their workers fairly, many corporate directors have issued themselves huge salaries, while underpaying workers, laying them off, and then urging the government to operate hugely inefficient social assistance programs for the impoverished workers.
8. US wages have stagnated for decades, while corporate profits have surged. House price inflation has been used by the government and the Fed to “create wealth”, but it’s not creating any wealth for most people. It’s destroying the ability of the country’s working class to house themselves.
9. In time, the US government will probably default on its debts, but it will be quite a long process, featuring an ongoing drop in the standard of living of most US residents.
10. Please click here now. This weekly chart of the Dow looks frightening. Relative strength (RSI) has been in steady decline since 2013, while the price of US stocks has rallied. Note the bearish wedging action of the price channel I’ve highlighted on the chart.
11. Some analysts have suggested that the US stock market could function as a type of “safe haven”, if global bond markets collapse. I beg to differ, and yesterday’s meltdown in the Dow suggests that I’m correct to do so.
12. Institutional investors will move funds from bonds to stocks if interest rates rise based on surging economic growth. That’s not happening, and US corporate productivity is “dead in the water”.
13. The US economic upcycle is almost eight years old. Growth is not surging, and while I don’t see Greece as a domino like Lehman was, most Western countries have debt problems that could easily become similar to the problems of Greece.
14. America is an aging empire. The simple fact is that when they are young, empires shine brightly. When they age, they fade into obscurity.
15. On that note, please click here now. While I wouldn’t touch the stock market of the aging and debt-soaked American empire with a ten foot pole, I have no fear of buying all the price sales that occur in the Chinese stock market.
16. In a nutshell, the Chinese empire is young and vibrant. Please click here now. That’s the monthly chart for FXI-NYSE, which I refer to as the “Chinese Dow”.
17. A pullback to the apex of the massive symmetrical triangle pattern would be no surprise to any professional investor. With about five hundred million people poised to become part of China’s “investor class”, new pension fund rules, and the growing share of China in international stock indexes, the future is very bright for the Chinese stock market!
18. Please click here now. That’s the seasonal chart for the spot price of gold, courtesy of Dimitri Speck. Please click here now. That’s another seasonal chart, using the price for gold futures.
19. Investors who put too much capital to work in a single price area, can find themselves straining to make every tiny price move important. When analysing seasonal charts, it’s important to remember that they are seasonal averages of the price action.
20. Generally speaking, gold tends to decline in the first half of the year, and rally in the second half. Today is last day of June, and so gold can be said, generally speaking, to be ending the weak season, and beginning its strong season.
21. Please click here now. That’s the daily T-bond chart. Rallies in T-bonds are often accompanied by rallies in the price of gold. It appears that a bullish multi-headed inverse head and shoulders bottom pattern is forming on the T-bond chart, and that’s more good news for gold investors!
22. Please click here now. Nobody loves gold more than the citizens of India. The country’s mines have all been depleted, and the government has used that fact as an excuse to impose massive duties on imports. Both China and India are moving quickly to find large amounts of gold in the sea, and this should encourage the government to end the duties. Supply from conventional mines and Western investors is dwindling, so I don’t think the coming seabed discoveries will affect the gold price adversely. It’s a win-win situation for all stakeholders, in what I call… the gold bull era!
23. Please click here now. That’s the daily chart for Barrick Gold, which I use as a proxy for the next leg of the bull era. Barrick rallied from the $11 area, but the rally was halted by seasonal factors. There’s a bullish wedge pattern in play now, and there is “price symmetry” with the early November lows in the $10.77 area.
24. As the second half of 2015 gets underway, I expect Barrick to begin to rally towards the key supply zone in the $13 area, and burst above it in early 2016. Investors should be prepared to accumulate Barrick, or their favourite gold stocks, over the next 48 hours, into the softness that typically precedes the US jobs report. The golden good times should begin to roll, after the report is released, and keep rolling, for the rest of the year!
Stewart Thomson of Graceland Updates, Guest Contributor to MiningFeeds.com
If you would like to receive our free newsletter via email, simply enter your email address below & click subscribe.
 Follow us on Twitter
 Become our facebook fan
CONNECT WITH US
Tweets
Tweet with hash tag #miningfeeds or @miningfeeds and your tweets will be displayed across this site.
MOST ACTIVE MINING STOCKS
Daily Gainers
 CMC Metals Ltd. CMC Metals Ltd. |
CMB.V | +900.00% |
 Eden Energy Ltd Eden Energy Ltd |
EDE.AX | +200.00% |
| GoviEx Uranium Inc. |
GXU.V | +42.86% |
| Eagle Nickel Ltd. |
ENL.AX | +41.67% |
| Citigold Corp. Limited |
CTO.AX | +33.33% |
| Mount Burgess Mining NL |
MTB.AX | +33.33% |
| Exalt Resources Limited |
ERD.AX | +31.94% |
| Casa Minerals Inc. |
CASA.V | +30.00% |
| Cariboo Rose Resources Ltd |
CRB.V | +28.57% |
| Belmont Resources Inc. |
BEA.V | +28.57% |


