
The prevailing valuations in the lofty US stock markets are increasingly becoming a bone of contention. Wall Street calmly asserts stocks are reasonably valued, since it has a huge vested interest in keeping people fully-invested. But with valuations soaring following a massive rally and weak third-quarter earnings season, they are dangerously high and portend great downside risk. Stock topping valuations abound.
Since investing is all about buying low then selling high, the price paid for any investment is everything. Buy good companies at cheap prices, and you’ll multiply your wealth over time. But buying those very same good companies at expensive prices radically stunts future gains. While cheap investments have great potential to soar as traders recognize their inherent value, expensive ones have already exhausted their upside.
And it’s valuations, not absolute stock prices, that define cheap and expensive. Valuations are where stock prices are trading relative to their underlying corporate earnings streams. The less investors pay in terms of stock price for each dollar of profits, the greater their ultimate returns. Valuations are most often expressed in price-to-earnings-ratio terms, with stock prices divided by underlying corporate earnings per share.
This concept is so easy to understand, yet the vast majority of investors ignore it. Imagine purchasing a house for a rental property that has expected annual rental income of $30k. How much would you be willing to pay for it? If you can get it for $210k, 7x earnings, it will pay for itself in just 7 years. That’s a great deal. But if that same house is priced at $630k, 21x, it will take far too long just to recoup the initial cost.
The stock markets work the same way, with each dollar of profits completely fungible. And the US stock markets have a century-and-a-quarter average P/E ratio of 14x earnings. That’s fair value for the stock markets as a whole, paying $14 in stock price for each $1 of underlying corporate earnings. This makes a lot of sense, as stock markets exist to “lend” capital from those with surpluses of it to others running deficits.
The reciprocal of 14x earnings is 7.1%. That’s a fair rate of return for those with excess savings they want to invest, and a fair price to pay for those who want access to that scarce capital. 14x facilitates mutually-beneficial transactions for each side of the capital trade, so it’s right where stock valuations have naturally gravitated towards over the very long term. Cheap and expensive are defined from that baseline.
Half fair value, or 7x earnings, is very cheap historically. Buying good companies’ stocks trading at 7x earnings is a virtual guarantee of massive wealth-multiplying future gains. Conversely double fair value, 28x, is exceedingly-dangerous bubble territory. Buying the same good companies’ stocks at 28x dooms invested capital to many years of lackluster gains at best, and catastrophic losses exceeding 50% at worst.
There’s nothing more important for investors to understand than general-stock-market valuations. They move in great third-of-a-century cycles I call Long Valuation Waves. These are divided into secular bulls and secular bears that each last about 17 years. Valuations start out cheap near 7x, gradually expand to or through 28x in the first-half secular bulls, and then consolidate back to 7x in the second-half secular bears.
Unfortunately the US stock markets remain mired deep in the valuation-contracting secular-bear phase of their LVW today despite their epic cyclical bull of recent years. How can that be true when the US stock markets have more than tripled since early 2009? The flagship S&P 500, despite its massive gains, still remains below its real inflation-adjusted peak from the end of the last secular bull way back in March 2000!
The last cyclical bull peaked in October 2007, and ominously the US stock markets are trading at far-higher valuations today than they were back then. This first chart looks at general-stock valuations as seen through the lens of the benchmark S&P 500, or SPX. Our methodology is simple, conservative, and easy to replicate. At each month-end, we record some key data from all 500 SPX component companies.
Each individual stock price is divided by that company’s latest four quarters of accounting earnings per share as reported to the SEC, yielding individual P/E ratios for all 500 SPX components. This is classic trailing-twelve-month methodology, involving hard historical data and no guesswork on future profits. Then all 500 of these P/Es are averaged, both simply and also weighted by individual companies’ market capitalizations.
Here are the results since the topping of the last cyclical bull, with SPX valuations recently surging up to lofty nosebleed levels. Contrary to Wall Street’s endless claims that the stock markets aren’t expensive today, prevailing valuations are actually way up at dangerous bull-slaying levels. The SPX and therefore US stock markets are trading at topping valuations today, which is a super-bearish omen going forward.

While I’m eager to see November’s valuation data, this month isn’t quite over yet. So our latest SPX valuation data is from the end of October. And that proved pretty ominous, with the market-capitalization-weighted-average price-to-earnings ratio of all 500 SPX component stocks rocketing 17.5% higher on a monthly basis to 25.5x earnings! These elite companies’ simple-average P/E ratio was right in line at 25.6x.
This was a huge jump in valuations in such a short period of time, an exceedingly-rare event. It had two primary drivers. First, the mighty S&P 500 rocketed an epic 8.3% higher in October, its best month since October 2011! Assuming constant corporate profits, any stock-price gains translate directly into proportionally higher price-to-earnings ratios. Up the P/E ratio’s P by any percentage, and the P/E will match that gain.
But that only accounts for about half of October’s extreme valuation ramp. The other half came from a weak third-quarter earnings season. While there were certainly some great results from elite technology companies, the great majority of SPX components saw flat-to-weak profits year-over-year. There were mounting worries of a bifurcated economy, the tech giants thriving while most of the rest of the companies struggle.
Lowering the E in P/E naturally forces valuations higher as well. And it’s pretty amazing lower earnings actually came to pass. It’s not overall corporate profits that feed P/E ratios, but earnings per share. The great majority of elite SPX companies actively manipulate EPS higher through stock buybacks. If overall profits can be spread across fewer outstanding shares, the EPS will rise which will force valuations lower.
And thanks to the Fed’s extreme zero-interest-rate policy held in place since the dark heart of 2008’s stock panic, corporations literally borrowed trillions of dollars near artificial record-low rates to use to buy back their stocks. As of the end of Q2’15, total buybacks over that past year alone had exceeded $555b! And a whopping 3/4ths of the elite SPX companies, the biggest and best in America, bought back their stocks.
These campaigns are explicitly designed to simultaneously boost stock prices and earnings per share, which creates an illusion of growth. Companies can even mask declining earnings by buying back enough shares to more than offset the drop in profits spread across them. And this outright earnings-per-share manipulation that lowers valuations makes this past year’s valuation ramp even more ominous.
A year ago in October 2014, the elite SPX component companies had a market-capitalization-weighted-average P/E ratio of 22.8x. Weighting all components’ P/E ratios by their market caps ensures smaller companies with outsized valuations don’t disproportionately skew the overall average. And the SPX ended that year-ago October at 2018, which was actually pretty close to the 2079 closing out October 2015.
With the SPX merely climbing 3.0% in that year ending October, it’s incredible that valuations still shot up by 11.5% despite those massive stock buybacks! This implies corporate earnings have peaked this past year, which helps explain these grinding toppy stock markets. If companies fail to even maintain their profits, then today’s lofty stock-market valuations based on future earnings growth look even more threatening.
Trading at 25.5x earnings last month, the SPX was right on the cusp of exceedingly-dangerous bubble territory at 28x earnings! No valuations remotely close to this had been seen in over a decade. Even back in October 2007 when the last cyclical bull peaked, the SPX valuation was considerably lower at 21.3x earnings. Yet stocks were still expensive enough to roll over from cyclical bull to cyclical bear.
Valuations are the key arbiter of those great bull-bear cycles in the stock markets. When stocks grow expensive by historical standards late in mature bull markets, the odds mount that a new bear market looms. And investors lulled into a dangerous sense of complacency at these critical times by Wall Street’s perpetually-bullish rationalizations of why stocks should rally forever face devastating bear-market losses.
After that last cyclical bull peaked in October 2007 at merely 21x earnings, the mighty S&P 500 would plunge 56.8% over the next 1.4 years in a brutal cyclical bear. Investors owning the best-of-the-best elite American companies constituting the SPX saw their capital more than sliced in half because they failed to heed the warning of high valuations. And today’s are more extreme, nearly 20% higher than that last bull top!
Remember that for a century and a quarter, the average P/E ratio of the US stock markets has been 14x earnings. The white line in these charts reveals where the SPX would need to trade to match this historical fair-value baseline. And as of the end of October, this number is way down under 1150. With the US stock markets so expensive, the downside as these lofty valuations inevitably mean revert is massive.
The stock markets would have to drop 45% based on current corporate earnings per share, even boosted by the gargantuan ZIRP-spawned stock buybacks in recent years, to merely return to fair value! This is an interesting number, because the typical decline in cyclical stock bears following cyclical stock bulls at this stage in the market cycles is 50%. The recent stock topping valuations are very menacing indeed.
For years, Wall Street has endlessly claimed these lofty Fed-levitated stock markets are justified based on underlying corporate-earnings fundamentals. For years, Wall Street has applauded the manipulative stock buybacks that artificially boost earnings per share. All this has led to extreme complacency, with most investors convinced this long-in-the-tooth bull market can continue indefinitely. Boy will they be surprised.
And even worse, the downside target for the next S&P 500 bear is actually much lower than fair value. At this stage in those great Long Valuation Wave stock-market cycles, valuations actually ought to be much closer to 10x earnings. This next chart, which zooms out to encompass the entire secular bear since 2000, illuminates this enormous downside risk created by the Fed’s brazen artificial stock-market levitation.

The US stock markets remain mired deep in the same secular bear that started back in March 2000. How can that be when the S&P 500 peaked at 1527 back then and recently soared to 2131 in May 2015? If the March 2000 apex of the last secular bull is adjusted for US Consumer Price Index inflation, which is even lowballed for political reasons, it works out to 2122 in constant May 2015 dollars. That’s a staggering revelation.
For 15.2 years, the US stock markets did nothing but grind sideways at best in real terms! For all the sound and fury of the Fed’s extraordinary stock-market levitation of recent years fueled by its unprecedented third quantitative-easing campaign, all it accomplished was returning the stock markets to their last real secular-bull peak. But not even the Fed’s epic money printing could create a solid corporate-profits foundation.
October’s near-bubble 25.5x SPX valuations were last seen 11.3 years earlier in June 2004. And those were right on the major secular-bear stock-valuation downtrend shown above with the thick blue dotted line. That valuation downtrend is exceedingly important, and actual valuations oscillated around it as usual in secular bears until late 2012 when the Fed launched and expanded its infamous QE3 campaign.
QE3 was radically different from QE1 and QE2 because it was open-ended, it had no predetermined size or end date like its predecessors. Top Fed officials deftly used this ambiguity to manipulate psychology among stock traders. They continually implied the Fed was ready to increase the size of QE3’s debt monetizations if the stock markets suffered any material selloff. The Fed was jawboning stocks higher.
Stock traders interpreted this endless dovishness exactly as the Fed intended, believing an effective Fed Put was in place for the stock markets. So they rushed to aggressively buy already-high stocks, ignoring all conventional indicators of risk including valuations. That Fed-sparked stampede into stocks fueled the massive breakout of the SPX above its 13-year-old nominal resistance near 1500 back in early 2013.
As the stock-market valuations rising sharply in the Fed-SPX-levitation era since 2013 prove, the huge stock gains weren’t the result of improving earnings fundamentals but merely Fed hot air. With profits failing to grow enough to justify those lofty stock prices, the fundamental foundation of recent years’ powerful stock bull was totally rotten. Stock valuations were driven to near-bubble extreme topping territory.
And with the Fed’s easy-money policies that inflated the stock markets ending, the chickens are going to come home to roost. The Fed concluded its new quantitative-easing bond buying with money conjured out of thin air in October 2014, and it seems to be on the verge of ending its zero-interest-rate policy kept in place since December 2008 that fueled those epic corporate stock buybacks seen in recent years.
And with the vast bullish psychological impact of QE and ZIRP fading, stock-market valuations are going to mean revert back to their secular downtrend in place before the Fed goosed the stock markets. The whole purpose of secular stock bears is to force the markets to grind sideways for long enough to give corporate earnings time to grow into the extreme stock prices seen at the end of the preceding secular bull.
This massive 17-year secular-bear grind is accomplished through smaller cyclical bears and bulls within that span. Secular bears consist of a series of cyclical bears that first cut stock prices in half, followed by cyclical bulls that double them back up to breakeven again. Since 2000, we’ve seen two of these full cyclical-bull-bear cycles. And as today’s dangerous stock-topping valuations prove, the next bear is imminent.
Thanks to the Fed’s gross market distortions in recent years dragging stocks so far outside of normal trends, this next bear is going to be a doozy. Secular bears begin with stock valuations near or above bubble levels, and end with them around half fair value at 7x earnings before the next secular bull can be born. At this late stage in 17-year secular bears as the valuation downtrend shows, P/Es should be near 10x.
Based on current corporate earnings, which Wall Street constantly claims are excellent, the SPX would have to plunge over 60% from here to 820! Even if profits start miraculously growing in this tough world economy, it’s hard to imagine them rising enough in the next couple years to push the SPX much over 1000 at 10x earnings. The Fed’s artificial stock-market levitation that so stretched valuations will prove disastrous.
Today’s stock topping valuations couldn’t be more dangerous at this stage in the great secular bull-bear cycles. SPX valuations are way up near bubble levels now thanks to the Fed, leaving vast downside to where they ought to be nearly 16 years into an indisputable ongoing secular bear. Investors need to be very careful in buying very expensive stocks today despite Wall Street trying to convince them otherwise.
And frighteningly, the corporate-earnings and therefore valuation situation may be even worse thanks to the gross Fed distortions of recent years. Corporate sales, which can’t be manipulated like earnings, have been weakening. Companies can cost-cut their way to profits for a while, but they can’t fire everyone and eventually have to see revenues improve to grow profits. Even stock buybacks are a temporary stopgap.
As the Fed starts the long road to normalizing rates after it ends its zero-interest-rate policy, the virtually-free money companies have been borrowing to buy back stocks will vanish. Higher borrowing costs will lead to plummeting share buybacks, which will end the manipulation of spreading overall profits across fewer outstanding shares year after year. So valuations could stay high or even climb higher from here.
The stock markets would be extremely expensive at 25.5x earnings even late in a secular bull market, but they are an accident waiting to happen this late in a secular bear. Investors ought to prepare for a new cyclical bear market that will at least cut stock prices in half. The biggest risk is not perceiving it in time, as bears unfold slowly over a couple years to keep investors lulled into complacency for as long as possible.
Investors and speculators alike can trade these stock topping valuations by being ready to liquidate their long stock positions as the stock markets inevitably roll over. Sliding stock markets can also be bet upon directly through put options on the leading SPY SPDR S&P 500 ETF. Alternatively, long positions can be added in gold (GLD ETF) and radically-undervalued gold stocks, as gold tends to thrive during stock bear markets.
The bottom line is the US stock markets are trading at dangerous topping valuations. Despite incredible buybacks fueled by record-low rates courtesy of the Fed, corporate profits are still so weak relative to Fed-inflated stock prices that stocks still neared bubble valuations following third-quarter earnings. This is a huge problem so late in a secular bear, when valuations should be far closer to 10x earnings than 26x.
This has to end badly. The gross Fed distortions of recent years artificially extended a mature cyclical bull and delayed a cyclical bear, but central banks can’t eliminate market cycles driven by valuations. The overdue bear market is still coming, and will be far worse starting from such lofty and overvalued conditions. Stock topping valuations at these extremes this late in a secular bear are exceedingly dangerous.
1. The case for gold ownership is not any weaker or stronger now, than it was a thousand years ago. Gold is the world’s ultimate asset, and that’s irrespective of whether the price is currently rising or falling.
2. Currently, most commodity indexes are dominated by oil, and game-changing events in the mid-East region are poised to occur in 2016.
3.Gold tends to track oil very closely. I expect oil to stage roughly a 50% – 100% rally from the 2015 lows, over the next 18 months. Here’s why:
4. American politicians appear to realize they’ve been overly aggressive in Syria, Iraq, Libya, Egypt, and in the entire mid-East region. The US policy of regime change there has clearly been disastrous.
5. As Western politicians begin to back away from that policy, a door is opening for Russian and Chinese politicians to become serious mid-East players.
6. A number of powerful institutional analysts have the same view that I do. On that note, please click here now. Interviewed by Barron’s, Larry Jeddeloh predicts that an Iran-Saudi deal is coming, whereby Iran stops backing the anti-Saudi rebels in Yemen, and in return the House of Saud announces a major cut in oil production.
7. Russia, Iran, and Saudi Arabia all want a higher oil price, and that deal would do it. I expect a deal will be signed in 2016, and create a major rally in oil and gold.
8. Another huge beneficiary of this deal would be the country of Canada. While rest of the West focuses on economically useless programs like QE, the new Canadian government is poised to ramp up infrastructure spending.
9. QE creates a drag on money velocity, by funnelling printed money into bank and government coffers. That forces elderly citizens to engage in dangerous risk taking with their savings.
10. Until US banks are incentivized to make profitable loans with higher interest rates, America will continue to burn the savings of its elderly citizens, like burning rice paper in a “risk-on blast furnace”.
11. Regardless of America’s chosen path, Canadian oil stocks should have a truly spectacular rally in the second half of 2016, and I’m an eager buyer, here and now.
12. Historically, gold tends to rally after the Fed’s first rate hike, and the dollar tends to weaken. I’ve suggested throughout 2015, that gold could remain “generally soft”, until Janet Yellen pulls her rate hike trigger. If the first hike comes at the December 16th meeting, and I think it will, early January could see an institutional rotation out of general equities, and into gold stocks.
13. Please click here now. Double-click to enlarge. That’s the daily gold chart. Note the beautiful technical action of my 14,7,7 Stochastics series oscillator, at the bottom of the chart.
14. I refer to that oscillator as “Tony the Tiger”, and Tony is flashing a crossover buy signal now. Gold is firming nicely. A move above the 20 line by that oscillator, would be more good news for gold price enthusiasts.
15. The most likely scenario for gold, in the short to intermediate term, is a double bottom pattern, ahead of the mid-December FOMC announcement.
16. I think it’s important for the entire Western gold community to be open to the idea that in the mid-East, and in the global gold market, BRICS countries are going to fix what America broke.
17. The Shanghai Gold Fix is coming within a few months. That will move more price discovery away from Western economic events, and towards Chindian jewellery demand versus mine supply. In early 2016, Chinese New Year celebrations could also add some serious zest to a post rate hike rally in gold.
18. Please click here now. When all is said and done, India is the world’s main demand-side driver of the gold price.
19. Mines are the main supply-side driver. New discoveries are becoming smaller, as gold-obsessed India begins to industrialize at a mind-boggling pace.In the next few years, while the rest of the world languishes in a QE-induced quagmire, Indian GDP could hit 10%!
20. Jewellers are in expansion mode, refiners are racing to expand capacity and get LBMA certification, and the citizens are building more wealth, which they celebrate by demanding more gold.
21. Also the media drama surrounding Indian gold monetization and paper gold bonds is over, and the surge in Indian refining of raw Dore gold is rightfully taking centre stage. There’s a shortage of Dore bars, and Indian refiners are eager to sign contracts with gold miners.
22. On that note, please click here now. That’s the GDX daily chart. Gold stocks are staging a very interesting technical non-confirmation with gold bullion. Gold has moved decisively below its summer lows, while many gold stocks are well above their lows.
23. Volume is also very positive; it’s been declining on price softness, and rising with price strength. Overall, there’s been a huge surge in volume in gold stocks since early July.
24. The average American investor in the gold community has a lot on their plate. My suggestion is to stay focused on the relentless industrialization taking place in India, the shrinking mine supply, and on the highly significant non-confirmation taking place, between gold and gold stocks. Keep it simple. Stay focused on gold stocks more than the bullion, for a winning year in 2016!
Stewart Thomson of Graceland Updates, Guest Contributor to MiningFeeds.com
The beleaguered gold-mining sector continues to be plagued by monumental universal bearishness. Nearly everyone assumes the gold miners are doomed, that they can’t survive for long in a sub-$1200-gold environment. But this belief is totally wrong, a consequence of extreme fear’s fog of war. The gold miners’ underlying earnings fundamentals remain very strong, as evidenced by their recent Q3 results.
In all the stock markets, corporate profits ultimately drive stock prices. Because a stock simply represents a fractional stake in its underlying company’s future earnings stream, all stock prices eventually revert to some reasonable multiple of those profits. These earnings are truly the only fundamental driver of stock prices. All deviations from righteous valuations based on profits are just the temporary products of herd sentiment.
The gold stocks are suffering such an extreme psychological anomaly today, drowning in mind-boggling depths of popular fear and despair. The leading HUI gold-stock index just slumped to a brutal new 13.3-year secular low this week! The apathy and hate for this sector is nothing short of astounding. Anyone masochistic enough to make a bullish contrarian case on gold stocks will be peppered with scathing ridicule.
But in the midst of any universal sentiment extreme, prudent investors and speculators must disconnect from the herd emotions to take a rational look at the underlying profits fundamentals. And there is zero doubt today that prevailing gold-stock prices are truly fundamentally absurd. The last time gold stocks were priced at these levels per the HUI ages ago in July 2002, the gold price was merely trading around $305.
Think about the wild incongruity of that. Profits drive stock prices, and profits in gold mining derive almost exclusively from the price of gold. This is because the mining costs for a particular deposit are essentially fixed in its mine-planning stages. So higher gold prices lead directly to higher profits, and this relationship is not linear. Gold miners naturally leverage gold’s moves, which can drive huge gains for investors
This is easy to illustrate. In this year’s second quarter, the elite gold miners of the flagship GDX Gold Miners ETF reported average cash and all-in sustaining costs of $635 and $895 per ounce. The latter number can be rounded up to $900 for an industry average. Such costs mean if gold is trading around $1100, this industry earns $200 per ounce in profits. What happens when gold merely rallies 10% to $1210?
Since costs at individual gold mines are largely fixed regardless of the gold price, gold’s gains translate directly into higher earnings. A $1210 selling price less $900 costs yields new profits of $310 per ounce, a whopping 55% gain on a 10% gold rally! This strong inherent leverage to gold’s upside is the main reason investors buy gold stocks. And the riches brave contrarians have won in this sector have been vast.
Today’s gold-stocks-to-zero herd groupthink has deluded everyone into forgetting the gold stocks were the best-performing sector in all the stock markets between November 2010 and September 2011. The HUI skyrocketed 1664% higher during those 10.8 years, radically trouncing the benchmark S&P 500’s 14% loss over that same span. Buying gold stocks low when few others will can create life-changing wealth.
And gold stocks couldn’t be any lower than today, priced as if gold was near $305 instead of reflecting the real prevailing price of $1070. Imagine the rush to buy stocks in any other sector if its stock prices were battered to such extreme lows that they implied its products were selling for around just 3/11ths of their actual selling price. The epic fundamental disconnect that exists in gold stocks today is utterly ridiculous.
The best way to fight irrational emotion to buy low so you can later sell high and multiply your capital is through research. The more hard information you have, the more you can root your psyche in reality and steel yourself from the howling winds of herd sentiment. The only way to understand today’s actual real fundamentals of the gold-mining industry is to carefully study how these companies are performing.
With the gold miners’ third-quarter results almost all reported, this week I decided to dig deep into these latest fundamental reads to sharpen my understanding of this sector’s profitability as a whole. It’s not easy wading through dozens of quarterly reports, but the strategic understanding gleaned makes such an effort well worth it. I found the gold miners continue to have costs so low their operations are very profitable.
That flagship GDX gold-stock ETF is the definitive gold-stock trading vehicle, and contains the best of the world’s gold miners. As of this week, this ETF held 35 of this planet’s elite “gold stocks”. The quotes are because a handful of GDX’s components are actually silver miners. But there’s no better roster of the world’s leading and dominant gold miners than those winning the honor of being included in this GDX ETF.
This week I ran through the latest quarterly results from all of them, and built a spreadsheet with a bunch of fundamental data from each. These tables summarize some of the most important information. They include each GDX component company’s key cost data for Q3, their cash in the bank at the end of Q3, and their operating cash flows generated in Q3. If you are bearish on gold stocks, prepare to be amazed.


These tables fit in the top 34 of GDX’s 35 components, 99.2% of its total weighting. And once again they just shatter the popular myth today that the gold miners are doomed at these low prevailing gold prices. This entire industry is operating at both cash and all-in sustaining costs far below current gold levels! It is vastly more profitable today than it was over 13 years ago the last time gold stocks traded at these prices.
Among the world’s elite gold miners that reported cash costs in Q3, their average was way down at an incredibly-low $618 per ounce! That’s an amazing revelation that obliterates the common notion today that gold miners are in trouble under $1200 gold. Even if gold somehow plunged all the way down to $650, an absurd apocalyptic extreme even the most vociferous bears never dream of, gold miners can survive.
Cash costs are how much it actually costs to produce each ounce of gold on an ongoing basis, the costs that have to be covered to pay the bills. They don’t include things like exploration, building mines, and reclamation costs. Cash-cost levels are the ultimate acid test of gold-miner survivability. As long as gold remains above cash costs, miners can keep producing and maintain operations to await higher prices.
But the problem with cash costs is they don’t reflect the true costs of mining gold. Cash costs were all the gold miners reported in the 1990s and 2000s, and they were misleading to investors without a deep knowledge of this industry’s many idiosyncrasies. So back in early 2013 the World Gold Council, the gold miners’ self-funded industry group, worked on a new framework for more representative cost reporting.
This resulted in the far-superior all-in-sustaining-cost metric introduced in June 2013. These include all the direct cash costs of mining gold, as well as many other costs. That includes the general corporate-level administrative expenses not included in cash costs like mine-level ones are, as well as all costs required to maintain and replenish existing production levels. This is essential since mines are always depleting.
So all-in sustaining costs also include the exploration, mine-development, and construction expenses necessary to maintain gold output. They also include the required remediation and reclamation costs incurred after mines are economically depleted. So there’s no doubt that all-in sustaining costs are a much superior cost measure. So it’s best to consider gold-mining profitability from them, not just cash costs.
In their just-reported Q3, the world’s elite gold miners had average all-in sustaining costs of just $866 per ounce! That’s incredible, way below the false perception of gold-mining cost levels fostered by today’s suffocating herd bearishness. That means even at this week’s brutal new 5.8-year secular gold low of $1069, this industry is still earning profits of $203 per ounce! That 19% profit margin is pretty darned impressive.
Contrary to popular assumptions, the gold miners are not only very profitable at today’s low gold prices but would still earn plenty even at $950. These companies have worked very hard to reduce costs to cope with the current depressed gold prices, and have widely succeeded. The actual fundamentals of the gold-mining industry today conclusively prove that this sector has nothing to worry about above $900.
But while some gold miners are trading at cheap price-to-earnings ratios today, the majority aren’t. If this industry is really earning $200+ per ounce at today’s gold prices, why isn’t that reflected in the gold miners’ P/E ratios? The answer is simple. These low gold prices have forced most miners to write down the carrying value of their deposit and mine assets, resulting in large non-cash charges to accounting earnings.
When companies initially buy deposits and build mines, the costs incurred are put on their books as assets. But as gold prices drop, all deposits become less economical to mine. So the SEC’s accounting rules require companies to write down these assets to reflect prevailing values. These asset-impairment charges are costs that flow through the income statement. They have temporarily overwhelmed real earnings.
But gold-driven writedowns are not that important or relevant over the long term. They are non-cash, so they don’t represent current costs. They are something of an accounting fiction in the quarters in which they hit. And assets’ carrying values are seldom righteous anyway, since these values aren’t increased when gold prices rise. They can only be adjusted lower, not higher. And writedowns soon flush off of income statements.
Traditional trailing price-to-earnings ratios include the last four quarters’ accounting earnings per share. So once the big writedowns pass beyond the latest year, accounting earnings again reflect underlying operating profitability. So as recent impairment charges roll out of the EPS calculations, the gold miners’ headline P/E ratios will rapidly shift from nonexistent to reflecting anomalous fundamental undervaluation.
An alternate measure of gold-mining profitability that isn’t skewed by impairment charges is operating cash flows. Q3’s are listed above for these elite GDX companies. Not only were they all positive last quarter, but some were large relative to the companies’ market capitalizations. As long as businesses can generate positive cash flows from operations, and make any debt payments, they can keep operating indefinitely.
These very strong operating cash flows have led to huge cash hoards for many of the elite gold miners, which are also noted above. In many cases the cash on hand at these gold miners is really large compared to their market caps. Strong cash positions mean the gold miners can weather a low-gold-price storm for quite some time even if gold would somehow miraculously plunge below their core cash costs.
The third-quarter results of the world’s elite gold miners included in the flagship GDX gold-stock ETF are incredibly bullish. Contrary to groupthink bearish expectations that gold miners are teetering right on the edge of bankruptcy, they are thriving even at low prevailing gold prices! Their key all-in sustaining costs are far below current gold levels, so they are generating big operating cash flows to boost their large coffers.
And these miners’ strong fundamental positions are improving. My last iteration of this research using Q2’15 results showed average cash and all-in-sustaining costs for the elite GDX gold miners of $635 and $895. In just the single quarter of Q3, barely any time to change the course of such capital-intensive operations as gold mining, these fell another 2.6% and 3.3% to $618 and $866. The gold miners are strengthening!
With gold stocks languishing near such fundamentally-absurd prices relative to the metal that drives their profits, their upside from here is utterly vast. As I discussed in an essay last week digging into the core fundamental relationship between gold stocks and gold prices, the gold stocks are highly likely to at least quadruple from current levels. Contrarian investors are chomping at the bit to return, waiting on a key signal.
And that is gold, which has been savaged by extreme selling by American futures speculators following late October’s hawkish Fed surprise on December rate hikes. They’ve been dumping hyper-leveraged gold-futures contracts at extraordinary rates in recent weeks, both by liquidating existing long-side bets and adding new short-side ones. But the full sizes of these gold bets are finite, with speculators nearing limits.
Sooner or later, all the speculators brazen enough to sell gold into major secular lows will have done so. And that will lead to big gold-futures short covering, since those leveraged downside bets on gold have to be offset by buying long contracts to close them out. With speculators’ gold-futures shorts very high again following that hawkish Fed surprise, another major short-covering rally in gold is imminent.
And naturally as gold rallies, gold miners’ profits leverage to their metal will kick in with a vengeance. This industry’s profits growth as gold climbs will dwarf the gains in gold. That’s going to lead to sharply falling valuations as P/E ratios drop, attracting in legions of value investors. And considering the gold stocks are now ludicrously trading as if gold was near $300 rather than $1100, their upside from here is vast.
While contrarian investors and speculators are waiting for a decisive green light from gold to pour back into the radically-undervalued gold stocks, they fear the same thing futures speculators do. Everyone is worried Fed rate hikes will prove gold’s nemesis, forcing it to keep spiraling lower indefinitely. The idea is higher yields on other assets will make zero-yielding gold less attractive, retarding investment demand.
Fortunately, history proves the exact opposite! Gold investment demand actually flourishes during Fed-rate-hike cycles because they are so damaging to overvalued stock and bond markets. Since 1971, the Fed has executed 11 rate-hike cycles. Gold actually rallied in the majority, 6 of those. And during those 6 Fed-rate-hike cycles where gold rallied, its average gain during the exact cycle spans was an amazing +61.0%!
The Fed’s last rate-hike cycle ran from June 2004 to June 2006, where it hiked its federal-fund rate by a whopping 425 basis points through 17 consecutive hikes. Yet even though that more than quintupled the FFR, gold still soared 49.6% higher over that exact span! Fed rate hikes are no threat to gold with one important exception, when gold enters those rate-hike cycles trading near major secular highs.
In the other 5 Fed-rate-hike cycles since 1971 where gold fell, this metal was already high when the Fed started increasing rates. That certainly isn’t the case today, with gold languishing near major secular lows. And gold’s average loss during these rate-hike cycles where it entered high was just 13.9%, asymmetrically small compared to its rate-hike-cycle gains. Gold stocks have nothing to fear from rate hikes.
And today’s already-excellent gold-stock earnings fundamentals based on their low costs and robust operating cash flows will see incredible growth as gold mean reverts far higher as investment demand inevitably returns. Gold’s woes began in early 2013 with the radical distortions from the Fed’s wildly-unprecedented open-ended third quantitative-easing campaign. Normalization will restore those conditions.
Between 2010 and 2012 before the Fed’s stock-market levitation, the gold price averaged $1490 in those last normal years. In 2012 alone, it averaged $1669. Let’s round these to $1500 and $1650 to get an idea of the gold-mining industry’s profits growth as gold mean reverts to normal levels. At rounded all-in sustaining costs of $875, $1500 and $1650 gold would yield enormous profits of $625 and $775 per ounce.
These merely-average gold levels would generate staggering profits growth for this industry up around 215% and 290% for a gold bull on the order of just 40% to 55%! Such extreme earnings growth would fuel an enormous upleg in gold stocks even if they were reasonably valued today, but coming out of the prevalent fundamentally-absurd lows that upleg will have to be epic. This should greatly excite investors!
With the general stock markets very overvalued thanks to the Fed’s levitation in recent years, there isn’t much fundamental upside to be found. Yet gold stocks, because sentiment is so overwhelmingly and irrationally bearish against them, have vast potential. They can be played by going long the GDX gold-stock ETF of course, but that sector benchmark’s gains will be dwarfed by those in the best of the elite miners.
The bottom line is gold miners’ underlying earnings fundamentals remain strong today even with the low prevailing gold prices. The all-in sustaining costs of this sector’s elite miners are quite low, leading to profitable operations generating large cash flows filling corporate treasuries. This reality evident in the latest quarterly results is a stark contrast to perceptions that the gold miners’ stocks are circling the drain.
Sooner or later all stock prices ultimately reflect their underlying corporate profits, and gold stocks are no exception. The extreme and wildly-irrational fear that has pummeled this sector to fundamentally-absurd price levels can’t and won’t last. And once that breaks as gold mean reverts higher, smart contrarians are going to flood back into this dirt-cheap sector and drive gold stocks radically higher over the coming years.
1. I’ve talked at length about the relationship between US money supply velocity and interest rates, and done so in a positive way.
2. A modest rise in nominal interest rates encourages banks to make loans, and it makes those loans profitable. Most of the QE money has either just sat in bank coffers, or it has been inefficiently invested in US government bonds.
3. I’ve strongly suggested that modest nominal rates can reduce real rates, by creating inflation. That’s negative for the US dollar, and positive for gold.
4. On that note, please click here now. That’s the COT report for the US dollar, released yesterday by the CFTC.
5. Clearly, the deep pocketed commercial traders (banks with “thundercash”) are building a massive short position in the dollar, probably in preparation for an inflationary rate hike from Janet Yellen, on December 16th.
6. Please click here now. The COT report for gold is in sync with the report for the dollar. The market-leading banks are buying gold aggressively into the current price weakness, and eagerly booking profits on a lot of short positions.
7. I suggested shorting some gold in the $1170 area, and with the price about $100 lower now, it’s important for all gold price enthusiasts to be buyers. Short position profits also need to be booked.
8. It’s a waste of time for amateur investors to read bearish analysis now, while giant banks buy gold with both aggression and size.
9. The bottom line is that Western gold community investors can feel very comfortable, here and now, with their accumulation of the world’s ultimate asset!
10. In my professional opinion, Janet Yellen is an “inflationist”. Rather than using aggressive rate hikes to halt inflation, she plans to use very modest rate hikes to increase it.
11. Please click here now. The COT report for silver is also looking very good, and in an environment where inflation begins to rise, money managers will embrace this mighty metal with open arms.
12. On the big picture front, China continues to make spectacular progress towards internationalizing the yuan, and making it a key world reserve currency.
13. Please click here now. It’s important to compartmentalize gold’s price drivers. Many analysts appear to have tried to fit a “love trade circle” into a “fear trade square”.
14. That can’t work. China’s central bank has a stated goal of internationalizing the yuan, and gold plays a stated role in making that happen. The internationalization of the yuan is clearly good news for gold.
15. Unfortunately for fear trade enthusiasts, yuan internationalization won’t produce a “gold price parabola”. It will produce modest and sustained upwards price pressure, for many years to come.
16. Please click here now. That’s the daily gold chart. Note the beautiful position of my 14,7,7 Stochastics series oscillator, as gold glides into key support. I’m an eager buyer, alongside the banks!
17. The internationalization of the yuan, and its relatively quick ascent to global reserve currency status, should also turn gold stocks into the world’s most respected equity asset class, and certainly into one of them.
18. Please click here now. That’s a monthly chart of the Dow. Consistent accumulation of strong assets, on price weakness, creates wealth that is retained during good and bad times.
19. While I run a highly successful gold-oriented swing trade service at www.guswinger.com, investors should only have a portion of their investable assets devoted to such endeavours. Trading is one part of a complete investment strategy portfolio.
20. Also, not every market decline is the same. Some are short and violent. Others are Chinese water torture. Some are very modest. It’s difficult to know what form a decline will take when it begins, but professional investors know the decline must be bought.
21. Amateur investors focus on their drawdowns during the accumulation phase, and professionals focus on the task at hand. For amateur investors that want to take themselves to the professional level, they need to reach deep into themselves, and find a higher level of intestinal fortitude.
22. I’ll ask all investors in the Western gold stocks community to think hard about that, and to take another hard look at the 10,000 area on my Dow chart. Amateur attempts to avoid drawdowns and pick “final lows” isn’t a proper way to build wealth. It’s financial poppycock. Intestinal fortitude in 2008 at Dow 10,000, and in gold stocks now, is what builds wealth that is here to stay.
23. On that key note, please click here now. That’s the daily GDX chart. I affectionately refer to my 14,7,7 Stochastics series oscillator as “Tony the Tiger”. Tony looks spectacular right now, and is ready to roar a very loud “Buy!” signal, for all gold stock enthusiasts.
24. Using Fibonacci retracement lines from the January highs near $23, to the September lows near $13, I’ve set an $18 target, which is the 50% retracement line. Gold stock champions (current and prospective) in the Western gold community should be eager buyers now, ready for mega-bank buying signaled by the COT reports to launch gold and gold stocks nicely higher. In the longer term, the role of gold in yuan internationalization will be one of the key price drivers, of a gold stocks bull era!
Stewart Thomson of Graceland Updates, Guest Contributor to MiningFeeds.com
Introduction
Global fertilizer prices remain under pressure due to low prices of major crops and global economic uncertainty. These factors have squeezed farmers’ margins and lowered the demand for fertilizers. Currency volatility between different regions is also affecting the fertilizer trade, decreasing demand from developing countries, where currencies have generally weakened.
This trend may change, however with the upcoming El Nino. Some crop prices are likely to strengthen but some will weaken further as this weather phenomenon has different impacts on different commodities in different regions.
Background
Fertilizers are chemical compounds, which when applied to plants provide essential nutrients for plant growth and yield. They can be divided into organic (carbon based and derived from plants/animals) and inorganic or commercial (non-carbon based and derived from minerals and industrial processes). Fertilizers generally provide three main nutrients: nitrogen, phosphorus and potassium, as well as a number of other secondary and micronutrients.
Nitrogen-based fertilizers (ammonia, urea) are the largest fertilizer market. They are produced from natural gas and nitrogen sourced from the air. Major exporting countries for nitrogen derived fertilizers are Russia, China and Ukraine. The second largest fertilizer is phosphates, which are derived from phosphate rock with its, deposits mostly located in North Africa and China. The major exporter of phosphate fertilizers is China, followed by USA, Russia and Morocco. Potash (potassium chloride) is also a mined fertilizer and its major exporters are Canada, Russia and Belarus – accounting for about 70% of the entire potash market.
Crop prices
Major crop commodities prices have declined in recent years in many key growing regions. The crops using the biggest volume of fertilizers are grains, followed by oilseeds then fruits and vegetables.
Asia consumes the largest volume of fertilizers, however low rice and wheat prices here have caused a fall in demand recently. Rice prices are expected to rise from forecasted lower global stocks and El Niño reducing production. Although wheat prices have also been falling; the outlook is opposite as prices are likely to fall further as El Nino can have a beneficial effect.
In the US, fertilizer is most commonly used on maize (corn) crops (about 44%). The price of maize has been falling due to high production over the past few years. Maize prices are expected to stay on a downward trend due to continuing good production, with production in 2015/16 forecast to be above average. In addition, global demand for US exports is expected to continue to fall due to the strong USD.
Sugar prices had fallen by 15% since the beginning of the year, before rising again in September. Previously good production estimates had kept the price low; recently however, wet weather delays to the harvest in Brazil’s key sugarcane belt and forecasts for more rainfall has caused concerns. Add in the BRL rallying against the USD and sugar prices have risen recently as a result.
Fertilizer prices
The prices of major fertilizers, as seen on the graph below, had started to recover last year from the downward trend seen in 2012/2013. The trends stayed relatively stable till the middle of this year, when the prices have started to drop again for all fertilizers apart from phosphate market.

* DAP – Diammonium phosphate
In the nitrogen fertilizers market, ammonia prices have fallen in the US and China, but stabilized at lower levels in Europe in recent months due to lower production cost. Prices of urea are also falling due to lower production cost and increased capacities. Export volumes of urea from Iran, Algeria and Saudi Arabia have also recently increased, as new production units came online. Moreover, exports from China in the first half of the year were up by 28% y-o-y, increasing supplies on the global market.
Phosphates prices haven’t fallen with other fertilizers, as some companies experienced production issues, which restricted price falls. Further price movements will largely depend on production output from major producing countries like Morocco and China. Weak monsoon rains in India has decreased buying activity and poses fears for even further demand deterioration.
Potash prices also fell due to low demand. In North America, demand in first half of 2015 fell by as much as 25-30% y-o-y, whilst global supply remains high. Moreover, the fall of Chinese, Indian and Brazilian currencies will likely reduce potash import demand from these major consumers. Chinese demand is also expected to fall due to recent VAT changes, as from 1st of September this year the tax has been re-introduced for domestic and import markets.
On the other hand, crop soils are low on potash due to low application and new varieties of crops, which remove more nutrients from the soil, which might be a factor limiting the drops in demand in the future.
Conclusions
With a mixed picture for the future price trends of major commodities, the development of demand for fertilizers and therefore their prices remains unclear. It will impact the margins of the producers of fertilizers, , as although they do have some other uses, there are not many.
And what about El Nino? The forecast are for it to be strong this year. Historically, it has had a positive effect on soyabeans and maize production in the US, while oilseeds crops in Indonesia and Malaysia were negatively affected. What will really happen cannot be predicted, as the effects on crops are not the same every time there is an El Nino. Some surprises might still be on the way.
The July 2013 announcement of Peter Espig’s accepting the role of CEO may have come as a surprise to some; however, to Mr. Espig it was a natural career progression. He grew up around mines and exploration projects, having spent 8 years working as a diamond driller in the 1980s. His career as an internationally renowned turnaround specialist and financier, including working at Goldman Sachs & Olympus Capital, places him in an ideal position to advance Nicola Mining Inc. [NIM.V] (the “Company” or “Nicola”).
Mr. Espig has structured greater than US$2.5 billion globally in private and public deals. According to Mr. Espig, “…regardless of the industry, turnarounds require hard work, professionalism and creativity. Mining is not the Wild West anymore, but managers have to constantly monitor cash burn, assets, debt and cash flow opportunities.” Prior to accepting the full-time role as CEO, Mr. Espig served as an Independent Director to the Company, a role that allowed him to better understand the value of its assets and to hit the ground running.
The following interview of Peter Espig, CEO Nicola Mining, was conducted by phone and email in the week ended October 30th. The views and opinions of Mr. Espig are entirely his own. The interviewer, Peter Epstein, CFA, MBA believes that the information provided by Mr. Espig is accurate, but cannot guarantee that it is.
Can you please explain the history of Nicola’s predecessor company Huldra Silver as far back as you care to go?
Huldra Silver Inc. (“Huldra”) was incorporated in 1980 and focused on the exploration and development of its wholly-owned group of mineral tenures located in British Columbia, Canada. The silver-lead-zinc Treasure Mountain property, situated 29 km northeast of Hope B.C., comprises 52 mineral tenures in an area covering 3,187 hectares (7,875 acres). After discovering a 250 meter long silver rich vein in 1985, which was tested in 1986, Huldra Silver Inc. went public in 1987. Between 1987 and 1989, Huldra explored 4 underground levels with 2,743 meters (9,000 feet) of crosscuts, drifts & raises and punched another 1,676 meters (5,500 feet) of underground drill holes. An additional 3,048 meters (10,000 feet) of surface drilling was completed as well.
A bulk sample of 407 Metric tonnes, “Mt” of high-grade material was shipped to Cominco’s & Asarco’s smelters for testing. The shipped material was compatible with the smelters’ requirements, and Huldra was paid $344,265. However, progress towards achieving continuous production was halted in 1989 due to difficult financial market conditions.
Despite low metals prices in the 1990s and until 2006, Huldra was able to perform modest exploration programs at Treasure Mountain. Notably, management updated property maps, particularly mine plans, and conducted rotary drilling to investigate parts of the property evidencing significant mineralization. In 2007, mine workings were re-entered on two levels and check sampling was done to prepare a National Instrument 43-101 (“NI 43-101”) compliant resource.
On the basis of updated, digitized versions, a NI 43-101 report of Treasure Mountain was completed in 2009. Total Indicated Resource above a 10.0 oz/ton (311g/Mt) cut-off was estimated at 33,000 Mt @ 24.2 opt (753g/Mt) silver, plus 4.16% lead & 3.80% zinc, an Inferred Resource estimated at 120,000 Mt @ 27 opt (840 g/Mt) silver, plus 2.79% lead & 4.36% zinc.
In preparation of a 10,000 Mt sample, Huldra’s Level 1 portal of underground workings was re-timbered. That same year, Huldra conducted an exploration program including stripping, trenching and diamond drilling to further explore a prospective area of silver lead-zinc mineralization. Several studies related to environmental and mine planning were also commenced. In 2011, the Company acquired additional surface rights adjoining historic mineral tenures for $350,000. Camp construction at Treasure Mountain, with facilities capable of supporting 50 workers, was completed at a cost of $1.2 million. Huldra also purchased mining equipment for $1.5 million to commence underground mining.
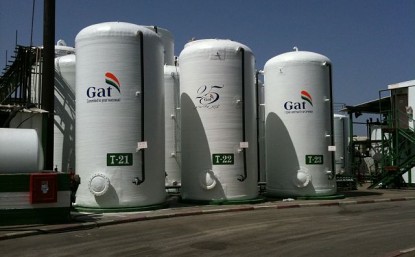
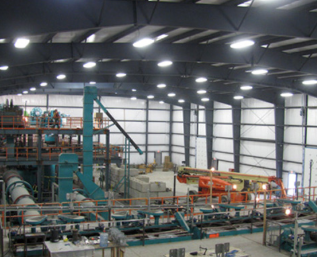
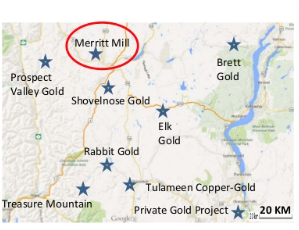
In 2011, Huldra acquired 100% ownership of Craigmont Holdings for consideration of $8 million. The Craigmont property is located near Merritt, B.C., 70 km north of Treasure Mountain. Huldra’s intent was to acquire a property that already maintained an existing mining and milling permit, as it would expedite the process of developing and mining Treasure Mountain. Given amicable weather, water, electrical infrastructure and proximity to Huldra’s former mining operations, Craigmont’s property was an ideal location to develop a mineral processing facility. The Company invested $21.6 million into a new mill plus $2.0 million into a lined tailings facility. Huldra built the Merritt Mill in 2011-2012, completing it November 2012.
Given a new management team and Board, a new company focus, what are KEY takeaways from the Company’s history?
Huldra Silver is an example of a company that had viable assets and a working business plan, yet was unable to service its debt. In short, it encountered the, “perfect storm” of excessive debt, falling commodity prices and diminished liquidity in both debt and equity markets. As a result, Nicola owns superior assets (see below) with near-term cash flow and longer-term exploration potential. We expect to deploy cash flow from our milling partnerships to fund other promising assets.
Importantly, the economic environment which continues to be illiquid and unsupportive of junior miners, creates highly attractive M&A opportunities. As a former M&A banker and distressed turnaround specialist, I understand how to acquire (companies / assets) and structure transactions. We continue to look at assets that can be acquired at discounts to total capital invested. However, ultimately it’s not just the discount that matters, but also synergies created by consolidating a valuable property with our new mill site.
Why did you change the name from Huldra Silver Inc. to Nicola Mining Inc.?
The name change is simple. Some may view it as extermination of the stigmatism attached to the previous company which entered into creditor protection and saw its market capitalization collapse, but this is not the reason. Actually, Huldra Silver Inc. was exactly what the name implies, a silver-focused junior mining company, but Nicola has become much more than that. We have the potential to become a consolidator of small high-grade gold and silver deposits, (and associated base metals), located throughout British Columbia. We changed the name to Nicola Mining because we are in the Nicola Region.
Legacy Huldra Silver Debt Structure:
| Debt Holder | Description | Amount |
| Waterton 1 | DIP Financing | $3,200,000 |
| Waterton 2 | Senior Debt | $7,300,000 |
| Convertible Debenture Holders | Unsecured | $11,000,000 |
| Trade Payables | Subordinated | $3,000,000 |
| Total | $24,500,00 |
Can you please describe the recently accomplished financial / debt restructuring?
Our team’s proactive restructuring of debt while in CCAA is one of the most compelling parts of the Nicola Mining story. At the time of my taking over as CEO, the Company had defaulted on $24.5 million in debt and payable obligations that required immediate restructuring. Post Tranche 3 Financing, the Company will have a senior secured 3% debt note of $1,287,500 and a Secured Convertible Debenture of approximately $8.5 million, which is due in 2 and 3 years.
Restructured Nicola Mining Debt Structure:
| Debt Holder | Pre-Offering | Post Debt Conversion |
| Waterton 1 (DIP Financing) | $3,200,000 | $1,287,500 (3 years) |
| Waterton 2 | $7,300,000 | $0 |
| Unsecured Convertible Debt | $11,500,000 | $0 |
| Payables & CRMC Settlement | $3,000,000 | $0 |
| Secured Convertible Debt | $8,500,000 (2 – 3 years) |
You have described Nicola Mining as a package of 4 distinct, non-correlated assets. Can you please outline those 4 assets?
Asset # 1: The Merritt Mill is fully operational, requiring no CAPEX to commence milling up to 300 Mt per day, “tpd.” We would require roughly $150k in CAPEX to install equipment allowing us to utilize a back up crushing system. If installed, Nicola would be able to concurrently process mill feed from two sources. Depending on material, our break-even milling is $50 to $70/Mt. Our mining partners pay mining & transportation costs and a tailings disposal fee. We pay milling costs. Nicola sells the concentrate, with resulting profits split 50 / 50.
A key component of our partnerships is that they are exclusive contracts. It`s truly a win / win. We unlock value of the miner’s properties by giving them an opportunity to monetize. Without Nicola, the miners would probably not be mining at all. We are their only outlet. We intend to share profits equally with our partners to ensure repeat business. It`s extremely difficult and costly to get a milling permit so we’re in a very advantageous position. Currently we have 3 partnership agreements in place; the first guarantees delivery 15 g/Mt gold, the second 1,306 g/Mt silver and the third, 7 g/Mt gold.
Our third Mining and Milling Profit Share Agreement is with a company called Siwash, see press release. Siwash’s mine is low-cost as its main vein system outcrops at surface. Our partner has about 3,500 Mt stockpiled and is required to deliver a total of 6,500 Mt ending in 2nd Qtr of 2016. Siwash is applying for a 10,000 Mt sample permit, (~ 167 tpd over 60 days). Assuming we process our partner’s 6,500 Mt over the course of 60 days, that would equate to roughly 100 tpd, or 1/3 of Merritt Mill’s current capacity.
Asset # 2: Treasure Mountain, a former operating mine, has $460,000 of remaining costs to mine Level 1 Stope 2 and another $308,000 to ship mill feed to Merritt Mill. Proceeds from our 3 milling partnerships are expected to repay a portion of Waterton’s debt, fund exploration and bolster working capital. Nicola Mining owns 100% of Treasure Mountain’s silver deposit consisting of 51 mineral tenures, 21 legacy claims, 100 cell units and five crown grants totaling 2,850 hectares (7,043 acres). The Company maintains the option of reopening Level 1 to extract silver from Stope 2. However, given depressed silver prices, our near-term focus remains on exploring 3 prospective targets.
Asset # 3: Thule Copper has, without question, tremendous blue-sky potential. I don’t use the term, “blue-sky” lightly, Thule Copper was once the largest open pit copper mine in the world. Thule’s mining leases and rights comprise 20 mineral claims covering 8,457 hectares (20,898 acres), of which 10 claims are contiguous. Thule Copper is known to host mineralization in the form of copper-iron skarn and copper porphyry. It’s located 20 km south of Teck Resources’ Highland Valley Copper operation, 10 km from Merritt, BC.
Asset #4: Industrial Soil. Our 4th asset was recently developed by Nicola Mining. It’s a portion of our property permitted to accept contaminated (industrial) soil. As mentioned, this asset and the utilization of the Merritt Mill, are the nearest-term cash flow opportunities. By 2h 2016, we expect to be cash flow positive. In the meantime, we don’t anticipate requiring equity capital, except for compelling, accretive acquisitions.
Did Huldra Silver own all 4 assets? How much capital was deployed?
That’s a good question. Huldra Silver owned the Mill, Treasure Mountain and Thule Copper. Prior management spent a very considerable amount advancing these assets. As can be seen, a total of $51 million has been sunk into our assets. This is noteworthy given that our current market cap is just $6 million. A portion of the $51 million deployed was completed many years ago. In today’s dollars, the cost of replicating these expenditures would be meaningfully greater.
Total historical investment:

Please explain near and intermediate term catalysts to watch for.
There are several important catalysts to watch for, milling operations, M&A, possible non-core asset sale and industrial soil handling. Milling of miner partnerships’ ore is expected to commence by the 2nd Qtr 2016. Given the distress in the mining industry, we expect very attractive and accretive M&A opportunities. We are reviewing a couple now. We have a contract in place to accept up to 300,000 Mt of industrial sand per year at $6.0/Mt of net revenue to Nicola. We have an offer for a non-core property listed for $2.5 million.
What’s the approximate valuation of the assets in an orderly (non fire sale) liquidation? Does this represent a reasonable fundamental downside scenario?
I don’t want to imply that the sale of our asset(s) has value because in a distressed environment characterized by limited liquidity, there’s no telling what any asset is worth. We do have a potentially valuable hard asset, the Merritt Mill, constructed at a cost of $21.6 million. Our Mill could allow a new owner to generate cash flow next year. However, in this market we would rather be buyers at steep discounts, not sellers.
The opportunity for us to consolidate in this epic downturn for TSX:V listed companies is exciting and compelling. We could also be an attractive takeover target for international players hoping to secure off-take. I should add that we’ve already been approached. The most important thing is to demonstrate that our assets can generate cash flow. That’s when our valuation could improve very significantly. It’s really hard to come up with a sum of the parts analysis pre cash flow. It’s prudent to assume that the value of a non-cash flowing assets in this environment is essentially zero. I believe we need to look at our assets as an NPV exercise.
Advancing these assets will require investment capital. How will Nicola fund all 4 assets, or will only 1 or 2 be worked on at once?
Funding requirements are minimal, although we will be required to spend approximately $100k (50.1% of our Thule Copper ownership) to maintain our permits on Thule Copper. We are really excited about Thule given the work done to date. Other CAPEX will be contingent upon cash flow, leading to cash accumulation. Unless there’s an exceptionally accretive opportunity, we will be highly conservative with our cash. It’s sometimes best to acquire assets at a huge CAPEX discount, rather than pay full price for developing new assets.
If the market fails to reward Nicola with a proper valuation (by your metrics) could the Company go private, declare a special dividend or spin out assets?
No, it’s not our goal at all to, “go private,” but rather focus on getting to a point that would entice senior secured debenture holders to convert into equity. More likely, listed miners with solid BC-based assets, but lacking cash flow, will find it difficult to pay listing, accounting and administrative fees. Shareholders of these companies will lose interest and management will look to consolidate with a stronger player like Nicola Mining.
Are there any misconceptions on Nicola Mining that you would like to address?
Thank you Peter [Epstein], I think we covered a lot of ground. In terms of misconceptions, one might be that we’re merely another junior natural resource company requiring ongoing, dilutive, capital raises to fund losses. This is clearly not the case given that we expect to generate revenues and cash flow next year. Our stock price and trading liquidity might be an indicator of that perception, but again, that’s no reflection on our assets and cash flow potential.
I believe our undervaluation could be due to a lack of understanding of the new Nicola Mining. We are just starting to tell our compelling story and to educate shareholders and prospective shareholders. Few may notice that we’re quite advanced on Treasure Mountain. As a past producing mine, the infrastructure is in place, the capital sunk and permits are pending. Finally, our market cap is just $6 million, yet the total amount of capital spent on our assets is $51 million. I believe there’s a disconnect between those figures. Hopefully, over time, our market cap will better reflect the large sum of capital invested and our ability to generate cash flow.
Disclosure: Nicola Mining has a small market cap. Small market cap stocks are highly speculative, not suitable for all investors. I, Peter Epstein, own shares of Nicola Mining. Mr. Epstein, CFA, MBA is not a licensed financial advisor. Readers should take that fact into careful consideration before buying or selling any stocks.
Readers are encouraged to consult with their own investment advisors before buying or selling any stock, especially speculative ones like Nicola Mining. At the time this article was posted, Nicola Mining was a sponsor of: http://EpsteinResearch.com. Please consider visiting: http://EpsteinResearch.com for free updates on Nicola Mining and others across a range of sectors. While at http://EpsteinResearch.com, please enter an email for instant delivery of my work. Thank you for supporting my articles & interviews.
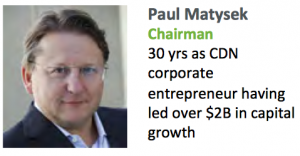
The following interview of Mr. Paul Matysek, Chairman & Director of Nano One Materials Corp. (TSX-V:NNO) was conducted by Peter Epstein, CFA, MBA in the week ended October 30, 2015. The interviewer, Peter Epstein, believes that the information put forth by Mr. Matysek is accurate, but cannot guarantee that it is. Readers are encouraged to visit Nano One’s corporate website for additional information.
Mr. Matysek is well known to most natural resource investors in Canada and around the globe. He’s the Founder and/or key Executive of 3 highly successful companies. Mr. Matysek is a corporate entrepreneur and professional geochemist & geologistwith over 30 years experience in the mining industry. He’s currently President & CEO of Goldrock Mines Corp. and has previously held senior Executive & Director positions with several natural resource exploration & development companies. Mr. Matysek is a proven company builder.
Mr. Matysek was recently President & CEO of Lithium One Inc., a company that had a world class lithium project in northern Argentina. In July 2012, Lithium One merged with Galaxy Resources of Australia, via a $112 million transaction, to create an integrated lithium company. Prior to that, he was President & CEO of Potash One Inc. where he was the architect of a $434 million friendly takeover of Potash One by K+S Ag. That deal closed in 2011. Prior to Founding Potash One, Mr. Matysek was Founder, President & CEO of Energy Metals Corporation, “EMC,” a premier uranium company that traded on the New York & Toronto Stock Exchanges. Mr. Matysek led EMC as one of the fastest growing Canadian companies in recent years, increasing its market capitalization from $10 million in 2004 to approximately $1.8 billion when it was acquired by a larger uranium producer in 2007.
Most entrepreneurs spend their entire careers without a meaningful success story. You have three. Is there any commonalty among the companies you support?
Yes. Timing, People and Execution. I believe that Nano One Materials (TSX-V:NNO) has these attributes, that’s why I’m Chairman and Director of the Company. I have been lucky in reading trends early (Uranium – Energy Metals Corp – Potash – Potash One and Lithium – Lithium One). I’m committed to attracting and working with the best professionals in the sector and relentlessly focused on executing a business plan.
Any unique, potentially game-changing business model is, by definition, difficult to comprehend. Can you please describe Nano One in layperson’s terms?
Nano One’s processing technology could enable a new generation of batteries by making it economically viable to produce a wider range of advanced energy storage materials. We start with low cost raw materials, such as lithium carbonate, and blend it with other metals using a scalable, patented process. This reduces manufacturing complexity and cost, while delivering materials that are more robustly structured for longer lasting performance. We aim to license and partner with key players in the industry to commercialize our technology, and are already having meetings with a number of parties.
Is Nano One Materials largely a lithium story? If so, can you please comment on the lithium sector?
There is pent-up demand and a rapidly growing market for lithium powered batteries. Nano One’s technology makes lithium carbonate (a cheaper form of lithium) viable for up and coming battery materials and sets us apart from other players.
Technology is changing at an increasingly rapid pace. Nano One appears to embrace change, is it technology agnostic?
Our technology can be used to make a wide range of advanced materials, so it’s not hard for us to shift with industry trends. So yes, we are in fact technology agnostic when it comes to advanced energy storage materials. We expect that our technology will scale and we have a growing list of strong patents. We are working hard to prove to industry players our technology’s performance in real life batteries.
Management describes in detail the importance of its Intellectual Property, “IP.” Can you characterize the strength of Nano One’s IP?
Nano One’s patents cover a broad range of materials and were issued quickly with only minor revisions. This indicates to us that we have a unique technological edge with fertile ground to expand our IP portfolio. Broad patents like ours can provide freedom to operate and should draw the attention of global players looking for strategic IP advantages.
Will the Nano One be following precise recipes from customers, or will it add value (with IP) by improving upon a customer’s specifications.
We will work with industrial partners in leveraging our technology and know-how to (i) to improve on battery material recipes and (ii) enable a new generation of materials.
How much due diligence did you do to become comfortable enough to agree to be Chairman of the Board of a small company?
The process took almost a year from initial contact with the Founders of Perfect Lithium to the close of the transaction, to taking them public through an RTO of my company Dundarave Resources. I conducted a considerable amount of due diligence to understand the space, the opportunity and the people involved. Lastly, I made sure that I could help formulate and execute their business strategy.
Some companies retain industry rock stars like yourself to serve on their Boards. Sometimes that person is merely a figurehead. What role are you playing?
I’m an active and involved Chairman of Nano One Materials, providing mentorship, contacts and advice to management. My skill set compliments the strong team that we have in place.
From your perspective, can you name near-term catalysts that investors should watch for?
With each new patent, the Company is de-risking its technology and making itself more attractive to industry players looking for strategic IP advantages. Nano One is speaking with a wide range of potential industry collaborators and has growing support of the Canadian government. Formalization of these discussions would boost our credibility and could provide near-term catalysts. We are working on a number of corporate initiatives, several of which could also be investment catalysts over time.
The TSX Venture Exchange is in a downturn of epic proportions. To what extent is Nano One tied to the variances of the TSX:V?
Certainly the difficult market environment on the TSX Venture exchange has effected the number of qualified investors in Canada, but the Company has ambitious plans underway to gain exposure in Europe and the U.S. This should allow Nano One to separate from the pack of junior mining companies that dominate trading on the TSX Venture Exchange.
Can you please comment on key investors in the Company?
Management has a significant shareholding base and other key investors were brought in during the recent $0.25 IPO placement. One significant fund that has a sizable position is Pathfinder Capital, a fund that has been significantly outperforming the market in the small cap space.
Are there any misconceptions regarding Nano One Materials that you would like to address?
It’s key to understand that we have a growing portfolio of IP that’s attractive and we’re confident that our technology is industrially scalable. Freedom to operate has immediate and long-range value for strategic players looking to manufacture materials, cells and/or batteries. This forms the basis of the collaboration discussions underway.
Paul, thank you very much for your valuable time and insightful answers.
Disclosures:
Nano One Materials has a small market cap. Small market cap stocks are highly speculative, not suitable for all investors. I, Peter Epstein, own shares of Nano One Materials. Mr. Epstein, CFA, MBA is not a licensed financial advisor. Readers should take that fact into careful consideration before buying or selling any stock mentioned.
Readers are encouraged to consult with their own investment advisors before buying or selling any stock, especially speculative ones. At the time that this interview was posted, Nano One was a sponsor of: http://EpsteinResearch.com. Please consider visiting: http://EpsteinResearch.com for free updates and additional disclosures on Nano One and others across a range of sectors. While at http://EpsteinResearch.com, please enter an email for instant delivery of my work. Thank you for supporting my articles & interviews.

The precious metals sector sharply reversed course after the Federal Reserve hinted that it may raise rates at its next meeting. This about face from the Fed was enough to effectively end the fledgling rally that began in the summer and threatened to take metals and miners higher to their 400-day moving averages. The prevailing thought was the Fed was on hold for a while and this paved the way for more strength in the precious metals complex. Thoughts be damned! The Fed has whipsawed gold bugs (and me) again.
Below we show the weekly candle charts for Gold and Silver and their 40-week (200-day) moving averages. Gold tested moving average resistance in each of the past three weeks. The Fed decision induced a nasty reversal on the chart as Gold went from trading above resistance to well below it. Gold also lost the key weekly pivot point around $1150-$1160. Silver formed the same bearish reversal after testing moving average resistance during each of the past four weeks. (Another important point is Gold failed at $1180 on the monthly chart).

The implications of the dramatic reversal could be that the metals have new lows ahead and that Gold could have a date with $1000/oz in the near future.
In order to give the current bear market in Gold proper context we looked at the absolute longest bear markets from the past. It turns out that three bears have lasted a full five years before a sustained rebound. We already know of the 1987 to 1993 bear. In regards to the 1996 to 2001 bull, Gold made its price low in 1999 yet didn’t bottom in terms of time until 2001. Something similar took place during the 1980 to 1985 bear market. History suggests the current bear market could last another nine or ten months.

If the Fed said something different then bullish conditions may have persisted but in any case we always have to respect the market. The precious metals sector formed a clear bearish reversal at important resistance. It augurs badly for gold bulls and gold bugs. While we strongly believe Gold remains in a secular bull market, we believe it’s possible that the current bear market could last well into 2016. The specter of $950 to $1000 Gold looms larger now and readers are advised to cut losses and prepare portfolios for the bearish scenario. As we navigate the end of this bear market, consider learning more about our premium service including our favorite junior miners which we expect to outperform into 2016.
If you would like to receive our free newsletter via email, simply enter your email address below & click subscribe.
 Follow us on Twitter
 Become our facebook fan
CONNECT WITH US
Tweets
Tweet with hash tag #miningfeeds or @miningfeeds and your tweets will be displayed across this site.
MOST ACTIVE MINING STOCKS
Daily Gainers
 CMC Metals Ltd. CMC Metals Ltd. |
CMB.V | +900.00% |
 Eden Energy Ltd Eden Energy Ltd |
EDE.AX | +200.00% |
| GoviEx Uranium Inc. |
GXU.V | +42.86% |
| Eagle Nickel Ltd. |
ENL.AX | +41.67% |
| Citigold Corp. Limited |
CTO.AX | +33.33% |
| Mount Burgess Mining NL |
MTB.AX | +33.33% |
| Exalt Resources Limited |
ERD.AX | +31.94% |
| Casa Minerals Inc. |
CASA.V | +30.00% |
| Cariboo Rose Resources Ltd |
CRB.V | +28.57% |
| Belmont Resources Inc. |
BEA.V | +28.57% |


