
With each passing rally hope has bloomed that the bear market in precious metals may be over. The long and deep “forever bear” has to end but it hasn’t yet. Under the surface, the bear market is getting weaker and Gold is growing stronger. It’s showing strength against foreign currencies and has broken its downtrend relative to equities. These are very positive developments and a precursor to the birth of a new bull market. However, the weak rebounds in the metals coupled with the potential for a US Dollar breakout advise us to continue to remain patient and cautious.
In looking at the price action in both Gold and Silver I see no character change in either market. They are rallying in similar fashion to rallies of 2014 and 2015. Since Gold first formed a weekly low in November 2015, it has rebounded a mere 6% in a little over two months. It hasn’t even tested the 200-day moving average at $1133/oz or the major resistance at $1140-$1150/oz. Meanwhile, Silver has been even weaker as it hasn’t been able to sustain any strength or rebound in the past few months.

The current fledgling rebound in Gold compares quite poorly to the rebounds that followed major lows in 1976 and 2008. Gold is up only 6% since its weekly low from nine weeks ago. Nine weeks following the lows from 1976 and 2008 Gold rebounded an average of 19.5%. That would put Gold at $1262/oz. If Gold bottomed late last year then at the very least it likely would have already rebounded to major resistance at $1180-$1200/oz.
Furthermore, if the US Dollar index was not consolidating in a bullish manner then Gold and Silver would be acting much stronger. In other words, Gold and Silver would be showing quite a bit more strength if the US Dollar index was likely to resolve its consolidation to the downside. Gold usually leads the US Dollar at key turning points.
The greenback has digested its massive gains in bullish fashion. It has held above the 38% retracement, the 200 and 400-day moving averages. It is trading nearly at the exact same level as a year ago yet the current net speculative position is at roughly half of its level of a year ago (51.7K contracts now versus 101K contracts in March 2015). In other words, plenty of speculation has come out of the market yet it remains less than 2% from new highs.
The strength in the gold stocks could give bulls some hope but refer back to our statement last week. The gold stocks, while initially following the stock market could resume their decline once metals have resumed their downtrends. The gains this week exceeded our expectations but our statement stands. If the metals reverse course then the gold miners are likely to follow that move and not the stock market itself (which has rebounded as anticipated).
While good things are happening under the surface for Gold, its lack of a strong rebound in recent months argues that such a rebound is in the future but not imminent. Gold’s steady downtrend could resume in the next week or two. As a result, precious metals bulls should be ready to hedge and then wait for an extreme oversold condition amid extreme bearish sentiment before turning bullish.

1.The gold price rally is accelerating. Please click here now. Double-click to enlarge. That’s the four hour bars gold chart, and the price action is solid. Gold has broken out to the upside, from a second inverse head and shoulders bottom pattern.
2. After a sharp pullback to the $1100 – $1108 area, gold should move nicely higher, towards my $1145 target zone.
3. Please click here now. Double-click to enlarge. That’s the four hour bars chart for silver, and it’s staging a solid upside breakout from a symmetrical triangle pattern this morning! The target is the $15 area, which is the break-even point for a number of silver mining companies.
4. From a fundamental perspective, gold now has a vast array of supportive price drivers. In the immediate term, Chinese New Year buying is a factor.
5. Also, India’s finance minister may be poised to unveil a massive gold import duty cut in the upcoming annual budget. That’s because supply-related collapse in oil prices has dramatically cut the nation’s current account deficit, as a percentage of GDP. The gold import duty is no longer a viable scapegoat for that shrinking deficit.
6. The El Nino weather system may end as early as May, and La Nina is poised to replace it. La Nina is bad news for US grain and South American crops, and good news for Indian crops, which is good news for Indian farmers, who are the world’s largest buyers of gold.
7. Gold peaked near $1923 in 2011, just a few months after the horrific Japanese earthquake occurred. The dollar then began soaring against the yen, but now it has stalled, and yesterday Japan announced the first monthly trade surplus since the earthquake.
8. On that note, please click here now. Double-click to enlarge this important dollar versus yen daily bars chart.
9. Most amateur technicians follow the USDX (dollar index) chart for cues about gold, but the dollar versus yen chart is vastly more important. Large FOREX traders view the yen, not the dollar, as the world’s safe haven fiat currency.
10. When money flows out of the yen, it flows out of gold. When money flows into the yen, it moves into gold. The yen and gold are both poised to begin what will likely be the largest rally of the past five years.
11. Janet Yellen and her fellow Fed workers are scheduled to begin their next meeting today, with an announcement expected tomorrow. Please click here now. Goldman Sachs economists feel the US stock market will have another “wet noodle” year, and that’s my view.
12. Ben Bernanke was Wall Street’s best friend. He unveiled a bizarre QE program that ravaged Main Street. That program encouraged Wall Street to borrow money and use it for stock buybacks and dividends. In a nutshell, Ben Bernanke helped engineer what I call “marked to model price/earnings ratios” for US companies.
13. Over the past seven years, Wall Street arguably spent more money on stock buybacks and dividends than it did on company operations, and the piper must be paid.
14. Janet Yellen should not be confused with Ben Bernanke. She is Main Street’s friend. She proved it by tapering Ben’s horrific QE program off the board, exactly as I predicted she would. Now, she is poised to raise interest rates repeatedly, much to Wall Street’s chagrin.
15. US citizens (Main Street) will then put money into bank accounts, and banks will lend that money in the fractional reserve system, reversing US money velocity.
16. The US stock market will probably experience many more violent sell-offs as Janet hikes again, again, and again. That will fuel more FOREX trader safe haven buying of the yen, and of gold.
17. Janet could hike rates this week, but I think she’ll give Wall Street a break. She’ll likely wait until the spring, before hammering global stock markets with her next hike.
18. Please click here now. Double-click to enlarge this daily bars oil chart. Horrifically, some oil producers are getting less than $20 a barrel for their oil right now. That’s because their oil is not the high quality “West Texas Intermediate” oil that the NYMEX uses for their benchmark pricing.
19. Please click here now. Ominously, the storage tanks in Cushing, Oklahoma are in danger of reaching full capacity, and may have already briefly done so last week.
20. US frackers are still pumping oil fiendishly, trying to pay substantial debt from unprofitable revenues. OPEC can produce profitably at much lower prices than the frackers, but OPEC governments need high revenues to prevent social unrest.
21. While oil could now rally to my $37 – $41 short term target zone, storage tanks are likely to hit full capacity by then, triggering a terrible meltdown to the $10 – $20 zone.
22. Civil unrest could occur in OPEC nations as the oil price tumbles, and Iran-Saudi tensions could grow, creating a gold buying frenzy by institutional investors. It’s hard to know how the US stock market would respond to such a horrific event, but I would suggest that the Western gold community may want to seek shelter from that storm, before it happens.
23. On that note, please click here now. Double-click to enlarge. Barrick has just staged a solid upside breakout, and where Barrick goes, most gold stocks tend to go.
24. Please click here now. Double-click to enlarge this key GDX daily bars chart. The massive bull wedge pattern in play suggests than an “institutional awakening” is at hand for the gold stocks sector, as the oil supply glut and Janet’s rate hikes send global stock markets into a financial gulag. I’ll dare to suggest that equity-oriented money managers are soon going to view gold stocks as asset class champagne!
Stewart Thomson of Graceland Updates, Guest Contributor to MiningFeeds.com

Gold stocks remain the pariah of the investment world. Despite gold’s strong early-year gains, the stocks of its miners have slumped to new secular lows. This whole forsaken sector continues to languish at fundamentally-absurd price levels, an extreme anomaly that is long overdue to start unwinding. The gold miners will be bid massively higher to reflect their impressive profitability even at today’s dismal gold prices.
Just this week, the flagship HUI gold-stock index plunged to a major new secular low. On Tuesday as gold merely slid 0.3%, the HUI plunged 5.6% to 100.7. This was an astounding new 13.5-year secular low, reeking of capitulation since gold’s price action certainly didn’t justify such a disastrous reaction in its miners’ stocks. That left already epically-bearish gold-stock sentiment even worse, which is hard to believe.
The gold stocks are ultimately leveraged plays on gold, because prevailing gold prices determine their profitability. And all stock prices eventually migrate to some reasonable multiple of their underlying corporate earnings, gold stocks are no exception. Gold’s overwhelmingly-dominant role in gold-mining profits has led this sector to amplify gold’s price moves, typically by 2x to 3x in major gold-stock indexes like the HUI.
So Tuesday’s extreme 21.9x downside leverage was wildly outsized. Gold stocks actually got off to a strong start in early 2016, surging 9.9% in this year’s first 4 trading days compared to gold’s 4.7% gain. But as soon as gold pulled back, the gold stocks got sucked into the bearish maelstrom of the plunging general stock markets. So by Tuesday, the HUI was down 9.4% year-to-date compared to gold’s 2.5% rally.
But this horrendous performance leading to calls for deep new lows is masking an ongoing bottoming. Back in mid-July, gold was blasted by an extreme gold-futures shorting attack explicitly executed to manipulate gold prices lower by running long-side stop losses. In the aftermath of that, the HUI dropped to 104.9 in early August. That would prove major new support near 105 that held strong until this week.
Despite the vast bearishness arrayed against them, gold stocks held their ground for 5.5 long months. Despite gold slumping to 7 new secular lows in November and December, the HUI didn’t fall materially under 105. Despite the Fed’s first rate hike in 9.5 years in mid-December that was universally expected to obliterate gold, that support held. And that continued into 2016 despite plunging global stock markets.
Even as of Tuesday’s new low, the HUI had only lost 4.0% since its initial early-August bottom. Gold’s price edged 0.2% higher over that span, while the benchmark S&P 500 stock index plunged 10.4%. With so many excuses to continue dumping gold stocks in the past half-year, their relative strength is a telltale sign of selling exhaustion. Pretty much everyone who wants out has already long since sold and exited.
So this week’s abrupt plunge to crazy new secular lows despite flat gold prices felt like a capitulation, which has been long overdue. The gold miners’ stocks are radically undervalued fundamentally, they have been pounded for years technically, and the extreme bearishness long plaguing them couldn’t possibly get any worse sentimentally. Everything is in place for gold stocks to carve a major secular bottom.
While ironclad technical and sentimental arguments can be made for gold stocks reversing and mean reverting sharply higher, the fundamental case trumps everything else. Despite this sector’s endless slide and universal antipathy, the gold miners’ underlying profit fundamentals are what’s going to turn around this left-for-dead sector. Gold stocks are truly trading at fundamentally-absurd price levels today!
Since the vast majority of mining costs are effectively fixed during mine-planning stages, the dominant variable driver of gold-mining earnings is the price of gold. And the relationship between these profits and gold is leveraged, not linear. This reality is easy to grasp. Imagine a gold miner producing gold for $850 per ounce. In a $1050 gold environment, December’s secular low, this miner earns a $200-per-ounce profit.
The miners’ costs don’t change as gold rallies, so all those gains amplify the bottom line. Since those Fed-rate-hike lows, gold has climbed back over $1100 in 2016. At $1100 even, that’s a 4.8% gold-price rally. Yet it still costs our miner $850 per ounce to produce, while selling that gold at $1100 now yields a $250-per-ounce profit. That’s a 25% increase on less than a 5% increase in gold prices, excellent leverage!
Since profits ultimately determine stock prices, essentially all that matters for the gold miners is the price of gold. Thus they have always moved in lockstep with gold, amplifying its price moves. But as this first chart of gold and the HUI reveals, a radically-unprecedented disconnect emerged in early 2013. And it has only worsened in recent years. The gold miners’ stock prices are no longer reflecting prevailing gold levels.

This week’s bizarre capitulation selling pummeled the HUI to an extraordinary 13.5-year secular low. It was the lowest HUI close since all the way back in July 2002. Back then gold was trading near $305, and had yet to exceed $329 in its young secular bull. This Tuesday, gold closed near $1087 or 3.6x higher. Yet gold stocks were trading at levels last seen around $305. Does that make any sense at all?
Absolutely not! Such an extreme pricing anomaly in any other sector would lead to a stampede of new buying. Imagine if Apple’s stock was trading as if it could only sell its iPhones for 3/11ths of their actual selling price. Investors would rush in to buy this epic bargain, rapidly bidding up Apple’s stock price until it reflected actual underlying cash flows. Only in ignored gold stocks can such a radical disconnect exist.
The ludicrous magnitude of this deviation is confirmed looking the other way, through the lens of gold. Just after the Fed finally ended its 7-year-old zero-interest-rate policy in mid-December, gold fell to a deep 6.1-year secular low. Where was the HUI the last time gold prices closed near $1050? Trading way up over 390, 3.7x higher. Gold-stock prices are so low that they need to quadruple merely to reflect gold today!
This hard fundamental truth about the mind-boggling gold-stock undervaluation really irks people with a vested interest in seeing gold stocks spiral lower into oblivion. Gold-stock investors and speculators who succumbed to their own fear to sell into recent years’ major secular lows need to believe that was a rational decision. So market commentators tickle their ears with endlessly-bearish gold-stocks-to-zero talk.
Thus whenever I write about the fundamentally-absurd gold-stock prices and their unparalleled vast opportunities for hardened contrarian investors, I get attacked by the already-sold-low crowd. They have a desperate psychological need to perceive themselves as smart for selling low, they want to rationalize away their foolishness. So they argue that gold mining simply isn’t profitable at today’s out-of-favor gold prices.
The implication is obvious, that gold stocks deserve to be priced as if gold was trading near $300 instead of $1100. If they can’t earn any money, then their super-low price levels are probably fundamentally-righteous. As a lifelong student of the markets and contrarian speculator, I love investigating counter arguments. So every quarter after the gold miners have reported their earnings, I carefully analyze their results.
Gold miners generally report quarters a month or two after quarter-end, so the latest read available is from 2015’s third quarter. Back in mid-November I analyzed the results of all the elite gold miners in the leading GDX Gold Miners ETF. Consisting of the world’s biggest and best gold miners, this excellent gold-stock benchmark perfectly mirrors the HUI. GDX’s 35 component stocks reflect industry-wide fundamentals.
I painstakingly scoured all the latest quarterly filings from all the GDX component stocks. Before I got into the financial-newsletter business 16 years ago, I was a Big Six CPA auditing mining companies. So I’m quite fluent in financial reporting and quarterly filings. The combination of all these Q3 results from all the elite gold miners included in GDX shows exactly where this industry’s profitability is running today.
I wrote a whole essay on that research if you want to dig deeper. It turned out that the average cash cost of the GDX gold miners was just $618 per ounce in Q3. That’s their actual cost of production at the mine level. At today’s $1100 gold prices, that implies cash operating profits of $482 per ounce! Such massive 44% margins would be celebrated in any other industry, but they are totally ignored in the gold miners.
But cash costs are admittedly misleading, as mining costs extend far beyond these mine-level expenses. So back in mid-2013, the World Gold Council introduced broader all-in sustaining costs. These include all expenses necessary to sustain current production levels, adding in corporate-level administration, exploration, mine-development, mine-construction, and mine-reclamation expenses among others.
The elite gold miners of GDX, who represent the vast majority of world gold production, reported average all-in sustaining costs of just $866 per ounce in Q3! This hard data reported to government regulators by the biggest and best gold miners drives a jagged stake through the heart of the popular myth today that gold mining isn’t profitable. At $1100 gold, this industry can still earn a very impressive $234 per ounce!
With all costs necessary to maintain and replenish current production levels not far above $850, there is zero justification for gold stocks to be trading as if gold was 3/11ths of its current levels. Now if this AISC metric was running at $1350, $250 over current gold prices instead of $250 under, you could certainly argue that almost any miserable gold-stock prices were fundamentally justified. But that’s not the case today.
The only reason gold stocks are trading at such fundamentally-absurd prices relative to their profitability and the price of the metal that drives it is extreme fear. Investors and speculators are understandably terrified of gold stocks after their horrific plunge since early 2013. That’s when the Fed spun up its QE3 debt-monetization campaign to full speed, levitating the stock markets and sucking capital out of gold.
While underlying profit fundamentals always determine ultimate stock-price levels, extreme greed or fear sometime drag prices far away. But these emotional extremes never persist. Fear in the markets is finite, as eventually everyone susceptible to being scared into selling low has already done so. That leaves only buyers, resulting in a secular reversal followed by a major mean reversion sharply higher as fear dissipates.
And gold stocks themselves are a great example of this. Back in late 2008 this sector was crushed in the first stock panic in a century, a once-in-a-lifetime perfect storm of fear. By late October 2008 that panic had blasted gold stocks to fundamentally-absurd price levels relative to gold, which I pointed out at the time was supremely bullish. And indeed over the subsequent several years, the HUI would more than quadruple!
Incredibly, the gold-stock lows today are far more extreme than those seen in that stock panic. This is true in both absolute terms and relative to gold. The more extreme any price anomaly in the markets, the higher the odds for an imminent reversal and the larger the inevitable subsequent mean reversion will be. Gold stocks’ radical price disconnect has positioned them to be 2016’s best-performing sector by far.
This last chart distills down the immutable fundamental relationship between gold-stock prices and the metal which drives their profits into a simple ratio. Dividing the daily HUI close by the daily gold close yields the HUI/Gold Ratio. When tracked over time, it shows when gold stocks are both overvalued or undervalued relative to gold. And due to the extreme fear, they’ve never been more undervalued than today!

When the HGR rises, the gold stocks are outperforming gold. That’s what happens normally during gold uplegs since gold-mining profits leverage the price of gold. Conversely a falling HGR signals that gold is outperforming gold stocks. This usually happens when gold is falling slower than gold stocks. Note that this ratio has been falling on balance for over 8 years now, an extraordinary secular span of time.
The last time the financial markets were normal was before 2008’s stock panic, before the desperate Fed implemented QE and ZIRP and wildly distorted everything. Over the 5-year span ending in mid-2008 just before that epic panic, the HGR meandered in a tight trading range between 0.46x support and 0.56x resistance. On average the HUI traded at 0.511x the price of gold, with only minor and short-lived deviations.
That strong relationship was shattered by 2008’s stock panic, the first since 1907. A panic is technically a 20%+ plunge in the broad stock indexes within a couple weeks. Leading into early October 2008, the benchmark S&P 500 plummeted 25.9% in just 10 trading days! The leading VIX fear gauge skyrocketed to 79.4, and gold-stock traders panicked like everyone else. That battered the HGR to a 7.5-year low of 0.207x.
But once again those horrendous gold-stock price levels weren’t fundamentally justified. They were just the result of epic fear that soon had to dissipate, just like today. So the HUI soon reversed and started to mean revert dramatically higher. The gold stocks climbed 319% over the subsequent 2.9 years, which earned fortunes for brave contrarians mentally tough enough to buy low when everyone else was too scared.
If there was a normal period after 2008’s stock panic, it was 2009 to 2012. Everything went crazy again in 2013 as the Fed ramped up its unprecedented open-ended QE3 bond-monetization campaign, which levitated the stock markets. The aggressive Fed jawboning about expanding QE3 if necessary any time the stock markets sold off created an effective Fed Put, so traders sold everything else including gold to buy stocks.
Stock investors dumped the flagship GLD gold-ETF shares at an epic record rate in early 2013, which cratered gold and obliterated gold stocks. That sparked such extreme fear that it hasn’t dissipated to this day, leaving this hated sector unable to stage any meaningful uplegs in the QE3 era. But back before that in 2009 to 2012, the HGR stabilized at a new post-panic average level of 0.346x. That’s the new normal.
The relentless ongoing gold-stock selling culminated this week in that capitulation day, forcing the HGR down to 0.093x. The HUI was trading at less than 1/10th prevailing gold-price levels! That tied the all-time HGR low from late September 2015. The gold stocks had never traded lower relative to gold, the metal that drives their profits and thus determines this sector’s fundamentally-righteous stock-price levels!
With the exception of gold stocks’ sharp mean-reversion rally in 2009, they’ve been falling relative to gold for over 8 straight years now. No market moves in one direction forever, they are all forever cyclical. And gold stocks are certainly no exception. As the Fed’s radical market distortions created by QE and ZIRP continue to unwind, both gold stocks and gold itself will mean revert far higher to reflect their fundamentals.
And that imminent mean reversion out of unsustainable fear-driven extremes portends enormous gains for gold stocks in the next couple years. Merely to return to that post-panic-average HGR of 0.346x at today’s gold prices would require the HUI to rocket about 275% higher from this week’s capitulation low to 375! That’s where gold stocks should be trading near $1100 gold, as proved in 2009 when $1100 was last seen.
Gold stocks are so despised, so incredibly undervalued, that they need to nearly quadruple from here merely to reflect today’s low gold prices! Is there any other sector in all the stock markets with such huge potential fundamentally-driven gains? Not a chance, especially with a major new stock bear awakening. Gold and therefore gold stocks move counter to stocks and rally during stock bears, a rare and valuable attribute.
But that easy-quadrupling potential from these extreme secular gold-stock lows greatly understates their potential. Why? Because gold itself is also overdue to mean revert dramatically higher in 2016 as the Fed’s gross market distortions unwind. Late last year when everyone hated gold, I laid out the strong case for a massive 2016 upleg. And gold has already started powering higher on an investment-demand renaissance.
I don’t know how high gold will surge this year, but 20% is very conservative. A 20% gold rally would leave this metal near $1275, in line with year-end targets from some major Wall Street banks. At $1275 gold and the post-panic-average 0.346x HGR, the HUI’s price target would climb over 440. That’s a 340% gain from this week’s capitulation low! And gold stocks’ potential in coming years is even greater than that.
2012 was the last normal year before the Fed unleashed QE3 and destroyed the normal functioning of the markets. Gold averaged nearly $1675 that year. So gold’s potential mean reversion out of its Fed-conjured extreme lows is to far-higher price levels than a mere 20% upleg. On top of that following any extreme, mean reversions tend to overshoot proportionally in the opposite direction. Think about that for a second.
Not only does gold have a high probability of overshooting beyond its pre-QE3 average levels, but the gold stocks have great odds of blasting to an HGR way above its post-panic normal-year average! So the upside potential in gold stocks in the coming years is vast, utterly unparalleled in all the markets. This is why I remain a hardcore contrarian so super-bullish on gold stocks, nothing else can compete.
And though everyone has long forgotten, there is recent precedent for extreme outperformance by the gold stocks. Between November 2000 and September 2011, the HUI powered 1664% higher in a life-changing secular bull! While contrarian gold-stock investors multiplied their wealth by nearly 18x, the S&P 500 lost 14%. Betting against the herd at secular extremes almost always pays off in a huge way.
All prudent investors and speculators need to have substantial gold-stock exposure in their portfolios. With the gold stocks near fundamentally-absurd 13.5-year secular lows already, the downside risk is trivial. Yet the upside potential is vast. Gold stocks can be bought via that GDX ETF of course, but the greatest gains by far will come in the best of the individual gold miners with the most-superior fundamentals.
At Zeal we’ve long specialized in this obscure contrarian realm. We’ve spent 16 years researching and trading the precious-metals miners and explorers, earning fortunes by buying low when few others would so we could later sell high when few others could. And with gold stocks’ fundamental disconnect so darned great today, there’s never been a greater buying opportunity. So we’ve been aggressively deploying.
All these new gold-stock and silver-stock trades are detailed in our acclaimed weekly and monthly subscription newsletters. They draw on our decades of exceptional experience to explain what’s going on in the markets, why, and how to trade them with specific stocks. With a new general-stock bear upon us, it’s exceedingly important to cultivate a studied contrarian perspective. Don’t procrastinate, subscribe today!
The bottom line is gold stocks remain at fundamentally-absurd price levels relative to gold which drives their profits. Heavy capitulation selling just forced them to 13.5-year secular lows, prices last seen when gold traded just over $300. Such a radical fundamental disconnect driven by irrational fear can’t persist, especially with gold already starting to mean revert higher. Gold-mining profits will leverage its coming gains.
Gold-stock prices can’t defy their underlying profitability forever, so their long-overdue mean reversion far higher will soon be underway. This gold-stock rally will feed on itself, attracting widespread interest during an accelerating general-stock bear where upside momentum is hard to find. The early contrarians willing to buy in near these lows stand to multiply their wealth and earn fortunes. Will you be among them?
1. As the third trading week of 2016 gets underway, gold continues to trade with great stability, regardless of whether global economic news appears to be good or bad.
2. Please click here now. Double-click to enlarge this hourly bars gold chart.
3. When gold was languishing in the $1060 area, I suggested it would rise to about $1110, and then pull back to the neckline of a double-headed inverse head and shoulders bottom. That’s exactly what happened.
4.From a purely technical gold chart perspective, gold “should” now rally back to the $1110 area, but please click here now. Double-click to enlarge. That’s the US dollar versus yen daily bars chart.
5.Gold has a very strong tendency to trade against the dollar like the yen trades against it. In the big picture, the good news is that the dollar is showcasing a huge head and shoulders top pattern against the yen, and a major uptrend line has been decisively penetrated to the downside.
6. In the short term, unfortunately, the dollar is likely to rally back to the broken trend line, and that could put some temporary pressure on the price of gold. Gold is likely to ease to $1033 – $1045, if the dollar rallies against the yen.
7. From there, the largest gold rally seen in many years is likely to occur, as the dollar gets crushed by safe-haven buying of the yen.
8. Western gold community investors should be aggressive gold buyers, regardless of any pain they feel, if this gold price pull back occurs.
9. Please click here now. Double-click to enlarge this Dow daily bars chart. China just announced Q4 growth of about 6.8%, and global stock markets are rallying on the news.
10. In America, GDP growth for Q4 of 2015 may come in well under 1%, with the Atlanta Fed already estimating it will be about 0.6%, a truly horrific number.
11. Regardless, the US stock market does often follow the Chinese stock market, and a short term US stock market rally can couple with a modest dollar-yen rally, to put some additional short term pressure on gold.
12. Please click here now. Double-click to enlarge. This FXI-NYSE daily chart of the Chinese stock market is flashing what I would call a buy-side volume alert.
13. All US stock market crashes were significant buying opportunities, when America was the world’s leading economic empire. Now, all Chinese stock market meltdowns are equally important buying opportunities, as China steadily moves to take the global economic “leadership baton”.
14. As the world’s “ultimate asset”, I expect gold to generally perform well, regardless of whether China’s economy surges, crashes, or drifts sideways.
15. Please click here now. Double-click to enlarge this daily bars oil chart. The end of oil-related sanctions against Iran has opened the door to a “buy the news” oil market rally.
16. Unfortunately for global stock markets and the dollar versus the yen, Iranian supply is likely to add to the global oil supply glut, taking oil and global stock markets into a fresh decline. That will create another surge of yen safe haven buying, and fuel a significant rally in the price of gold.
17. The year of 2016 is likely to be better for bullion than for gold stocks, largely because of the yen acting as a safe haven against the dollar, but gold stocks should be accumulated now, in preparation for the rise of American stagflation in 2017.
18. As oil recovers later this year, I expect Janet Yellen to keep pressure on global stock markets with more rate hikes. A lot of analysts think she is focused on the US stock market, but I would argue that was more the focus of Ben Bernanke.
19. I’ve argued that Janet Yellen is a much bigger friend of Main Street than Wall Street, and her bold taper of QE to zero, which I predicted, bears that out. She also appears to have serious concerns, and rightfully so, about the “debtaholic” mentality of the US government.
20. I’ve stated that “Rate Hikes Rock”, because they empower Main Street and put pressure on the US government to change its ways, or face gold revaluation.
21. Also, savers finally have an incentive, one that will grow, to put money in the bank, where it can be loaned out. That puts upwards pressure on money supply velocity, increasing inflation. Janet Yellen has helped stabilize the price of gold, with her taper of QE, and with just one rate hike.
22. More rate hikes are coming, many more, and I don’t think Janet Yellen cares how loudly the US government and Wall Street whine about it.
23. Please click here now. Double-click to enlarge this daily bars GDX chart. As Janet empowers Main Street and produces stagflation, gold stocks will become the “go-to” asset for institutional money managers.
24. Most gold stock analysts are trying vainly to predict either a “final low” for gold stocks, a fresh decline, or some other kind of price event. I’m not sure that such an endeavor builds any wealth. It’s more important that gold stock enthusiasts simply buy systematically into the current “seeds of stagflation” theme, so they benefit when the seeds become trees and flowers!
Stewart Thomson of Graceland Updates, Guest Contributor to MiningFeeds.com

The fledgling rebound in the precious metals complex suddenly reversed course. Since the intraday peak last Thursday, gold stocks (GDX and GDXJ) declined about 13% while Gold lost $1100/oz and today (Thursday) $1080/oz. Silver, which did not mount much of a rebound to begin with remains mired below $13/oz. Gold is showing increasing relative strength (as we noted last week) and that is a good thing. However, the poor performance from Silver and sudden sharp reversal in the gold miners signals that the sector is on the cusp of making new lows.
Let me start with Silver, a market I have not covered in recent missives. The daily candle chart below includes the 50-day moving average and the net speculative position (as a percentage of open interest). Over the past two months Silver has been in a bearish consolidation with support at $13.60/oz and resistance at $14.40/oz. Silver’s numerous failures to recapture resistance at $14.40/oz and recent failures at the declining 50-day moving average augur for a break to new lows. Initial downside targets are $12.60 and $12.00, which is a very strong Fibonacci target.

The lack of extreme bearish sentiment is also damning. As of last Tuesday when Silver closed at $14.00/oz, the net speculative position was 17.2%. That is quite high given the current bearish trend. The net speculative position declined to 6% or below three times since 2013. There is room for more selling in Silver.
The immediate prognosis for the gold miners is just as dire.
The chart below plots the weekly candles for GDXJ and GDX. Note how the miners failed to close above resistance last week. GDXJ failed to hold its gains above $20 while GDX failed to move beyond $15. The miners, since that failure have declined nearly 10% and are threatening a breakdown in the days ahead. The miners have potential measured downside targets of $10.30 for GDX and $13 for GDXJ.

The implications of continued poor performance from Silver and the gold miners could be two fold. First, they could be hinting of Gold’s strong potential to decline to major support around $970/oz. Second, and with respect to the mining companies, their poor performance coupled with lower metals prices increases the risk of some major bankruptcies in the sector. Hence, traders and investors need to be very careful in owning broad baskets like GDX and GDXJ. Those with a long bias should consider hedging their portfolio by going short Silver or the miners. The time to clear hedges and accumulate quality companies figures to be when Gold is very oversold and nears major support amid extreme bearish sentiment. Note that three of the last four major bottoms in Gold occurred in February or March. As we navigate the end of this bear market, consider learning more about our premium service including our favorite junior miners which we expect to outperform in 2016.
1. At the end of the year, I always urge investors to stand aside from the US stock market. That’s because major money managers tend to move large amounts of liquidity during the first week of January, setting the tone for the year.
2. This year, the US stock market just put on what is arguably the worst first week of trading in the history of America!
3. To view the RBS (Royal Bank of Scotland) take on this dangerous situation, please click here now. I think that picture speaks about a thousand frightening words.
4.Please click here now. Inflation is suddenly on the move in Saudi Arabia, and in a country that already embraces gold, that’s going to add to demand.
5.For a more detailed view, please click here now. Clearly, some of the world’s top economists are very concerned about the ramifications of Janet Yellen’s rate hike policy.
6. My own view is quite different. Mine is that “Rate hikes rock!” That’s because I’m firmly committed to the view that rate hikes will benefit main street America, while putting severe and rightful pressure on Wall Street and the US government.
7. US consumer spending, borrowing, and saving all appear to be rising, while overall GDP declines. The Fed has begun to shrink its balance sheet, and wage inflation has ticked up. This is a very good situation, for gold price enthusiasts around the world!
8. Please click here now. Double-click to enlarge. That’s the daily dollar versus yen chart.
9. The dollar has staged a major breakdown against the yen, and large FOREX traders tend to base their dollar-gold trades on the dollar-yen chart action, more than on movements in the overall dollar index (USDX).
10. Please click here now. Double-click to enlarge. That’s the daily gold chart. In the short term, I expect the dollar to rally a bit against the yen, and that could push gold modestly down, to the $1070 – $1080 area.
11. From there, I expect the dollar to stage a major decline against the yen, creating a massive rally in gold.
12. Right now, the yuan is declining against the dollar. That yuan weakness is putting a lot of pressure on oil and global stock markets.
13. Please click here now. That’s the daily oil chart. Strong supply and drooping demand is quickly filling up available storage tanks.
14. If those tanks reach capacity, oil traders could panic, and oil could crash to the $15 – $20 area, and that would probably create a crash in global stock markets. Please click here now. Double-click to enlarge this daily Dow chart. I expect the Dow to swoon again, but not until it stages a very powerful rally.
15. The yen and gold bullion will likely function as the world’s only safe havens, as Janet Yellen unveils more rate hikes, stunning most analysts.
16. As oil goes lower, and the Fed pushes money off its balance sheet and into the commercial banking system, main street America won’t exactly “glitter like gold”, but it will stage significant relative outperformance versus corporate Wall Street. Consumers will both save and spend, and wages will rise.
17. Ultimately, that’s fabulous news for gold stocks, but in the short term gold stocks may not shine as brightly as bullion.
18. On that note, please click here now. Double-click to enlarge this daily GDX chart.
19. Many amateur technicians have probably worked overly hard recently, in an effort to call “ultimate lows” and “fresh big declines” for gold and gold stocks. The reality of the situation appears to be more mundane; most gold stocks did signal a rally for gold bullion, by refusing to confirm gold’s late 2015 decline below the summer lows.
20. That was positive news for gold, but gold stocks themselves are unlikely to stage any kind of “barn burner” rally, until Janet Yellen unveils more rate hikes and the Fed chops its balance sheet, making stagflation become widely recognized.
21.The exception to this “rule” will be the South African miners, where the tumbling rand currency is becoming a major booster shot to company profits, and share prices.
22. Please click here now. That’s the daily Harmony mining chart. In less than two months, while GDX has barely moved higher, Harmony has almost tripled!
23. Many Western gold stock investors have bitter memories of mine-crippling strikes and theft, in the 1970s. The bottom line is that was then, and this is now; China and India weren’t looking to secure long term supplies of gold in the 1970s. They are doing so now.
24. South Africa has many of the world’s big reserve mines, and even a modest recovery in the overall gold price would create substantial profits for many miners there.
25. What about silver? Please click here now. Double-click to enlarge this daily silver chart. In the short term, silver could slip a dollar or so, on the downside. That’s because the “stag” part of stagflation (lower GDP and stagnant stock markets) is now apparent, but the “flation” (inflation) part of the equation requires more time to present itself. I’ll dare to suggest that all silver price enthusiasts need to be aggressive buyers of any short term price weakness, because the winds of stagflation can grow in intensity, with shocking speed!
Stewart Thomson of Graceland Updates, Guest Contributor to MiningFeeds.com

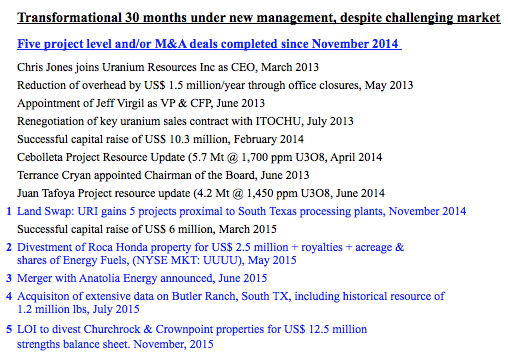
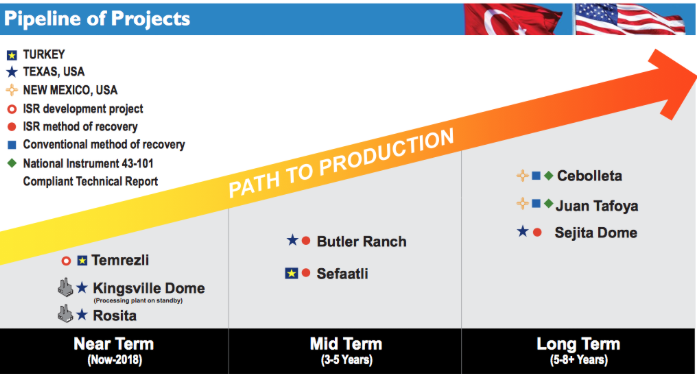
Uranium Resources Inc. “URI” (Nasdaq:URRE) (URI:ASX) has delivered a string of good news, but the Company’s stock is down nearly 60% since the June 2015 announcement of its acquisition of Anatolia Energy. Since Chris M. Jones took the helm as CEO in March 2013, URI has proactively executed a number of key initiatives, 14 in fact. Nothing short of transformational changes have been made over the past 32 months. These successes demonstrate ongoing efforts to bolster liquidity, reduce risk, diversify assets and pull forward cash flow. Achievements include; cost cutting & cost containment, new hires, positive project & resource updates, asset sales / acquisitions and importantly, the renegotiation of a key sales contract. Mr. Jones’ abbreviated bio is as follows:
Christopher M. Jones, President, CEO & Director: Joined in March 2013. More than 30 years experience in positions of increasing responsibility in the Mining & Energy industries. Mr. Jones was most recently President & CEO of Wildcat Silver Corporation, where his team quadrupled the size of the resource. He’s a licensed Professional Engineer in the US & Canada, has a B.S. in Mining Engineering from South Dakota School of Mines and an MBA from Colorado State University. Mr. Jones is a member of the American Institute of Mining, Metallurgical & Petroleum Engineers.
Clearly, the Company is run by a highly skilled, experienced and committed team, including 4 in new roles subsequent to CEO Jones’ arrival.
Select Management & Board members [Corporate Presentation]
Terence J. Cryan, Chairman of the Board: Director since October 2006, Chairman since June 2014. Mr. Cryan has over twenty years of international experience as an investment banker in the US & Europe. He served as Director of a number of international companies and is a frequent lecturer at Finance & Energy industry gatherings. He holds a Master of Science degree in Economics from the London School of Economics and a BA from Tufts University.
Tracy A. Stevenson, Director: Has served as Director since December 2013. Mr. Stevenson, CPA, is a Founding member of Bedrock Resources, a financial advisory firm focused on natural resources. He was Global Head of Business Process Improvement at Rio Tinto, and Executive VP, CFO & Director of Comalco Ltd. Prior, Mr. Stevenson served as CFO / Director of Kennecott Corp. and as Director of Ivanhoe Mines.
Mark K. Wheatley, Director: Has served as Director of Uranium Resources Inc. since 1q 2013 Mr. Wheatley’s independent, non-executive Board roles have included Chair of Gold One International, Norton Goldfields & Goliath Gold Mining, as well as directorships at St. Barbara Mines & Uranium One Inc. Mr. Wheatley was Chairman & CEO of Southern Cross Resources when it merged to create Uranium One in 2005.
Jeffrey L. Vigil, VP & CFO: Appointed VP & CFO in June 2013, responsible for financial & management reporting including tax, compliance, treasury, risk management & capital raising functions. Has served in various financial positions including CFO at Energy Fuels Inc. Mr. Vigil has more than 30 years financial management experience, 8 in the uranium sector, including serving as a mill cost analyst for Energy Fuels’ White Mesa Uranium Processing Facility.
URI’s market position has strengthened, yet its stock has plunged
Please look at the exhibit – 14 significant developments, 5 of which highlighted by management as transformational. Since March 2013, CEO Jones has led a new management team & Board in executing a well thought out, forward looking plan. The Company enjoys stronger liquidity, now trading on both the NASDAQ & Australian markets. The Anatolia acquisition closed on November 8th, eliminating deal risk. And, an asset sale was announced the following day. URI’s largest shareholder, Resource Capital Fund V L.P. “RCF” is reported to be, “evaluating project [the Temrezli ISR project] financing options.”
Balance sheet liquidity is solid, supporting a valuation that should be moving higher, not lower. As of September 30, 2015, non-restricted cash was $3.8 million. Since then, the Company signed a Binding Letter of Intent to sell 2 non-core assets for $12.5 million, of which $5.5 million is cash. To be clear, closing this transaction is not a sure thing. However, the buyer, Laramide Resources, recently obtained a $5 million loan and raised $1.5 million of equity. URI has $8 million in convertible debentures held by RCF. In December, URI closed a small equity raise, 2.5 million shares @ $0.40 (with no warrants). Existing warrants & options are well out of the money.
Therefore, URI’s pro forma Enterprise Value, “EV” is [54 mm shares x $0.53/share (Jan. 4th close) = $28.5 mm market cap, plus $8 mm convertible debt, minus ~ $9.5 mm pro forma cash, (including the prospective $5.5 million from sale of assets) is roughly $27 million (or $32.5 million without $5.5 million of cash proceeds). A pro forma EV of just $27 million for a company that’s produced over 8 million pounds of uranium in Texas, owns a world-class ISR project in Turkey, a standby processing facility in the U.S. and maintains strong exploration upside in Texas, New Mexico & Turkey, seems exceedingly cheap. [Corporate Presentation]
New & improved Uranium Resources Inc, trading at unwarranted discount to peers
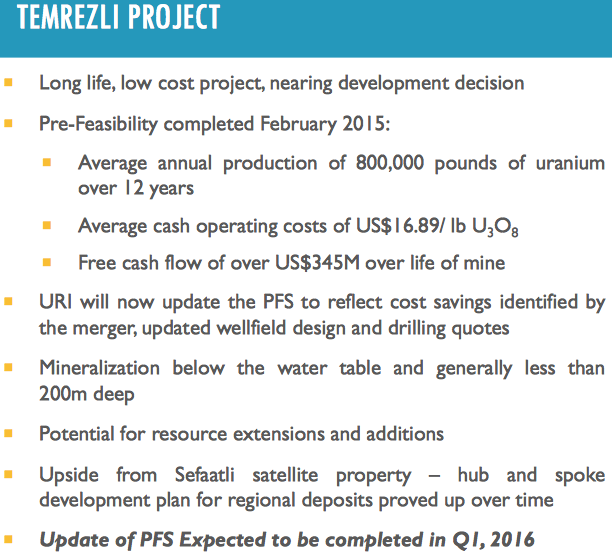
The nearest and most valuable asset possibly into production is the Temrezli ISR Project. Temrezli’s post-tax NPV of $126 million is based on upfront capital of $41 million. However, URI is on track to potentially reduce that figure trough synergies and the relocation of its Rosita processing plant to Turkey. If anticipated synergies can be extracted, the capital requirement could be in the low-to-mid $30’s million, which would boost the project’s already impressive IRR of 65%. As per the PFS sensitivities found in this press release, slashing initial cap-ex from $41 million to $35 million, if possible, would generate an after-tax IRR of ~77%.
URI’s entire pro forma EV is trading at roughly a quarter of Temrezli’s NPV alone! An investor at $0.53/share effectively gets Temrezli for FREE. That’s if one believes as I do that the valuation of the Company’s standby processing mill (2 mills, but Rosita mill headed to Turkey), plus advanced & earlier-stage exploration / development assets in Turkey, New Mexico & Texas, is worth at least $27 million. Hardly a stretch given that URI had an EV of $45 million the day before the Anatolia transaction was announced. Notably, in the months preceding Japan’s Fukushima incident, URI (without Anatolia) had a market cap as high as $300 million, 10x that of today’s market cap (including Anatolia).
Proactive corporate initiatives de-risk world-class Temrezli Project
More detail on the Company’s non-Temrezli assets — URI holds a 100% interest in 9 licenses covering over 44,479 acres, including several advanced exploration opportunities in the central Anatolian region of the country. URI controls three production properties and several exploration targets in South Texas. The Company also has substantial historical, non-reserve mineralized material and a NRC license to produce up to 3 million pounds per year. URI controls mineral rights encompassing approximately 190,000 acres in the prolific Grants Mineral Belt of New Mexico, one of the foremost sandstone-hosted uranium basins in the world. Finally, the Company has expanded its feeder pipeline of high-potential ISR projects in Texas, near its processing infrastructure.
Enhanced liquidity would deliver more than a comfortable margin for error, it would be used to partially fund URI’s low-cost, world-class Temrezli ISR Project. Anatolia’s Pre‐Feasibility Study indicated an after-tax NPV(8%) of $126 million based on a uranium price of $65/lb. At a long-term uranium price of $55/lb., (currently $44/lb.) the after-tax NPV is roughly $85 million, still 3x that of the entire Company’s pro forma EV! Recall that the Temrezli project is squarely in the lowest cost quartile in the industry, making it solidly profitable at a price as low as $40/lb. I believe that an upfront capital call in the $30’s of millions, for a top-tier ISR project, is achievable even in this challenging funding environment.
Conclusion
I strongly believe that the new Uranium Resources Inc. (Nasdaq:URRE) (URI:ASX) is demonstrably undervalued. URI is without question in a stronger position today then it was six months ago. Importantly, URI’s lower risk profile should facilitate project financing. URI’s stock is ~ 70% below its 52-week high. Compared to ISR peers Energy Fuels, UR-Energy, Uranium Energy Corp. & Peninsula Energy, URI is trading at close to a 55% discount on an EV/lb. basis (giving zero credit to historical non-reserve mineralized, “lbs. in the ground”). In my opinion the sell off is unwarranted, offering a compelling risk-adjusted opportunity to buy shares. [Please see my prior article on URI]
Reiterating the analysis, the Company’s pro forma cash balance is about $9.5 million (including the prospective $5.5 million from sale of assets). The pro forma EV is just $27 million, 40% below URI’s EV before the Anatolia acquisition. Investors are arguably getting Temrezli’s Pre-Feasibility Study derived NPV(8%) of $126 million (at $65/lb. uranium) for free. Even at $55/lb, the NPV is about $85 million, 3x that of the entire Company’s EV. Fundamentally the story has only become stronger, a story that does not require a near-term spike in uranium prices to be a big winner. Therefore, investors are faced with a compelling risk/reward opportunity.
Here’s a good audio interview of CEO Chris Jones, conducted by Jeb Handwerger.
Disclosure: Uranium Resources Inc. has a small market cap. Small market cap stocks are highly speculative, not suitable for all investors. I, Peter Epstein, own shares of Uranium Resources Inc. purchased in the open market. Mr. Epstein, CFA, MBA is not a licensed financial advisor. Readers should take that fact into careful consideration before buying or selling any stocks named herein.
Readers are encouraged to consult with their own investment advisors before buying or selling any stock, especially highly speculative ones like Uranium Resources Inc. At the time that this article was posted, Uranium Resources Inc. was a sponsor of: http://EpsteinResearch.com. Please visit: http://EpsteinResearch.com for free updates on URI and others across a range of sectors. Thank you for supporting my articles & interviews.
Gold certainly had a rough year in 2015, grinding inexorably lower on Fed-rate-hike fears and investor abandonment. But gold is poised to rebound dramatically in this new year, mean reverting out of its recent deep secular lows. The drivers of gold’s weakness have soared to such extremes that they have to reverse hard. The resulting heavy buying from dominant groups of traders will fuel gold’s mighty 2016 upleg.
Investment demand, or lack thereof, is what overwhelmingly drives the gold price. Investment certainly isn’t the largest component of gold demand, a crown held by jewelry at roughly 4/7ths of the total. But that is somewhat misleading, as gold’s investment merits are the primary reason Asians flock to gold jewelry. But since global jewelry demand is fairly consistent, it’s not what drives the gold price on the margin.
Investment demand is much smaller. According to the World Gold Council, it only accounted for 17.7% of global gold demand in 2013, 19.4% in 2014, and 22.0% in 2015 as of the end of the third quarter. So call investment demand something like 1/5th of total world gold demand. While that isn’t huge, it is a super-volatile demand category. That’s where gold’s biggest demand swings emerge, driving its price.
The reason gold prices plummeted 27.9% in 2013, slipped another 2.0% in 2014, and then fell 9.6% in 2015 by this essay’s data cutoff on the 29th was because investment demand first collapsed and then remained weak. Without strong global investment demand, gold is going to struggle. It is the big swing category of demand, the outlying volatile variable imposed on the steadiness of other demand and supply.
It’s hard to believe after the brutal gold wasteland of recent years, but this unique asset hasn’t always been despised. Between April 2001 and August 2011, gold skyrocketed 638.2% higher in a mighty secular bull earning fortunes for brave contrarians. The flagship S&P 500 stock index actually slipped 1.9% lower over that same span. Even after gold’s summer-2011 peak, its price averaged $1669 in all of 2012.
The collapse of gold’s critical investment demand began in early 2013. And it wasn’t a normal event, but an extreme market anomaly courtesy of the US Federal Reserve. Back in September 2012, gold traded at $1766 the day the Fed launched its third quantitative-easing campaign. QE3 was wildly different than its predecessors in that it was open-ended, its bond monetizations had no predetermined size or end date.
Just a few months later in December 2012 as gold traded at $1712, the Fed more than doubled the size of its brand-new QE3 campaign with massive new US Treasury monetizations. Starting in January 2013 the Fed would conjure up $85b per month out of thin air to buy bonds. The purpose of QE3 was to manipulate long-term interest rates lower, which the Fed openly admitted. QE3 radically distorted the markets.
QE3’s undefined open-ended nature made it a powerful psychological-operations weapon to use on traders to actively manipulate their sentiment. Whenever the stock markets started to sell off, elite Fed officials would run to their podiums to declare their central bank was ready to expand QE3 if necessary. Traders interpreted this just as the Fed intended, believing the Fed was effectively backstopping stock markets!
So traders started pouring increasing amounts of capital into the stock markets, levitating them. With a Fed Put in place, a notion that Fed officials aggressively fostered, traders increasingly ignored all the conventional stock-market indicators. They bought and bought and bought, sentiment, technicals, and fundamentals be damned. This relentless stock buying gradually became a self-fulfilling prophecy.
As the stock markets seemingly magically levitated thanks to the Fed’s deft use of QE3’s undefined nature, they started sucking capital away from other asset classes. Investors love to chase performance, and stock markets were powering relentlessly higher leaving everything else behind. So they started to sell other assets to move that capital into the red-hot stock markets. Gold was collateral damage from this migration.
This mass exodus of investment capital from gold was most evident in the flagship GLD SPDR Gold Shares gold ETF. After hitting an all-time-record gold-bullion-holdings high of 1353.3 metric tons just 3 trading days before the Fed greatly expanded QE3 in December 2012, stock investors started to dump GLD shares faster than gold in early 2013. This soon snowballed into a wildly-unprecedented record selloff.
Since GLD’s mission is to track the gold price, it has to act as a direct conduit for stock-market capital to slosh into and out of physical gold bullion. When GLD shares suffer differential selling beyond what is going on in gold, their price threatens to decouple from gold’s to the downside. GLD’s managers have to avert this failure by shunting that excess share supply directly into gold itself. This requires selling gold bullion.
GLD’s managers sell enough of its gold holdings to raise sufficient cash to buy back all the excess GLD shares being offered. In 2013 as the Fed’s extraordinary QE3-stock-market levitation blasted the S&P 500 29.6% higher, stock investors dumped GLD shares so fast that its holdings plummeted 40.9% or 552.6t that year! GLD selling alone accounted for over 5/6ths of 2013’s total drop in overall global gold demand.
As GLD was forced to hemorrhage vast record torrents of gold bullion into the markets, another group of traders piled on to ride gold’s downside. The American gold-futures speculators, whose trading has the greatest impact on gold’s price by far, started short selling gold futures at extreme levels. This added to the paper supply of gold, forcing down the benchmark gold-futures price off of which the physical metal is priced.
The more American stock investors jettisoned GLD shares, the faster gold fell. The faster gold fell, the more American futures speculators ramped their short selling. All the resulting gold carnage forced the other futures speculators long gold futures to greatly pare their bets, adding still more selling to the mix. The result was the most devastating vicious circle of selling gold has ever seen, spawning recent years’ wasteland.
As gold fell due to extreme selling driven by the Fed-levitated stock markets sucking investment capital out of it, traders tried to rationalize those losses as fundamentally-righteous. So the futures speculators started to believe first the tapering of the size of QE3’s monthly bond monetizations, then the end of QE3’s new bond buying, then later the Fed’s first rate hike would wreak more havoc on devastated gold.
These rationalizations were always weak though, simply masking self-feeding selling driven by out-of-control bearish sentiment. Remember gold traded at $1766 and $1712 when QE3 was originally born and expanded in late 2012. So gold plunged sharply during QE3. If that largest inflationary event in world history was ludicrously very bearish for gold, then why would the end of QE3 prove bearish as well?
The coming slowing and end of QE3’s epic monetary inflation was the boogeyman used by traders to justify aggressively selling gold in 2013 and much of 2014. QE3 was first tapered in December 2013, and its new bond buying fully ended in October 2014 even though none of those vast monetized bonds have been sold yet to this day. Once QE3’s new bond buying ended, traders shifted their boogeyman to rate hikes.
Fed-rate-hike fears were used to justify futures speculators’ and stock investors’ ongoing gold selling in 2015. Their rationale was simple. Since gold yields nothing, it will be far less attractive in a rising-rate world where yields climb on competing investments. But again this justification was totally emotional, a reflection of extreme popular bearishness that had nothing to do with gold’s actual global fundamentals.
The fatal flaw with this Fed-rate-hikes-are-gold’s-nemesis thesis is that history proves just the opposite. I’ve extensively studied gold’s performance within the exact spans of every Fed-rate-hike cycle since 1971. It turns out there have been 11 of them, through all of which gold averaged a stellar gain of 26.9% while the Fed was hiking rates. In the majority 6 where gold rallied, its average gain was a staggering 61.0%!
In the other 5 Fed-rate-hike cycles where gold lost ground, its average loss was an asymmetrically-small 13.9%. Gold’s best performance within Fed-rate-hike cycles occurred when it entered them near secular lows and they were gradual. With gold just off major secular lows today, and the coming Fed-rate-hike cycle promised to have the slowest hiking pace ever witnessed, it’s incredibly bullish for gold’s fortunes.
If higher rates really kill gold, history would be riddled with examples. The Fed is currently estimating that the federal-funds rate it targets will hit 1.25% to 1.5% in 2016. While that’s a lot higher than recent years’ 0.0% to 0.25% range, it is still trivial by historical standards. Between January 1970 and January 1980, gold skyrocketed 2332% higher when the FFR averaged a super-high 7.1% and gold still yielded zero.
During that later 638% secular gold bull between April 2001 and August 2011, the FFR still averaged 2.1% over that span despite the advent of the Fed’s zero-interest-rate policy within it. Gold has no problem at all rallying mightily during Fed-rate-hike cycles and in much-higher-rate environments as long as global investment demand is strong. All those rampant gold-to-plunge-due-to-Fed-policy fears are baseless.
Thus as 2016 dawns, the whole premise for selling gold near major secular lows is totally wrong. Gold only hit these lows because investment demand remained low as extreme bearish psychology choked out all logic and reason. But the Fed actually hiking rates for the first time in 9.5 years, ending 7 years of ZIRP, will serve as the acid test to shatter these false notions. Gold hasn’t plunged post-hike as widely forecast!
And that means gold-futures speculators and stock investors alike are going to have to seriously rethink their whole gold thesis. As they realize that rate hikes won’t slaughter gold, investment demand is going to start returning. And coming from such epically-extreme anomalous lows, it is going to take a massive amount of gold buying to restore normalcy in the gold market. That normalization is inevitable in 2016.
Major gold uplegs have three distinct stages of buying, with groups of traders handing off the baton like a relay race. New gold uplegs are initially ignited and fueled by speculators buying gold futures to cover their risky hyper-leveraged shorts. That sparking surge of buying lasts several months or so, propelling gold’s price high enough to get speculators interested in redeploying capital in long futures positions again.
Unlike short covering which is mandatory and forced as gold rises to prevent speculators from getting wiped out, long buying is totally voluntary and far less frantic. So it can take a half-year or more for the speculators to reestablish their upside bets on gold. That extends gold’s new upleg long enough and high enough to convince investors with their vastly larger pools of capital to start returning, which takes years.
Today gold is in an unprecedented position where the coming speculator gold-futures short covering, speculator gold-futures long buying, and stock investor GLD-gold-ETF buying is all aligned to be utterly huge! As the extreme anomalies of recent years spawned by the Fed’s stock-market levitation unwind, the vast gold buying necessary to mean revert that market to norms is going to fuel a mighty new gold upleg.
Let’s start with the futures speculators, the early buyers necessary to get gold moving higher again for long enough to motivate investors to return. This chart shows American futures speculators’ total short-side and long-side bets on gold weekly over the past several years. These guys are so far out over their skis on the bearish side of this trade it is mind-boggling, and their only way out is extreme gold-futures buying.

American speculators’ aggregate gold-futures positions are released every Friday afternoon current to the preceding Tuesday’s close in the CFTC’s Commitments of Traders reports. The latest read when this essay was published was December 22nd’s. That was the week surrounding the Fed’s rate hike which was supposed to obliterate gold. Yet since gold didn’t plunge as expected, speculators quickly covered.
They bought 15.5k gold-futures contracts that CoT week, cutting their total shorts from near-record levels to 167.5k contracts. But that is still extremely high by all historical standards, not far from the all-time record of 202.3k in early August. Even during the recent Fed-distorted years, speculators’ gold-futures short-side bets generally meandered in the trading range between 75k to 150k contracts shown above.
Merely to return near recent years’ 75k-contract support for the fifth time since late 2013, speculators are going to have to buy 92.5k gold-futures contracts to offset and cover their shorts. And to mean revert to total speculator shorts’ normal-year average levels of 65.4k between 2009 and 2012 before the Fed’s stock levitation started, these traders have to buy a staggering 102.1k contracts. That’s an incredible amount of gold!
Each gold-futures contract controls 100 troy ounces of the metal, so that equates to total gold buying in speculators’ short covering alone of 317.6 tonnes! For an idea of how enormous this is, quarterly global gold investment demand in 2015 up to Q3 averaged 228.0t. So we are talking about overall world investment demand soaring 139% on speculator short covering alone within a condensed several-month span!
Short covering unfolds so rapidly because traders are legally obligated to effectively pay back the gold they effectively borrowed to sell short. And the leverage in gold futures is so extreme that they can’t afford to wait to cover once gold starts rallying. A single gold-futures contract controls $107,000 worth of gold at $1070, yet only requires a maintenance margin of $3750. That makes for extreme leverage of 28.5x!
A mere 3.5% rally in the gold price at that kind of leverage would wipe out 100% of the capital risked by fully-margined gold-futures speculators. So gold-futures short covering rapidly feeds on itself, with all the covering buying blasting gold’s price rapidly higher which forces additional speculators to cover their own shorts. The more short covering, the faster gold rallies. The faster gold rallies, the more shorts are covered.
By the time gold-futures short covering has run its course and fizzled out, speculators buying long-side gold futures start returning. And their bets are exceedingly low right now, which means they also have huge buying to do to mean revert to normal. As of that latest CoT report on the 22nd, American futures speculators only held 189.7k long-side gold contracts. That’s their lowest level since way back in April 2014.
In those last normal years between 2009 to 2012, speculators averaged weekly long-side gold-futures positions of 288.5k contracts. Merely to mean revert to those normal levels without even overshooting would require 98.8k contracts of buying equivalent to another 307.2t of gold! In total, American futures speculators alone need to buy the enormous equivalent of 624.8t of gold simply to normalize current extremes!
To put this into perspective, in all of 2013 and 2014 global gold investment demand ran 784.8t and 819.1t per the World Gold Council. In 2015 current to Q3, that number is running 684.0t. Annualize the latter and average these years, and you get yearly gold investment demand of 838.6t. American futures speculators alone are almost certainly going to buy 3/4ths as much gold in 2016 on top of all that normal demand!
And all that mean-reversion gold-futures buying will propel gold high enough for long enough to start to convince investors to return. And their gold positions are as extreme today as speculators’ gold-futures ones, a guarantee of massive normalization buying coming. While physical bar-and-coin investment is larger than ETFs, GLD’s highly-transparent daily data is representative of radical underinvestment as a whole.

This chart reveals the total value of GLD’s gold-bullion holdings divided by the market capitalization of that benchmark S&P 500 stock index. If offers a glimpse into the proportion of stock investors’ portfolios that are deployed in gold. And thanks to the epic gold bearishness in recent years based on those false notions on the extreme Fed policies’ implications for gold, American stock investors are radically underinvested.
For many centuries, wise investors have recommended every portfolio have at least a 5% allocation in gold. It is the ultimate insurance policy, a unique asset that moves counter to stock markets. When something bad happens with the other 95% of one’s investments, that mere 5% gold allocation will often multiply enough to offset most of the other losses. That old 5% target is probably gold’s full-investment level.
But as of the end of November the last time we calculated the S&P 500’s market capitalization, the ratio of the value of GLD’s holdings to the S&P 500’s collective market cap was just 0.115%. American stock investors had just over a measly one-tenth of one percent of their capital invested in gold! That is incredibly low by all historical standards, a Fed-driven anomaly that is as ripe to mean revert as gold-futures bets.
During those last normal years between 2009 to 2012, this GLD/SPX ratio averaged 0.475%. Seeing stock investors with that nearly 0.5% portfolio allocation to gold is a reasonable conservative baseline. Just to return to 0.475% would require gold’s portfolio allocation to soar 4.1x from the recent super-depressed levels. Vast amounts of stock-market capital would have to deluge back into gold to make this happen.
GLD’s holdings averaged 1208.5t between 2009 to 2012 before the Fed’s stock-market levitation sucked so much capital out of other investments including gold. This week, GLD’s holdings were way down around 643.6t. So to return to pre-QE3 GLD-investment levels, stock investors would have to buy up enough GLD shares to force this ETF’s managers to purchase another 564.9t of gold bullion in coming years!
And that’s third-stage gold-upleg investment buying on top of first-stage speculator gold-futures short covering and second-stage long buying! While it will probably take years instead of months to normalize levels of gold portfolio allocations for stock investors, that’s still a tremendous amount of marginal new gold investment demand. 564.9t of GLD buying over 2 years is 282.5t per year, and over 3 years is 188.3t.
The average quarterly gold investment demand in 2015 up until Q3 was 228.0t, so we’re talking about an additional 0.8x to 1.2x a quarter’s gold demand per year on top of all other gold demand. And don’t forget that GLD is just a window into one aspect of gold investing, ETFs. Global physical bar-and-coin demand is way larger than ETF demand, and the radical underinvestment there is similar to what GLD has revealed.
So with the gold positions of speculators and investors alike so radically skewed by the Fed’s extreme market distortions of recent years, vast mean-reversion buying is inevitable in 2016 to start to normalize gold investment back to reasonable levels. Coming off of such an anomalously-low base where virtually everyone loathes gold, all this speculator and investor gold buying is going to fuel a mighty gold upleg.
Gold’s performance will trounce the stock markets’ in 2016, and it can be played via that GLD gold ETF or physical gold bullion. But the coming gains in the left-for-dead gold stocks will dwarf those in the metal they mine. With their stock prices recently trading near fundamentally-absurd levels relative to their current profitability, down near extreme 13-year secular lows, gold stocks should be 2016’s top-performing sector.
The bottom line is gold is poised for a mighty upleg in 2016 after being abandoned during the Fed’s surreal stock-market levitation. That sucked incredible amounts of capital out of other assets including gold, which speculators and investors alike jettisoned with a vengeance. The resulting bearishness left gold-futures speculators’ bets at epically anomalous levels, and stock investors radically underinvested in gold.
They tried to rationalize their extreme gold selling with Fed-rate-hike fears. But now that the rate hike has happened and gold refused to collapse as advertised, traders will have to start normalizing all their hyper-bearish gold positions. This will require vast buying by both speculators and investors, greatly boosting gold investment demand which will fuel a mighty new gold upleg in 2016. Are you ready to ride it?
If you would like to receive our free newsletter via email, simply enter your email address below & click subscribe.
 Follow us on Twitter
 Become our facebook fan
CONNECT WITH US
Tweets
Tweet with hash tag #miningfeeds or @miningfeeds and your tweets will be displayed across this site.
MOST ACTIVE MINING STOCKS
Daily Gainers
 CMC Metals Ltd. CMC Metals Ltd. |
CMB.V | +900.00% |
 Eden Energy Ltd Eden Energy Ltd |
EDE.AX | +200.00% |
| GoviEx Uranium Inc. |
GXU.V | +42.86% |
| Eagle Nickel Ltd. |
ENL.AX | +41.67% |
| Citigold Corp. Limited |
CTO.AX | +33.33% |
| Mount Burgess Mining NL |
MTB.AX | +33.33% |
| Exalt Resources Limited |
ERD.AX | +31.94% |
| Casa Minerals Inc. |
CASA.V | +30.00% |
| Cariboo Rose Resources Ltd |
CRB.V | +28.57% |
| Belmont Resources Inc. |
BEA.V | +28.57% |


