

This major gold producer opened down 10% this morning (February 26, 2016) because of the earnings news released the night before. Were the earnings that bad? No, not at all. Once again, the market sells when it should buy and buys when it should sell.
First, you need to know that Goldcorp just brought in a new CEO. The first thing a new CEO does is to clear the decks of any mistakes made by his predecessor that his predecessor did not want to admit. Why carry the can for the old administration? So, the new CEO wrote off everything possible. These are NON-CASH expenses. These horses left the barn long ago. The only actual expense involved is auditor’s ink.
And here’s the bonus: Goldcorp shareholders will not see another write-off for years. What they will see is exaggerated earnings now that the bad stuff is off the books.
Goldcorp also announced it is cutting the dividend. Right. They are cutting the dividend after the gold price is UP nearly $200 per ounce from the low of last year. Why? So the new CEO can show off his performance and get a bonus from thankful shareholders for raising the dividend later this year.
With the gold price UP nearly $200 from the reporting period released today, we are looking at ancient history here folks. History that is irrelevant. The economics have changed but the new guy gets the credit.
So, dear reader, if you are thinking of buying a gold stock, please take a look at GG. Buy when the masses are selling. Just remember to sell when they are buying.
How to make $$ from the Lithium-ion Battery revolution?
The story unfolding couldn’t be simpler. Lithium-ion batteries (Li-ion) represent a paradigm shift in the transportation and stationary (residential, commercial & utility grid-storage) battery markets. As the world becomes less dependent on fossil fuels, demand for environmentally sustainable solutions utilizing rechargeable Li-ion batteries is taking off. Evidence of this trend can readily be seen in the lithium market, where prices have nearly tripled in just six months.
Having said that, this article is about graphite, a material so integral to Li-ion batteries that they could be called Li-ion graphite batteries. Though I doubt the name will catch on, it illustrates the fact that it takes 10x to 30x more graphite than lithium to make a Li-ion battery. Although lithium has garnered the lion’s share of publicity, it’s reasonable to expect to see a similar trajectory for a select few in the graphite exploration & development space.
Graphite is a critically important material in the high-tech battery revolution. Demand for graphite in stationary/grid-storage batteries alone could be particularly acute, forecast to grow by 74.9% annually to a market size of US$170 billion in 2025. (source: Panasonic Corp. / Benchmark Mineral Intelligence, 2015). One company well placed to cross the finish line among the winners is, Alabama Graphite Corp. (AGC) [ TSX-V: ALP) / OTC: ABGPF / FRANKFURT: 1AG ]. The fact that this particular Company proposes to mine, process, finish and sell domestically, battery-ready graphite, is all the better. These days everyone’s looking for Made-in-the-USA solutions to address security of supply concerns and demonstrate that critical materials like graphite, lithium and cobalt are procured from environmentally sound sources. [Note: See AGC’s Corporate Presentation ]
Many emerging green-energy, tech materials companies aspire to supply these dominant segments in the Li-ion battery hierarchy. However, only a handful will be able to deliver the most sought after Coated Spherical Purified Graphite (CSPG). Why? An essential factor to recognize is that CSPG is not a commodity product. It’s a specialty, nonmetallic mineral, painstakingly tailored to the specs of a specific graphite concentrate feedstock. As such, a graphite junior that does not have a mine to end-market customer strategy, would likely face difficulties at the point of sale of a number of commodity-like graphite concentrates. More on this to follow.
Identifying a theme? Easy. Picking the winners? Not so easy
Alabama Graphite is unlike other graphite juniors. Conventional production plans entail mining graphite and building processing facilities to upgrade run-of-mine ore into a primary processed graphite concentrate (PPGC), to be sold for use in traditional applications such as crucibles, brake linings & foils. The team at AGC believes this business model may present challenges due to a lack of demand for PPGC and potential oversupply in the market. Production of PPGC, and supply / demand dynamics in China, are a wildcard as well.
As evidenced by the Company’s Preliminary Economic Assessment, (PEA), AGC has zero interest in selling primary processed graphite concentrate. Instead, it plans to convert 100% of its PPGC to specialty, secondary processed, natural CSPG, specifically designed to serve Li-ion battery markets. CSPG is expected to account for 75% of AGC’s output, and purified micronized flake graphite (PMG) 25%. PMG is used in end products like polymers, plastic & rubber composites, powder metallurgy, and energy/friction materials.
There are at least 7 Li-ion battery factories, including facilities under construction, in the U.S. Add to that several car manufacturing plants and over 100 utility companies. If AGC reaches commercial production, it will have the entire U.S. market at its fingertips.
But here’s where the EV rubber hits the road. If AGC reaches commercial production, it’s reasonable to assume that its ultra-high purity end products (particularly CSPG), would be in high demand. This is a critically important distinction; PPGC will become more of a commodity-like product, subject higher competitive risks. Therefore, even emerging graphite producers that reach commercial production could fail, if a portion of end products cannot be sold profitably or at all.
Valuation considerations: Coosa quite valuable, AGC undervalued
The Coosa Graphite Project is located on private land in Alabama, USA. This means State-level permitting only (no federal / EPA, NEPA permitting required), a six-month process that can be initiated during the Company’s work on its Feasibility Study. In other words, Alabama Graphite has the potential to fast-track production compared to peers that might face more arduous permitting challenges. Local communities strongly support the Company’s efforts. Tax revenues and employment opportunities would increase if Coosa were to be mined. [NOTE: An excellent article by GARETH HATCH from February 16th]
In November 2015, AGC announced the completion of an independent, NI 43-101 compliant (PEA) describing its Coosa project. The PEA delineated a project with initial capital needs of $43.2 million, to generate an estimated after-tax NPV(8%) of $320 million and an IRR of 45.7% (the after-tax NPV(10%) = $236 million). AGC’s market cap of US$9.7 million is just 3% of its preliminary after-tax NPV. All else equal, the market cap could double and AGC’s valuation would still be just one-sixteenth its PEA-derived, estimated NPV. [Note: a NPV(8%) is used for comparisons; all figures in US$]
Comparing that ratio, market cap divided by after-tax NPV, (lower values possibly indicative of cheaper valuations), to a group of four TSX-listed graphite juniors is illustrative. As mentioned, AGC is trading at 3% of its after-tax NPV. That’s a 75% discount to the average of roughly 12% of NPV, among the four group members. This relative undervaluation is even more pronounced if one assumes that, all else equal, group members potentially face greater equity dilution than AGC. Why? The other’s projects have significantly larger initial cap-ex requirements.
Looking at valuation another way, AGC’s initial capital call of $43.2 million is roughly one-third that of the group’s average requirement of $125 million. To be fair, AGC’s much lower capital need is due to a much smaller processing facility. A metric that attempts to equalize capital intensity across projects is the ratio of initial capital investment to after-tax NPV (the lower the better). The group members have ratios of 2.0x, 0.7x, 0.3x & 0.5x; for an average of 0.875x. This ratio shows that at 0.135x, AGCs capital intensity is four times lower. Capital intensity is of paramount importance in attracting strategic investors. By this measure, Coosa stands a better chance of being financed.
Concluding thoughts
Dozens of graphite juniors boast about flake size, head-grades, relative percentages of large & jumbo flake, deposit size, PPGC grades, etc. However, competition for PPGC will likely be fierce, potentially sinking a great number of projects. Who’s to know which projects will make it into production at all? For companies faced with large initial cap-ex budgets, frequently in excess of $100 million, project viability is questionable. Looking at just one aspect of the overall economics, consider that most emerging player s would need to drill, blast, crush & grind run-of-mine ore.

1.All lights for gold are green, and rather than beginning a correction, gold may be poised to intensify its rally.
2. Investors with widely differing views on gold all seem to be pressing their buy buttons at the same time. That’s something that has not happened in a long time. The bottom line is this:
3. Key bank economists are forecasting a new upcycle for commodities, which will begin later this year, India may cut the import duty on Sunday night (February 28), Shanghai prepares to launch its gold price fix, gold ETFs are adding serious tonnage, the chartists are happy, and most discussion of US interest rate policy (whether hawkish or dovish) is bullish for gold.
4. Gold is arguably entering a period of time that is best termed as, “fundamental and technical nirvana”.
5. Please click here now. Double-click to enlarge. That’s a key gold chart, using two hour bars.
6. There’s a beautiful symmetrical triangle in play, with a rough upside target of $1310.
7. Mainstream chartists are also watching gold with great interest. Please click here now. Double-click to enlarge. Bloomberg News is covering a “golden cross” event, which occurs when the 50 day moving average crosses the 200 day moving average.
8. The widespread interest in gold is creating even more demand for this mightiest of metals! Please click here now. Double-click to enlarge. Investors have added an incredible amount of gold to the SPDR fund over the past few days, taking the total tonnage to over 750 tons.
9. Indian demand has dropped dramatically in February, but that’s actually good news! To understand why I say that, please click here now. The country’s national budget is scheduled for release on Sunday, and most of India’s top jewellers are predicting a cut in the import duty, which will be a key part of that budget.
10. If the duty cut happens, jewellers may buy gold aggressively, helping push the price to the triangle pattern target of $1310.
11. Please click here now. Double-click to enlarge. This dollar-yen chart is arguably the world’s most important chart for gold investors, in the intermediate term.
12. There’s a massive head and shoulders top pattern in play for the dollar, and if the dollar can’t stage even a modest rally against the yen, gold will not suffer the major correction that most analysts are waiting for.
13. If the dollar declines further against the yen, while an Indian duty cut occurs, gold could stage a powerful “overshoot” move, well beyond the $1310 target zone, and closer to $1400.
14. It’s likely an unspoken truth in the Western gold community, that almost every analyst was caught off guard by the enormous gold price rally that followed Janet Yellen’s interest rate hike. In contrast, I calmly predicted it. Most of these analysts are now trying to claim some kind of “final low” has appeared, and they are waiting to buy a correction.
15. Unfortunately, they may be left behind, holding little or no exposure to gold, as the rally not only continues, but intensifies.
16. If Janet Yellen doesn’t raise rates in March, it will cause institutional investors to buy gold, based on their view of a more dovish Fed.
17. If she does raise rates, it will cause an even bigger rally in gold, because it will cause a panic out of the dollar and global stock markets, into the yen and gold safe haven markets.
18. Please click here now. The good news for gold is starting to arrive faster than rabbits make babies. Hong Kong is a huge market, and one that is highly trusted by institutional investors.
19. As Hong Kong creates more partnerships with China, Western institutional investors will be keen to participate, creating even more demand for gold, as mine supply remains quite static.
20. Please click here now. Double-click to enlarge this spectacular GDX daily chart. I’m predicting that the inverse head and shoulders pattern that is forming now will probably come to be viewed as one of the greatest chart patterns of all time.
21. The $200 gold price rally has been a “game changer” for the bottom line profits of many gold and silver mining companies. There are a myriad of junior stocks that have rallied 100%, 200%, and more, just since December.
22. From an Elliot Wave Theory (EWT) perspective, gold, silver, and related stocks may now be rallying in a “C wave”. Of all the Elliot waves, the C wave moves the price by the largest amount, in the shortest amount of time.
23. The C wave is like a siren on the rocks for investors who are not invested, but want in. It tends to “goad” investors into expecting a correction, when rally intensification is the theme in play. When a C wave process begins to unfold, shorting needs to be held to a “bare bones minimum”, particularly when the market in play is gold.
24. The bottom line for gold stocks is this: GDX may pause in the $21 area, but investors should not be booking anything other than very light profits, until my $27 – $30 target zone is acquired!
Stewart Thomson of Graceland Updates, Guest Contributor to MiningFeeds.com

One day before the PDAC begins, on March 5th, this year’s Subscriber Investment Summit will be held at Hilton Toronto. In the past, the Subscriber Investment Summit has been a must-attend conference event, featuring leaders in the junior resource space, such as North Arrows Minerals CEO Ken Armstrong, Paul Begin of Continental Gold, CEO.ca‘s Tommy Humphreys, Peter Ball of Columbus Gold, among many others.
This year’s Subscriber Investment Summit proves to be once more a must-attend event.
During the 2016 Subscriber Investment Summit, 14 of the top resource CEOs will be presenting, along with 5 keynote speakers.
Keynote speakers will include some of the top fund managers and mining analysts, including:
Nathan Weiss – who runs Weiss Research, an institutional research product that tracks energy, and particularly clean energy, trends;
Eric Coffin – editor of the HRA Journal;
Keith Schaefer – editor of the Oil and Gas Investments Bulletin;
Zachary George – founder of activist hedge fund FrontFour Capital;
Tommy Humphrey – editor and founder of CEO.ca, who will be speaking about technology and its impact on investing.
In addition to these keynote speakers, CEO’s from 14 hand-chosen resource companies will be speaking at the Summit, including CEOs from:
- Painted Pony Petroleum
- Tamarack Valley Energy
- Nevsun Resources
- Arena Minerals
- Continental Gold
- Crius Energy
- Erdene Resource Development
- Lithium X Energy
- Marquee Energy
- Morien Resources
- NexGen Energy
- NovaCopper
- Renaissance Oil
- SilverCrest Metals
The summit’s venue will be the Hilton Hotel in Downtown Toronto (University and Richmond) on Saturday, March 5, 2016 – 9:00am-4pm.
Visit www.subscribersummit.com for more information. Reserve your tickets now here.

The gold miners’ stocks have soared this year as investors flock back into this long-abandoned sector. Many traders wonder if these eye-popping gains are merely the product of fleeting sentiment that could reverse anytime, or are supported by strong underlying fundamentals. With the gold miners reporting their latest quarterly operating results, this extensive new data offers great insights into gold mining’s fundamentals.
By law, publicly-traded companies must file quarterly earnings reports four times a year. These yield a treasure trove of valuable information for traders, and are easily the single-most-important contribution to financial-market transparency. The Securities and Exchange Commission requires companies traded on the US stock markets to file quarterly earnings reports no later than 45 days after their quarters end.
For reasons that mystify me, the gold miners love to push this limit. Despite having modern computer accounting systems that can produce final numbers within days of quarters ending, most of the gold miners report 4 to 6 weeks after quarter-end. Rather ironically, many issue press releases within a week or two after quarter-end that contain some of the key information to later be included in their quarterly reports.
So 6 weeks after every quarter-end, I like to dig into the operating results of the world’s best gold miners to get a better feel for how this industry is faring fundamentally. But unfortunately, there’s an exception to the SEC rules for the fourth quarter. They extend the reporting deadline out to 90 days after the end of that particular quarter. So naturally many of the already-slow-to-report gold miners take advantage of this slack.
As an investor, the idea of Q4 results coming out near the end of Q1 irritates me to no end. With plenty of gold miners reporting way out in mid to even late March, their Q4 data is practically ancient history by then! But as a CPA and former Big Six auditor, I understand the Q4 delay. Producing annual reports, or 10-Ks in SEC terms, is far more time-consuming than the much-smaller quarterly reports known as 10-Qs.
The 10-Qs filed during the first three quarters use unaudited numbers, so there’s no need for CPA firms to investigate and sign off on them. 10-Ks require fully-audited results, and the months after Q4 are the busy season for auditing where CPAs are swamped. And the vast array of data and analysis included in 10-Ks takes way longer to collect, organize, proof, and publish than the rest of the year’s quarterly reports.
So doing my quarterly analysis of gold miners’ operating results is more challenging after Q4 because less data is available. But I’d much rather use what’s out there now than wait until the very end of Q1 to take a look at Q4’s results. Many gold miners issue press releases summarizing key Q4 results even before they file their 10-Ks, so they’re a great source of early data. And Q4 was exceedingly important for gold miners.
With gold soaring as high as 17.5% year-to-date last week, and the flagship HUI gold-stock index literally skyrocketing 62.4% higher in less than a month, the psychology in this sector has shifted radically from Q4. Remember that was a horrendous hyper-bearish sentiment wasteland, where everyone was utterly convinced gold and its miners were doomed. That all swirled around the Fed’s imminent rate hikes.
Despite history showing that Fed-rate-hike cycles are bullish for gold as I proved before the December hike, American futures speculators were convinced otherwise. So they pounded gold relentlessly from late October after the Fed indicated a December rate hike ending 7 years of ZIRP was indeed likely. By the day after that hike, extreme record futures selling had crushed gold to a dismal 6.1-year secular low of $1051.
Gold’s average price in Q4 was just $1105, the worst since Q4 2009. This was widely believed to be an existential threat to gold mining. As recently as last summer, $1200 gold was erroneously seen as the breakeven level for the gold industry. So the HUI was hammered to a brutal 13.3-year secular low in November, even though gold miners’ Q3 operating results argued such levels were fundamentally-absurd.
Thus Q4 2015 was arguably one of the toughest quarters gold miners have ever faced. While it’s certainly true past quarters many years ago had lower gold prices, mining costs were commensurately lower then too. Q4 was a real test of how the gold miners could function in a super-low-gold-price environment. So I’ve been impatiently waiting for enough Q4 operating results to analyze this industry for over 6 weeks now.
This week I looked into the latest data from every elite gold miner of the dominant GDX Market Vectors Gold Miners ETF. GDX is an outstanding sector benchmark that almost perfectly mirrors that HUI index. I filled a spreadsheet full of the available data from each GDX component company, some of which is summarized in these tables. Considered as a whole, they offer great insights into this industry’s fundamental health.
Each company’s symbol, stock exchange, and weighting in GDX as of the middle of this week is noted. GDX’s managers effectively weight their positions by market capitalization, which is probably the best way to do it since it eliminates any selection bias. Market caps are followed by the quarter from which each company’s data emerged. Again that was problematic due to that loose 90-day deadline on Q4 reporting.


While GDX had 36 component companies as of the middle of this week, only 34 fit in these tables. But they account for over 98.6% of the weighting in GDX, as well as much of the world’s gold mining. These companies mined roughly 11,710k ounces of gold in Q4, or 364.2 metric tons. According to the World Gold Council, total global mine supply in Q4 was 809.8t. So about 45% came from these GDX stocks alone!
The first data column shows each GDX miner’s cash costs per ounce of gold mined. Cash costs have dominated gold-mining financial reporting since the 1990s. They include all direct production costs, mine-level administration, smelting, refining, transport, regulatory, royalty, and tax expenses. That’s what it currently costs to produce each ounce of gold. They are the acid-test measure of gold-miner survivability.
And cash costs were incredibly low in Q4 as the miners tightened their belts in response to the rotten gold prices. They averaged just $587 per ounce across these elite GDX gold miners, 5.0% lower than Q3’s average of $618. This industry cash-cost level is the gold price traders need to fear. As long as gold is trading above $587, the miners can continue producing gold and paying their bills necessary to survive.
Remember at worst in Q4, gold fell to $1051 the day after that Fed rate hike. The gold miners’ stocks were trading near 13-year secular lows on that, at prices last seen in July 2002 when gold was trading near $305 and had yet to exceed $329 in its young secular bull. Yet gold was priced $464 higher than the direct costs of mining it! So obviously the gold-stock Apocalypse the bears cooked up was a pile of crap.
While cash costs are a worst-case-scenario metric for gold mining’s survivability, all-in sustaining costs are far more important for its ongoing viability. Cash costs are misleading because they don’t include many major expenses essential for mining gold. So the World Gold Council introduced AISC in June 2013 to provide investors with a more realistic and representative portrayal of the true costs of gold mining.
All-in sustaining costs include all direct cash costs of mining gold, and much more including corporate-level administration. It’s always been suspect that the high-level people running companies weren’t considered a relevant cash cost. More importantly, AISC include everything necessary to maintain and replenish operations at current production levels. This is critical since gold mines are constantly depleting.
All-in sustaining costs therefore also include exploration for new gold to mine, mine development and construction expenses, remediation, and reclamation. AISC are a far-superior measure to cash costs since they reveal the ongoing cost of maintaining gold output. As long as gold miners can produce their gold at AISC less than prevailing gold prices, they can generate surplus cash flows and profits indefinitely.
In Q4 the elite GDX component stocks reported average all-in sustaining costs of $836 per ounce. That is 3.5% under Q3’s levels. So at gold’s secular nadir of $1051, the gold-mining industry was still able to generate positive cash flows of $215 per ounce mined. And at Q4’s average gold price of $1105, those jump to $269. Contrary to popular belief, despite their ludicrous stock prices gold miners were thriving in Q4!
In order to threaten this industry’s ability to generate positive cash flows while maintaining existing levels of production, the gold price would have had to plummet all the way to $836. While Q4 certainly saw downside gold predictions abound, even the most vociferous bears weren’t calling for such brutally-low gold prices. This fundamentally-sound gold-mining cost structure proves the absurdity of Q4 gold-stock levels.
With this industry able to effectively earn $269 per ounce of gold mined, the idea that it was righteous for gold stocks to trade at levels last seen in July 2002 at $305 gold was far beyond ridiculous. A $269-per-ounce profit represented a hefty 24% margin, heights many industries would die for. As I argued at the time in the dark heart of Q4, the gold-mining sector was the most radically undervalued in all the stock markets!
The gold miners never deserved such extremely-low prices fundamentally, they were truly absurd. So Q4’s entire gold-stock disaster was purely the product of sentiment, a superstorm of popular irrational fear. And excessive fear never lasts, it soon burns itself out after everyone susceptible to being scared into foolishly selling low has already sold. That leaves only buyers, igniting a powerful mean reversion higher.
The gold miners’ Q4 financial reports don’t only include Q4 and full-year-2015 all-in sustaining costs, but their AISC projections for 2016. They’re noted above in the next column. This year the gold miners are expecting AISC to run $866 per ounce. Incidentally, managements have strong incentives to overstate expenses and understate production in forecasts. That way they have room to beat and exceed expectations.
The stock markets often greatly reward companies in all sectors that beat expectations, while punishing those that fall short. Not long ago on February 5th, tech darling LinkedIn plummeted 43.6% in a single trading day after saying its Q1 outlook was lower than previously thought! Gold-mining executives are compensated with stock options and often own sizable equity stakes, thus they’re keen to manage expectations.
So odds are this industry will have AISC in 2016 under its conservative average $866-per-ounce target. One reason is gold mining is very fuel-intensive, so the super-low oil prices driven by oil’s global supply glut will reduce operating expenses. But let’s assume that $866 AISC projection for this year is right. That means the gold miners are going to generate massive cash flows and profits as gold mean reverts higher.
At $1200 gold, $866 AISC yield $334 per ounce in surplus cash flow. And since the majority of mining costs are largely fixed when mines are designed and built, expenses don’t rise in lockstep with gold. If gold rallies just 8.3% to $1300 for example, profits swell 29.9% to $434 per ounce. The leverage to gold that gold miners’ profits and therefore stock prices offer is extraordinary, which makes them so attractive.
This industry’s strong cash flows and cash positions were readily evident in gold miners’ Q4 results as well. The next couple columns show each GDX component company’s cash position at the end of Q4, and its percent of their current market capitalization this week. Not only did many of the gold miners have lots of cash in their darkest quarter, but they generated tons more as quarterly operating cash flows indicate.
As long as companies can produce positive cash flows from operations, and they haven’t been profligate in borrowing, there is no threat to their ongoing viability. And the strong operating cash flows generated by the gold miners even in miserable Q4 with gold languishing near deep secular lows is serious testament to their fundamental health. There’s no doubt gold stocks’ powerful run higher is fundamentally justified!
Last week I published a popular essay exploring gold-stock upside targets derived from a fundamental perspective based on their operating profitability. And even if this new gold upleg somehow stalls out, the gold stocks are overdue to at least quadruple out of their recent deep secular lows! Their new Q4 operating results confirm that outlook, that the gold miners’ stocks still have massive fundamental upside from here.
Such a mean reversion would catapult the HUI from this week’s levels around 150 to 400+, likely within the next year or so. And as gold-mining profitability continues to improve this year as gold continues to mean revert higher, the bullish fundamental case for the gold miners will only grow stronger. I plan to keep updating this research about 6 weeks after every quarter-end, to keep tabs on gold miners’ latest results.
And because Q1, Q2, and Q3 reporting won’t require audited numbers and doesn’t include the arduous process of producing 10-Ks and annual reports, the upcoming 2016 installments on the fundamental state of the gold-mining industry will be much more complete. I’m already really looking forward to the Q1 results, which are almost certain to show exploding operating cash flows on these higher gold prices.
So if you’ve been dragging your feet on investing in gold stocks, it’s not too late. This entire sector was beaten down to such fundamentally-absurd price levels late last year that it still has epic mean-reversion rallying left to do to merely return to some semblance of normalcy. As always, the easiest way to play this super-bullish gold-stock sector is through buying that leading GDX gold-stock ETF or its call options.
But also as always, the gains within this sector will sort out like a bell curve. Some gold stocks will really underperform their peers, most will see average gains, and some will see huge outperformance. These right-end gainers are usually the miners and explorers with the best fundamentals. So there’s no doubt an expertly-picked portfolio of the best of the gold stocks will trounce the broader gains mirrored by GDX and the HUI.
I’ve intensely studied and traded gold stocks for decades now, and there are a surprising number of GDX component stocks that I’m not the least bit interested in owning. I suspect they will be a big drag on gold-stock portfolios. But there are other GDX stocks that have fantastic potential to far outperform their peers, as well as a big universe of high-potential smaller gold stocks that fly below the GDX-inclusion radar.
The bottom line is the gold miners thrived in bleak Q4 despite their stock prices and gold languishing at deep secular lows thanks to horrendously-bearish psychology. This entire industry was producing gold at all-in sustaining costs averaging under $850 per ounce, proving it never faced an existential threat as was widely assumed. Even in Q4’s gloom, the gold miners were generating large operating cash flows.
And this year the gold miners are projecting similar all-in sustaining costs even as gold mean reverts much higher out of last year’s unsustainable extremes. That portends exploding profits as gold’s gains are leveraged. This is exceedingly bullish fundamentally for the battered gold stocks, which still need to multiply from today’s levels merely to reflect today’s gold prices. There are great fortunes still to be won.

Gold took a kicking over the long weekend. It had moved too far too fast, was overbought and needed a correction. But that’s all it is, IMO.
I don’t use a lot of technical indicators, but every once in a while you find one that seems to work. In gold, it’s the 50 week moving average. Why does it work? Only a complete moron would spend more that one second contemplating that question. Probably it works because everyone thinks it does. There are no reasons for these things.
So, here is the chart of the 50 week moving average for gold going back to 2008. When gold got in gear and the bull market resumed, gold traded consistently above its 50 week moving average. When it broke down in late 2012 and slipped into a bear market, gold consistently failed to break above the declining 50 week moving average. Until this year. After last weekend’s bloodletting, it’s still comfortably above the blue line. For my money, gold is in a new bull market until it breaks below that line.


1.Led by oil, the world’s risk-on assets are beginning what could be a fairly significant bear market rally. Bear market rallies tend to be quite violent. They often end very quickly, without warning.
2. Please click here now. Double-click to enlarge. There’s a double bottom pattern in play on this daily bars oil chart.
3. Oil is one of the world’s great risk-on assets, and its price action can be a good lead indicator for other risk-on assets, like the US dollar and the Dow.
4. Please click here now. While production quotas may do more long term harm than good, in the short term, they are fuelling a strong rally in the price of oil.
5. Basis Dow Theory, the US stock market fell into a bear market last week. The Dow Industrials closed below their August closing low. The Industrials could stage a dramatic rally now, but unless the Transports stage an even better performance, a bear market rally is all this will be.
6. Please click here now. Double-click to enlarge. Recently, this daily bars chart of the Dow has shown great similarity to the oil chart.
7. It’s hard to know exactly how high the Dow could go on this rally, but it would not surprise me to see the Industrials make a marginal new high, while the Transports fail to do so.
8. Please click here now. Most analysts are very concerned about the Chinese economy, but I think some of those concerns have been created by predatory hedge funds who have made large bets against Chinese markets.
9. The Chinese economy is suffering “transition pain”, as it moves from an exports-oriented theme, to one of domestic consumption. Growth may be less than what is officially stated in China, but bank loans are strengthening, and that’s adding fuel to the global markets risk-on rally.
10. Please click here now. Double-click to enlarge. That’s the daily bars chart of the US dollar against the Japanese yen. The US dollar is the world’s largest risk-on market, and it is currently rallying towards the neckline of a huge and bearish head and shoulders top pattern.
11. Most amateur investors think the US dollar is a risk-off trade, but major FOREX players know it’s part of the risk-on sector. Japan is the world’s largest creditor, and its savvy citizens are phenomenal savers. In contrast, the United States is the world’s largest debtor, and the citizens tend to embrace excessive debt as a kind of “moral good”. That’s not a good thing, to put it mildly.
12. As professional investors try to get in on the risk-on assets rally, that’s putting some pressure on gold, which is the most important risk-off asset.
13. Please click here now. Double-click to enlarge. That’s the daily bars gold chart. The power uptrend line was snapped by the surge into risk-on assets, and the decline may be forming the elusive right shoulder of large inverse head and shoulders bottom pattern.
14. Please click here now. Top analysts at Deutsche Bank have the same view I do about the bear market in most global equity markets. If the Fed hikes 3 – 4 times this year, as I’m predicting, risk-on assets could begin to stage a bear market meltdown that is reminiscent of 1929.
15. Goldman’s top commodity economist is Jeff Currie. He’s also predicting 3 rate hikes this year. He argues that will pressure gold to the $1000 area before a major upcycle in oil begins later this year. He believes that upcycle would unleash a major rise in almost all commodities, following oil’s lead.
16. I understand Jeff’s viewpoint. I have tremendous respect for his abilities, and for the liquidity flows he can create with his statements, but he thought gold would tumble when the Fed raised rates. Instead, exactly as I predicted, rate hikes created a panic out of lead risk-on markets like the Dow and the dollar. That created a huge surge into the lead risk-off markets of gold and the yen.
17. Please click here now. I don’t think Bloomberg has all the facts about what is happening in India. There is a lull in buying, but the gold price rally is only part of the reason for that lull. In the bigger picture, the national budget is scheduled for release within about two weeks. Most jewellers expect the gold import duty to be cut from 10% to the 2% – 4% range.
18. Against the background of a serious rally in the gold price and the prospect of a duty cut, most Indian buyers have ceased their buying, and they will stay in “cold” mode, until that budget is released.
19. Tactics? The Western gold community needs to prepare for the unexpected, and gold certainly could trade in the $1000 area, as Jeff Currie predicts it will. In the current situation, put options on gold, bought as portfolio insurance, are a fearful investor’s best friend.
20. If Janet Yellen raises rates repeatedly and relentlessly, like both Jeff Currie and I are predicting, he may be correct that gold declines to $1000 before moving higher, or I may be correct that risk-on assets resume their bear market, and gold and the yen stage powerful rallies. Put options keep the investor protected, yet in the upside game, regardless of whether Jeff’s scenario or mine is the one that happens.
21. Also, my GDX and gold trading service at www.guswinger.com has performed spectacularly well during the “gulag” action of the past year, as well as during the huge rally of 2016. Send me an email to stewart@gracelandupdates.com and I’ll send you the track record in Microsoft Excel format. A trading account is not a replacement for physical bullion and quality gold/silver stocks. It is a good way for the investor to diversify their tactics, in the world’s greatest asset class.
22. Please click here now. Double-click to enlarge this phenomenal GDX daily bars chart. I suggested that GDX would stage a violent upside rally from the wedge pattern, and that has happened.
23. A budding major uptrend is now in play, and so is a potentially very bullish inverse head and shoulders bottom pattern. To view that scenario, pleaseclick here now. Double-click to enlarge. The price action is superb, and as more right shoulders are formed, GDX should move steadily higher.
24. Gold stocks get a “bad rap” from the mainstream community (MC), but the reality is they are part of the risk-off gold market. Gold mining itself is inherently risky, because the product mined is so difficult to find. That doesn’t change the fact that the gold sector is a risk-off market, and gold stocks will be bought as institutions pour out of risk-on markets like the dollar and the Dow!
Stewart Thomson of Graceland Updates, Guest Contributor to MiningFeeds.com

US manufacturing sales on a seasonally-adjusted basis have fallen for 17 consecutive months and are now down more than 8% below the July 2014 peak. December 2016 manufacturing sales were at the same level as November 2011, obviously a story of stagnation rather than the economic recovery the Fed keeps yammering about. Total sales in 2015 were $258 billion less than 2014–$5.738 trillion vs. $5.996 trillion. That’s despite record car sales in 2015. And what’s worse, inventory at the manufacturing level continues to pile up despite declining production.
Now, the main stream economists will admit these numbers aren’t great but they argue that they don’t matter because “manufacturing is only 12% of the economy”. But it’s all in how you measure things. GDP measures final sales and manufacturing accounts for 12% of final sales. But that leaves out all the intermediate goods sold by one business to another. You buy a car and that is a final sale captured in GDP. The car maker bought seat belts and tires from other companies but those sales don’t count in GDP.
The US GDP is currently estimated at about $18 trillion. Manufacturing sales are estimated at $5.7 trillion. So, really, manufacturing represents around 32% of the economy, or maybe a little less after eliminating double counting.
Now, can you have a recession in 32% of the economy and not be in a recession economy-wide? Oh, and by the way, manufacturing pays higher-than-average wages and accounts on average for about 60% of S&P 500 corporate earnings. The answer is no, you cannot have an 8% downshift in US manufacturing sales without an economy-wide recession. Employment, wages, retail sales…all of it goes down, maybe not all at once, but in fairly quick succession.
The Fed says there is minimal chance of a recession this year. But I think we are already in one. Let’s compare against past recessions.
Manufacturing sales fell by a little more than 10% during the 2001-2 dot-com recession. The decline spanned 14 months from peak to trough. Inventory levels fell during that period so the decline in sales came to a halt. By the middle of 2002, both sales and inventories were back on the upswing although very slowly at first. The problem now is much greater. Sales are already down 8%, orders and production volumes have all declined and have been for almost a year and a half but inventories are still growing.
The December 2015 inventory data was released last Friday (February 12, 2016). Manufacturing inventories rose another 0.2 percent in the month. In fact, inventory levels have been rising since 2011 and the rate of growth is actually accelerating. This cannot continue.

Only in the Great Recession were manufacturing inventories in worse shape. Manufacturers are going to cut inventories by producing less than they sell, to restore balance. That’s what recessions are all about. Investors beware. The stock market does not do well in recessions.
Last week we focused on the gold stocks. There was more initial evidence of a new bull market there than in Gold. However, Thursday Gold erased some doubts as it rocketed above $1200/oz and to as high as $1264/oz before settling a bit lower. That move puts Gold’s recovery on par with those following past major lows and offers greater confirmation that a new bull market is underway.
The chart below plots the recoveries from 1976 and 2008 and puts them on the same scale as the current rebound. Note how those recoveries surged well above $1200/oz within three months. Moreover, note how $1200/oz served as a pivot point for those two recoveries within two months before pushing much higher. Gold does not have to zoom to $1400/oz in the next few months to validate the new bull market. It’s more important that it holds above $1200/oz in the weeks ahead.

In addition to $1200/oz, $1180/oz is also a very important level. It has marked resistance and support numerous times in recent years as well as during 2009 to 2010. A monthly close above $1180/oz, which also surrounds the 20-month moving average is another sign that the bear market in Gold is over. February is only half over but Gold appears poised to close above $1180/oz.

Meanwhile, Gold continues to show impressive relative strength against foreign currencies and equities in particular. Gold against foreign currencies is at a 10-month high and could soon test a 3-year high. (We should also note Gold relative to emerging market currencies is at a 34 month). Gold against the NYSE hit more than a 2-year high this week. Note how these ratios have surged well above their 400-day moving averages which will now be support. This relative strength reflects that this move in Gold extends far beyond US$ weakness.

Unless Gold somehow loses its gains and closes February below $1180/oz then there is no reason to doubt a major trend change and new bull market. Gold is very strong in real terms and has been for weeks. Gold’s recovery is now on par with past recoveries and the metal has taken out key resistance at $1180/oz. Last week we concluded: While we have some concerns on the metals we should note that the miners lead at major turning points. The miners are telling us something has changed. There will be pullbacks and periods of consolidation but the forever bear market is over.

By now, we all know that central bank asset purchases (known as Quantitative Easing or QE) have failed to boost the economies of all the jurisdictions that have done them—Japan, the Eurozone, Denmark, Sweden, Switzerland and the US, to name names. The new, new extreme central bank plan to spur economic growth is negative interest rate policy (NIRP).
Ten-year Japan Government Bonds closed on February 8, 2016 at a record low yield of minus 3.7 basis points, the result of this new NIRP policy adopted by the Japanese Central Bank. By the latest count, roughly $6 trillion worth of sovereign debt worldwide now trades at negative yields, most of it in Europe.
This is nothing short of insane. The madness starts from the ridiculous premise that economic growth comes from consumption, not savings and investment. The very heart of the capitalist system—the only system that has ever generated significant economic growth—is savings and investment in productive enterprise. Negative interest rates destroy the value of savings and discourage real investment in favour of useless speculation. The time value of money is the logical foundation of our economic system—that savers are paid interest to defer consumption.
The sovereign debt market is not the only victim of NIRP. The central banks of the Eurozone, Switzerland, Sweden, and Denmark now charge interest on deposits they hold from commercial banks. Not surprisingly, these commercial banks are now beginning to charge interest on deposits they hold from their customers. Meanwhile, governments worldwide as well as organizations such as the IMF, BIS and OECD are actively promoting the idea that cash should be eliminated to cut off funding for terrorism and crime. So, dear reader, you can look forward one fine day to having all your savings locked into the banking system, being charged whatever interest rate the banks think is appropriate. Gold anyone?
Now, you may think this can’t happen here in the North American land of freedom and good government. Think again. Both the Federal Reserve and the Bank of Canada have endorsed the concepts of NIRP and a cashless society.
The Federal Reserve is telling banks to prepare for NIRP, for the first time requiring banks to include the possibility of negative-yielding Treasuries in their stress tests. Several high-ranking Fed officials have recently discussed the idea. In a speech last week, Fed Vice-Chair Stanley Fischer said Europe’s experiment with negative rates is “working better than I expected.”
The February 10, 2016 edition of the Wall Street Journal quotes J.P. Morgan’s economics team led by Malcolm Barr who says euro-area rates could drop to negative 4.5%, U.K., rates could go to negative 2.5% and the U.S. to negative 1.3%.
Negative rates in the U.S. would likely begin with the interest paid on excess reserves that banks store at the Fed, a number currently at $2.15 trillion that is currently earning 0.5 percent interest. The idea would be to charge banks to store reserves. This move would likely result in negative rates on the $2.75 trillion in money market funds used by banks and governments to fund their operations. From there, it wouldn’t take long for the commercial banks to adopt negative interest rates for customer deposits. The hardest hit would be the pension plans that depend on interest to meet their obligations to retirees.
What would you rather depend on for your retirement? Personal savings in money market funds, private pension plans and social security programs, all protected by your friendly national government, or physical gold held outside the banking system?
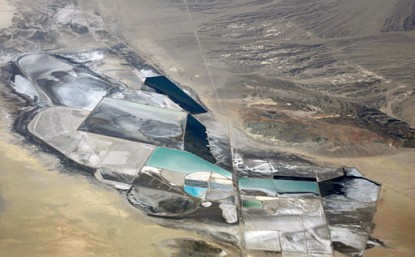
Pure Energy Minerals (TSX-V: PE) / (OTC: HMGLF) / (Frankfurt: AHG1) is the second most advanced Nevada (NV) lithium junior. The Company is advancing its Clayton Valley Project, one of very few brine-based lithium projects outside of South America. In my opinion, the dozen or more juniors owning, controlling, optioning or attempting to earn into prospective lithium-bearing property in NV, are 24-36 months behind. The Company has assembled a land package of just over 9,300 acres next door to the only producing lithium brine mine in North America. Pure Energy has been entirely focused on Esmeralda County, NV lithium opportunities since 2013. [All in C$] [Please see Corporate Presentation]
With the exception of Western Lithium, only one other NV junior has completed meaningful exploration work. Like Pure Energy, Dajin Resources is one of the earlier lithium settlers in the State. Based on press releases by Dajin, it is probably 12-18 months ahead of the pack.
Pure Energy stands out by having delineated a NI 43-101 compliant Inferred Resource of 816,000 Metric tonnes Lithium Carbonate Equivalent (LCE). This Spring, the Company plans to deliver an updated resource report followed by a Preliminary Economic Assessment (PEA) several months later. The Clayton Valley project, adjacent to Albemarle Corp’s Silver Peak brine operation, has made great strides towards possibly becoming the nation’s next source of lithium.
By contrast, most new entrants have barely moved the ball forward. Admittedly, a select few presumably have favorable attributes, cheap stocks or attractive long-term call option value. Pure Energy is different, it has de-risked its project a lot compared to peers. Make no mistake, investments in aspiring lithium companies, including Pure Energy, are highly speculative. Still, I strongly believe that the Company’s current valuation offers investors a compelling risk adjusted investment opportunity.
While Pure Energy’s valuation is above most in NV, it’s well below the valuations of Canadian & Australian-listed lithium companies. The top 7 pre-production peers have an average market cap of about $142 million. Pure Energy’s market cap of $35 million is one-fourth the average.
Pure Energy has considerably more blue-sky potential than higher valued, pre-production peers. Although others might be closer to production, Pure Energy is trading at a 75% discount. I ask readers, which stock has more potential upside over the next 6-12 months, Australia-listed producer Orocobre Ltd or Pure Energy? My bet is on Pure Energy. I think the stock price could double or triple before Orocobre’s stock was up by 50% or 100%. If the Company’s valuation were to double, commensurate with Orocobre’s moving 50% higher, the Company would trade at just one-tenth that of Orocobre’s valuation.
Readers are encouraged to compare Pure Energy’s status with that of other popular lithium juniors. To reiterate, the Company has a higher valuation, but the premium is warranted. Readers beware, in many cases lower valuations are not what they appear. How many capital raises might earlier-stage peers need to catch up to where Pure Energy is today?
If readers take nothing else away from this bullish article, consider this; an investment in Pure Energy allows shareholders to have their speculative lithium cake, and eat it to. Like those with lower valuations, Pure Energy’s upside potential is tremendous, however, unlike peers — the Company’s fundamental downside is much lower (my opinion only).
How many Nevada juniors can boast these accomplishments?
++ Pure Energy has delivered a NI 43-101 compliant Inferred resource report of 816,000 Metric tonnes Lithium Carbonate Equivalent (LCE).
++ Pure Energy is working closely with two industry leaders (Bateman Advanced Technologies & POSCO), developers of cutting edge lithium processing technologies. [Scroll down for excellent video of Bateman’s technology]
++ Bateman will soon be testing representative brine from Pure Energy’s Clayton Valley project at its mini pilot plant in Israel. Data generated from testing is expected to enable Pure Energy to report preliminary estimates of op-ex & cap-ex.
++ Pure Energy entered into a conditional 5-year lithium hydroxide supply agreement, sourcing products from Clayton Valley to deliver to the Giga-factory, located 3.5 hours away. The Company remains on track to report an updated NI 43-101 compliant resource within 60 days and deliver a PEA several months later.
++ The Department of Energy has released the remaining funds for Pure Energy’s work with SRI International (a research & innovation center), to develop novel cost-effective methods for lithium extraction from geothermal brines.
++ The University of British Columbia & Pure Energy received a grant from the Natural Sciences & Engineering Research Council of Canada. [Please see Corporate Presentation]
These ongoing collaborations / milestones and the pending resource report, followed by a PEA, demonstrate that Pure Energy has advanced well beyond peers. Time is money, a prime property in southern Nevada’s “Lithium Hub,” with a 3-year head start, is worth a sizable amount to larger companies looking to expand or enter the lithium sector. Pure Energy is ideally positioned to sign on with a strategic partner to pursue value-creating corporate initiatives. The ability to commence operations this decade is likely of paramount importance to a number of potentially interested parties.
Conclusion
Given the incredible strength in lithium prices over the past several months, (reports of a tripling in certain spot prices), any lithium junior fortunate enough to reach commercial production, would have the world at its feet. However, a lithium junior with a market cap of, $5 to $20 million, still facing significant and unavoidable dilution on the path to PEA, may not be as attractive as it appears. Instead, a relatively more advanced player, like Pure Energy Minerals (TSX-V: PE) / (OTC: HMGLF) / (Frankfurt: AHG1), less than 6 months from a PEA, offers a very compelling risk-adjusted investment opportunity.
Disclosures: Many of the companies mentioned have small market caps, including Pure Energy Minerals. Small market cap stocks are highly speculative, not suitable for all investors. I, Peter Epstein, own shares of Pure Energy and Dajin Resources. Mr. Epstein, CFA, MBA, is not a licensed financial advisor. Readers should take that fact into careful consideration before buying or selling any stocks mentioned.
Readers are encouraged to consult with their own investment advisors before buying or selling stocks, especially speculative ones. At the time that this article was posted, Pure Energy Minerals & Dajin Resources were sponsors of: http://EpsteinResearch.com. Please consider visiting: http://EpsteinResearch.com for free updates on small caps across a range of sectors. While there, enter an email for instant updates. Thank you for your support.
The gold stock sector has started to move and my clients and I are loaded up. This last week, most of the companies have had a good run although there is much more to go. Did you know this or are you fixated on yesterday’s bull market on NASDAQ?
I think gold has begun to move into a new bull market which will last several years and create lots of 10 baggers. This is how the markets work. There is always a bull market somewhere but investors miss it because they are still focussed on the dying bull of yesterday. Gold is the mirror of the stock market and like all mirrors, it operates in reverse. While NASDAQ soared, gold stocks were killed. Now the shoe is going on the other foot.
The great thing about bull markets is that you can make mistakes and still be fine, as long as your mistakes are from the long side. You can buy after a run higher and still win if you are patient enough to wait out the inevitable corrections. And if you are careful, you can buy the underperforming junk and do really well as long as you buy good management. You can’t buy junk in a bear.
The gold sector always has some underperformers that are being punished for what they did in the past but no longer do. Kinross is a good example. Previous management made two grievous errors. First, they wildly overpaid for assets at the top of the market. As the gold price declined, their financial statements were a sea of red. Second, they went big into Russia at a time when Russia was the wild west of property rights; if a well-connected Russian liked what you owned, he stole it.
Both of these negatives have been fully discounted in the share price and then some. Meanwhile, the management has changed and the company has put its house in order: capital spending has been scaled back; operating costs have been cut; new projects have been acquired at a good price in mining-friendly Nevada; and Russia has become a much better (not perfect) place to be. In fact, with the collapse of the rouble, Russia is a very inexpensive place to operate and the government actually believes in the importance of gold. In short, Kinross is an undervalued turnaround—perfect for the investor who thinks he may have missed the first leg of a new bull market.
For a great write-up (and way more detail), see Pater Tenebrarum’s A Senior Canadian Gold Producer Worth a Close Look at http://www.acting-man.com/?p=42982.

BHP Billiton has been having an incredibly hard time in the market, and has been for quite some time. As you can see from the chart above, the downtrend has been happening for more than 6 months. So, what’s causing the value of the company to decline? Ultimately, it’s the downturn we’ve seen in the value of metals like iron and steel. Today, we’ll talk about why iron and steel have seen such a dramatic decline in their values, how long declines are likely to last, and what we can expect to see from BHP Billiton moving forward.
Why We’ve Seen Big Declines In Iron And Steel
The declines in the value of iron and steel are for a very good reason. The reason is economic conditions. If you look around the world, it becomes clear that global economic conditions are on the brink of disaster. Europe, Japan, Brazil, and most importantly for this particular story, China are all on the brink of disaster. There are two reasons China is so incredibly important for this story. First and foremost, China is the world’s second largest economy. So naturally, when China isn’t doing well economically, we can expect to see declines around the world. Another, perhaps more important fact about China is that it is the world’s largest producer of raw materials. This means that when China isn’t doing well, steel and iron, metals that are mined by BHP Billiton aren’t in as high of a demand in the country; leading to declines in the values of these economies and BHP Billiton as a result.
 Source: anyoption
How Long Are The Declines Likely To Last?
While I’d like to say that we’ve reached the end of the issue, I have to be honest here, that simply doesn’t seem to be the case. The reality is that the declines are rooted in fundamentals, not sentiment. When declines are rooted in fundamentals, it’s usually a sign that they are going to last for quite some time, and this case is no different. As mentioned above, the declines on the stock are being caused by economic conditions and the drag these conditions are causing on commodities. While several economies play a role, China is the leading driver of the downward movement. Looking at market and economic conditions in China, it’s clear to see why I’m not expecting to see much by way of improvements.
Last year, we saw quite a bit from China as the country’s economy started to spiral out of control. To solve the problem, China surprisingly reduced the value of its currency. At this point, many experts expected that the move would work to stimulate economic growth. However, that’s not what happened at all. In fact, from there, things got worse. Since then, the People’s Bank of China has made several moves to no avail.
What We Can Expect From BHP Billiton Moving Forward
Moving forward, I’m not expecting to see much by way of positive activity out of BHP Billiton. Unfortunately, the commodities market is in the dumps at the moment, and given the fact that the company deals in mining, the stock is likely to feel the pain. The reality is that the declines, rooted in fundamentals and based on economic conditions aren’t going to end in the commodities market any time soon. As a result, we simply can’t expect to see much from BHP.
What Do You Think?
Where do you think BHP Billiton is headed moving forward? Let us know your opinion in the comments below.

1.Gold has stunned most of the world’s analysts with a major rally after Janet Yellen hiked rates. The citizens of China also appear to have greatly increased their buying.
2. In the past few days, instead of waning, this rally has relentlessly intensified. Some gold stocks are showing 100%+ gains, just since the start of the year!
3. Chinese citizens always tend to increase their gold buying ahead of Chinese New Year, but turmoil in the Chinese stock market this year appears to be causing them to buy much more gold than they normally do.
4. Also, some leading commodity economists have suggested oil will begin a new up cycle later this year, and other commodities will lag, but ultimately follow. In response, many institutional money managers seem to be rushing to buy commodities now, to stay ahead of the crowd.
5. To view what is probably the most powerful gold price driver in the world right now, please click here now. Double-click to enlarge. That’s daily chart of the risk-on US dollar versus the risk-off yen.
6. A huge head and shoulders top pattern is in play, and yesterday the neckline broke, creating panic selling of risk-on assets, and panic buying of both fiat and bullion safe havens.
7. I realize that most analysts in the gold community were stunned when Janet Yellen raised interest rates, and even more stunned when gold began to rally after she did. In contrast, none of this is any surprise to me at all.
8. I predicted Janet would raise rates, causing a meltdown in global stock markets, and a huge gold price rally. That’s exactly what is happening.
9. Most gold analysts look at the dollar index, the USDX. That’s a mistake. What matters to gold is the action of Japanese fiat versus American fiat. Japan is the world’s largest creditor nation. America is the largest debtor. Most global carry trades are settled in yen.
10. Also, Japanese citizens are maniacal savers, while most American citizens are notorious debt worshippers. That’s all the information any investor needs, to understand why the largest FOREX traders view the yen as risk-off fiat, and view the US dollar as risk-on fiat.
11. Please click here now. The tumbling price of oil is enhancing the yen as the world’s top safe haven fiat. That’s creating a huge institutional rush into gold!
12. Please click here now. Double-click to enlarge. That’s the daily oil chart. While oil may trade sideways for a few weeks, the IEA now reports that demand growth has started to drop substantially, while supply from OPEC rises.
13. A fresh decline in the oil price seems imminent, and that could create more problems for US dollar investors, and for stock market investors. The yen, gold, silver, and precious metal stocks are becoming the world’s go-to save haven assets!
14. It’s hard to know how Chinese investors will react to all this “markets mayhem” when their markets reopen tomorrow, but with the neckline broken on the dollar-yen chart, the danger faced by all risk-on investors is enormous.
15. Janet Yellen is also scheduled to make a speech to the US government tomorrow. In it, I expect her to give the government a subtle chiding, for refusing to “cut the fat”.
16. Fed policies are not as effective as they were decades ago, mainly because the US government’s size has become a huge financial ball and chain.
17. Rate hikes are not about “normalizing Fed policy”. They are about pressuring the US government to downsize.
18. More rate hikes are coming, and when Janet unveils them, more mayhem is coming to risk-on markets around the world, including the dollar.
19. Please click here now. Double-click to enlarge. That’s the daily gold chart. The good news is that gold may be forming a large inverse head and shoulders bottom pattern.
20. While a price drop to form the right shoulder of the pattern may make investors feel uncomfortable, the dollar-yen chart price action suggests the pullback for gold may be milder. Please click here now. Double-click to enlarge. This gold price scenario is very likely, if the risk-on dollar continues to tumble against the risk-off yen.
21. Please click here now. Double-click to enlarge. That’s the GDX daily chart, and the price action is superb. I predicted that a breakout from the huge bull wedge pattern was imminent, and it has occurred.
22. Now it appears that GDX is forming a large inverse head and shoulders bottom pattern, much bigger than the one taking shape on the bullion chart.
23. Please click here now. Double-click to enlarge. That’s the daily SIL chart. Silver stocks had a rough start to the year, because silver is an industrial metal as well as a precious one.
24. When modest risks appear, silver can lag gold. That was the case in early January. Now, much bigger risks are presenting themselves, and powerful FOREX traders are rushing out of all risk-on markets, and into both gold and silver. As the risk-on dollar begins its next leg down, silver enthusiasts can expect to see their favorite metal perform at least as well as gold, and perhaps even better!
Stewart Thomson of Graceland Updates, Guest Contributor to MiningFeeds.com

Gold and its miners’ stocks are rocketing higher as speculators and investors alike return to this left-for-dead sector. This sudden deluge of capital inflows has crowned gold stocks the best-performing sector of this young new year by far, shocking traders. And this stunning reversal of fortunes in both the metal and the companies producing it is only starting, so it’s exceedingly important to understand what’s going on.
Gold was inarguably the world’s most-hated investment in recent years. No one wanted anything to do with it, because no one felt any need for it. The world’s stock markets were relentlessly levitating, thanks to record easing by the world’s elite central banks. And with stocks seemingly destined to do nothing but rally indefinitely, there was little demand for counter-moving gold for prudent portfolio diversification.
But as global stock markets started sliding in 2016, the bubble in central-bank confidence rapidly started to burst. Central banks indeed quickly stepped in to try and stave off the waves of selling, but to no avail. Extreme central-bank jawboning and actions that would’ve dramatically goosed stocks in years past failed to have much impact, helping shake traders awake from their years-long central-bank-induced stupor.
These newly-alert traders started remembering that markets are forever cyclical, they can’t move in a straight line forever. What’s high and in favor after rallying for years will inevitably roll over and head the other way, a bearish portent for central-bank-levitated stocks. Conversely what’s low and out of favor after years of selling will inevitably mean revert higher. Thus investment demand for gold is rekindling.
The dazzling 2016 gold story truly is that simple. Stock markets are rolling over into a long-overdue new cyclical bear that central banks artificially held at bay for years. So investors are diversifying into gold, which generally moves counter to stocks. And with investors migrating back, speculators are flocking in as well to ride gold’s momentum. With this strategic context in place, let’s dig into what’s been moving gold.

The recent seeds for 2016’s new gold upleg were sown late last July. Years of central-bank-levitated stock markets had left gold with major secular support between $1150 and $1200. As gold slumped to the lower end of that zone in its usual summer doldrums, a large bearish speculator decided to press his bets in spectacular fashion late one lazy Sunday evening in July in a record gold-futures shorting attack.
Within one minute around 9:30pm, nearly 24k gold-futures contracts controlling about $2.7b worth of gold were sold short! This brazen attempt to shatter gold’s support worked, blasting it almost $50 lower in that single minute. With $1150 broken, gold would drift down near $1084 by early August. But with bearish futures speculators’ selling exhausted, gold rebounded sharply in what would become a multi-month uptrend.
The American futures speculators who dominantly manhandled gold in 2015 had been overwhelmingly bearish on the yellow metal. Their core thesis was very simple. Since gold yields nothing, the coming Fed rate hikes would decimate investment demand for this metal. Higher yields in bonds would make zero-yielding gold even less attractive, and the resulting capital flight would smash gold way under $1000.
The Fed’s Federal Open Market Committee meeting in late October played right into this bearish-gold outlook. The very morning of that decision, gold was trading near $1182 and had more than recovered its record-shorting-attack losses. But the FOMC surprised that day coming across as very hawkish, by declaring it might very well hike rates for the first time in a decade at its next meeting coming in mid-December.
So American futures speculators dumped gold with a vengeance, at rates so extreme several major new all-time records for gold-futures selling were hit. That frenzied gold-futures selling petered out by early December, with gold pounded back down near $1053. There were almost no gold bulls left, with even those who called themselves bulls universally predicting another drop down into the $800s before gold bottomed.
But for a handful of contrarian students of the markets including me, this was supremely irrational. Gold too is forever cyclical, its price can’t fall forever. And with literally everyone hyper-bearish on this metal and utterly convinced it was doomed to keep spiraling lower indefinitely, peak fear had to be near. When a trade gets that epically one-sided, everyone susceptible to being scared into selling low has already sold.
And the seemingly-logical core case for this extreme gold bearishness, that a new Fed-rate-hike cycle would devastate zero-yielding gold, was totally false historically! I started researching gold’s behavior during past Fed-rate-hike cycles last summer. If higher rates indeed suck capital out of gold, that would be crystal-clear in the historical record. Surely the gold-futures speculators had done their homework, right?
It turns out there have been 11 Fed-rate-hike cycles since 1971, a large sample size over many decades. On average during the exact spans of all 11, gold rallied 26.9%. In the 6 where gold climbed, its average gains were a staggering 61.0%! And in the other 5 where gold retreated, its average losses proved to be an asymmetrically-small 13.9%. Historically Fed-rate-hike cycles were actually exceedingly bullish for gold!
The lower the gold price when a Fed-rate-hike cycle is launched, and the more gradual that cycle’s hiking, the bigger gold’s gains within it. With the Fed’s imminent rate-hike cycle coming with gold near major secular lows, and promised to be the most gradual ever, it was hard to imagine a more bullish scenario for gold. Yet the goofy futures speculators were so caught up in their masturbatory groupthink they were blind.
These traders make mind-bogglingly-risky hyper-leveraged bets where they can double or lose all their capital with a mere few-percent move in gold. They can’t afford to trade on bad information. Yet they didn’t even remember that gold soared 50% higher during the last rate-hike cycle between June 2004 to June 2006, where the Fed more than quintupled its federal-funds rate to 5.25% through 17 consecutive hikes.
Believe me, I didn’t keep this critical research to myself. I originally published it in an essay back in early September, and deepened it considerably in mid-December just days before that FOMC meeting. I did everything I could to alert investors and speculators to the epic contrarian opportunity in gold, and was ignored, mocked, and ridiculed for it. People hate hearing when they are wrong for succumbing to groupthink.
The Fed indeed hiked rates for the first time in 9.5 years in mid-December, the very event that American futures speculators had long been waiting for to crush gold. And the next day gold indeed suffered a kneejerk plunge, falling 2.1% to a marginal new 6.1-year secular low of $1051. But in the subsequent days leading into year-end, gold didn’t collapse. That was a massive clue consensus was dead wrong.
On New Year’s Eve when gold remained loathed and closed at $1060, I published an essay “Fueling Gold’s 2016 Upleg”. In it I explained why “gold is poised for a mighty upleg in 2016”. Speculators had to do vast gold-futures buying to mean revert their excessively-bearish bets back to normal levels, and investors had to do vast gold buying to mean revert their own meager gold portfolio holdings to normal levels as well.
And that’s indeed coming to pass already, just as I advised investors it would. During the first 4 weeks of 2016 for gold-futures speculators, they boosted their long holdings by 22.3k contracts while slashing their shorts by 22.2k. That’s the equivalent of 138.4 metric tons of gold buying from this group of traders alone! And these guys still have another 163.3k contracts or 507.9t left to buy to fully mean revert to normal.
To put this into perspective, the World Gold Council reports that global gold investment demand during the first 9 months of 2015 (latest data) averaged 76.0t per month. Meanwhile on the investment front, American stock investors have already put so much differential buying pressure on GLD gold-ETF shares that its gold-bullion holdings have surged 47.7t or 7.4% higher so far this year! Gold demand is really back.
But how can this be when gold yields nothing? Why do investors flock to it during Fed-rate-hike cycles? The answer is simple. A tightening Fed is the arch-nemesis of stock markets levitated for years by epic record Fed easing. As Fed-inflated stock prices crumble into a new cyclical bear, smart investors have no choice but to diversify their portfolios. And gold has been the premier portfolio diversifier for millennia.
This investment gold buying is only just starting, as is the powerful new gold upleg it is driving. Late last year, American stock investors had just 0.115% of their portfolios invested in gold per the ratio between the value of GLD’s holdings and the S&P 500’s collective market capitalization. Between 2009 and 2012 before the Fed’s third quantitative-easing campaign radically distorted markets, that was 4.1x higher at 0.475%!
There’s no doubt this new stock bear as the Fed’s gross distortions unwind will easily push this ratio back over 0.5% in the next year or two. And that’s going to require vast gold buying by American stock investors alone. During 2012 before QE3, GLD’s holdings averaged 1294.2t which is another 88% higher from this week’s levels. That gold investment helped support gold’s average price of $1669 in 2012.
Just as stock-market-investment cycles take years to unfold, so do gold-investment cycles. So realize the gold buying and resulting rallying we’ve seen so far in 2016 is just the tiniest tip of the iceberg. Gold is not only going to fully mean revert out of recent years’ extreme central-bank distortions, but overshoot towards the opposite extreme. We are truly looking at gold rallying on balance for years as investors return!
Investors can ride this great mean reversion back to normal gold-investment levels with physical gold bullion or the flagship GLD SPDR Gold Shares gold ETF. Speculators can buy call options on the latter. Gold is conservative and rallies during stock bears, which is far superior to cash. But if you really want to multiply wealth as gold mean reverts higher, the gold miners’ stocks will greatly amplify gold’s coming gains.

The gold stocks are ultimately just a leveraged play on gold prices. Since their mining costs are largely fixed when mines are built, the price of gold overwhelmingly determines the profitability of mining it. And stock prices always eventually gravitate towards some reasonable multiple of the earnings of their underlying companies. Since rising gold prices lead to exploding mining profits, gold-mining stocks skyrocket.
Let’s backtrack and get some perspective here, just like in gold. Last July’s record gold-futures shorting attack pounded the premier gold-stock index, the HUI NYSE Arca Gold BUGS Index, to a brutal 13.0-year secular low. If you think sentiment in gold was bad, it was practically rapturous compared to the dark hell gold stocks have suffered through! Everyone, and I mean literally everyone, viscerally loathed this sector.
But such gold-stock price levels were fundamentally-absurd, as I argued aggressively in late July, again in mid-November, and a third time in late January. Trading near 105 per the HUI, the gold stocks languished at levels last seen in July 2002 when gold was trading near $305 and had yet to exceed $329 in its young secular bull. Yet even at gold’s deep post-rate-hike low near $1050, it was 3.4x higher than that.
The elite gold miners’ stocks are all included in the HUI as well as the GDX Market Vectors Gold Miners ETF. Per the latest full quarterly data available which is Q3’s, these leading gold miners had average all-in sustaining costs of $866 per ounce. In other words, they can produce gold and do all the exploration, mine building, and reclamation necessary to sustain those levels of gold production indefinitely for $866.
I wrote a whole comprehensive essay detailing the gold miners’ costs in mid-November, and will likely do another one soon incorporating Q4 data. But when an entire industry can mine gold at essentially a $200-per-ounce profit near recent gold lows, does it make any sense at all for the gold stocks to trade as if gold was just over $300? Those gold-stock prices were ludicrous, truly fundamentally-absurd by any standard.
So even as gold drifted lower after that initial HUI 105 print in early August, the gold stocks held strong. With this industry priced as if it would cease to exist within weeks, everyone susceptible to being scared into selling low had already sold. This selling exhaustion gave way to a monster rally in early October as gold caught a bid, but that was quickly scuttled after gold plummeted in the wake of that hawkish FOMC surprise.
While gold plumbed dismal new secular lows in November and December, the gold stocks’ key support at HUI 105 held. The left-for-dead gold stocks had actually started to carve a new upleg way back in mid-November, which held strong despite gold’s new post-rate-hike secular low in mid-December. As 2015 waned, I argued that gold stocks would be the best-performing sector of 2016 by far as they mean reverted.
This entire sector couldn’t trade as if gold was $300 when it was earning profits on the order of $200 per ounce even not far above $1050 gold! Since gold drives gold-mining profits, and profits ultimately drive stock prices, reasonable gold-stock price levels can be approximated through the HUI/Gold Ratio. And that declared the gold stocks’ prices needed to quadruple merely to reflect then-prevailing low gold prices!
And indeed the last time gold had hit those mid-December lows near $1050 back in October 2009, the HUI had been trading near 390 instead of 106. I’ve been writing about this extreme gold-stock pricing anomaly for months on end, and aggressively buying and recommending elite gold stocks and silver stocks to capitalize on this stunning disconnect. But unfortunately naive traders bristle at contrarian thought.
Just as expected, gold stocks surged out of the gates in early 2016 to extend their uptrend with gold. But this sharp early-year rally soon stalled out and gold stocks started plunging. Even though gold was only retreating in a minor pullback, gold stocks plummeted in an utter collapse. This culminated in a bizarre episode of what had to be heavy capitulation selling that shattered the HUI’s 105 support in mid-January.
There was no reason whatsoever for this, it was just as irrational as most of the gold-stock trading during recent years. The major gold miners of the HUI usually leverage gold’s moves on the order of 2x to 3x. Yet in just 7 trading days ending at the HUI’s new 13.5-year secular low, this index had plummeted 17.6% on a mere 2.1% gold slide! At worst the HUI should’ve been down 6%. Triple that reeked of capitulation.
In hindsight it looks easier to make that call, but it sure as heck wasn’t that day when gold-stock trades were getting hammered to stop losses en masse. Yet as I wrote in our weekly newsletter that afternoon to our subscribers, it felt like a final capitulation even then so I aggressively bought and recommended a half-dozen gold stocks that very day when everyone else was forecasting big cascading losses to come.
Stock prices can’t stay decoupled from their underlying fundamentals indefinitely, and gold stocks’ epic disconnect from gold has to be one of the greatest in all of stock-market history. So not surprisingly out of that last-hurrah capitulation likely triggered by mechanical stop-loss selling, gold stocks started to rebound immediately. Just one week after those extreme lows, they were back within the HUI’s new uptrend.
And their gains accelerated dramatically from there, culminating in this week’s long-awaited breakout back above the HUI’s 200-day moving average. In just over two weeks, the gold stocks as measured by the HUI had rocketed 31.7% higher! And as of this Wednesday (the data cutoff for this essay), the HUI was up 19.3% year-to-date compared to 7.8% for gold and a 6.4% loss in the broad-market S&P 500 index.
But like gold, this new gold-stock buying is only just starting. Even though gold had rebounded all the way back up to $1143 by the middle of this week, it still cost the elite miners an average of just $866 per ounce to produce. That yields profits of $277 per ounce. That’s up a staggering 50% from profitability at gold’s mid-December low, on a mere 9% gold rally! Gold stocks’ profits leverage to gold is utterly amazing.
As gold continues powering higher as investors return to prudently diversify their portfolios in the face of the looming stock bear, investors and speculators are also going to continue pouring capital into the beaten-down gold stocks. There is simply no other sector in all the stock markets with stellar odds of at least quadrupling during a general-stock bear. Gold stocks will have to power higher for years to mean revert!
This sector has always been volatile, so that advance certainly won’t be in a straight line nor will gold’s. But for smart contrarian investors and speculators willing to take a strategic perspective based on real fundamentals, this sector can multiply fortunes. During the last secular gold bull, the HUI blasted an unbelievable 1664% higher between November 2000 and September 2011! Gold stocks can really run.
While investors and speculators can certainly play this sector in that GDX gold-stock ETF, the gains of the best of the miners will dwarf those of the sector as a whole. Intra-sector gains inevitably fall out into a bell-curve distribution, with a few big losers, most average, and a few huge winners. Smart stock picking of the elites with the fundamentals likely to generate right-tail performance will enjoy seriously-outsized gains.
The bottom line is gold and gold stocks are already rocketing higher in 2016. Investment demand for gold is returning as evaporating confidence in central banks is pushing global stock markets into a new bear. And as investors seek to re-diversify their risky stock-heavy portfolios with gold, the left-for-dead gold miners’ stocks are also catching a massive bid. They are this young year’s best-performing sector by far.
And these major new gold and gold-stock uplegs are only just beginning. Gold investment was forced so darned low by years of extreme central-bank market distortions that it will take years more of buying to normalize. And gold stocks have so far to rally merely to mean revert, let alone reflect higher prevailing gold prices, that they’re destined for years of heavy investment buying. We’ve hardly seen the tip of the iceberg.
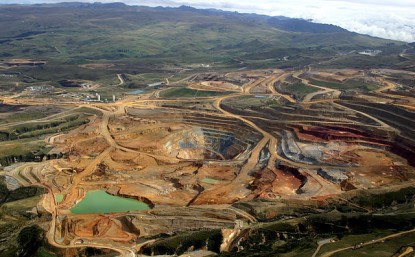
1.Gold and Japanese fiat are unlikely friends. During economic crisis, money managers treat both gold and the yen as safe havens. Top FOREX traders use the action of the dollar against the yen for cues to place bets on gold against the dollar.
2. From a fundamental perspective, while it’s true that both the US and Japanese governments worship debt, Japanese citizens are maniacal savers, while American citizens are notorious “debtaholics”. Also, most institutional carry trades are based on the yen. When those trades implode, significant buying of the yen, and gold, can occur.
3. Please click here now. Double-click to enlarge. That’s the daily bars chart for oil. The latest rally is failing, within an ugly broadening down channel.
4. The failing oil rally could trigger another global stock market rout, and another surge of yen and gold buying.
5. Please click here now. Double-click to enlarge this dollar versus yen daily bars chart. After breaking a major uptrend line, the dollar has rallied back towards that trend line.
6. That’s a tiny “risk on” rally. The dollar rallies against the yen when oil rallies, and when global stock markets rally. If oil and global stock markets take out their recent lows, the yen and gold will probably surge higher, and do so aggressively.
7. Please click here now. Double-click to enlarge. The technical action of this US dollar versus Canadian dollar daily bars chart is in sync with what is happening on the yen and oil charts.
8. US fiat will rally against Canadian fiat if oil tumbles, because Canada is a major oil exporter. Oil companies in Alberta are in a lot of trouble already, and the situation is becoming dire.
9. Having said that, it’s very important that the Western gold community makes a serious effort to be realistic about the price drivers that are actually in play in the gold market.
10. America’s days as the world’s “top economic dog” are over. From a simple mathematics perspective, 350 million (or more) debt-oriented Americans can’t compete with 2.7 billion gold-oriented Chindians.
11. America is probably going to experience another 1929 type of event, and it will likely be sooner rather than later. Regardless, the Eastern love trade (gold jewellery) is quickly becoming the main factor in the overall US dollar gold price discovery process.
12. Please click here now. Double-click to enlarge this beautiful daily bars gold chart. A magnificent uptrend channel is in play.
13. While the love trade continues to grow in price discovery power, the fear trade is still very important. Gold has a rough general tendency to swoon in the days ahead of the monthly US jobs report, and the next one will be released on Friday at 830AM.
14. After the report is released, gold tends to stage a very strong rally in the days that follow that report. Gold is trading with very modest volatility now, because of Chinese New Year buying, and ongoing buying in India.
15. Please click here now. Indian gold demand is not “here today and gone tomorrow” like it is in America. It’s inelastic and based on religion.
16. In a nutshell, gold demand growth in India is probably the most powerful citizen-oriented economic force on planet Earth.
17. Please click here now. Double-click to enlarge. I’ve argued that Raghuram Rajan is likely the greatest central banker in the history of the world, and certainly one of them. He’s putting real pressure the India’s finance ministry to unveil serious economic reforms.
18. His actions open the door for Janet Yellen to do the same thing, and I don’t think she will drop that ball. More pressure from Janet on the US government’s insane spending habits is coming. That means more US rate hikes are coming, and since American QE has failed, gold revaluation is the tool Janet would use if America experiences a “1929 2.0” economic meltdown.
19. Sir John Templeton never tried to call any kind of “final bottom” in financial markets. He simply looked for, and found, outstanding value. Likewise, value-oriented investors in the Western gold community should never view their account drawdowns as an “error”.
20. For the value investor, viewing drawdowns as an error is like calling the concrete foundation of their house an error. There is no error. In regards to the concept of value, please click here now. Double-click to enlarge what is arguably the global financial markets’ “chart of the year”. The massive bullish wedge pattern in play on this daily bars GDX chart looks truly spectacular.
21. Note how close GDX is, to staging a significant upside breakout above the supply line of the wedge! Within GDX itself, many of the component stocks are staging massive upside rallies. That suggests a GDX breakout is now imminent.
22. Please click here now. Double-click to enlarge. That’s the Barrick daily chart. With significant cost cutting and massive production in play, the stock is poised to lead GDX higher.
23. Please click here now. Double-click to enlarge this Newmont daily chart. The company is poised to stage a major upside breakout. With both Newmont and Barrick surging higher, institutional and value-oriented money managers are beginning to pay attention to the price action.
24. Most gold stocks have “proven their mettle” in the latest financial markets meltdown, and are poised to become the world’s “go to” asset. Western financial markets look shaky at best. Chinese gold buying is solid. Indian gold buying intensifies with each gold buying season, while mine supply stalls. Clearly, all lights for gold are green!
Stewart Thomson of Graceland Updates, Guest Contributor to MiningFeeds.com
If you would like to receive our free newsletter via email, simply enter your email address below & click subscribe.
 Follow us on Twitter
 Become our facebook fan
CONNECT WITH US
Tweets
Tweet with hash tag #miningfeeds or @miningfeeds and your tweets will be displayed across this site.
MOST ACTIVE MINING STOCKS
Daily Gainers
 CMC Metals Ltd. CMC Metals Ltd. |
CMB.V | +900.00% |
 Eden Energy Ltd Eden Energy Ltd |
EDE.AX | +200.00% |
| GoviEx Uranium Inc. |
GXU.V | +42.86% |
| Eagle Nickel Ltd. |
ENL.AX | +41.67% |
| Citigold Corp. Limited |
CTO.AX | +33.33% |
| Mount Burgess Mining NL |
MTB.AX | +33.33% |
| Exalt Resources Limited |
ERD.AX | +31.94% |
| Casa Minerals Inc. |
CASA.V | +30.00% |
| Cariboo Rose Resources Ltd |
CRB.V | +28.57% |
| Belmont Resources Inc. |
BEA.V | +28.57% |


