

What a move in the gold stocks! The sector has refused to correct for more than a few days at a time. All weakness has been bought as a wall of worry has been built and the sector emerges from a historic low that could be on par with the 1942 low in the stock market. I thought the Federal Reserve statement or reaction to it (along with the market’s overbought condition) might cause the sector to correct this week. Instead, GDX and GDXJ powered higher and have gained roughly 13% for the week.
The weekly candle chart (below) shows both GDXJ and GDX are in breakout mode. GDXJ moved beyond previous resistance at $32-$33 and has upside targets at $43-$45 and even $50. Meanwhile, GDX has surpassed resistance at $22-$23 and now has upside to $27-$28 and $30. Furthermore, the 38% retracement of the entire bear in GDX is at $32. Do note that the miners have gapped higher in each of the past two days. For the sake of the bulls on the sideline, I hope to see an immediate pullback in the days ahead.

The gold stocks are already very overbought and if they continue higher unabated then we will have to worry about a potential sizeable correction. The chart below shows GDX’s parent index (GDM) along with two oscillators which plot its distance from its 100-day and 200-day exponential moving averages. The oscillators show the gold stocks are the second most overbought they have been in the past 22 years. The most overbought point was early 2002 when GDM corrected 37% before climbing much higher.

Before we worry about a sizeable correction, let me point out some very important data. The 2002 correction began when GDM and HUI rebounded 212% and 311% respectively from the major low in 2000. Thus far, the two have rallied 100% and 128% respectively.
Furthermore, the gold stocks are only three months removed from what could be the greatest buying opportunity of all time in the sector! While this is a sensational statement, it is rooted in data and facts and not your typical gold bug doomer porn. In short, there are three major similarities between the recent bottom in the gold stocks and the 1942 low in the stock market which arguably proved to be the greatest buying opportunity ever. I discuss and analyze the similarities in this video.
To conclude, the gold stocks have emerged from a historic bottom, have more upside but will eventually correct. How much they correct and when depends on how fast they reach their upside targets and what specific levels they reach. My current guess is anywhere from 25% to 35%.

1.All institutional analyst eyes are on this week’s central bank announcements from Japan and America. Most gold community analysts seem to have a difficult time grasping the idea that Japan’s fiat currency is viewed by top FOREX money managers as a safe haven, albeit less of one than gold.
2. The Japanese government is a huge debtor, but the citizens are even bigger creditors, and the bottom line is that the weakness of the debtors is superseded by the strength of the creditors.
3. It’s possible that the Bank of Japan fires a “bazooka” this week, but how that will affect the Japanese stock market, the dollar-yen trade, and gold… is unknown.
4. Goldman Sachs analysts believe that a Kuroda bazooka shot will strengthen the dollar and make the Japanese stock market surge higher.
5. In contrast, Morgan Stanley believes the bazooka shot will have the opposite effect; the Japanese stock market rally will fail, and the dollar will fall against the yen.
6. On that note, please click here now. For more detail on Morgan Stanley’s view, please click here now. I think Morgan Stanley’s team will likely prevail. Here’s why:
7. Kuroda is attempting to send the stock market higher just as the seasonally weak month of May arrives, and that’s a tall order, especially when powerful money managers at Morgan Stanley are going to use any strength to exit the market.
8. The US central bank is also in an interesting position right now. The NIRP policies adopted by Japan and Europe are viewed as failures by more and more top money managers around the world, yet just one small US rate hike caused a huge global stock market sell-off, and a safe haven surge into the yen and gold.
9. If Janet Yellen raises rates at any time this year, an even bigger global stock market tumble than the last one is likely. If she leaves rates unchanged, or joins “Team NIRP” and actually cuts rates, it could cause a loss of confidence event with central banks in general, and an enormous institutional gold buying binge is quite likely to happen.
10. In terms of the fear trade, gold is clearly sitting in the best win-win position of many years.
11. Please click here now. I’ve been emphatic that India is entering a one hundred year “gold-oriented bull era”. Stock market enthusiasts in the Western gold community should focus on Indian stock market ETFs, rather than on “hail Mary” plays with the aging empire of America.
12. Please click here now. Double-click to enlarge. From a technical perspective, the Bombay Stock Exchange (BSE) index looks truly spectacular.
13. I think the BSE is likely beginning the greatest bull move in the history of global stock markets. Eager investors can use INDA-NYSE to get in on the upside action.
14. Interestingly, as Indian markets soar, the US stock market rally is likely to drift aimlessly, and a crash to below the 2009 lows cannot be ruled out.
15. That’s because US stock buybacks have massively distorted price/earnings ratios, and without the QE lifeline, large money managers are showing real concern about being invested in American markets.
16. Please click here now. Double-click to enlarge. Gold is the world’s ultimate asset, and it’s showcasing a beautiful rectangular consolidation pattern against the dollar, on this daily chart.
17. Sizable volatility is likely as the Fed and the BOJ make their announcements. After a likely pullback towards $1190, gold should rise towards my $1305 target price, and then onto $1320, $1350, and $1380.
18. Fear needs to be tossed aside. Short term pullbacks offer superb entry points for all ultimate asset enthusiasts!
19. Please click here now. Double-click to enlarge this hourly bars oil chart. Oil is the largest component of most commodity indexes, and there’s a nice bull wedge pattern in play.
20. Chinese demand for commodities is rising again, and many large US money managers believe an upcycle for inflation lies just ahead. I don’t think they will stop allocating money to the sector because of any short term concerns, and most gold stock charts look somewhat like the “oil chart on steroids”.
21. Please click here now. Double-click to enlarge this GDX hourly bars chart. The bull wedge pattern is almost identical to the oil chart wedge. All ten percent price corrections in gold stocks should be bought aggressively. Stock market investors can’t avoid India just because they lost money in US markets after Y2K. Likewise, Western gold stock investors can’t focus on past gold stocks losses. It’s a new era. It’s a gold bull era, and it’s time for the Western gold community to embrace it with open arms.
22. Please click here now. This is a nice Chinese commodity exchanges volume chart. I predicted a soft landing for the transition of the Chinese economy from an exports-orientation to domestic consumption, followed by a surge in gold buying. That’s exactly what has happened, and I’ll dare to suggest the upside fun has only just started!
23. Please click here now. Western mainstream media is beginning to note the growing power of Chinese exchanges in major commodity price discovery.
24. Please click here now. Russia’s central bank continues its relentless monthly gold buy program, as does the PBOC, the central bank of China. Western gold and silver community investors should be modest buyers of all small pullbacks, and bigger buyers of any “price correction” that ultimately appears. It’s time to say good-bye to tears and fears, and say hello to about one hundred years of bull era fun!
Stewart Thomson of Graceland Updates, Guest Contributor to MiningFeeds.com

Those of us who work in the mining sector are probably well-aware of some of the big names in the industry. Names like Eike Batista, Robert Friedland, Lukas Lundin, and Frank Giustra. All mining executives who have not only enjoyed great success in the industry, but who have also seemed to be in the right place at the right time — and then made the most of it.
Chairman of Goldcorp Inc. (NYSE: GG), Ian Telfer, would be another name to add to the list. Ian Telfer has spent more than thirty years in the mining business, building and leading a number of first-rate mining companies, all while experiencing gold’s ebb and flow from bull market to bear to bull again. Perhaps most importantly, Ian, along with his business partner, Frank Giustra, were prescient enough in 2001 to take advantage of the end of a deep gold bear market and the beginning of a gold bull run that lasted the next seven years.
Taking full advantage of this bull market, Ian would go on to form and lead a number of significant mining companies, like Wheaton River Minerals Inc. and Silver Wheaton Corp., and would also lead Goldcorp, first as its President and CEO, then as its Chairman, a role Ian continues to serve to this day.
As we learn when speaking with Ian Telfer, earning this kind of success in a relatively short amount of time takes skill, hard work and a passion for the industry. It also means being in the right place at the right time.
We had the chance to speak with Ian at length about his thoughts on the current gold market and his tips for the younger generation of miners just starting out.
First of all, thank you so much for taking the time to speak with us.
Ian Telfer: Absolutely. It’s my pleasure.
I want to begin by mentioning the current jobless claims in the United States that came out last week. Jobless claims in the United States fell once more in one of the best employment reports to come out in a while. The employment data has reignited talks of interest rates hikes in the United States.
What are your thoughts on this recent economic news? Do you think it will stall a rise in gold prices?
Ian Telfer: Well, certainly positive employment data like this report is great news. More people having the opportunity to work is what counts afterall. However, whether this report will dampen gold prices for the rest of this year — I’m not too sure about that. Putting aside this employment report, I think there’s still plenty of economic uncertainty to go around. That’s not exactly a good thing, but I think that’s one reason why we have seen gold prices rise this year. I don’t see that this employment report has fundamentally changed the amount of uncertainty out there.
Thus far, gold prices this year are up roughly 16 percent. So, you do still see this run-up continuing?
Ian Telfer: In general, I’m always bullish on gold. The fact that the total amount of gold ever mined globally equals roughly 152,000 metric tons, which is enough to fill 60 tractor trailers, gives I think an idea of just how precious this metal is. And if you spend any time working in the gold sector, you’ll see that the number of mines producing a reliable amount of gold is falling. The fact of the matter is that it’s becoming more difficult and more expensive to reach and extract gold.
Gold prices will always face different economic climates and will always have their bear and bull runs. But, that will never discount the fact that gold is a rare commodity that’s been desired for thousands of years and will continue to be desired.
Given this year’s more positive price environment, based on your experience, what advice can you provide juniors? If this is the beginning of a gold bull run, what should they be doing?
Ian Telfer: Well, as bullish as I am about gold, I can’t say whether we’re seeing the beginning of a major bull run. I think there’s a lot of factors that play into a prediction like that. But, I do think this is a better time to be in mining than say a year or two ago.
My biggest point of advice would be to stay out of debt as much as possible. If we are at the beginning of a legitimate upswing in the mining industry, then access to capital will begin to get much easier. But, I would urge juniors to be cautious. A rise in commodity prices never lasts, and you don’t want to be over-leveraged when prices start to fall again.
What kind of guidance can you give to the younger generation of miners who are just entering the mining space?
Ian Telfer: That’s a good question. After thirty some odd years in the business, I think I do have some advice to give. I think there are two points of guidance I’d highlight. I’ve mentioned these before, but I think they always deserve another mention. One, don’t let the fear of failure stop you from taking advantage of a potential opportunity. Second, never forget that opportunity knocks very softly, and I think you have to be attuned to your surroundings, to what’s around you, to hear it.
There’s no doubt that the mining business is full of risks. And I think that sometimes freezes young mining entrepreneurs or those who are new to the mining business. There are a lot of decisions to make, and when you’re first starting out, a lot of those decisions will impact whether you’re still in business the following year. But, with all that said, there is no reward without risk – and that is doubly true for the resource sector.
Second, I think that a lot of entrepreneurs — and this can be said for other industries as well — believe that when there is an opportunity, it presents itself with a big bang and is as clear as day. I’m sure that’s the case sometimes. But, more often than not, opportunity comes in quietly and you have to be so engaged and so in-the-moment to be the first one to hear it.
A last question: Can you provide any details on whether Goldcorp will be planning any new acquisitions this year or if there are any particular mines the company is currently looking at?
Ian Telfer: Well, in response to that question, I can only say that Goldcorp is always looking for new opportunities. We’re very comfortable with our current operations and we look forward to seeing continued results there. But, as always, we strive to be in a position to take take advantage of an opportunity when it presents itself.
Thank you so much, Mr. Telfer.
Ian Telfer: It was my pleasure.
The gold stocks have been on a tear lately as they continue to move higher in defiance of the bearish calls of numerous pundits and traders. After trading lower mid week and filling Monday’s gap, the miners are set to close the week with some strength. While the miners are overbought and could remain below resistance for a little while, their strong outperformance of Gold remains a comforting signal for bulls.
The selloff in the miners began once they hit their first resistance targets, as noted in our editorial from last week. We noted immediate upside targets of GDXJ $33 and GDX $22.50. To be exact, GDXJ hit $33.07 and GDX touched $23.06. The resistance lines are visible in both charts below. Because the miners remain a good distance above their 50-day moving averages (GDX $19.58, GDXJ $26.82) it is possible they consolidate beneath resistance for a few weeks.

Turning to the metals, Gold continues to consolidate as it works off the excess speculative positions while Silver has broken out and above its 80-week moving average for the first time since late 2012. Both metals will close the week higher than depicted in this chart.

Other than Gold’s consolidation and resemblance of a small distribution pattern, the precious metals complex looks quite healthy. The breakout in Silver was telegraphed by the strength in the silver stocks as SIL doubled from its lows and SILJ is up more than 150% from its lows. At the same time, the gold stocks, as already noted have shown the same kind of strength against Gold. Those who are focusing on Gold’s CoT and false topping pattern are neglecting the more powerful signals given by the rest of the sector.
Because the gold stocks are at resistance and remain well above their 50-day moving averages, it is possible they could correct and consolidate for a few weeks before moving towards higher targets. We want to reiterate that the relative strength in the gold stocks and the relative strength in the silver space are healthy signs for the sector. If the sector were about to plunge (as some expect) Gold would be the leader and not the laggard that is now.
1.The price action continues to be superb for most mining stocks held by the Western gold community.
2. Now, silver bullion is poised to join the upside fun. That’s an indication that the current rally will enter its final stage. The final stage of a major rally in any investment class can produce truly spectacular gains for investors.
3. Huge value-oriented funds are buyers of an array of gold stocks, and so for the past few weeks I’ve suggested that if there has ever been a time for the average Western gold community investor to “chase price” in the gold stock sector, that time is now.
4. To view the big gold stocks picture from a technical standpoint, please click here now. Double-click to enlarge. This weekly GDX chart shows the development of a massive inverse head and shoulders bottom.
5. Once the right shoulder is completed by a brief pause in the $23 – $28 area, GDX should surge to my $33 – $40 target zone. The bottom line is that good times are here, for gold stock enthusiasts across the world!
6. Please click here now. Double-click to enlarge. This daily chart shows silver poised to burst up from its own inverse head and shoulders bottom, and race towards my $18 target zone.
7. Both the Bank of Japan (BOJ) and the US Central Bank have major announcements coming on April 27. HSBC economists are forecasting that Japan could announce what I’ve dubbed a “QE For The Citizens” program. The BOJ may actually print money and give it to the citizens to spend. That’s very inflationary.
8. Institutional buying of gold stocks in anticipation of such a program may be adding fuel to the current “rocket rally”. Also, savers are one of the main backbones of capitalism. I think Janet Yellen probably wants to raise rates in America on the same day that the BOJ’s Kuroda announces what is essentially a helicopter money drop.
9. A rate hike in America on April 27 could cause a horrific US stock market sell-off. Janet’s first rate hike caused a major equities market meltdown, and a surge into the yen and gold.
10. A second hike, against the background of helicopter action in Japan, could see the yen ignored as a safe haven. Gold and silver may stand alone, as the safe havens for institutional liquidity flows.
11.US T-bond yields have been in a bear market for about 35 years, just as T-bond prices have been in a 35 year bull market.
12. When yields enter a bull market, it’s generally reflected in the gold price as a ratio against the US monetary base. Please click here now. That’s the gold versus money base long term chart, courtesy of macrotrends.net.
13. It can be argued that gold has not experienced a real bull market since the one that ended in 1980. That’s because it’s only when T-bond yields enter a real bull market that the inflation-adjusted price of gold enters a major bull market, measured in US dollars.
14. To further understand this concept, please click here now. Double-click to enlarge. That’s another macrotrends.net chart. It shows the inflation-adjusted price of gold over the long term. I’ve annotated it with an inverse head and shoulders bull continuation pattern.
15. The rough target of the pattern is $3200+. A breakout above the neckline would likely coincide with a surge in the US inflation rate, and with the start of a new bear market in US T-bond prices.
16. Was the entire gold price rally during the 2000 – 2011 time frame really just a giant bear market rally? Well, when viewed on the gold versus money base and inflation-adjusted price charts, the answer is probably: Yes.
17. The good news is that rising inflation is now launching a new major bull market for gold in inflation-adjusted prices, and against the US money base. That’s why gold stocks are staging such a stunning performance against all fiat currency, and against gold too!
18. Please click here now. Double-click to enlarge. If gold is beginning a fresh inflation-adjusted bull market, gold stocks are likely only beginning what could be a multi-decade period of dramatic outperformance against fiat currencies and gold bullion.
19. There is no price driver that gets an institutional money manager more excited about gold stocks than inflation. There’s too much risk involved in placing bets based on geopolitics, short term Fed programs, and other events involving great fear. The inflation trade for gold is best described as a kind of hybrid of both the love trade and the fear trade. It’s something that money managers can quantify, discuss with institutional investors in a calm manner, and get solid response from those discussions.
20. The new bull market in gold stocks versus gold marks the end of a 20 year bear market, and if the main theme is going to be rising inflation, then other key commodities will be signalling higher prices too. On that note, please click here now. Double-click to enlarge. That’s the daily oil chart.
21. Oil is the largest component in most commodity indexes. Mike Rothman is the former top energy analyst for both ISI and Merrill Lynch. His influence in the institutional investor community can be substantial, and he just outlined a case for a 100% increase in the price of oil by the end of this year. The technical action I see on the chart supports his solid fundamental thesis. I predicted oil would begin a major rally from the green trend line I put on the oil chart, and that appears to be exactly what is happening.
22. Please click here now. Double-click to enlarge this daily gold chart. One item of minor technical concern is the small head and shoulders top pattern that has appeared. A similar top pattern appeared on gold stock ETFs, and it was destroyed as they rocketed higher over the past few days.
23. Sometimes gold stocks lead gold, and sometimes gold leads the stocks. The good news is that even if there is a pullback in the gold price, the inflation focus of large value fund managers, Kuroda’s money drop helicopters, European NIRP policy, and another stock market panic in America are all likely to combine, and make that pullback very short-lived.
24. Eager gold stock enthusiasts can confidently buy more of their favourite gold stocks on every ten dollar pullback in the price of gold, and do so in the welcome company of many of the world’s most powerful money managers!
Stewart Thomson of Graceland Updates, Guest Contributor to MiningFeeds.com

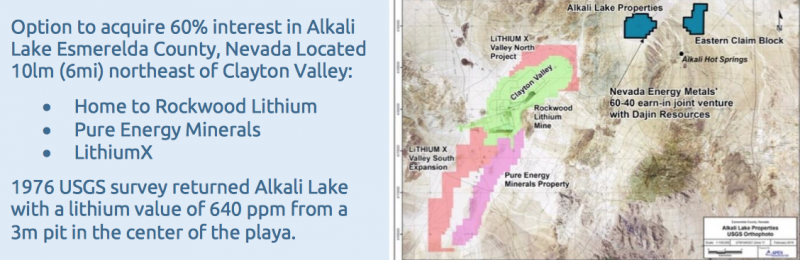
These days, investors in emerging lithium companies seem only to care about two things. How close is a property to a producing lithium operation (or basin with high lithium concentrations)? And, how many acres (hectares) is it? Look at Clayton Valley, Nevada, home to Albemarle Corp.’s Silver Peak lithium brine operation.
Conventional wisdom says to be as close to Silver Peak as possible, wielding as many acres as possible. However, newly appointed Technical Advisor Malcolm Bell of Nevada Energy Metals, Inc. (TSX-V: BFF) / (OTC: SSMLF) / (Frankfurt: A2AFBV), believes there could be other Clayton Valley-like basins in the State. It’s not the zip code that counts most, but the geological setting and volcanic history.
Is it a certainty that Nevada will become a meaningful lithium suppler? No. But consider that an area of great promise for lithium-ion battery demand is the U.S. Department of Defense, (DOD). I mention it to support my view that, “security of supply” will be a crucial factor going forward. Will the DOD (indirectly) continue to rely on countries in South America and CHINA! for critical lithium-ion battery materials?

If pricing remains stronger for longer, and demand continues to soar, the world will need more lithium, especially from safe, reliable jurisdictions. Companies like Nevada Energy Metals plan to be ready. As a project generator, the Company is well on its way in accumulating a robust portfolio of wholly-owned & JV properties. With Malcolm’s guidance, and the help of new hires (yet to be finalized), the team will have a lot on their plates. In fact, they already do, actively evaluating acquisitions and staking additional promising locations.
On March 22nd, Nevada Energy Metals appointed Mr. J. Malcolm Bell to the Advisory Board and as lead consultant for project acquisitions & land development opportunities.
Mr. Bell has over 45 years of resource industry experience either as principal, director, or senior officer of private & public companies. In 1980, he founded Hi-Tec Resource Management Ltd., a successful minerals exploration company. In 1986, he founded the International Investment & Business Opportunities Exposition, the first investment trade show company in Canada.
In 1997, he co-founded British Canadian Mines Ltd., containing the largest privately held mineral exploration portfolio in Newfoundland; and subsequently completed a $13-million reverse merger on it. In 2002, he helped negotiate a $20-million merger between Olympic Resources Ltd & Whittier Energy Corp. Currently, Mr. Bell heads a private Vancouver-based consultancy that sources projects & capital for companies engaged in mining, renewable energy & technology ventures.
I, Peter Epstein, CFA, MBA, caught up with Malcolm in the week ended April 1st to ask him a few questions. We spoke at length about his background and what he brings to the table. Mostly, he explained how nature has endowed Nevada with ideal conditions that, in select places, allow lithium to become concentrated in clays and brines.
Your extensive experience in natural resources, including sourcing projects & capital, affords you opportunities to serve in advisory roles for many Nevada juniors. Why choose lithium, and why Nevada Energy Metals, Inc.?
Nevada is an area of strong interest for me. At times it’s been for gold or copper, but now my focus is on lithium and its strategic importance. For months before joining the Technical Board, I was working closely with the Company on identifying and locking down lithium-bearing properties and staking ground. I helped them with the 100% acquisition of Teels Marsh West and with their option agreement on up to 60% of Alkali Lake.
I’m very bullish on lithium demand and Nevada’s potential role in supplying it.
Regarding Nevada Energy Metals, I’m excited by the pace, the speed at which things are getting done. In addition to the two transactions mentioned, I helped successfully stake a very promising property in the San Emidio Desert basin. On top of that, the Company is already starting (next week) a phase 1 exploration program on Teels Marsh West.
So, this is a company that wants to advance properties, not just sit on them. Regarding other lithium juniors, I think that I can add the most value here, by spearheading an aggressive property acquisition mandate. The Nevada Energy Metals has a lot of irons in the fire, the next few months should be a very active time for both the Company and me!
You and Nevada Energy Metals are not alone in being bullish on lithium prospects in the State. What about the climate / geology of Nevada fostered the deposition of lithium in brines?
That’s a great question. Dry desert-like climatic conditions and a favorable geological environment created conditions, over hundreds of thousands of years, that are today prospective for lithium in clays and lithium in brine deposits. There are four main reasons.
Firstly, it’s generally recognized that undrained, or closed desert playa basins are the most prospective locations. Secondly, there should be a history of large-scale volcanic eruptions, contributing large volumes of volcanic ash, containing trace amounts of lithium into the basin. Thirdly, the basin should sit atop, or be in very close proximity to, a geothermal heat source and hot springs.
Finally, there needs to be (or have been) an inflow of lithium-bearing hot spring fluids into the closed basin over a very long period, to boost the lithium content of existing brines. Most important, the same heat source responsible for the hot springs, has to have created a hot water convection cycle. This hot water convection cycle is what ties it all together. Only a trace amount of lithium is in the hot water, BUT over thousands of years the convection cycle deposits lithium into the basin over and over and over again…. The continuous hot springs cycling allows lithium concentrations to build.
Can you tell us about the staking of the San Emidio Desert basin?
Yes, the staking of 86 placer claims covering about 1,700 acres was announced last week. The property is about 60 miles (95 km) northeast of Reno, fairly close to where Tesla is building its giga-factory. The San Emidio Desert basin is an alkali playa environment being fed by lithium-bearing geothermal fluids.
All of the criteria I described earlier is present at San Emidio. To be clear, this does not ensure that favorable brine concentrations will be found. But it shows it’s a promising target to explore and test for a commercial deposit. Given the limited exploration for lithium in Nevada to date, there certainly could be another Clayton Valley-like discovery. If the right conditions are in place, robust lithium brine deposits could be at large.
Can you please explain the initial phase of exploration at Teels Marsh West, and what you hope to accomplish?
Yes, we’re excited to start a surface exploration program on Teels Marsh West next week. The marsh covers roughly 2,000 acres (~810 hectares) in Mineral County. Lithium concentrations at Teels Marsh of up to 850 ppm were reported in sampling programs conducted by the US Geological Survey (OFR: 76-567).
The initial exploration phase consists of 20 shallow holes designed to collect fluid and sediment samples situated nearby a previously discovered thermal area. The area is on, and adjacent to, a range front fault system along the west side of the marsh. Close proximity to a geothermal heat source is believed to be a principal requirement for concentrating lithium in the brines at Clayton Valley.
Finding lithium concentrations is all fine and good, but the parts per million (ppm) are lower than the brines found in Argentina & Chile, why should anyone care about Nevada?
I’m no expert in lithium fundamentals or pricing, but the only North American producing mine, Silver Peak, is thought to be concentrating brines with initial lithium values of 150ppm to 250ppm. That’s using the decades old technology / process of solar evaporation. Most geologists believe that closed basins in places like Clayton Valley would be able to produce average concentrations of at least 200ppm.
Right, 200ppm is less than South American lithium values, but Nevada is ground zero of several new processing technologies that have potential to be superior to harvesting brines in giant evaporation ponds. To be clear, these technologies are mostly in scale-up phase. Still, most lithium juniors around the world are several years from commercial production, leaving plenty of time for new technologies to catch up.
Thank you Malcolm for your time and insightful answers to my questions. Good luck in your new role at Nevada Energy Metals.
Disclosures: Readers are charged with conducting their own investment due diligence and recognize that small cap stocks can deliver a 100% loss of investment capital. The author or interviewer as the case may be, Peter Epstein, CFA, MBA, believes that he’s diligent and prudent in screening out companies that, for any reasons whatsoever, are unattractive investment opportunities. However, he cannot guarantee that his efforts will be successful. Readers understand that Mr. Epstein cannot be held accountable or responsible for the accuracy of opinions, facts, estimates, forecasts and assumptions conveyed herein or for investment actions taken by readers.
At the time this interview was published, Nevada Energy Metals was a sponsor of EpsteinResearch.com. Mr. Epstein owns stock in the Company. He is not a registered or licensed financial advisor. His article(s) on Nevada Energy Metals and other small cap companies should be considered very carefully in this context. Readers are urged to consult with their own financial advisors before making investment decisions. This company, and all small cap companies, are highly speculative, not suitable for all investors.
Any commentary suggesting that a particular stock is, “under valued,” “over-sold,” a “compelling opportunity,” is “de-risked,” could be “re-rated,” or similar words and phrases, are not directed at any individual or group and do not constitute investment advice. Each individual and group must make their own determination regarding the suitability of any stock mentioned herein. Any comparisons between or among stocks are for illustrative purposes only and are not be taken as fact or relied upon. Nothing herein is to be considered explicitly or implicitly a part of full and proper due diligence.
This interview and does not constitute an offer or a solicitation of an offer for the purchase or sale of any shares or other securities of the companies referred to herein. There are substantial risks associated with investing in development stage exploration companies. Potential investors should seek advice from a qualified financial dealer prior to investing in any company referred to herein. No securities commission or similar authority has in any way passed on any of the information contained in this interview.
Silver’s reluctant, sluggish participation in early 2016’s powerful gold rally has been glaringly obvious. Instead of amplifying the yellow metal’s big gains as in the past, silver largely failed to even keep pace. The lack of silver confirmation for gold’s big move has certainly raised concerns. But despite silver’s vexing torpidity in recent months, it is a coiled spring ready to explode higher to catch and surpass gold.
Silver has always been something of an investing enigma, somehow combining attributes of a highly-speculative investment, a conventional industrial commodity, and an alternative currency. Silver trades like each from time to time, stymieing attempts to classify it. Silver tends to grind sideways boringly for long periods of time, and then skyrocket higher in bulls of such magnitude that they are celebrated for years.
Silver’s primary driver has always been the price of gold. While silver can decouple over the short term, these two precious metals have very-high correlations across most multi-year spans. This is the result of silver’s unique supply-and-demand profile. Silver’s industrial demand, including all fabrication, jewelry, and silverware, accounts for around 4/5ths of total global demand. This tends to be fairly constant over time.
Thus the relatively-static lion’s share of silver demand has little impact on its price. But while investing is responsible for just the other 1/5th, it varies wildly depending on sentiment. So it effectively sets silver’s price at the margin. And the overwhelmingly-dominant driver of how bullish or bearish investors feel about silver is the price of gold. Silver effectively acts like a gold sentiment gauge, mirroring gold’s action.
When gold is climbing decisively and investors believe its rally is sustainable, they tend to flock back to silver. And since silver is such a tiny market in capital terms, relatively-small inflows can drive utterly massive price surges. 2014’s total world demand of 1067m ounces per the Silver Institute was worth just $20.3b at 2014 average silver prices. That’s practically a rounding error compared to the global capital markets!
The World Gold Council pegged global gold demand at 4226.4 metric tons in 2014. At the average gold price that year, that was worth $172.0b. So with the world silver market being less than 1/8th the size of the world gold market, all investor silver buying and selling has a price impact on the order of 8x what it would in gold. So silver can easily move disproportionately far and fast once gold gets investors excited again.
The problem is 2016’s powerful gold rally hasn’t translated into enough investor excitement to generate a substantial bid for silver. As of mid-March, silver was only up 12.5% year-to-date compared to 19.9% for gold. Normally during big gold bull runs, silver amplifies gold’s upside since its market is so much smaller. Silver can generally be expected to double gold’s underlying gains over time, a far cry from 2016’s action.
So what does silver’s serious early-year underperformance mean? Some argue that the lack of silver confirmation for gold’s strong surge is a warning sign that the latter isn’t sustainable. But that is extremely unlikely given gold’s strong fundamental underpinning of massive new investment buying. Far more likely is silver is just lagging gold, which isn’t uncommon as this secular gold and silver chart shows.

While gold is absolutely silver’s primary driver mathematically, this critical relationship gets delayed after secular gold-price extremes. That’s because the gold/silver link isn’t mechanical, but psychological. It takes time for major gold trend reversals to sink in with silver investors. They don’t ramp their buying and selling to outsized silver-moving levels until they really believe that gold’s new trend is well-established.
This delayed silver reaction to major new gold uptrends is readily evident over the past decade or so. During gold corrections and bear markets, silver amplifies gold’s downside to ultimately fall considerably farther. That leaves silver sentiment very bearish when gold is bottoming. So recently-burned investors are loath to return in gold’s initial rally. Their outlook tainted by fear and despair, they doubt gold’s run will last.
But once gold rallies far enough for long enough to convince silver investors that the bottom really is in, and the new upleg is sustainable, they start redeploying in silver. This is slow at first, but as silver’s own price is driven higher more and more capital returns. Nothing begets buying like buying, everyone loves a winner. Then as silver’s gains accelerate, they soon catch up with and eventually surpass gold’s own.
This pattern happened multiple times in the late 2000s. As you can see above, silver fell far behind gold as the yellow metal corrected or consolidated. With gold no longer rallying, investors’ interest in owning silver waned. But soon after gold bottomed and started powering higher again, silver caught a massive bid and ultimately surged much faster and higher than gold. This has long been the typical silver-upleg pattern.
And this same bearish silver-price lead-in to a major secular gold low unfolded again in recent years, at an exceptionally-large scale. Between gold’s secular-bull peak back in August 2011 and its secular-bear bottom in December 2015, it plunged 44.5%. Silver greatly amplified that secular gold bear, with a 68.7% plummet over that same span. Such horrendous losses decimated the ranks of silver investors.
This is easiest to see in the silver-bullion holdings of the world-leading iShares Silver Trust silver ETF. Unlike most silver supply-and-demand data that is available just once a year or quarterly at best, SLV’s managers publish its bullion holdings every day. SLV is effectively a conduit for stock-market capital to flow into and out of physical silver bullion, so its holdings are a great proxy for stock investors’ silver exposure.
Back in August 2011 when gold peaked, silver was trading just under $44 and SLV held 313.9m ounces of silver in trust for its shareholders. That works out to about $13.7b of silver. But by mid-December 2015 the day after the Fed’s rate hike when gold slumped to a dismal 6.1-year secular low, silver was priced under $14 and SLV held 323.5m ounces. So there was only $4.4b of stock-market capital invested in silver.
Naturally silver-investor morale was atrocious as gold was bottoming late last year. Heading into that first Fed rate hike in 9.5 years, there was a universal belief that a new Fed-rate-hike cycle would prove devastating for zero-yielding gold. Never mind that history proves just the opposite, that gold thrives in Fed-rate-hike cycles! With everyone expecting gold to spiral lower, no one wanted anything to do with silver.
The longer bearish sentiment remains, and the more extreme it gets, the more inertia it has and the harder it is to turn. And with silver slumping to a brutal 6.4-year secular low of its own in mid-December, it was going to take some time to convince battered silver investors to return. I suspect that natural delay in sentiment shifting following an extreme is why silver has lagged gold’s powerful rally in 2016’s initial months.
They certainly weren’t ready to jump back into silver at the first signs of a gold advance, as a half-dozen sharp gold rallies had soon failed in recent years. They were driven by speculators buying gold futures, which soon exhausted itself. Gold rallies can only grow into uplegs and new bull markets if investors with their vastly-larger pools of capital soon step in to take the buying baton from futures speculators.
And gold’s massive new investment buying this year, unlike anything seen since early 2009, really was not fully evident until late February. So it’s understandable that silver investors remained skeptical of the initial couple months of gold’s new rally, as that was within the timeframe where it could still be driven solely by futures speculators. As March rolled around, investors finally started to return to silver again.
This is evident in the silver-bullion holdings of SLV. By the end of February, they had slipped by 2.0% in 2016. Stock investors weren’t the least-bit interested in silver. This was a sharp contrast to the gold-bullion holdings of the leading GLD gold ETF, which soared 21.0% year-to-date in that same span. But silver investors finally started to return in March, where SLV’s holdings surged 6.0% by late in the month.
So after falling behind gold again following a major secular low, capital is starting to flow back into silver. Investors are starting to understand that 2016’s gold rally is very different from anything in recent years with its strong investor participation. So they are finally starting to believe this new gold bull is righteous and sustainable. Yet again, silver is fulfilling its traditional role of acting as a sentiment gauge for gold.
And it’s not just gold sentiment that impacts silver, certainly one of the most speculative investments out there. Silver has also long had a tendency to be affected by significant stock-market action, especially to the downside. Historically when stock markets sell off notably on any trading day, silver is often sucked in. On days when stocks are down and gold is up, silver tends to split the difference instead of following gold.
Stock-market selloffs significant enough to capture investors’ attention have a universal dampening effect on the willingness to take risk. That’s why they’re often called “risk-off” days. And silver seems to be far more susceptible to that than gold, since it is far more speculative. So a second reason that silver has lagged gold so much in 2016 was the sharp general-stock selloff in the first 6 weeks of this year.
I’ve observed this silver-following-general-stock-down-days phenomenon for years, but it’s difficult to quantify since the gold action also affects silver on those days. But it definitely exists. Silver certainly isn’t the only commodity affected by pessimistic stock-market sentiment. Crude oil has also always had a strong correlation with stock-market selloffs. Stock-market fortunes exert a powerful universal influence.
With silver finally starting to respond to gold’s powerful 2016 rally, its upside potential is truly massive. This next chart looks at the Silver/Gold Ratio, or more precisely the inverted Gold/Silver Ratio. It is effectively the same thing, but with cleaner easier-to-read numbers than the true SGR’s tiny decimals. Silver fell so far out of favor last year that it remains extremely undervalued relative to gold, making it a coiled spring.

So far in 2016, the SGR has averaged 79.5. In other words, it takes 79.5 ounces of silver to equal the value of a single ounce of gold. Since gold is silver’s dominant driver, these metals’ prices have always been closely related. The SGR quantifies this critical relationship, and is actually an outstanding trading tool. It reveals when silver is undervalued or overvalued relative to gold, ideal times to buy low and sell high.
Before 2008’s once-in-a-century stock panic, the SGR averaged 54.9. That’s a good baseline of where silver should be trading relative to gold on average in modern markets. During 2008’s stock panic, the strong tendency of silver to be sucked into exceptional stock-market down days flared with a vengeance. So silver plummeted far faster than gold as stock markets collapsed, blasting the SGR to unsustainable extremes.
During the last 4 months of 2008 within that stock panic, the SGR averaged 75.8. Silver was radically undervalued relative to gold, an incredible buy. As I pointed out at the time to our subscribers, and later explained in an essay in early 2009, silver simply couldn’t sustain such extreme lows relative to gold. As is always the case after such a ratio hits extremes, a normalizing mean reversion the other way is inevitable.
And indeed that soon came to pass just as expected. Silver prices rocketed far faster than gold’s in 2009 emerging from that epic stock panic. But like most mean reversions out of extremes, they didn’t simply stop at the previous 54.9 average. In mid-2010 silver finally started to regain popularity with investors so they threw capital at it in a big way. So silver skyrocketed to the opposite extreme in early 2011, radically overshooting.
Over that entire 2009-to-2012 span, the normal years sandwiched between 2008’s crazy stock panic and the Fed’s wildly-distorting QE3 campaign ramping to full steam in early 2013, the SGR averaged 56.9. Interestingly that is right in line with the pre-panic average, and close to the 55 SGR that the gold miners and silver miners had long used to convert their byproduct to equivalent ounces of their primary metal.
Between 2013 and 2015, the Fed’s unprecedented open-ended QE3 campaign levitated stock markets. Each time they threatened to sell off, Fed officials were quick to step in and imply they were ready to expand QE if necessary. Investors interpreted this as a Fed Put, so capital migrated from everything else into the seemingly-perpetually-rising stock markets. Demand for alternative investments led by gold just collapsed.
And being driven by gold, silver followed it lower in recent years. But being highly-speculative, as well as tending to amplify gold, silver prices fell a lot farther than gold’s. So far in 2016, silver has been so low relative to gold that the SGR is averaging just 79.5. Thus silver has actually been cheaper relative to gold this year than during 2008’s once-in-a-lifetime stock panic! Such an incredible anomaly can’t persist.
So today silver looks even more bullish than it was in late 2008, which is amazing. From its November 2008 panic low to its euphoric blow-off top in April 2011, silver soared 443% higher in 2.4 years! There’s no doubt a similar mighty bull market is very possible off of mid-December 2015’s secular low. A similar gain would ultimately catapult silver prices above $74 per ounce in another popular-speculative-mania scenario!
While an overshoot after the inevitable mean reversion out of 2016’s extreme silver lows is inevitable, there’s no need to expect such a radical one to be bullish on silver. Silver will have no problem at all returning to its 2009-to-2012 average levels near 1/57th the price of gold. At $1250 gold, that yields a silver price target near $22. That’s another 44% above today’s levels, a solid gain no one would sneeze at.
But gold itself is also mean reverting out of the extreme Fed-conjured distortions of recent years, heading far higher. During 2012 before the Fed’s stock-market-levitating QE3 ramped to full steam, the gold price averaged $1669. At that price and the post-panic-average 56.9 SGR, silver would be priced above $29 again! That’s 93% higher than today’s levels. And seeing silver back up there really isn’t a stretch at all.
Silver first went above $29 in December 2010 as it regained popularity with investors. Then it essentially stayed above $29 until March 2013 when the Fed’s QE3 was starting to hammer gold. So there is plenty of modern precedent for silver being priced far higher than it is today. The weak late-2015 silver prices that seem normal now are as big of anomaly as they were during 2008’s stock panic, it simply can’t last.
All it takes for silver to surge dramatically is for a relatively-small fraction of investors to migrate a trivial amount of capital in the grand scheme of the markets back into this white metal. Like everything else in the markets, silver is forever cyclical. It gradually oscillates from out of favor to into favor. And the higher investors push silver, the more attractive silver becomes attracting in even more capital. Buying begets buying.
With silver due for a massive mean reversion higher this year as gold’s new investor-fueled bull market continues to grow, there’s rarely been a better time to buy silver. Investors can buy physical silver bars and coins, or that flagship SLV silver ETF. But silver’s coming gains will be dwarfed by those in the beaten-down silver miners. Their profits leverage to silver’s price is extreme, granting them epic upside potential.
The bottom line is silver is a coiled spring today ready to explode higher. Silver was battered so low in recent years’ gold bear that it’s spent 2016 trading near stock-panic levels relative to gold. Such super-low prices aren’t sustainable, so silver is due for a massive mean reversion higher as investors start to return. Their lagging buying finally began in March, and will soon accelerate and become self-feeding.
These big new capital inflows squeezing into such a small market will drive up silver prices faster than gold’s. As silver’s new bull catches up with and then surpasses gold’s, the SGR will gradually normalize. Naturally much-higher silver prices will work wonders for the left-for-dead silver miners’ stocks. Coming off of late 2015’s extreme secular lows, their gains in the coming years will certainly prove breathtaking.
If you would like to receive our free newsletter via email, simply enter your email address below & click subscribe.
 Follow us on Twitter
 Become our facebook fan
CONNECT WITH US
Tweets
Tweet with hash tag #miningfeeds or @miningfeeds and your tweets will be displayed across this site.
MOST ACTIVE MINING STOCKS
Daily Gainers
 CMC Metals Ltd. CMC Metals Ltd. |
CMB.V | +900.00% |
 Eden Energy Ltd Eden Energy Ltd |
EDE.AX | +200.00% |
| GoviEx Uranium Inc. |
GXU.V | +42.86% |
| Eagle Nickel Ltd. |
ENL.AX | +41.67% |
| Citigold Corp. Limited |
CTO.AX | +33.33% |
| Mount Burgess Mining NL |
MTB.AX | +33.33% |
| Exalt Resources Limited |
ERD.AX | +31.94% |
| Casa Minerals Inc. |
CASA.V | +30.00% |
| Cariboo Rose Resources Ltd |
CRB.V | +28.57% |
| Belmont Resources Inc. |
BEA.V | +28.57% |


