

1. In a boxing ring, size must be respected. In the same ring, a heavyweight champion fighter tends to absolutely destroy a flyweight fighter. In the gold market, size must also be respected.
2. Please click here now. Double-click to enlarge this fabulous GDX weekly chart.
3. Trading volume size must be respected, and since late 2014 GDX volume has increased dramatically. In mid-2015, the already-huge volume size intensified, and even more so in 2016.
4. There’s no question that the $27 area highs represent significant resistance for GDX, and a pause in the upside fun at this point in time is perfectly normal.
5. Given the incredible value-oriented institutional enthusiasm about gold and gold stocks now, I’m very confident that any pause or pullback from $27 will occur on very light volume.
6. Overall, from a technical perspective, GDX and most gold stocks are performing at an “A Grade” level.
7. Please click here now. Double-click to enlarge this weekly gold chart. The $1320 area low of April 2013 is a significant hurdle for gold bullion, as is the May 2013 area of $1336.
8. Gold bulls are battling the bears right now in this important price zone, just as gold stock bulls are battling gold stock bears in the $27 area in GDX.
9. The bottom line is that on a weekly chart basis, gold must close above $1336 and GDX must close above $27.61 to open the door to another significant price advance for the precious metals sector.
10. Do I think the bulls will succeed? Of course I do, but I’ll dare to suggest that in the Western gold community, emotions often run “hot”. Even a small pause or pullback in the price of gold and GDX can produce outright panic amongst investors.
11. I’d like to see as many Western gold community “citizens” as possible move beyond that mindset, and take a more relaxed approach to their holdings of the ultimate asset.
12. Institutional Brexit fears were large enough to push gold into the $1320 – $1336 resistance zone. Without more fears, gold will have a difficult time continuing its advance.
13. Please click here now. COMEX margins are being increased, and that also adds weight to the idea that gold needs a rest.
14. Also, please click here now. Double-click to enlarge this important weekly gold chart that is priced in British pounds.
15. Gold surged out of a beautiful bull flag pattern ahead of the Brexit, and made it to the 1000 GBP price zone, which is massive resistance.
16. If the gargantuan love trade of China and India can come to the rescue of fear traders that are facing strong resistance at GDX $27, gold $1320, and gold 1000 BGP, any pullback now is likely to be mild and short-lived.
17. On that note, please click here now. About 80% of India has now received monsoon rains. The Indian government’s weather expert track the monsoon’s movement, and I follow it daily.
18. It’s clear that only the North-Western crop zones of India have yet to receive monsoon rainfall, and I expect that to happen over the next 14 days.
19. As it becomes more evident that the upcoming harvest will be bountiful for India’s gold-obsessed farmers, banks and jewellers will loan the farmers money to buy gold for Diwali celebrations. Next, please click here now. After many months of sluggish action, China’s imports just surged!
20. The Chinese government has recently endorsed higher deficit spending, and the citizens appear to be quickly responding with increased demand for gold.
21. As love trade demand rises, any new fear trade event could cause an even more dramatic spike in the gold price than the Brexit did.
22. In the current environment, institutional money managers are clearly not comfortable with “risk-on” assets like stock markets and debt-soaked fiat currencies.
23. Unlike the Fed in America, the European central bank (ECB) has no European Treasury to back it in a crisis situation. That’s an upside price driver of gold of potentially gargantuan size, and the Brexit has magnified the dangers of an ECB collapse. For GDX, the $25 to $20 area is a key buying area during any pullback, and I invite the entire Western gold community to join me in that key accumulation zone, if it happens!
Stewart Thomson of Graceland Updates, Guest Contributor to MiningFeeds.com
What a last 24 hours for markets! At one point Gold was up $100/oz, S&P futures were limit down and the British Pound was down over 8%! The volatility has subsided, perhaps temporarily and Gold settled around $1320/oz with Silver settling below key resistance at $18. The miners predictably gapped up but the strength was sold. As miners remain below 2014 resistance we expect Gold to retest $1300/oz before moving higher.
The chart below plots the weekly candlestick charts of GDXJ (top) and GDX. The miners gained 5% to 6% on the week thanks to Brexit but note that miners sold off today after testing 2014 resistance. GDXJ, which has resistance at $43-$45 reached $43.76 today before declining and GDX, which has resistance at $27-$28, reached $27.71 before declining.

We should also note that the miners remain stretched when viewed through the lenses of history. Specifically, Brexit pushed the rebound above the 2008-2009 rebound.

Given the action in the miners today and their historically overbought condition, coupled with Gold selling off from much higher levels, I expect Gold to retest $1300/oz next week. A retest is only that and nothing more. While Gold has technically not formed a reverse head and shoulders bottom, it nevertheless has a potential measured target of $1550/oz. There is some resistance at $1330 and $1380 to $1400. However, there is very little resistance from $1400 to $1550.

News events rarely change market trends as the market typically leads news but Brexit could be an indication of a new bullish development for precious metals. That would be the long-term disintegration of Europe which would be very negative for the Euro, the world’s second largest currency. This news propelled Gold through $1300 and could be the catalyst to take it towards $1400 over the next few months. Meanwhile, the gold stocks could back and fill just a bit before again testing 2014 resistance levels.

1. All institutional eyes are on the Brexit vote. In the short term, it’s the main driver of gold price discovery.
2. Please click here now. In the big picture, a “Stay” vote is mildly positive for the gold price, because England will want special privileges with its EU membership. That means other EU member countries will soon demand special privileges, too.
3. A “Leave” vote is even more positive for the gold price, and if it’s followed by a rate hike from Janet Yellen in July, global stock markets could begin a horrific down cycle.
4. Please click here now. Gold is very sensitive to the price action of the US dollar against the Japanese Yen.
5. Japan is the world’s largest creditor nation, and America is the world’s largest debtor nation. The Brexit turmoil is causing Japanese citizens and institutions to repatriate money from abroad. That puts heavy downwards pressure on the US dollar.
6. Please click here now. Double-click to enlarge. This hourly bars chart of the dollar versus the yen looks like a train wreck chart.
7. When the world’s largest creditor class goes into “risk-off” mode, powerful institutional money managers buy gold aggressively.
8. Please click here now. I’ve suggested that the SPDR fund (GLD-NYSE) could hit 900 tons in June, and as of this morning, it’s already at 896!
9. During the “QE heydays” of 2009 – 2011, highly levered hedge funds were aggressive SPDR fund buyers. Sadly, that leverage meant they couldn’t hold their positions when the price dipped.
10. Now, a lot of unleveraged private banks and value-oriented institutions are the buyers. They won’t be shaken from their positions, and they are buying gold consistently.
11. In contrast to gold, the US stock market has substantial headwinds facing it. Value players don’t want anything to do with that market.
12. With QE finished, and a July rate hike looking imminent, the US stock market is looking very vulnerable.
13. Please click here now. Double-click to enlarge this hourly bars chart of the Dow. It looks very toppy. For another look at that chart, please click here now. Double-click to enlarge.
14. There’s a big head and shoulders top forming.
15. The May unemployment report was truly abysmal, and the US business up cycle is about eight years old. It’s either ended, or close to ending.
16. Statements from Janet Yellen that the economy looks good are simply not enough to allay concerns from American money managers and creditors in Japan, about the inherent dangers in the US stock market.
17. A rate hike that follows Brexit turmoil could put the Dow into crash mode, and send gold straight towards $1400.
18. Please click here now. Double-click to enlarge this daily gold chart.
19. In the short term, my 14,7,7 series Stochastics oscillator suggests gold is now a bit overbought, but any weakness should be seen as a buying opportunity.
20. Gold has an solid floor of bullish fundamentals underneath it now. That means the downside is very limited, but it’s difficult for Western money managers to overwhelm supply when India is in quiet mode, as it is now.
21. So, it’s important that gold market investors exhibit patience. Gold has really been trading sideways from mid-February, in a loose rectangular price pattern. Chinese New Year buying ended in February, and India is still one to two months away from serious Diwali-related dealer buying.
22. The bottom line is that as Asian physical demand strengthens, Western money manager buying will push total global demand above total supply, and the next major leg higher for gold will be underway!
23. Please click here now. Double-click to enlarge. That’s the GDX hourly bars chart. Some analysts think that gold stocks have come “too far, too fast”, and perhaps bullion will outperform the gold stocks now.
24. I beg to differ. If gold can make it to the $1400 area, the profits made by gold companies can increase dramatically, and that would unleash a fresh round of powerful institutional buying. Gold stocks should not only continue to lead bullion in the second half of 2016, but they appear poised to increase that outperformance!
Stewart Thomson of Graceland Updates, Guest Contributor to MiningFeeds.com
First Majestic Silver has been one of the world’s best-performing stocks in 2016, nearly quintupling at best in recent months. This outstanding Canadian silver miner runs extensive operations in Mexico, and is one of this metal’s purest producers. Despite its blistering run this year, First Majestic remains incredibly well-positioned to greatly leverage silver’s mean reversion higher. Investors should take a look.
First Majestic Silver’s amazing fundamentals won me over as a fan years ago, and I definitely have a dog in this fight. As silver was grinding along near major secular lows late last year, we recommended a new long-term investment in First Majestic at $3.20 in our monthly newsletter. Then in mid-January as silver stocks languished, we added another new First Majestic trade at $2.51 in our weekly newsletter.
First Majestic Silver trades on the NYSE under the awesome symbol AG. That is of course the chemical symbol for silver on the periodic table of elements, deriving from the ancient Latin word for silver argentum. Founded in 2002 by its current CEO Keith Neumeyer, First Majestic has steadily grown into one of the world’s elite powerhouse silver miners. And that’s no mean feat, silver mining is a tough industry.
The geology and economics of silver mining are very challenging, making major primary silver producers a rare breed. The great majority of the world’s known silver deposits were formed mixed in with gold or base metals. And the revenues derived from mining these other metals usually dwarf those from silver, relegating it to mere byproduct status. Indeed most of the world’s silver production is simply a byproduct.
The venerable Silver Institute gathers the best global fundamental data available on silver. Its highly-anticipated report on silver supply and demand in 2015 was just released in early May. Last year, a staggering 70% of world silver mine supply came as a byproduct from mining other metals! Less than a third of the 886.7m ounces of silver mined last year came from primary silver mines, let alone primary silver miners.
Most of those primary silver mines are owned by companies that aren’t primary silver miners. Though they sometimes have “silver” in their names, the majority of their revenues are usually from gold. Out of the top 17 elite silver miners in the flagship SIL Global X Silver Miners ETF, only 7 generated over half of their Q1’16 sales from silver. And First Majestic Silver enjoyed a commanding lead on that desirable list.
Fully 69.5% of its revenues in this year’s first quarter came from silver, which crowned it the purest major silver miner in the world during that slice of time! This well exceeded the silver percentages of even Silver Wheaton and Pan American Silver, granting First Majestic Silver exceptional leverage to silver prices. And it is widely respected and owned by professional investors, as evidenced by its broad major-ETF inclusion.
First Majestic is not only one of the top components of that dominant SIL silver miners ETF, but is also included in the flagship GDX VanEck Vectors Gold Miners ETF and GDXJ VanEck Vectors Junior Gold Miners ETF! Inclusion by the managers of these elite top ETFs is the gold standard for silver miners, gold miners, and junior gold miners respectively. So First Majestic has been heavily vetted by the best.
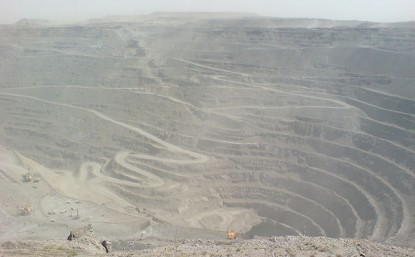
This company operates fully six silver mines in Mexico, Santa Elena, La Parrilla (“grill”), Del Toro (“bull”), La Encantada (“enchanted”), San Martin, and La Guitarra (“guitar”). Mexico is a fantastic place to explore for and mine for silver. It’s not only geopolitically stable, but it is close to the US and Canada and easy and relatively cheap to operate in. And Mexico has been a global silver powerhouse for centuries.
Mexico was the world’s top silver-producing country in 2015, responsible for over 1/5th of global mined supply. And this is nothing new. Ever since the Spanish colonials swarmed Mexico’s shores in the 16th century, silver production has been massive. It’s believed that fully one-third of all the silver ever mined in the history of the world came from Mexico! It’s long been the epicenter of global silver mining.
Ask any hardened prospector where the best place to explore for silver is, and he’ll reply where it has already been found. Miners have spent centuries scouring Mexico’s rugged hills for silver, and have left extensive past workings. But since their technology was radically inferior to modern mining’s, they literally just scraped the surface. They mined the most-obvious veins, but left most of the silver behind.
Fascinatingly, there have been multiple silver miners who have actually included old tailings piles in their mining plans! The waste rock discarded by miners of centuries past often still has very high grades of silver by current standards. Mexico is the best place in the world to mine silver, so it has been First Majestic’s sole target. Many economies of scale and efficiency result from focusing in a single country.
First Majestic’s excellent portfolio of Mexican silver mines all have very fascinating histories, but it’s their collective economics that make this company so attractive to investors. They produced 11.1m ounces of pure silver in 2015, along with enough byproduct gold, lead, and zinc to boost silver-equivalent production to 16.1m ounces. While some diversified miners produce far more silver, this is major for a primary miner.
But even more important than First Majestic’s excellent production profile is its low costs. Last year was a rough one for silver, where it averaged just $15.68 per ounce. And it slumped to a major 6.4-year secular low in mid-December leading into the Fed’s first rate hike in 9.5 years. The resulting silver sentiment wasteland was so brutal that investors grew concerned about the very viability of primary silver miners.
Just as the true mettle of sailors only becomes evident in the fiercest storms, 2015 severely tested silver miners’ managers. And First Majestic passed through that maelstrom unscathed. Last year it was able to mine silver at cast costs of just $7.87 per ounce! That’s the acid-test measure of how low of silver prices a silver miner can temporarily bear. Mid-December’s $13.69 secular low never posed a threat at all.
Far more realistic are all-in sustaining costs, which include all expenses necessary to both maintain and replenish operations at current production levels. That runs the gamut from exploring for new deposits to replace depleting ones, developing and building mines, and reclaiming old exhausted ones. Last year First Majestic reported AISC of just $13.43 per ounce! This was well below silver’s low average levels.
And if First Majestic could earn healthy 14% operating margins even at last year’s dismal silver prices, its profits are going to skyrocket as silver recovers and inevitably mean reverts higher in its new bull market. Silver miners enjoy strong profits leverage to rising silver prices because their mining costs are largely fixed. They are mostly determined up front in the planning stages before mines are even constructed.
Geologists and mining engineers have to target specific ore bodies for extraction, figure out the lowest-cost way to dig to them, and determine the process to recover the most silver from that ore. These costs persist no matter what silver is doing, they don’t rise proportionally with silver prices. Thus growth in mining profits greatly amplifies silver’s gains, which is what makes silver stocks so alluring for investors.
In early 2016 First Majestic provided guidance for this year’s operating results. It expects to produce at midpoints of 12.7m ounces of pure silver and 18.8m ounces in silver-equivalent terms including its byproduct metals. Those are excellent 14% and 17% year-over-year production gains! First Majestic isn’t just an elite primary silver miner, but a growing one. This company has always focused on expanding.
But even more exciting than First Majestic’s projected production growth in 2016 is this year’s guidance on costs. This company expects to mine its silver at all-in sustaining costs at a midpoint of just $12.83 per ounce! That’s 4.5% lower than 2015’s results, even though the silver price will almost certainly prove to average far higher this year. So First Majestic’s operating margins are set to soar dramatically!
Silver averaged $14.90 in Q1’16, barely off Q4’15’s secular-trough average of $14.77. As I explained in an essay in late April, new silver bull markets often get off to a slow start due to the way gold dominates silver psychology. Speculators and investors don’t return to silver until after gold has already rallied far enough for long enough to convince them a sustainable new upleg is underway. So silver lags gold.
But once silver excitement inevitably starts building, silver’s gains soon surpass those of its primary driver gold. So far in Q2, silver has averaged a much-higher $16.55. First Majestic’s profits will leverage these gains. In Q1’16, this company produced 3.1m and 5.1m silver and silver-equivalent ounces at incredible all-in sustaining costs of just $8.97 per ounce due to higher byproduct production and gold prices!
When First Majestic projected 2016 way back in mid-January, it used very conservative assumptions of silver and gold averaging just $14 and $1000 this year. So as Q1’s results revealed, this company’s all-in sustaining costs are likely to come in far under its projections in 2016. This will lead to exploding profits as silver continues mean reverting higher. This is readily evident across Q4’15 and Q1’16 results.
At Q4’15’s average silver price of $14.77 and First Majestic’s AISC of $11.28, this company earned $3.49 per ounce of silver mined. That’s pretty darned impressive for a major secular trough quarter in silver! But even though the average silver price only rose 0.9% to $14.90 in Q1’16, First Majestic’s far-lower AISC of $8.97 due to far-higher gold byproduct credits made for a $5.93 profit. That’s a staggering 70% higher!
There’s no doubt silver and gold will continue mean reverting higher on balance out of last year’s ugly central-bank-conjured extreme lows. That means higher selling prices and lower all-in sustaining costs for First Majestic Silver. I don’t know how high silver will go, but it averaged $19.05, $23.80, and $31.19 in 2014, 2013, and 2012. So these are all very conservative non-overshoot mean-reversion targets for silver.
Assuming First Majestic’s AISC come in around $10 per ounce this year due to the higher gold prices, this yields huge per-ounce profits potential of $9.05, $13.80, and $21.19. Those are staggering 159%, 295%, and 507% rocketings from Q4’15’s levels! The potential profits growth First Majestic is very likely to enjoy in this new silver bull is epic. And naturally that will lead to far-higher prices for First Majestic’s stock.
First Majestic Silver is one of the best-performing stocks out of all the precious-metals miners this year. Between mid-January and its latest high in mid-May, AG has skyrocketed an unbelievable 381.3% higher in just 3.9 months! Enjoying a near-quintupling in a matter of months is very rare even in this volatile sector. After such a blistering catapult higher, investors are naturally wondering if it is too late to buy AG.
This next chart offers some crucial insights on that important question. It looks at First Majestic Silver’s stock price in recent years along with key technical lines including its 50-day moving average, 200dma, and 2.5-standard-deviation Bollinger Bands superimposed on the silver price. Considering the secular-low extremes AG has just recovered from, a quintupling is merely a totally-justified mean-reversion rally.

Back in mid-January, AG slumped to a brutal 6.3-year secular low. With silver not far off that 6.4-year secular low of its own, investors’ sentiment was so exceedingly bearish that they continued to doubt the very survivability of the primary-silver-mining industry! In a rather-amazing testament to how bad things were in precious-metals-stock land, AG’s secular low was actually pretty mild compared to most of its peers’.
That same day AG bottomed, the flagship HUI NYSE Arca Gold BUGS Index dropped to an extraordinary 13.5-year secular low of its own! As I pointed out that very week, such gold-stock and silver-stock levels were truly fundamentally-absurd even with prevailing gold and silver prices. The very day of that bottom when everyone was panicking, I recommended buying AG along with 5 other elite gold and silver miners.
Remember that silver averaged $14.77 in Q4’15, and First Majestic still posted all-in sustaining costs way under that at $11.28 per ounce. So it was quite literally ridiculous for AG to trade as if this company was going out of business on January 19th when silver slumped to $14.03. Along with its peers’ stocks, First Majestic’s should never have been that low. Such fear was radically too extreme to be sustainable.
So a massive mean reversion higher in AG’s stock was inevitable, as I was pounding the table on for our subscribers in mid-January. And that’s indeed all that’s happened with First Majestic’s stock. While a quintuple in a matter of months sounds excessive without context, AG has only mean reverted back up to a mere 26.8-month high at best. This elite primary silver miner has simply regained already-low early-2014 levels!
Now if First Majestic’s stock had just quintupled to a major secular high late in a multi-year bull when extreme greed abounded, such blow-off gains would be a screaming sell signal. But seeing the same thing off major secular lows ludicrously defying First Majestic’s fundamentals when everyone had left it for dead is a radically-different scenario. Extreme gains off secular lows signal the births of major new bulls!
As you’d expect with a primary silver miner, First Majestic’s stock amplifies silver’s moves because they directly affect its profitability. AG’s gains and losses relative to silver’s over every major swing in recent years are highlighted on this chart, as well as AG’s leverage to silver prices and how long each swing took. Since silver-mining stocks are far riskier than owning silver itself, they must leverage its gains to be worthwhile.
AG has seen 6 major uplegs in recent years, but the last two were too anomalous to be considered as representative of average potential. In early 2015 AG surged dramatically while silver stayed flat, and of course in early 2016 AG mean reverted out of those secular extremes. Excluding these latest episodes of extreme upside leverage, AG averaged a healthy 2.7x upside leverage to silver in its recent bear years.
That’s pretty impressive considering the super-bearish sentiment plaguing silver and its miners’ stocks between 2013 to 2015 as the Fed wildly distorted the markets. Odds are AG’s upside leverage to silver uplegs will improve with investors’ sentiment becoming far more bullish. They will be looking for elite silver stocks to amplify silver’s gains, leading them to deploy more capital in AG than in the recent dark years.
And with First Majestic’s profitability already starting to explode with higher silver prices and higher gold byproduct prices lowering costs, this stock is destined to surge a heck of a lot higher on balance in the coming years. AG’s all-time high of $25.61 was seen in April 2011 as silver blasted towards $48 in a blow-off popular-mania peak not atypical for this super-volatile metal. AG’s potential going forward is far better.
During that peak Q2’11 quarter, First Majestic only produced 1.8m silver-equivalent ounces at cash costs of $8.32. That was a couple years before June 2013 when the World Gold Council first introduced all-in sustaining costs, so this superior metric was unavailable then. In Q1’16 First Majestic produced 5.1m silver-equivalent ounces at $5.00-per-ounce cash costs, 183% higher and 40% lower than around AG’s peak!
With vastly more production and much lower costs, AG stock should easily break through to major new all-time highs in the coming years as these new silver and gold bulls mature. So although buying AG above $10 is nowhere near as fantastic as buying near $3, great upside remains in this amazing primary silver miner. First Majestic’s incredible fundamentals point to massive profits growth in the coming years.
There’s one more little thing I’d like to share about First Majestic Silver that’s really cool. It actually sells its own mined silver in custom-minted First Majestic coins, ingots, and bars. I’ve always advocated every investor have a core portfolio foundation of 5% to 20% in physical gold and silver in their own immediate possession before ever investing in stocks. It’s wonderful to see First Majestic encourage physical investment!
The bottom line is First Majestic Silver is one of the world’s greatest primary silver miners. It has built a fantastic portfolio of mining operations in Mexico, silver mining’s epicenter for centuries. First Majestic concentrates on producing silver at low costs, which enabled it to easily weather the severe testing of last year’s deep secular silver lows. It never faced any existential threat, despite what its low stock price implied.
First Majestic’s operating profits are exploding this year as silver recovers and mean reverts higher. Its already-low costs are plunging due to surging byproduct credits from higher gold prices. The near-quintupling in First Majestic’s stock in recent months is not only fundamentally-justified, but it’s likely only the beginning of a major new bull market likely to last for years. It’s not too late for investors to get deployed.
1.When titans clash, reverberations are felt around the world. The US central bank has begun a titanic clash with the US government, and as the battle unfolds, all markets will be impacted significantly.
2. Please click here now. Double-click to enlarge. This short term chart shows gold beginning a small uptrend, with higher lows and higher highs.
3. Please click here now. Double-click to enlarge. A broadening formation is now in play on this key daily gold chart.
4. Broadening formations are formed by higher highs and lower lows, and these patterns indicate a loss of control in the market.
5. I predicted the Fed would hike rates in 2015, and that would be a warning shot to the US government to get its financial house in order, or more hikes would follow.
6. I do not believe the Fed’s first rate hike had anything to do with GDP or employment, and nor will the rate hikes that follow. The Fed is enticing banks to move the “QE money ball” out of government bonds and T-bills, and into the private fractional reserve banking system.
7. There, it can be loaned out more profitably, and money velocity will begin to rise. For the first time in US history, rate hikes are not being used to cool inflation, but to heat it up. Rate hikes raise the cost of borrowing money for the government, and for stock market buyback programs that have created questionable price/earnings ratios in the US stock market.
8. Gold is trading in a broadening formation because institutional investors are beginning to sense a loss of control, emanating from both government and central banks.
9. I expect gold will trade essentially sideways until mid-July, which is when it often bottoms anyways. That’s because early preparations for gold-oriented Diwali begin in India, and demand begins to surge.
10. Demand from India was weak in 2013 because of the imposition of a duty and import restrictions, and in 2014 and 2015, because the monsoon season in both years was very dry.
11. The 2016 monsoon season looks good. It should produce great crops, and gold demand from millions of farmers will rise significantly as that happens. Please click here now. India just killed the tax on cash purchases of jewellery. That’s very good news for farmers. They will be holding a lot of cash as their crops are harvested.
12. Also, if Janet Yellen hikes rates in July, not only will she be hiking just as Indian demand picks up, she will be doing so just as the US stock market enters what I call “crash season”. That’s the August – October time period.
13. If Janet hikes in September, the damage to the US stock market could be even worse. Goldman analysts predict she will hike in both September and December. That would put enormous pressure on both the US stock market and US government bonds.
14. Please click here now. Powerful JP Morgan analysts have forecast gold will surge to $1400 in the second half of 2016, and now Citi adds a nice price forecast.
15. Please click here now. Double-click to enlarge this GDX daily chart. I realize that some of the “old guard” of the Western gold community envisioned gold soaring to stratospheric prices as the US government debt crisis deepened.
16. Gold forecasts of $1400 from banks like JP Morgan may not sound very exciting to investors who envisioned gold at much higher prices by now, but it’s important to understand that it only takes a modest amount of upside action in the price of bullion to create dramatic movement in the price of gold stocks.
17. Gold bullion rose about 25% from the December lows to the May highs, and GDX surged about 100% in the same timeframe! Many individual gold and silver stocks staged “five bagger” and “ten bagger” performances.
18. Please click here now. Double-click to enlarge this daily silver chart.
19. Next, please click here now. Double-click to enlarge. Silver bullion rallied about 30% from the $14 area lows to about $18.
20. In the same time frame, the SIL silver stocks ETF surged well over 100% higher. What is even more important, is that while silver bullion has now fallen about 25% from the $18 area high, the SIL silver stocks ETF is only down about 15%!
21. How is it possible for gold stocks and silver stocks to pullback so slightly, after such a huge rally, even while bullion has a solid pullback?
22. It’s possible because so many powerful value-oriented institutional investors are showing great concern about coming inflation, loss of control in government and central banking, and overvaluation of the US stock market. They are buyers of gold stocks and silver stocks on price corrections, price rallies, and when they trade sideways!
23. A real correction is coming to the gold market, but I don’t believe it will happen until well into the 2017 calendar year. A lot of US economic reports will be released this week, including the jobs report on Friday morning. Gold has a strong tendency to rally following the release of that report.
24. Investors who may have recently become somewhat obsessed with calling a gold price correction may want to consider throwing a bit of caution to the wind. This is a time for investors to position themselves for the next wave higher, and for gold stocks, that wave may just begin on Friday morning!
If you would like to receive our free newsletter via email, simply enter your email address below & click subscribe.
 Follow us on Twitter
 Become our facebook fan
CONNECT WITH US
Tweets
Tweet with hash tag #miningfeeds or @miningfeeds and your tweets will be displayed across this site.
MOST ACTIVE MINING STOCKS
Daily Gainers
 CMC Metals Ltd. CMC Metals Ltd. |
CMB.V | +900.00% |
 Eden Energy Ltd Eden Energy Ltd |
EDE.AX | +200.00% |
| GoviEx Uranium Inc. |
GXU.V | +42.86% |
| Eagle Nickel Ltd. |
ENL.AX | +41.67% |
| Citigold Corp. Limited |
CTO.AX | +33.33% |
| Mount Burgess Mining NL |
MTB.AX | +33.33% |
| Exalt Resources Limited |
ERD.AX | +31.94% |
| Casa Minerals Inc. |
CASA.V | +30.00% |
| Cariboo Rose Resources Ltd |
CRB.V | +28.57% |
| Belmont Resources Inc. |
BEA.V | +28.57% |


