

1. The gold market is quiet, and there is seasonal softness.
2. That may be about to change, as both the US and Japanese central banks are having policy meetings this week.
3. The Fed meets on Wednesday, and the BOJ follows on Thursday. There is also some confusion in regards to the BOJ’s position on perpetual bonds, which are also known as helicopter money.
4. On that note, please click here now. A few days after the BOJ and Japanese government officials met with Ben Bernanke, the BOJ released a statement from Kuroda that he is totally against helicopter money.
5. Please click here now. It turns out that Kuroda’s statements were made back around June 17, weeks before he and the Japanese government met with Bernanke.
6. It should also be noted that Kuroda said he was opposed to negative interest rates, and then engaged in that policy anyways. Will the same thing happen with perpetual bonds?
7. The BOJ could make a blockbuster announcement on Thursday. The big questions for the Western gold community are these: Will helicopter money cause the yen to lose its safe haven currency status? If so, will that be positive or negative for the price of gold?
8. Please click here now. Double-click to enlarge. Part of the reason I was able to successfully forecast the massive rally in gold from the late December 2015 lows was because of the giant top that formed on this US dollar versus Japanese yen chart.
9. I don’t expect Janet Yellen to shock the market with a rate hike tomorrow. It’s Kuroda that is under pressure to announce something big, because Japan is slipping back into deflationary recession.
10. Please click here now. Double-click to enlarge this daily gold chart. Technically, gold is in sync with the fundaments I discussed above.
11. Gold is drifting lower in a nice bull wedge pattern ahead of the central bank meetings. Note the fabulous position of my key 14,7,7 Stochastics oscillator, at the bottom of the chart.
12. Technically, gold is ready to charge towards $1375, $1392, and then surge above $1432, but whether that happens or not in the short term will depend on what the BOJ does on Thursday.
13. The overall “background music” for gold is extremely positive. Institutional money managers believe more negative rate bonds are coming, and they view gold as a currency.
14. Since gold pays a zero percent interest rate (and a positive one with India’s sovereign gold bonds), gold is becoming a favoured currency.
15. Bob Moriarty wrote a book called, “Nobody Knows Anything” that he asked me to read and review. I could probably talk for hours about some of the key points in the book, and maybe I will, but the bottom line is this: In my professional opinion, Bob is probably the hardest working person in the junior mining space, and certainly one of them. He endures a travel schedule that most younger men, including me, couldn’t handle if their lives depended on it. That fact alone should get anyone’s attention.
16. There is a lot of synergy in what he writes in that book, which is for sale on Amazon where I bought it, with how I operate my newsletter. Here’s why: My most important theme is an investor’s “personal surprise zone”, and how to deal with that using professional tactics.
17. Most analysts try to predict the direction of the gold price, but I’m emphatic that serious wealth in the gold market is only built and retained by being able to buy prices that the investor never predicted, and probably believed were impossible.
18. Combat veterans like Bob tend to be very street smart, and they also appear to have a very good understanding of luck.
19. Successful business owners work extremely hard, but most of them will also acknowledge that lady luck played a big role in their success.
20. The winner is able to use their incredible work ethic and street smarts when they get lucky, and that’s the key to success.
21. The investor who buys gold when all their analysis has failed them in their personal “Nobody Knows Anything” zone, is the investor most likely to succeed.
22. While nobody knows for sure what the BOJ will do on Thursday, or what Janet will do tomorrow at the Fed meeting, please click here now. Double-click to enlarge. That’s the GDX daily chart. Note the blue support zone in the $26.80 area.
23. To get richer with gold stocks, using the “nobody knows anything” mantra, investors cannot predict whether GDX will trade at $26.80, but they can prepare to take buy-side action, if it does!
24. The $26.80 support zone can also be seen on the weekly chart. To view it, please click here now. Double-click to enlarge. Aggressive gold stock enthusiasts can buy right now, ahead of the Fed and BOJ meetings. More conservative investors like myself will typically wait for $26.80 before buying. All in all, it’s a super time to be invested in the precious metals sector, and I hope everyone is cheering for a gold-positive announcement from the BOJ on Thursday!
Stewart Thomson of Graceland Updates, Guest Contributor to MiningFeeds.com
Silver’s young bull market got off to a typically-slow start, lagging gold’s own new bull. But recently the white metal surged to catch up in a record summer rally. That left silver very overbought and facing near-term correction risks led by a record futures selling overhang and weak late-summer seasonals. But this strengthening bull still has a long ways higher to run yet before silver prices reflect prevailing gold levels.
Silver is something of an enigma. By the global supply-and-demand numbers, it’s inarguably another industrial metal. According to the venerable Silver Institute which gathers the world’s best fundamental data, industrial fabrication accounted for 50.3% of total demand last year. That was followed by coins and bars at 25.0% and jewelry at 19.4%. Most of the silver mined is consumed, not hoarded for investment.
On the supply front, the Silver Institute found that only 30% of global silver mine supply in 2015 came from primary silver mines. The great majority of silver produced is simply a byproduct from mining base metals and gold. These byproduct miners often think so little of silver that they sell the upside on their production to silver-streaming companies at relatively-low prices. That doesn’t sound like a precious metal.
Yet contrarian investors still love silver with a zeal unparalleled in all the markets. Silver is a tiny market with extreme volatility, so investors can earn fast fortunes when this metal periodically soars higher. At 2015’s average silver price of $15.68, the Silver Institute’s 1170.5m ounces demanded was worth just $18.4b! That’s a rounding error compared to the size of global capital markets, giving silver huge upside potential.
It doesn’t take much capital inflows through new investor buying to catapult silver higher. And usually the catalyst that rekindles silver demand is gold powering higher. Gold has always driven silver, as the silver investors and speculators take their trading cues from gold. They only flood into silver after gold has powered high enough for long enough to convince them its upside is sustainable. So silver lags gold.
That certainly happened in its young new bull. Back in mid-December around the Fed’s first rate hike in 9.5 years, gold and silver carved major 6.1-year and 6.4-year secular lows within days of each other. No one wanted anything to do with the precious metals, they were left for dead. I argued otherwise late last year, pointing out silver’s deep undervaluation relative to gold. Silver was languishing at stock-panic levels.
If such extremes weren’t sustainable in late 2008 in that epic maelstrom of fear spawned by the first stock panic in a century, they certainly couldn’t last without panic-grade fear. And indeed silver soon started to rally, but it really lagged gold’s initial advance in the early months of 2016. By early March as gold entered formal bull-market territory with a 20.1% gain off its secular low, silver had merely rallied 15.0% at best.
That was terrible relative performance, as silver’s far-smaller market size enables it to leverage advances in gold. Per the World Gold Council, total gold demand in 2015 ran 4193.1 tonnes. At gold’s average price last year of $1159, that works out to a market size of $156.3b. That is 8.5x larger than silver’s! So every dollar of investment capital that flows into silver has 8.5x the upside price impact of a dollar into gold.
By early April gold had rallied 21.0% at best from its secular lows but silver was only up 16.1% at best, not even in a new bull market yet. Some silver investors were getting discouraged, but they didn’t have to worry. Silver lags gold, and was wound like a coiled spring ready to explode as I outlined at the time. Silver finally started outperforming in April, taking its bull-to-date gains to 30.1% versus gold’s 23.1% by month-end.
Following that dazzling April surge into official bull-market-dom, silver was overbought and retreated in May. I didn’t expect much from summer, as silver has a long history of drifting sideways to lower during June, July, and early August even in the strongest bull-market years. Yet silver bucked this summer-doldrums trend to soar in June and early July! By mid-July it had blasted 48.7% above its recent secular low.
By that point gold was up 29.9% at best in its own young bull, so silver’s upside leverage to gold was only running 1.63x. That’s still pretty weak, as silver tends to amplify major moves higher in gold by 2x to 3x. The former is typical, while the latter occasionally flares up when silver grows popular enough to capture investors’ and speculators’ imaginations. While silver hasn’t hit 2x yet, it’s definitely catching up.
With a lot more excitement about silver now than back in early April, traders are wondering where silver is heading next. After such a strong counter-cyclical run, silver is certainly very overbought. So a healthy mid-bull pullback or correction is probable. But from a longer-term perspective, silver’s young new bull market is barely getting started. And silver’s greatest gains historically come late in bulls, not early on.
There are two major short-term risk factors for silver. The most-pressing one is the positioning of silver-futures speculators who are exceedingly long. The secondary one is silver’s weak seasonals this time of year. Let’s start with those. By July 13th, silver had rocketed a spectacular 27.7% higher since its final close in May! That’s a radical new bull-year record utterly dwarfing everything that’s come before.
Between November 2001 and April 2011, silver skyrocketed 1104.7% higher in a mighty 9.4-year secular bull. In 2012 silver consolidated high, not collapsing until the Fed’s gross market distortions spawned by the wildly-unprecedented QE3 began in early 2013. Between 2001 and 2012 which were amazing years for silver, on average by July’s same 8th trading day silver was actually down 1.9% summer-to-date.
Nothing like this year’s incredible 27.7% summer-to-date gains have ever been witnessed before. Silver tends to make a major seasonal low in mid-August, where it averaged 4.0% summer-to-date losses in that bull-year timeframe between 2001 and 2012. There’s definitely a risk silver will soon see some of this year’s massive record upside summer-performance delta erode back down toward normal seasonal levels.
Unfortunately investment demand didn’t play a big role in silver’s anomalous summer strength. That leading SLV iShares Silver Trust silver ETF is the best daily proxy available for investment capital flows into and out of silver. Its managers have to respond to differential SLV-share buying or selling pressure by buying or selling actual real physical silver bullion, or else SLV will decouple from silver and fail its mission.
Between the end of May and silver’s latest mid-July peak, SLV’s holdings merely grew by 3.8% or 12.8m ounces. That’s far from enough to explain silver’s enormous upside breakout. It wasn’t stock investors who’ve been aggressively buying silver, but futures speculators. The hyper-leveraged bets that these guys make necessitate an extreme-short-term focus, they are momentum players who buy and sell as a herd.
This chart looks at the total long and short silver-futures contracts held by speculators over the last 3.5 years or so. Their long bullish upside bets are shown in green, and their short bearish downside bets in red. Silver’s summer surge and its entire young bull have largely been driven by extreme long-side silver-futures buying by speculators. That ramped their total longs to record levels, for a record selling overhang.

Silver-futures positions collectively held by speculators are published each Friday afternoon by the US Commodity Futures Trading Commission in its famous Commitments of Traders reports. As of the latest data available when this essay was published, speculators held 141.0k long silver-futures contracts. This is the highest in our dataset going back to early 1999, and almost certainly a new all-time record peak!
Major interim highs in silver, in bull markets and bears alike, tend to arise when speculators’ upside bets grow excessive. Their very buying forces silver higher, but the moment something spooks them they are quick to rapidly exit these risky positions as a herd. That hammers silver lower until the futures selling storm passes. Silver-futures traders are forced to have a radically-shorter time horizon than normal investors.
Every single futures contract controls 5000 troy ounces of silver. At $20 an ounce, that’s worth $100k. But the minimum cash margin required to trade each contract is only $5250. So speculators can run leverage on silver futures up to 19.0x! The legal limit in the stock markets has been 2.0x for decades for good reason. At 19.0x, speculators risk getting wiped out by relatively-small adverse moves in silver prices.
A mere 5.3% move in silver, which is nothing in this volatile market, would obliterate 100% of the capital risked by fully-margined speculators who bet wrong on its near-term direction! Even if they were only running half the maximum leverage at 9.5x, a 10.5% silver move against them would force total losses of their capital bet. These guys can’t afford to be wrong for long, they have to exit fast when silver moves against them.
We recently saw this happen in May. By early that month, silver-futures speculators’ longs were up at a then-all-time-record 134.9k contracts. Then a gold selloff on Fed hawkishness spooked silver traders into selling in sympathy. Over the next several weeks, speculators liquidated 16.9k long contracts or merely 1/8th of their peak holdings. This forced silver 6.7% lower, which is well into formal pullback territory.
Today speculators’ silver-futures longs are even more extreme at that all-time-record 141.0k contracts. To put that into perspective, it represents leveraged upside bets on a whopping 705m ounces of silver! That is the equivalent of fully 4/5ths of the entire world’s mine production in 2015. And because of the risks inherent in hyper-leveraged futures trading, these positions will be unwound fast when silver turns.
Within a span of weeks speculators could sell 1/8th, 1/4th, or even a 1/3rd of their record futures longs which would really hammer silver. If they sell and close 1/3rd of their excessive longs, that would still leave their total position at a lofty 94.0k contracts which still remains far above the 2009-to-2012 average of 63.9k. Those were the normal years between 2008’s stock panic and 2013’s dawn of the Fed’s QE3 distortions.
Over the 7.0-month span of silver’s new bull market seeing that 48.7% gain, futures speculators added 46.6k long contracts while covering 22.5k short ones. That works out to around 233m ounces and 113m ounces respectively, serious buying. If these guys are forced to rapidly exit even half of these new silver-bull positions alone, we are looking at 173m ounces of silver selling slamming the markets within weeks.
That’s simply too much for normal demand to absorb. In all of 2015, which is the last comprehensive fundamental data available, global silver coin-and-bar investment demand ran a record 292.3m ounces. That averages out to just 24.4m ounces per month. Even if silver investment demand has doubled this year, which is likely far too optimistic, the amount of potential silver-futures selling will temporarily dwarf it.
So just like gold, silver faces a record futures selling overhang today. Last week I explained gold’s own record futures selling overhang in great depth. So check that out if you’d like a deeper background on why excessive speculator long positions are a major near-term threat even within the mightiest of bull markets. All bull markets flow and ebb, and futures speculators’ collective bets often control the timing.
But mid-bull corrections are a great boon to investors and speculators alike. They help keep sentiment balanced, which is essential to ensuring a healthy bull market enjoying a long lifespan. And they also provide the best relative buy-low opportunities within ongoing bull markets! Traders looking to add to their silver or silver-stock holdings should rejoice when corrections near, and get ready to deploy more capital.
Despite silver’s near-term downside risks from futures speculators’ excessive longs and the potential for this year’s record summer rally to mean revert down towards more normal performance, silver’s young bull has far from run its course. Silver’s vast upside potential from here is most apparent when looking at the silver price relative to its primary driver gold’s. The telling Silver/Gold Ratio remains super-bullish.

Since gold drives silver to a dominant degree historically, prevailing silver price levels can be considered overvalued or undervalued relative to gold. If silver is exceptionally low relative to gold prices it remains a strong buy, which is certainly the case today. As of the middle of this week, it took 68 ounces of silver to equal the value of a single ounce of gold. That level of SGR is still quite low by modern standards.
Before 2008’s incredible stock panic cast silver into that brutal maelstrom of fear, the SGR averaged 54.9x. Silver generally traded in a fairly-tight range around 1/55th the price of gold. But since silver is so highly speculative and subject to traders’ collective greed and fear, it was pummeled so low that the SGR briefly averaged just 75.8x in the stock-panic months. But as I argued at the time, such extremes weren’t sustainable.
Indeed silver soon started soaring relative to gold, actually becoming so popular in 2011 it entered a speculative mania. When investors and speculators really get excited about silver and start pouring capital in, this metal’s upside is mind-boggling. Still over that entire 2009-to-2012 normal-year span between the stock panic and the Fed’s gross QE3 distortions, the SGR averaged a very similar 56.9x level.
During the large majority of its bull-market years between 2005 and 2012, silver tended to trade in range between 1/55th to 1/50th the price of gold. But let’s call a 55x SGR normal to be a little conservative here. At this week’s prevailing gold price of $1315, a 55x SGR puts silver at $23.90. That’s another 24% higher from this week’s levels, which is a considerable gain from here. Silver is too low relative to gold.
And silver easily has the potential to head a heck of a lot higher than that before its young bull market gives up its ghost. Gold is in a major new bull market of its own driven by massive investment buying. Gold should easily at least mean revert back up to its pre-QE3 levels like 2012’s average price running $1669. Plug a 55x SGR into that and it yields a juicy silver target of $30.35, another 57% higher from here.
But this is pretty conservative as well on two fronts. Gold is likely to not only mean revert after seeing extreme lows driven by epic fear in recent years, but to overshoot proportionally towards the opposite extreme. The higher gold goes in its mighty new bull, the more upside potential silver has. And the greater the coming bull-market gains in gold and silver, the more likely they will grow increasingly popular.
When investors and speculators get excited about silver, they can bid it far above normal levels relative to gold. That stunning late-2010-early-2011 episode where silver entered a speculative mania to climax its last bull is a great case in point. Traders got so excited about the tiny silver market rocketing vertically that they bid silver high enough to temporarily see an SGR under 35x. Such extremes are great selling opportunities.
At relatively-low non-overshoot $1669 gold, again 2012’s average price, an SGR of 35x implies a silver price way up at $47.70. That’s another 147% higher than this week’s levels, a heck of a bull run from here! Personally I suspect gold will head much higher before this new bull fully runs its course, so the potential gains silver could see are much greater. You can plug in your own SGR numbers to suit your outlook.
So even though silver faces a healthy near-term correction, its bull-market upside remains vast. Those record excessive silver-futures longs held by speculators will be considerably unwound over a relatively-short span, and silver will soon pass through its weak summer seasonals. Investors and speculators alike should be preparing their buying lists and readying their capital for the big opportunities coming.
Silver’s next interim low will likely be first signaled by futures speculators’ collective bets, so all traders interested in adding positions should watch them closely. That will likely prove the most-advantageous time, the lowest prices, at which to add silver bullion, SLV shares, and silver-mining stocks for a long time to come. Far from being a threat to this young silver bull, a correction is a great boon for everyone riding it.
But such great opportunities to buy relatively low are only seized by prudent investors and speculators who are aware they’re coming and stay informed. We can sure help you with that at Zeal. Each week I carefully study and analyze the current gold-futures and silver-futures situations, and then report the resulting implications in our popular weekly newsletter. Its subscribers will know when silver is likely bottoming.
We will use this coming silver correction to add new silver-stock trades, augmenting our existing ones that have already seen staggering unrealized gains up to 550%+ this year alone! We also publish a monthly newsletter more tailored to investors, which will help keep you abreast of the markets. Our acclaimed newsletters draw on our vast experience, knowledge, wisdom, and ongoing research to explain what’s going on in the markets, why, and how to trade them with specific stocks. Since 2001, all 832 realized newsletter stock trades have averaged excellent annualized realized gains of +16.7%! You too can learn to think, trade, and thrive like a contrarian for just $10 an issue. Subscribe today!
The bottom line is this young silver bull faces a healthy correction. Futures speculators have ramped their silver longs to extreme record levels, igniting a record summer rally counter to normal seasonal weakness. This has left silver very overbought, at risk of a considerable near-term selloff once something inevitably spooks the hyper-leveraged futures speculators into unwinding their excessive longs.
But far from being threats, mid-bull corrections are great opportunities. They rebalance sentiment which is necessary to keep bulls healthy and long-lived. And they offer investors and speculators the lowest buying prices seen within ongoing bull markets. So if you want to ride silver’s young bull much higher in the coming years, now is the time to research and prepare for the coming smorgasbord of relative bargains.

The purge has arrived. Well perhaps not quite a purge, but it’s coming. It will be rejuvenating for the Lithium, (“Li”) sector. From 2016 highs, the shares of dozens of globally-listed Li juniors are down by 40% or more. Reminiscent of the cannabis craze 18 months ago, the Li sector is witness to a lot of shenanigans. Like cannabis, if ingested Li can make one feel better, but investing in newly minted Nevada (“NV”) Li juniors can cause confusion and anxiety.
Company name changes, sudden moves to Li from unrelated sectors, repeated touting of links to Albemarle’s Silver Peak brine operations, Tesla Motors, it’s giga-factory, Elon Musk, aggressive valuations, etc. Notably, Li juniors sometimes fail to mention where reported lithium values come from and other important information like brine chemistry. Li concentrations in surface samples are not readily comparable to those found in brine solutions. They represent different things. Vague reporting of Li values leads readers to scan press releases looking for the highest reported Li parts per million (“ppm”) number, irrespective of comparability across companies.
Four NV focused juniors (of more than 30 I’m monitoring) have sizable market caps (C$30 -C$90 million). Dajin Resources Corp, (TSX-V: DJI) (OTC: DJIFF) (Frankfurt: A1XF20) (“Dajin”) is not one of those four, it hosts acreage (hectarage) in both NV & Argentina (“ARG”). Dajin’s controlled land package in ARG encompasses about 230k acres (~93k hectares), larger than that of Lithium Americas (TSX:LAC). As an aside, Li junior exposure can also be had in exciting places like Mali, Namibia, Tanzania & Zimbabwe….
NV is a hotbed of Li speculation, but caveat emptor, readers must be careful in equating a Li land rush with that of say an oil & gas “fracking,” frenzy. A promising oil & gas play can be drilled relatively quickly, establishing it as prospective for hydrocarbons, or better suited for cultivating cannabis. Remember, proximity to potential economic Li concentrations is much more important than proximity to Tesla Motor’s (TSLA) giga-factory!
Dajin Resources has accomplished more than most in Nevada
Dajin is an example of a Li junior with staying power. Led by an experienced and respected team including technical advisors & consultants, it has been operating with boots on the ground in Nevada for about two years and over six years in ARG. Six of eight team members listed on Dajin’s website have direct experience spanning geology, mining, drilling, green field exploration, exploration techniques, regional mapping, geoscience, hydrology, project management, social responsibility, geothermal energy & volcanism. Several team members also have experience on the ground in NV & ARG.
In a prior article on Epstein Research I explained why Dajin is well ahead of most global Li juniors. In this article I discuss the under-reported issue of NV water rights. Essentially, there are a few dozen NV focused Li juniors, most clustered in a few basins spread across a few counties. How will half, a quarter or even an eighth of these aspirants obtain water rights in a timely fashion, without undue expense?
Expert, highly experienced consultants are essential when pursuing water rights. Yet, how many NV water rights experts are out there? How many Nevada Division of Water Resources (“NDWR”) State engineers are there? Enough to process potentially a few dozen applications? A good way to introduce the topic is by describing a recent action taken by Albemarle Corporation (NYSE: ALB).
Water rights could be a showstopper for Nevada Li juniors
Albemarle filed an official protest with the NDWR against a Li junior’s application to transfer the “Place of Use” and “Point of Diversion” of a recently acquired water rights permit in Clayton Valley, NV. The dispute involves a pre-existing certificated water rights permit allowing 1,770 acre feet ((~1.233 million liters / 325.9k gallons) per year of water use for mining & milling. The junior filed an application to transfer the water permit from its current location to a location about 8 kms (~5 miles) from the nearest lithium brine production well of Albemarle’s Silver Peak Li operations.
Opposition by Albemarle in Clayton Valley underscores important points about water rights in NV. For example, not only can a new application be contested, but an application to transfer a permit is sometimes subject to the same potential for opposition. Dajin’s expert water rights consultant told me the quickest an uncontested water rights permit in NV might be issued is approximately 3 months. Most take 6-12 months
The sale, purchase and lease of water rights is routine across the State. However, by no means does attempting to buy a permit speed things up. A permit cannot be sold or leased to another party for a different use, unless an application is submitted to the NDWR and approval is granted.
The NDWR reviews all applications with respect to four broad questions. First, is there unappropriated water in the basin? 2) Would the granting of a permit impact existing rights? 3) Would granting a permit be in the public interest? 4) Are municipal (domestic wells) properly protected? Further, in NV, surface rights are separate from underground rights. This makes the reporting requirements (studies, data, testing, modeling) more costly, challenging and time consuming. It’s clear to me that this process is more of an art than a science.
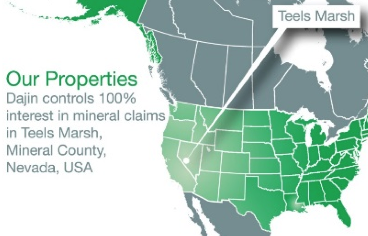
Applications are processed on a first received basis, sequentially, one at a time. Application(s) at the top of the line can materially delay those in waiting. Getting an application in front of NDWR is becoming harder to accomplish. In May, Dajin was granted underground water rights 1,000 acre feet per year, for its 100% owned Teels Marsh Li project in Mineral County, NV. This quantity of water requested represents the total amount of unappropriated groundwater that existed in the Teels Marsh when the application was filed. From the May 26, 2016 press release, quote,
Dajin believes that the acquisition of water rights is an important aspect of Lithium brine extraction and processing. Low cost and time proven traditional extraction methods require concentration of brines by evaporation in surface ponds. New technologies are being developed that use less water and can potentially return processed water to the reservoir. However, Dajin wishes to maintain maximum flexibility in the adoption of any future process technology for the extraction of Lithium from brine at Teels Marsh, hence the acquisition of water rights is an important step forward in Dajin’s development plans.
Water rights just one of many requirements
And now the bad news…. a water rights permit is just one of many hoops to jump through, all exploration activities require approvals. For Teels Marsh alone, Dajin planned, funded, applied for and received permits, retained experts, performed and successfully completed; seismic, gravity & geoprobe surveys, auger brine and sediment sampling, stratigraphic analysis, the collection of magnetic & geochemical data. Exploration work in NV is conducted with the granting of Notices of Intent, which allow for exploration activities contained within a 5 acre disturbance area. New Notices of Intent are required each time a new activity is proposed and reclamation is required after the work is completed.
All of this heavy lifting feeds into a model, the inputs forming a 3-D image that helps inform the structure of the basin. Understanding the structure increases the odds of choosing optimal drill targets. In addition, the data obtained from the reports, analysis, sampling & surveys has to be complied (along with base-line studies & documentation) and incorporated into a Plan of Operations to be submitted to the Bureau of Land Management (BLM). Upon approval, a company has much more flexibly to operate and drill cost-effectively, as the 5-acre constraint is removed.
Dajin has completed all of this at Teels Marsh. Recently, management retained experts to help prepare its Plan of Operations, which is expected to be granted by mid-2017.
Please consider the wisdom of George Harrison,
“But it’s gonna take money
A whole lot of spending money
It’s gonna take plenty of money
To do it right….”
“It’s gonna take time
A whole lot of precious time
It’s gonna take patience and time, um
To do it, to do it, to do it, to do it, to do it
To do it right!”
Yes, everything takes time (money), more time (money) than expected, more time (money) than investors have patience for. Presumably, timespans will grow even longer. Scary news for most companies jumping on the Li bandwagon this Spring & Summer, but an outcome that Dajin has prudently planned for and executed on since mid-2014.
Disclosures: The contents of this article are for informational purposes only. Readers fully understand and agree that nothing contained herein, including but not limited to, commentary, opinions, views, assumptions, reported facts, calculations, etc. is to be considered, in any way whatsoever, implicit or explicit investment advice. Further, nothing contained herein is a recommendation or solicitation to buy, hold or sell any security. The content contained is not directed at any individual or group. Peter Epstein and Epstein Research [ER] are not responsible, under any circumstances whatsoever, for investment actions taken by the reader. Peter Epstein and [ER] have never been, and are not currently, a registered or licensed financial advisor or broker/dealer, investment advisor, stock broker, trader, money manager, compliance or legal officer, and they do not perform market making activities. Peter Epstein and [ER] are not directly employed by any company, group, organization, party or person. The shares of Dajin Resources are highly speculative, not suitable for all investors. Readers understand and agree that investments in small cap stocks can result in a 100% loss of invested funds. It is assumed and agreed upon by readers of this article that they will consult with their own licensed or registered financial advisors before making any investment decisions. At the time this article was posted, Peter Epstein owned shares of Dajin Resources and the Company was a sponsor of Epstein Research. Any comparison between or among stocks is for illustrative purposes only and should not be taken as fact or relied upon. Readers understand and agree that they must conduct their own due diligence above and beyond reading this article. While the author believes he’s diligent in screening out companies that, for any reasons whatsoever, are unattractive investment opportunities, he cannot guarantee that his efforts will (or have been) successful. Mr. Epstein & [ER] are not responsible for any perceived, or actual, errors including, but not limited to, commentary, opinions, views, assumptions, reported facts & financial calculations, or for its completeness. Mr. Epstein & [ER] are not expected or required to subsequently follow or cover events & news, or write about any particular company or topic. Mr. Epstein and [ER] are not experts in any company, industry sector or investment topic.

Gold’s mighty new bull market this year has been amazing, the result of heavy buying by investors and speculators alike. But these latter traders have pumped so much capital into gold futures that this metal now faces a record selling overhang. Since the hyper-leveraged nature of futures trading demands an ultra-short-term focus, speculators’ excessive bullish bets on gold pose major near-term downside risks.
Gold’s price trends are overwhelmingly dominated by global investment demand. Even though it has only accounted for about 1/5th of total demand in recent years, investment is wildly variable. With the rest of gold demand relatively stable, it is fluctuating investment demand that ultimately sets gold prices at the margin. Gold’s young bull in 2016 is largely the result of an influx of massive investment buying.
These investors are usually strong hands, expecting to hold gold for the long term as a unique and essential portfolio diversifier that moves counter to stock markets. Gold investors generally buy gold outright, or at worst using the decades-old legal limit of leverage in the stock markets of 2.0x via the leading GLD SPDR Gold Shares gold ETF. Thus normal short-term price volatility doesn’t spook investors into selling.
Futures speculation is an entirely different game. These traders don’t actually buy and sell physical gold, but merely the contractual rights to buy or sell it later in the future at set prices. This is a side game of pure gambling, nothing like investment. Futures speculators never have any intention of buying gold to own it, and they short sell gold they don’t own. Their world is virtual, totally divorced from supply and demand.
But unfortunately the gold-futures price set by their trading has long been considered the benchmark world gold price! The gold-futures bets speculators are collectively making as a herd not only drive but dominate most short-term gold action. Since real investors make their buying and selling decisions based on this essentially-fictional gold-futures price, futures trading has a disproportionate impact on gold.
The sad fact that paper-gold trading far outguns physical-gold trading in determining short-term pricing has long vexed gold investors. This is a major problem because futures speculators’ time horizons are vastly shorter than normal investors’. The extreme leverage inherent in futures trading forces its entire focus to be ultra-short-term. These elite traders have to be momentum players to survive, there’s no other option.
A single US gold-futures contract traded on the CME’s COMEX market controls 100 troy ounces of gold. That’s worth $135k at $1350 gold, a serious sum of capital that excludes all but the biggest traders from the futures realm. If futures had the same maximum margin as stocks of 2.0x, the incentives and time horizons of futures speculators would closely match long-term investors’. But regrettably that’s not the case.
This week, the minimum cash margin required to be deposited for each gold-futures contract was merely $6k. For just $6000, speculators can own the price action of 100 ounces of gold. At $1350, that works out to maximum leverage of 22.5x! Every 1% move in the gold price is instantly amplified into 22.5% gains or losses for speculators. That’s exceedingly risky if not insane, extreme leverage creates extreme risk.
Gold-futures speculators running minimum-margin maximum-leverage would be wiped out, take 100% losses of their capital bet, with just a relatively-small 4.4% adverse move by gold against their bets! Such hyper-leverage is nearly impossible for investors to imagine. And even if conservative speculators keep triple the minimum margin, that’s still 7.5x leverage which is far beyond anything investors will ever experience.
Such extreme leverage demands an ultra-short-term focus, forcing all futures speculators to be myopic momentum players. In order to survive, all they can care about is which direction gold’s next 5% move is heading in. The long-term trends, whether gold is enjoying a secular bull or mired in a secular bear, are almost completely irrelevant. Gold’s likely coming daily and weekly performances are all that matter.
And unlike investors, futures speculators can earn huge amplified gains whether gold is rising or falling. They are totally agnostic, they don’t care either way as long as they bet right. They buy long-side gold futures if they expect gold to rally in the near future. They short sell gold futures if they expect gold to fall in coming weeks. Also unlike investing, these futures contracts formally expire in a matter of months.
This further compounds the extreme short-term focus of futures speculation. Since these traders have no desire to end up owning physical gold, they have to exit all their positions before their contracts reach maturity. This is done by executing the opposite trades. Longs are closed by selling gold futures, while shorts are closed by buying them. This collective gold-futures trading action greatly impacts gold pricing.
Imagine gold’s prevailing supply-and-demand-driven trend as a straight line, rising in bull markets on mounting investment demand or falling in bear markets on waning investment demand. Futures trading temporarily forces gold off this core fundamental line, in bulls and bears alike. Excessive gold-futures buying or selling briefly pulls gold above or below where it should be based on prevailing fundamentals.
And that’s the problem facing gold today. Futures speculators as a herd have become wildly bullish on the yellow metal, ramping their leveraged long bets to record levels! This chart superimposes gold on the total long and short gold-futures contracts held by speculators, as reported by the US Commodity Futures Trading Commission in its famous weekly Commitments of Traders reports released every Friday afternoon.

CoT reports are current to the preceding Tuesdays, so July 5th was the latest data available when this essay was published. It revealed speculators’ total gold-futures long contracts held has soared to 440.4k! This level is astounding, the highest seen in the 17.5 years of our dataset running back to early 1999 and almost certainly the highest ever witnessed. Speculators’ gold-futures longs are at all-time record highs!
So what you might wonder, why does this matter? With a mighty new bull market in gold underway for the first time in years, doesn’t it make sense for futures speculators as a herd to be overwhelmingly bullish today? They are ultra-short-term momentum players by necessity, and gold’s trend this year has been sharply higher. So why not be excessively long with hyper-leveraged bets? I hear this argument often.
The problem is speculators’ collective gold-futures bets have long proven a powerful contrarian indicator for gold! Given the extreme risks they choose to take and the amount of capital they throw around, the futures speculators are no doubt elite traders. But they’re still susceptible to the same popular greed and fear, the herd groupthink, that plagues all investors and speculators. Their emotions peak at the wrong times.
Futures speculators get the most bullish as a herd, as evidenced by high longs and low shorts, right as gold is hitting major interim peaks. They wax the most bearish, with low longs and high shorts, just as gold is carving major short-term bottoms. These guys are wrong at price extremes just like everyone else. I’ve observed this phenomenon unfold in real-time for many years, and the historical data proves it.
This chart encompasses the great recent gold bull and bear. Gold powered 166.5% higher between its stock-panic low in November 2008 to its latest secular peak in August 2011, a mighty run. Then gold suffered a brutal 44.5% loss by December 2015 after the Fed’s first rate hike in nearly a decade. These were major secular events by any standard, in which futures speculators’ bets marked major interim highs.
These short-term peaks in the gold price are highlighted in this chart with light-blue columns. The vast majority of major interim highs gold hits in bull and bear markets are driven by speculators ramping their long gold-futures bets to major highs. Gold experiences short-term toppings whenever speculators get excessively bullish. And their long peaks are always short-lived, as they must soon unwind these big positions.
So regardless of how awesome gold’s young new bull market is today, or how many years it is likely to power higher on balance based on strong fundamentals, speculators’ new record-high long positions are a serious near-term threat. We’ve just witnessed what is likely the most epic expansion of speculators’ leveraged upside gold bets in history. And they never plateau after a peak, they always soon collapse.
Remember the only way for futures speculators to exit long positions without taking physical delivery of gold which they don’t want is to sell gold futures. As this chart shows, that subsequent gold-futures selling unfolds rapidly and is proportional to the preceding long ramp. So gold faces potentially-extreme gold-futures selling pressure in the near-term until speculators’ excessive longs are largely unwound.
This next chart zooms in to this same dataset over the past 3.5 years or so, offering more detail. Almost all of gold’s major interim highs in recent years resulted from futures speculators getting too bullish. And those all saw gold soon fall sharply as these traders aggressively sold gold futures to offset and close their excessive long positions. This year’s epic extreme long ramp utterly dwarfs anything seen in recent years.

At this scale the major contrary implications of speculator gold-futures long bets surging to high levels in recent context are even clearer. These elite traders buy aggressively, driving gold up to major interim highs. Then something spooks them and they quickly start unwinding these risky hyper-leveraged bets through offsetting selling. And that drives sharp gold selloffs until overall futures bets are normalized.
Back on New Year’s Eve 2015 when gold remained universally despised and languished near major secular lows, I made a ridiculed contrarian bullish call on gold. I published an essay called “Fueling Gold’s 2016 Upleg” in which I concluded, “The bottom line is gold is poised for a mighty upleg in 2016” largely because “resulting bearishness left gold-futures speculators’ bets at epically anomalous levels”.
Around gold’s major 6.1-year secular low in mid-December driven by that initial Fed rate hike, the total longs held by futures speculators were way down at 191.2k contracts. That was a major low as I pointed out at the time, and as you can see here. With futures speculators so overwhelmingly bearish as evidenced by relative-low longs and high shorts (183.0k contracts), they would soon have to do some major buying.
In the 6.7 months between that secular low and gold’s latest major interim high last Friday, gold has powered 29.9% higher to enter its awesome new bull. But this was largely driven by futures speculators adding an astounding 249.2k long contracts while covering 82.8k shorts, both of which mean buying gold futures aggressively. That was the equivalent of utterly massive amounts of notional gold buying.
Speculators buying an additional 249.2k long contracts equates to 775.0 metric tons of gold being purchased in the futures market, causing a proportional price impact! The 82.8k short contracts they covered in that span equates to another 257.5t of buying. In just under 7 months, these traders bought the gold-futures equivalent of a staggering 1032.4t of gold! That far eclipses gold investment demand over that span.
The best proxy for investment demand is the capital flows into that leading American GLD gold ETF. In Q1, the latest quarter where comprehensive global gold supply-and-demand data is available, fully 80.6% of the rise in world gold demand came from GLD buying alone! During that same 6.7-month span of gold’s new bull, total GLD differential buying was only 351.1t. That’s only about a third of speculators’ demand!
So while 2016’s massive ongoing investment demand will likely offset significant gold-futures selling by speculators, it won’t be sufficient to absorb the majority of their selling. So gold faces serious downside risks in the near-term until speculators’ excessive longs are mostly unwound. Record gold-futures long positions mean a record gold-futures selling overhang, and that will likely unfold rapidly due to futures leverage.
With a new bull underway, I don’t think speculators’ gold-futures longs will have to fully retreat to their late-2015 secular-bear levels that sunk as low as 186.7k contracts. Between 2009 to 2012, gold’s last normal years before the Fed’s extreme QE3-driven market distortions starting in 2013, speculators’ total gold-futures longs averaged 288.5k contracts per the weekly CoTs. That’s a reasonable downside target.
Merely to mean revert back to that normal average well above recent years’ depressed levels, speculators will have to sell 151.9k gold-futures contracts to offset and close their excessive longs. That works out to the equivalent of an incredible 472.4t of gold! And because gold futures are so hyper-leveraged, selling in them quickly cascades. Early sellers drive gold’s price lower, forcing more traders to exit before they’re ruined.
The more speculators sell gold futures, the faster that benchmark gold-futures price falls, forcing even more speculators to exit their long positions. Futures selling rapidly feeds on itself. So normalization selling after speculators make excessive long bets is fairly rapid, unfolding over a month or a few on the outside. Even assuming 3 months, that equates to an overwhelming 157.5t of gold selling per month!
GLD’s biggest monthly build in 7.0 years happened in February, and it was only 108.0t. GLD’s average monthly build in the first half of 2016 was merely 51.3t. So there is simply no way even excellent gold investment buying can hope to offset the magnitude of gold-futures selling by speculators after their long bets soared to this all-time record high. And that’s not even counting new gold-futures shorting.
As speculators close their excessive longs by selling gold futures, the falling gold price will motivate other speculators to add new short positions. These are created by selling gold futures just like when longs are closed. With speculators’ downside bets on gold near major lows recently, there is big potential shorting that will likely flare up before it is exhausted. That compounds gold’s near-term downside.
We had a little taste of what cascading gold-futures selling can do back in May, even without new short selling. Heavy speculator gold-futures buying pushed gold to a new bull-market high at the end of April, catapulting their total longs to a then-record 389.7k contracts. Gold drifted sideways for a week or so, but soon Fed hawkishness spooked futures speculators into selling. So gold fell 6.5% in just over a month.
Speculators rapidly exited just 67.8k long gold-futures contracts during May, the equivalent of 210.8t of gold. And that was offset by only 43.7t of gold buying via GLD shares. So the next gold selloff driven by these excessive bullish bets held by speculators will likely be considerably larger. May also had the benefit of strong gold seasonals, but now gold is languishing in its weakest time of the year seasonally in mid-summer.
The catalyst that ignites the cascading gold-futures selling triggering the collapse of that record selling overhang will likely be Fed hawkishness. Despite the proven historical fact gold thrives in Fed-rate-hike cycles, myopic futures speculators have falsely convinced themselves rate hikes are gold’s ultimate nemesis. Fed hawkishness not only drove May’s selloff, but gold’s late-2015 one dragging it to major secular lows.
Top Fed officials really want to hike rates, as they have no conventional easing ammo left for the next market crisis if they don’t. After the surprise victory of that successful British vote for independence from the domineering EU bureaucrats in late June, federal-funds-futures-implied odds of Fed rate hikes at its upcoming FOMC meetings collapsed to zero. Futures traders went so far as to actually expect a cut!
This stock-market-obsessed Yellen Fed will never act unless rate-hike expectations leading into any particular FOMC meeting are well over 50%. The FOMC doesn’t want to surprise the stock markets and spark a major selloff. So Fed officials have herculean jawboning ahead of them to once again work to convince traders that more rate hikes are still coming. Hawkish talk will once again spark gold-futures selling.
So while I remain very bullish on gold in the coming years for core fundamental supply-and-demand reasons, this metal faces serious risks for a major short-term selloff. Whenever speculators grow too bullish as a herd, making excessive upside bets on gold, major interim tops occur. And the subsequent cascading gold-futures selling to normalize speculators’ collective positions is invariably fast and furious.
Such futures-driven selloffs offer the best buying opportunities ever seen within ongoing gold bull markets! If you want to add more gold via physical coins or that GLD ETF, you’ll almost certainly get a much better entry point after speculators’ excessive longs are largely unwound. This is also true for silver, since silver follows gold. Speculators’ silver-futures longs also just hit a new all-time record high last CoT week.
A futures-driven gold selloff will also hit the lofty stocks of the gold and silver miners and explorers. As I explained last week, they are certainly due for a correction after such record summer gains. That is a great boon for investors and speculators alike looking to add more gold-stock and silver-stock positions near lows as we are. So anyone interested in precious metals needs to watch speculators’ gold futures very closely.
We do at Zeal, since they have a dominant impact on short-term gold prices. Each week I carefully study and analyze the current gold-futures situation, and report the resulting implications and outlook to the subscribers of our popular weekly newsletter. Staying informed is essential to success in the markets, as that’s the only way you’ll know about buying and selling opportunities in real-time before they quickly pass.
We also publish an acclaimed monthly newsletter, and both will help you stay abreast of the markets. They draw on our vast experience, knowledge, wisdom, and ongoing research to explain what’s going on in the markets, why, and how to trade them with specific stocks. They’ve really helped our subscribers multiply their wealth over the years, with all 832 realized stock trades since 2001 averaging excellent annualized realized gains of +16.7%! For just $10 an issue, you can learn to think, trade, and thrive like a contrarian. Subscribe today before the next big gold-stock buying opportunity arrives!
The bottom line is gold faces a record futures selling overhang today. Speculators have succumbed to euphoric groupthink again, becoming incredibly bullish as a herd. They just ramped their upside gold-futures bets by an extreme amount to an epic new all-time record high. All these excessive longs will have to be unwound by selling before expiration, and once futures selling starts it rapidly snowballs.
Gold sees major interim tops in bulls and bears alike whenever speculators’ long positions surge up to relatively-high levels, let alone extremes. While these elite traders don’t control gold’s long-term trends driven by fundamentals, their collective trading can sure bully gold around over the short term. But the unwinding of speculators’ excessive gold-futures longs offers some of the best mid-bull buying opportunities.

1. Gold stocks continue to take out key highs, but in the big picture, the upside action has barely started.
2. Please click here now. Double-click to enlarge this quarterly bars XAU index versus gold chart.
3. A multi-decade rise in gold stocks versus all other assets is likely beginning. Institutional money managers are buying on days of strength, weakness, and sideways price action!
4. Why are these money managers so enthusiastic about gold, and even more enthusiastic about gold stocks?
5. Well, central banks around the world are engaged in a bizarre policy of low interest rates and quantitative easing that is ostensibly designed to “kickstart the economy”, but is really designed to allow governments to borrow and spend until the cows come home.
6. Negative interest rates allow governments to borrow money, and make a profit on their reckless actions. In America and Japan, where a lot of citizens are elderly, negative real interest rates on pensioners is very destructive.
7. In Japan, most pensioners lost large amounts of money in the huge equity bear market that began in 1989. Now, the remnants of those investments are subject to negative interest rates. They are pulling money out of the banking system, holding cash, and buying gold.
8. American bank loan profits have been in a twenty-year bear cycle, and so has money velocity. Savings are funnelled to government, where it is quickly spent on bizarre and violent programs to promote regime change in Muslim nations.
9. Most government spending is a useless endeavour that gives almost no boost to GDP. Please click here now. The US government is particularly notorious for wasting money on a vast array of guns and bombs, while refusing to buy a dying elderly citizen a needed prescription pill.
10. Horrifically, as India’s top central banker found out the hard way, if central bankers don’t print money for governments to spend on a regular basis, governments will find another “whipping boy” who will do what is asked of them.
11. So, most of the world’s central banks continue their policy of low/negative rates and QE. This is a very dangerous situation, and it is causing top institutional money managers to worry about the growing likelihood of a global sovereign bond crisis.
12. Gold is their only protection against that type of crisis, and right now these money managers are clearly engaging in significant buying in the gold market. What about gold stocks?
13. Well, a bond market crisis can create massive inflation in the current situation, because so much money is sitting idle at the Fed. Interest rates soar during a credit market crisis. Money pours out of government bonds and into the private economy. Stock markets can crash horrendously as that happens, and gold stocks become the go-to asset for institutions.
14. Please click here now. Double-click to enlarge this important GDX weekly chart. The surge to above the highs of 2014 and 2015 is turning the $27-$28 price zone into massive support.
15. All $2 – $3 corrections in the GDX price can be bought by gold stock enthusiasts with a smile, because that’s what a myriad of institutional money managers are doing. The Western gold community needs to let go of all bad past memories, grab this exciting gold stocks bull by the horns, and enjoy the ride!
16. Please click here now. Double-click to enlarge. Gold is moving higher in an up channel that looks like it was sculpted by Michelangelo.
17. Please click here now. China is an emerging economic empire, but all empires have horrible recessions and financial market crashes.
18. Chinese banks have seen their loan profits squeezed by the government’s policy of chopping rates. A potential Chinese banking crisis is really just another part of a looming global sovereign bond crisis. If such a crisis occurs, citizens and institutions in China will rush to buy more gold.
19. Please click here now. Double-click to enlarge. Silver now has what appears to be a bull flag pattern in play. A pullback within the pattern is likely now, but an upside breakout would suggest silver is going to $26 quite quickly.
20. If governments continue to pressure central bankers to keep chopping sovereign bond interest rates so they can borrow insane amounts of money and waste it, silver will benefit nicely from the safe haven flows into gold.
21. On the other hand, if central bankers raise interest rates in an attempt to force governments to act responsibly, that will incentivize banks to move money out of government bonds and into the private sector, which is inflationary. Silver will do extremely well in that situation.
22. For the first time in history, all US central bank actions are bullish for the entire precious metals sector.
23. Hillary Clinton wants to spend vast amounts of money that the government doesn’t have. Don Trump wants to increase the already beyond-insane military budget.
24. With both presidential candidates appearing eager to grow government size, the US central bank may have to revalue gold. If the Fed hiked rates aggressively, the US government could collapse. A gold revaluation policy would restore the government’s balance sheet and credit rating. A revaluation would also essentially devalue the fiat-oriented West, and revalue the citizens of India, who hold titanic amounts of gold. India, most of China, and the tiny Western gold community are probably on the cusp of a “bull era”. That era would be launched by central bank gold revaluation to either avoid a sovereign debt crisis, or to solve it. Good times are now here for gold-oriented investors, and even better times lie just ahead!
Stewart Thomson of Graceland Updates, Guest Contributor to MiningFeeds.com
The red-hot gold miners’ stocks have continued blasting higher this summer on heavy ETF buying by professional money managers. Funds’ ongoing big capital inflows into this market-leading sector have overcome its usual summer seasonal weakness. While gold stocks’ odds-defying record early-summer surge certainly ramps short-term downside risk, this year’s dazzling new gold-stock bull still remains young.
Managing other people’s money is a hard and challenging job. Investors naturally expect and demand healthy returns after entrusting their hard-earned wealth to financial professionals. And if these fund managers fail to deliver, investors are quick to pull their capital and move it elsewhere. So the money-management industry faces staggering pressure to perform. The funds that don’t measure up risk extinction.
The surest way to find the best short-term performance is to chase winning sectors, so most professional money managers are momentum players. When they see outsized gains, they are quick to deploy their investors’ capital to partake. And that’s led them to gold stocks. In the first half of 2016, the flagship HUI gold-stock index rocketed 121.8% higher compared to a mere 2.7% gain in the benchmark S&P 500 index!
With such epic results, even relatively-small gold-stock allocations in portfolios can really boost their overall gains. So following the successful Brexit vote in late June that reversed gold sharply off lows, fund managers started flooding into leading gold-stock ETFs. These capital inflows accelerated into the end of Q2 on window dressing, where fund managers buy a quarter’s winners before they report to their investors.
These money managers believe reporting that their funds own high-performing stocks in their quarterly updates make them look smarter. But window dressing is deceptive, since funds buying a quarter’s best performers at quarter-end didn’t actually reap their big gains! With gold stocks now firmly on fund managers’ radars, their heavy ETF buying continued in the initial days of Q3 as they put new capital to work.
Like most ETFs, gold-stock ETFs track underlying indexes. Thus when a gold-stock ETF sees a big surge of differential buying from fund capital inflows, its shares threaten to decouple from its index to the upside. So to maintain tracking, the ETF managers have to issue enough new ETF shares to offset that excess demand. They then use the proceeds to buy shares in the actual underlying gold stocks they own.
Because 2016’s new gold-stock bull has been driven by heavy fund buying of ETF shares, the gold stocks owned by the leading ETFs have enjoyed the greatest gains. While nearly all the world’s biggest and best gold miners’ stocks are included in these ETFs, the ones that aren’t are really underperforming their peers. For better or worse, ETFs are how most investors and fund managers choose to own gold stocks.
The leading gold-stock ETFs are the GDX VanEck Vectors Gold Miners ETF for the major gold miners, the GDXJ VanEck Vectors Junior Gold Miners ETF for the smaller miners and explorers, and the SIL Global X Silver Miners ETF for the silver miners. The companies that these ETFs own have seen some of the best gains in 2016, as ETFs have to spread their capital inflows proportionally across their holdings.
But is this amazing gold-stock surge sustainable? There’s definitely still vast room left for professional money managers to add gold-stock exposure in these leading ETFs. As of this week, GDX, GDXJ, and SIL had total net assets of just $10.7b, $4.2b, and $0.4b! These are rounding errors compared to the vast sums of capital invested in funds, so overall fund exposure to gold stocks via these ETFs is still close to zero.
All this heavy fund buying in recent weeks has certainly left gold stocks very overbought on a short-term basis. So if the money managers scale back their big capital inflows, that will probably result in a considerable pullback or correction. But from anything beyond a near-term perspective, the gold stocks don’t look toppy at all despite their extraordinary surge so far this year. Their new bull remains quite young.
This first chart encompassing the last few years or so helps put gold stocks’ blistering recent-weeks surge into perspective. It looks at that leading HUI gold-stock index, which is closely mirrored by GDX. Using the HUI for any technical analysis beyond a few months is preferable because this index doesn’t have management fees. GDX’s managers are paid a 0.52%-of-assets fee annually, slowly skewing its results.

The flagship HUI gold-stock index has skyrocketed a truly-astounding 169.9% higher in just 5.6 months since mid-January! That certainly sounds ridiculously extreme in isolation, but context is crucial here. The HUI had been bludgeoned to fundamentally-absurd 13.5-year secular lows in January. The gold stocks were trading as if gold had utterly cratered to $305, yet it was actually 3.6x higher near $1087.
I wrote an essay that very secular-low week pointing out the fundamental ridiculousness of that pricing anomaly, urging investors to aggressively buy gold stocks just as we and our subscribers did. With this sector never trading lower relative to the price of gold which drives its profits, there absolutely had to be a massive mean reversion higher. That’s the whole story of gold stocks’ new bull, an unwinding of extreme fear.
Last summer a major gold-stock uptrend off deep secular lows suffered an anomalous breakdown after extreme gold-futures shorting sparked panic selling in gold stocks. Up until gold stocks’ sharp post-Brexit surge in recent weeks, all they did was regain that late-2014-early-2015 uptrend channel that had been unrighteously shattered. Gold-stock prices still remained extraordinarily low in the grand scheme.
After soaring dramatically into late April, the HUI consolidated high within that old uptrend between then and late June. That consolidation trading range ran between roughly 200 and 240, far above the 100 secular low of mid-January. It wasn’t the Brexit surge that broke gold stocks out of this consolidation, that only pushed the HUI back up to 240 resistance. This sector’s rare summer breakout came a week later.
Starting on the last 2 trading days of June and Q2, and continuing in the first 3 of July and Q3, funds poured capital into the leading gold-stock ETFs. They were likely window dressing their portfolios before reporting to their investors at the end of last quarter, then deploying fresh capital into gold stocks at the start of this quarter. This catapulted the HUI 14.9% higher in just 5 trading days as of this Wednesday!
Such a big, decisive breakout is radically unprecedented in the summer months. June and July have always been gold stocks’ weakest time of the year seasonally. Before we dig into that though, these fund-ETF-buying-driven gold-stock levels simply aren’t extreme. The HUI was merely trading at a 2.9-year high in the middle of this week after all that surging! That’s far from an ominous major secular peak.
But with the HUI stretching 70.0% above its 200-day moving average, gold stocks are definitely very overbought on a short-term basis. But such overextendedness just portends a short-term pullback or correction. Back at the end of April, the HUI had rallied so far so fast that it had soared 73.8% above its 200dma. These are very extreme readings by any measure, far beyond anything normally witnessed!
Yet the gold stocks didn’t collapse out of that epic late-April overboughtness. While the HUI suffered a healthy 14.8% correction over the next month or so that bled off late April’s excessive greed, that was just part of a larger high consolidation. That sideways grinding not far off gold stocks’ recent super-overbought peak laid the technical and sentimental foundation from which this past week’s major breakout launched.
While that heavy gold-stock-ETF buying by money managers has left this sector very overbought again, gold stock prices are still relatively low. They have merely regained the already-low levels of recent years prior to last summer’s anomalous breakdown. So although gold stocks face another consolidation or correction from these latest super-overbought levels, that’s probably the full extent of their near-term risk.
Now with today’s overall gold-stock-ETF holdings still so utterly trivial compared to the trillions of dollars of capital the fund industry controls, money managers inarguably have vast gold-stock buying left to do. If they want any meaningful overall-portfolio boost from these new precious-metals bulls, they are going to have to raise their almost-nonexistent exposure dramatically to at least 5%. That will take huge buying.
So it’s tempting to expect the torrid capital inflows into gold stocks seen in the past week to continue. But that’s really unlikely. Window dressing only happens at the end of quarters, and it’s a long way to the end of Q3. And early-quarter deploying of fresh capital from investors peaks early in quarters, as the fund managers rush to put this money to work as quickly as they can. They aren’t paid to just sit in cash.
Thus while fund gold-stock-ETF buying will indeed likely continue in the coming months and years, it can’t stay as intense as it’s been this past week. Markets, and capital flows, are forever cyclical. Gold-stock prices naturally flow and ebb just like everything else in the markets. And following such a blistering surge, the near-term gold-stock downside risk is considerable. Especially in the middle of summer.
This next chart looks at gold stocks’ summer performances per the HUI in the bull-market years between 2001 and 2012. Between November 2000 and September 2011, the HUI skyrocketed 1664.4% higher in that 10.8-year secular span! So if there were ever summers where gold stocks should’ve performed strongly, those were it. Yet the radically-unprecedented record strength we’ve seen this summer dwarfs them.
I discussed these summer-seasonal charts a couple weeks ago, but here’s the gist. Each year between 2001 to 2012, and 2016, has the HUI indexed to its final close in that particular May. That’s set at 100, with all price moves recast off it. A HUI level of 105 is up 5% from its May close, for example. Each year between 2001 to 2012 is shown in yellow, and their average in red. This year’s HUI action is rendered in blue.

Between the end of May and the middle of this week, the HUI has soared 35.0% in 5 weeks! That is so far beyond unprecedented even in the mightiest of bull-market years that it defies belief. As this chart reveals, no other modern bull-market summer has even come close. 2016’s gold-stock performance in June and early July is in a league of its own. The sheer anomalousness of this summer breakout is concerning.
Normally the gold stocks as represented by the HUI meander in a boring sideways grind in June and July between about 10% below to 10% above their May closes. By July’s third trading day, which was this Wednesday, the HUI averages a 0.9% loss from its May close. So to see it 35.0% above the levels where it entered summer is mind-boggling. Even on a short-term basis, extremes beget mean reversions.
On average, gold stocks see a major seasonal low in bull-market years in late July 3.6% under their May close. Historically this late-July timeframe has proven the best time of the summer to add new gold-stock positions. The gap between where the HUI is today and where seasonals argue it very well could be in a few weeks is massive! Gold stocks’ downside risk in the summer doldrums is serious from today’s lofty levels.
So odds are gold stocks will at least suffer a pullback and quite likely a full-blown correction exceeding 10%. Remember that the last time gold stocks were so overbought in late April, the HUI fell nearly 15% in the subsequent weeks. Money managers could short-circuit this natural sentiment rebalancing if they keep migrating more capital into gold stocks by selling some of their other holdings, but that’s fairly unlikely.
But even if this extreme outsized record early-summer strength naturally mean reverts to late-summer weakness, this young gold-stock bull is far from over. This last chart looks at the long-term picture in gold stocks considered relative to the dominant driver of their profits and hence stock prices, gold. The HUI/Gold Ratio shows how cheap gold stocks remain relative to today’s gold prices, let alone tomorrow’s.

Despite gold stocks rocketing higher this year, they still remain very low absolutely and relative to gold. While this week’s 272 HUI may feel high compared to January’s extreme 101 secular low, it is still really low historically. With the exceptions of 2008’s short-lived stock-panic anomaly, and the extraordinarily-weak recent-years action spawned by the Fed’s stock-market levitation, today’s HUI levels are still super-low.
Ultimately all stock prices migrate to some reasonable multiple of their underlying companies’ profits. And in gold mining, earnings are almost exclusively driven by the price of gold. Since mine costs are essentially fixed in the planning stages when ore bodies are targeted and extraction methods defined, they generally don’t follow gold prices higher. Thus profits leverage and amplify moves in gold itself.
The HUI/Gold Ratio is a great proxy for this critical fundamental relationship between the gold stocks and the metal they mine. As of this Wednesday after all that heavy fund gold-stock-ETF buying, the HGR hit 0.199x. In other words, the HUI close was running about 20% of gold’s own close. While this was up 115.1% from the HGR’s all-time low of 0.093x in mid-January, it was still merely a 2.9-year high.
Recent years’ dismal gold-stock price levels were an extreme anomaly driven by Fed-levitated US stock markets, which crushed demand for alternative investments led by gold. Investors shunned everything but the endlessly-rallying stock markets, driving gold stocks to much-lower levels relative to gold than even those seen during 2008’s first stock panic in a century. Such extreme gold-stock pricing wasn’t normal.
Back in 2009 to 2012, the post-stock-panic years before the Fed ramped up its unprecedented open-ended QE3 campaign which levitated stock markets, the HGR averaged 0.346x. A mean reversion back up to these levels at $1300, $1350, and $1400 gold yields HUI targets of 450, 467, and 484. That’s another 66%, 72%, and 78% above this week’s summer-breakout levels, implying big gains likely from here.
And these mean-reversion gold-stock-bull targets are very conservative. Once price levels are forced to extremely-anomalous levels, the subsequent mean reversions in the opposite direction never stop at the means. Instead they overshoot proportionally to the other extremes. So gold stocks are almost certain to see far higher levels relative to gold than in that post-panic-average period. Pre-panic levels are actually likely.
In the long 5-year secular span between mid-2003 and mid-2008, the HGR averaged 0.511x. A mean-reversion overshoot back to there at $1300, $1350, and $1400 gold would yield HUI targets of 664, 690, and 715 which are 144%, 154%, and 163% above today’s levels! And this assumes gold itself isn’t going higher, which is silly given the massive investment buying gold has seen in 2016 as portfolio allocations rise.
Today’s gold levels are also relatively low compared to modern precedent. Back in 2012 for example, the last normal year before the Fed’s QE3 radically distorted the markets, gold averaged $1669. The HGR-implied HUI targets at those post-panic and pre-panic average levels with 2012 gold prices soar to 578 and 853! That’s 113% and 214% higher than this week’s latest HUI peak driven by heavy gold-stock-ETF buying.
So no matter what happens in the near-term, gold stocks’ bull-market upside from here remains vast. Gold-stock technicals are very overbought, and argue for a consolidation or correction after such fast gains. And the extreme record early-summer strength in gold stocks far beyond anything ever witnessed before certainly ramps the odds that a short-term mean reversion lower is inevitable. Mid-bull selloffs are typical.
Not only do they bleed away greed and rebalance sentiment to keep bull markets healthy, but selloffs are a great boon to investors and speculators alike. They offer the best times to add new positions at relatively-low prices within ongoing bulls. Prudent traders know there is no need to chase strong rallies and buy high, because they are always followed by buy-lower opportunities in consolidations or corrections.
So if you have existing gold-stock positions, make sure they are protected by trailing stops and enjoy this record early-summer rally. While I’m always wary of summers after decades of hard experience in gold stocks, this year I decided to hold 2/3rds of our wildly-profitable gold-stock trading book into summer in case the massive investment buying pushed gold even higher. I advised our subscribers to do the same.
But after such an extreme gold-stock rally counter to normal seasonal tendencies, it’s not wise to chase this sector’s record strength. Whether you are looking to add elite individual gold stocks with superior fundamentals like we own, or one of the leading ETFs like GDX, there’s no hurry. Don’t let your greed and excitement dupe you into buying high. Wait for the inevitable consolidation or correction to deploy!
The bottom line is gold stocks have just enjoyed a record early-summer surge. This was driven by heavy gold-stock-ETF buying by professional money managers, who want portfolio exposure to far-and-away the best-performing sector this year. Their resulting quarter-end and early-quarter buying has left gold stocks very overbought in their seasonally-weakest time, greatly ramping the odds of a near-term selloff.
Mid-bull selloffs after big moves higher are common, rebalancing sentiment which greatly extends bull lifespans. They offer the best opportunities for traders to add new positions at relatively-low prices. And make no mistake, gold stocks remain super-low absolutely and relative to the metal driving their profits. 2016’s dazzling new gold-stock bull remains young, with years left to run yet before it matures then peaks.
1. The gold price action in 2016 is now getting widespread attention. The upside fun can continue, but when “the crowd” is very excited about the next possible move, the wise professional investor takes the view that a more relaxed outlook may be in order.
2. Please click here now. Many economists are raising their upside price targets significantly, and most precious metals charts do look very good.
3. That’s all the more reason for investors to “enjoy the ride” at this point in time, rather than get overly excited about predicting the next price movement.
4. For now, investors should focus on the strong fundamentals that are in place for gold. It’s hard to do the opposite of what the crowd is doing all the time, but to achieve long term financial success in the gold market, that’s what must be done.
5. Please click here now. Double-click to enlarge. That’s the daily chart of the British pound versus the US dollar. The pound may be about to begin another Brexit-related leg down, from a bear flag formation. That’s good news for gold.
6. Please click here now. Double-click to enlarge this US dollar versus Japanese yen chart. Both the dollar and the pound are “risk-on” currencies, while the yen is a safe haven.
7. A new leg down for the dollar against the yen may be getting underway, and that’s also good news for gold.
8. Please click here now. Double-click to enlarge this phenomenal daily silver chart.
9. The recent silver price action is impressive, and resistance at $18 has now become solid support.
10. For a longer term look at the silver chart, please click here now. Double-click to enlarge.
11. Silver has surged close to the high of $21.44 hit back in 2008. Many investors have horrific memories of that period of time, and that former high may now act as a form of price resistance.
12. Silver often acts like a levered version of gold. I don’t think investors who feel the urge to buy silver now are making an error, given the huge amount of institutional enthusiasm for the entire precious metals sector that is occurring now.
13. Having said that, given the importance of the $21.44 price zone, a decline to about $18 could easily happen. I don’t think the next price movement can be predicted easily at this point in time, but if they are buyers now, silver-oriented investors should prepare themselves to take more buy-side action at $18.
14. Please click here now. Double-click to enlarge this important daily gold chart.
15. Gold is flirting with the Brexit highs, and it appears to have staged a decent upside breakout from a loose rectangle. That’s a positive development, and it suggests that gold may make its way towards $1392, or even $1440.
16. If gold can rise to about $1392 or higher, the entire $1285 – $1335 area would become a strong support zone, like $18 is now for silver.
17. Gold stocks and silver stocks are the star performers of 2016. Can they continue to shine?
18. Well, please click here now. Double-click to enlarge this GDX daily chart.
19. GDX just staged a very interesting upside breakout. After rising above the 2015 highs in the $23 area, GDX just surpassed the 2014 highs near $28.
20. This is a very exciting development. Institutional money managers like to see stocks making multi-year highs, and gold stocks are doing it while most mainstream assets languish.
21. Since the $1045 area lows, gold has rallied more than $300 to the recent highs. Cost-cutting programs at many gold mining companies have been in place for the past few years, and most of companies were anticipating the gold price to be under $1200 in the coming years.
22. This gold price rally is producing quite a shocking rise in company earnings for many miners.
23. From here, my fundamental and technical analysis of this situation suggests that GDX could quickly establish a new trading range, roughly between $25 – $40.
24. That’s good news not just for the mining companies, but for the entire global gold community!
If you would like to receive our free newsletter via email, simply enter your email address below & click subscribe.
 Follow us on Twitter
 Become our facebook fan
CONNECT WITH US
Tweets
Tweet with hash tag #miningfeeds or @miningfeeds and your tweets will be displayed across this site.
MOST ACTIVE MINING STOCKS
Daily Gainers
 CMC Metals Ltd. CMC Metals Ltd. |
CMB.V | +900.00% |
 Eden Energy Ltd Eden Energy Ltd |
EDE.AX | +200.00% |
| GoviEx Uranium Inc. |
GXU.V | +42.86% |
| Eagle Nickel Ltd. |
ENL.AX | +41.67% |
| Citigold Corp. Limited |
CTO.AX | +33.33% |
| Mount Burgess Mining NL |
MTB.AX | +33.33% |
| Exalt Resources Limited |
ERD.AX | +31.94% |
| Casa Minerals Inc. |
CASA.V | +30.00% |
| Cariboo Rose Resources Ltd |
CRB.V | +28.57% |
| Belmont Resources Inc. |
BEA.V | +28.57% |


