
Concerns over President Trump’s healthcare policies are causing consternation in the financial markets everywhere. Almost $30 billion dollars was wiped off the ASX when nervous traders had the jitters. The ASX 200 fell by 1.6%, with mining stocks some of the biggest losers.
Iron ore prices took a massive hit, falling 4% overnight on March 22, which had a knock-on effect on mining stocks. Fortescue Metals dropped by 5.3%, shares in Rio Tinto tumbled by 2.6%, and BHP Billiton fell by a more modest 2.9%.
On March 23, the ASX recovered its sharp losses of the day before thanks to investors buying up cheap mining and energy stocks. The S&P/ASX 200 Index jumped back above the 5700 mark to 5708. Analysts from City Index noted that the materials sector was providing much-needed support to the index. Overall, iron ore prices fell by 8%, but global oil prices are holding relatively firm, which is helping to prop up mining stocks and shares.
Fortunately, fluctuations in the financial markets are not a reflection of the mining sector as a whole, but there may be troubled times ahead in Western Australia.
WA Mining Sector under Pressure
WA mining is coming under increasing pressure after the State Government announced a new iron ore fee. Mike Henry of BHP is warning that taxing the mining sector in a bid to reduce the $4 billion budget deficit could push the industry into serious decline. Mr Henry says the industry needs to remain competitive if it is to compete in the global marketplace, but with increased taxes in the pipeline, mining giants such as BHP and Rio Tinto may reduce their investment in Western Australia. However, local MP Brendan Grylls disputes the claim and accuses the industry of making misleading statements.
BBIG – China State Construction Engineering Partnership
Thankfully, it’s not all bad news. BBIG has recently announced a new $6 billion partnership with China State Construction Engineering Corporation for the construction of an iron ore project in WA. This should help to give the sector a much-needed boost. Construction is set to begin in the Pilbara region. 3,300 workers will be required during the construction phase, but once the project is up and running, there will be positions for a further 900 permanent workers. The Memorandum of Understanding ceremony was attended by Australia’s Prime Minister Malcolm Turnbull and Chinese Premier Li Kequiang.
Mining Company IPOs Set to Increase in 2017
There are also other signs that the Australian mining sector is slowly beginning to recover. Experts predict that several of the smaller mining companies are likely to float on the stock market this year, which could prove profitable for amateur investors looking to get in on the ground floor. So far, nine companies have already filed to list shares on the ASX, which is a significant increase in the total of 10 issues in 2016.
Rallying metal prices are encouraging some companies to consider stock market flotation as a means of raising working capital to fund further exploration. However, many still remember that disastrous fall in mining stocks back in 2015, so IPOs are expected to be modest. Firms are more likely to look at listing on junior markets in IPOs worth $10 million or less.
Whether the mining sector can continue to prop up the economy in WA remains to be seen, but one thing is certain, diversification is a smart strategy going forward.
Guest Post by: Luke Hatkinson-Kent
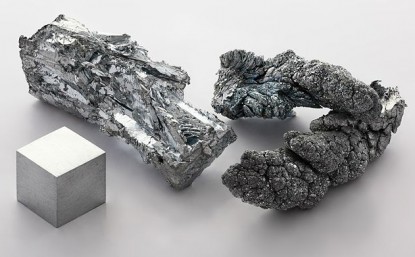
A recent pull back has hit my current favorite sector, zinc.
Zinc prices reached a 5 year high in February. Just as analysts forecasted, the zinc concentrate market is unravelling but after a terrific run zinc equities have pulled back slightly as investors take profits.
Because nothing has fundamentally changed in the zinc space, this selloff has created a buying opportunity. In fact, the fundamentals of the industry just keep getting better.
Andrew Thomas senior analyst zinc markets, Wood Mackenzie said in an interview at PDAC with Investing News Network “I think it’s probably not until around the middle of this year that we’d expect to see stockpiles really become depleted. We’ve still got a few months yet.”
Smart resource investors are already placing bets in zinc names ahead of this pinch point.
Investors beginning to look at the zinc sector have limited options as after a decade of unexciting zinc price action left the sector unloved and underfunded.
The first way to play the sector would be to look at large producers. No surprise that commodity giants Glencore and Teck (5 bagger in last year) rank in the top 10 zinc producers worldwide.
Earlier this month Glencore tightened their grip further down the food chain by taking a 25% stake in the only zinc focused producer on the TSX, Trevali Mining. In exchange Trevali will take control of two zinc mines in Africa and move one step closer to becoming a mid-tier zinc producer. Trevali is a 4 bagger in the last year.
Next on investors radar are zinc development stocks (companies with a resource).
Development companies offer a fantastic risk/reward in bull markets as they benefit from the commodity price move, and news catalysts as they move their projects forward, and offer takeover potential.
As the zinc bull market continues, investors will be looking for companies with large proven deposits (increased leverage) in good political jurisdictions.
| Company | Project | Resource* (zinc lbs) | EV (per lb) | Location |
| Darnley Bay | Pine Point* | 5.8 billion | $0.006669 | Northwest Territories |
| Canada Zinc Metals | Akie | 5.7 billion | $0.008302 | British Columbia |
| Zazu | Lik South | 4.2 billion (*50% interest) | $0.007867 | Alaska |
| Canadian Zinc | Prairie Creek | 3.5 billion | $0.041298 | Northwest Territories |
| InZinc | West Desert | 2.4 billion | $0.007360 | Western Utah |
| Tinka | Ayawilca | 2.4 billion | $0.042131 | Peru |
*Pine Point resource is historical and not 43-101 compliant
*Resources all published reserve/resource categories
When doing due diligence you also want to check key metrics such as current cash position and upcoming catalysts.
Joseph Gallucci, Managing Director Investment Banking at Eight Capital “A majority of zinc development plays will not be in production to catch the cycle, either due to permitting or funding obstacles (or both).”
| Company | Cash | Project stage |
| Darnley Bay | ~$10,000,000 | PEA in progress |
| Tinka Resources | ~$10,000,000 | Resource drilling |
| Canadian Zinc | ~$9,800,000 | PFS complete |
| Canada Zinc Metals | ~$7,000,000 | Resource drilling |
| InZinc | <$500,000 | PEA complete |
| Zazu | <$100,000 | PFS done |
Cash position is critical for investors as it will allow the company to fund additional work that may create shareholder value before the dilution of another financing.
Here is a quick look at a few of the zinc development companies and what they have planned in 2017.
Tinka Resources – Tinka has been a popular zinc stock up 25% over the last month. An excellent step out drilling hole was the main reason for the run. At the Ayawilca project in Peru the company is targeting resource growth in 2017. A 10,000 metre drill program commenced in February and investors will be analyzing results as the come in. 2017 will be focused on drilling and metallurgy work with a new resource estimate later in the year followed by the possibility of a PEA.
InZinc – InZinc’s share price is up close to 50% to start the year, on leverage to the zinc price and a new model about the West Desert Project. InZinc will need to complete a financing and then start drill testing this new thesis.
Canada Zinc Metals – The team at Canada Zinc Metals plans to take full advantage of a potential move in the zinc price this year. The busiest work season in a couple years is planned with 7500 metres of drilling at Akie. Drilling will start when the weather gets better (June) and is expected to go through September. Canada Zinc is currently evaluating the possibility of completing a PEA in the fourth quarter.
Darnley Bay – Darnley Bay is the newcomer to the zinc development group but may be the first to production after acquiring the past producing Pine Point Project. The most profitable zinc-lead mine in Canadian history producing 64 million tonnes of 7% zinc and 3.1% lead from 52 deposits. Past production is a huge advantage with proven mining methods to rely on, infrastructure in place and should be a benefit when it comes to permitting. Investments by Pat DiCapo, Rob McEwen, and Lukas Lundin funded the company for a catalyst rich 2017 lying ahead. A drill permit has just been received and 3500m of drilling is expected to commence shortly. At least two more drilling campaigns are expected to follow. An IP survey is also planned on newly acquired claims. A major catalyst will be a Preliminary Economic Assessment (PEA) expected in April.
Zinc development stocks look ready to go in 2017 and this pullback presents a fantastic buying opportunity in what is likely to be a hot sector moving forward
*All data believed to be accurate as of March 27, 2017. Market data changes quickly so do your own due dilligence before making any investment decisions.

There are several important points to remember about gold, notably the fact that it is a safe-haven asset. This means that gold is the go-to asset when equities markets sour. Since capital typically flows into equities, treasuries, fixed-interest-bearing accounts, or gold, there is a massive redirect of resources when a risk-off approach is adopted to equities. We have seen some remarkable changes taking place since November 8, 2016, when Trump was elected President of the United States.
The so-called ‘Trump Bump’ saw equities markets surging to record levels, unprecedented in US history. The Dow Jones Industrial Average quickly exceeded 21,000, while the NASDAQ and S&P 500 index racked up notable gains too. The mania that drove traders to plough money into equities soon fizzled. Whenever markets are rising too quickly, without a strong fundamental basis, a correction is imminent. Markets have witnessed several notable developments taking place since the Fed decision to raise the federal funds rate.
Wall Street Took the Rate Hike in Its Stride, but Dollar Weakness Is a Concern
On Wednesday, 15 March 2017, Fed chair Janet Yellen announced a 25-basis point rate hike. This was generally well received by the financial markets, despite the fear and loathing that typically goes with a rate hike and Wall Street. Remember that equities markets despise uncertainty; they do not react favourably to sudden increases or decreases in interest rates. However, the Fed rate hike was anticipated, as evidenced by the CME Group Fedwatch tool probabilities. In the days leading up to the hike, there was a 90% + probability of rates rising, and Wall Street analysts priced this into their forecasts.
With respect to gold, it’s a no-brainer; gold reacts negatively to interest-rate hikes. Since gold is a dollar-denominated asset, it moves in the opposite direction to a strengthening USD. Gold typically retains some of its value when other asset classes such as equities markets are falling. The most successful way to trade gold is either to speculate on it with things like CFD Trading, or to trade ETFs (exchange traded funds) of gold. The world’s biggest gold ETF is SPDR. This is a useful resource to evaluate when gauging which direction to trade gold contracts for difference.
_SPLrZWVTIh_1490138771 (1)")
How Is Gold Performing Lately?
Gold is currently trading at $1,245.59 per ounce, down 0.04% or $0.51. The precious metal is down 0.32% over the past 30 days, and down 6.10% over the past 6 months. The 1-year performance of gold is relatively flat at -0.82%, for a decline of $10.20. On Tuesday, 21 March, gold closed at $1,246.10 on the Comex, up 1.01%, but the spot price of gold was $1,245.35.
Typically, we would expect the gold price to plunge after a Fed rate hike. This didn’t happen because the USD moved in the opposite direction. The USD is going through a soft patch at this time, and there have been surprising movements since the Fed decision was reached. While the Fed alluded to 2 rate hikes – and no more – in 2017, dollar traders took that as a bearish sign and sold the currency en masse.
Gold is priced in dollars, and moves with the strength of the dollar. A weak dollar means that foreign buyers of gold can buy more gold for their currency. A strong dollar means that foreign buyers of gold can buy less gold for the currency. As such, demand and supply move accordingly. Does this mean that the Fed monetary tightening policies will keep the dollar weak? Not at all. The Fed is acting in the best interests of the US economy, and as things stand, the US economy is robust.
Many economists believe that the current performance of the greenback is temporary and that what we are seeing is a short-term weakening of the greenback. Part of the problem is that the projections for the federal funds rate (FFR) remain unchanged from their forecasts in December. In any event, the FFR is going to be significantly higher by the end of 2017, and this is going to invariably lead to a stronger USD as US markets become more attractive to foreign investors.
The precious metals complex enjoyed a strong week mostly due to a post-Fed explosion on Wednesday. Although gold stocks sold off to end the week, they finished up almost 5% for the week. Gold gained 2.4% on the week while Silver gained 2.9%. The miners enjoyed massive gains following the previous two rate hikes and that has some optimistic about a repeat scenario. However, the miners and metals need to prove they can recapture their 200-day moving averages before we become optimistic.
Precious metals should trend higher in the short-term if the current macro technical landscape does not change. The US Dollar index has fallen below its 50-day moving average and could fall another 2% to moving average support. Also, despite the Fed rate hike, the 10-year yield did not make a new high. Bonds could rebound and the huge speculative short position, if unwound could add to the rebound. A rally in Bonds coupled with a weak US Dollar would help precious metals.

Precious metals could rebound farther but resistance in the form of the 200-day moving average looms large. In the chart below we plot Gold, Silver, GDXJ and GDX along with their 200-day moving averages. In addition to the 200-day moving average, the February highs will also provide resistance. We should note, while the metals remained above their late January lows, the miners did not. It would not be a good sign to see a continued rally led by the metals rather than the miners.

We should see some upside follow through in precious metals if our read on the US Dollar and Bonds is correct but take note of February highs and 200-day moving averages as resistance. I would not be chasing any strength until the sector proves itself. The first step would be a return to the February highs. If this rally fades below those levels then miners are again at risk for a retest of the recent December lows. We continue to look for bargains that we can buy on weakness and hold into 2018.

The gold stocks bounced strongly today after the February jobs report confirmed the Federal Reserve will hike interest rates next week. While precious metals rallied strongly following the previous two hikes, I’m not so sure today marks the start of a big rebound. For one, the Federal Reserve could hike rates again in July. Second and more important, the technical setup argues for more back and forth action in the weeks and months ahead. While the current price action in the gold stocks is different from that in the previous cyclical bull markets, we do think we have found one viable comparison for the current correction.
Although the gold stocks may rally for a few weeks in the short-term, I see them testing the December lows or close to those lows before retesting their February peaks. If this occurs and the correction that began last summer remains in effect, then what does that mean for the larger picture?
Put simply, the gold stocks formed a historic low in January 2016 and are undergoing a sizeable correction (in price and time) to the record advance that took place in the first half of 2016. A long and deep wave 2 correction, though not typical has a few historical examples.
In the chart below we plot the housing and banks sectors, which endured a sizeable wave 2 correction (in price and time) in 2010-2011 before exploding higher from late 2011 to early 2013.

These two sectors share several key similarities to the gold stocks at present. They endured a devastating bear market of more than 80%. (It was the worst bear market in over 80 years). They rebounded strongly from their historic 2009 bottoms. In particular, the banks surged 250% in 12 months. Then both sectors corrected 44% in a correction that lasted 17 months and longer than the initial rebound. Finally, note that the banks and housing sectors experienced a technical breakdown (C leg) in late 2011 that effectively served as a massive bear trap and a tremendous buying opportunity.
With respect to the gold stocks, the point is additional technical weakness and a breach of support will likely be a great buying opportunity and not a sell signal. Gold stocks in January 2016 were the cheapest they had ever been. Going forward over the next few months, the closer they trade to those levels, the better buying opportunity it is. Given the historical context, one should not overreact if the miners lose their 400-day moving averages or temporarily break their December lows. Due to the gold stocks being only 15 months removed from such a historic bottom, there simply aren’t enough new sellers to drive the sector that much lower.

The gold stocks appear to be following a rare but viable example of a lengthy bull market correction. Unless they can rally back to their February highs soon then the analog to the housing and banks sectors remain in play. That aligns with our outlook of the spring and summer being a grind. As we noted last week, the way to play this setup is to buy weakness and avoid chasing strength. We are actively looking for bargains that we can buy and hold through this period into the next big move higher.
Nicola Mining Inc. (TSX-V: NIM) / (OTC: HUSIF) has three primary, potential company-making assets, two nearing high-margin, steady-state cash flow. The third, Treasure Mountain, offers both a shovel ready, up to C$9 million profit opportunity (see below) plus, longer term, a potential company-making silver-lead-zinc mine on a past-producing mine site. Regarding the first two assets, there’s the valuable, (virtually impossible to replicate in BC) gold-silver Merritt Mill and processing facility centrally located near Merritt, BC, and an “Exploration & Material Purchase Agreement” with Teck Resources (NYSE: TECK) / (TSX: TCK) to monetize waste rock from Nicola’s 100% owned Thule Copper project (another potential company-maker).
Valuable Cash Flowing & Exploration / Development Assets

Merritt Mill in BC, Canada
At current 200 tpd capacity, grade assumptions and precious metal prices, the Mill should be good for about ~$2.3 million in operating income this year. NOTE: (based on publicly available information, including data from peer toll milling operations). Add an additional ~$2.5 million/yr. from the Teck Material Purchase Agreement from 2018 on. Combined, Nicola’s sitting on two assets that could generate ~$5 million next year, with considerable upside from higher grade ore, higher spot prices and expanded Mill capacity.
Below is an estimate of what (I think) the milling operations could look like in 2017. This is an indicative model, a composite of various milling & profit share agreements, based on Company press releases.

All else equal, if the Company were to process 20% higher grade ore (from some of the profit sharing agreements), cash flow would grow from ~$2.3 to ~$4.2 million. In a scenario with 10% higher spot prices, Nicola’s share of operating profits would be ~$6.0 million, with more upside from ramping up throughput. Adding ~$2.5 million from the Teck waste material deal approaches ~$8.5 million in company-wide cash flow from 2018 on. NOTE: {this is not a forecast by me or the Company and does not contemplate the potential for increased throughput}.
Both earnings streams are high quality and expected to be long-lived, attributes that typically command strong market multiples. For example, precious metal streaming companies Franco-Nevada (NYSE: FNV) and Silver Wheaton (NYSE: SLW) trade at an average 20x Enterprise Value (“EV”) to EBITDA. Unlike FNV and SLW, Nicola has $77 million in tax credits, shielding it from paying cash taxes for years to come. The following chart shows implied share prices across various EBITDA and market multiple scenarios. Nicola Mining is currently at $0.22/share, (down 25% from $0.29 on February 17th).

Thule Copper Project
Nicola has achieved the elusive dream of most junior mining companies, positive cash flow to meaningfully self-fund exploration. Even better, both exploration projects are on past producing sites. They could be, yes I’ll say it again, company makers. Past production on Nicola’s Thule Copper property featured Craigmont, the largest open-pit copper mine in North America at the time. It operated at 1.28% Cu open pit, and closer to 2% Cu underground.
Thule Copper is located 14km northwest of Merritt, British Columbia and covers 10,084 hectares (~24,920 acres) along the southern end of the Guichon Batholith.
The Company recently completed a diamond drilling program designed to test 3 distinct zones on the property, referred to as the Embayment, Titan Queen, and Eric. Total diamond drilling for the 2016 program was 1,084 meters in 5 holes through the Embayment Zone located approximately 1 km northwest of the past-producing Craigmont Mine. A follow-up drill program will be designed to determine continuity of mineralization further west along strike and at depth. Drill results represent an important near-term catalyst.
Craigmont produced high-grade copper in a skarn setting but never encountered what management believes is an underlying porphyry. New evidence of possibly something Big was uncovered during the Company’s aforementioned drilling last year. Drill results were a success, all holes hit mineralization and blockbuster hole THU-002 in the Embayment zone returned 1.11% copper over a remarkable 86-meter width.
Treasure Mountain
100% owned Treasure Mountain, a former operating mine, has a shovel ready, opportunity to mine already permitted Level 1 Stope 2 and ship mill feed to its Merritt Mill. Treasure Mountain’s silver, lead, zinc endowment consists of 51 mineral tenures, 21 legacy claims, 100 cell units and five crown grants totaling 2,850 hectares (~7,040 acres). The Company maintains the option of reopening Level 1 to extract silver from Stope 2 at any time and could realize indicative economics as shown below. Given that the Company is not starved for capital and that management believes precious and base metal prices are likely to move higher, there’s no rush to exploit this opportunity.
This indicative, up to C$ 9 million, one-time cash flow (over ~9-month mining period) would mitigate (but not necessarily nullify) the need for equity dilution. Combined with potential cash flow outlined above, Thule Copper could be robustly explored this year and next.

As mentioned, Treasure Mountain has tremendous blue-sky potential. One of the best reported holes is TM11-36, with a 1.2 meter interval containing 1,565 g/t Ag (45.6 opt), 13.5% Pb & 9.9% Zn. Below is more dill data.

Conclusion
Nicola Mining Inc. (TSX-V: NIM) / (OTC: HUSIF) can be viewed as 3 companies in 1, it’s not a cash burning, single-asset junior mining company. Importantly, the sum of the parts is greater than the whole because internally generated (tax-free) profits from Milling can be invested into the Company’s other highly prospective projects (Thule Copper & Treasure Mountain). These two assets are not merely lottery tickets (like most green field projects), each is host to very significant prior mining, development & exploration activities in a world-class mining jurisdiction.
Nicola’s Merritt Mill is not just a $30 million+ (invested capital) 200 tpd processing facility, it’s the only Mill in BC allowed to accept feed from anywhere in the Province, and in many cases the ONLY place otherwise stranded mines can send ore. Therefore, on both an operating basis (cash flow multiple) analysis (see above), and on replacement value, the Mill more than covers the entire market cap of the Company. That means an investor today gets Thule Copper & Treasure Mountain for Free. But wait, don’t take my word for it, check out Nicola’s website and click on the “Projects” tab.
Disclosures: The content of this article is for illustrative purposes only. Readers fully understand and agree that nothing contained herein, written by Peter Epstein of Epstein Research, [ER] including but not limited to, commentary, opinions, views, assumptions, reported facts, estimates, calculations, etc. is to be considered, in any way whatsoever, implicit or explicit investment advice. Further, nothing contained herein is a recommendation or solicitation to buy or sell any security. The content contained herein is not directed at any individual or group. Mr. Epstein and [ER] are not responsible, under any circumstances whatsoever, for investment actions taken by the reader. Mr. Epstein and [ER] have never been, and are not currently, a registered or licensed financial advisor or broker / dealer, investment advisor, stockbroker, trader, money manager, compliance or legal officer, and they do not perform market making activities. Mr. Epstein and [ER] are not directly employed by any company, group, organization, party or person. Shares of Nicola Mining are highly speculative, not suitable for all investors. Readers understand and agree that investments in small cap stocks can result in a 100% loss of invested funds. It is assumed and agreed upon by readers that they consult with their own licensed or registered financial advisors before making investment decisions.
At the time this article was posted, Peter Epstein owned shares in Nicola Mining and the Company was a sponsor of [ER]. Readers understand and agree that they must conduct their own research, above and beyond reading this article. While the author believes he’s diligent in screening out companies that are unattractive investment opportunities, he cannot guarantee that his efforts will (or have been) successful. Mr. Epstein & [ER] are not responsible for any perceived, or actual, errors including, but not limited to, commentary, opinions, views, assumptions, reported facts & financial calculations, or for the completeness of this article or future content. Mr. Epstein & [ER] are not expected or required to subsequently follow or cover events & news, or write about any particular company or topic. Mr. Epstein and [ER] are not experts in any company, industry sector or investment topic.
It has almost been a year since the spectacular 14.6-carat Oppenheimer Blue diamond sold for a record-setting $57.5 million. The rare blue diamond, the sale of which was managed by auction house Christie’s for almost $4 million dollars a carat, is the most expensive blue diamond ever sold.
Since the sale in May 2016, demand for rare fancy colored diamonds has steadily increased, creating what many have called the year of the colored diamond. With that said, colored diamonds have been progressively gaining value over the last decade and are considered one of the best hard assets a robust investment portfolio can have.
While Fancy Light Blue and Fancy Vivid Pink diamonds have made international headlines over the last two years for the amounts they have sold for, looking at historic data, the value of rare diamonds could potentially climb higher over the next five years.
Between 2009 and 2016, the price of pink diamonds has increased nearly 180 percent and currently sits at a record high. Blue and yellow diamonds have also gained value, with the price of both rising 70 percent and 90 percent, respectively.
The allure and luxury of fancy colored diamonds is universal, which makes them a coveted asset in a range of countries and cultures. In addition to being a status symbol, these exclusive fancy colored diamonds are easily portable and of high-value making them an ideal hard asset.
Demand for rare colored diamonds is expected to strengthen over the next decade as supply of the exquisite fancy colored diamonds becomes scarcer. Only 0.001 percent of diamonds mined each year qualify as “fancy” and even fewer earn the distinction of “vivid”, which refers to a highly saturated hue.

There are also very few mines that produce fancy colored diamonds, notes Paragon International Wealth Management, a Toronto-based firm that specializes in the acquisition and investment management of fancy colored diamonds, particularly pink diamonds.
The scarcity and rareness of these fancy colored diamonds makes them more precious and sought-after than their less illustrious white diamond counterparts.
“For every 10,000 white diamonds mined only one natural colored diamond will be found,” notes Paragon International Wealth Management. “This makes natural colored diamonds extremely rare and ideal for investment purposes.”
When you consider that only one fancy blue diamond is mined each year, and there are only 20 to 30 fancy reds known to exist, it is easy to understand why fancy colored diamonds are such a hot commodity.
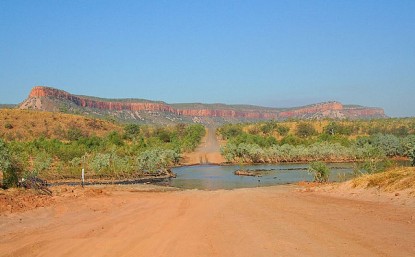
This will be further compounded if the famous Argyle diamond mine, located in East Kimberley, Australia, closes in the next 24 months. The Argyle mine is the only known substantial source of pink diamonds, responsible for roughly 90 to 95 percent of the global supply. Due to a rapid depletion in supply and escalating mining costs, the Argyle mine is expected to close in 2018, making the rare pink diamonds that have been mined there even more precious.

While we expected the gold stocks to correct and test GDX $22 and GDXJ $35, we did not expect it to happen so quickly. It literally took only three days! Gold stocks rebounded on Friday and managed to close the week above those key levels. While gold stocks could bounce or consolidate for a few days, we would advise patience as lower levels could be tested as spring begins.
The weekly candle charts of GDX and GDXJ are shown below along with their 80-week moving average. For the entire week, GDX and GDXJ declined 8% and nearly 12% respectively. Although miners recovered Friday, the weekly candles signal the kind of selling pressure that do not exactly mark “higher lows” within an uptrend. In other words, while miners could recover for a few days or even a week or two, I would expect lower levels to be tested. That essentially includes the 80-week moving averages and the December lows.

In order to get a sense for the strong support levels, I use a daily line chart which helps to smooth out the volatility. The miners essentially have two points of strong support. The first is a wide area that includes $20-$21 for GDX as well as $31-$32 for GDXJ. That target area includes the 400-day moving average for both GDX and GDXJ. If that target area fails to hold for a few days or even a week then look for strong support at the December lows.

In short, the next quality buying opportunity figures to be at a retest of the 400-day moving average or perhaps a retest of the December lows. A weekly close above GDX $25 and GDXJ $40 would invalidate our cautious view. We expect the next several months could be a grind as the sector oscillates between support and resistance. It’s hard to do but the way to play that is to buy weakness and avoid chasing strength.
If you would like to receive our free newsletter via email, simply enter your email address below & click subscribe.
 Follow us on Twitter
 Become our facebook fan
CONNECT WITH US
Tweets
Tweet with hash tag #miningfeeds or @miningfeeds and your tweets will be displayed across this site.
MOST ACTIVE MINING STOCKS
Daily Gainers
 CMC Metals Ltd. CMC Metals Ltd. |
CMB.V | +900.00% |
 Eden Energy Ltd Eden Energy Ltd |
EDE.AX | +200.00% |
| GoviEx Uranium Inc. |
GXU.V | +42.86% |
| Eagle Nickel Ltd. |
ENL.AX | +41.67% |
| Citigold Corp. Limited |
CTO.AX | +33.33% |
| Mount Burgess Mining NL |
MTB.AX | +33.33% |
| Exalt Resources Limited |
ERD.AX | +31.94% |
| Casa Minerals Inc. |
CASA.V | +30.00% |
| Cariboo Rose Resources Ltd |
CRB.V | +28.57% |
| Belmont Resources Inc. |
BEA.V | +28.57% |


