

The silver miners’ stocks have been slowly grinding higher this year, but it’s been a volatile ride. This sector’s alternating surges and plunges have spawned outsized swings in sentiment, really distorting investors’ perceptions of the major silver miners. But once a quarter earnings season arrives, revealing their hard fundamental realities which dispel the obscuring sentiment fogs. The silver miners reported a solid Q1.
Four times a year publicly-traded companies release treasure troves of valuable information in the form of quarterly reports. These are generally due by 45 days after quarter-ends in the US and Canada. They offer true and clear snapshots of what’s really going on operationally, shattering the misconceptions bred by the ever-shifting winds of sentiment. There’s no silver-miner data that is more highly anticipated than quarterlies.
Silver mining is a tough business both geologically and economically. Primary silver deposits, those with enough silver to generate over half their revenues when mined, are quite rare. Most of the world’s silver ore formed alongside base metals or gold, and their value usually well outweighs silver’s. So typically in any given year, less than a third of the global mined silver supply actually comes from primary silver mines!
The world authority on silver supply-and-demand fundamentals is the Silver Institute. It recently released its highly-anticipated World Silver Survey 2017, which covers 2016. Last year only 30% of silver mined came from primary silver mines, a slight increase. The remaining 70% of silver produced was simply a byproduct. 35% of the total mined supply came from lead/zinc mines, 23% from copper, and 12% from gold.
As scarce as silver-heavy deposits supporting primary silver mines are, primary silver miners are even rarer. Since silver is so much less valuable than gold, most silver miners need multiple mines in order to generate sufficient cash flows. These often include non-primary-silver ones, usually gold. More and more traditional elite silver miners are aggressively bolstering their gold production, often at silver’s expense.
So the universe of major silver miners is pretty small, and their purity is shrinking. The definitive list of these companies to analyze comes from the most-popular silver-stock investment vehicle, the SIL Global X Silver Miners ETF. This week its net assets are running 5.5x greater than its next-largest competitor’s, so SIL really dominates this space. With ETF investing now the norm, SIL is a boon for its component miners.
While there aren’t many silver miners to pick from, major-ETF inclusion shows silver stocks have been vetted by elite analysts. Due to fund flows into top sector ETFs, being included in SIL is one of the important considerations for picking great silver stocks. When the vast pools of fund capital seek silver-stock exposure, their SIL inflows force it to buy shares in its underlying companies bidding their prices higher.
Back in mid-May as the major silver miners finished reporting their Q1’17 results, SIL included 29 “silver miners”. This term is used rather loosely, as SIL includes plenty of companies which can’t be described as primary silver miners. Most generate well under half their revenues from silver, which greatly limits their stock prices’ leverage to silver rallies. Nevertheless, SIL is today’s leading silver-stock ETF and benchmark.
The higher the percentage of sales any miner derives from silver, naturally the greater its exposure to silver-price moves. If a company only earns 20%, 30%, or even 40% of its revenues from silver, it’s not a primary silver miner and its stock price won’t be very responsive to silver itself. But as silver miners are increasingly actively diversifying into gold, there aren’t enough big primary silver miners left to build an ETF alone.
Every quarter I dig into the latest results from the major silver miners of SIL to get a better understanding of how they and this industry are faring fundamentally. I feed a bunch of data into a spreadsheet, some of which made it into the table below. It includes key data for the top 17 SIL component companies, an arbitrary number that fits in this table. That is a commanding sample at 93.8% of SIL’s total weighting.
While most of these top 17 SIL components had reported on Q1’17 by mid-May, not all had. Some of these major silver miners trade in the UK or Mexico, where financial results are only required in half-year increments. If a field is left blank in this table, it usually means that data wasn’t available by the end of Q1’s earnings season. Some percentage changes are also blank if their data went from positive to negative.
In these tables the first couple columns show each SIL component’s symbol and weighting within this ETF as of mid-May. Just under a third of these stocks don’t trade normally in the States. So if you can’t find a symbol, it’s a listing from a company’s primary foreign stock exchange. That’s followed by each SIL component’s Q1’17 silver production in ounces, along with its absolute percentage change from Q4’16.
Quarter-on-quarter changes offer a more-granular read on companies’ ongoing operating and financial performance trends than year-over-year comparisons. QoQ changes are also included for the key data in this table’s right half of cash costs per ounce of silver mined, all-in sustaining costs per ounce, and operating cash flows generated. Together costs and cash flows reveal the financial health of silver miners.
The Q1’17 silver production is followed by this same quarter’s gold production. Almost every major silver miner in SIL also produces significant-if-not-large amounts of gold! While gold stabilizes and augments the silver miners’ cash flows, it also retards their stocks’ sensitivity to silver itself. Naturally investors and speculators buy silver stocks and their ETFs because they want leveraged exposure to silver’s price, not gold’s.
So a final column reveals how pure the elite SIL silver miners are. This is mostly calculated by taking a company’s Q1 silver production, multiplying it by the average silver price in Q1, and dividing that by the company’s total quarterly sales. If miners didn’t report Q1 revenues, I approximated them by adding the silver sales to gold sales based on their quarterly production and these metals’ average first-quarter prices.
After spending lots of time digesting these elite silver miners’ latest quarterly results, it’s fully apparent their stocks’ sharp selloff from mid-April to early May wasn’t fundamentally-righteous at all! The major silver miners remain fundamentally strong, which isn’t reflected in their fear-battered stock prices these days. The silver miners are poised to see exploding profits as silver mean reverts higher with gold this year.

Production is the lifeblood of mining companies, and thus the best place to start fundamental analysis. In Q1’17, these top 17 SIL components collectively produced an impressive 75.9m ozs of silver. If 2016’s world-silver-mining run rate is applied to this year’s first quarter, that implies 221.5m ozs of silver mined. Thus these top SIL silver miners would account for over 34% of that total, so they truly are major silver players.
This big Q1’17 silver production was nearly perfectly stable with Q4’16’s, off a trivial 0.6%. This is rather remarkable considering the example of gold miners. As discussed a couple weeks ago in my analysis of the first-quarter results of the major gold miners, gold production has long contracted sharply from Q4s to Q1s. The silver miners bucked this seasonal trend, and unfortunately I don’t know if this is unusual or typical.
Unlike gold’s quarterly frequency, comprehensive silver fundamental data from the Silver Institute is only published once a year. That resolution is obviously insufficient to discern quarter-to-quarter production trends for this industry. But these silver miners’ Q1 gold production did follow the gold miners’, with a collective plunge of 15.9% QoQ to 1.4m ounces. That was well beyond the top GDX gold miners’ -8.5% average.
Many of these elite major silver miners don’t just mine gold as a silver byproduct, but actually operate at least one primary gold mine. The silver miners have collectively decided to diversify into gold due to its superior economics. Consider hypothetical mid-sized silver and gold miners, which might produce 10m and 300k ounces annually. What would those cash flows look like at last quarter’s average metals’ prices?
In Q1’17, silver and gold averaged $17.44 and $1220. Those were up a slight 1.9% and 0.2% QoQ. At 10m ounces, that silver miner would generate $174m in sales. But the similar-sized gold miner’s sales of $366m more than doubles that. At recent years’ prevailing prices, the cash flows from gold mining are much more robust than those from silver mining. That makes it much easier to pay the bills and expand.
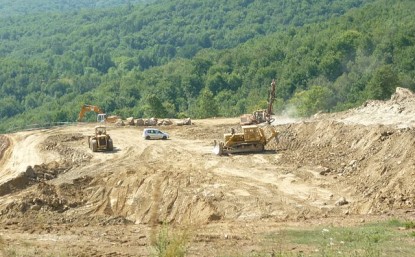
Silver mining is often as capital-intensive as gold mining, requiring similar large expenses for planning, permitting, and constructing mines and mills to process ore. Similar heavy excavators and haul trucks are necessary to dig and haul the ore, along with similar staffing levels to run mines. So silver’s lower cash flows to support all this activity make silver mining harder than gold mining, which isn’t lost on silver miners.
Silver-mining profits do skyrocket when silver soars occasionally in one of its massive bull markets. But during silver’s long intervening drifts at relatively-low price levels, the silver miners often can’t generate sufficient cash flows to finance expansions. So the top silver miners are increasingly looking to gold, a trend that isn’t likely to reverse given the relative economics of silver and gold. Primary silver miners are getting rarer.
The silver-streaming giant formerly known as Silver Wheaton is a great example of this. It was started as a pure-play silver streamer, which silver-stock investors loved. But in recent years it has brought more and more gold online, and was on the verge of becoming a primary gold play in Q4. So it just changed its name to Wheaton Precious Metals to reflect its big shift in focus! The best silver miners are chasing gold.
Technically a company isn’t a primary silver miner unless it derives over half its revenues from silver. In Q1’17, the average sales percentage from silver of these top SIL components was just 38.5%! That is right on trend over this past year, with Q1’16, Q2’16, Q3’16, and Q4’16 weighing in at 44.9%, 45.3%, 42.8%, and 40.6%. In Q1’17, only 4 of the top SIL component companies qualified as primary silver miners!
While I understand this, as a long-time silver-stock investor it saddens me primary silver miners have apparently become a dying breed. When silver starts powering higher in one of its massive uplegs and well outperforms gold again, this industry’s silver percentage will rise. But unless silver not only shoots way ahead but stays there while gold lags, it’s hard to see major-silver-mining purity significantly reverse.
Unfortunately SIL’s mid-May composition was such that there wasn’t a lot of Q1 cost data reported by its top component miners. 3 of its top 4 companies trade in the UK and Mexico, where reporting only comes in half-year increments. Lower down the list there were more half-year reporters, an explorer with no production, primary gold miners that don’t report silver costs, and a company forced to delay its Q1 results.
Nevertheless, it’s always useful to look at the data we have. Industrywide silver-mining costs are one of the most-critical fundamental data points for silver-stock investors. As long as the miners can produce silver for well under prevailing silver prices, they remain fundamentally sound. Cost knowledge helps traders weather this sector’s fear-driven plunges without succumbing to selling low like the rest of the herd.
There are two major ways to measure silver-mining costs, classic cash costs per ounce and the superior all-in sustaining costs. Both are useful metrics. Cash costs are the acid test of silver-miner survivability in lower-silver-price environments, revealing the worst-case silver levels necessary to keep the mines running. All-in sustaining costs show where silver needs to trade to maintain current mining tempos indefinitely.
Cash costs naturally encompass all cash expenses necessary to produce each ounce of silver, including all direct production costs, mine-level administration, smelting, refining, transport, regulatory, royalty, and tax expenses. In Q1’17, these top 17 SIL-component silver miners that reported cash costs averaged $6.75 per ounce. That was a colossal 28.0% QoQ jump from Q4’s $5.28, which seems like a troubling omen.
But it’s not. Flighty silver-stock investors are always on the verge of panicking, fleeing this volatile and psychologically-challenging sector. But the only event worthy of such extreme bearishness would be prevailing silver prices falling near cash costs. And even at $6.75-per-ounce cash costs and today’s low silver, a vast buffer exists. There’s no way silver is going to plunge down under $7 in any conceivable scenario.
These high cash costs are actually an anomaly driven by two individual companies. First Silver Standard is now winding down its rapidly-depleting silver mine as planned. It produced 10.4m ounces of silver in 2016, but only 5.0m is forecast this year! As silver throughput drops each quarter, the per-ounce costs are rising. Without SSRI’s outlying super-high cash costs, the rest of these top SIL miners averaged just $5.77.
Another company Silvercorp Metals had slid out of SIL’s top 17 components as of mid-May. It was the 18th one, removing it from this particular calculation. Due to SVM’s massive lead and zinc byproducts, its costs are the lowest in the industry. In Q4’16, it reported cash costs of negative $5.48 per ounce! That really dragged down the average. So the major silver miners’ collective cash costs were just fine in Q1.
Way more important than cash costs are the far-superior all-in sustaining costs. They were introduced by the World Gold Council in June 2013 to give investors a much-better understanding of what it really costs to maintain a silver mine as an ongoing concern. AISC include all direct cash costs, but then add on everything else that is necessary to maintain and replenish operations at current silver-production levels.
These additional expenses include exploration for new silver to mine to replace depleting deposits, mine-development and construction expenses, remediation, and mine reclamation. They also include the corporate-level administration expenses necessary to oversee silver mines. All-in sustaining costs are the most-important silver-mining cost metric by far for investors, revealing silver miners’ true operating profitability.
In Q1’17, these top 17 SIL components reporting AISC averaged $11.50 per ounce. That was up 8.9% QoQ from Q4’s $10.56. But again SSRI’s collapsing depletion production and surging costs were the dominant reason. Ex-SSRI, this average ran $10.84 which was much closer to Q4’s levels. And that Q4 number was artificially low since it included SVM’s incredible $1.87 AISC due to its huge base-metals byproducts.
At $11.50 AISC, the major silver miners still earned big profits in the first quarter. Silver again averaged $17.44 per ounce, implying fat profit margins of $5.94 per ounce or 34%! Most industries would kill for such margins, yet silver-stock investors are always worried silver prices are too low for miners to thrive. That’s why it’s so important to study fundamentals, because technical price action fuels misleading sentiment!
Today’s silver price is indeed really low relative to prevailing gold levels, which portends huge upside as it mean reverts higher. The long-term average Silver/Gold Ratio runs around 56, which means it takes 56 ounces of silver to equal the value of one ounce of gold. Silver is really underperforming gold so far in 2017, with the SGR averaging just 71 year-to-date as of mid-May. So silver is overdue to catch up with gold.
At a 56 SGR and $1250 gold, silver is easily heading over $22.25. That’s 28% above its Q1 average. Assuming the major silver miners’ all-in sustaining costs hold, that implies profits per ounce soaring 82% higher! Plug in a higher gold price or the typical mean-reversion overshoot after an SGR extreme, and the silver-mining profits upside is far greater. Silver miners’ inherent profits leverage to rising silver is incredible.
The silver miners’ strong fundamentals even in Q1 are evident in their collective cash flows generated from operations. They surged 29% QoQ to $712m despite slightly-lower silver production and average silver prices only up 1.9% from Q4. Operating cash flows will skyrocket too as silver regains lost ground relative to its dominating primary driver gold. That will finance mine expansions leading to higher production.
Silver-mining was actually quite profitable in Q1, despite all investors’ worries about prevailing silver price levels. These top 17 SIL components reporting hard GAAP quarterly profits actually earned a collective $346m in the first quarter, a whopping 131% higher than Q4’s levels! The popular idea that silver-mining fundamentals just aren’t favorable near $17.50 silver is flat-out wrong. The silver miners are already thriving.
And their earnings power and thus stock-price potential will only grow as silver mean reverts higher. In silver mining, costs are largely fixed during the mine-planning stages. That’s when engineers decide which ore bodies to mine, how to dig to them, and how to process that ore. Quarter after quarter, the same numbers of employees, haul trucks, excavators, and mills are generally used regardless of silver prices.
So as silver powers higher in coming quarters, silver-mining profits will really leverage its advance. And that will fundamentally support far-higher silver-stock prices. The investors who will make out like bandits on this are the early contrarians willing to buy in low, before everyone else realizes what is coming. By the time silver surges higher with gold so silver stocks regain favor again, the big gains will have already been won.
While investors and speculators alike can certainly play the silver miners’ ongoing mean-reversion bull with this leading SIL ETF, individual silver stocks with superior fundamentals will enjoy the best gains by far. Their upside will trounce the ETFs’, which are burdened by companies that don’t generate much of their sales from silver. A handpicked portfolio of purer elite silver miners will yield much-greater wealth creation.
The bottom line is the major silver miners were fundamentally strong in Q1’17, despite investors fretting about silver prices languishing. The miners were actually still earning fat profits, thanks to industry cost levels remaining well under prevailing silver prices. And silver miners’ operating cash flows have been really augmented by their increasing diversification into gold, which now has superior economics to silver.
With silver-stock sentiment remaining excessively bearish, this sector is primed to soar as silver itself continues mean reverting higher to catch up with gold’s new upleg. The silver miners’ profits leverage to rising silver prices remains outstanding. After fleeing silver stocks so aggressively in Q4, investors and speculators alike will have to do big buying to reestablish silver-mining positions. These inflows will fuel major upside.

History never repeats itself, but often it does have a habit of rhyming. Looking at the posturing going on in the London Stock Exchange this week, it seems that observation is as true as ever. One of London’s most cherished listed mining companies is potentially falling into the clutches of an apparently disreputable Russian conglomerate with a history of unlawful conduct.
Renova Group is a diversified corporation owned by Russian billionaire Viktor Vekselberg, one of Russia’s richest men and a prolific, bullish and often unorthodox investor. Its assets are diversified, but its business practices remain largely consistent. Renova has made headlines in the past for the aggressive and stealthy tactics it has employed to take control of public companies without paying a fair price for them. And now it looks like it has London, and mining, in its sights.
Renova first came to the attention of many with a blaze of investment in the Swiss market between 2006 and 2013. Just as impressive as the companies involved were the brazen tactics employed to secure them. Rather than incur the expense of offering to buy out shareholders and reward them a control premium to take over a company, Renova works to stack the board in their favour instead.
Renova’s track record can be seen in their acquisition of Swiss majors Oerlikon, Sulzer and Schmolz + Bickenbach. At Oerlikon, Renova acted in concert with Ronny Pecik and Georg Stumpf, the Austrian billionaires, to build up stakes in the Swiss industrial group – first 13.8%, later increasing it to 44%. All were later investigated by Swiss authorities concerning this stake-building and were fined CHF40m each in January 2010 for violating disclosure rules.
Similarly at Sulzer, Renova, along with concert party partners Pecik and Stumpf, had to pay Swiss authorities CHF10m to settle allegations of a breach of disclosure rules during the building of a controlling stake in the large industrial group. The Swiss Federal Department of Finance (FDF) announced that the trio had misused share options to hide their objectives and by 2015 Renova was forced into a mandatory offer after increasing their stake to over 33.3%.
Now it looks like those tactics have come to London as Renova mounts a management reshuffle at the veteran goldmining company, Petropavlovsk. Reports surfaced last week that Renova (which is thought to own around 30% of the business) along with two other large shareholders – M&G Investments, owned by the Prudential, and Sothic Capital Management – intended to vote against the chairmanship of Peter Hambro, Petropavlovsk’s founder. Renova has also proposed adding several individuals to the board. This too is a tactic we have seen before, but nominating one of their own employees, Vladislav Egorov, to a supposedly independent position certainly looks like a new kind of chutzpah.
For their own part, questions remain over the credibility of Renova as a business. Their CEO Evgeny Olkhovik remains in Russian custody facing fraud and bribery charges, meaning they are hardly strangers to scrutiny. Last year, Renova’s Moscow offices were raided by FSB agents wearing ski masks and balaclavas. Given one of the other major shareholders in Petropavlovsk is one of London’s most respected firms, the Prudential, it will make for an interesting AGM when the future of the goldminer, which returned to profit this year after a damaging refinancing process in 2015, is discussed next month.
My concern is less for the value of Petropavlovsk, I am certain that a change at Board level won’t have any immediate impact. But the value of a London listing cannot be overstated, and it is a worrying sight to see underhand tactics that benefit the controlling parties and not the shareholders that truly deserve reward. As we approach Petropavlovsk’s AGM next month, it will be fascinating to see the commentary that accompanies Renova’s first move into the mining market in London, not to mention how the Prudential can justify such a close associate with the Russian firm.
1. The average gold market investor should be quite happy right now. If that’s not the case, the investor has likely used price projection analysis as a reason to “chase price”, and needs to deploy a new set of market tactics.
2. Please click here now. Double-click to enlarge this very nice looking daily gold chart. Gold has been in an uptrend since December. Note the consistent pattern of higher highs and higher lows on the chart.
3. I use the 14,7,7 series Stochastics oscillator on key daily charts instead of the popular 14,3,3 series, because it smooths out a lot of false signals.
4. As the oscillator reached the oversold area of about 10 in mid March, Indian dealer stocking for Akha Teej was ramping up, and the oscillator slowly became overbought in the 90 area.
5. It’s important for investors to look at major fundamental events like Chindian festivals and US central bank policy changes.
6. When those events are in play with the 14,7,7 Stochastics oscillator in the oversold position at about 10, significant rallies can be expected to occur in the gold market.
7. When those events occur with the Stochastics oscillator in the overbought area at about 90, price declines that are large enough to demoralize investors can occur.
8. As Indian dealer stocking for Akha Teej peaked in mid April, the Stochastics oscillator was overbought and rolling over.
9. A decline was expected, and it happened.
10. Now, the Stochastics oscillator has declined to about 10 and flashed a crossover buy signal. A rally was expected and it’s now in play! A mid June rate hike should be the catalyst that gives the big uptrend from the December lows a “booster shot”.
11. Regardless, from a tactical standpoint it’s very important for gold market investors to avoid placing large buy orders when the price of gold has already rallied significantly.
12. That’s easier said than done, because gold is the world’s ultimate asset, and any rally may be the start of something much bigger.
13. It takes a tremendous amount of intestinal fortitude for an investor to patiently wait for the market to decline while it rallies relentlessly higher. Investors who feel they must get in on a big rally should consider the use of call options that don’t use up much of their capital. These options offer large potential reward and very limited risk.
14. Please click here now. Double-click to enlarge this GDX chart. Gold stock enthusiasts need to remember that GDX surged from the December 2015 lows of about $13 to the $31 area in a very short time.
15. It will take several more rate hikes to reverse money velocity and create enough institutional interest in gold stocks to drive GDX to a new all-time high, but it will happen.
16. In the meantime, I’m an aggressive buyer of GDX on every ten cents decline in the entire $23 – $18 price zone.
17. I’m predicting that the next rate hike from the Fed will be the catalyst that ends the current consolidation and begins the next leg of the uptrend.
18. On that note, please click here now. Double-click to enlarge. Janet Yellen has stated that her goal is to raise short term rates while holding the line on long term rates. The price action on this T-bond chart suggests that she’s been successful, and will continue to be successful. That’s very positive for gold!
19. Please click here now. “Global oil markets are on course to reach a supply-demand balance in 2017, the IEA said, with supply deficits expected to pick up speed in the near term.” -CNBC News, May 16, 2017.
20. Oil is the biggest component of most commodity indexes. If OPEC extends the production cuts for the rest of the year (and I think they will do that), oil should begin a new leg higher. In turn, that would add significant pressure to inflation indexes.
21. Please click here now. Inflation in England is also starting to rise, and I expect that to happen across Europe very soon.
22. Please click here now. Double-click to enlarge. Silver bugs may have been disappointed by the recent decline but this is a key accumulation area for investors who want to be part of the next big rally in a profitable way.
23. Many analysts are frustrated with the performance of silver relative to gold. Those days of frustration will end as money velocity stages a dramatic reversal to the upside, but not before that happens.
24. Fundamentals make charts, and fundamentals make ratios like the gold versus silver ratio. An upturn in money velocity is imminent. It’s not the canary in the gold mine, but the canary in the silver mine, and it will usher in the inflationary bull era for the entire precious metals sector!
Stewart Thomson of Graceland Updates, Guest Contributor to MiningFeeds.com

The gold miners’ stocks have been slammed by a sharp gold pullback in recent weeks, spawning today’s bearish sentiment. Traders often get caught up in the emotional swings generated by this volatile sector. But once a quarter earnings season arrives, revealing gold mining’s hard fundamental realities which dispel the obscuring sentiment fogs. The major gold miners’ profitability actually just exploded higher in Q1!
Four times a year publicly-traded companies release treasure troves of valuable information in the form of quarterly reports. Companies trading in the States are required to file 10-Qs with the US Securities and Exchange Commission by 45 calendar days after quarter-ends. Canadian companies have similar requirements. Some companies in other countries with half-year reporting instead of quarterly even follow suit.
So the world’s major gold miners are just wrapping up their first-quarter earnings season. After spending decades intensely studying and actively trading this contrarian sector, there’s no gold-stock data I look forward to more than the miners’ quarterly financial and operational reports. They offer a true and clear snapshot of what’s really going on, shattering the misconceptions bred by the ever-shifting winds of sentiment.
The definitive list of major gold-mining stocks to analyze comes from the world’s most-popular gold-stock investment vehicle, the GDX VanEck Vectors Gold Miners ETF. Its composition and performance are similar to the benchmark HUI gold-stock index. GDX utterly dominates this sector, with no meaningful competition. This week GDX’s net assets are 36.2x larger than the next-biggest 1x-long major-gold-miners ETF!
Being included in GDX is the gold standard for gold miners, requiring deep analysis and vetting by elite analysts. And due to ETF investing eclipsing individual-stock investing, major-ETF inclusion is one of the most-important considerations for picking great gold stocks. As the vast pools of fund capital flow into leading ETFs, these ETFs in turn buy shares in their underlying companies bidding their stock prices higher.
This week GDX included a whopping 51 component “Gold Miners”. That term is used somewhat loosely, as this ETF also contains major silver miners, silver streamers, and gold royalty companies. Still, all the world’s great gold miners are GDX components. Due to time constraints, I limited my deep individual-company research to this ETF’s top 34 components, an arbitrary number that fits neatly into the tables below.
Collectively GDX’s 34 largest components now account for 91.1% of its total weighting, a commanding sample. While the vast majority of gold miners’ Q1’17 results have been released, a few are still coming due to later reporting. GDX includes major foreign gold miners trading in Australia, the UK, and South Africa. These companies report in half-year increments instead of quarterly, so their Q1 data is limited.
The importance of these top-GDX-component gold miners can’t be overstated. In Q1 they collectively produced nearly 9.7m ounces of gold, or 300.3 metric tons. According to the World Gold Council’s just-released Q1 Gold Demand Trends report, the definitive source on gold’s worldwide supply-and-demand fundamentals, total global mine production was 764.0t. GDX’s top miners alone accounted for nearly 4/10ths!
Every quarter I wade through a ton of data from these elite gold miners’ 10-Qs, and dump it into a big spreadsheet for analysis. Some made it into these tables. If a field is left blank, that usually means a company didn’t report it for Q1’17 as of this Wednesday. Some percentage changes are also left blank if they went from a negative to positive number, which was actually quite common in terms of profitability in Q1.
In these tables the first couple columns show each GDX component’s symbol and weighting within this ETF as of this week. While most of these gold stocks trade in the States, not all of them do. So if you can’t find one of these symbols, it’s a listing from a company’s primary foreign stock exchange. That’s followed by each company’s Q1’17 gold production in ounces, which is mostly reported in pure-gold terms.
Most gold miners also produce byproduct metals like silver and copper. These are valuable, as they are sold to offset some of the considerable costs of gold mining. Some companies report their quarterly gold production including silver, a construct called gold-equivalent ounces. I only included GEOs if no pure-gold numbers were reported. Financial and operational reporting varies greatly from company to company.
That’s followed by the quarter-on-quarter change, the absolute percentage difference between Q4’16 and Q1’17. This offers a more-granular read on gold miners’ ongoing performance trends than year-over-year comparisons. QoQ changes are also listed for the rest of this data, which includes cash costs per ounce of gold mined, all-in sustaining costs per ounce, operating cash flows generated, and GAAP accounting profits.
After spending lots of time digesting these elite gold miners’ latest quarterly reports, it’s fully apparent gold stocks’ recent sharp selloff wasn’t fundamentally-righteous at all! Gold-stock traders got scared because gold was sliding after gold-futures shorting attacks. That excessive herd fear pummeled this sector back down to fundamentally-absurd levels relative to prevailing gold prices, spawning incredible bargains.


Gold miners are naturally in the business of wresting gold from the bowels of the Earth, so that’s where we’ll start. And as you can see from the sea of red in the QoQ-change column following gold production, it plunged among the top 34 GDX gold miners in Q1’17. The 9.7m ounces collectively mined collapsed by 8.5% from Q4’16’s 10.6m! Of the 33 of these companies reporting Q1 production, it fell QoQ in fully 29.
If you don’t follow this sector closely, this looks like a dire fundamental bloodbath. If the world’s biggest and best gold miners can’t maintain production, they must be in a world of hurt. How can they grow their profitability if their ounces mined are plunging? Interestingly, sharply-slowing first-quarter gold production has long been typical in this sector. The World Gold Council’s comprehensive global data proves this out.
According to its new Q1 GDT report, world mine production fell 9.6% QoQ in Q1’17. So the GDX majors actually fared better than their peers. In the first quarters of 2016, 2015, 2014, 2013, 2012, and 2011, world gold production dropped 6.3%, 10.3%, 11.4%, 8.1%, 6.9%, and 7.3% QoQ. That averages out to a precipitous 8.4% first-quarter plunge in recent years! So the top GDX miners’ -8.5% was right in line with precedent.
What drives this curious seasonal phenomenon? Why do gold miners, which should be producing their metal at constant rates, collectively see sharp first-quarter pullbacks? The reasons are both operational and psychological. On the mining front, gold deposits are far from homogenous. Ore bodies have richer and poorer areas in terms of gold content. Often lesser ore has to be mined first to dig down to better ore.
So geologists carefully analyze drilling data to construct mining plans. Some quarters ore with less gold must be mined and run through the fixed-capacity mills, resulting in lower gold production. This industry has often collectively decided to chew through its lower-grade ore on the way to better stuff in years’ first quarters. The reasons are likely new capital budgets in new years and managing investors’ expectations.
Near the end of each year, gold-mining companies allocate capital to expanding operations in the following year. That often includes opening up new areas of their deposits to mine, necessitating digging through lower-grade ore. I suspect managements like to take this quarterly-production hit in first quarters since it gives plenty of time to exceed expectations later in the year. That helps maximize their stock-based compensation.
So after this typical Q1 slump, gold production expands dramatically in Q2 and Q3. From 2010 to 2016, the WGC’s comprehensive data shows global Q2 gold mined ramped 6.6%, 7.6%, 6.2%, 7.1%, 5.8%, 7.3%, and 3.5% QoQ! That averages out to 6.3% quarterly gains in Q2, which I fully expect to see again this year. That surge continued in Q3s from 2010 to 2016, at 8.0%, 4.4%, 5.3%, 9.0%, 8.8%, 5.6%, and 6.7% QoQ.
So the usual first-quarter drop in gold production is followed by big surges in both the second and third quarters, it’s nothing to worry about. Gold mining is highly seasonal due to capital-allocation decisions on mining-plan timing, and managements trying to set themselves up for big expectations beats and thus higher stock prices later in the year. On a YoY basis, Q1’17’s global gold production was flat at -0.5% from Q1’16.
Lower gold production directly leads to higher per-ounce mining costs. Gold miners blast and haul big chunks of gold-bearing ore to mills. These are essentially giant rock grinders that break ore into smaller pieces, vastly increasing the surface area for chemicals to later leach the gold out. Mill capacity is fixed, with limits on ore tonnage throughput. So the same quarterly tonnage of lower-grade ore leads to fewer ounces.
But the costs of running mills, electricity, employees, and maintenance, are the same regardless of how rich the ore being run through. Lower-grade ore yields fewer ounces to spread these big fixed costs across, jacking up per-ounce costs. A 9% drop in quarterly gold production should lead to a 9% rise in per-ounce costs, inversely proportional. Thus the top GDX gold miners’ costs should’ve risen sharply in Q1.
But rather impressively, they didn’t! Q1’17’s gold-mining costs were essentially flat QoQ, which means the elite GDX gold miners are squeezing out major operational efficiencies. That portends exploding profitability in this year’s coming quarters as richer ore is once again fed into the mills to boost production. Stable costs on much-lower production is an incredibly-bullish fundamental omen for gold stocks!
There are two major ways to measure gold-mining costs, classic cash costs per ounce and the superior all-in sustaining costs per ounce. Both are useful metrics. Cash costs are the acid test of gold-miner survivability in lower-gold-price environments, revealing the worst-case gold levels necessary to keep the mines running. All-in sustaining costs show where gold needs to trade to maintain current mining tempos indefinitely.
Cash costs naturally encompass all cash expenses necessary to produce each ounce of gold, including all direct production costs, mine-level administration, smelting, refining, transport, regulatory, royalty, and tax expenses. In Q1’17, these top 34 GDX-component gold miners that reported cash costs averaged just $623 per ounce. That was actually 0.8% lower than Q4’16’s $628, despite that big 8.5% production drop!
Gold-stock traders are notoriously excitable. Literally everything scares them, the sky is always falling in their worlds. They collectively have little courage in their convictions, always looking for excuses to flee. If they want something real to fear, it’s gold falling below the cash costs of mining it. And at $623 in Q1, that true fundamental disaster isn’t in the cards. Gold miners face no meaningful threats at today’s gold prices!
Way more important than cash costs are the far-superior all-in sustaining costs. They were introduced by the World Gold Council in June 2013 to give investors a much-better understanding of what it really costs to maintain a gold mine as an ongoing concern. AISC include all direct cash costs, but then add on everything else that is necessary to maintain and replenish operations at current gold-production levels.
These additional expenses include exploration for new gold to mine to replace depleting deposits, mine-development and construction expenses, remediation, and mine reclamation. They also include the corporate-level administration expenses necessary to oversee gold mines. All-in sustaining costs are the most-important gold-mining cost metric by far for investors, revealing gold miners’ true operating profitability.
In Q1’17, these top 34 GDX components reporting AISC averaged a level of only $878 per ounce. That’s just 0.3% higher than Q4’16’s $875 despite sharply-lower production! The major gold miners are growing their operational efficiencies, which will lead to much-bigger profits growth in coming quarters as both gold prices and production levels mean revert higher. Stable AISC are super-bullish fundamentally for this sector.
Because of gold’s extreme post-election selloff on the equally-extreme Trumphoria stock-market surge, there’s a universal belief today that gold is faring poorly. Yet in Q1’17, gold rallied 8.5% which easily bested the leading S&P 500 stock index’s 5.5% gain! Gold averaged $1220 in Q1, up slightly from the $1218 in Q4. Comparing the major gold miners’ AISC with prevailing gold prices shows huge upside potential.
At $1220 gold and $878 AISC, the top GDX gold miners were earning $342 per ounce mined in Q1. That equates to big 28% profit margins, fat levels most other industries would die for. That is nearly identical to the $343 profits seen in Q4. The gold miners remain quite profitable today, despite the excessively-bearish psychology that recently hammered their stocks back down to fundamentally-absurd levels relative to gold.
The key fundamental reason gold stocks enjoy such massive upside is their profits leverage to gold. Gold-mining costs are essentially fixed during mine-planning stages, when engineers decide which ore bodies to mine, how to dig to them, and how to process that ore. Quarter after quarter, generally the same numbers of employees, haul trucks, excavators, and mills are used regardless of prevailing gold prices.
So higher gold prices flow right through to the bottom line, costs don’t rise with them. To average $1300 in 2017, gold would have to rally just 6.6% from Q1’s $1220 average. Yet with static AISC, such gold levels would lead to a big 23.4% surge in profitability. $1500 gold is only 22.9% higher from Q1’s average, and still way under 2012’s $1669 average before the Fed’s extreme QE3 stock-market levitation slammed gold.
At $1500 gold and $878 AISC, major gold miners’ profits would rocket 81.8% higher to $622 per ounce. If you believe gold is heading higher in the coming quarters as these overvalued stock markets inevitably roll over, the gold stocks are screaming buys today fundamentally. Their already-strong profitability will soar, really leveraging gold’s mean-reversion advance. Gold stocks’ great near-term upside potential is unequalled.
Another key measure of gold miners’ fundamental health is their cash flows generated from operations. The top 34 GDX components’ came in at $3.0b in Q1’17, down a sharp 15.8% QoQ from Q4’16’s $3.6b. But that’s to be expected with sharply-lower production. Naturally fewer ounces being mined and sold yields lower operating cash flows. OCF will surge sharply in coming quarters as gold prices and production recover.
The second big surprise in the major gold miners’ Q1’17 results after flat costs despite lower production was radically-higher profits! And we are talking hard GAAP earnings here, not the garbage adjusted fictions Wall Street is using to make stock-market valuations look less extreme than they actually are. As of the middle of this week, 26 of these top 34 GDX components had reported accounting net income for Q1.
That was the exact-same number I found in my updated Q4’16 analysis of gold miners’ fundamentals. Even with a flat average gold price and lower production, these major gold miners reported over $1.6b in profits in Q1’17. That was an enormous improvement from Q4’16’s $0.6b in collective losses. In a single quarter with flat gold and lower production, the major gold miners’ earnings swung $2.2b back into the black!
While much of Q4’s big accounting losses were driven by non-cash writedowns of gold-mining assets due to sharply-lower gold prices following the election, Q1’s massive profits jump is still impressive. It proves the gold miners are very profitable even at $1220 gold, the same level that has thrown the goofy gold-stock traders into tizzies in recent weeks. Their indiscriminate fleeing spawned a huge fundamental disconnect.
Just last week that leading HUI gold-stock index plunged to 181.6. The first time those levels were seen in gold’s current upleg in late December, gold was just cresting $1150. But that day it closed at $1229. To see the same gold-stock prices over 4 months later with gold about $79 higher is ludicrous! Traders aren’t thinking rationally, they are overcome with fear. When they snap out of it, gold stocks will surge.
Though this contrarian sector is widely despised today, it was the best-performing in all the stock markets last year despite that sharp post-election selloff in Q4. The HUI blasted 64.0% higher in 2016, trouncing the S&P 500’s mere 9.5% gain! Similar huge 50%+ gold-stock gains are highly likely again this year, as gold mean reverts higher on the coming stock-market selloff. The gold miners’ strong Q1 fundamentals prove this.
While investors and speculators alike can certainly play gold stocks’ coming rebound rally with the major ETFs like GDX, the best gains by far will be won in individual gold stocks with superior fundamentals. Their upside will far exceed the ETFs’, which are burdened by overdiversification with underperforming gold stocks. A carefully-handpicked portfolio of elite gold miners will generate much-greater wealth creation.
At Zeal we’ve literally spent tens of thousands of hours researching individual gold stocks and markets, so we can better decide what to trade and when. As of the end of Q1, this has resulted in 928 stock trades recommended in real-time to our newsletter subscribers since 2001. Fighting the crowd to buy low and sell high is very profitable, as all these trades averaged stellar annualized realized gains of +22.0%
The key to this success is staying informed and being contrarian. That means buying low when others are afraid. So we’ve been aggressively adding new trades in recent weeks’ selloff. An easy way to keep abreast is through our acclaimed weekly and monthly newsletters. They draw on our vast experience, knowledge, wisdom, and ongoing research to explain what’s going on in the markets, why, and how to trade them with specific stocks. For only $10 per issue, you can learn to think, trade, and thrive like a contrarian. Subscribe today and get deployed in great gold stocks before they surge far higher!
The bottom line is the major gold miners’ fundamentals were very strong in the just-reported first quarter. As usual seasonally, gold production fell sharply with lower-grade ore being run through the mills. But it was remarkable to see the miners still hold costs steady, evidencing big improvements in operational efficiencies. That will fuel sharply-higher profits growth in coming quarters as production mean reverts higher.
The major gold miners’ accounting earnings already exploded higher in Q1 without Q4’s big writedowns. That leaves the gold stocks wildly undervalued even at today’s prevailing gold prices, let alone where gold is heading in coming quarters. Sooner or later gold-stock traders will realize how irrational their latest bout of excessive fear was. Then they will flood back in with a vengeance, catapulting gold stocks far higher.

Dwayne Melrose is a Director & Chair of the Technical Committee for LiCo Energy Metals [TSX-V: LIC / OTCQB: WCTXF / Frankfurt: 43W1]. I interviewed Dwayne by phone and email in the week ended May 5th. While the interview focused a bit more on the Company’s Lithium project in Chile, the Cobalt opportunity in Ontario, Canada is exciting as well, and LiCo is funded to actively advance both projects.
Dwayne, thank you for your time. Let’s start with your background, can you summarize 30 years into 1 or 2 paragraphs.
Sure, no problem. I have over 30 years’ experience in the mining industry, where I’ve worked all over the world and in a wide range of capacities. Boiling it down though, I’m a project developer. For example, as President & CEO of True Gold Mining Inc., [2011-2015] my team advanced the company from exploration (pre-PEA) into a fully permitted and financed company (raising over $200 M in equity/debt) in just over 3 years. I spent 20 years with Cameco Corp/Centerra Gold working in Canada, the U.S., Kyrgyzstan & Kazakhstan (uranium capital of the world). In the Kyrgyz Republic I led the team at the Kumtor Gold Mine responsible for the discovery of the SB Zone, which significantly increased the mine’s reserves and resources.
I know my way around all aspects of exploration and development. I especially like projects with the potential to be developed in a matter of a few years, not the 5-10 years it takes to develop a gold or uranium mine these days. That’s why I was drawn to LiCo’s lithium brine project in Chile, there’s real potential to be able to dramatically de-risk that project. The region has a skilled mining workforce, mining services and equipment. Our camp is nearby two of the largest lithium producers on the planet, so it has a lot going for it.
Thanks, that was great. Can you give readers a brief overview of LiCo Energy Metals?
Yes, as the name suggests, LiCo Energy Metals is focused on two energy metals, Lithium (“Li”) and Cobalt (“Co”). We have control or ownership interests in 4 primary assets; our flagship Purickuta Project, an option on a Li brine exploitation concession in the famed Atacama salar in Chile, 2 interesting Li prospects in Nevada and the Teledyne Co project in Cobalt, Ontario. We have funds earmarked for all projects, but by looking at our press releases, one can see our main interest at this time is Chile and Canada.

How did you find LiCo, or did the Company find you?
Yes, well I guess the Company found me. I had been speaking with key shareholders at the end of last year, waiting to hear more about various projects under consideration. As mentioned, the lithium play in Chile won me over. Of course, the Company has promising cobalt properties in one of the best jurisdictions (outside of the Democratic Republic of Congo) to find cobalt. I’ve been impressed at how rapidly we have been able to move the ball forward on our projects. That’s something that attracted me as well, the corporate culture of getting things done and being properly funded to work quickly and efficiently. My skill set allows me to cover a lot of bases on the technical side, which is what I’m best at.
In Chile you have an option on an exploitation concession, surrounded on all sides by Chile’s SQM and nearby the operations of another Li giant, Albemarle. There are few publicly-listed Li juniors in Chile, but over 20 in Argentina. Why aren’t other juniors pursuing Chile as actively as they are Argentina?
That’s a great question, one on the top of my list when I signed on with LiCo. There certainly is uncertainty with regard to a junior (ourselves included) being able to advance a project in Chile. We understand that and accept that risk because the potential reward is quite large. Doing business in Chile is challenging, but no more challenging than in many other countries I’ve worked in. There’s a perception that there’s no room for juniors in Chile because SQM and ALB are such major players in the space. But, we believe there’s always room for more than 2 players. If we’re right, then we have a seat at the table in the single best lithium producing jurisdictions in the world. And, we’re not just sitting around waiting for the overall Chile/Li/junior story to pan out, we’re actively involved with boots on the ground and planned exploration activities that are pre-funded.

You bring up a good point about Argentina. Of course Argentina will be a major player in Li supply going forward. Chile is already a major force and will remain so. Argentina is getting saturated with Li juniors (still plenty of Li to be found and harvested, still a great story, but crowded with juniors). We feel strongly that there will be Li winners from among the ranks of juniors in Argentina, winners in Chile, in Nevada and parts of Canada and Australia…. But only the strong will survive in coming years. Funding is key, and we are in good shape on that front.
Please tell us more about the Purickuta Project.
Yes, this is currently our flagship project, and we’re looking to lock down additional property in Chile, both Li and Co targets. I love this project and I’m happy with how it’s progressing. I just returned from a 10-day trip, and I’m impressed with the mining / minerals culture in the Atacama salar region. In the nearby community that we will be working with, something like 75% of the jobs are at either SQM or Albemarle, so again, skilled labor will not be a problem. Equipment & Infrastructure? Not a problem.
We have an exploitation concession, which is different than an exploration concession. So, we believe that we will be able to advance the project relatively quickly. With that in mind, we already contracted a firm to do a detailed Transient Electromagnetic (TEM) geophysical survey that should provide detailed information on the depth and possible thickness of brine bearing aquifers to enable optimal drill target selection. Subject to receipt of permits, drilling to depths of up to 350 m will commence shortly thereafter, followed by an engineering & hydrological study that will include flow testing, porosity measurements and an assessment of aquifer potential.
We believe, subject to permitting, this work could lead us to a maiden resource in a year or less. Technically speaking, drilling a prospect Li brine deposit is straightforward, a lot easier than chasing narrow vein gold deposits! We will continue to deliver updates on our Phase 1 exploration program at Purickuta, so readers should stay tuned.
Can you update readers on the Teledyne Cobalt project?

Yes, look– an estimated $25 million (inflation-adjusted) was invested onsite prior to our arrival, there are underground workings, 600 hectares, the project is in one of the best jurisdictions outside of Africa and China. A detailed NI 43-101 Technical Report was delivered in September 2016. The property is on-strike with a prolific past producing mine. The property adjoins claims that hosted the Agaunico Mine. From 1905 through to 1961, Agaunico reportedly produced 4,350,000 pounds of cobalt and 980,000 oz. of silver worth hundreds of millions in today’s dollars and spot prices.
LiCo Energy Metals reported that it has commenced a Phase One exploration program on the Teledyne Property. A geophysical survey has been completed. It covered areas that have had little to no exploration work to further identify prospective mineralized targets to depths of up to about 300 m or greater. This work, along with the historical data that is currently being compiled, will be evaluated in advance of a diamond drill program planned to commence in late 2nd qtr/early 3rd qtr. We have a lot of good information on our website about the Teledyne project.
Experts like Simon Moores, Joe Lowry & Chris Berry do a great job informing investors about green energy-tech metals. Do you have a view on the market fundamentals for these metals?
When it comes to the global paradigm shift towards green energy high tech Li-ion batteries, I leave it to the experts you mentioned and others. We follow their work, and they seem to agree that demand for both Li and Co will be very strong. This chart tells me all I need to know about the underlying strength in Cobalt, half of world-wide production and reserves are from (in) the Democratic Republic of Congo. Even if supply from the DRC can be sustained, global corporations like Tesla Inc. will presumably go to great lengths to source Co from any other place on earth!
Are there misconceptions about LiCo Energy Metals that you would like to address or final thoughts to leave us with?
I really think that it might be a misconception that Chile is not open for business to juniors. If Chile is a primary factor in keeping readers away from a company like LiCo Energy Metals, that might be a mistake. Every jurisdiction has its own set of opportunities and challenges. If we successfully move forward, we will be doing so in the single best salar on the planet. So, readers should certainly diversify; own Li / Co juniors in other jurisdictions, but it probably makes sense for risk tolerant investors to have exposure to Chile as well. To add to that, getting exposure to both Li and Co, in a single company, is rare and something to consider.
Thank you so much for your time and thoughtful answers to my questions.
Disclosures: The content of this interview is for information purposes only. Readers fully understand and agree that nothing contained herein, written by Peter Epstein, about LiCo Energy Metals, including but not limited to, commentary, opinions, views, assumptions, reported facts, calculations, etc. is to be considered, in any way whatsoever, implicit or explicit investment advice. Further, nothing contained herein is a recommendation or solicitation to buy, hold or sell any security. The content contained herein is not directed at any individual or group. Peter Epstein and Epstein Research [ER] are not responsible, under any circumstances whatsoever, for investment actions taken by the reader. Peter Epstein and [ER] have never been, and are not currently, a registered or licensed financial advisor or broker/dealer, investment advisor, stockbroker, trader, money manager, compliance or legal officer, and they do not perform market making activities. Peter Epstein and [ER] are not directly employed by any company, group, organization, party or person. The shares of LiCo Energy are highly speculative, not suitable for all investors. Readers understand and agree that investments in small cap stocks can result in a 100% loss of invested funds. It is assumed and agreed upon by readers that they will consult with their own licensed or registered financial advisors before making any investment decisions.
At the time this article was posted, Peter Epstein owned shares of LiCo Energy (purchased in open market) and the Company was a sponsor of Epstein Research. Readers understand and agree that they must conduct their own due diligence above and beyond reading this article. While the author believes he’s diligent in screening out companies that, for any reasons whatsoever, are unattractive investment opportunities, he cannot guarantee that his efforts will (or have been) successful. Mr. Epstein & [ER] are not responsible for any perceived, or actual, errors including, but not limited to, commentary, opinions, views, assumptions, reported facts & financial calculations, or for the completeness of this article or future content. Mr. Epstein & [ER] are not expected or required to subsequently follow or cover events & news, or write about any particular company or topic. Mr. Epstein and [ER] are not experts in any company, industry sector or investment topic.
Gold has suffered a sharp pullback over the past couple weeks, stoking much bearish sentiment. While a variety of factors fed this selloff, the precipitating catalyst was a gold-futures shorting attack. These are relatively-rare episodes of extreme selling specifically timed and executed to manipulate gold prices lower rapidly. Traders need to understand these events, which are inherently self-limiting and soon bullish.
Gold-futures shorting attacks are very real, with telltale volume and price signatures unlike anything else. I’ve studied them for many years now, and have written extensively about them in our newsletters as they occur. But it’s critical to realize these rare events are only responsible for a tiny fraction of all gold selling. The vast majority of the time gold selloffs are driven by other far-more-normal factors, not shorting attacks.
These isolated anomalous episodes are often cited as proof the gold price is actively manipulated. But whether that’s true or not, gold-futures shorting attacks can only explain tiny sporadic swaths of gold-price behavior. When they occur their impacts can definitely be outsized, but these are always short-lived. That’s because the huge selling necessary to execute a shorting attack is far too extreme to be sustained.
Gold-futures shorting attacks are naturally a subset of gold-futures trading, which dominates short-term gold prices. Gold-futures speculators enjoy a wildly-disproportional impact on gold levels for a couple of key reasons. The American-gold-futures-derived gold price is the world’s reference price. So whatever the futures speculators as a herd are doing greatly affects popular psychology among gold traders globally.
Speculators’ gold-futures trading is a sentiment multiplier. When these guys are buying and driving up gold, other traders grow bullish and start committing their own capital. This virtuous circle feeds on itself. But when speculators are selling gold futures and pushing gold lower, the rest of the traders get nervous and bearish. So they tend to join in the selling, exacerbating the downside. Traders key off gold-futures action.
On top of this, gold futures inherently enjoy extreme leverage to gold which greatly amplifies their impact on its price. Each gold-futures contract controls 100 troy ounces of gold. At $1250, that’s worth $125,000 in notional terms. But the margin required to trade a gold-futures contract is merely $4200. So a speculator running minimum margin can employ extreme leverage nearing 30x! The legal limit in the stock markets is 2x.
Compared to normal gold investors buying outright at 1x leverage, every dollar of capital bet by futures speculators can have 20x to 30x the gold-price impact! So even though gold investment dwarfs gold-futures trading, on a short-term basis the latter is like the tail that wags the gold-price dog. This extreme leverage inherent in gold futures is the only reason shorting attacks using them are even possible in the first place.
The mechanics of a gold-futures shorting attack are simple. A large speculator or group of them short sells gold-futures contracts at dizzying rates only sustainable for minutes on the outside. That’s far too much selling pressure for gold futures to absorb, radically beyond normal trading tempos. The resulting extreme sell-side imbalance forces gold prices to plunge before enough buyers emerge to absorb that selling.
The speculators executing these attacks hope they spawn widespread gold-futures selling. Because of gold futures’ extreme leverage, traders can’t afford to be wrong for long. At 25x, a mere 4% gold-price move against a position results in a 100% loss of capital risked! So the short sellers hope their selling blitzes will force opposing long-side speculators to capitulate and sell, usually via mechanical stop-loss orders.
This additional selling of gold-futures long contracts drives its price even lower, tripping more stop losses already in place. Then with gold sharply lower, the speculators who launched the shorting attack start to gradually buy gold futures to cover and close their positions. Buying back at lower gold prices than they sold at leads to profits. This whole process is very fast, measured in minutes for shorting and hours for covering.
Gold-futures shorting attacks are easy to identify because the trading volumes are so extreme. Every week, the Commodity Futures Trading Commission details speculators’ total long and short gold-futures positions in its famous Commitments of Traders reports. A big swing in total spec longs or shorts in any entire week is 20k+ gold-futures contracts. Gold-futures shorting attacks dump 20k+ contracts in minutes!
This chart looks at speculators’ total gold-futures long and short contracts since 2015, in green and red respectively. Gold itself is superimposed in blue. It’s incredible how much speculators’ collective gold-futures trading dominates short-term gold price action. I’ve written a bunch of essays on this, the most-recent in late February. Gold price action cannot be understood and gamed without following gold futures.

Just a few weeks ago as gold challenged $1290, a series of gold-futures shorting attacks were unleashed in rapid succession. They quickly turned gold south, nullifying its recent bullish breakout above its 200-day moving average. In order to better grasp what just happened to gold, and why it is actually quite bullish, a major past gold-futures shorting attack offers illumination. The most successful came in July 2015.
During that lazy summer a couple years ago, gold was relatively low but stable. It had spent months meandering between roughly $1175 and $1200, with range outliers near $1150 and $1225. Then on Friday July 17th, some gold news hit. Continuously since April 2009, the Chinese government had claimed it hadn’t bought any gold to add to its central bank’s reserves. Few in the gold world believed that was true.
That day out of the blue, the People’s Bank of China declared its gold reserves were 1658 metric tons. It was a 57% jump from the previously-reported number, and likely still fake and wildly-understated. But it was far behind analysts’ estimates that the PBoC really held 3500t+ of gold. So gold slumped 1.0% that day to $1134, below the lower end of its summer trading range. Naturally sentiment was pretty bearish.
With gold on the verge of a technical breakdown, some large speculator decided to launch a gold-futures shorting attack to hasten the process. The execution of this was particularly Machiavellian, coming late on a Sunday night when gold-futures trading volume was exceptionally low. While the great majority of gold-futures trading occurs during American market hours, electronic trading is actually open 23 hours a day.
So the US Monday trading day effectively really starts on Sunday evening at 6pm NYT. That happens to be well before the Asian markets even open, so anomalous gold trading action then can only come from the extended US session. That Sunday night July 19th when no one was paying attention, some large trader slammed through 24k contracts of gold-futures sell orders within just over a single minute! It was crazy.
That volume spike was so extreme that twice within that single minute separate 20-second trading halts were triggered! So the effective dump time of this massive slug of contracts was actually seconds. The gold price plummeted $48 lower to $1086 in that one minute! That was a dismal new 5.3-year secular low for gold, so it was devastating for sentiment. I wrote much more detail on this event soon after it happened.
Inarguably the only reason to sell 20k+ gold-futures contracts within minutes is to brazenly attempt to manipulate gold’s price lower. Long-side speculators who want to exit positions never sell so fast, since it blasts gold lower wrecking their exit prices. And the same is true for normal short-side speculators. If they expect gold to drop and want to establish shorts, they execute their selling gradually for the best entries.
Long-side and short-side speculators alike want to sell gold futures at the highest gold price possible. So they don’t sabotage their own exits and entries by unleashing far more selling than the market can bear. Normal rational speculators enter and exit large positions relative to market volume gradually, over hours. A 20k-contract buy or sell order broken into pieces and spread across hours will have a far-smaller price impact.
That Sunday-night extreme selling blitz in July 2015 was specifically timed and executed to manipulate the gold price sharply lower. And it succeeded with flying colors! But it wasn’t bearish for gold for long. That $1086 gold low hit the second that extreme short selling ended was about as low as gold got. The silver lining of gold-futures shorting is all those contracts must soon be repurchased to close those positions.
Short selling is effectively borrowing gold futures a speculator doesn’t own to sell them, in the hopes of buying them back later at lower gold prices to repay those debts. So every single contract sold short has to be closed by buying an offsetting long contract. 20k contracts of gold-futures short selling guarantees 20k contracts of long buying is coming in the near future. Thus gold-futures shorting attacks are self-limiting.
Since that short covering after an attack comes gradually, it isn’t evident in trading volume like the initial extreme shorting. There’s no way to know when the offending speculators covered. But gold only drifted modestly lower over the next several weeks or so. The Monday after that Sunday-night shorting attack, gold closed near $1098. At worst in early August, gold fell to $1084 on close. And then it started to rally.
Gold-futures shorting attacks are designed to manipulate herd psychology to unleash cascading selling. But that primarily only works on other hyper-leveraged futures speculators. Gold’s investors don’t use leverage, so a few-percent price drop for them is a proportional minor loss. Thus shorting attacks usually don’t spook them into selling. It’s only gold-futures speculators that are forced out, and that process is fast.
After that July 2015 shorting attack, gold bottomed just 4.4% lower than pre-attack levels less than three weeks later. By that point selling was exhausted, all traders susceptible to being scared into selling low had already sold. That left only buyers, so gold gradually powered 9.6% higher to $1188 over the next 10 weeks or so! Gold-futures shorting attacks effectively suck in all near-term selling, clearing it out of the way.
That July 2015 Sunday-night event was the most-successful example of a gold-futures shorting attack in recent years. While it wreaked real damage on gold technicals and sentiment, that was short-lived. The 24k contracts dumped in a minute had to be covered with offsetting long buying, and the resulting bearish sentiment soon led to selling exhaustion. So gold rallied strongly out of that manipulative shorting episode.
With this background, fast forward to April 2017 a couple weeks ago. By mid-month, gold was doing really well. It had surged 7.4% higher in just over 4 weeks since the Fed’s third rate hike of this new cycle which had been irrationally expected to be super-bearish for gold. Then some large speculator or group of them started probing gold’s downside on Tuesday April 18th with the initial gold-futures shorting attack.
It happened just before 10am NYT that day, which is when the new iteration of the anachronistic London Gold Fix afternoon price auction happens. It’s now called the LBMA Gold price auction, and it shouldn’t even exist in this modern world of continuous price discovery. The precise timing of the London Gold Fix makes it very susceptible to manipulation, as many academic studies and even lawsuits have extensively proven.
Large traders with business contracts tied to that gold fix can attempt to bully the gold price around just before its auction. And they do, with an overwhelming downside bias. That day just before the new LBMA Gold price auction someone dumped 22k+ gold-futures contracts within minutes. But gold hardly bent under that heavy pressure, merely sliding from $1286 to $1279. It then surged to close up 0.4% at $1289!
That initial gold-futures shorting attack certainly stood out. It had the telltale volume and price signature of such an event, but failed miserably. That was very bullish that the gold-futures market could absorb so much selling so fast without plunging. It looked like an isolated attack until the very next day, when again just before the current version of the London Gold Fix an even more extreme shorting attack was executed.
On Wednesday April 19th just before 10am NYT again, someone slammed through a 25k-contract gold-futures sell order in a single minute! The intensity of gold-futures shorting attacks is defined by both the total contracts sold and the compressed time span they’re dumped in. That attack was actually slightly bigger and shorter than that July 2015 one, and thus more intense. But its impact was really muted.
Gold plunged from $1286 to $1275 within minutes, and then rallied back to a -0.7% close at $1280. If it had happened on a Sunday night, its downside gold-price impact would’ve been far greater. Any gold-futures shorting attack is pretty rare, so two in back-to-back trading days was highly suspicious. A large speculator was actively trying to manipulate the gold price lower in a big and brazen way, out in the open.
That was leading into April’s third Friday, which is options expiration. And that was after gold had surged sharply in the month following the Fed’s latest rate hike in mid-March, which was universally assumed to be very bearish for gold. So I wondered if some large trader, like a hedge fund, was facing big losses on gold futures or options. Maybe that trader feared gold cresting $1300 would unleash universal new buying.
Whatever the motivation for those attacks, gold proved remarkably resilient through them. That Thursday and Friday saw no more abnormal selling leading into the 10am NYT LBMA Gold price auctions. So it looked like we were out of the woods. France had the first round of its presidential election that Sunday the 23rd, which played out exactly as expected by pollsters and traders. The winners didn’t surprise markets.
The worst-case scenario which didn’t happen was the popular far-right candidate along with an openly-Communist far-left one winning the two top spots for this weekend’s second-round runoff. They both openly oppose the euro and European Union. But the first-round winner who is expected to dominate the final-round vote this weekend is a moderate, very pro-Europe. So there was no adverse France surprise!
Yet that very Sunday evening at 6pm NYT as the electronic American gold-futures session opened, a massive sell order slammed the markets. This was well before Asian markets even opened, so it was definitely US gold-futures trading. With volume so low on Sunday evening, gold plunged from the $1284 it had closed near the Friday before to $1265. That third gold-futures shorting attack was finally successful.
It was the same modus operandi as that July 2015 masterpiece, a Sunday-evening blitz to unleash stop-loss selling among other long-side speculators. And though gold only fell $19 in minutes compared to $48 in July 2015, enough sentiment damage was done. That sparked the gold selloff that has continued and accelerated right into this week. Selling begets selling, and the catalyzing event was that shorting attack.
Remember gold-futures shorting attacks are exceedingly extreme and fast, 20k+ contracts dumped in a matter of minutes on the outside. As gold bounced sharply back up to $1276 within hours after that latest shorting attack, those dumped contracts were likely already covered by then. Indeed that week’s CoT report showed a mere 2.5k-contract climb in speculators’ total gold-futures shorts. The attack was over.
But it did multiply bearish psychology, leading to much additional follow-on selling by other long-side gold-futures speculators. In the month or so leading into that Sunday-evening shorting attack, total long contracts held by speculators had surged 23% or 62k contracts. So there was plenty of selling to do if all those new upside bets were liquidated. And that is what’s been happening since that sparking attack.
While depressing over the short term, this selling is actually quite bullish. Gold-futures shorting attacks act like cloud-seeding operations to suppress severe thunderstorms. The resulting selling is like a little rain now instead of hail forming later. All speculators susceptible to being scared into selling are soon forced out, leading to selling exhaustion. That leaves only buyers, resulting in big multi-month gold rallies.
After that shorting-attack-spawned pullback in recent weeks, gold is poised for a big rebound. Sooner or later some news will arise igniting a stock-market selloff. That will unleash big demand for gold, from both speculators and investors. Futures speculators rebuilding low long positions will drive a strong rally in gold, which will be mirrored by its leading GLD SPDR Gold Shares gold ETF which stock investors buy.
But these strong coming gold gains will be dwarfed by those in the stocks of its miners, which have been hammered disproportionately hard in this latest gold pullback. The gold stocks have once again been irrationally bashed down to fundamentally-absurd levels relative to prevailing gold prices. This portends big mean-reversion gains coming once gold turns higher again, as usual soon after gold-futures shorting attacks.
Gold stocks are wildly oversold today, poised for a major surge. Our acclaimed contrarian weekly and monthly newsletters are full of our latest picks. They draw on our vast experience, knowledge, wisdom, and ongoing research to explain what’s going on in the markets, why, and how to trade them with specific stocks. Subscribe today and learn to think, trade, and thrive like contrarians for only around $10 per issue!
The bottom line is gold’s sharp pullback in recent weeks was sparked by a series of gold-futures shorting attacks. Some large speculator intentionally dumped massive amounts of gold-futures contracts within minutes, several different times. Such extreme selling so fast was way too much for markets to absorb, so gold fell. This shifted gold psychology to bearish, resulting in cascading follow-on selling by long-side traders.
While such gold-futures shorting attacks quickly hammer gold, they are inherently self-limiting. All those shorts must soon be covered with symmetrical offsetting long buying. So following the initial multi-week selloffs after past gold-futures shorting attacks, gold enjoys strong multi-month rallies. All the selling after the shorting attacks soon leads to gold-futures selling exhaustion, paving the way for big mean-reversion buying.
The past few weeks have been rough for precious metals. Gold had climbed all the way to $1297/oz but the other parts of the sector (Silver and the gold stocks) failed to confirm the move. They have since fallen off a cliff. Over the past 14 days, GDX has lost 15% while GDXJ has declined 20%. Silver during that span has declined every day. Yes, Silver has declined 14 consecutive days. Gold still has some “catching down” to do (with the rest of the sector) but the gold stocks and Silver are oversold and nearing a bounce.
We plot the daily bar charts of our in-house junior gold index and GDXJ below along with GDX. The junior sector has been hit especially hard partly due to news that GDXJ, because of massive inflows will be cutting its stake in various juniors and investing in larger companies. Regardless of the why, the charts are the charts and much damage has been done. However, both junior indices have a bit more downside potential before testing strong support. GDX has good support roughly 4% below Thursday’s close.

Silver, as we noted, is down 14 consecutive trading days and nearly 13% over that period. This week Silver has lost 5.6% and sliced below key long-term averages. While the broader trend is lower, Silver is very close to testing strong short-term support from $15.90 to $16.13. That is another 1%-2% lower for Silver, which could then face resistance from $16.90 to $17.20.

Overall, both the gold stocks and Silver are oversold and nearing a bounce. We say nearing because another day or two of selling is possible before a bounce. Gold meanwhile, has key support at $1220/oz but the gold stocks have already priced in sub $1200/oz Gold. Although the gold stocks are setup to bounce this month and we see a few opportunities, we expect another opportunity and a better one in the middle of summer.
Gold has lost much of its shine in the year-to-date period as investors had fewer reasons to be fearful about the global economic outlook. Towards the end of 2016, investors were optimistic about the bullish prospects of gold this year because of how geopolitical concerns could trigger a capital flight towards the safe haven metal. Investors were especially worried that Donald Trump could initiate policies that would trigger an economic crash when he took the Oath of Office on Jan 20.
However, in the last couple of months, it is becoming increasingly obvious to investors that the global economy is resilient. In fact, it appears that it would make more than a couple of ill-timed or hasty economic policies to trigger another global economic meltdown. However, the next couple of weeks could be decisive for the global economy as new geopolitical concerns start to take shape. This piece seeks to see if the bullish case for gold can be revived going forward.
Here’s the bullish case for gold
Investors are still riding the bull on Wall Street and they haven’t started making the capital flight into gold yet. The yellow metals is still trading around $1,283.40 an ounce but it has managed to creep up 8.44% in the year-to-date period as shown in the chart below.

Interestingly, many analysts had provided strong bullish forecasts for gold and it seems that such bullish forecasts have largely fallen flat. However, analysts are optimistic that gold will eventually get back to winning ways as tensions continue to mount. Roberto Jensen, an analyst at Saxon Trade observes that “the bullion doesn’t always make sharp uptrend in the short-term but we can expect a break-out in the medium term as investors start to lose faith in the political class.”
Jurge Kiener, chief investment officer at Swiss Asia Capital also shares the same bullish sentiments. In his words, “from a fundamental point of view, I think we’re going to get a break out on the upside.” Interestingly, the upcoming French elections could open the proverbial Pandora’s Box that could send gold prices skyrocketing.
Geopolitical tensions revive the bullish case for gold
The minor relief that investors had about geopolitical anxiety earlier this year might have ended and there’s mounting apprehensions that. To start with, there’s news making the rounds that Russian planes are moving wing to wing with Syrian planes on the ground. Syria is one of the hottest spots of geopolitical uncertainties in the Middle East and Russia’s intervention suggests that the West might be drawn into a sinkhole of epic proportions.
The kind of “frenemy” relationship between U.S. President Donald Trump and Russia also precipitates uncertainties on how the West might intervene in Syria. Still on Russia, breaking news also indicate that Russian bombers have started making deep maneuvers into the U.S. border zones in Alaska. Russia has been flexing its military muscles in recent times and investors have more reasons to be afraid.
Going forward to Asia, North Korea had made a video showing its missiles annihilating the U.S. The video itself is a threat that the U.S. can’t ordinarily afford to ignore because of Kim Jong-un’s eccentric nature. However, levelheaded U.S. presidents might ignore North Korea’s threat but it is unlikely that Donald Trump will be so forgiving.
If you would like to receive our free newsletter via email, simply enter your email address below & click subscribe.
 Follow us on Twitter
 Become our facebook fan
CONNECT WITH US
Tweets
Tweet with hash tag #miningfeeds or @miningfeeds and your tweets will be displayed across this site.
MOST ACTIVE MINING STOCKS
Daily Gainers
 CMC Metals Ltd. CMC Metals Ltd. |
CMB.V | +900.00% |
 Eden Energy Ltd Eden Energy Ltd |
EDE.AX | +200.00% |
| GoviEx Uranium Inc. |
GXU.V | +42.86% |
| Eagle Nickel Ltd. |
ENL.AX | +41.67% |
| Citigold Corp. Limited |
CTO.AX | +33.33% |
| Mount Burgess Mining NL |
MTB.AX | +33.33% |
| Exalt Resources Limited |
ERD.AX | +31.94% |
| Casa Minerals Inc. |
CASA.V | +30.00% |
| Cariboo Rose Resources Ltd |
CRB.V | +28.57% |
| Belmont Resources Inc. |
BEA.V | +28.57% |


