
The platinum group metals are composed of six noble, precious metallic elements: iridium, osmium, palladium, platinum, ruthenium, and rhodium. In mining, the most valuable PGMs are platinum and palladium, and rhodium to a lesser degree. Intuitively, the metals are correlated in terms of price movement, and often time track other precious metals, especially gold.

While platinum and gold are correlated (0.85), platinum has historically traded higher than gold, averaging 50% more since 2000. The platinum to gold ratio is currently 0.75, with gold consistently trading higher since the beginning of 2015.
If we shorten the timeframe from 2000 to 2009, the average decreases. However, it still implies that current platinum prices are undervalued relative to gold:

Using the current gold price of $1,300/oz. and the average ratio since 2000, platinum should rebound from its current price of $990/oz. to $1,950. Using the 2009 average of 1.03 still means a significant rebound to $1,360/oz., or a gain of 40% from current levels.
The PGM industry is dominated by the major South African platinum producers, and the largest palladium producer in the world, the Russian-based Norilsk Nickel. Just these two regions account for almost 90% of the World’s platinum and palladium production.
What makes PGM investing even more precarious is that in addition to operating in risky jurisdictions, there are only a handful of public companies. If you filter this to junior companies with a resource, you are down to less than ten.
New Age Metals (CVE:NAM, OTCMKTS:PAWEF)

Current Price: C$0.07
Shares Outstanding: 68.4 million
Market Capitalization: C$4.8 million
Cash: ~C$2.6 million
New Age Metals is one of the few PGM companies that operates in a safe jurisdiction, but is also the cheapest on a per platinum ounce basis. According to our analysis and current market prices, New Age Metal’s River Valley PGM Project hosts a total resource of 3.4 million ounces platinum equivalent. This gives New Age Metals a valuation of C$0.74/oz. Compare this to the average of its comp group, C$40.00/oz.
With platinum poised to return to its median, and New Age Metals trading at a substantial discount to its peers, the optionality in this play is enormous.
New Age Metals is an out of favor companies that has fallen through the cracks because of the decline of platinum. However, the company has raised C$2.6 million and is now more than halfway done its 2017 drilling campaign, focusing on the Dana North (T3) and Pine zone.
In addition, an induced polarization (IP) geophysical survey and borehole geophysics has been completed. The first portion of the drill program was concentrated on follow-up drill testing of the 2015/2016 PGM mineralization at the Pine zone. Drilling will now focus on the geophysical interpretation from the recently completed IP survey.

Six holes were completed at the Pine zone, which is open along strike and at depth. The first batch of assays has been sent to the lab. Results are expected any day now.
The current exploration program will be used to establish the resource base for a preliminary economic assessment (PEA), which the company plans to complete before the end of 2018.
Prior to the current program, the River Valley PGM Project has seen 671 holes drill holes for 152,394 metres and $40 million in total spending. Shares from its last financing became free-trading on August 28, and the stock has sold off in anticipation. In fact, share prices are down more than 50% from its recent high. This bargain price is a nice entry for new investors, especially with an imminent fall commodity rally, and the strong and catalytic news flow on the horizon.
No other PGM company has the torque NAM has, and that is why the company is one of largest holdings in our portfolio.
Cheers,
Sean
Trump administration review of Obama-era environmental regulation near natural monuments may prove a boon for extraction industries and a pain for conservationists.
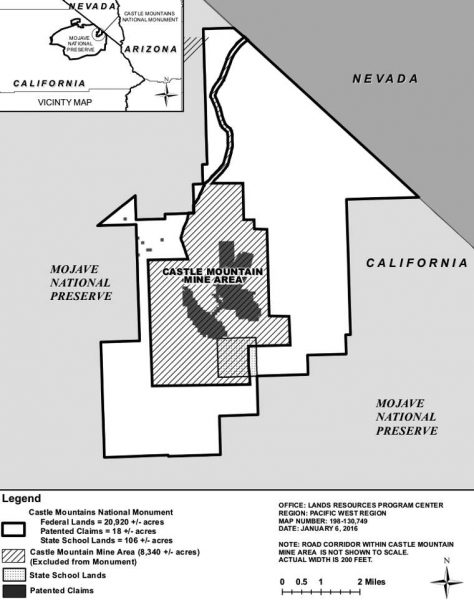
Less than a year ago, President Obama designated a new national monument in the eastern Mojave Desert as part of his administration’s broader efforts to keep extractive industries out of environmentally sensitive areas before Donald Trump took office.
The 20,920-acre monument surrounds an open-pit gold mining operation at the southern end of the Castle Mountains. This designation allowed Newcastle Gold Ltd. (TSX: NCA) to proceed with plans to excavate 10 million tons of ore from its 8,300-acre Castle Gold project through 2025.
However, with the election of Donald Trump as president, many Obama-era regulations are coming under scrutiny. In a plan delivered last week to the White House, Interior Secretary Ryan Zinke said he has suggested the president should make changes at “a handful” of monuments. Castle Mountains National Monument was not on the list of 27 sites proposed for status modification or elimination.
According to a report published by the LA Times, NewCastle has been speaking to Zinke. Documents obtained through a Freedom of Information Act request show that Newcastle and Rep. Paul Cook (R-Yucca Valley) have told Zinke the designation was made without sufficient public outreach or input from the company.
NewCastle’s recommended solution is to decrease the size of Castle Mountains National Monument by 50%.
This has surprised conservationists and environmentalists to learn Newcastle’s position shifted after the Trump administration moved to roll back federal protections on many of the monuments created by previous administrations.
The LA Times reports…
“The company gave its word that the deal we struck nearly a year ago was good,” David Lamfrom, director of California and desert wildlife programs for the National Parks Conservation Assn., told the LA Times reporter. “So we’re … furious to learn that the company and its supporters have been secretly complaining that the process was unjust.”
However, George Panneton, CEO and President of NewCastle Gold was more diplomatic when asked about his company’s discussions, in a quote from the LA Times article.
“We’re more than happy to sit down with environmental groups and work out our differences,” he said. “For example, the mine could help subsidize the monument and Mojave National Preserve once it’s up and running and making a profit.”
Panneton said Newcastle plans to resume production next year.
Sources:
“Under Obama, a gold mining firm was fine with a Mojave Desert monument. Under Trump, an about-face.” LA Times, August 28, 2017,
http://www.latimes.com/local/california/la-me-monument-gold-mine-20170828-story.html
Yesterday morning, NewCastle Gold Ltd. (TSX: NCA) reported additional drill results from the southern portion of the Oro Belle Trend within the region of the JSLA pit on its Castle Mountain Gold Project in California.
Highlights from the release include Hole 167 which intersected 148m of 0.89 g/t from 73m, including 31m of 2.45 g/t, and a further 171m of 0.42 g/t from 236m. CMM-161A intersected 180m of 1.01 g/t from 152m, including 20m of 5.79 g/t. Hole CMM-161A was completed as a supplement to hole CMM-161, where 52 samples were previously assigned a zero grade.
Based on recent results, the company will be starting a 10-km follow-up drill program in September. The company plans to complete its pre-feasibility study by the end of the year.
The 2015 resource includes a measured resource of 17.4 million tonnes at 0.86g/t gold for 0.48 million ounces and an indicated 202.5Mt at 0.57g/t gold for 3.71 million ounces.
NewCastle finished June with $3.12 million in cash and equivalents, before closing a bought deal offering on July 13, at $0.95 per share for total proceeds of ~$15 million. The company needs to raise money for preparation work and according to TD Securities, is looking at debt financing, or better alternatives if presented.
According to data collected by the Financial Times, as of last year, six analysts rated NewCastle outperform with one analyst recommending to buy the stock. As of Aug 25, 2017, the consensus forecast improved amongst 11 polled investment analysts covering NewCastle advises that the company will outperform the market. This has been the consensus forecast since the sentiment of investment analysts deteriorated on Apr 22, 2014.
TD Securities rated the shares in the company with a speculative buy, a speculative risk, and a 12-month price target of $2.00. TD assessed the news to have an positive impact on the company’s share price. By TD’s count, there are still results pending from this program.
News of the results pushed the stock up 1 cent to 96 cents on 497,900 shares on August 29.
On April 18, 2017, Camino Minerals Corp. (TSX-V: COR) released drill results from its copper exploration project, Los Chapitos in Peru. The company intersected in hole CHR-002 1.30 per cent copper over 106 metres, with the hole ending in mineralization, including a section of 2.12 per cent copper over 38 m and hole CHR-001 intersected 0.47 per cent copper over 76 m, including 0.67 per cent copper over 22 m. These results put the company on the radar as a company to watch. On August 25th, John Kaiser of Kaiser Research Online appeared on the Discovery Watch to discuss Camino’s results, its market activity and future prospects.

According to Kaiser, there were good results but as he studied the data it became apparent to him and the company that there was a magnetic anomaly next to hole CHR-002 which suggested there might be a sulphide body at a 200-metre depth. Combined with the data that hole CHR-002 ended in mineralization, the hope was that once they get into the sulphide body that there would be high tonnage and high grade copper in this anomaly. The next phase of drilling was designed to target this anomaly with drill hole DCH-012 (hole 12).
The results drove the company’s share price to an intraday high of $2.21 settling at $1.24 by the end of the day. However, since then the stock has retreated to 47 cents at time of publication, largely in part because the company did not find what it thought was there.

On Aug. 28, the company released results from the Adriana and Katty zones on the los Chapitos project, that included hole 12. Kaiser said that the results were not what the company was expecting. Hole 12 was great until it hit the anomaly; the mineralization very quickly faded out and the company’s theory did not pan out. As a result, the company is choosing not to use IP anomalies as a targeting-tool on this project. Nonetheless, Kaiser and the company are still optimistic about the results and the project.
The company reported drill highlights for the Adriana zone from DCH-012 which intersected 0.93 per cent copper over 96.5 metres, including 2.03 per cent copper over 19.5 m and 5.01 per cent copper over 4.5 m and which DCH-019 intersected 0.97 per cent copper over 42.0 m, including 3.31 per cent copper over 7.5 m. Some drill highlights from the Katty zone included DCH-010 which intersected 0.70 per cent copper over 43.5 m, including 1.85 per cent copper over 5.6 m and DCH-014 which intersected 1.20 per cent copper over 21.4 m, including 2.70 per cent copper over 7.9 m. It is early in the exploration program and the company has plenty of work coming up.
Kaiser believes it is a still interesting project without the sulphide anomaly. The company has about 8,000 to 10,000 metres of drilling planned at the Adriana Zone plus another 2,000 to 3,000 metres at the Katty Zone. Over the next two to three months as the company drills this trend, they will put together a resource estimate. He feels it may not be that great unless they hit something different from the current trend. In addition, the company is applying for permitting at the Atajo zone.
When Kaiser asked Ken McNaughton, President of Camino, why the company is moving forward so aggressively, McNaughton replied because they are seeing copper in all of the core. Kaiser concludes that Camino results were not as spectacular as he had hoped but the company has the cash and is marching in the right direction.
Source: http://www.howestreet.com/2017/08/25/can-inzinc-get-back-in-sync/
***The author does not own any shares in Camino and provided this report for information purposes. The author was not compensated for this article.
- SPDR fund tonnage (GLD-NYSE) has recaptured the 800 ton mark, and rose to 814 yesterday. This is happening as a steady wave of institutional money managers embrace gold as an important portfolio component.
- It’s also occurring as Indian dealers begin buying for Diwali. The result of this overall ramp-up in demand is a beautiful surge higher in the gold price!
- Please click here now. Double-click to enlarge this important gold chart. I call this my “Road To $1392” chart.
- When the price of an asset arrives at major resistance in a huge chart pattern, a real upside breakout and sustained move higher can only occur if market fundamentals are aligned with the technical set-up.
- The good news is that for gold, this appears to be the case. Please click here now. Double-click to enlarge this monthly gold chart. The $1377 – $1392 price range is the resistance zone of a huge inverse head and shoulders bottom pattern. It is the neckline of the pattern.
- Note the tremendous rise in volume that is occurring as gold makes a beeline to that neckline. The Indian gold market has completed its restructuring, and Western money managers are lining up to add gold to their portfolios.
- The managers are not just making a one-time purchase. They are adding gold as apercentage allocation. That allocation seems to be averaging around 5%. As the funds gather new assets, they buy more gold to maintain that 5% allocation.
- Asian fund managers typically give gold an even higher allocation to gold in their funds than Western managers. As China and India become the main economic empires, Western money managers will tend to play “follow the Chindian leader”.
- That means the current Western money manager allocation to gold that is about 5% could easily rise to 10% or 15% in the coming years. Clearly, all liquidity flow lights for gold…are green!
- My weekly chart roadmap suggests that gold will rise not just to $1392, but to $1526, and $1800. Importantly, the rise will be accompanied by substantial growth in respect for gold as an asset class.
- There’s a huge difference in a rally based on an event like QE and a rally based on a permanent portfolio commitment to the asset class. The latter produces price gains that are sustained.
- Please click here now. Double-click to enlarge this important dollar versus yen chart. The 108 “line in the sand” seems ready to fail. A tumble towards 100 would almost guarantee that gold surges to $1392 and begins the move towards $1526.
- The yen and gold are the two most important risk-off assets for heavyweight FOREX traders. The dollar entered a long-term bear market against the yen in 2016. That defined risk itself as entering a major bear market.
- Please click here now. Double-click to enlarge. That’s a daily chart of the dollar versus the yen. It looks like a train wreck.
- US taxes have not been cut. There’s not even any intention to cut the capital gains rate, let alone abolish it. That makes it almost impossible to attract serious long term investment capital into demographically-disastrous America.
- Trump had a chance to turn the country into a bigger and better version of Switzerland, and oversee a tax-free empire where the citizens age with grace. Instead, a 1929 type of situation now seems imminent.
- An inflationary depression is likely to follow the US government’s launch of what I call Trump’s “Tariffs to Infinity” program. He’s launching a mirror image of Herb Hoover’s tariffs program, and doing it with stocks, bonds, and real estate all in a precarious position.
- That’s truly great news for gold stock investors! Please click here now. Double-click to enlarge this fabulous GDX chart. I’ve told gold bugs to watch for a big volume day to send GDX rocketing towards my $26 target, after buying every ten cents decline in the $23 – $18 price zone.
- That volume surge occurred yesterday. Please click here now. Double-click to enlarge. On this two-year chart for GDX, my new $31 target is clear. That’s a key number, because it’s the equivalent of $1392 for gold.
- The 2014 – 2017 period is the most important accumulation zone for gold stock enthusiasts in the history of the gold market, and perhaps in the history of all markets.
- That’s because a reversal in US money velocity is imminent, and the gold stocks versus gold bullion bear market that began in 1995 has ended.
- Tactics? Well, I realize that many gold bugs may have sold their gold stocks in 2014 – 2016 instead of launching the major accumulation program that I adamantly recommended. Some investors bought penny stocks in the general US equity market to try to make back the losses they booked with gold stocks.
- That was obviously a mistake, and those stocks are vulnerable now to a 1929 type of crash. The bottom line is that the current situation of many gold bugs is unfortunate, but just as a car can be repaired, so can a portfolio be repaired.
- Yesterday’s volume bar in GDX is a game changer. So is the growing allocation to gold by institutional money managers, and so is the completed restructuring of the Indian gold market. It’s time for investors to forget the past, move their portfolio cars into the gas station, and fuel up on gold and silver stocks!
Special Offer For Website Readers: Please send me an Email to freereports4@gracelandupdates.
Thanks! Cheers
Stewart Thomson, Graceland Updates
Stewart Thomson is a retired Merrill Lynch broker. Stewart writes the Graceland Updates daily between 4am-7am. They are sent out around 8am-9am. The newsletter is attractively priced and the format is a unique numbered point form. Giving clarity of each point and saving valuable reading time.
https://www.gracelandupdates.
Risks, Disclaimers, Legal
Stewart Thomson is no longer an investment advisor. The information provided by Stewart and Graceland Updates is for general information purposes only. Before taking any action on any investment, it is imperative that you consult with multiple properly licensed, experienced and qualified investment advisors and get numerous opinions before taking any action. Your minimum risk on any investment in the world is: 100% loss of all your money. You may be taking or preparing to take leveraged positions in investments and not know it, exposing yourself to unlimited risks. This is highly concerning if you are an investor in any derivatives products. There is an approx $700 trillion OTC Derivatives Iceberg with a tiny portion written off officially. The bottom line:
Are You Prepared?
Welcome to the dog days of summer. The low volatility in precious metals continues. Janet Yellen or some other Fed heads said something Friday. Precious Metals sold off but quickly recovered. It appears that not much has transpired in recent weeks as precious metals have grinded higher, albeit slowly. However, while it may be a fledgling development, the miners appear to be leading Gold now.
In the chart below we plot a number of markets including Gold, GDX, GDXJ, our 55-stock junior index and our optionality index. We marked three points that help inform our analysis.

From point 1 to point 3, the gold stocks went from underperforming Gold to slightly leading Gold. The gold stocks began to underperform in late winter. They peaked in February and did not even come close to reaching those highs in March while Gold made a higher high. Gold retested that high at point 2 in June while miners made another lower high. However, there has been a change from then to point 3. Gold is at the same level at point 3 as point 2 but so are the miners! Furthermore, in recent days (since point 3) the gold stocks have made higher highs while Gold has not.
The most important recent development in precious metals could be the renewed relative strength in the gold stocks. Volatility has been very low and Gold has yet to break $1300/oz but the gold stocks have managed to reverse their previous underperformance. They were lagging badly from late winter through spring. Ratio charts (not shown) show that the underperformance ended in May and the outperformance began only days ago. If that holds up into September and Gold breaks above $1300/oz then the gold stocks could enjoy strong gains over the weeks ahead.
Jordan Roy-Byrne CMT, MFTA
The junior gold miners’ stocks have spent months grinding sideways near lows, sapping confidence and breeding widespread bearishness. The entire precious-metals sector has been left for dead, eclipsed by the dazzling Trumphoria stock-market rally. But traders need to keep their eyes on the fundamental ball so herd sentiment doesn’t mislead them. The juniors recently reported Q2 earnings, and enjoyed strong results.
Four times a year publicly-traded companies release treasure troves of valuable information in the form of quarterly reports. Companies trading in the States are required to file 10-Qs with the US Securities and Exchange Commission by 45 calendar days after quarter-ends. Canadian companies have similar requirements. In other countries with half-year reporting, some companies still partially report quarterly.
The definitive list of elite junior gold stocks to analyze used to come from the world’s most-popular junior-gold-stock investment vehicle. This week the GDXJ VanEck Vectors Junior Gold Miners ETF reported $4.0b in net assets. Among all gold-stock ETFs, that was only second to GDX’s $7.5b. That is GDXJ’s big-brother ETF that includes larger major gold miners. GDXJ’s popularity testifies to the great allure of juniors.
Unfortunately this fame has recently created major problems severely hobbling the usefulness of GDXJ. This sector ETF has shifted from being beneficial for junior gold miners to outright harming them. GDXJ is literally advertised as a “Junior Gold Miners ETF”. Investors only buy GDXJ shares because they think this ETF gives them direct exposure to junior gold miners’ stocks. But unfortunately that’s no longer true!
GDXJ is quite literally the victim of its own success. This ETF grew so large in the first half of 2016 as gold stocks soared in a massive upleg that it risked running afoul of Canadian securities law. Most of the world’s junior gold miners and explorers trade in Canada. In that country once any investor including an ETF goes over 20% ownership in any stock, it is deemed a takeover offer that must be extended to all shareholders!
Understanding what happened in GDXJ is exceedingly important for junior-gold-stock investors, and I explained it in depth in my last essay on juniors’ Q1’17 results. GDXJ’s managers were forced to reduce their stakes in leading Canadian juniors. So last year capital that GDXJ investors intended to deploy in junior gold miners was instead diverted into much-larger gold miners. GDXJ’s effective mission stealthily changed.
Not many are more deeply immersed in the gold-stock sector than me, as I’ve spent decades studying, trading, and writing about this contrarian realm. These huge GDXJ changes weren’t advertised, and it took even me months to put the pieces together to understand what was happening. GDXJ’s managers may have had little choice, but their major direction change has been devastating to the junior gold miners.
Investors naturally poured capital into GDXJ, the “Junior Gold Miners ETF”, expecting to own junior gold miners. But instead of buying junior gold miners’ shares and bidding up their prices, GDXJ was instead shunting those critical inflows to the much-larger mid-tier and even major gold miners. That left the junior gold miners starved of capital, as their share prices they rely heavily upon for financing languished in neglect.
GDXJ’s managers should’ve lobbied Canadian regulators and lawmakers to exempt ETFs from that 20% takeover rule. Hundreds of thousands of investors buying an ETF obviously have no intention of taking over gold-mining companies! And higher junior-gold-stock prices boost the Canadian economy, helping these miners create valuable high-paying jobs. But GDXJ’s managers instead skated perilously close to fraud.
This year they rejiggered their own index underlying GDXJ, greatly demoting most of the junior gold miners! Investors buying GDXJ today are getting very-low junior-gold-miner exposure, which makes the name of this ETF a deliberate deception. I’ve championed GDXJ for years, it is a great idea. But in its current sorry state, I wouldn’t touch it with a ten-foot pole. It is no longer anything close to a junior-gold-miners ETF.
There’s no formal definition of a junior gold miner, which gives cover to GDXJ’s managers pushing the limits. Major gold miners are generally those that produce over 1m ounces of gold annually. For years juniors were considered to be sub-200k-ounce producers. 300k ounces per year is a very generous threshold. Anything between 300k to 1m ounces annually is in the mid-tier realm, where GDXJ now traffics.
That high 300k-ounce-per-year junior cutoff translates into 75k ounces per quarter. Following the end of the gold miners’ Q2 earnings season in mid-August, I dug into the top 34 GDXJ components. That is just an arbitrary number that fits neatly into the tables below. While GDXJ had a whopping 73 component stocks in mid-August, the top 34 accounted for 81.5% of its total weighting. That’s a commanding sample.
Out of these top 34 GDXJ companies, only 4 primary gold miners met that sub-75k-ounces-per-quarter qualification to be a junior gold miner! Their quarterly production is highlighted in blue below, and they collectively accounted for just 7.1% of GDXJ’s total weighting. And that isn’t righteous, as these include a 126-year-old silver miner, a mid-tier miner with temporary production declines, and a ramping mid-tier producer.
GDXJ is inarguably now a pure mid-tier gold-miner ETF. That’s great if GDXJ is advertised as such, but terrible if capital investors explicitly intend for junior gold miners is instead being diverted into mid-tiers without their knowledge or consent. The vast majority of GDXJ shareholders have no idea how radically this ETF has changed since early 2016. It is all but unrecognizable, straying greatly from its original mission.
I’ve been doing these deep quarterly dives into GDXJ’s top components for years now. In Q2’17, fully 29 of the top 34 GDXJ components were also GDX components. These ETFs are separate, a “Gold Miners ETF” and a “Junior Gold Miners ETF”. So why on earth should they own many of the same companies? In the tables below I highlighted GDXJ components also in GDX in yellow in the column showing GDXJ weightings.
These 29 GDX components accounted for 74.6% of GDXJ’s total weighting, not just its top 34. They also represented 30.1% of GDX’s total weighting. So three-quarters of the junior gold miners’ ETF is made up of nearly a third of the major gold miners’ ETF! I’ve talked with many GDXJ investors over the years, and have never heard one wish their capital allocated specifically to junior golds would instead go to much-larger miners.
Fully 12 of GDXJ’s top 17 components weren’t even in this ETF a year ago in Q2’16. They alone now account for 40.6% of its total weighting. 15 of the top 34 are new, or 45.3% of the total. In the tables below, I highlighted the symbols of companies actually in GDXJ a year ago in light blue. Today’s GDXJ is a radical departure from a year ago. Analyzing Q2’17 results largely devoid of real juniors was frustrating.
Nevertheless, GDXJ remains the leading “junior-gold” benchmark. So every quarter I wade through tons of data from its top components’ 10-Qs, and dump it into a big spreadsheet for analysis. The highlights made it into these tables. A blank field means a company didn’t report that data for Q2’17 as of that mid-August 10-Q deadline. Companies have wide variations in reporting styles, data presented, and report timing.
In these tables the first couple columns show each GDXJ component’s symbol and weighting within this ETF as of mid-August. While most of these gold stocks trade in the States, not all of them do. So if you can’t find one of these symbols, it’s a listing from a company’s primary foreign stock exchange. That’s followed by each company’s Q2’17 gold production in ounces, which is mostly reported in pure-gold terms.
Many gold miners also produce byproduct metals like silver and copper. These are valuable, as they are sold to offset some of the considerable costs of gold mining. Some companies report their quarterly gold production including silver, a construct called gold-equivalent ounces. I only included GEOs if no pure-gold numbers were reported. That’s followed by production’s absolute year-over-year change from Q2’16.
Next comes the most-important fundamental data for gold miners, cash costs and all-in sustaining costs per ounce mined. The latter determines their profitability and hence ultimately stock prices. Those are also followed by YoY changes. Finally the YoY changes in cash flows generated from operations, GAAP profits, revenues, and cash on balance sheets are listed. There’s one key exception to these YoY changes.
Percentage changes aren’t relevant or meaningful if data shifted from negative to positive or vice versa. Plenty of major gold miners earning profits in Q2’17 suffered net losses in Q2’16. So in cases where data crossed that zero line, I included the raw numbers instead. This whole dataset offers a fantastic high-level fundamental read on how the mid-tier gold miners are faring today. They’re looking quite impressive.
After spending days digesting these GDXJ gold miners’ latest quarterly reports, it’s fully apparent their vexing consolidation this year isn’t fundamentally righteous at all! Traders have abandoned this sector since the election because the allure of the levitating general stock markets has eclipsed gold. That has left gold stocks exceedingly undervalued, truly the best fundamental bargains out there in all the stock markets!


Once again the light-blue-highlighted symbols are GDXJ components that were there a year ago. The white-backgrounded ones are new additions. And the yellow-highlighted GDXJ weightings are stocks that were also GDX components in mid-August. GDXJ is increasingly a GDX clone that offers little if any real exposure to true gold juniors’ epic upside potential during gold bulls. GDXJ is but a shadow of its former self.
VanEck owns and manages GDX, GDXJ, and the MVIS indexing company that decides exactly which gold stocks are included in each. With one company in total control, GDX and GDXJ should have zero overlap in underlying companies! GDX or GDXJ inclusion should be mutually-exclusive based on the size of individual miners. That would make both GDX and GDXJ much more targeted and useful for investors.
GDXJ’s highest-ranked component choices made by its managers are mystifying. This “Junior Gold Miners ETF” has a major primary silver miner as its largest component. Over half of PAAS’s sales in Q2 came from silver. And the next two biggest are large South African gold miners. That country has one of the most anti-shareholder governments in the world now, forcing unconscionable racial quotas on owners.
Since gold miners are in the business of wresting gold from the bowels of the Earth, production is the best place to start. These top 34 GDXJ gold miners collectively produced 3,583k ounces in Q2’17. That rocketed 74% higher YoY, but that comparison is meaningless given the extreme changes in this ETF’s composition since mid-2016. On the bright side, GDXJ’s miners do remain significantly smaller than GDX’s.
GDX’s top 34 components, fully 20 of which are also top-34 GDXJ components, collectively produced 9854k ounces of gold in Q2. So GDXJ components’ average quarterly gold production of 119k ounces excluding explorers was 61% lower than GDX components’ 308k average. So even if GDXJ’s “Junior” name is very misleading, it definitely has smaller gold miners even if they’re well above that 75k junior threshold.
Despite GDXJ’s top 34 components looking way different from a year ago, these current gold miners are faring well on the crucial production front. Fully 19 of these mid-tier gold miners enjoyed big average YoY production growth of 26%! Overall average growth excluding explorers was 12% YoY, which is nothing to sneeze at given gold’s rough year since mid-2016. These elite GDXJ gold “juniors” are really thriving.
Gold production varies seasonally within calendar years partially due to mining-plan timing. Gold-bearing ore was certainly not created equal, with even individual deposits seeing big internal variations in their metal-to-waste-rock ratios. Miners often have to dig through lower-grade ore to get to the higher-grade zones underneath. This still has economically-valuable amounts of gold, so it is run through the mills.
These mills are essentially giant rock grinders that break ore into smaller pieces, vastly increasing its surface area for chemicals to later leach out the gold. Mill capacity is fixed, with limits on ore tonnage throughput. So when miners are blasting and hauling lower-grade ore, fewer ounces are produced. As they transition into higher-grade zones, the same amount of rock naturally yields more payable ounces.
Regardless of the ore grades being blasted and milled, the overall quarterly costs of mining don’t change much. Operations require the same levels of employees, fuel, maintenance, and electricity no matter how rich the rock being processed. So higher gold production directly leads to lower per-ounce mining costs. The big fixed costs of gold mining are spread across more ounces, making this business more profitable.
There are two major ways to measure gold-mining costs, classic cash costs per ounce and the superior all-in sustaining costs per ounce. Both are useful metrics. Cash costs are the acid test of gold-miner survivability in lower-gold-price environments, revealing the worst-case gold levels necessary to keep the mines running. All-in sustaining costs show where gold needs to trade to maintain current mining tempos indefinitely.
Cash costs naturally encompass all cash expenses necessary to produce each ounce of gold, including all direct production costs, mine-level administration, smelting, refining, transport, regulatory, royalty, and tax expenses. In Q2’17, these top 34 GDXJ-component gold miners that reported cash costs averaged just $628 per ounce. That was indeed down a sizable 1.3% YoY from Q2’16, and 3.0% QoQ from Q1’17.
This was really quite impressive, as the mid-tier gold miners’ cash costs were only a little higher than the GDX majors’ $605. That’s despite the mid-tiers each operating fewer gold mines and thus having fewer opportunities to realize cost efficiencies. Traders must recognize these smaller gold miners are in zero fundamental peril as long as prevailing gold prices remain well above cash costs. And $628 gold ain’t happening!
Way more important than cash costs are the far-superior all-in sustaining costs. They were introduced by the World Gold Council in June 2013 to give investors a much-better understanding of what it really costs to maintain a gold mine as an ongoing concern. AISC include all direct cash costs, but then add on everything else that is necessary to maintain and replenish operations at current gold-production levels.
These additional expenses include exploration for new gold to mine to replace depleting deposits, mine-development and construction expenses, remediation, and mine reclamation. They also include the corporate-level administration expenses necessary to oversee gold mines. All-in sustaining costs are the most-important gold-mining cost metric by far for investors, revealing gold miners’ true operating profitability.
In Q2’17, these top 34 GDXJ components reporting AISC averaged just $879 per ounce. That’s down 0.9% YoY and 4.9% QoQ. That also compares very favorably with the GDX majors, which saw average AISC nearly identical at $867 in Q2. The mid-tier gold miners’ low costs show they are faring far better fundamentally today than everyone thinks based on this year’s largely-disappointing technical stock-price action.
All-in sustaining costs are effectively this industry’s breakeven level. As long as gold stays above $879 per ounce, it remains profitable to mine. At Q2’s average gold price of $1258, these top GDXJ gold miners were earning big average profits of $379 per ounce last quarter! That equates to hefty profit margins of 30%, levels most industries would kill for. The mid-tier gold miners aren’t getting credit for that today.
Unfortunately given its largely-junior-less composition, GDXJ remains the leading benchmark for junior gold miners. In Q2’17, GDXJ averaged $33.30 per share. That was down a sharp 11% from Q1’s average of $37.46. Investors have largely abandoned gold miners because they are captivated by the extreme Trumphoria stock-market rally since the election. Yet gold-mining profits surged in that span.
At Q1’s average gold price of $1220 and Q1’s average top GDXJ components’ AISC of $924, these elite mid-tier miners were earning $296 per ounce on average. That’s already quite healthy. But quarter-on-quarter from Q1 to Q2, these top 34 GDXJ components’ operating profits rocketed 28% higher to $379 per ounce. There’s absolutely no doubt the sharp decline in gold-stock prices in Q2 had nothing to do with fundamentals!
Gold stocks are in the dumps technically because these lofty stock markets keep powering higher. Even though they are in dangerous bubble territory and the Fed is on the verge of starting to suck capital out of the markets via super-bearish quantitative tightening. These record stock markets have really retarded investment demand for gold, which tends to move counter to stock markets. So gold stocks are deeply out of favor.
Gold-stock price levels and psychology are totally dependent on gold, the dominant driver of miners’ profits. Gold stocks enjoy major profits leverage to gold, which gives their stocks big upside potential when gold rallies. Gold-mining costs are essentially fixed during mine-planning stages. Generally the same numbers of employees and equipment are used quarter after quarter regardless of the gold price.
So higher gold prices flow right through to the bottom line, costs don’t rise with them. If gold rallies just another 3.4% from Q2’s average prices to average $1300 in a coming quarter, profits will surge another 11.1% at Q2’s all-in sustaining costs. In a $1400-average-gold quarter, merely 11.3% higher from Q2’s levels, gold-mining profits would soar 37.5% higher. At $1500, those gains surge to 19.3% and 63.9%!
And a 20% gold rally from Q2’s levels is nothing special. Back in roughly the first half of last year after a sharp stock-market correction, gold powered 29.9% higher in just 6.7 months! So if you believe gold is heading higher in coming quarters as these crazy stock markets falter, the gold stocks are screaming buys today fundamentally. Their already-strong profitability will soar, amplifying gold’s mean-reversion upleg.
Since today’s bastardized GDXJ largely devoid of juniors changed so radically since last year, the normal year-over-year comparisons in key financial results aren’t comparable. But here they are for reference. These top-34 GDXJ companies’ cashflows generated from operations soared 57% YoY to $1458m. That was driven by sales up 59% YoY to $3840m. That left their collective cash balances $34% higher YoY at $6140m.
And top-34-GDXJ-component profits skyrocketed 385% YoY to $751m. Again don’t read too much into this since it’s an apples-to-oranges comparison. If GDXJ’s component list and weightings finally stabilize after such extreme tumult, we’ll have clean comps again next year. We can still look at operating cash flows and GAAP profits among this year’s list of top-34 components, which offers some additional insights.
On the OCF front, 10 of these 34 miners reported average YoY gains of 54%, while 13 of them reported average declines of 33%. Together all 23 averaged operating-cash-flows growth of 5%. That isn’t much, but it’s positive. And it’s not bad considering Q2’17’s average gold price was dead flat from Q2’16’s. These mid-tier gold miners are doing far better operationally than their neglected super-low stock prices imply.
On the GAAP-earnings front, the 10 miners that earned profits in both Q2s averaged huge growth of 110% YoY! And out of 14 more miners that saw profits cross zero in the past year, 8 swung from losses to gains. Total annual earnings growth among those zero-crossing swingers exceeded $536m. Make no mistake, these “junior” gold miners are thriving fundamentally even at Q2’s relatively-low $1258 average gold.
So overall the mid-tier gold miners’ fundamentals looked quite impressive in Q2’17, a stark contrast to the miserable sentiment plaguing this sector. Gold stocks’ vexing consolidation this year wasn’t the result of operational struggles, but purely bearish psychology. That will soon shift as stock markets roll over and gold surges, making the beaten-down gold stocks a coiled spring today. They are overdue to soar again!
Though this contrarian sector is despised, it was the best-performing in all the stock markets last year despite a sharp Q4 post-election selloff. The leading HUI gold-stock index blasted 64.0% higher in 2016, trouncing the S&P 500’s 9.5% gain! Similar huge 50%+ gold-stock gains are possible again this year, as gold mean reverts higher as stock markets sell off. The gold miners’ strong Q2 fundamentals prove this.
Given GDXJ’s serious problems, leading to diverting most of its capital inflows into larger gold miners that definitely aren’t juniors, you won’t find sufficient junior-gold exposure in this troubled ETF. Instead traders should prudently deploy capital in the better individual junior gold miners’ stocks with superior fundamentals. Their upside is vast, and would trounce GDXJ’s even if it was still working as advertised.
At Zeal we’ve literally spent tens of thousands of hours researching individual gold stocks and markets, so we can better decide what to trade and when. As of the end of Q2, this has resulted in 951 stock trades recommended in real-time to our newsletter subscribers since 2001. Fighting the crowd to buy low and sell high is very profitable, as all these trades averaged stellar annualized realized gains of +21.2%!
The key to this success is staying informed and being contrarian. That means buying low when others are scared, like late in this year’s vexing consolidation. An easy way to keep abreast is through our acclaimed weekly and monthly newsletters. They draw on our vast experience, knowledge, wisdom, and ongoing research to explain what’s going on in the markets, why, and how to trade them with specific stocks. For only $10 per issue, you can learn to think, trade, and thrive like contrarians. Subscribe today, and get deployed in the great gold stocks on our trading books before they surge far higher!
The bottom line is the mid-tier gold miners that now dominate GDXJ enjoyed strong fundamentals in their recently-reported Q2 results. Despite a flat comp-quarter gold price, they collectively mined more gold at lower costs. That naturally fueled better operating cash flows and profits. Today’s low gold-stock prices and popular bearishness are wildly unjustified fundamentally, an anomaly that doesn’t reflect operations.
As gold itself continues mean reverting higher, these mid-tier gold miners will see their profits soar due to their big inherent leverage to gold. GDXJ now offers excellent exposure to mid-tier gold miners, which will see gains well outpacing the majors. But if you are looking for the extreme upside likely in true junior gold miners, avoid today’s GDXJ and buy individual stocks. GDXJ is no longer a “Junior Gold Miners ETF”!
Adam Hamilton, CPA
August 25, 2017
Copyright 2000 – 2017 Zeal LLC (www.ZealLLC.com)
1. After rallying almost $100 an ounce from the July lows of about $1210 (basis December futures), gold is consolidating its gains.
2. Fundamentally, there isn’t much immediate time frame news from either the fear trade or the love trade. That’s the root cause of this sideways price action, and its healthy.
3. To get some technical perspective on the consolidation, please click here now. Double-click to enlarge this short term gold chart.
4. A small head and shoulders top pattern has appeared, and it suggests more consolidation will occur before the upside action resumes. This scenario would see gold move down towards $1272,
and then rally towards $1330.
5. Please click here now. Double-click to enlarge. On this chart, a slightly bigger head and shoulders pattern is apparent. It suggests a deeper correction to about $1250 may occur.
6. I’ve outlined the $1300 – $1330 price zone as a good place to book some light profits on positions bought into my $1220 – $1200 buy zone. From here, investors should be viewing the $1275 – $1245 price zone as a fresh buy zone.
7. Please click here now. Double-click to enlarge this important dollar versus yen chart.
8. The world’s biggest liquidity movers are major bank FOREX departments, and they tend to aggressively buy the dollar versus the yen when global risk is declining.
9. When global risk rises, they will aggressively sell the dollar against the yen.
10. Both gold and the yen are viewed by these liquidity flow monsters as the world’s most important safe havens. The 108 dollar versus yen price is a very similar “line in the sand” to the $1300 line in the sand for gold.
11. The dollar is consolidating its recent decline in the 108 area as gold consolidates in the $1300 zone. Fundamentals make charts, and earth shaking news in September and October could see the dollar tumble under 108 and gold blast through $1300.
12. The debt ceiling (which I call a floor) debate is one event that could create a major panic in risk-on markets in this critical September-October time frame.
13. That fear trade rubber is going to meet the road just as Indian dealers begin buying gold aggressively for Diwali. They appear to be in pause mode now, which is logical since they don’t tend to chase the price after it has rallied almost $100 an ounce.
14. As I’ve mentioned, all gold bug eyes need to be focused on the $1275 – $1245 buy zone. Perhaps even more importantly, all gold bug hands need to be ready to press the buy button for their favourite gold stocks if gold moves into that key buy zone.
15. On that note, please click here now. Double-click to enlarge this GDX chart. The $26 area for GDX corresponds with $1300 for gold. Gold has traded at the $1300 area numerous times since February, but GDX rallies have not taken it to $26.
16. I understand that most gold bugs are heavily invested in gold stocks. The inability of these stocks to consistently outperform bullion is frustrating, but there is light in that tunnel.
17. To begin to view the light, please click here now. Double-click to enlarge this long term gold chart. Bull markets have rising volume and bear markets have rising volume. Corrective action, up or down, is accompanied by falling volume.
18. Gold has been in a bull cycle since 2002. Volume has risen on major price advances, and dwindled on declines.
19. Please click here now. Double-click to enlarge. Gold stocks were in a bear cycle against gold from 1995 – 2016.
20. That happened because the Fed lowered rates to make small inexperienced investors move their money out of bank accounts and into risky investments focused on capital gain.
21. The 1995 – 2016 bear market in gold stocks against gold is over. Just as gold based against the dollar in the 1999 – 2001 period before blasting higher on big volume, gold stocks are doing the same thing against gold now.
22. Quantitative tightening in America, Japan, and Europe is coming. Higher rates are in play. This is going to (slowly at first) move money out of global stock markets and government bonds and into the fractional reserve banking system. That will reverse the money velocity bear cycle that corresponded with the gold stocks bear market.
23. It’s a steady process, but it requires investors to be realistic about the time required to create a money velocity bull market… and thus a gold stocks bull market against gold. The bottom line is this:
24. Good gold stock times are not quite here, but they are near!
Thanks!
Cheers
Stewart Thomson
Graceland Updates
Written between 4am-7am. 5-6 issues per week. Emailed at aprox 9am daily.
https://www.gracelandupdates.com
Email: stewart@gracelandupdates.com
Stewart Thomson is a retired Merrill Lynch broker. Stewart writes the Graceland Updates daily between 4am-7am. They are sent out around 8am-9am. The newsletter is attractively priced and the format is a unique numbered point form. Giving clarity of each point and saving valuable reading time.
Risks, Disclaimers, Legal
Stewart Thomson is no longer an investment advisor. The information provided by Stewart and Graceland Updates is for general information purposes only. Before taking any action on any investment, it is imperative that you consult with multiple properly licensed, experienced and qualified investment advisors and get numerous opinions before taking any action. Your minimum risk on any investment in the world is: 100% loss of all your money. You may be taking or preparing to take leveraged positions in investments and not know it, exposing yourself to unlimited risks. This is highly concerning if you are an investor in any derivatives products. There is an approx $700 trillion OTC Derivatives Iceberg with a tiny portion written off officially. The bottom line: Are You Prepared?
Ontario Premier Kathleen Wynne announced today in Thunder Bay that agreements have been reached with the Webequie, Marten Falls and Nibinamik First Nations to begin construction of a road to the currently difficult to access Ring of Fire mineral belt. The route would go to the proposed Noront Resources Ltd. (TSX-V: NOR) mining project that Queen’s Park hope will give Northern Ontario a much-needed economic boost as well as link remote communities with other highways.

News of this today, sent shares of Noront Resources Ltd. up 8.5 cents to 41.5 cents on massive volume of 9.1 million shares. Noront’s 30-per-cent junior partner at the Big Daddy chromite deposit in the region, KWG Resources Inc. (TSX-V: KWG), saw its shares rise a half cent to 2.5 cents on 10.9 million shares traded.
This provincial announcement may prove to be a surprise for KWG Resources, Vice-President of Exploration, Moe Lavigne, as he has been quoted in the past that even he doubted the government’s intentions to advance the road project.
“I have no confidence that the provincial government is really motivated to make this happen. And the reason is that they’re conflicted because they’ve sold that part of the province to the green movement (with the passage of the Far North Act in 2010). They don’t want to be seen building roads in an area they promised to make a park.”
KWG has long been an advocate for the road but a doubtful one. The company partnered with a Chinese engineering firm to conduct, what amounts to, a pre-feasibility study of KWG’s plans for an ore-haul railway from northwestern Ontario to the James Bay region to carry out chromite for processing.
The company claim-staked a 340-kilometre long rail line running from the CN main line into the Ring of Fire mineral belt and to KWG’s Big Daddy chromite deposit, of which it owns a 30 per cent share with Noront Resources, much to the chagrin of federal and provincial authorities who took to court Noront, Cliff Natural Resources and KWG over the legality of using mining claims to secure surface rights for railroads
This announcement will not change things over night, environmental assessments will begin in January, six months before the June 7 provincial election, and construction is set to start in 2019. However, it has changed the prospects for two juniors miners as they will most likely take the news to raise funds and beat the proverbial drum to attract new investors and appease long time shareholders.
The area lies about 575 km. northeast of Thunder Bay, and west of James Bay. The funding is part of the government’s promise to invest $1 billion in Ring of Fire infrastructure in the region.
It’s estimated there is $60 billion in mineral deposits in the area, including chromite, an essential component in making stainless steel of which China consumes about 50% of the global supply.
Three weeks ago we discussed how Gold needed to perform considering the US$ index was likely to bounce due to an oversold condition and extreme bearish sentiment.
We wrote: “Simply put, Gold will have to prove itself in real terms if it is going to hold its ground or breakout as the US$ begins a likely bounce.”
The US$ index has enjoyed only a slight rebound but Gold has maintained its 2017 US$ weakness induced gains because of its strong relative performance. Below we plot the daily line chart of Gold and a number of ratios: Gold against foreign currencies (Gold/FC), Gold against Equities and Gold against Bonds. Since the July low, Gold has showed good nominal and relative performance.

The key has been the strong rebound in Gold/FC and the breakout in Gold/Equities. Gold/FC has broken above two trendlines and is now testing its 200-day moving average. Meanwhile, Gold/Equities has broken above one trendline and has regained its 200-day moving average. It would be very bullish for Gold if Gold/FC pushed through its 200-day moving average while Gold/Equities pushed above trendline 2. Those moves would likely accompany a Gold breakout through $1300/oz but more importantly, they would put Gold in a position of trading above its 200-day moving average in nominal terms and against the major asset classes (stocks, bonds, currencies).
Although Gold failed to break above $1300/oz today (Friday), it remains in position to do so because of its renewed strength in real terms. As long as the US$ index does not rally hard, we expect Gold to break above $1300 and reach $1375. The gold stocks as a group have been lagging recently but in the event of a Gold breakout, we foresee significant upside potential as the group could play catch up. Consider learning more about our premium service including our favorite junior exploration companies.
Jordan Roy-Byrne CMT, MFTA
Jordan@TheDailyGold.com
The gold miners’ stocks have spent months adrift, cast off in the long shadow of the Trumphoria stock-market rally. This vexing consolidation has left a wasteland of popular bearishness. But once a quarter earnings season arrives, bright fundamental sunlight dispelling the obscuring sentiment fogs. The major gold miners’ just-reported Q2’17 results prove this sector remains strong fundamentally, and super-undervalued.
Four times a year publicly-traded companies release treasure troves of valuable information in the form of quarterly reports. Companies trading in the States are required to file 10-Qs with the US Securities and Exchange Commission by 45 calendar days after quarter-ends. Canadian companies have similar requirements. In other countries with half-year reporting, some companies still partially report quarterly.
The world’s major gold miners just wrapped up their second-quarter earnings season. After spending decades intensely studying and actively trading this contrarian sector, there’s no gold-stock data I look forward to more than the miners’ quarterly financial and operational reports. They offer a true and clear snapshot of what’s really going on, shattering the misconceptions bred by evershifting winds of sentiment.
The definitive list of major gold-mining stocks to analyze comes from the world’s most-popular gold-stock investment vehicle, the GDX VanEck Vectors Gold Miners ETF. Its composition and performance are similar to the benchmark HUI gold-stock index. GDX utterly dominates this sector, with no meaningful competition. This week GDX’s net assets are 19.9x larger than the next-biggest 1x-long major-gold-miners ETF!
Being included in GDX is the gold standard for gold miners, requiring deep analysis and vetting by elite analysts. And due to ETF investing eclipsing individual-stock investing, major-ETF inclusion is one of the most-important considerations for picking great gold stocks. As the vast pools of fund capital flow into leading ETFs, these ETFs in turn buy shares in their underlying companies bidding their stock prices higher.
This week GDX included a whopping 50 component “Gold Miners”. That term is used somewhat loosely, as this ETF also contains major silver miners, silver streamers, and gold royalty companies. Still, all the world’s great gold miners are GDX components. Due to time constraints, I limited my deep individual-company research to this ETF’s top 34 components, an arbitrary number that fits neatly into the tables below.
Collectively GDX’s 34 largest components now account for 92.1% of its total weighting, a commanding sample. While the vast majority of gold miners’ Q2’17 results have been released, a few are still coming due to later reporting. GDX includes major foreign gold miners trading in Australia, the UK, and South Africa. These companies report in half-year increments instead of quarterly, so their Q2 data is limited.
The importance of these top-GDX-component gold miners can’t be overstated. In Q2 they collectively produced nearly 9.9m ounces of gold, or 306.5 metric tons. The World Gold Council’s recently-released Q2 Gold Demand Trends report, the definitive source on worldwide supply-and-demand fundamentals, pegged total global mine production at 791.2t in Q2. GDX’s top 34 miners alone accounted for nearly 4/10ths!
Every quarter I wade through a ton of data from these elite gold miners’ 10-Qs, and dump it into a big spreadsheet for analysis. The highlights made it into these tables. If a field is left blank, that means a company didn’t report that data for Q2’17 as of this Wednesday. Companies always try to present their quarterly results in the best-possible light, which leads to wide variations in reporting styles and data offered.
In these tables the first couple columns show each GDX component’s symbol and weighting within this ETF as of this week. While most of these gold stocks trade in the States, not all of them do. So if you can’t find one of these symbols, it’s a listing from a company’s primary foreign stock exchange. That’s followed by each company’s Q2’17 gold production in ounces, which is mostly reported in pure-gold terms.
Most gold miners also produce byproduct metals like silver and copper. These are valuable, as they are sold to offset some of the considerable costs of gold mining. Some companies report their quarterly gold production including silver, a construct called gold-equivalent ounces. I only included GEOs if no pure-gold numbers were reported. That’s followed by production’s absolute year-over-year change from Q2’16.
Next comes the most-important fundamental data for gold miners, cash costs and all-in sustaining costs per ounce mined. The latter determines their profitability and hence ultimately stock prices. Those are also followed by YoY changes. Finally the YoY changes in cash flows generated from operations, GAAP profits, revenues, and cash on balance sheets are listed. There’s one key exception to these YoY changes.
Percentage changes aren’t relevant or meaningful if data shifted from negative to positive or vice versa. Plenty of major gold miners earning profits in Q2’17 suffered net losses in Q2’16. So in cases where data crossed that zero line, I included the raw numbers instead. This whole dataset offers a fantastic highlevel fundamental read on how the major gold miners are faring today. They’re doing pretty darned well!
After spending days digesting these elite gold miners’ latest quarterly reports, it’s fully apparent their vexing consolidation this year isn’t fundamentally righteous at all! Traders have abandoned this sector since the election because the allure of the levitating general stock markets has eclipsed gold. That has left gold stocks exceedingly undervalued, truly the best fundamental bargains out there in all the stock markets!
The elite ranks of the world’s top gold miners haven’t changed much in the past year, seeing only slight shuffling in their GDX weightings. All the usual suspects are here. Since gold miners are in the business of wresting gold from the bowels of the Earth, production is the best place to start. These top 34 GDX gold miners again collectively produced 9,854k ounces in Q2’17. That merely rose 0.5% YoY, essentially flat.
That’s misleading though. GDX’s indexers have long loved the South African gold miners, despite them suffering ongoing heavy depredation by one of the world’s most corrupt and racist governments. Back in 2004, the South African government mandated gold miners increase their black ownership to 26% over the next decade. That was largely accomplished by diluting existing shareholders to give to new ones.
Many of these new black owners soon sold their share windfalls, which forced the unconscionable racial quota lower. Just in mid-June, South African stocks were crushed after their government declared a new black-ownership target of 30%. Even if miners had already hit that previous 26% racial quota, they were given just one year to top back up to 30%. So the entire South African mining industry is reeling in disarray.
Foreign investors being discriminated against for their skin color are fleeing in droves. The South African miners are under so much pressure they are delaying their financial reporting. This week Sibanye Gold was GDX’s 15th-largest holding, and it hadn’t even reported Q2’17 gold production yet. In Q1’17 it ran 330k ounces. So assuming that holds, the top 34 GDX components’ Q2 production is actually running 10,184k ounces. That makes for impressive 3.9% YoY growth!
That latest World Gold Council data shows global mined gold supply slipped 0.3% YoY in Q2. So the major gold miners are using their superior capital firepower to take gold-mining market share from smaller miners. Given the South African government’s openly-racist policies hostile to current shareholders, GDX’s managers should boot all the South African miners from this ETF.
Back in mid-May when I published my analysis of the major gold miners’ Q1’17 results, I discussed an interesting seasonal phenomenon. Between 2011 and 2016, world gold production dropped 8.4% on average from Q4s to Q1s. The drivers of this were explained back in that essay. The relevant part today is that global gold production bounces back dramatically in Q2s and Q3s following those Q1 slumps.
That indeed came to pass again this year despite the lackluster gold-price environment in Q2’17. With that assumed Sibanye Gold Q2 production thrown in, the top 34 GDX gold miners’ Q2 production surged 5.5% quarter-on-quarter from Q1! That’s in line with global gold production’s 6.3% average gain between these two quarters from 2011 to 2016. Everything looks good on the major gold miners’ production front.
Gold production varies seasonally within calendar years partially due to mining plan timing. Gold-bearing ore was certainly not created equal, with even individual deposits seeing big internal variations in their metal-to-waste-rock ratios. Miners often have to dig through lower-grade ore to get to the highergrade zones underneath. This still has economically-valuable amounts of gold, so it is run through the mills.
These mills are essentially giant rock grinders that break ore into smaller pieces, vastly increasing its surface area for chemicals to later leach out the gold. Mill capacity is fixed, with limits on ore tonnage throughput. So when miners are blasting and hauling lower-grade ore, fewer ounces are produced. As they transition into higher-grade zones, the same amount of rock naturally yields more payable ounces.
Regardless of the ore grades being blasted and milled, the overall quarterly costs of mining don’t change much. Operations require the same levels of employees, fuel, maintenance, and electricity no matter how rich the rock being processed. So higher gold production directly leads to lower per-ounce mining costs. The big fixed costs of gold mining are spread across more ounces, making this business more profitable.
There are two major ways to measure gold-mining costs, classic cash costs per ounce and the superior all-in sustaining costs per ounce. Both are useful metrics. Cash costs are the acid test of gold-miner survivability in lower-goldprice environments, revealing the worst-case gold levels necessary to keep the mines running. All-in sustaining costs show where gold needs to trade to maintain current mining tempos indefinitely.
Cash costs naturally encompass all cash expenses necessary to produce each ounce of gold, including all direct production costs, mine-level administration, smelting, refining, transport, regulatory, royalty, and tax expenses. In Q2’17, these top 34 GDX-component gold miners that reported cash costs averaged just $605 per ounce. That was indeed down a sizable 1.9% YoY from Q2’16, and 2.9% QoQ from Q1’17.
Gold-stock traders are notoriously excitable. Literally everything scares them, the sky is always falling in their worlds. They collectively have little courage in their convictions, always looking for excuses to flee. If they want something real to fear, it’s gold falling below the cash costs of mining it. And at $605 in Q2, that true fundamental disaster isn’t in the cards. Gold miners face no meaningful threats at today’s gold prices!
Way more important than cash costs are the far-superior all-in sustaining costs. They were introduced by the World Gold Council in June 2013 to give investors a much-better understanding of what it really costs to maintain a gold mine as an ongoing concern. AISC include all direct cash costs, but then add on everything else that is necessary to maintain and replenish operations at current gold production levels.
These additional expenses include exploration for new gold to mine to replace depleting deposits, mine-development and construction expenses, remediation, and mine reclamation. They also include the corporate-level administration expenses necessary to oversee gold mines. All-in sustaining costs are the most important gold-mining cost metric by far for investors, revealing gold miners’ true operating profitability.
In Q2’17, these top 34 GDX-component gold miners reporting AISC averaged a level of just $867 per ounce. That’s down 2.1% YoY and 1.3% QoQ. That gold price is effectively this industry’s breakeven level. As long as gold is higher, the major gold miners can collectively earn profits mining. And earnings were already hefty in Q2, with gold’s average price of $1258 remaining $391 above the prevailing AISC levels.
Even today with gold investment demand in tatters thanks to the extreme Trumphoria stock-market rally since the election, the gold miners are thriving. The $391 per ounce they earned on average last quarter was a whopping 14.3% higher than their average profits of $342 in Q1’17. Yet the average gold price only rallied 3.1% QoQ. Thus the major gold miners enjoyed outstanding profits leverage to gold of 4.7x!
Yet you sure wouldn’t know it from gold-stock prices. That leading HUI goldstock index which is closely mirrored by GDX saw its average level actually fall 3.1% QoQ in Q2’17. Despite gold miners’ earnings soaring dramatically, goldstock prices slumped. That proves the gold-stock weakness in Q2 was purely a sentiment thing, it was totally unjustified fundamentally. Today’s low gold-stock prices are an anomaly.
Gold-stock price levels and psychology are totally dependent on gold, the dominant driver of miners’ profits. As these bubble stock markets inevitably roll over, probably soon with the Fed’s quantitative tightening looming, gold investment will return to favor for prudent portfolio diversification. And once gold rallies long enough and high enough to convince traders its strength is sustainable, gold stocks will be off to the races.
The key fundamental reason gold stocks enjoy such massive upside is their profits leverage to gold. Gold-mining costs are essentially fixed during mineplanning stages, when engineers decide which ore bodies to mine, how to dig to them, and how to process that ore. Quarter after quarter, generally the same numbers of employees, haul trucks, excavators, and mills are used regardless of prevailing gold prices.
So higher gold prices flow right through to the bottom line, costs don’t rise with them. If gold rallies just another 3.4% from Q2’s average prices to average $1300 in a coming quarter, profits will surge another 10.7% at Q2’s all-in sustaining costs. In a $1400-average-gold quarter, merely 11.3% higher from Q2’s levels, gold-mining profits would soar 36.3% higher. At $1500, those gains surge to 19.3% and 61.9%!
And a 20% gold rally from Q2’s levels is nothing special. Back in roughly the first half of last year after a sharp stock-market correction, gold powered 29.9% higher in just 6.7 months! So if you believe gold is heading higher in coming quarters as these crazy stock markets falter, the gold stocks are screaming buys today fundamentally. Their already-strong profitability will soar, amplifying gold’s mean-reversion upleg.
Another key measure of gold miners’ fundamental health is their cash flows generated from operations. With Q2’s average gold price only 0.1% lower YoY, and AISC down 2.1%, I expected to see OCF growth last quarter. But it didn’t happen, as these top 34 GDX components reporting Q2 cash flows generated from operations only totaled $3362m. That was down a sharp 17.0% YoY, raining on gold stocks’ Q2 parade.
Of the 29 of the top 34 GDX components reporting Q2 OCFs, a majority 17 were down YoY. I looked at this on a company-by-company basis, but no industrywide trends jumped out. Operating cashflows can vary considerably from quarter to quarter depending on what companies are doing with their operating gold mines. As long as OCFs remain massively positive, the gold miners’ operations are quite profitable.
Between Q1’17 and Q2’17 when average gold prices only climbed 3.1%, the top GDX components’ OCF still surged 11.0% sequentially! So the major gold miners are faring quite well despite all the excessively-bearish psychology arrayed against them. Their GAAP-accounting-profits growth in Q2’17 was nothing short of spectacular, which will directly translate into lower price-toearnings ratios to entice investors back.
The 25 of these top 34 GDX component gold miners reporting Q2 profits earned $2371m. That was a mind-boggling 757% higher YoY! Some of this collective growth wasn’t normal. GDX’s largest component and the world’s largest gold miner is Barrick Gold. In Q2 it reported an enormous gain of $880m on one-time sales of one-half and one-fourth of its interests in a couple major gold projects in Argentina and Chile.
IAMGOLD was another notable outlier, with a colossal $524m gain from reversing impairment charges. But even without these two huge one-off gains, overall GAAP profits for these top 34 GDX gold miners that reported Q2 still soared 250% higher YoY! Note in these tables how most of the miners saw substantial profits growth in Q2, with lots of green and little red in that column. The swings across zero are telling too.
More miners swung from losses a year ago to profits in Q2’17 than the other way around. Again all this profits growth will really bring down prevailing gold-mining price-to-earnings ratios, making this sector look a lot more attractive by that popular fundamental valuation measure. Based on this year’s dismal gold-stock sentiment you’d think these miners were doing terribly, but the opposite proved true again in Q2.
With higher production most of these elite gold miners enjoyed sales growth too, but overall revenues in the top 34 GDX components reporting them last quarter still slipped 2.1% lower YoY. There were two drivers. This year’s Q2’17 results had 27 of these 34 companies report sales compared to 28 a year ago. And these gold miners collectively saw a sharp 8.7% YoY drop in their silver production, weighing on revenues.
Still the $10.7b in collective sales among these top gold miners last quarter is up 3.9% QoQ, in line with the average gold-price gain of 3.1%. Those sales are impressive for gold mining, but serve to reveal just how small this little contrarian sector remains. It only takes a tiny fraction of stock-market capital to slosh into the gold miners’ stocks to fuel enormous gains fast. Gold rallying is the key, which shifts sentiment to bullish.
Finally these top 34 GDX gold miners saw big gains in the cash on their balance sheets in Q2. Weighing in at a hefty $13.7b, it surged 14.1% YoY. The sales of major mining projects likely weren’t a big factor, as most sellers and buyers are in this top-GDX-component list. Overall cash grew 3.5% or $462m QoQ, leaving the major gold miners with lots of firepower to snatch up promising projects and mines from the juniors.
So overall the major gold miners’ fundamentals looked quite impressive in Q2’17, a stark contrast to the miserable sentiment plaguing this sector. Gold stocks’ vexing consolidation this year wasn’t the result of operational struggles, but purely bearish psychology. That will soon shift as the stock markets roll over and gold surges, making the beaten-down gold stocks a coiled spring today. They are overdue to soar again!
Though this contrarian sector is widely despised today, it was the best performing in all the stock markets last year despite that sharp post-election selloff in Q4. The HUI blasted 64.0% higher in 2016, trouncing the S&P 500’s mere 9.5% gain! Similar huge 50%+ gold-stock gains are possible again this year, as gold mean reverts higher on the coming stock-market selloff. The gold miners’ strong Q2 fundamentals prove this.
While investors and speculators alike can certainly play gold stocks’ coming rebound rally with the major ETFs like GDX, the best gains by far will be won in individual gold stocks with superior fundamentals. Their upside will trounce the ETFs’, which are burdened by over-diversification and underperforming gold stocks. A carefully-handpicked portfolio of elite gold and silver miners will generate much-greater wealth creation.
At Zeal we’ve literally spent tens of thousands of hours researching individual gold stocks and markets, so we can better decide what to trade and when. As of the end of Q2, this has resulted in 951 stock trades recommended in real-time to our newsletter subscribers since 2001. Fighting the crowd to buy low and sell high is very profitable, as all these trades averaged stellar annualized realized gains of +21.2%!
The key to this success is staying informed and being contrarian. That means buying low when others are scared, like late in this year’s vexing consolidation. An easy way to keep abreast is through our acclaimed weekly and monthly newsletters. They draw on our vast experience, knowledge, wisdom, and ongoing research to explain what’s going on in the markets, why, and how to trade them with specific stocks. For only $10 per issue, you can learn to think, trade, and thrive like contrarians. Subscribe today, and get deployed in the great gold stocks on our trading books before they surge far higher!
The bottom line is the major gold miners’ fundamentals were very strong in the just-reported second quarter. Production growth drove lower costs, which along with rallying gold prices really helped catapult profits radically higher. This is translating into falling P/E ratios, emphasizing the extreme undervaluation rampant in this deeply-out-of-favor sector. Sooner or later investors will take notice and start returning en masse.
The universally-despised gold stocks are the last dirt-cheap sector in these Trumphoria-inflated stock markets. No one wants anything to do with them, which is the best time to buy low before they soar. All it will take to ignite gold stocks’ overdue mean-reversion rally is gold investment demand returning. The miners’ profits will really leverage gold rallying higher, making gold stocks even more fundamentally compelling. Adam Hamilton, CPA August 18, 2017 Copyright 2000 – 2017 Zeal LLC (www.ZealLLC.com)
In the last couple of years, we have seen the majority of commodities bottom out, finally seeing some signs of life. The majority of the rebounds occurred from late-2015 to early 2016.

Molybdenum led the pack after its mini-resurgence and subsequent fall, while nickel experienced the same path, bottoming out several months later.

Looking back at the last five years, iron ore fell the hardest, decreasing 67%, while lead remained the most resilient, losing only 15%.
Now that commodities have bottomed, many in just the past year have been performing extraordinarily. Cobalt is heads above the rest, gaining 114%, while vanadium comes in second at 71%. There is quite a difference afterwards, with copper gaining 32% and zinc 27%.
Precious metals have not fared as well. In fact, the past year saw gold, silver, and platinum drop -5%, -15%, and -16%, respectively.
Regardless, there are incredible gains to be seen ahead, especially in precious metals. The bottom for commodities is in and has been for some time. Are you there to take advantage?
In July, the Rogers International Commodity Index (RICI) had its best month since September, 2016, according to Price Asset Management, a US-based firm that manages a commodity fund based on the RICI index.
The index was up 3.13%, slightly ahead of the benchmark Bloomberg Commodity Index (BCOM) which was up 2.26%.The RICI is a composite, US dollar-based index designed by legendary commodity investor Jim Rogers Jr. in the late 1990’s. Metals continue to be the leading sector as both precious and industrial metals are showing strength as a result of continued strong fundamentals and global disturbances supporting precious metals.
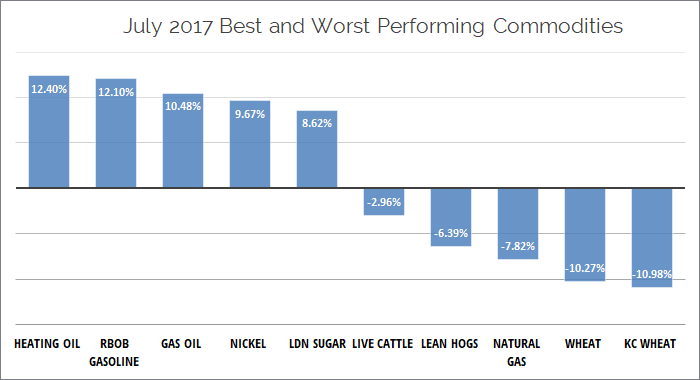
For the year, the RICI was down 2.82% versus a 3.12-per-cent downturn in the BCOM. July was the first month of 2017 where commodities outperformed US Equities, with the S&P 500 Index up 2.06%. The increase in the RICI was very broad based as 29 of the 37 components were positive for the month. The index was led by the energy sector which was up 6.68%, followed by metals up +2.51% and agriculture down a slight 0.42%, For the year so far, metals continue to be the leading sector as both precious and industrial metals are showing broad strength as a result of continued strong fundamentals and global unrest supporting precious metals. Tin was the only metal in the negative at 1.46% for the year.
According to Alan Konn, Managing Director of Price Asset Management LLC, commodities, after an extensive bear market, are now up over +15% from a low in February of 2016. Prices of the RICI components are on average still 50% below their highs. He notes that the recovery has started with tremendous pressure on producers due to the prolonged downturn which has caused marginal production and capital expenditures to be cut. With the possibility of rising interest rates, increased inflation expectations, and fiscal stimulus in the form of global infrastructure spending replacing quantitative easing; the global macro outlook appears decidedly positive. These global macro forces that should be positive for some commodities but may also cause problems in other asset classes.
About the Rogers International Commodity Index:
The Rogers International Commodity Index® (RICI®) was developed by Jim Rogers to be an international, diversified, investable raw materials index. The RICI® currently has thirty-seven commodities representing the energy, metals, and agricultural sectors. The index is a basket of commodities consumed in the global economy. The index’s weightings attempt to balance consumption patterns worldwide (in developed and developing countries) with specific future contract liquidity. The value of this basket is tracked via futures contracts on 37 different exchange-traded physical commodities, quoted in four different currencies, on nine exchanges in four countries.
About Price Asset Management LLC:
Price Asset Management, LLC (PAM) has been registered with the CFTC as a Commodity Trading Advisor (CTA) and a Commodity Pool Operator (CPO) since 2000, and has been managing its main commodities fund since 2007. PAM is an SEC Registered Investment Advisor, a member of the National Futures Association (NFA), and has adopted the Global Investment Performance Standards (with independent verification) and the CFA Institute Asset Manager Code of Professional Conduct. PAM operates with robust compliance and risk management, offsite IT redundancy, business continuity and disaster recovery planning, with external audit and fund administration.
(Sources: Price Asset Management, July 2017 Update)
Aug 15, 2017
- For gold to perform well against the US dollar, it needs to perform well against the Japanese yen.
- Please click here now. Double-click to enlarge.
- Since 2011 gold has traded sideways against the yen. Since 2013 it has been coiling in a very positive symmetrical triangle pattern.
- An upside breakout would usher in a major move higher for gold against both the yen and the dollar.
- Since 2013, the Indian market has been dealing with major duty, import rule, and hallmarking issues. The process has weighed on demand since 2012.
- India’s gold market has undergone an enormous restructuring in response to these issues. The good news is that the restructuring is essentially complete now.
- That paves the way for higher imports on a much more consistent basis.
- China has made significant progress in tying gold price discovery more to physical demand versus supply.
- Trump has also had major success in pushing the dollar lower against most of the world’s currencies.
- These are not just one-time events. Events like tension in Korea can move gold $20 – $50 in a short period of time. A $100 – $200 move is possible if the tension intensifies (which it hasn’t).
- Unfortunately, these gains are no more sustainable than the gains from the 1980 Russian invasion of Afghanistan were sustainable.
- When the tension subsides, all the gains from these one-time events tends to be lost.
- To move $1000 higher or more, gold needs to see a quasi-permanent ramp-up in the physical market demand against static or limited supply growth, and that’s happening right here, right now.
- Trump’s actions on the dollar are a long-term process. He is now beginning a trade war with China. From a gold price discovery perspective, this is vastly more important than tension involving Korea.
- Please click here now. Double-click to enlarge this gold chart.
- Gold looks fabulous. After rallying about $90, gold is consolidating its gains. A new minor support zone at $1260 – $1280 is in play. Both traders and accumulators can be buyers in this support zone, in anticipation of a sustained rise above $1300.
- Please click here now. Double-click to enlarge this daily chart of the Dow. If the US stock market suffers a major crash in September or October, there tend to be “cracks in the dike” in August.
- That’s what’s happening now. The uptrend is still intact, but getting tested. The next technical event to watch for is an RSI non-confirmation. This happens when the Dow makes a new high, but the RSI oscillator (shown at the top of the chart) does not.
- Investors can lighten up in August and essentially take a two month stock market holiday. That’s what I do. It reduces emotional stress.
- My focus is more on the Asian stock markets than America, and I’ve sold about 30% of my positions into this price strength. If there is a crash, investors can buy aggressively, with a focus on banks and Asian markets.
- Asian consumers carry debt that is similar to US citizen debt, but they have a lot of savings and strong saving rates as a percentage of income. US citizens have almost no savings and abysmal saving rates.
- Asian markets will rebound from any crash with the resiliency shown by US markets during the late 1800s. In contrast, US markets are in danger of descending into a stagflationary gulag if they crash. I’m a buyer of US markets if they crash, but not with much risk capital compared to my Asian market allocation.
- Please click here now. A number of influential money managers are following GDX right now, including Jeff Gundlach. The triangle formation they are following is important, but what is more exciting is the bullish volume action.
- Volume is rising on rallies within the triangle, and ebbing on declines. That’s very positive. Bullion and mining stock investors should be very comfortable right now. Technical breakouts appear imminent and fundamentals are strong!
Stewart Thomson is a retired Merrill Lynch broker. Stewart writes the Graceland Updates daily between 4am-7am. They are sent out around 8am-9am. The newsletter is attractively priced and the format is a unique numbered point form. Giving clarity of each point and saving valuable reading time.
Risks, Disclaimers, Legal
Stewart Thomson is no longer an investment advisor. The information provided by Stewart and Graceland Updates is for general information purposes only. Before taking any action on any investment, it is imperative that you consult with multiple properly licensed, experienced and qualified investment advisors and get numerous opinions before taking any action. Your minimum risk on any investment in the world is: 100% loss of all your money. You may be taking or preparing to take leveraged positions in investments and not know it, exposing yourself to unlimited risks. This is highly concerning if you are an investor in any derivatives products. There is an approx $700 trillion OTC Derivatives Iceberg with a tiny portion written off officially. The bottom line:
Are You Prepared?
China will halt iron, iron ore and seafood imports from North Korea starting Tuesday as it implements the new UN sanctions, the Chinese commerce ministry said Monday. According to Metal Bulletin Daily for Aug 15, 2017, China could lose up to a tenth of its lead concentrates supply from looming North Korea Ban within a ban.
Lead and lead ore exports are worth approximately $110 million per year to North Korea, according to UN estimates. At, 51,000 tonnes, it accounted for a tenth of China’s lead concentrate imports over January to May. In mined lead production, North Korea ranks eleventh globally and fifth in Asia in 2016, according to the World Bureau of Metal Statistics (WBMS).
This coincides with of the tightest international lead concentrate markets in years. Global lead market was in a shortage of 9,600 tonnes in the first months of 2017, according to the WBMS. The market reported a shortage of 172,000 tonnes in the whole year of 2016. As of late April 2017, global lead inventory expanded 2,000 tonnes, compared the level seen in late 2016. Global refined lead output was 3.95 million tonnes in the first four months of 2017, up 13.3% for the year.
The International Lead and Zinc Study Group (ILZSG) said in its July report that the metal was in a 91,000-tonne deficit for the first five months of the year, and treatment charges (TCs) for lead concentrate remain low. This has been reflected in fund appetite for the metal: lead net longs from LME traders are the most bullish since the exchange started publishing data on it.
Although China is the biggest producer of mined lead, it lags behind the rest of the world in terms of secondary lead output. While the US produces 70% of its lead from recycled batteries, the European rate is below 60% and that of China is around 50%, according to the International Lead Association.
Today, August 14, 2017, the TSX Venture Exchange Index was up 1.83 points to 764.64. In total for the TSX Venture, 331 issues advanced, 348 remained unchanged and 363 declined. During the trading day, 113,333,831 shares changed hands in 20,356 trades worth approximately $42,3697,000 (CDN). At time of publication, gold was down $6.80 to $1287 and silver down half a cent to $17.065.
OK2 Minerals Ltd. (TSX-V: OK) reported results from its 2017 phase 1 exploration program at its Pyramid copper-gold porphyry project in British Columbia. Eleven holes were drilled for a total of 1,260.42 metres, and four zones were drill tested. The company plans to test deeper targets in the hope to produce some better results. Shares in the company remained unchanged with 251,800 shares traded for the day.
Erdene Resource Development Corp. (TSX-V: ERD) released additional assay results from the company’s 2017 drill program at its Bayan Khundii gold project in southwest Mongolia. Highlights include: step-out drilling north of Midfield Zone returns several high-grade intersections, including: 40 metres of 3.3 g/t gold, including 9 metres of 12.5 g/t gold, 165 metres north of the Midfield Zone (BKD-179), 71.6 metres of 1.6 g/t gold, including 19 metres of 4.6 g/t gold, 80 metres north of the Midfield Zone (BKD-178) and 39 metres of 2.1 g/t gold, including 9 metres of 8.2 g/t gold, 200 metres north of the Midfield Zone (BKD-182). Shares in the company were up $0.03 cents to $0.82 cents on 161,500 shares for the day.
For the rest of the year, the drilling program at Bayan Khundii will focus on defining the newly discovered high-grade mineralization encountered during its 2017 exploration program and exploring a series of geophysical and geochemical targets within the larger 2-kilometre by 1.8-kilometre Bayan Khundii target area. In addition, the company will complete regional drilling between Bayan Khundii and its Altan Arrow gold-silver project. Based on upcoming results, and on drilling completed at Altan Nar in 2015 and 2016, the company hopes to update its resource estimate at Altan Nar in 2018 and a maiden resource estimate for Bayan Khundii.
Dolly Varden Silver Corp. (TSX-V: DV) released results from exploration drilling on the Dolly Varden silver project in the Golden Triangle of northwestern British Columbia. Hole DV17-058 — lower zone yielded a core length of 16.1 metres (13.19-metre true thickness) grading 269 g/t (grams per tonne) silver, 0.3 per cent lead and 0.21 per cent zinc for a silver-equivalent of 292.8 g/t. Within this Lower Zone interval is 7.65 metres (6.27 m true thickness) grading Ag 481.1 g/t, Pb 0.50 % and Zn 0.29 % for a silver equivalent of 517.3 g/t. This constitutes the discovery of a new zone located 200 metres north and 200 metres deeper than the north side of the Torbrit deposit. It was planned to consist of over 5,000 metres of diamond drilling in about 25 to 35 drill holes. A proposal is being considered to expand the 2017 exploration program to about 12,000 metres. Market response was positive as the news of the results pushed shares in the company up 0.09 cents to $0.69 cents on 216,400 shares traded for the day.
Salazar Resources Ltd. (TSX-V: SRL) released results from an additional 10 holes of its current drill program on the company’s Curipamba project in Ecuador. Highlights include 6.87 metres averaging 1.47 grams per tonne gold, 10.9 g/t silver, 7.42 per cent copper and 1.01 per cent zinc from hole CURI-234 and from hole CURI-231 3.09 metres averaging 0.60 g/t gold, 9.40 g/t silver, 6.43 per cent copper and 0.18 per cent zinc. News of the results did not affect the shares in the company for the day, as share price remains unchanged at $0.12 on 400 shares traded.
Silver Range Resources Ltd. (TSX-V: SNG) reported grab samples up to 73.3 g/t Au at Enigma, south of Yerington in Lyon county, Nevada. The company plans to conduct a survey at the property to further define the geology of the area. Shares in the company were half a cent on 10,000 shares to finish the day at $0.195 cents.
Avino Silver & Gold Mines Ltd. (TSX-V: ASM) released drill results from the remaining 11 holes of its 22-hole drill program at the main Avino mine, 80 kilometres northeast of Durango, Mexico. The company commenced new drill programs on the Avino property which are targeting three areas of mineralisation. The first area of drilling is located on surface at the west end of the San Gonzalo mine and comprises six holes for a total of 1,200 metres of drilling. The second area is situated where the Avino-San Juventino and the footwall breccia intersect and consists of five holes for a total of 1,300 metres. The third area is located in the historical El Chirumbo mining area, which is located at the east end of the Avino vein and comprises 10 holes for a total of 2,000 metres of drilling. Shares in the company were up $0.04 to $2.11 on 25,100 shares traded for the day.
The outlook for precious metals has changed quite a bit over the last month. In early July, Gold and gold stocks were weak and threatening severe breakdowns below key levels such as $1200 Gold and $21 GDX. Those moves reversed course and now Gold and gold stocks are threatening resistance. The prognosis has turned bullish and with the help of a correcting stock market precious metals could build on their recent rebound.

Below we plot the weekly bar chart of Gold which is testing critical resistance in the $1290-$1300 area. Gold could close the week at its highest weekly close in 2017, just weeks after breaking its 2017 uptrend. That early July breakdown proved to be a false break as Gold has been able to rally back up to resistance. Gold has broken the downtrend line since 2011 but the most important resistance is $1300. With a break above $1300, Gold could be on its way to a retest of the 2016 high at $1375.
Turning to the miners, we find that GDX has already broken its downtrend and the 200-day moving average. GDXJ faces strong resistance at $34-$35. Silver has a little ways to go before it can break its downtrend line but its relative strength in recent days is quite encouraging.

While there are only a few data points in the junior bull analog chart (which is based on our junior indices), it suggests the juniors could be close to starting a new leg higher. If Gold is going to rise to $1375 then the juniors would enjoy a good pop. The analog chart shows the significant upside potential in juniors if Gold were to clear $1375 and advance towards $1550-$1600.

There are several reasons we have turned bullish. First, precious metals were breaking down in early July yet that reversed course entirely. Gold has rallied back to +$1290 and well above resistance at $1240-$1250. If Gold were going to break below $1200 then the rally would have rolled over again around $1240. Second, intermarket activity has turned quite favorable for Gold. The US$ index has not made a new low but Gold has perked up. Meanwhile, Gold is benefitting (as it should) from weakness in the equity market. We think the weakness could continue and drive Gold to $1375.
The bottom line is Gold is now showing strength on both a nominal and relative basis. If this continues then Gold will clear $1300 and the gold stocks (which have been lagging) could push higher in sudden and aggressive fashion. Consider learning more about our premium service including our favorite junior exploration companies.
Jordan Roy-Byrne CMT, MFTA
On Wednesday, Aug. 8, Nevsun Resources Ltd. (T:NSU) reported a loss of $0.15 earnings per share (EPS) for the second quarter of 2017 (all amounts are in U.S. dollars). Revenues were down quarter on quarter (8%) on a decline in realized zinc prices (11%) and zinc concentrate sales (35%), but benefited from copper sales (7.7 million lbs). EPS was impacted by a $70 million, write-down of long term stockpiles and mobile equipment, reflecting a revised mine plan at Bisha from 8 to 4 years. Cash increased to $171 million from $169M in the first quarter of 2017, primarily the result of positive operating cash of $13 million, reduced taxes and a working capital release of $9 million. Zinc production was down by 17% to 43 million lbs on lower throughput, grades and recoveries, and zinc and cash costs were up 1% to $0.92/lb. However, copper production, though minor (5.7 million lbs), was up 36% for the quarter, maintaining cash costs of $1.59/lb.
Management revised production guidance to 190-210 million lbs of zinc, down from 200-230m lbs, while its outlook for copper improved with a guidance of 20-30 million lbs of copper, up from 10-20 million lbs. Revised production guidance reflects the fact that Bisha no longer produces bulk zinc concentrate. In order to improve metal recovery and material movement, the company approved an additional $24 million in capital for Bisha. A larger capital investment would have been required to maintain a longer mine life and could not have been funded by the internal cash flow from Bisha. The Bisha operation now has a reserve mine life to mid-2021, down from approximately eight years at the last reserve estimate.
The company’s main focus is to bring the Timok project into production by 2021. In 2017, the company has spent $14 million on the Upper Zone and has recently started a 10,000-metre drill program to search for additional high grade zones. Milestones achieved to date in 2017 include the completion of all planned infill drilling (30,000 metres) and the advancement of key technical mining, metallurgical and environmental studies. The company noted that it will begin a decline development to reach the ore body, rather than a shaft, in the fourth quarter of 2017.
The company delayed the preliminary feasibility study to the first quarter of 2018 and plans to deliver an update preliminary economic assessment in October, 2017. After the delivery of a feasibility study on either the Upper Zone or the Lower Zone, Freeport McMoran (US:FCX) will increase its ownership in the Lower Zone to 54% and Nevsun will own 100% of the Upper Zone and the remaining 46% of the upper zone.
The negative news has sent the shares in the company down to a year low of $2.67 (CDN), from $3.39 before the second quarter financials were released on Wednesday. These are levels that have not been seen since 2010, and a far cry from its peaks in the seven dollar range back in 2010 when Bisha was moving to production and copper was cresting at $4.50/lb.
Backgrounder on Nevsun Resources CEO and President, Peter Kukielski
Nevsun Resources appointed Stanford-educated civil engineer Peter Kukielski, the former head of AcrelorMittal, as CEO and President of Nevsun in May, 2017. He ruffled feathers at ArcelorMittal by suggesting it should spin-off its mining division, joined Warburg Pincus at the beginning of 2014. He also sits on the board of Perth-based South32. At Warburg Pincus he was the executive in residence at the private equity firm, where he wanted to create not a mining fund but an operating miner with physical assets. This was back in 2014 at the bottom of the commodities downturn when several other mining executives, including former Xstrata boss Mick Davis, launched private equity funds hoping to get fire sale prices on assets as prices tumbled. Instead, they largely sat on the sidelines as prices rallied throughout 2016 according to the Global Mining Observer. Warburg Pincus pulled the plug on the $1 billion fund at the end of 2016, having failed to land any deals. One mine his fund was looking at was Rio Tinto’s IOC (Iron Ore Company of Canada) operation in Canada, but complications included a $900 million lawsuit hanging over the asset, brought by Inuit groups. Don Lindsay, the head of Vancouver-based Teck, also looked at buying the mine under Rio’s former chief executive Sam Walsh. Unphased by the closing of the fund he led, Mr. Kukielski landed at the helm of Nevsun as it is moving to its next project, Timok where he may get his wish to actually build an operating mine with assets, if he sticks around and no one pulls the plug.

The total company leverage is calculated as debt to EBITDA or free cash flow. This metric is commonly used to assess a company’s ability to service its debt. When we first published this chart, it appeared there was still some runway left, as market caps were increasing in tandem. However, the ratio has now reached a record high, signalling that debt loads are at capacity. It appears the S&P 500’s torrid pace is running out of fuel, and it will be interesting to see how companies will continue to fake their growth.

As depicted by debt margin, investors are borrowing at record levels to buy shares. Speculators are still trying to squeeze out as much as they can from an overbought market, and will be vulnerable to a sell-off. Once the selling begins, it will be exaggerated as investors begin to unwind their positions. This will bring about market capitulation, and even more downside for an extended time.
The gold miners’ stocks have largely ground sideways this year, really lagging gold’s strong rally. That lack of upside has decimated sentiment, leaving a bearish wasteland bereft of hope. But this deeply-out-of-favor sector is actually a coiled spring, ready to surge dramatically as psychology shifts. Sentiment, technicals, and fundamentals all point to much-higher gold-stock prices even at today’s prevailing gold levels.
The main appeal of gold-mining stocks is their underlying profits’ leverage to gold. The gold stocks are much riskier than gold, due to many operational, geological, and geopolitical risks the metal itself doesn’t share. So investors and speculators alike must be compensated for these big added risks with superior returns to gold. That hasn’t happened so far in 2017, which is why gold stocks are so widely despised today.
All year long, the extreme Trumphoria-fueled stock-market rally has stolen the limelight. The flagship S&P 500 stock index is up 10.5% year-to-date as of this week. That’s sucked all the oxygen out of the investment world, overshadowing everything else. So investors have shunned gold this year, while the futures speculators have shorted it at near-record extremes. Gold has often been mocked on CNBC all year.
That’s pretty ironic though, as gold’s YTD performance is +10.9%! That’s a little better than the general stock markets. That should be enough to garner some attention, but gold can’t escape from the stock markets’ eclipsing shadow. Gold miners’ inherent profits leverage to gold usually enables their stock prices to amplify an underlying gold rally by 2x to 3x. Thus the gold-stock sector ought to be up 20% to 30% YTD.
The dominant gold-stock index is the HUI NYSE Arca Gold BUGS Index, which is closely mirrored by the leading GDX VanEck Vectors Gold Miners ETF. So far in 2017, its performance has been dismal relative to gold. As of this week the HUI was only up 6.6% YTD! That makes for mere 0.6x leverage to gold, unacceptable given gold stocks’ big additional risks. That’s why psychology is exceedingly bearish today.
Gold stocks are underperforming so massively this year due to sentiment. Because this small contrarian sector is languishing, traders want nothing to do with it. And because they are widely avoided, the gold stocks are trapped in consolidation hell. The only thing able to start shifting sentiment back to bullish is a meaningful gold rally igniting material gold-stock buying. The resulting gains would win back capital inflows.
Sentiment and technicals are inexorably intertwined. No matter what else is going on, when stocks are high traders get excited and bullish. That’s happening in the general stock markets today, despite their bubble valuations and the Fed’s quantitative tightening ominously looming. But when stocks are down, traders wax sullen and bearish. The markets work this way universally, the gold stocks are no exception.
As at all sentiment extremes, traders have assumed this vexing gold-stock weakness will last indefinitely. But that’s a bad bet, as sentiment perpetually meanders back and forth between excessive greed and fear. The longer sentiment stays on one side of that arc, and the more extreme it gets, the greater the odds for an imminent mean-reversion swing back the other way. And those tend to overshoot proportionally.
The last time gold stocks drifted near lows like so far this year was in the second half of 2015. They were hated, with nearly everyone predicting they were doomed to spiral lower forever. Yet sentiment shifted out of that bearish echo chamber, and the gold stocks took off like North Korean ICBMs. In merely 6.5 months, the HUI skyrocketed 182.2% higher! That amplified gold’s 25.2% concurrent rally by a breathtaking 7.2x.
Gold stocks have long exhibited a drift-surge pattern. Long consolidations bleeding away all bullishness are soon followed by massive uplegs. They ignite just as traders are capitulating and walking away. The best time to buy is late in one of these grating drifts, because the next major upleg is just around the corner. And that’s exactly where the gold stocks are today technically, as this HUI consolidation chart reveals.

Last year’s monster gold-stock upleg that has already been forgotten is crystal-clear here. Contrarians willing to fight the herd and buy low in late 2015 when gold stocks were shunned made out like bandits. They nearly tripled their capital in about a half-year! Once this sector starts moving, shifting from drift to surge, its resulting uplegs tend to be massive. The trick is bucking bearish sentiment to get invested early.
That enormous upleg birthing a new gold-stock bull last year was followed by a gigantic drop driven by gold. Since prevailing gold prices directly drive their earnings, the gold stocks follow and amplify moves in the metal they mine. In the second half of 2016, gold plunged sharply thanks to a highly-improbable series of events. Gold’s resulting freakish drop was incredibly anomalous, which is why it bounced back this year.
First gold was hit by gold-futures stop losses being run, then by the Trumphoria stock-market surge in the wake of the surprise election results, and finally by the Fed’s second rate hike of this cycle. Seeing an isolated event-driven selloff isn’t unusual, but three in a row back-to-back is unheard of. I explained all of them in depth in past essays if you want a deeper understanding of why they were unrepeatable one-off events.
Gold fell 17.3% in 5.3 months, certainly a massive correction but well shy of new-bear-market territory at -20%. Gold stocks as measured by the HUI amplified gold’s downside by 2.5x, smack in the middle of that historical 2x-to-3x leverage range. So the huge gold-stock selloff in last year’s second half wasn’t outsized at all compared to the anomalous carnage in gold. That’s the way this sector has always worked.
Once again gold miners’ profits leverage to gold explains their price action. Consider an example, a gold miner producing gold at all-in sustaining costs of $1000 per ounce. At $1250 gold, that yields profits of $250 per ounce. If gold rallies or falls 10% to $1375 or $1125, this miner’s profits literally soar or plunge 50% to $375 or $125 per ounce! The higher any miner’s costs, the greater its profits leverage to gold prices.
In the last quarter fully reported, Q1’17, the major gold miners of GDX reported average all-in sustaining costs of $878. Q2’17 results haven’t been fully released yet, but should be by next week. At $878 AISC, $1250 gold yields profits of $372 per ounce. If gold rallies or falls 10%, these per-ounce profits change to $497 or $247. That’s up or down 34% on a 10% gold move! That’s where gold stocks’ leverage to gold comes from.
So seeing this sector largely drift sideways this year despite gold’s strong 10.9% YTD gain is anomalous, it shouldn’t have happened. And it wouldn’t have happened without stock markets’ extreme Trumphoria rally monopolizing traders’ attention. They’ve been so captivated that they’ve ignored gold’s superior gains in 2017, and that lack of interest has slaughtered the gold stocks dependent on gold being in favor.
The result technically is the major triangle consolidation rendered above. Since gold stocks’ deep low in December on a Fed rate hike, their lower support has been slowly climbing. But meanwhile their upper resistance has been trending lower. This has slowly and inexorably compressed this sector technically, tightening the gold stocks into a coiled spring. These converging trendlines guarantee an imminent breakout.
And odds overwhelmingly favor an upside resolution to this triangle consolidation pattern. Gold stocks’ resistance line is paralleling their key 200-day moving average. A decisive move above their 200dma will unleash all kinds of buying from technically-oriented traders. And that 200dma breakout will result in the simultaneous breakout from this year’s vexing consolidation. That will rapidly shift psychology away from bearish.
There are two major reasons why gold stocks are heading much higher rather than lower soon. Gold has long enjoyed a major autumn rally which tends to catapult the gold stocks higher in the coming months. I wrote about this in depth last week, explaining why it happens and quantifying it. With gold seasonals so strong in the coming months, it would be super-unlikely for gold stocks to break down from already-low levels.
On average in bull-market years, gold powers 6.9% higher between mid-June and late September. That fuels an 11.2% HUI rally on average in that same general timeframe. As gold continues powering higher over the next month, the gold stocks will almost certainly amplify its gains. This isn’t an academic point, as this year’s autumn rally is already well underway. Gold’s summer-doldrums low came in early July.
Since then gold and the HUI have climbed 5.2% and 8.6% higher as of this week. That resulting 1.7x leverage is still on the low side, but rapidly improving from the 0.6x year-to-date metric. Gold stocks are starting to outperform their profits-driving metal again, a major sign sentiment is already shifting away from extreme bearishness. But there’s a far-better reason to be bullish on gold stocks than their autumn rally.
While these coiled-spring technicals are exciting, they pale in comparison to the immense fundamental disconnect between gold-miner stock prices and gold levels. Ultimately all stock prices eventually reflect some reasonable multiple of their underlying corporate profits. But the gold stocks are now collectively trading as if gold was far under current prices, which is supremely irrational. This anomaly has to mean revert.
This last chart offers the most-compelling fundamental justification to be heavily long gold stocks today. It looks at a construct called the HUI/Gold Ratio, calculated simply by dividing the daily HUI close by the daily gold close. This HGR acts as a proxy for that core fundamental relationship between gold, miners’ profits, and their stock prices. Gold stocks have rarely been as undervalued relative to gold as they are now.

This week, the HGR was trading near 0.152x. The HUI was running at 15.2% of gold’s price. Of course like all indicators that means nothing in isolation. But the context provided by this long-term HGR chart shows how absurdly cheap the gold stocks remain relative to the metal which drives their earnings. The only year in modern history where gold stocks were cheaper was 2015, the end of an exceptional secular bear.
Early in 2016 gold stocks as measured by the HUI slumped to a fundamentally-absurd 13.5-year secular low. It made no sense whatsoever. Though gold was trading near $1087, way above this industry’s all-in sustaining costs, the HUI was trading at levels last seen when gold was near $305 in July 2002! That anomaly couldn’t and didn’t last, resulting in battered gold stocks nearly tripling in only about a half-year.
That coiled-spring reaction perfectly illustrates how explosive gold-stock upside is after this sector suffers a long, low drift resulting in extremely-bearish psychology. If today’s 0.15x HGR is actually righteous, it would’ve been seen plenty of times in modern history. But it hasn’t. Such extremely-low gold-stock price levels relative to gold were only able to persist briefly after a long secular bear. They weren’t sustainable.
Remember the Fed started aggressively levitating the US stock markets in early 2013, wreaking havoc on alternative investments led by gold. The gold market’s last normal years were sandwiched between 2008’s stock panic and 2013’s radical Fed distortions. That’s the best recent baseline for where the HGR ought to trade. And between 2009 to 2012, it was running way up at 0.346x. That’s over double today’s levels!
To simply mean revert back up to those last normal levels relative to gold, the big gold stocks dominating the HUI would have to power 127% higher from here to 441! To restore some semblance of normalcy fundamentally, the gold stocks need to more than double from here even at this week’s $1276 prevailing gold levels! The gold stocks certainly can’t stay disconnected from their own earnings realities forever.
All markets are cyclical, including gold stocks. Extreme undervaluations relative to gold are followed by overvaluations as the pendulum swings back the other way. Mean reversions after extremes never stop in the middle. Their momentum leads them to overshoot to the opposite extreme! That makes gold stocks’ coming upside far more impressive. A proportional overshoot heralds radically-higher gold-stock prices ahead.
At worst in mid-January 2016, the HGR fell to an all-time low of 0.093x. That was a staggering 0.253x under that post-panic normal-year average HGR of 0.346x. So a proportional overshoot would briefly boost the HGR 0.253x above that mean, to 0.599x. That upside extreme wouldn’t last long, as greed wouldn’t be sustainable. But it could happen in a blowoff top after gold stocks are popular following a bull.
At $1276 gold, that yields a potential HUI topping target of 764! That’s a stupendous 293% above this week’s levels. Is there any other stock sector with the potential to quadruple in the coming years? No way. Gold stocks are the only severely-undervalued sector left after this Trumphoria stock rally, so their upside is unparalleled. And incredibly these simple HGR-derived gold-stock targets are actually conservative.
They assume gold is static, stuck at $1276. That’s exceedingly unlikely. As these Fed-levitated stock markets inevitably roll over with Fed quantitative tightening dawning, gold itself will catch a major bid as investment capital returns. As a rare asset that generally moves counter to stock markets, gold is hostage to them. So when the stock markets suffer their long-overdue major selloff, gold will soar on capital inflows.
10%, 20%, and 30% gold uplegs from here would take this metal to $1403, $1531, and $1658. Plug in the HGR of your choice, the post-panic average or the mean-reversion overshoot, and you get some potential HUI targets so high they defy belief. And don’t think a 30% gold rally is out of the question. In response to the last stock-market correction, gold powered 29.9% higher in just 6.7 months in early 2016!
Don’t get bogged down in HUI upside targets, they only serve to illustrate a critical point for investors and speculators today. Gold stocks are not only radically undervalued at today’s gold prices, but even more so compared to where gold is heading in its own still-very-much-alive bull market. Even if you think gold stocks only have 50% to 100% upside, that’s vastly better than everything else in these overvalued stock markets.
Gold stocks’ leverage to gold’s gains is already accelerating in their early autumn rally. That is gradually starting to shift sentiment, pushing that pendulum away from being pegged at hyper-bearish. The more gold stocks rally, the more traders will take notice and deploy capital. That process will soon become self-feeding, and gold stocks will be off to the races again like in early 2016. That will yield massive gains.
That begs the question what are you going to do about it? Are you tough enough mentally to invest like a contrarian, to buy low and out of favor when few others are willing? Can you handle fighting the crowd, making unpopular investments? Or will you take the mainstream approach, which is waiting to buy gold stocks until they’ve already doubled from here? The biggest gains are won by the early birds who buy the lowest.
While investors and speculators alike can certainly play gold stocks’ coming breakout rally with the major ETFs like GDX, the best gains by far will be won in individual gold stocks with superior fundamentals. Their upside will trounce the ETFs’, which are burdened by over-diversification and underperforming gold stocks. A carefully-handpicked portfolio of elite gold and silver miners will generate much-greater wealth creation.
At Zeal we’ve literally spent tens of thousands of hours researching individual gold stocks and markets, so we can better decide what to trade and when. As of the end of Q2, this has resulted in 951 stock trades recommended in real-time to our newsletter subscribers since 2001. Fighting the crowd to buy low and sell high is very profitable, as all these trades averaged stellar annualized realized gains of +21.2%!
The key to this success is staying informed and being contrarian. That means buying low when others are scared, like late in this year’s vexing consolidation. An easy way to keep abreast is through our acclaimed weekly and monthly newsletters. They draw on our vast experience, knowledge, wisdom, and ongoing research to explain what’s going on in the markets, why, and how to trade them with specific stocks. For only $10 per issue, you can learn to think, trade, and thrive like contrarians. Subscribe today, and get deployed in the great gold and silver stocks in our full trading books!
The bottom line is gold stocks look like a coiled spring today despite the extreme bearishness plaguing them. Following its long drift so far this year, this sector is ready to stage a massive breakout surge in the coming months. Technically gold stocks’ triangle consolidation has nearly converged, guaranteeing an imminent breakout. But far more bullish are gold stocks’ deeply-undervalued fundamentals relative to gold.
Gold-mining profits are heavily dependent on prevailing gold prices. And with this industry’s costs way under gold’s current levels, the gold miners are already earning hefty profits today. Sooner or later their stock prices must reflect fundamental reality. That mean-reversion process is already underway, with gold stocks’ early-autumn-rally gains increasingly outpacing gold’s. Their upside leverage should only accelerate.
Adam Hamilton, CPA
August 11, 2017
Copyright 2000 – 2017 Zeal LLC (www.ZealLLC.com)

Viscount Mining (TSX-V: VML) / (OTCQB: VLMGF) is a project generator with 2 silver (“Ag“) / gold (“Au“) properties in the Western U.S., Silver Cliff and Cherry Creek. Silver Cliff in south-central Colorado consists of 2,029 acres that were host to high-grade silver, gold & base metal production from 1878 to the early 1900’s. A Pre-Feasibility Study (“PFS“) was completed in the 1980s, but that report is not NI 43-101 compliant. The PFS contained very-high grade assays including an interval of 68 troy oz./ton Ag (2,125 grams/tonne) over 44 ft. (13.4 m). Late last year, management twinned several of the holes from the 1980’s and was quite pleased with the results. See table of twinned holes below
The Cherry Creek property in northeastern Nevada consists of over 400 un-patented and patented claims as well as mill rights. There was a robust 2-year exploration program (at no cost to Viscount) in 2015-16 by a former earn-in party that yielded detailed and positive results that the Company plans to follow up on this year. Interested parties are looking at Silver Cliff and Cherry Creek. A farm-out agreement on one or both properties could be a 2017 event and would represent important investment catalysts. A Phase 2 drilling program at Silver Cliff is expected to start in September / October.
Looking more closely at Viscount, I discovered that there are in fact a number of near-term catalysts, so I reached out to Viscount’s Chairman Kaare Foy to learn more. The following interview was conducted from August 3-8 by phone and email.
Kaare, can you give readers a brief overview of your background?
Yes, of course. l was born in New South Wales, Australia, earned a Bachelor of Economics Degree from Monash University and received a Green Beret with the Australian Commando Regiment. I worked in the construction materials industry in Melbourne, Switzerland & Saudi Arabia before emigrating to Canada in 1995. I was appointed Hon. Consul of Montenegro to British Columbia in 2010 and awarded the Queen Elizabeth II Diamond Jubilee Medal in 2012. Since 2008 I’ve been a Director of Golden Prospect Metals Ltd. of the UK.
I have more than 35 years’ experience in senior management and Board roles for both public & private companies in Australia, Canada and the UK. Most pertinent to your readers might be my 18 years at Great Panther Silver (NYSE: GPL) / (TSX-V: GPR), a producer operating the Guanajuato Mine Complex, which includes the San Ignacio and Topia Mines, both in Mexico.
I became a Director in 1994 and Executive Chairman in 2003, the position I held until I retired in 2012. I led the company from a one-person start-up to a successful mid-tier producer. In the year before my retirement, Great Panther’s share price reached US$5, and its market cap US$600 million.
CEO and Founder Jim MacKenzie convinced me to come out of retirement in July 2013 to become Chairman of Viscount. I was particularly impressed with his forthrightness and his vision for the Company – one of generating multiple projects, having mid-tiers and Majors earn-in and subsequently acquire the properties, and distributing (via special dividend) the resultant sale proceeds to shareholders.
Please tell us about the people on Viscount Mining’s team.
First off there’s Jim our CEO, a Director & Founder of Viscount in 2010. He brought me in, but more importantly he brought in the Cherry Creek and Silver Cliff projects and assembled our excellent team. Jim’s a skilled deal maker and negotiator of joint ventures, land acquisitions & exploration agreements. He has demonstrated strong results through strategic planning, high quality acquisitions & partnerships.
Dr. James Robinson B.S., M.S., [Ph.D] joined our Technical Board in April. He has deep knowledge of Nevada, structural geology, precious-metals deposit models & exploration techniques. Jamie was a senior consulting geologist to the former earn-in party involved in all aspects of their 2-years of exploration of Cherry Creek. His experience is proving especially valuable as he accompanies interested parties on site visits.
Dr. Gilles Arseneau has been retained to complete a NI 43-101 Technical Report on our Silver Cliff project. Dr. Arseneau has more than 25 years’ experience and holds a Ph.D Geology, from the Colorado School of Mines.
Mark Abrams B.Sc., M.Sc. is a Director & senior Technical Advisor. He has more than 30 years’ of domestic & international mineral exploration experience. Most recently he was responsible for exploration & acquisitions in the U.S. for Golden Predator Corp., Prior, he worked for 12 years for Agnico-Eagle (USA), where he led his exploration team to a gold discovery in northeastern Nevada.
Dr. Howard Reino Lahti, B.Sc., M.Sc., Ph.D. is our VP of Exploration. He has 45 years’ of mineral exploration experience. Dr. Lahti has managed mineral exploration projects in Canada, Thailand, Brazil, Peru, Chile, Panama, the Artic & Ecuador, and has prepared several NI 43-101 technical reports.
Mr. Dallas Davis MA, P.Eng., FEC brings over 40 years’ expertise to the table as a geologist & consultant to the mining industry, during which time, he has participated in several notable discoveries. He’s been designated a “Qualified Person,” (“QP“) under NI 43-101 Standards. See full bios here
Can you describe Viscount Mining’s Cherry Creek property?
Our 100% owned Cherry Creek property is ~30 miles north of the town of Ely in northeastern Nevada. The district produced mainly high-grade silver, and some gold, from the mid-1800’s to 1920. We have 2,600 acres of patented and 7,200 acres un-patented claims, a property that’s host to more than 20 past-producing mines. Since 2011, we’ve painstakingly consolidated nearly 10,000 acres, plus mill rights, for the first time, all under one roof.

Last December a former earn-in party completed a 2nd year of comprehensive geologic mapping, surveying soil & rock-chip sampling, including 2 full RC drilling programs. They spent several million US dollars completing extensive exploration that required a lot of time & coordination. All that data has been logged and integrated with a significant amount of historical information, allowing us to identify several really exciting areas.
How much exploration was done at Cherry Creek in 2015-16 and what do you expect to accomplish this year?
A great deal of valuable work was completed (at no cost to us) in 2015-16 including; geologic maps, multi-element analyses of surface samples and drill cuttings, lithologic logs from drill holes, digital maps & databases, subsurface interpretations & comprehensive summary reports. As I said, several million (US dollars) was invested over that 2-year period. That’s a significant work commitment on a single project controlled by a company our size. If not for the earn-in party, we would probably have spent that and issued tens of millions of shares to fund the exploration. Instead, we were able to meaningfully advance Cherry Creek and maintain a tight capital structure. Today we have just 41 M shares outstanding and zero debt.
In May we announced some very promising gold & silver exploration target areas. We found key characteristics similar to sediment-hosted gold mines in eastern Nevada like Newmont’s Long Canyon and projects similar to Liberty Gold’s Kinsley Mountain.
Please describe the Silver Cliff project.

The Silver Cliff property is a very high-grade silver deposit in Colorado. It consists of 96 claims on 2,029 acres that were host to high-grade silver, gold & base metal production from numerous mines in the late 1800s. The property underwent substantial exploration in the 1960’s 70’s & 80’s by companies including Freeport, Hecla, Homestake & Tenneco Minerals.
We think Silver Cliff might overlie a large caldera & porphyry system. We have an ‘exploration target’ of 40 to 50 M ounces of silver. NOTE: the quantity is conceptual in nature as there has been insufficient exploration to date to define a mineral resource. The genesis of the target is drilling in the 1980s by Tenneco that resulted in a (historical) Pre-Feasibility Study (“PFS“) with reported silver grades as high as 2,125 g/t silver (68 oz./t) over 44 ft. (13.4 m).
What are the plans for Silver Cliff this year?
We’re not relying on the conclusions of the non–NI 43-101 compliant PFS. Instead, we did a Phase I drill program late last year that consisted of 10 holes (~610 m / 2,000 ft.), twinning holes found in the PFS. The objective of the program, and a phase II drill program coming this Fall, is to prove out a NI 43-101 maiden mineral resource estimate. We are quite happy with the results of the twinned holes. One of the best results, the assay for confirmation hole K16-01, contained an interval of 1,778 g/t silver (equal to about 57 oz./t), over 20 ft. (6.1 m).
What are the key corporate catalysts over the next 6 months? Why should readers consider buying shares of Viscount Mining?
There are many reasons to buy our stock! In terms of near-term catalysts, we have multiple interested parties looking at both Cherry Creek and Silver Cliff. News of an agreement with a strategic funding partner on at least one, possibly both projects is likely within 6 months. Subject to lining up partners and funding, we should have initial results from the drill program and a NI 43-101 Technical Report by Dr. Arseneau on Silver Cliff. After that Technical Report, we should be able to deliver a maiden mineral resource estimate. And finally, within 6 months, we should be well on our way to completing a PEA on Silver Cliff.

Readers should consider buying our shares ahead of these and other important milestones. We think our shares offer an attractive investment opportunity for the following reasons:
+ Valuation – market cap is just C$11 M / US$ 8.5 M for 2 potential blockbuster assets
+ Multiple parties, incl. mid-tier & Majors, actively looking at partnering on Cherry Creek & Silver Cliff
+ Maiden resource estimate in 4th qtr. or early 2018 [conceptual target of 40 – 50 M ounces of Silver]
+ Shallow, very high-grade Ag deposit at Silver Cliff, potentially amenable to open pit mining
+ Long-term, explicit strategy to pay success-based special dividends to shareholders upon closing of portfolio asset sales
+ Strong management, Board & technical team, especially for a company our size
+ Near-term catalysts to attract attention to the Viscount Mining (TSX-V: VML) / (OTCQB: VLMGF) story
Kaare, thanks so much for your time and thoughtful answers to my questions. I look forward to seeing news from your company in coming weeks and months.
Disclosures: The content of this interview is for information only. Readers fully understand and agree that nothing contained herein, written by Peter Epstein of Epstein Research [ER], (together, [ER]) about Viscount Mining, including but not limited to, commentary, opinions, views, assumptions, reported facts, calculations, etc. is to be considered implicit or explicit investment advice. Nothing contained herein is a recommendation or solicitation to buy or sell any security. [ER] is not responsible under any circumstances for investment actions taken by the reader. [ER] has never been, and is not currently, a registered or licensed financial advisor or broker/dealer, investment advisor, stockbroker, trader, money manager, compliance or legal officer, and does not perform market making activities. [ER] is not directly employed by any company, group, organization, party or person. The shares of Viscount Mining are highly speculative, not suitable for all investors. Readers understand and agree that investments in small cap stocks can result in a 100% loss of invested funds. It is assumed and agreed upon by readers that they will consult with their own licensed or registered financial advisors before making any investment decisions.
At the time this interview was posted, Peter Epstein owned shares in Viscount Mining and the Company was an advertiser on [ER]. Readers understand and agree that they must conduct their own due diligence above and beyond reading this article. While the author believes he’s diligent in screening out companies that, for any reasons whatsoever, are unattractive investment opportunities, he cannot guarantee that his efforts will (or have been) successful. [ER] is not responsible for any perceived, or actual, errors including, but not limited to, commentary, opinions, views, assumptions, reported facts & financial calculations, or for the completeness of this article or future content. [ER] is not expected or required to subsequently follow or cover events & news, or write about any particular company or topic. [ER] is not an expert in any company, industry sector or investment topic.
Spin-out of two (U$2.3 billion and U$190 million) gold start-up successes since 2011 has the talent and potential of the originals

Liberty Board at the historic Moosehead Pit at Goldstrike. From left: Rob Pease, Mark O’Dea, Don McInnes, Sean Tetzlaff, Cal Everett
The gold mining industry is massively depleting its reserves, not finding new deposits fast enough, and could be on the cusp of its most profitable turning point ever.
Gold mine supply will peak in 2019 and continue falling through at least 2025, according to BMO Capital Markets and Bloomberg.
Producers like Newmont (NYSE:NEM), Goldcorp (NYSE:GG), Barrick (NYSE:ABX) and Kinross (NYSE:KTO) are looking to the Western United States for their future pipeline. They have all made new investments there and are searching for more. Acquisitions are being focused in stable political and operating environments.
New gold finds have long been richly rewarded.
As an example, investors turned $200 million to $2.3 billion with Fronteer Gold, a Nevada explorer acquired by Newmont Mining (NYSE:NEM) in 2011. In 2016, Endeavour Mining purchased True Gold for U$190 million. Both discoveries were developed from the same group of scientists, led by Mark O’Dea.
Of the last 7 heap leach gold mines put into production in the world, 2 are from the O’Dea Oxygen group. They find deposits, drill them off, de-risk the discoveries and then sell or build them. Two other heap leach deposits from the same group are now being permitted to be built in Turkey by Alamos. That’s 4 projects out of a tiny universe where new discoveries are rare.
The dream team of gold scientists behind Fronteer and True Gold are doing it again.
This time, the industry is starving for new discoveries. A brutal six year bear market has prevented producing companies from investing in exploration. Meanwhile, everyday, gold miners deplete their ores. They are forced to dig deeper, and mine more difficult rock. Plus, project development timelines often take ten or twenty years.
As a result, there are now undeveloped gold resources with bigger valuations than similar projects already built — with construction costs already sunk.
“The older you get in this business, the lower-risk oriented you become in your investments,” commented Liberty Gold (TSX:LGD; OTC:LGDTF) CEO Cal Everett. Originally called Pilot Gold (TSX:PLG), the Fronteer spinout was rebranded Liberty Gold this year to reflect its Western US focus. Kicking rocks at Liberty is the same technical team who developed Fronteer and True Gold.

Liberty Team at Stamp Mill at Goldstrike
To name a couple of those key players:
- Dr. Moira Smith is Liberty’s VP of Exploration and helped drive Fronteer’s Long Canyon discovery, which is now critical to Newmont’s growth. Smith has been involved in 7 significant gold mine discoveries in her career that are now in development or in production. “The lady’s absolutely brilliant,” Everett says.
- Dr. Mark O’Dea is Liberty’s Chairman. He guided Fronteer to a $2.3 billion sale. More recently he established True Gold, a West African gold developer, that was bought out for U$190 million.
And Liberty now has fresh eyes to build towards a major discovery. It poached Cal Everett, Liberty’s President and CEO, following a recent Corporate acquisition.
Everett is a geologist from New Brunswick, Canada. His father was a military policeman. The younger Everett spent his early career in exploration working with large mining companies. He changed careers to the finance side and excelled as an investment advisor beginning in the early 1990s. Building his own proprietary resource models, and with an international network of geologists, Everett became one of the mining industry’s most influential discovery financiers, working with BMO Capital Markets, PI Financial and later, founding Axeman Resource Capital.
Everett was advising another explorer in 2014 that was competing with Liberty to acquire the past producing Goldstrike project in Utah.
When Liberty outbid, O’Dea offered Everett the top job a year later when the Company was looking for a management and direction change. For Everett, the team and projects were too good to pass up.
“They have an incredible screening process, having been all over the world. It’s no accident they do metallurgy early, avoid political risk, focus on large land positions and other vetting procedures up-front.” Everett says.
On Liberty’s assets, “Three major district-scalable projects, all that are drill confirmed and have given grade in the jurisdiction where everybody wants to be.”
“The secret to this business is when you have a big discovery in a district but still at an early stage, you never stop drilling. You drill until the market wakes up and pays attention.”
THE PROJECTS
The discovery formula is simple. Acquire past producing Carlin – style heap leach oxide gold mines in the Western US that closed 20 years ago in a U$350 gold market, re-interpret thousands of historical drill holes into a new target model and then drill out the discoveries in a higher priced gold market.
The Goldstrike asset in Utah is getting the most drilling this year with, with 3 drills operating almost year round, 50 holes in the lab on any given day and approximately 50 new holes drilled a month. Last week, a discovery was announced 6 km from the known resource area confirming the project is in a gold district by itself. Liberty is finding mineralization nearly everywhere the right rocks are outcropping at Goldstrike. There were 1519 historical holes and now 345 Liberty holes, with an 84% hit success rate over a 22 square kilometre drill confirmed target area. Fresh permits for 150 additional drill sites will help Liberty’s goal to define a million-ounce plus oxide gold resource in the near-term. Preliminary metallurgy has been released with 86% recovery of leachable gold in less than 10 days. This quick and high recovery will help establish Liberty as a low-cost gold producer.
The Kinsley property in Nevada was in production in the mid 1990s but shuttered due to low gold prices years ago. There, Liberty Gold made new high-grade gold discoveries below a past producing surface oxide gold mine and established an initial resource that remains totally open for expansion. The target is high grade at depth, not leachable gold at surface. Kinsley has excellent metallurgy and warrants aggressive follow-up drilling. Liberty is the operator of the project and holds a 79% interest. This year a short four hole drill test successfully found the extension of the high grade deposit to the east, 29.0 metres at 5.30 grams per tonne gold and 3.0 m at 3.68 grams per tonne gold, with a higher grade zone above it with 7.6 m at 6.84 grams per tonne gold and 4.6 m at 12.4 grams per tonne gold. There are many untested targets on the property.
The Black Pine project in Idaho was a significant mid-90s gold producer which Liberty acquired last year for US$800,000 cash, 300,000 shares and a 0.5% royalty. Everett says it’s a Goldstrike look-alike but 12 months behind in terms of advancement. Liberty is currently working on a Plan of Operations to gain approvals for a large exploration program at Black Pine. In the meantime, Liberty’s technical team has vast historical data to devour, including 1,866 historical drill holes. The Black Pine drill target area is drill confirmed over 12 square kilometers. Just gathering this information today for all three projects could cost in excess of Liberty’s current valuation of roughly $65 million (not including $14 million in cash at March 31, 2017).
Liberty Gold also owns an under-appreciated Turkish mineral portfolio. One of the interests, Halilaga, a copper-gold-moly deposit partnered with Teck Resources, was roughly valued at US$66 million in 2015 by Brent Cook, an influential mining analyst, but is a mere footnote in the Liberty Gold story today. Liberty also owns 60% of the TV Tower project, near Halilaga, with six gold and copper discoveries already.
The sale or joint venture of the Turkish assets could raise non-dilutive capital for Liberty to fund aggressive exploration at Goldstrike, Kinsley and Black Pine. Everett does not want to raise equity while Liberty’s stock trades near all time lows. He’s taking responsibility himself now to ramp up marketing. Liberty will have a presence at the major mining trade shows this Fall and is hosting a revolving door of technical presentations.
In the downturn, Liberty shares have fallen from over $3 in 2011 to less than 45 cents at press time. Macquarie mining analyst Mike Gray rates Liberty Gold an Outperform and Top Pick with an initial CAD $0.90 price target. That will prove to be a very conservative target if Liberty enjoys a sample of Fronteer’s success — an inevitability, according to its CEO.
In Everett’s words: “The mining companies know that if you have the district, and you keep drilling, you will find more gold. It’s as simple as that. We are advancing Goldstrike, targeting it to become a minimum 100,000 ounce gold producer. It just takes drilling and scientific back up to try and reach your goal.”
As gold producers struggle to find new mines, Liberty is literally at the ground floor of growth — advancing its three key projects. With many paths to unlock value and the industry’s brightest geologists at the helm, Liberty is one of the few companies positioned to profit from gold’s production growth problem.
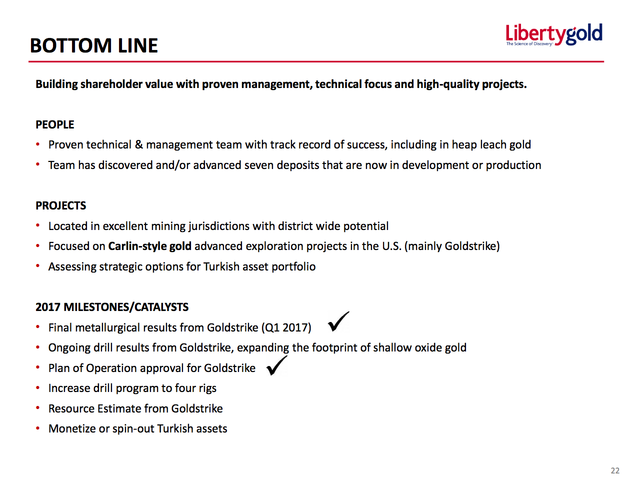
Other Western USA gold plays worth mentioning:
Gold Standard Ventures (TSXV:GSV, NYSE:GSV). Moved quickly in the bear market to consolidate a large and strategic land position in Nevada’s Carlin Trend where it is making new discoveries. Gold Standard has attracted strategic investment from OceanaGold and Goldcorp. With a $500 million valuation, it is the most advanced junior in Nevada.
Newcastle Gold (TSX:NCA, OTC:CTMQF). Newcastle boasts an impressive management team led by Detour Gold founder Gerald Panneton and financial backers including mining magnates Richard Warke and Frank Giustra. Developing the multimillion ounce Castle Mountain project in California. Several drill rigs turning to grow and upgrade resources on the production fast track. Valuation today approaching $175 million.
Fiore Gold (TSXV:F, OTC:FIORF). Another Giustra-backed gold vehicle, with Pan, an operating gold mine in Nevada, Gold Rock, a nearby development project, and Golden Eagle, an exploration play in Washington State. Fiore Gold is the pending business combination of Fiore Exploration and GRP Metals, the recapitalized Midway Gold. It is expected to trade in Fall 2017 with a roughly $100 million market capitalization. Investors will be watching to see if Fiore can successfully ramp up the Pan mine and take advantage of other growth opportunities in Nevada.
Barrick Gold (NYSE:ABX). Major producer Barrick is leaning heavily on its Nevada assets to help lower production costs, and recently acquired the Robertson property from Coral Gold Resources in the Cortez District. Barrick is on track to reduce its debt to $5 billion by the end of 2018 and appears to be on track after a sold quarter.
Goldcorp (NYSE:G). It’s no secret Americas-focused gold producer Goldcorp is making bets on small exploration companies to fund its future growth, and hasn’t been shy about the Western United States, where it recently acquired a gold mine in Nevada, and backed a junior there, Gold Standard Ventures. Goldcorp has been one of the worst performing gold stocks of late but refocusing on the Western United States is a step in the right direction.
Newmont Mining (NYSE:NEM). Nevada is the workhorse of Newmont Mining, one of the world’s largest producers. Operations include 11 surface mines, eight underground mines and 13 processing facilities. Annual production from Nevada alone exceeded 1.6 million ounces in 2016, obviously requiring new discoveries or M&A to be sustained.
Kinross Gold (TSX:K, NYSE:KGC). Kinross is on track to meet its annual production guidance of 2.5-2.7 million ounces of gold and costs of $660-$720/ounce and AISC is expected at $925-$1,025/ounce. Production is expected to double at Bald Mountain in Nevada, however the Buckhorn mine in Washington State has recently run out of ore.
Disclaimer: All statements in this report, other than statements of historical fact should be considered forward-looking statements. These statements relate to future events or future performance. Forward-looking statements are often, but not always identified by the use of words such as “seek”, “anticipate”, “plan”, “continue”, “estimate”, “expect”, “may”, “will”, “project”, “predict”, “potential”, “targeting”, “intend”, “could”, “might”, “should”, “believe” and similar expressions. Much of this report is comprised of statements of projection. These statements involve known and unknown risks, uncertainties and other factors that may cause actual results or events to differ materially from those anticipated in such forward-looking statements. Risks and uncertainties respecting mineral exploration companies are generally disclosed in the annual financial or other filing documents of those and similar companies as filed with the relevant securities commissions, and should be reviewed by any reader of this newsletter.
Tommy Humphreys is an online financial newsletter writer. He is focused on researching and marketing resource and other public companies. Nothing in this article should be construed as a solicitation to buy or sell any securities mentioned anywhere in this newsletter. This article is intended for informational and entertainment purposes only!
Be advised, Tommy Humphreys is not a registered broker-dealer or financial advisor. Before investing in any securities, you should consult with your financial advisor and a registered broker-dealer.
Never, ever, make an investment based solely on what you read in an online newsletter, including Tommy Humphreys’ online newsletter, especially if the investment involves a small, thinly-traded company that isn’t well known.
Tommy Humphreys’ past performance is not indicative of future results and should not be used as a reason to purchase any stocks mentioned in his newsletters or on this website.
In many cases Tommy Humphreys owns shares in the companies he features, and that is the case with respect to Liberty Gold. For those reasons, please be aware that Tommy Humphreys can be considered extremely biased in regards to the companies he writes about and features in his newsletters, including Liberty Gold. Because Tommy Humphreys owns shares of Liberty Gold, there is an inherent conflict of interest involved that may influence his perspective on Liberty Gold. This is why you should conduct extensive due diligence as well as seek the advice of your financial advisor and a registered broker-dealer before investing in any securities. Tommy Humphreys may purchase more shares of Liberty Gold for the purpose of selling them for his own profit and will buy or sell at any time without notice to anyone, including readers of this newsletter.
Tommy Humphreys shall not be liable for any damages, losses, or costs of any kind or type arising out of or in any way connected with the use of this newsletter. You should independently investigate and fully understand all risks before investing. When investing in speculative stocks, it is possible to lose your entire investment.
Any decision to purchase or sell as a result of the opinions expressed in this report will be the full responsibility of the person authorizing such transaction, and should only be made after such person has consulted a registered financial advisor and conducted thorough due diligence. Information in this report has been obtained from sources considered to be reliable, but we do not guarantee that they are accurate or complete. Our views and opinions in this newsletter are our own views and are based on information that we have received, which we assumed to be reliable. We do not guarantee that any of the companies mentioned in this newsletter (specifically Liberty Gold) will perform as we expect, and any comparisons we have made to other companies may not be valid or come into effect.
Tommy Humphreys does not undertake any obligation to publicly update or revise any statements made in this newsletter.
Manitoba has long been a source for Canada’s mineral wealth and will continue to provide a diversified source for metals going into the future as companies continue to fund exploration in the province. In 2013, $1.3 billion in minerals were produced and made up 6% of the province’s GDP. There remains immense untapped mineral potential with only 1.4% of total Canadian exploration expenditure being spent in Manitoba as of 2013. According to the Fraser Institute’s Annual Survey of Mining Companies: 2016, Manitoba moved up from 19th place to 2nd place in terms of the Institute’s Investment Attractiveness Index. There are immense areas of Manitoba still left unexplored compared to other jurisdictions in Canada, which leaves plenty of potential for mineral discoveries.
There is one company that is putting its exploration dollars to work in Manitoba and increasing their resources in the Flin Flon-Snow Lake Greenstone Belt of Manitoba. Satori Resources, listed on the TSX Venture Exchange under the ticker symbol BUD, acquired the Tartan Lake project which was a past producing mine with a historical high-grade production of 47,000 ounces of gold between 1987 and 1989. The project hosts a 450-tonne-per-day gold concentrator and related infrastructure, along with a decline ramp providing access to developed gold mineralization within the main and south zones to a vertical depth of 320 metres
The company recently put out an updated Mineral Resource estimate using a cut-off grade of 3.0 g/t Au, Indicated Resource of 1,180,000 tonnes at 6.32 g/t Au for 240,000 ounces and an Inferred Resource of 240,000 tonnes at 4.89 g/t Au for an additional 38,000 ounces at its Tartan Lake Project. Indicated resource gold ounces and grade have increased by 135% and 24%, respectively, compared to the 2012 mineral resource estimate. This is an impressive start and the company hopes to continue increasing the resource with its current drilling program.
The company began drilling at its 100-per-cent owned Tartan Lake project on June 13th. The 2017 drilling program consists of 4,000 metres of diamond drilling in two phases. The first phase will conduct 2,000 metres of drilling in six holes to expand the resource outside of the known high-grade gold resources in the main and south zones and to get a more accurate picture of the resource. This will hopefully be wrapped up by July. The second phase will follow up on the results from the first phase and explore some other targets in the area.
Will Ansley is an experienced hand in the Canadian junior mining space who is leading Satori as President and CEO. He is a Chartered Professional Accountant with over 12 years of mining experience having worked on teams that brought 6 mines into production over an 8-year period: FNX Mining, Lake Shore Gold and Mineral Streams which was bought by AuRico, are a few of the companies he has worked with.
I had a chance to ask Mr. Ansley some questions to give me the run-down of the highly prospective gold project at Tartan Lake and what to expect in the coming months.

Hello Mr. Ansley, thank you for taking the time to sit down with me, let’s get right to it. What brought this mining to deal to your attention? How did it fall into your hands?
Satori was brought to my attention through my relationship with Bruce Reid, Tartan Lake was one of a number of projects Bruce was trying to advance but he was spread too thin. I was looking to invest into the company by way of private placement as the Satori shares did not have a lot of liquidity; Bruce was not active in terms of marketing or getting the message out. In my opinion the asset is attractive with high grades, with significant infrastructure already in place, and is located within an established mining camp with access to skilled mining labor and parts. Having already been an existing mine, permitting will not be that difficult so it checks a lot of boxes. When I asked Bruce about doing a private placement he suggested I consider getting involved in managing the company going forward.
Bruce’s experience with Carlisle Goldfields in the Manitoba Greenbelt was attractive. Carlisle’s primary asset was the Lynn Lake gold project, in Manitoba, which comprised of five near surface deposits containing total measured and indicated mineral resources of 2.75 million ounces of gold and total inferred mineral resources of 2.28 million ounces.
The company stands out as significantly undervalued at ~$11/oz vs. peer average at ~$33/oz with a current market capitalization of approximately $6m. Why do you think the company is currently undervalued according to peers?
It is really a matter of getting the message out and showing investors the incredible asset Satori has up in Flin Flon, Manitoba. As a result of the significant downturn in metal prices, over the past 5 years the company was essentially put on life support with very little work performed on the asset, no marketing, the telephones were all turned off, salaries eliminated. I have to give Bruce and the board a pat on the back, they rolled back the shares 10:1 and literally turned the taps off for several years.
Since I came on board in the fall of 2016 we completed a 1600 metre drill campaign, with incredible results including 10.88 g/t Au over 13.1 metres and 9.99 g/t over 11.2 metres, strengthened our board of directors, issued an updated 43-101 technical report increasing our indicated mineral resources by 135% to 240,000 ounces of Au at 6.32 gpt, and we raised $1.3 million in order to advance our exploration efforts on the asset.
Success from our current drill program will provide positive news flow, generate additional interest and provide materials to market the company with. With any luck we will be able to expand our existing resource and build further interest in our company.
It is an unusual ticker symbol for a gold mining company. What is the story behind the BUD ticker symbol?
The asset was spun out when Claude Resources acquired St. Eugene Mining for the low grade Amisk Deposit, and I understand the original management team was evaluating potential names and tickers while having some drinks – the CFO of the time was having a Budweiser and suggested they use the ticker BUD. The name of the company does not match with the ticker, but you know ever investor I speak with always remembers the ticker name BUD.
What is your investor elevator pitch?
A past producing high-grade gold asset with significant existing infrastructure in place, within an established mining camp. Our valuation is compelling at only $11/oz and we have enough cash on hand to allow us to materially advance the property.
A little more detail about our existing infrastructure: there is a 450 tpd mill (which will require refurbishment) including operational hydro direct from the grid, a back fill plant, water management system, a terrific shop and maintenance facility, an office and dry facility, over 3100 metres of underground development including a ramp down to 320 metres as well as 6 sub-levels, a vent raise to surface, and tailings management system.
What should investors expect to see over the coming year?
We recently commenced a 4000-metre diamond drill program which will be split into two equal phases, and we are evaluating numerous regional targets outside of the main mining area where the resource is located. The overall property package is 2670 hectares and only ~ 15% has been explored by Satori.
Does your team have experience with Greenstone Belts and in particular in Manitoba?
Our geologic efforts are spearheaded by a company called Orix Geoscience, and we are fortunate to have them involved in the project. Orix has an office in Manitoba as well as Toronto and Sudbury Ontario. Their geologists have a wealth of experience not only in Manitoba but throughout the world. Their clients include a number of recognizable names in the gold space from large cap to juniors.
On our board of directors we have Carl Hansen, who has worked in the Snow Lake area for Inco Gold, is familiar with operational history of the Tartan Lake Mine, and Gary O’Connor has over 30 years of global experience in the mineral exploration industry including senior positions with Gabriel Resources, European Goldfields, Freeport-McMoRan, BP Minerals and Amax Minerals.
Board Member and largest shareholder Bruce Reid also knows the Greenstone Belt and Manitoba intimately. He was the former President and CEO of Carlisle Goldfields which proved up 5 million ounces at the Lynn Lake Gold Camp in Lynn Lake. Carlisle was purchased by Alamos Gold in January 2016.
How is Manitoba as a mining jurisdiction?
Manitoba is a terrific place to do business, rated #2 in the world by the Fraser Institute. Manitoba is pro-mining, pro-investment, and has arguably the cheapest hydro costs on the planet. Where we are located, in Flin Flon, and majority of the local mines are scheduled to close by 2020 therefore the entire region is highly motivated to explore and find new deposits to put into production. For example we received our drill permits within a day and have been encouraged to apply for a grant which provides a 50% credit on eligible exploration costs up to a maximum of $200,000 credit.
What is your outlook on the gold price in the coming years?
Despite the Fed’s recent increase in interest rates, the cost to hold gold is still relatively low and as a result we should continue to see investors and more importantly central banks own gold.
Where do you get your mining news?
I read a variety of sources including Kitco, the Junior Mining Network as well morning notes from mining salespeople and analyst reports.
Having worked with Cordoba Minerals can you offer us any insight? What is going on?
San Matias is a world class project in Colombia, backed by world class investors, and advanced by world class geologists. Recently they announced their intent to consolidate the asset back into Cordoba, the public company vehicle, and in the process raise a substantial amount of money in order to advance the project. The consolidation transaction should work out well for existing CDB shareholders, they receive a premium up front and get to ride along dollar-for-dollar with Robert Friedland. Historically this strategy has been highly rewarding for investors who partner with Robert, he thinks big and delivers big returns.
I would like thank Will for taking the time to help provide some illumination on this company and wish him the best of luck with the upcoming drill results.
About Satori Resources Inc.:
Ticker Symbol: TSX-V: BUD
Capital Structure: 28,078,507
Market Cap: ~ $6 million as of 06/07/2017
Year High: $0.30
Year Low: $0.065
401 Bay Street, Suite 2702
P.O.Box 86
Toronto, Ontario M5H 2Y4, Canada
Twitter: @satoriresources
Email: wansley@satoriresources.ca
Phone: (416) 303-3344
Today Osisko Mining Inc. (T:OSK) released more high-grade gold Intersected at Lynx, reporting a headline result of two metres of 379 g/t gold. In the company’s press release today, OSK-W-17-881 returned a bonanza grade of 379 g/t Au over 2.0 metres, including 1,260 g/t Au over 0.6 metre (30.7 g/t Au over 2.0 m cut). However, investors should not jump to conclusions because this is a term used a semi-qualitative/quantitative term to describe drill results in the hundreds of g/t and does not indicate the entire project but nonetheless impressive.
The drill results come from its ongoing 400,000 metre drill program at its 100% owned Windfall Lake gold project located in Urban Township, Québec. The latest drill results comprise 16 intercepts in 12 drill holes focused on infill and expansion drilling in the Lynx deposit. Currently, the company has 24 drills active on the Windfall Project; expect more results and a growing resource as the company is using these results to support an updated resource later in 2017.
Highlights from today’s drill results are as follows:
-
Drill Hole OSK-W-17-881: 2.0 metres grading 379.00 g/t gold (uncut) from a downhole depth of 412.0 metres, including 0.6 metres grading 1,260.00 g/t gold (uncut);
-
Drill Hole OSK-W-17-898: 3.0 metres grading 23.50 g/t gold from a downhole depth of 429.9 metres, including 0.8 metres grading 85.20 g/t gold;
-
Drill Hole OSK-W-17-895: 6.5 metres grading 8.98 g/t gold from a downhole depth of 221.0 metres, including 1.0 metre grading 34.70 g/t gold and 0.5 metres grading 37.40 g/t gold;
-
Drill Hole OSK-W-17-924: 6.1 metres grading 9.18 g/t gold from a downhole depth of 220.9 metres, including 1.1 metres grading 29.50 g/t gold; and
-
Drill Hole OSK-W-17-908:
-
4.2 metres grading 10.60 g/t gold from a downhole depth of 738.4 metres, including 1.6 metres grading 26.60 g/t gold;
-
4.1 metres grading 7.34 g/t gold from a downhole depth of 756.0 metres, including 1.1 metres grading 19.30 g/t gold;
-
2.5 metres grading 12.60 g/t gold from a downhole depth of 764.0 metres, including 1.0 metre grading 26.70 g/t gold.
In today’s trading on the TSX, shares in Osisko rose 8 cents to $4.77 with 855,300 changing hands. At this time last year, shares in the company were trading around $2.00. In a note to clients today, Haywood maintained its buy rating of Osisko shares with a price target of $6.50 with a very high risk rating. Upcoming catalyst events for investors will be the Windfall resource update and the Marban feasibility study due in the company’s third quarter of 2017. With results like this, there could be a significant change with the size of the Windfall resource.
Yesterday evening, Tahoe Resources Inc. (T:THO) reported its second quarter 2017 financial results of US$33.48-million. Daniel Earle of TD Securities found the results mixed. Earnings per share (EPS) beat on lower costs and the company suspended its dividend, which TD securities believes is prudent. Q2/17 adjusted EPS of $0.11 were above TD estimates of $0.08 (street consensus: $0.09) due to lower costs and expenses generally. Operating Cash Flow of $0.26 was above TD’s estimate of $0.22 (consensus: $0.23) and Haywood Securities estimate of ~US$0.20. However, the company suspended its multi-year guidance given the uncertainty at the Escobal silver mine.
On July 5, the company reported that the Supreme Court of Guatemala had issued a provisional decision to suspend the company’s Escobal mining license. The company has appealed the decision to the Constitutional Court and a ruling could come within the next three months. The company is are seeking to have its Escobal mining license reinstated during this period. TD securities is accounting for no production from Escobal for one year. The Casillas road block that is still in place, and reportedly shows no sign of immediate resolution. In a note to clients today, Geordie Mark of Haywood Securities notes that both the road block and the provisional decision to suspend the Escobal mining licence need to be resolved prior to operations returning. The Casillas road block is still in place, and there are reportedly no signs of immediate resolution to this situation.
Preliminary production results were released, with the company having reported production greater than 4 Moz Silver (Ag) and greater than 110 koz Au. Q2/17 total cash costs were not previously reported and were better than we anticipated. Until further clarity is obtained at Escobal, the company’s 2017 and multi-year guidance has been suspended and certain exploration and capital spending programs are being reviewed. 2017 gold guidance remained unchanged at 375-425 koz Au at total cash costs of $700-$750/oz.
The company has also deferred the La Arena II PEA and an investor day that was planned for mid-September. La Arena produced 48 koz gold at a cash cost of US$579/oz. Gold production was higher than our estimates (46 koz gold) on placing less (3.2 Mt vs 3.7 Mt) higher grade (0.46 g/t vs 0.43 g/t gold) on the leach pads. Cash costs bettered our forecast of US$670/oz.
Management reported that it views its expansion plans at the Shahuindo and Timmins mines as budgeted and required and that these projects are on track for completion in mid-2018. Shanuindo produced 21 koz gold, which was higher than Haywood Securities estimates of 15.4 koz gold, by placing more (1.3 Mt vs 0.98 Mt) tonnes of lower grade (0.65 g/t vs 0.73 g/t gold) on the leach pad. Reported cash costs of US$590/oz were much lower than their expectations of US$845/oz. Timmins Mines produced 41 koz gold that was lower than expectations (44 koz gold) on processing slightly more (356 kt vs 314 kt) lower grade (3.75 g/t vs 4.56 g/t gold) ore. Gold recoveries of 97% were slightly higher than the Haywood estimate of 96%. Cash cost of US$633/oz were marginally higher than Haywood’s estimates of US$632/oz
The company generated positive free cash flow (FCF) of $17 million in the second quarter of 2017, after spending $63 million in total capital expenditures. Haywood expects capex to increase in the second half of 2017. As at June 30, the company had cash and equivalents of $191 million and $35 million of debt due in April 2018. The company currently has access to $75 million from its undrawn credit facility.
On the year, shares in Tahoe Resources (T:THO) are down from a 12-month high of $22.11 and at time of publication, shares were trading down 25 cents to $6.35 on 3.6 million shares traded for the day, near 12-month lows. TD Securities provided a recommendation of hold and a high risk rating with a 12-month price target of $8.50. However, TD Securities may want to revise its price target given the uncertainty at Escobal and other brokerages price targets. Haywood Securities in a note to clients today maintained its hold rating with a price target of $6.75 (revised down from $7.25) with a high risk rating for shares of Tahoe. Significant upcoming catalysts will be any updates at the Escobal mine which should be expected in the second half of 2017.
1. Gold is consolidating the recent rally. That rally (basis December futures) moved the price from the $1210 area up to about $1280.
2. Please click here now. Double click to enlarge this short term gold chart.
3. There’s a small head & shoulders top pattern in play, and commercial traders have been selling gold and shorting in that top area.
4. Please click here now. When commercial traders add short positions into a gold price rally, a pause in the upside action often follows.
5. Please click here now. Double click to enlarge this daily gold chart.
6. Note the 14,7,7 Stochastics series crossover sell signal on the chart. A few weeks of consolidation would bring down this overbought oscillator.
7. That would put gold in a nice technical position just as Diwali buying gets underway. Indians are always eager buyers into gold price weakness, and so are Western commercial traders. If a gold “price sale” happens at the same time as an event like Diwali, commercial traders tend to be very aggressive buyers.
8. With the consolidation now apparently underway, gold bugs can nibble at the price in the $1245 – $1260 area. My suggestion is not to predict that the price goes there, but to be prepared to do some light buying if it happens. My own focus for fresh buys in the consolidation zone is GDX, the gold stocks ETF.
9. On that note, please click here now. Double-click to enlarge. I’m quite an aggressive GDX buyer in the $22 – $18 area, and a seller (of some) in the $23 area.
10. Please click here now. This is another important COT report. It’s for the Japanese yen versus the US dollar.
11. As expected, the commercial traders are shorting the yen into the rally. What is much more interesting is the overall size of the long position they hold. It’s truly enormous.
12. This is important because the yen is a key “risk-off” currency like gold. The US debt ceiling is becoming a concern. If congress refuses to raise the ceiling, it could create a financial earthquake in the US government bond market.
13. In turn, that would create an epic risk-off event, sending both the yen and gold higher. If that happened, the commercial traders would likely sell a big portion of their huge long yen position at a fat profit.
14. Also, Japan may be poised to finally raise interest rates in 2018. That’s another event that could send both gold and the yen soaring against the dollar.
15. In addition, I think most analysts are seriously underestimating the commitment of Donald Trump to lowering the value of the dollar. He’s doing it to make American debt more manageable.
16. The bottom line is that there’s a global currency war going on, Trump is winning it, and the dollar faces tremendous headwinds from all directions.
17. Some investors have asked me if a fall in the bond market would trigger a stock market “melt-up”. The answer is that just as gold sometimes rallies and sometimes declines when rates are hiked, the US stock market can rally or decline when rates rise.
18. The current pace of rate hikes has done no harm to the stock market. If it continues, the stock market can theoretically keep rallying. If something goes wrong (perhaps quantitative tightening), and the bond market crashed, the stock market would almost certainly crash too, even though it’s not a bubble market.
19. Please click here now. Double-click to enlarge this fabulous bitcoin chart. I’m adamant that investors should be well-diversified in their quest to build wealth and retain it.
20. I view blockchain currency as the hottest sub-sector of the precious metals asset class. At www.gublockchain.com I cover the intense price action for bitcoin and many other blockchain currencies.
21. In the case of bitcoin, it just blasted out of a beautiful inverse head and shoulders bottom pattern. It appears to be making a beeline to my $4000 price target for that pattern. Eager wealth builders can be modest sellers in the $3800 – $4200 area.
22. Please click here now. Double-click to enlarge. On August 1, 2017 bitoin investors received free “bitcoin cash” currency, the result of a “hard fork” in bitcoin.
23. I view the bitcoin cash spinoff as a gargantuan dividend, and it just surged about 100% higher… in less than 48 hours.
24. While blockchain is the current star of the upside action show, gold bullion, silver bullion, and the yen may be poised to join the fun in the key September and October months that I refer to as “US stock market crash season”!
– Stewart Thomson, Graceland Updates
Stewart Thomson is a retired Merrill Lynch broker. Stewart writes the Graceland Updates daily between 4am-7am. They are sent out around 8am-9am. The newsletter is attractively priced and the format is a unique numbered point form. Giving clarity of each point and saving valuable reading time
Risks, Disclaimers, Legal
Stewart Thomson is no longer an investment advisor. The information provided by Stewart and Graceland Updates is for general information purposes only. Before taking any action on any investment, it is imperative that you consult with multiple properly licensed, experienced and qualified investment advisors and get numerous opinions before taking any action. Your minimum risk on any investment in the world is: 100% loss of all your money. You may be taking or preparing to take leveraged positions in investments and not know it, exposing yourself to unlimited risks. This is highly concerning if you are an investor in any derivatives products. There is an approx $700 trillion OTC Derivatives Iceberg with a tiny portion written off officially. The bottom line: Are You Prepared?
Looking back at gold’s performance since 1979, August and September are big months for the yellow metal. What is the cause? No one really knows but there are some theories that have been thrown around.
The adage “sell in May and go away” is common in the mining sector. Investors are back from vacation and ready to deploy their cash in a big way. Concurrently, the largest financial crashes have occurred in September and October, investors are also buying gold to hedge their portfolios.

Indian wedding season is huge for gold, and if you have ever been to a traditional Indian, its easy to see why India is the World’s largest consumer of gold jewelry. Throw Christmas into the mix, and you have the perfect retail storm.
Lastly, the European Central Bank and 20 other European central banks are currently governed by a Central Bank Gold Agreement, which ensures all banks operate with transparency and do not engage in large uncoordinated gold sales. The Agreement dictates the limit in sales, and resets every September, meaning the market may see less selling activity.
In the 38 years we used for the chart, August had only 14 years of negative returns, while September had 13. Regardless if these theories are true or not, its hard to ignore the decades of data that suggest the best months of gold are yet to come.
Compliments of Sean Zubick at http://palisade-research.com/
The gold miners’ stocks have suffered a lackluster year so far, mostly lagging gold’s solid new upleg. But that vexing underperformance should soon give way to a big catch-up surge. The deeply-out-of-favor gold stocks are now entering their strong season, which starts right about now with a powerful autumn rally. That generates major gains on average in bull-market years, and this year’s upside potential is exceptional.
Seasonality is the tendency for prices to exhibit recurring patterns at certain times during the calendar year. While seasonality doesn’t drive price action, it quantifies annually-repeating behavior driven by sentiment, technicals, and fundamentals. We humans are creatures of habit and herd, which naturally colors our trading decisions. The calendar year’s passage affects the timing and intensity of buying and selling.
Gold stocks exhibit strong seasonality because their price action mirrors that of their dominant primary driver, gold. Gold’s seasonality isn’t driven by supply fluctuations like grown commodities experience, as its mined supply remains fairly steady year-round. Instead gold’s major seasonality is demand-driven, with global investment demand varying dramatically depending on the time within the calendar year.
This gold seasonality is fueled by well-known income-cycle and cultural drivers of outsized gold demand from around the world. Starting now in late summer, Asian farmers begin to reap their harvests. As they figure out how much surplus income was generated from all their hard work during the growing season, they wisely plow some of their savings into gold. Asian harvest is followed by India’s famous wedding season.
Indians believe getting married during their autumn festivals is auspicious, increasing the likelihood of long, successful, happy, and even lucky marriages. And Indian parents outfit their brides with beautiful and intricate 22-karat gold jewelry, which they buy in vast quantities. That’s not only for adornment on their wedding days, but these dowries secure brides’ financial independence within their husbands’ families.
After that comes the Western holiday season, where gold-jewelry demand surges for Christmas gifts for wives, girlfriends, daughters, and mothers. Following year-end, Western investors figure out how much surplus income they earned after getting bonuses and paying taxes. Some of this is invested into gold just like the Asian farmers do. Then big Chinese New Year gold buying flares up heading into February.
So during its bull-market years, gold has always tended to enjoy major autumn rallies driven by these sequential episodes of outsized demand. Naturally the gold stocks follow gold higher, amplifying its gains due to their profits leverage to the gold price. Today gold stocks are once again right at their most-bullish seasonal juncture, the transition between the usually-drifting summer doldrums and big autumn rallies.
Quantifying gold’s seasonal tendencies during bull markets requires all relevant years’ price action to be recast in perfectly-comparable percentage terms. That’s accomplished by individually indexing each calendar year’s gold price to its final close of the preceding year. That’s set at 100 and then all the gold-price action of the following year is calculated off that common indexed baseline, normalizing all years.
So gold trading at an indexed level of 105 simply means it has rallied 5% from the prior year’s close, while 95 shows it’s down 5%. This methodology renders all bull-market-year gold performances in like terms. That’s critical since gold’s price range has been so vast, from $257 in April 2001 to $1894 in August 2011. That span encompassed gold’s last secular bull, which saw a colossal 638.2% gain over those 10.4 years!
So 2001 to 2011 were certainly bull years. 2012 was technically one too, despite gold suffering a major correction following that powerful bull run. At worst that year, gold fell 18.8% from its 2011 peak. That was not quite enough to enter formal bear territory at a 20% drop. But 2013 to 2015 were definitely brutal bear years, which need to be excluded since gold behaves very differently in bull and bear markets.
In early 2013 the Fed’s wildly-unprecedented open-ended QE3 campaign ramped to full speed, radically distorting the markets. Stock markets levitated on the Fed’s implied backstopping, slaughtering demand for alternative investments led by gold. In Q2’13 alone, gold plummeted by 22.8% which proved its worst quarter in an astounding 93 years! Gold’s bear continued until the Fed’s initial rate hike of this cycle in late 2015.
The day after that first rate hike in 9.5 years in mid-December 2015, gold plunged to a major 6.1-year secular low. Then it started rallying sharply out of that irrational rate-hike scare, formally crossing the +20% new-bull threshold in early March 2016. Ever since, gold has remained in this young bull. At worst last December after gold was crushed on the post-election Trumphoria stock-market surge, it had merely corrected 17.3%.
So the bull-market years for gold in modern history ran from 2001 to 2012, skipped the intervening bear-market years of 2013 to 2015, and resumed in 2016 to 2017. Thus these are the years most relevant to understanding gold’s typical seasonal performance throughout the calendar year. We’re interested in bull-market seasonality, because gold remains in its young bull today and bear-market action is quite dissimilar.
This chart averages the individually-indexed full-year gold performances in those bull-market years from 2001 to 2012 and 2016. 2017 isn’t included in this analysis yet since it remains a work in progress. This chart distills out gold’s bull-market seasonal tendencies in like percentage terms. They reveal right about now is when gold’s long parade of big seasonal rallies gets underway, kicking off with its major autumn rally.

During these modern bull-market years, gold has enjoyed a strong and pronounced seasonal uptrend. From that prior-year-final-close 100 baseline, it has powered 16.2% higher on average by year-end! These are major gains by any standard, well worth investing for. While this chart is rendered in calendar-year terms since these increments are easiest for us to grasp, gold’s seasonal year actually starts in the summers.
Remember this whole concept of seasonality relies on blending many years together, smoothing away outliers to reveal the core underlying tendencies. Seasonally gold tends to bottom in mid-June, but then still largely drifts sideways in its summer doldrums until late July. This year’s gold summer-doldrums low came a bit later in early July. At $1212, gold was still up 5.4% year-to-date compared to that low’s +6.0% average.
From that major seasonal low in gold’s weakest time of the year, gold grinds higher in July before starting to surge again in August. That’s when Asian harvest buying kicks into full swing. Although August is still emerging from the summer-doldrums sideways grind, it’s actually gold’s fifth best month seasonally with a 2.0% average gain in these modern bull-market years. Investors and speculators need to be long gold in August!
And gold’s major autumn rally only builds from there. Next comes September, which was actually gold’s strongest month of the year seasonally on average from 2001 to 2012 and 2016! Its 3.1% seasonal gain is challenged only by November and January, which weigh in at a slightly-lower 3.1% due to rounding and 2.9%. Overall gold’s autumn rally between mid-June and late September sees it power 6.9% higher on average.
That’s a major gain by any standard in just 3.4 months. The historical average annual US stock-market returns run around 7% to 10% depending on the span measured. So seeing gold surge nearly that much on average in modern bull-market years in just over a quarter of the time is impressive. And gold’s already-underway autumn rally this year has much greater upside potential than usual due to a couple factors.
Two key groups of traders drive gold’s short-term fortunes, gold-futures speculators and stock investors who buy that leading GLD gold ETF’s shares for portfolio gold exposure. They’ve both been exceedingly bearish this summer, and thus have dumped vast quantities of gold. So speculators and investors alike have massive mean-reversion buying to do to return their gold exposure to some semblance of normalcy.
On the gold-futures side, speculators spent much of July aggressively dumping gold. That was mostly in the form of a near-record gold-futures shorting blitz! That left these traders’ collective short positions way up at near-record extremes. These extreme shorts are guaranteed near-future buying, because they soon have to be covered by buying offsetting long contracts. Short covering quickly snowballs, becoming self-feeding.
That epic shorting blasted gold under both its 200-day moving average and upleg’s uptrend support back in early July. That spooked investors who were already enamored with the red-hot stock markets. So they jettisoned GLD shares far faster than gold itself was being sold, bashing this behemoth’s holdings to new post-election lows. With their gold holdings via GLD now very low, their portfolios can’t be properly diversified.
Just this week, GLD held 791.9 metric tons of gold in trust for its shareholders. This was worth $32.2b at this week’s prevailing gold price of $1266. Meanwhile the collective market capitalization of the elite S&P 500 stocks is way up at $22,601.6b! That implies American stock investors, institutions and individuals combined, have gold portfolio allocations around 0.14%. Between 2009 to 2012, this ratio averaged 0.48%.
The trigger necessary to rekindle gold investment demand will likely again prove a major stock-market selloff. Gold is a unique asset that tends to move counter to stock markets, an anti-stock trade. And that makes gold the ultimate portfolio diversifier, with investment demand surging as stock markets weaken. Gold has long been hostage to stocks. Its current bull was born in late 2015 in the midst of the last stock corrections.
And make no mistake, despite the epic euphoria and complacency out there today’s stock markets face serious downside risks in coming months. That’s right during gold’s autumn rally. Big bearish factors that could spark another correction-grade selloff over 10% very soon include bubble valuations, record-low volatility, a toppy and tired long-in-the-tooth bull, and most importantly the Fed’s quantitative tightening.
Especially since early 2013, this enormous stock bull has been artificially boosted by extreme Fed easing in the form of QE bond buying. Now the Fed is planning to reverse that into QT bond selling, likely to be announced in mid-September and started as Q4 dawns. The Fed plans to gradually ramp QT to high levels by late 2018, destroying vast amounts of capital created by QE and injected into the stock markets.
This imminent Fed QT is super-bearish for these QE-levitated stock markets! And as they inevitably start rolling over, gold is going to catch a major bid again just like in early 2016. Stock investors will flood back into GLD shares to attempt to better diversify their stock-heavy portfolios. This year’s gold autumn rally will be supercharged if any of that mean-reversion investment buying happens within its coming-months timespan.
Gold’s strong autumn seasonals are why gold stocks enjoy strong autumn seasonals of their own. Gold stocks amplify gold’s price action because gold-mining profitability leverages it. This next chart uses the same bull-market seasonal methodology applied to the flagship HUI gold-stock index. The gold stocks are now entering their best couple-month span of the year seasonally, a very bullish portent for this sector!

Gold stocks enjoy strong seasonal rallies corresponding with gold’s own. Yet unlike gold’s which vary considerably, gold stocks’ seasonal rallies have been much more consistent on average during these bull-market years. Starting in autumn, they ran 11.2%, 15.4%, and 14.0% compared to gold’s 6.9%, 9.5%, and 3.8%. The seasonal gains in gold stocks are more-evenly distributed over the calendar year than gold’s.
While 13 bull-market years are indexed and averaged in this chart, last year’s outsized gold-stock action still really influenced these seasonals. As measured by that benchmark HUI, gold stocks blasted 182.2% higher in just 6.5 months between mid-January and early August 2016! Later the post-election gold exodus on stock-market Trumphoria helped drive a massive 42.5% HUI drop by that brutal mid-December bottom.
So this entire gold-stock-bull seasonal chart shifted higher by about 5 indexed points compared to last year’s version before 2016! The gold stocks tend to bottom with gold seasonally, in mid-June. But that’s followed by a secondary low only slightly higher in late July. So on average, right about now is the best time of the year seasonally to throw heavily long gold stocks near their typical summer-doldrums bottoming.
And this year’s gold-stock upside potential in their coming autumn, winter, and spring seasonal rallies is far greater than normal. Gold is a key factor, as the big mean-reversion buying coming in gold futures and GLD shares will catapult gold much higher. That will radically improve gold-stock sentiment, which is a bearish wasteland now. Gold-mining fundamentals will get much better too as their profits amplify gold’s gains.
But the likely gold-stock gains in this new strong season running from now until next spring will really be compounded by this sector’s terrible performance this year. Normally at its mid-June and late-July summer-doldrums lows, the HUI is still up 17.3% and 18.1% year-to-date. But at its early-July low this year, the HUI was down 1.9% YTD! That was a ludicrous anomaly since gold was still up 5.4% YTD at that point.
The major gold stocks generally leverage gold’s gains by 2x to 3x, which is why traders want to own them during gold bulls. With gold stocks now running sub-1x leverage to gold for most of 2017, they are due for a mighty catch-up surge back up to 2x+ in the coming months. At this week’s gold levels, the HUI would need to trade near 219 to run 2x leverage YTD and 238 for 3x. That’s 12% and 22% higher from here!
Gold stocks are a small contrarian sector that is pathologically manic-depressive. They are often hated or ignored, and thus grind listlessly at relatively-low levels building bearishness. But that bipolar nature can shift on a dime once gold itself starts rallying convincingly. Then capital floods back into gold stocks and catapults them sharply higher within weeks. These surges following long drifts are wildly profitable to ride.
But the only way to catch them is to buy low before they erupt, when gold-stock sentiment remains mired in excessive bearishness. That’s already reversing. Since early July’s summer-doldrums low this year, the HUI has already surged 10.3% as of this week. That leveraged gold’s 4.7% rally over that same span by 2.2x, right on target. Thus gold-stock sentiment has already begun improving in this sector’s young autumn rally.
Some of gold stocks’ biggest seasonal months of the year are right around the corner. This final chart breaks down gold-stock-bull seasonality as exhibited by the HUI into calendar months. Each is indexed to 100 as of the previous month’s final close, and then individual calendar months’ indexes are averaged across gold-stock-bull calendar years. These monthly seasonals flesh out the seasonal rallies’ internals.

During these modern bull-market years from 2001 to 2012 and 2016, August and September were gold stocks’ fourth- and third-best months of the year seasonally! August averaged HUI gains of 4.7%, while September’s were even slightly better at 4.8%. While February and May are bigger, gold stocks have no other two-month span like August-September that averages such major back-to-back gains for this sector!
That’s another reason why it’s so important to buy low in the summer doldrums when you least want to, when it feels miserable. Most speculators and investors aren’t contrarians, they haven’t painstakingly forged the hard discipline necessary to actually buy low. Instead they wait until after a sector has already rallied, and then chase the momentum. That’s not only far riskier, but yields much-lower long-term gains.
After gold stocks have already started powering higher in their coming big autumn rally, the easy gains have already been won. While there are outliers, the average of 13 years of bull-market gold-stock price action decisively proves that the late summer doldrums are the highest-probability-for-success buying opportunity of the entire year! Contrarians strong enough to fight the herd can back up the truck for great bargains.
I’ve studied and written about gold and gold-stock seasonality for many years now. And without a doubt the most-important thing to realize is seasonals are mere tendencies. While these averages over years are driven by underlying sentiment, technicals, and fundamentals, the seasonals can easily be overpowered in any year by these same driving forces. Seasonals are like tailwinds or headwinds, not primary engines.
So seasonal rallies are strongest when gold stocks have sentimental, technical, and fundamental reasons to power higher. That’s certainly the case this year! Bearishness in this sector is extreme after that terrible first-half performance, implying the sentiment pendulum is overdue to once again swing back to bullish. And after lagging gold so dramatically, gold-stock prices are likely to mean revert far higher to regain normalcy.
And relative to gold which drives their profits and thus ultimately stock prices, the gold miners’ stocks are exceedingly undervalued today. They have rarely been cheaper fundamentally! This will become more apparent as the gold miners finish reporting their Q2’17 results in the coming weeks. The average gold price climbed 3.1% from Q1 to $1258 in Q2, which should boost this sector’s profits from already-strong Q1.
While investors and speculators alike can certainly play gold stocks’ coming autumn rally with the major ETFs like GDX, the best gains by far will be won in individual gold stocks with superior fundamentals. Their upside will trounce the ETFs’, which are burdened by over-diversification and underperforming gold stocks. A carefully-handpicked portfolio of elite gold and silver miners will generate much-greater wealth creation.
At Zeal we’ve literally spent tens of thousands of hours researching individual gold stocks and markets, so we can better decide what to trade and when. As of the end of Q2, this has resulted in 951 stock trades recommended in real-time to our newsletter subscribers since 2001. Fighting the crowd to buy low and sell high is very profitable, as all these trades averaged stellar annualized realized gains of +21.2%!
The key to this success is staying informed and being contrarian. That means buying low when others are scared, like late in gold stocks’ summer doldrums. An easy way to keep abreast is through our acclaimed weekly and monthly newsletters. They draw on our vast experience, knowledge, wisdom, and ongoing research to explain what’s going on in the markets, why, and how to trade them with specific stocks. For only $10 per issue, you can learn to think, trade, and thrive like contrarians. Subscribe today, and get deployed in the great gold and silver stocks in our full trading books!
The bottom line is gold-stock seasonals argue this sector is right on the verge of a major autumn rally. August and September are the best couple-month span of the year for gold stocks seasonally in bull-market years. This is driven by a parallel autumn gold rally fueled by outsized Asian demand coming back online. Gold stocks naturally amplify gold’s gains since their profits leverage gold’s price moves.
And since gold stocks have so seriously lagged gold in 2017, their upside potential in this year’s autumn rally is exceptional. Instead of just amplifying gold’s own coming gains like usual, the gold stocks need to stage a serious catch-up rally as well. That’s already begun in the past month, proving sentiment is starting to shift away from excessive bearishness. Momentum is building for a far-better-than-average strong season.
Adam Hamilton, CPA
August 4, 2017
Copyright 2000 – 2017 Zeal LLC (www.ZealLLC.com)
Dennis Gartman of the eponymous The Gartman Letter noted today in his daily letter to investors that he is paying less attention to the non-farms component than others because “after eight full years of better employment data the labor pool of truly available… and importantly drug and alcohol free workers… has nearly been depleted.” He is suggesting that businesses cannot find “usable and reliable” labor, and therefore we should pay attention to hours worked and average hourly earnings of US employment figures as good indicator of inflationary pressures which is bad for gold. He said that a close above a gold price of $1272 or $1276 is a bullish sign on the yellow metal.
“Turning to gold, it is firmer today although it is having trouble pushing upward through resistance in the spot at the $1272-$1276 level, which has served as strong resistance for the past two weeks. Technically a close above that resistance… even by the barest of margins… would be a powerfully bullish signal. Indeed we are reminded of one of the rules of trading established by the great Richard Dennis who fearlessly bought almost any and all markets that closed at new, interim highs for the week. He made his “name” in the business of trading doing just that… and very effectively!
Much may depend upon today’s Employment Situation Report, but as noted…the proper focus should not be upon the unemployment rate, nor upon the non-farm payrolls component of the report, but should be instead upon the report on average hourly earnings. The labor pool has just about been exhausted, to the point that every businessman… or woman… that we talk with has expressed an utter and increasing inability to hire and retain good workers. Wages are rising and that shall be… or at least should be… reflected in today’s report, suggesting that inflationary pressures are building…finally.”
As it turned out, average hourly earnings for the US rose to $26.36 in July 2017 from $26.27 back in June, and $25.71 one year back in July 2016 (Source: Bureau Labor of Statistics). Total aggregate hours increased by 0.2% over the month of July, and 2% over the year. Aggregate weekly payrolls increased 0.5% over-the-month and 4.6% over the year (Source: Bureau of Labor Statistics). These figures point to a strong labor market which placed downward pressure on gold prices. Gold finished down $9.70 on the day to $1264.70
Despite the fact that there was no bullish signal on gold today, Gartman is still long gold.
“We are long of gold in EUR, Yen and US dollar terms and for now we sit tight, as we have on balance for the past several years, hoping for and/or awaiting spot dollar denominated gold to take out and close nicely above $1280/oz.”
It looks like Richard Dennis and the gold bulls are going to have to wait a bit longer for bullish signals on gold.
Some time ago we discussed the analogies in the silver market and the implication of the analogies was that a big decline should follow. However, we have not seen anything epic on a medium-term basis – only a local (yet powerful) intra-day slide. Was the analogy invalidated and did the outlook become bullish?
Let’s take a closer look at the silver chart (charts courtesy of http://stockcharts.com) and begin today’s analysis by reminding ourselves the analogies that we are going to discuss in greater detail.

Quoting the July 10, 2017 Gold & Silver Trading Alert:
“The above chart is very rich in important data and analogies and it will take us some time to discuss all of them. Let’s start with the one that was already present before Friday’s session and then we’ll move to the one that became apparent based on what happened based on it.
The first thing is that silver’s recent, and not so recent (mid-2016 – today) performance is to a large extent a repeat of what we saw in 2008. This time, the price moves took more time, but the price levels themselves are almost identical. The 2008 and 2016 tops both formed a bit above $21 and both were followed by a decline to about $16 (marked with orange lines), which was in turn followed by a rally to about $19 (again, in both cases). Then a huge plunge followed in 2008 – why shouldn’t it follow this time if the previous price swings are so similar in terms of price? The decline in 2008 took silver below $9, so based on this analogy alone, it appears that silver is once again likely to test these levels.
Also, both rallies (the ones that ended in 2008 and 2016) started from about $14, which further strengthens the analogy between these situations.
Let’s move to the second analogy – the one that seems even more important.
The three local tops in silver that we saw this year are similar to the ones that we saw in 2012 and 2013, right before the big plunge in the price of white metal. This can be seen on a stand-alone basis, but it’s even clearer when we realize that both three-top patterns were preceded by proportionately similar action.
The late-2015 and 2010 bottoms were the ones that preceded the big upswings in silver. In both cases, the initial rally was shortly followed by a consolidation (mid-2010 and Q1 2016), then a sharp rally with a quick correction in the middle (late 2010-early 2011 and Q2 2016) and then a top that formed after a very sharp upswing. Both tops were followed by a zig-zag correction and local bottoms (mid-2011, end of Q3 2011, end of 2011, mid-2012, Q3 and Q4 2016). After these bottoms (the final ones took place in mid-2012 and at the end of 2016), we saw rallies that took silver much higher and that ended below the most recent local top (the Q3 2012 rally ended below the Q1 2012 top and the Q1 2017 rally ended below the Q4 2016 top).
Both preceding actions were not identical, but quite similar. This makes the three-top similarity much more profound than if we saw it on a stand-alone basis.
But wait, there’s more. The rising support/resistance lines that we can draw (red lines) based on the initial bottom and the interim one also show similarity – both final local bottoms took silver right to this line and the corrective upswing that followed was the final one (Q1 2013 and the May-June 2017 rallies) before the big dive.
With similar preceding action, similar follow-up action is to be expected. We marked the follow-up declines of the 2012 and 2013 tops with blue, dashed lines. Applying these lines to the recent 3 tops in silver provides us with a coherent price and time target. The fact that they all point to a similar price-time combination further confirms the analogy between the tops. The target based on the three tops and the analogy to the previous ones is about $9.60, which is also the 2006 bottom. So, based on the above analogy, $9.60 is the downside target and the blue ellipses mark the current moment and the moment in the past that is analogous to it. It seems that the most volatile part of the decline is just ahead.
With two analogies pointing to different price targets (and important long-term declining support lines and levels being between them), what will the final target be? It will depend on what happens in the precious metals market (not only in silver) once we get closer to these levels. If miners show significant strength and gold reaches an important support level, we may not wait for silver to decline to the lowest of targets before moving back into the precious metals market with the long-term investments.
For now, it seems that the final bottom in silver form between $8 and $10.”
The question for today is whether anything from the above was invalidated based on silver’s lack of decline and did the above silver price prediction change? In short, the direct price analogy was invalidated, however, the general analogy and the implications still remain intact. Why?
Because of what happened in with the U.S. dollar in the recent months.
The silver market has its own fundamentals and it’s much more to silver than just the USD Index, however, in the past decade all big moves in the silver prices were seen at least in some tune with the value of the U.S. dollar.
The 2005 – 2006 upswing was seen with a horizontal trend in the USD and the final spike took place during the USD’s slide. Silver declined only after the USD Index stopped declining.
The 2007 – 2008 rally in silver was seen with a decline in the USD Index and the decline started when the USD stopped declining. The huge slide started when USD Index rallied back up.
The 2010 – 2011 rally in silver was also seen with a decline in the USD Index and the decline started when the USD stopped declining. The huge slide started when USD Index rallied back up in the second half of the year.
The 2012 decline took place when the USD Index did nothing initially and then moved higher.
The huge 2012 – 2013 decline in silver started when the USD Index did nothing initially and then it accelerated dramatically after USD moved higher.
There are many other less visible examples of this relationship and for the purpose of this essay, they all have one key implication:
There were no powerful slides in silver if the USD Index was declining.
Why would that be the case?
As the USD declines in value, silver priced in it becomes cheaper for investors and users from abroad and this triggers purchases. Theoretically, it shouldn’t matter that much because the price of silver can move up or down in all currencies, but in practice, it does. When investors are in this “buy mode” the sharp declines are quickly absorbed by this buying power.
Given the declining USD Index, there were only two types of reaction in silver: either moving back and forth or a rally. What we’ve been seeing in the recent weeks and months is a strong suggestion that the silver market does not want to move higher right now and it’s waiting for an opportunity to slide, just like it did in 2013. The USD Index has been refusing to provide such a signal for months now.
On a daily basis, silver may seem to respond to the action in the USD Index, but from the bigger point of view, the link is much more bearish – the USD Index is about 10 index points lower than it was at the beginning of this year and silver is more or less at the same price level (more or less the same is the case with silver stocks). If silver was able to ignore such a huge slide in the USD, then it’s very likely to respond to the USD’s rebound. In fact, it seems that even a stop in the USD’s decline would be enough to trigger a decline in silver.
Moving back to the question in the title of today’s analysis – was the bearish analogy in silver invalidated? No, silver visibly “wants to” decline, just as it’s likely to based on the analogies that we described previously, however, it is not able to do so given the continuously declining USD Index. The USD Index just reached very important support levels, so the end of the decline could be near. This means that silver could be very close to unfolding the bearish potential that it’s been holding for many weeks.
Summing up, the situation in silver continues to be bearish even though it doesn’t appear to be the case at first sight and the key reason for it seems to be silver’s link to the USD Index and the recent performance of the latter. Once the USD stops declining, silver’s bearish potential is likely to become more and more visible. Should the USD reverse in a volatile manner, silver could truly plunge.
If you enjoyed the above analysis and would like to receive free follow-ups, we encourage you to sign up for our gold newsletter – it’s free and if you don’t like it, you can unsubscribe with just 2 clicks. If you sign up today, you’ll also get 7 days of free access to our premium daily Gold & Silver Trading Alerts. Sign up now.
Thank you.
Przemyslaw Radomski, CFA
Founder, Editor-in-chief, Gold & Silver Fund Manager
Sunshine Profits – Tools for Effective Gold & Silver Investments
* * * * *
All essays, research and information found above represent analyses and opinions of Przemyslaw Radomski, CFA and Sunshine Profits’ associates only. As such, it may prove wrong and be a subject to change without notice. Opinions and analyses were based on data available to authors of respective essays at the time of writing. Although the information provided above is based on careful research and sources that are believed to be accurate, Przemyslaw Radomski, CFA and his associates do not guarantee the accuracy or thoroughness of the data or information reported. The opinions published above are neither an offer nor a recommendation to purchase or sell any securities. Mr. Radomski is not a Registered Securities Advisor. By reading Przemyslaw Radomski’s, CFA reports you fully agree that he will not be held responsible or liable for any decisions you make regarding any information provided in these reports. Investing, trading and speculation in any financial markets may involve high risk of loss. Przemyslaw Radomski, CFA, Sunshine Profits’ employees and affiliates as well as members of their families may have a short or long position in any securities, including those mentioned in any of the reports or essays, and may make additional purchases and/or sales of those securities without notice.
If you would like to receive our free newsletter via email, simply enter your email address below & click subscribe.
 Follow us on Twitter
 Become our facebook fan
CONNECT WITH US
Tweets
Tweet with hash tag #miningfeeds or @miningfeeds and your tweets will be displayed across this site.
MOST ACTIVE MINING STOCKS
Daily Gainers
 CMC Metals Ltd. CMC Metals Ltd. |
CMB.V | +900.00% |
 Eden Energy Ltd Eden Energy Ltd |
EDE.AX | +200.00% |
| GoviEx Uranium Inc. |
GXU.V | +42.86% |
| Eagle Nickel Ltd. |
ENL.AX | +41.67% |
| Citigold Corp. Limited |
CTO.AX | +33.33% |
| Mount Burgess Mining NL |
MTB.AX | +33.33% |
| Exalt Resources Limited |
ERD.AX | +31.94% |
| Casa Minerals Inc. |
CASA.V | +30.00% |
| Cariboo Rose Resources Ltd |
CRB.V | +28.57% |
| Belmont Resources Inc. |
BEA.V | +28.57% |


