
- Today is options expiry day for gold. That’s almost certainly the reason for gold’s pullback today, after it staged a powerful rally yesterday.
- A pause in the price action is normal around these expiry events. The October options contract is expiring, which is recognized by traders as an important one.
- Traders will now focus on December options.
- Please click here now. Double-click to enlarge this short term gold chart.
- For a medium term view of the price action, please click here now. Double-click to enlarge.
- From a technical perspective, all the current price movement in the gold market appears to be “textbook” action. To summarize the recent movement: Gold burst above the $1305 area highs and surged to the “Call-In” day highs in the $1352 area.
- I issued a “book profits now” call as that happened, and the rally promptly died. The pullback took gold back to the breakout zone in the $1305 area.
- Yesterday, gold staged its first rally from that support zone. Gold may soon pull back deeper into that support zone before launching what should be a successful rally above the call-in day resistance zone at $1352 – $1362.
- I’ve laid out two buy zones for investors who want to position themselves to participate in the anticipated breakout above $1362.
- All pullbacks can make investors nervous, and those nervous investors should look at put options for insurance (both emotional and financial).
- Please click here now. That’s a snapshot of the strike price, closing price, change in price, and trading volume for GLD-nyse put options.
- These are December options. Different contract months are available and they can be bought through most stock brokers. Send me an Email to stewart@gracelandupdates.com if you want more information about protective put options and I’ll send you a tactical video. Thanks.
- Buying some put options at the same time as buying long positions in gold, silver, and related stocks can help amateur investors to buy serious price weakness,yet still get a good night’s sleep.
- Please click here now. I’ve annotated this Dimitri Speck seasonal action gold chart. In the case of gold price seasonality, history doesn’t always exactly repeat,but it certainly does rhyme. Note the short term peak that often occurs at the end of September.
- October is generally a pullback month ahead of Diwali, but that pullback may have started a bit earlier than usual this year. So, it should end earlier too, probably within about two weeks. There’s an outside chance that it’s already ended, but I wouldn’t bet real money on that idea.
- My $1305 – $1295 and $1285 – $1270 buy zones should be the focus of gold bugs for now.
- Please click here now. The head of the World Gold Council outlines the case for “peak gold”, and he predicts gold will move to $1400 in 2018 and to all-time highs in “the medium term”.
- He may or may not be correct that the world will never produce as much gold as it produces now, but he’s a very influential man.
- So, the question isn’t so much whether “Peak Gold” is real, but whether institutional money managers think it’s real or even partially real, and they do appear to be believers!
- I predict they will move substantially more money into gold stocks in 2018 than they are moving now, based on the view that supply is unlikely to rise much, if at all.
- My personal focus on all price weakness since 2014 has been gold stocks more than bullion. I will also note that gold mining exploration budgets have fallen about 70% since 2012. It takes a long time to put a gold project into production. All the exploration done in the 2012 period doesn’t seem to be bearing much low hanging fruit in terms of viable new projects.
- Please click here now. Double-click to enlarge this interesting GDX chart. GDX has been staging numerous technical breakouts to the upside, and the latest one is from a large symmetrical triangle.
- The apex of that triangle sits in the $22.50 area. Once option expiry day is out of the way, there is still the US jobs report to deal with next week (October 6, 2017). Gold and gold stocks should make a meaningful seasonal low around that rough time frame. From there, I expect gold to begin a trending move higher into 2018, rising up above key resistance at $1392 and steadily rallying towards $1523.
- GDX should easily hit $37 in 2018, with $55 also being a possible target zone if Western money managers continue to allocate money to the SPDR fund as they have in recent months!
Special Offer For Website Readers: Please send me an Email to freereports4@gracelandupdates.com and I’ll send you my free “Eight Are Great!” senior gold stocks report! I highlight the price action of eight low and medium priced senior producers, with key buy and sell zones highlighted!
Thanks!
Stewart Thomson
Graceland Updates
Note: We are privacy oriented. We accept cheques, credit card, and if needed, PayPal.
Written between 4am-7am. 5-6 issues per week. Emailed at aprox 9am daily.
https://www.gracelandupdates.com
Email:
Rate Sheet (us funds):
Lifetime: $999
2yr: $299 (over 500 issues)
1yr: $199 (over 250 issues)
6 mths: $129 (over 125 issues)
To pay by credit card/paypal, please click this link:
https://gracelandupdates.com/subscribe-pp/
To pay by cheque, make cheque payable to “Stewart Thomson”
Mail to:
Stewart Thomson / 1276 Lakeview Drive / Oakville, Ontario L6H 2M8 Canada
Stewart Thomson is a retired Merrill Lynch broker. Stewart writes the Graceland Updates daily between 4am-7am. They are sent out around 8am-9am. The newsletter is attractively priced and the format is a unique numbered point form. Giving clarity of each point and saving valuable reading time.
Risks, Disclaimers, Legal
Stewart Thomson is no longer an investment advisor. The information provided by Stewart and Graceland Updates is for general information purposes only. Before taking any action on any investment, it is imperative that you consult with multiple properly licensed, experienced and qualified investment advisors and get numerous opinions before taking any action. Your minimum risk on any investment in the world is: 100% loss of all your money. You may be taking or preparing to take leveraged positions in investments and not know it, exposing yourself to unlimited risks. This is highly concerning if you are an investor in any derivatives products. There is an approx $700 trillion OTC Derivatives Iceberg with a tiny portion written off officially. The bottom line:
Are You Prepared?
This week’s landmark Federal Open Market Committee decision to launch quantitative tightening is one of the most-important and most-consequential actions in the Federal Reserve’s entire 104-year history. QT changes everything for world financial markets levitated by years of quantitative easing. The advent of the QT era has enormous implications for stock markets and gold that all investors need to understand.
This week’s FOMC decision to birth QT in early October certainly wasn’t a surprise. To the Fed’s credit, this unprecedented paradigm shift had been well-telegraphed. Back at its mid-June meeting, the FOMC warned “The Committee currently expects to begin implementing a balance sheet normalization program this year”. Its usual FOMC statement was accompanied by an addendum explaining how QT would likely unfold.
That mid-June trial balloon didn’t tank stock markets, so this week the FOMC decided to implement it with no changes. The FOMC’s new statement from Wednesday declared, “In October, the Committee will initiate the balance sheet normalization program described in the June 2017 Addendum to the Committee’s Policy Normalization Principles and Plans.” And thus the long-feared QT era is now upon us.
The Fed is well aware of how extraordinarily risky quantitative tightening is for QE-inflated stock markets, so it is starting slow. QT is necessary to unwind the vast quantities of bonds purchased since late 2008 via QE. Back in October 2008, the US stock markets experienced their first panic in 101 years. Ironically it was that earlier 1907 panic that led to the Federal Reserve’s creation in 1913 to help prevent future panics.
Technically a stock panic is a 20%+ stock-market plunge within two weeks. The flagship S&P 500 stock index plummeted 25.9% in just 10 trading days leading into early October 2008, which was certainly a panic-grade plunge! The extreme fear generated by that rare anomaly led the Fed itself to panic, fearing a new depression driven by the wealth effect. When stocks plummet, people get scared and slash their spending.
That’s a big problem for the US economy over 2/3rds driven by consumer spending, and could become self-reinforcing and snowball. The more stocks plunge, the more fearful people become for their own financial futures. They extrapolate the stock carnage continuing indefinitely and pull in their horns. The less they spend, the more corporate profits fall. So corporations lay off people exacerbating the slowdown.
The Fed slashed its benchmark federal-funds interest rate like mad, hammering it to zero in December 2008. That totally exhausted the conventional monetary policy used to boost the economy, rate cuts. So the Fed moved into dangerous new territory of debt monetization. It conjured new money out of thin air to buy bonds, injecting that new cash into the real economy. That was euphemistically called quantitative easing.
The Fed vehemently insisted it wasn’t monetizing bonds because QE would only be a temporary crisis measure. That proved one of the biggest central-bank lies ever, which is saying a lot. When the Fed buys bonds, they accumulate on its balance sheet. Over the next 6.7 years, that rocketed a staggering 427% higher from $849b before the stock panic to a $4474b peak in February 2015! That was $3625b of QE.
While the new QE bond buying formally ended in October 2014 when the Fed fully tapered QE3, that $3.6t of monetized bonds remained on the Fed’s balance sheet. As of the latest-available data from last week, the Fed’s BS was still $4417b. That means 98.4% of all the Fed’s entire colossal QE binge from late 2008 to late 2014 remains intact! That vast deluge of new money created remains out in the economy.
Don’t let the complacent stock-market reaction this week fool you, quantitative tightening is a huge deal. It’s the biggest market game-changer by far since QE’s dawn! Starting to reverse QE via QT radically alters market dynamics going forward. Like a freight train just starting to move, it doesn’t look scary to traders yet. But once that QT train gets barreling at full speed, it’s going to be a havoc-wreaking juggernaut.
QT will start small in the imminent Q4’17, with the Fed allowing $10b per month of maturing bonds to roll off its books. The reason the Fed’s QE-bloated balance sheet has remained so large is the Fed is reinvesting proceeds from maturing bonds into new bonds to keep that QE-conjured cash deployed in the real economy. QT will slowly taper that reinvestment, effectively destroying some of the QE-injected money.
These monthly bond rolloffs will start at $6b in Treasuries and $4b in mortgage-backed securities. Then the Fed will raise those monthly caps by these same amounts once a quarter for a year. Thus over the next year, QT’s pace will gradually mount to its full-steam speed of $30b and $20b of monthly rolloffs in Treasuries and MBS bonds. The FOMC just unleashed a QT juggernaut that’s going to run at $50b per month!
When this idea was initially floated back in mid-June, it was far more aggressive than anyone thought the Yellen Fed would ever risk. $50b per month yields a jaw-dropping quantitative-tightening pace of $600b per year! These complacent stock markets’ belief that such massive monetary destruction won’t affect them materially is ludicrously foolish. QT will naturally unwind and reverse the market impact of QE.
This hyper-easy Fed is only hiking interest rates and undertaking QT for one critical reason. It knows the next financial-market crisis is inevitable at some point in the future, so it wants to reload rate-cutting and bond-buying ammunition to be ready for it. The higher the Fed can raise its federal-funds rate, and the lower it can shrink its bloated balance sheet, the more easing firepower it will have available in the future.
But QT has never before been attempted and is extremely risky for these QE-levitated stock markets. So the Fed is attempting to thread the needle between preparing for the next market crisis and triggering it. Yellen and top Fed officials have been crystal-clear that they have no intention of fully unwinding all the QE since late 2008. Wall Street expectations are running for a half unwind of the $3.6t, or $1.8t of total QT.
At the full-speed $600b-per-year QT pace coming in late 2018, that would take 3 years to execute. The coming-year ramp-up will make it take longer. So these markets are likely in for fierce QT headwinds for several years or so. At this week’s post-FOMC-decision press conference, Janet Yellen took great pains to explain the FOMC has no intentions of altering this QT-pacing plan unless there is some market calamity.
Yellen was also more certain than I’ve ever heard her on any policy decisions that this terminal $50b-per-month QT won’t need to be adjusted. With QT now officially started, the FOMC is fully committed. If it decides to slow QT at some future meeting in response to a stock selloff, it risks sending a big signal of no confidence in the economy and exacerbating that very selloff! Like a freight train, QT is hard to stop.
With stock markets at all-time record highs this week, QT’s advent seems like no big deal to euphoric stock traders. They are dreadfully wrong. CNBC’s inimitable Rick Santelli had a great analogy of this. Just hearing a hurricane is coming is radically different than actually living through one. QT isn’t feared because it isn’t here and hasn’t affected markets yet. But once it arrives and does, psychology will really change.
Make no mistake, quantitative tightening is extremely bearish for these QE-inflated stock markets. Back in late July I argued this bearish case in depth. QT is every bit as bearish for stocks as QE was bullish! This first chart updated from that earlier essay shows why. This is the scariest and most-damning chart in all the stock markets. It simply superimposes that S&P 500 benchmark stock index over the Fed’s balance sheet.
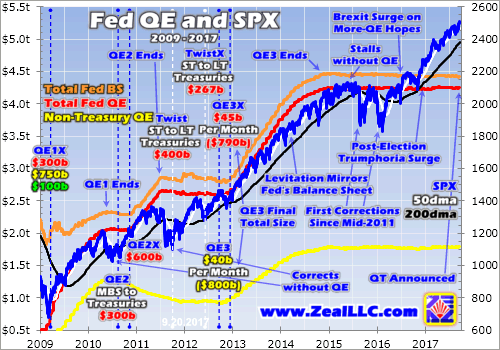
Between March 2009 and this week’s Fed Day, the S&P 500 has powered an epic 270.8% higher in 8.5 years! That makes it the third-largest and second-longest stock bull in US history. Why did that happen? The underlying US economy sure hasn’t been great, plodding along at 2%ish growth ever since the stock panic. That sluggish economic growth has constrained corporate-earnings growth too, it’s been modest at best.
Stocks are exceedingly expensive too, with their highest valuations ever witnessed outside of the extreme bull-market toppings in 1929 and 2000. The elite S&P 500 component companies exited August with an average trailing-twelve-month price-to-earnings ratio of 28.1x! That’s literally in formal bubble territory at 28x, which is double the 14x century-and-a-quarter fair value. Cheap stocks didn’t drive most of this bull.
And if this bull’s gargantuan gains weren’t the product of normal bull-market fundamentals, that leaves quantitative easing. A large fraction of that $3.6t of money conjured out of thin air by the Fed to inject into the economy found its way into the US stock markets. Note above how closely this entire stock bull mirrored the growth in the Fed’s total balance sheet. The blue and orange lines above are closely intertwined.
Those vast QE money injections levitated stock markets through two simple mechanisms. The massive and wildly-unprecedented Fed bond buying forced interest rates to extreme artificial lows. That bullied traditional bond investors seeking income from yields into far-riskier dividend-paying stocks. Super-low interest rates also served as a rationalization for historically-expensive P/E ratios rampant across the stock markets.
While QE directly lifted stocks by sucking investment capital out of bonds newly saddled with record-low yields, a secondary indirect QE impact proved more important. US corporations took advantage of the Fed-manipulated extreme interest-rate lows to borrow aggressively. But instead of investing all this easy cheap capital into growing their businesses and creating jobs, they squandered most of it on stock buybacks.
QE’s super-low borrowing costs fueled a stock-buyback binge vastly greater than anything seen before in world history. Literally trillions of dollars were borrowed by elite S&P 500 US corporations to repurchase their own shares! This was naked financial manipulation, boosting stock prices through higher demand while reducing shares outstanding. That made corporate earnings look much more favorable on a per-share basis.
Incredibly QE-fueled corporate stock buybacks have proven the only net source of stock-market capital inflows in this entire bull market since March 2009! Elite Wall Street banks have published many studies on this. Without that debt-funded stock-buyback frenzy only possible through QE’s record-low borrowing rates, this massive near-record bull wouldn’t even exist. Corporations were the only buyers of their stocks.
QE’s dominating influence on stock prices is unassailable. The S&P 500 surged in its early bull years until QE1 ended in mid-2010, when it suffered its first major correction. The Fed panicked again, fearing another plunge. So it birthed and soon expanded QE2 in late 2010. Again the stock markets surged on a trajectory perfectly paralleling the Fed’s balance-sheet growth. But stocks plunged when QE2 ended in mid-2011.
The S&P 500 fell 19.4% over the next 5.2 months, a major correction that neared bear-market territory. The Fed again feared a cascading negative wealth effect, so it launched Operation Twist in late 2011 to turn stock markets around. That converted short-term Treasuries to long-term Treasuries, forcing long rates even lower. As the stock markets started topping again in late 2012, the Fed went all out with QE3.
QE3 was radically different from QE1 and QE2 in that it was totally open-ended. Unlike its predecessors, QE3 had no predetermined size or duration! So stock traders couldn’t anticipate when QE3 would end or how big it would get. Stock markets surged on QE3’s announcement and subsequent expansion a few months later. Fed officials started to deftly use QE3’s inherent ambiguity to herd stock traders’ psychology.
Whenever the stock markets started to sell off, Fed officials would rush to their soapboxes to reassure traders that QE3 could be expanded anytime if necessary. Those implicit promises of central-bank intervention quickly truncated all nascent selloffs before they could reach correction territory. Traders realized that the Fed was effectively backstopping the stock markets! So greed flourished unchecked by corrections.
This stock bull went from normal between 2009 to 2012 to literally central-bank conjured from 2013 on. The Fed’s QE3-expansion promises so enthralled traders that the S&P 500 went an astounding 3.6 years without a correction between late 2011 to mid-2015, one of the longest-such spans ever! With the Fed jawboning negating healthy sentiment-rebalancing corrections, psychology grew ever more greedy and complacent.
QE3 was finally wound down in late 2014, leading to this Fed-conjured stock bull stalling out. Without central-bank money printing behind it, the stock-market levitation between 2013 to 2015 never would have happened! Without more QE to keep inflating stocks, the S&P 500 ground sideways and started topping. Corrections resumed in mid-2015 and early 2016 without the promise of more Fed QE to avert them.
In mid-2016 the stock markets were able to break out to new highs, but only because the UK’s surprise pro-Brexit vote fueled hopes of more global central-bank easing. The subsequent extreme Trumphoria rally since the election was an incredible anomaly driven by euphoric hopes for big tax cuts soon from the newly-Republican-controlled government. But Republican infighting is making that look increasingly unlikely.
The critical takeaway of the entire QE era since late 2008 is that stock-market action closely mirrored whatever the Fed was doing. Ex-Trumphoria, all this bull’s massive stock-market gains happened when the Fed was actively injecting trillions of dollars of QE. When the Fed paused its balance-sheet growth, the stock markets either corrected hard or stalled out. These stock markets are extraordinarily QE-dependent.
The Fed’s balance sheet has never materially shrunk since QE was born out of that 2008 stock panic. Now quantitative tightening will start ramping up in just a couple weeks for the first time ever. If QE is responsible for much of this stock bull, and certainly all of the extreme levitation from 2013 to 2015 due to the open-ended QE3, can QT possibly be benign? No freaking way friends! Unwinding QE is this bull’s death knell.
QE was like monetary steroids for stocks, artificially ballooning this bull market to monstrous proportions. Letting bonds run off the Fed’s balance sheet instead of reinvesting effectively destroys that QE-spawned money. QE made this bull the grotesque beast it is, so QT is going to hammer a stake right through its heart. This unprecedented QT is even more dangerous given today’s bubble valuations and rampant euphoria.
Investors and speculators alike should be terrified of $600b per year of quantitative tightening! The way to play it is to pare down overweight stock positions and build cash to prepare for the long-overdue Fed-delayed bear market. Speculators can also buy puts in the leading SPY SPDR S&P 500 ETF. Investors can go long gold via its own flagship GLD SPDR Gold Shares ETF, which tends to move counter to stock markets.
Gold was hit fairly hard after this week’s FOMC decision announcing QT, which makes it look like QT is bearish for gold. Nothing could be farther from the truth. Gold’s post-Fed selloff had nothing at all to do with QT! At every other FOMC meeting, the Fed also releases a summary of top Fed officials’ outlooks for future federal-funds-rate levels. This so-called dot plot was widely expected to be more dovish than June’s.
Yellen herself had given speeches in the quarter since that implied this Fed-rate-hike cycle was closer to its end than beginning. She had said the neutral federal-funds rate was lower than in the past, so gold-futures speculators expected this week’s dot plot to be revised lower. It wasn’t, coming in unchanged from June’s with 3/4ths of FOMC members still expecting another rate hike at the FOMC’s mid-December meeting.
This dot-plot hawkish surprise totally unrelated to QT led to big US-dollar buying. Futures-implied rate-hike odds in December surged from 58% the day before to 73% in the wake of the FOMC’s decision. So gold-futures speculators aggressively dumped contracts, forcing gold lower. That reaction is irrational, as gold has surged dramatically on average in past Fed-rate-hike cycles! QT didn’t play into this week’s gold selloff.
This last chart superimposes gold over that same Fed balance sheet of the QE era. Gold skyrocketed during QE1 and QE2, which makes sense since debt monetizations are pure inflation. But once the open-ended QE3 started miraculously levitating stock markets in early 2013, investors abandoned gold to chase those Fed-conjured stock-market gains. That blasted gold into a massive record-setting bear market.
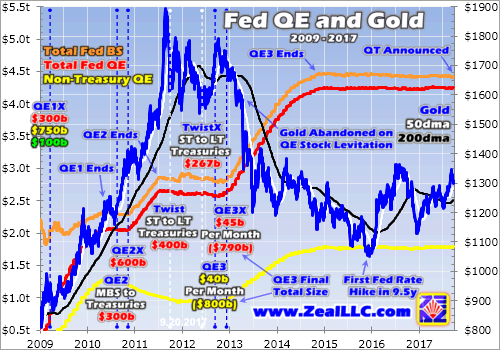
In a normal world, quantitative easing would always be bullish for gold as more money is injected into the economy. Gold’s monetary value largely derives from the fact its supply grows slowly, under 1% a year. That’s far slower than money supplies grow normally, let alone during QE inflation. Gold’s price rallies as relatively more money is available to compete for relatively less physical gold. QE3 broke that historical relationship.
With the Fed hellbent on ensuring the US stock markets did nothing but rally indefinitely, investors felt no need for prudently diversifying their portfolios with alternative investments. Gold is the anti-stock trade, it tends to move counter to stock markets. So why bother with gold when QE3 was magically levitating the stock markets from 2013 to 2015? That QE3-stock-levitation-driven gold bear finally bottomed in late 2015.
Today’s gold bull was born the very next day after the Fed’s first rate hike in 9.5 years in mid-December 2015. If Fed rate hikes are as bearish for gold as futures speculators assume, why has gold’s 23.7% bull as of this week exceeded the S&P 500’s 22.8% gain over that same span? Not even the Trumphoria rally has enabled stock markets to catch up with gold’s young bull! Fed rate hikes are actually bullish for gold.
The reason is hiking cycles weigh on stock markets, which gets investors interested in owning counter-moving gold to re-diversity their portfolios. That’s also why this new QT era is actually super-bullish for gold despite the coming monetary destruction. As QT gradually crushes these fake QE-inflated stock markets in coming years, gold investment demand is going to soar again. We’ll see a reversal of 2013’s action.
That year alone gold plunged a colossal 27.9% on the extreme 29.6% S&P 500 rally driven by $1107b of fresh quantitative easing from the massive new QE3 campaign! That 2013 gold catastrophe courtesy of the Fed bred the bearish psychology that’s plagued this leading alternative asset ever since. At QT’s $600b planned annual pace, it will take almost a couple years to unwind that epic $1.1t QE seen in 2013 alone.
Interestingly the Wall-Street-expected $1.8t of total QT coming would take the Fed’s balance sheet back down to $2.6t. That’s back to mid-2011 levels, below the $2.8t in late 2012 when QE3 was announced. Gold averaged $1573 per ounce in 2011, and it ought to head much higher if QT indeed spawns the next stock bear. That’s the core bullish-gold thesis of QT, that falling stock prices far outweigh monetary destruction.
Stock bears are normal and necessary to bleed off excessive valuations, but they are devastating to the unprepared. The last two ending in October 2002 and March 2009 ultimately hammered the S&P 500 49.1% and 56.8% lower over 2.6 and 1.4 years! If these lofty QE-levitated stock markets suffer another typical 50% bear during QT, huge gold investment demand will almost certainly catapult it to new record highs.
These QE-inflated stock markets are doomed under QT, there’s no doubt. The Fed giveth and the Fed taketh away. Stock bears gradually unfold over a couple years or so, slowly boiling the bullish frogs. So without a panic-type plunge, the tightening Fed is going to be hard-pressed to throttle back QT without igniting a crisis of confidence. As QT slowly strangles this monstrous stock bull, gold will really return to vogue.
The key to thriving and multiplying your fortune in bull and bear markets alike is staying informed, about broader markets and individual stocks. That’s long been our specialty at Zeal. My decades of experience both intensely studying the markets and actively trading them as a contrarian is priceless and impossible to replicate. I share my vast experience, knowledge, wisdom, and ongoing research in our popular newsletters.
Published weekly and monthly, they explain what’s going on in the markets, why, and how to trade them with specific stocks. They are a great way to stay abreast, easy to read and affordable. Walking the contrarian walk is very profitable. As of the end of Q2, we’ve recommended and realized 951 newsletter stock trades since 2001. Their average annualized realized gain including all losers is +21.2%! That’s hard to beat over such a long span. Subscribe today and get invested before QT’s market impacts are felt!
The bottom line is the coming quantitative tightening is incredibly bearish for these stock markets that have been artificially levitated by quantitative easing. QT has never before been attempted, let alone in artificial QE-inflated stock markets trading at bubble valuations and drenched in euphoria. All the stock-bullish tailwinds from years of QE will reverse into fierce headwinds under QT. It truly changes everything.
The main beneficiary of stock-market weakness is gold, as the leading alternative investment that tends to move counter to stock markets. The coming QT-driven overdue stock bear will fuel a big renaissance in gold investment to diversify stock-heavy portfolios. And the Fed can’t risk slowing or stopping QT now that it’s officially triggered. The resulting crisis of confidence would likely exacerbate a major stock-market selloff.
Adam Hamilton, CPA
September 22, 2017
Copyright 2000 – 2017 Zeal LLC (www.ZealLLC.com)
The future is sealed; batteries will rule the automotive industry as more and more countries outlaw combustion engines. Lithium (Li) is the lightest metal with the highest energy density, allowing the metal to supply the maximum charge per kilogram, which, in turn, makes it excellent for battery use.
Current global lithium production is not enough to meet future demand and with countries around the world increasingly shunning fossil fuels, demand for a secure supply of lithium will drive growth of lithium mining companies.
One company is already on its way to commercial production of lithium.
North American Lithium (NAL) acquired and is re-starting one of the only near-term viable hard rock lithium operations globally. North American Lithium is the 100-per-cent owner of the Québec Lithium Mine in Val-d’Or, Quebec, a mine site located within reach of North America’s largest markets and export terminals.
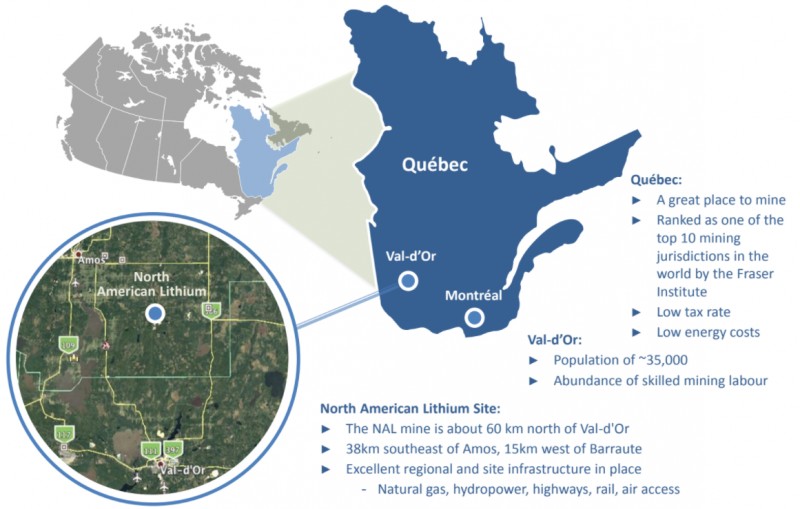
According to the 2016 Fraser Institute Annual Survey Mining Jurisdictions, Québec ranks as one of the top 10 mining jurisdictions in the world, with a low tax rate, low energy costs and a mining friendly government. NAL’s mine is situated about 60 kilometres north of Val-D’Or, a city with a population of 35,000 residents that provides an abundance of skilled mining labor for the region. The site also happens to be serviced by excellent regional and site-based infrastructure with access to natural gas, hydropower, highways, rail, and air. With security of supply a top priority for technology companies, businesses that require lithium will want to source their supply from safe and stable jurisdictions.
NAL’s lithium project is a past-producing mine with approximately $500 million already spent on the development of the property. Previous companies completed the necessary work to advance the project to the brink of commissioning. In addition, over $100 million has been invested by NAL shareholders over the last two years, shortening the timeline to production for a junior mining company.
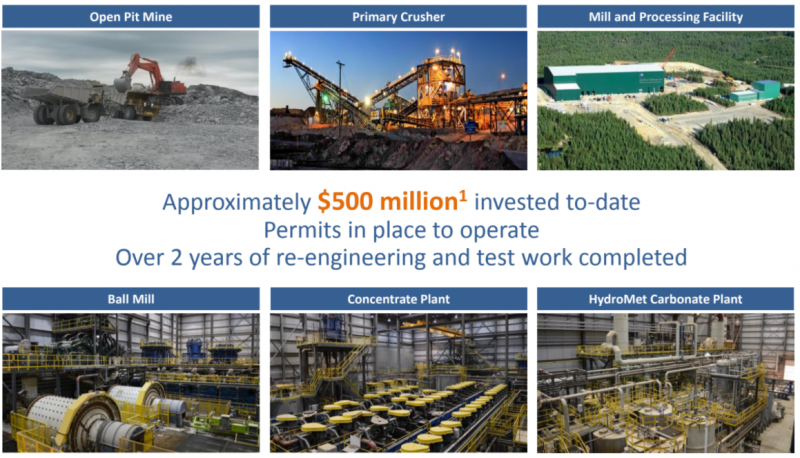
Previous work at NAL’s mine site revealed significant mineral resource estimates for a long operating life. As of May 2017, the company has measured resources of 13.5 Mt tonnes at 1.08 %Li2, indicated 25.8 Mt at 1.02 %Li2 for a total of measured and indicated of 39.3 Mt tonnes at 1.04 %Li2. Also as of May 2017, the site proved 11.9 Mt at 0.94 %Li2 and probable reserves of 8.9 Mt at 93 %Li2. Infill-drilling confirmed previous drilling data and the 2016 drill campaign shows potential to extend reserve life from material within current mining lease. Currently, the project is fully permitted, in possession of all permits/licenses to restart the mine, processing facility and tailings.
The amount of previous work, in addition to the size of the resource and the improved market demand for lithium prompted NAL to acquire the asset in 2016. NAL is a joint investment venture between Jien International Investments Ltd. and Investissement Québec. Jien has a successful track record in Québec, having invested $1.6 billion in Northern Québec nickel, copper and PGM producer Canadian Royalties Inc. (CRI). The company has strong relationships with China and other Asian markets with an experienced, Canadian-based operational, technical and finance team. Management has experience with turning around mines in Québec and a unique access to Chinese lithium converter markets.
NAL is led by Chief Executive Officer and Director, James Xiang. James Xiang has had a successful track record as an entrepreneur, investor and savvy rescue artist since immigrating to Canada in 2001. In 2005, Xiang began pursuing a career in the resource sector and successfully brought a China-based nickel-copper project, GobiMin Inc, to list on the TSX. In less than one and a half years, GobiMin’s market cap grew by 10 times. Under his management during the financial crisis of 2008, GobiMin was able to sell its main project to a Chinese firm in an all cash-deal which proved his ability to take advantage of both North American market and Chinese markets.
James Xiang was also instrumental in the turnaround of Canadian Royalties Inc. As the company’s CEO, Xiang re-built the company’s senior management and corporate strategy, which was work that ultimately led to a company turnabout that caught the attention of the market, especially Investissment Québec, which partnered with Xiang at NAL.
Future plans for the company include developing and completing the improvement of its existing lithium processing facilities, becoming a commercial producer of lithium carbonate, and looking for expansion and acquisition in Québec and globally.
- Several weeks ago, I surprised most investors by issuing my “Book Profits Now!” call for the precious metals asset class.
- When I did so, head and shoulders top formations immediately formed on gold and GDX, and prices have swooned.
- Rumours of a sudden drop in Indian dealer demand appeared to become a concern for commercial traders on the COMEX.
- India’s monsoon season has turned out to be a bit of a “bust”, with both flooding and drought. Farmers buy gold with a portion of their crop profits. With only another week or two left in the monsoon season, crop sales may not be very good.
- Of further concern to me was the fact that the demand drop was occurring as gold arrived at the $1352 resistance zone. That resistance was created by Modi’s cash call-in that took place in November of 2016.
- The upcoming Fed meeting will probably mark the end of the decline related to those concerns, but there could be additional weakness until the next US jobs report is released.
- Please click here now. Double-click to enlarge.
- For investors, this gold chart tells the entire tactical story. The $1270 – $1260 area is the target of the H&S top pattern.
- Investors should use a two-pronged strategy to profit from the coming rally that should take gold back to the “Call-In Day” resistance around $1352.
- I’ve outlined the $1315 – $1295 price area as the first key buy zone. Eager accumulators can buy right now.
- Janet Yellen’s handling of the imminent launch of quantitative tightening (QT) at this Fed meeting is critical.
- It will almost certainly determine whether gold bounces from the $1315 – $1295 buy zone or first proceeds down to the H&S target zone at $1260 -$1270.
- If gold moves to that lower zone, investors need to consider taking more aggressive buy-side action.
- That’s my personal strategy as well as my recommended one for gold bugs around the world.
- Please click here now. Double-click to enlarge this GDX chart.
- The technical picture for GDX is very similar to gold. Note the small but positive wedge pattern. I’ve highlighted it with thick black trend lines.
- While the target of the H&S top pattern is about $22.50 (similar to the $1260 – $1270 target for gold), the wedge formation could send GDX and most gold stocks higher from current price levels.
- Please click here now. Double-click to enlarge this US dollar versus Japanese yen chart. My important 14,7,7 series Stochastics oscillator is now overbought, and that’s happening just ahead of the Fed meeting.
- Heavyweight analysts at Japanese bank Nomura are predicting a collapse in the dollar down to the 105 – 100 target zone by the end of the year.
- That’s also been my target zone for quite awhile, and it’s because the dollar is trading in a rectangle between 108 and 114.
- The technical odds of a breakdown to 100 -105 are about 67%. Also, rallies tend to be week when oscillators become overbought quickly, and that’s what’s happening now.
- Please click here now. This chart tells the entire story for the precious metals asset class. It’s dramatically under owned, and there’s a beautiful double bottom pattern in play.
- Gold and associated assets are clearly poised for an enormous increase in institutional ownership. I call it “The Golden Wave”. This buying is not event-based. It’s based on portfolio allocation to gold as an asset class, and that means the buying will be sustained.
- Gold bugs around the world can use my key prices zones of $1315 – $1295 and $1260 – $1270 now to get tactically positioned in key gold stocks to surf the golden institutional wave!
Stewart Thomson is a retired Merrill Lynch broker. Stewart writes the Graceland Updates daily between 4am-7am. They are sent out around 8am-9am. The newsletter is attractively priced and the format is a unique numbered point form. Giving clarity of each point and saving valuable reading time.
Risks, Disclaimers, Legal
Stewart Thomson is no longer an investment advisor. The information provided by Stewart and Graceland Updates is for general information purposes only. Before taking any action on any investment, it is imperative that you consult with multiple properly licensed, experienced and qualified investment advisors and get numerous opinions before taking any action. Your minimum risk on any investment in the world is: 100% loss of all your money. You may be taking or preparing to take leveraged positions in investments and not know it, exposing yourself to unlimited risks. This is highly concerning if you are an investor in any derivatives products. There is an approx $700 trillion OTC Derivatives Iceberg with a tiny portion written off officially. The bottom line:
Are You Prepared?

On Monday Sept. 15, HIVE Blockchain Technologies Ltd. (TSX-V: HIVE) began trading on the TSX Venture Exchange. The company commenced mining operations and began accumulating cryptocurrency the same day. It is providing access to the seemingly complex world of cryptocurrencies in a traditional way, through the public markets. However, it is also providing investors a unique opportunity to get access to the blockchain technology that will change how business is done.
At the very core of the global economy are contracts, transactions and records which define the economic, political and legal systems people operate in. However, the global system has not kept paced with advancements in digital payments systems which is creating massive slowdowns and backlogs for transactions being processed through financial intermediaries; this will have to change.
Blockchain could solve this problem. The technology is at the heart of bitcoin. Blockchain is an open, distributed ledger that can track transactions between two parties in a verifiable and permanent way. The ledger is programmable to trigger transactions automatically.
In a digital world where increasingly two parties never meet and will never meet, there needs to be a way to ensure confidence and the origin of any agreement or payment. When Ronald Reagan was negotiating with Russia over a nuclear arms deal, he often quoted a Russian proverb: “trust but verify.”
Blockchain offers this and helps to remove and reduce much of the insecurity and necessary due diligence with a built-in verifiable method, allowing transactions to quickly proceed with confidence which improves the speed of business to match the booming digital economy.
With blockchain, contracts are embedded in digital code and stored in transparent and open databases, where they are protected from deletion, tampering, and revision.
Every agreement, process, task, and payment would have a digital record and signature that could be identified, validated, stored, and shared. Intermediaries like lawyers, brokers, and bankers might no longer be necessary. Individuals, organizations, machines, and algorithms would freely transact and interact with one another with little friction. Blockchain is a disturbed network, a peer-to-peer network that does not rely on a central authority because of its inherent security. Here lies the massive potential of blockchain technology.
Blockchain was introduced in 2008 as part of bitcoin, a virtual/digital currency that does not rely on a central authority such as a bank or government for issuing the currency, transferring ownership, and confirming transactions. Bitcoin and digital currencies are the first examples of blockchain technology.
E-mail enabled person-to-person messaging, bitcoin with blockchain accounting enables person-to-person financial transactions without going through a financial intermediary.
The development and maintenance of blockchain is open, distributed, and shared. A dedicated team of volunteers around the world maintains the software. Just like e-mail, bitcoin first caught on with a relatively small community. However, the community of supporters is changing as people are realizing the potential.
According to Marco Iansiti and Karim R. Lakhani writing in the Harvard Business Review, at the end of 2016 the value of bitcoin transactions was expected to hit $92 billion. That’s still a fraction compared to the $411 trillion in total global payments, but bitcoin is growing fast and increasingly important with instant payments and foreign currency and asset trading, where the present financial system imposes limitations.
According to a recent IBM study, one-third of C-level executives are using or considering adopting blockchain technology within their organizations. The study found that executives hope to enable new transaction applications that could help create trust, accountability and transparency among their organizations and partners.
Eighty percent of the 3,000 executives surveyed in the IBM study, indicated that they were using or considering blockchain either to develop new business models in response to a changing financial landscape. Furthermore, 71 percent of business leaders who are actively using blockchain believe that industry associations will play a key role in advancing the technology, suggesting widespread creation of industry standards.
The earlier a company is able to develop a business model around blockchain, the better they will be able to control its and its profitability.
Bank of America, JPMorgan, the New York Stock Exchange, Fidelity Investments, and Standard Chartered are testing blockchain technology as a replacement for paper-based and manual transaction processing in such areas as trade finance, foreign exchange, cross-border settlement, and securities settlement. The Bank of Canada is testing a digital currency called CAD coin for interbank transfers. According to the Harvard Business Review, there should be a proliferation of private blockchains that serve specific purposes for various industries.
All this is going to create massive demand for digital currencies to enable the blockchain infrastructure to work. However, there have been many campy and independent solutions created to mine digital currencies however the small scale limits their scalability and corporate adoption. The heavy data requirements limit the average user from mining without incurring massive expenses.
Industrial-scale mining is highly profitable even with cryptocurrency prices far below current levels. Professional-grade, scalable infrastructure is necessary to support a growing blockchain ecosystem.
In 2013, Marco Streng, a 29-year-old German mathematician, saw an opportunity for industrial digital mining and built a privately-owned cloud cryptocurrency mining company, Genesis Mining.
Crypto miners secure transactions on the blockchain and, in exchange for expending considerable computing resources to do so, are rewarded with newly minted cryptocoins.
Genesis’ customers purchase contracts that secure the computer processing power used to create Bitcoins or other cryptocurrencies like Ethereum. The processing power is produced in data centres built in remote northern locations (to keep the computers cool), with access to cheap electricity and great web connectivity. The company’s first industrial data centre was in Eastern Europe, with facilities added in Iceland, Sweden, and more planned locations.
Streng realized something was missing – accessibility. Many people won’t purchase Bitcoins or buy a cloud mining contract because of its complexities–both real and perceived, and yet these same individuals want to invest in what is fast becoming the future of banking and finance.
This is why one company, HIVE Blockchain Technologies Ltd. (TSX-V: HIVE) was created with the goal of building the leading listed blockchain company through the development and ownership of cryptocurrency mining infrastructure and other related blockchain businesses.
“The concept with HiVE is to give Genesis a footprint outside of the cryptocurrency world and build a bridge from the blockchain space to traditional capital markets,” commented Marco Streng said in an interview.
HIVE fills a gap in the equities markets by offering access to the growth of the blockchain sector in a traditional investment vehicle, shares. Shareholders gain exposure to both an operating cryptocurrency mining business and resulting cash-flow and price performance of a growing portfolio of cryptocurrencies generated from mining activities without having to select from the wide variety of currencies being developed.
HIVE is a partnership between Genesis Mining, the world’s largest cloud bitcoin mining company with over 700,000 customers, and Fiore Group, a leading Canadian merchant banking firm led by Frank Giustra, Gord Keep and Brian Paes-Braga.
Frank Holmes serves as the company’s non-executive chairman. Mr. Holmes is the founder and CEO of U.S. Global Investors, an award winning asset management firm specializing in gold and emerging markets.
Bjoern Arzt, Tobias Ebel, and Olivier Roussy Newton have also joined the board of directors of HIVE. Mr. Arzt and Mr. Ebel both advise Genesis and are Managing Partners of Logos Fund, a successful cryptocurrency mining investment fund based in Zug, Switzerland. Mr. Roussy Newton is an investment banker and entrepreneur focused on early stage blockchain and quantum computing firms.
Transformative applications of the blockchain are being developed and it is far from being a mature and established industry. But it makes sense to evaluate their possibilities now and invest in companies developing the technology for commercial purposes.
The long term value in blockchain will be most accretive when tied to a new business model in which to underlying value of the peer-to-peer frictionless transactions detaches from the short sighted use of blockchain for cryptocurrencies.
In the interim, HIVE technologies offers a safe and understandable route to participate and profit in digital currencies and from a technology that is in its formative stage which eventually will change how global payments are done.
The ground floor on blockchain technologies is here.
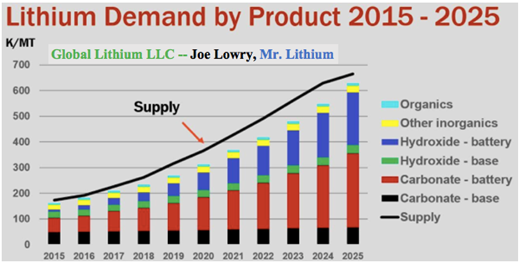
This is my 4th interview of “Mr. Lithium,” Joe Lowry. Do people still call him that? Following Joe’s advice by paying a pretty penny for his consulting services, or following him for free on Twitter and Linked-In, is one of the absolute best ways to stay on top of the lithium sector. Although Joe does not give investment advice, he sometimes issues PSAs, “public service announcements,” warning followers to be careful not to believe everything they read or hear about lithium juniors! (ask him what he thinks of the dozens of Li juniors heavily focused on projects in Nevada …. actually, don’t)
Still, reading between the lines, it’s been clear which names he has liked over the months and years. Lithium Americas (TSX: LAC) and SQM (NYSE: SQM) are prime examples. It’s truly worth one’s time to follow Joe. Consider that LAC shares have more than doubled from an early July low of C$0.78 (it closed at C$1.70 on September 15th) when rumblings suggested that SQM might not move forward on the LAC/SQM Cauchari-Olaroz project. Joe was among the first to squash those rumors, setting up what turned out to be a highly profitable buying opportunity. SQM is up 120% in the past 12 months (by comparison, the Global X Lithium ETF is up 54%, and the S&P500 Index 16%)
Another key takeaway from reading Joe’s real-time accounts of the lithium industry is that things happen, a lot of things, away from the U.S. & Canada. And, it’s not all about south America’s, “Lithium Triangle” either. China is incredibly important and Australia is a long-time and growing hotspot for hard rock Li mining. Joe has mentioned Chinese and Australian-listed companies that have also had tremendous performance over the past year, Ganfeng Lithium (SHE:002460) + 208% and Tianqi Lithium (SHE:002466) + 97%.
Joe is a fan of Australian-listed Galaxy Resources (ASX: GXY), a company a hard-rock operation in production in Australia, a world-class brine development project (Sal de Vida) in Argentina that has a Bank Feasibility Study on it, and a promising exploration project in Quebec, Canada near Nemaska’s (TSX: NMX) Whabouchi project. GXY is up 60% in just the past 3 months.
Reading my prior 3 interviews of Joe in preparation for this one was quite interesting. Consider what he said in June 2015,
“There’s already significant tightness in the upstream market (both carbonate & hydroxide) that will build over the next 24 months resulting in a significant price rise.”
Now, look at this price chart from Simon Moores’ group, Benchmark Mineral Intelligence,
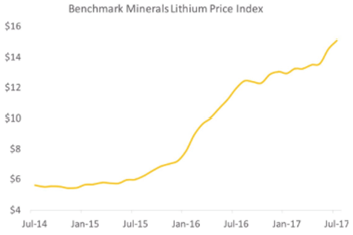
Notice what happened around June, 2015? I always learn a lot from interviewing Mr. Lithium, this time was no different. Please enjoy this latest masterpiece, my fourth, and view links to previous interviews at the bottom of the page. NOTE: (I have no prior or existing financial relationship with Joe Lowry or any of his business interests)
What has been the biggest change in your view of either demand or supply for the next 5 or 10 years?
Since mid-year when I have been asked to speak on lithium supply & demand, I say the following, ‘all the positive surprises have been on the demand side and the negative surprises on the supply side.’ I do a lot of expert consultant calls on the subject of lithium. These calls no longer dwell on the topic of demand — investors seem to recognize that electric transportation demand is real and significant.
The question now is more about speed of EV implementation. On supply, it has been great to see LAC, Pilbara Minerals (ASX: PLS) & Altura Mining (ASX: AJM) get funding, but the continued issues with Albemarle’s (NYSE: ALB) LaNegra II expansion, and Orocobre (ASX: ORE) ramping up to phase 1 capacity of 17,500 tonnes/yr. of lithium carbonate, are further evidence that lithium projects take time and have considerable execution risk.
While most agree with you & Simon Moores that Li prices will remain at or above $10-12k/tonne for years to come, what event(s) could cause prices to fall below $10k/tonne?
Oversupply, which isn’t likely to happen. Also, the global average cost of production is creeping up each year. Even Albemarle in the Atacama salar in Chile has significantly higher cash costs after agreeing to a new royalty regime this year.
What is the most important lithium industry topic that investors are not talking about?
The biggest issue with the retail investor is falling love with a company because its stock price is up, even if the company’s project is poor or marginal.
On the institutional side, many are asking the wrong questions and accepting what some major banks say, that is, in many cases, simply poor quality analysis. I have done calls with hedge funds and institutions that were only willing to look at ALB for a lithium investment. Juniors were not on the table for them because of their size or the exchange they are traded on. I always said to buy SQM, but would get some response about the CORFO issue. Look at the missed opportunity (up 120% in the past year).
Are you receiving more calls from investment fund managers lately? At what point on the investment spectrum are we on in terms of boom-bust / fear-greed, bubble / pop?
Since 2015, the rate I charge for expert consulting calls has tripled, while at the same time, the volume of calls coming in has also tripled. I say we are in, ‘lithium’s 15 minutes of fame‘ which may turn into a 15-year ‘super cycle.’
Companies you’ve spoken favorably on, companies like Tianqi, Ganfeng, SQM, and Lithium Americas are up between 87% & 208% in the past year. Can large lithium companies continue to vastly outperform market indices?
First, let me clarify, Tianqi should be at the end, not the beginning of that list. They have great assets but are not great operators like SQM & Ganfeng. In this cycle I bought SQM at $15/shr. and bought more shares up to $20. It’s at $58 as we speak. I started buying shares of LAC the week of the SQM JV deal in March of 2016. I was public about this only to prove that I, ‘eat my own cooking.‘ At this point in the cycle, SQM may be approaching full valuation, but in my opinion LAC is still significantly undervalued and has a lot of room to run.
NOTE: Howard Klein of RK Equity has excellent commentary on the perceived under-valuation of LAC, and a few other names. He publishes the Lithium-ion Bull newsletter. Twitter: @HowardKlein10
China’s announcement to ban gas & diesel cars is hardly a surprise, yet the market seems to have been blown away by this news. In what year do you think China will start phasing out ICE-powered vehicles?

Much of my business is directly tied to what happens in China. My opinion is that this announcement is both aspirational and significant. I take it as more of an indication that near-term policy decisions will support e-transportation & ESS growth. But, we could easily be talking five years from now about when China is going to turn that pronouncement into reality.
There are > 20 juniors with at least 1 owned or optioned Li brine property in Argentina. Lacking large sums of capital, some are planning to pump brine into evaporation ponds, then ship a 1%-2% Li concentrate to a larger player for processing. Is that a business model that could work?
This idea sounds good, but would be difficult to implement. Most brine assets have significant variations. Salars are dynamic – it’s not just about, ‘pumping brine into ponds‘; expertise is required to manage the mix of brines. This is true on the world’s best brine resource in Chile and wouldn’t be any easier with combined mediocre assets. Blending brines from several salars will increase processing complexity significantly. It may look good on a, ‘white board‘ and make for a good story for investors who don’t understand how lithium processing works, but I’m skeptical to say the least.
You comment periodically about FMC Corp., Albemarle & SQM. Please summarize your views on each.
SQM only fairly recently decided to go ‘all-in’ on lithium, as evidenced by the LAC and Kidman Resources (ASX: KDR) deals and their expansion in Chile. SQM is now the, ‘lithium superpower.’ Yes, they still have to work out issues with CORFO, but the Chilean government does not want to kill the golden goose.
Albemarle has great assets, but are, at best, mediocre operators. They have a very poor record of executing on capital projects. Their announcement on September 15th about new technology was a typical PR move, but likely lacks substance – they highlighted a technology that even they say is not ready for commercial use. ALB has issues with their brine operation that are starting to be recognized based on their limited output vs. SQM. In one sentence; ALB is a company run by a lawyer trying to compete in a world where operations are key.
FMC Corp. (NYSE: FMC) has allowed their franchise to atrophy by not investing in resource capacity. They have a very good, but small upstream operation in Argentina. They have a very old processing plant in North Carolina, and an old downstream plant in the UK. Their newly announced tolling operation is what I have called a ‘House of Cards‘ – your readers can find my posts on Linked-In. From a top 3 producer in years past, FMC will be #6 globally in LCE production in 2018.
Joe, I notice that you mention a company named Nano One, ticker NNO.v from time to time. What can you tell us about that company?
Nano One Materials (TSX-V: NNO) has an extremely interesting technology. The primary focus is to lower the cost of producing cathode by eliminating process steps. In addition, Nano’s process may enable the use of non ‘battery-grade‘ lithium materials in cathode production. Another benefit of the process is the ability to use lithium carbonate to produce high nickel compounds such as NCA that currently require lithium hydroxide.
SQM has operations or projects in Chile, Argentina & Australia. It’s been reported that they’re looking for a fourth jurisdiction to operate in. Any thoughts on where they are looking?
I have very clear thoughts on this, but I will keep them to myself. Clearly SQM is now “all-in” on lithium and part of what I call the, ‘Lithium Star Alliance‘ along with LAC, Ganfeng, Kidman & PLS (via Ganfeng’s interest)
You & Simon Moores say that the lithium supply chain is in need of funding from additional sources, presumably battery makers & EV manufacturers. Has there been any evidence of this yet?
Absolutely, there is evidence, but valuation is a major issue. I am speaking with interested parties across the supply chain (from cathode to car makers). The problem is that car and battery companies want to negotiate from strength and tend to be bullies when dealing with their suppliers. They are trying to price shop in a seller’s market. It will take time for them to realize the reality of the lithium market – lithium suppliers are in the driver’s seat.
Thanks Joe, very good stuff, as always. Great catching up with you!
Gold has surged dramatically to major breakouts since its usual summer-doldrums lows. That’s naturally rekindled interest in this leading alternative investment, despite the record-high stock markets. Investors are starting to return to gold again to prudently diversify their stock-heavy portfolios. That’s very bullish for gold, as investment capital inflows can persist for months or even years. This shift is most evident in GLD.
The American SPDR Gold Shares is the world’s leading and dominant gold exchange-traded fund. Since its birth way back in November 2004, it has acted as a conduit for the vast pools of stock-market capital to migrate into and out of physical gold bullion. The marginal gold investment demand, and sometimes supply, via GLD can be big and varies wildly. Thus GLD-share trading is often gold’s primary short-term driver.
The definitive arbiter of global gold supply and demand is the venerable World Gold Council. It publishes highly-anticipated quarterly reports called Gold Demand Trends. They offer the best reads available on global gold fundamentals. At first glance, it’s not apparent why gold-ETF demand plays such a massive role in driving gold’s price action. But digging a little deeper makes this crucial-to-understand relationship clearer.
According to the WGC, over the past 5 years from 2012 to 2016 jewelry demand averaged about 54% of overall global gold demand. Total investment demand including physical bars and coins in addition to gold ETFs averaged just 26%. Breaking that category down further into bars and coins separate from ETFs, they weighed in at averages of 28% and -2% of world gold demand respectively over the past 5 years.
The key to ETFs’ outsized impact on gold prices is in the extreme variability of their demand. Across that same span, total gold demand only varied 10% from the midpoint of its worst year to best year. For jewelry that variance ran 27%, as gold’s largest demand category is relatively inelastic to gold’s price. Variability for bar-and-coin investment was higher at 49%. But that’s still nothing compared to ETFs’ wild swings.
Global gold-ETF demand between 2012 to 2016 varied radically from a low of -914.3 metric tons in 2013 to a high of +534.2t in 2016! The percentages don’t work with a negative number, but that 5-year variance of 1448.6t is vast beyond belief. Despite global gold-ETF demand averaging just -2% of total world gold demand over that span compared to 54% for jewelry, in raw-tonnage terms ETFs’ variability ran 2.2x jewelry’s!
Gold prices are set at the margin, and capital inflows and outflows via gold ETFs dwarf changes in every other gold demand category. The extreme volatility in gold investment demand through ETFs from stock traders overpowers everything else. When stock investors are buying gold-ETF shares faster than gold itself is being bought, gold rallies. That investment buying fuels major uplegs and entire bull markets in gold.
The mission of gold ETFs including GLD is to mirror the gold price. But the supply and demand of ETF shares is independent from gold’s own. So when stock investors buy gold-ETF shares faster than gold is being bid higher, those share prices threaten to decouple to the upside. Gold-ETF managers only have one way to prevent this tracking failure. They issue new gold-ETF shares to offset that excess demand.
Selling new gold-ETF shares to stock investors raises capital, which is then plowed into physical gold bullion held in trust for shareholders that very day. This process effectively shunts excess demand for gold-ETF shares into the underlying gold market, bidding gold higher. Gold ETFs including GLD could not track the gold price if this mechanism for equalizing differential capital flows between them didn’t exist.
The opposite happens when gold-ETF shares are sold faster than gold itself is being sold. That forces the shares to disconnect from gold to the downside. Gold ETF managers avert that failure by stepping in to buy back those excess shares offered. They raise the capital necessary to sop up this excess supply by selling some of the gold bullion underlying their ETF. Gold ETFs are a capital conduit between stocks and gold!
Because of the massive size of the US stock markets, GLD capital flows are more important to gold than all of the other gold ETFs around the world combined. GLD’s managers are very transparent, publishing its physical-gold-bullion holdings daily. That offers a far-higher-resolution read on what’s going on in gold investment than the WGC’s quarterly fundamental reports. GLD’s holdings are the key to gold’s fortunes.
When GLD’s holdings are rising, that means American stock-market capital is flowing into the global gold market. When GLD’s holdings are falling, investors are pulling capital back out of gold. There is nothing more important for gold’s overall price trends than these GLD capital flows. From extremes gold-futures speculators can overpower GLD’s influence on gold from time to time, but these eclipsing bouts don’t last long.
I’ve actively studied GLD’s dominating influence on gold prices for many years now. The hard data on this is crystal-clear, as we’ll discuss shortly. But unfortunately many if not most speculators and investors in gold, silver, and their miners’ stocks still don’t understand this. You can’t really grasp what’s going on in gold, and therefore the entire precious-metals complex, if you don’t closely follow GLD’s holdings daily.
This week’s chart looks at GLD’s physical gold bullion held in trust for its shareholders superimposed over the gold price since 2015. When American stock-market capital is flowing into gold via differential GLD-share buying, gold rallies. When that capital heads back out, gold falls. These gold-investment trends often take many months to play out, and a major new GLD-share buying spree is just getting underway.
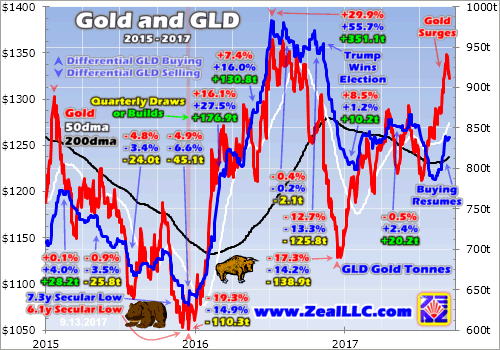
Like always in the markets, understanding what’s going on today requires perspective. If you don’t know where we’ve been and why, you’re not going to be right on where we’re going. I broke the performances in gold and GLD’s holdings into calendar quarters here for easier analysis. Back in late 2015, gold was pounded lower heading into the Fed’s first rate hike in nearly a decade in the terminal phase of a brutal bear.
In Q3’15, gold fell 4.8% on a 3.4% or 24.0t GLD draw. American stock investors continued jettisoning gold via GLD shares in Q4’15. In that bear-trough quarter, gold fell 4.9% on a 6.6% or 45.1t GLD draw driven by heavy differential selling of GLD shares. The resulting 7.3-year secular low in GLD’s physical-gold-bullion holdings held in trust for shareholders drove gold to a parallel 6.1-year low on the very same day.
Overall between late-January 2015 and mid-December 2015, gold plunged 19.3% on a 14.9% or 110.3t GLD draw. When American stock traders are paring their gold exposure by dumping GLD shares faster than gold itself is being sold, gold is going to head lower. Per the WGC, total 2015 gold demand slumped just 0.8% or 35.6t year-over-year. That was entirely due to total ETF demand falling 128.3t, led by GLD’s 66.6t drop.
But everything changed dramatically in early 2016 because the lofty US stock markets plunged sharply in their biggest correction since mid-2011. Stock investors generally ignore gold until stock markets start to sell off materially. Then they rush to redeploy in this ultimate alternative investment. Gold is effectively the anti-stock trade, a rare asset that moves counter to stock markets. So investment demand soars in selloffs.
After being universally despised in hyper-bearishness just a couple weeks earlier, gold demand started to return in January 2016. The leading S&P 500 stock index suffered a series of dramatic down days, including separate 1.5%, 2.4%, 2.5%, 2.2%, and 1.6% losses within weeks. So scared stock investors remembered gold, and started to flood back into GLD shares far faster than gold itself was being bid higher.
Their differential GLD-share buying single-handedly ignited a new gold bull! In Q1’16, gold rocketed up 16.1% on an epic 27.5% or 176.9t GLD build. According to the latest WGC Q2’17 GDT, total global gold demand in Q1’16 only rose 179.2t YoY. That means American stock investors’ heavy GLD-share buying alone was responsible for a staggering 98.7% of global gold demand growth! GLD’s gold-price influence is huge.
Q2’16 was similar, with gold powering another 7.4% higher on another big 16.0% or 130.8t GLD build. The WGC reports that worldwide gold demand only grew 134.7t YoY that quarter, so the GLD holdings build driven by stock investors’ differential share buying accounted for 97.1%! Love or hate GLD, the hard truth is gold’s new bull market never would’ve existed if stock investors hadn’t rushed into gold via that ETF.
In essentially the first half of 2016, gold had powered 29.9% higher on a stunning 55.7% or 351.1t GLD-holdings build. That gold surge naturally fueled much more investment buying, both in physical bars and coins and other gold ETFs around the world. But without that American stock-market capital flowing into gold through the GLD conduit, odds are little of that parallel buying would’ve happened. GLD is the key to gold.
Gold then stalled out in Q3’16 because new record stock-market highs slammed the door on GLD capital inflows. Stock investors generally want nothing to do with gold when stocks are soaring. And they did in the wake of the Brexit surprise on hopes for more central-bank easing. So gold just consolidated high that quarter, slipping 0.4% on a 0.2% or 2.1t GLD draw. Gold’s bull halted the moment differential GLD buying did!
GLD’s dominance reasserted itself in Q4’16, but going the other way. Opening up a direct gold conduit for the vast pools of stock-market capital is a double-edged sword. GLD’s holdings started plummeting in the wake of Trump’s surprise election victory. The resulting Trumphoria on hopes for big tax cuts soon fueled surging record stock markets. So investors once again felt no need to prudently diversify with gold.
That quarter gold plunged 12.7% on a 13.3% or 125.8t GLD draw. The WGC’s latest data shows global gold demand fell 117.3t YoY in that quarter. So the heavy differential GLD-share selling was responsible for more than all of it! For better or for worse, the rise of ETF investing to market dominance has made GLD the overpowering driver of gold’s fortunes. Nothing else has wielded such huge price influence in recent years.
Unfortunately many traditional gold investors and speculators still ignore GLD’s holdings. Many don’t like GLD because it’s paper gold, inferior to physical bars and coins held in your own immediate possession. I certainly empathize with that. I’ve been continuously recommending physical gold coins to all investors since May 2001 when gold was at $264. I’ve never recommended GLD shares to our subscribers as investments.
But regardless of whether you think GLD is an anti-gold conspiracy or a great new way to entice stock-market capital into gold, this behemoth can’t be ignored. Following GLD’s vast impact on gold prices has nothing to do with making a statement on its fitness. To be successful traders, we have to set our own emotions and opinions aside. All that matters is what’s driving the markets and why, not whether we approve.
Between gold’s early-July-2016 initial bull peak and its mid-December-2016 trough, gold plunged 17.3% on a 14.2% or 138.9t GLD draw. While that was a massive correction, it technically wasn’t a bear market because it didn’t cross that -20% threshold. This means gold has remained continuously in a young bull market since early 2016. And that bull has reasserted itself this year just as I predicted at its post-election bottom.
In Q1’17 gold indeed powered 8.5% higher out of those deep Trumphoria lows. But interestingly GLD capital flows weren’t a material factor, as this ETF only experienced a minor 1.2% or 10.2t build. Asians had stepped in to buy gold aggressively, usurping the gold-driving helm from American stock investors. It was remarkable gold climbed so much, as overall global demand fell 212.7t YoY. Q1 was something of an anomaly.
Some of that was unwound in Q2’17, the last quarter for which comprehensive gold fundamental data is now available. Gold slid 0.5% despite a 2.4% or 20.2t GLD build. That compared to overall world gold demand falling 102.3t YoY. Despite the record US stock-market highs driven by Trumphoria, American stock investors were bucking the global trend of selling gold-ETF shares. Overall ETF demand dropped 181.4t YoY.
But despite GLD apparently exiting gold’s driver seat, the red gold-price line above continued to generally mirror GLD’s holdings. The only reason GLD’s influence faded in the first half of this year is there wasn’t much differential buying or selling of GLD shares by American stock investors. The major Trumphoria stock rally left them largely indifferent to gold. That made room for other gold drivers to temporarily eclipse GLD.
Last year the absolute value of GLD’s quarterly holdings changes averaged 108.9t. But so far in the first couple quarters of 2017, that has collapsed 86% to a mere 15.2t average! Realize when stock investors start buying or selling GLD shares much faster than gold itself again, GLD’s dominance of gold’s price will come roaring back with a vengeance. Its extreme volatility overwhelmingly drives gold at the margin.
And that brings us to the current quarter where things are really getting interesting. Following that huge post-election draw, GLD’s holdings finally bottomed at 799.1 metric tons in late January. That low held until late July, when they started falling to a new post-election low of 786.9t by early August. That was the result of very-bearish sentiment fueled by gold’s usual summer-doldrums lows, its weakest time of the year.
Despite this summer seasonal lull being well-known, it inevitably freaks out traders. So they succumb to their fears and sell low at exactly the wrong time, right before gold’s major autumn rally. That started to power higher out of the early-July low right on schedule. But stock investors didn’t take notice until gold had already surged 6.4% higher to $1290 in just 5 weeks. Then they finally started buying GLD shares again.
GLD’s holdings initially bottomed on August 7th before stalling there for an entire week. The day after gold challenged $1290, August 14th, stock investors started to return. Their differential buying drove a 0.5% holdings build that day, the first in 7 weeks. That GLD-share buying pressure really accelerated in late August and early September, where separate major build days of 1.1%, 1.8%, and 1.1% were witnessed.
By September 5th, GLD’s holdings had powered 6.8% or 53.2t higher in less than a month! That helped drive a parallel 6.5% gold rally, catapulting it from $1257 to $1339 over that short span. These new gold capital inflows from stock investors via GLD are very exciting. This is the biggest and sharpest GLD build seen since well before the election, since back in Q2’16. Something big and very bullish is afoot in gold investment.
American stock investors are starting to return to gold despite the stock markets remaining near or at all-time record highs. There’s certainly been no correction or even series of major down days. Investors are returning to gold without that typical stock-selloff catalyst. And once swelling gold investment demand starts driving gold higher, its rally tends to become self-feeding and run for months on end before petering out.
Investors love chasing winners, nothing drives buying like higher prices. The more investors bid up gold through differential GLD-share buying, the more its price rallies. The more gold rallies, the more other investors want to join in to ride the momentum. Buying begets buying. To see this starting to happen in these euphoric stock markets is extraordinary. The inevitable overdue major selloff will supercharge gold buying.
These lofty Fed-goosed stock markets are long overdue for a major correction or more likely a new bear market. Once they roll over sooner or later here, gold investment demand is going to explode just like it did back in early 2016 during the last correction. That stock selling could start soon, as next week the Fed is widely expected to unveil quantitative tightening. That’s every bit as bearish for stocks as QE was bullish!
Resurgent gold investment demand will once again almost certainly propel gold dramatically higher, as it did in the first half of 2016. This bull market’s latest growing upleg can be played with GLD, but that will only pace gold’s gains. Far greater upside can be found in the gold miners’ stocks, where profits amplify gold’s gains. The gold stocks recently enjoyed major breakouts, but remain deeply undervalued relative to gold.
The key to riding any gold-stock bull to multiplying your fortune is staying informed, both about broader markets and individual stocks. That’s long been our specialty at Zeal. My decades of experience both intensely studying the markets and actively trading them as a contrarian is priceless and impossible to replicate. I share my vast experience, knowledge, wisdom, and ongoing research in our popular newsletters.
Published weekly and monthly, they explain what’s going on in the markets, why, and how to trade them with specific stocks. They are a great way to stay abreast, easy to read and affordable. Walking the contrarian walk is very profitable. As of the end of Q2, we’ve recommended and realized 951 newsletter stock trades since 2001. Their average annualized realized gain including all losers is +21.2%! That’s hard to beat over such a long span. Subscribe today and get invested before gold stocks really start running!
The bottom line is gold investment demand is resuming after its massive post-election slump. Differential GLD-share buying, the dominant driver of gold’s young bull, just enjoyed its biggest and fastest surge in over a year. American stock investors are starting to prudently diversify back into gold, despite the stock markets still near record highs. Worries are mounting that the long-delayed major stock selloff is looming.
When that fateful event inevitably arrives, gold investment demand is going to explode again just like it did in early 2016. That will catapult gold, silver, and their miners’ stocks dramatically higher. Seeing gold investment demand surge recently even without a stock-selloff catalyst highlights the big latent interest in gold. Usually moving counter to stocks, it remains the ultimate portfolio diversifier every investor needs to own.
Adam Hamilton, CPA
September 15, 2017
Copyright 2000 – 2017 Zeal LLC (www.ZealLLC.com)
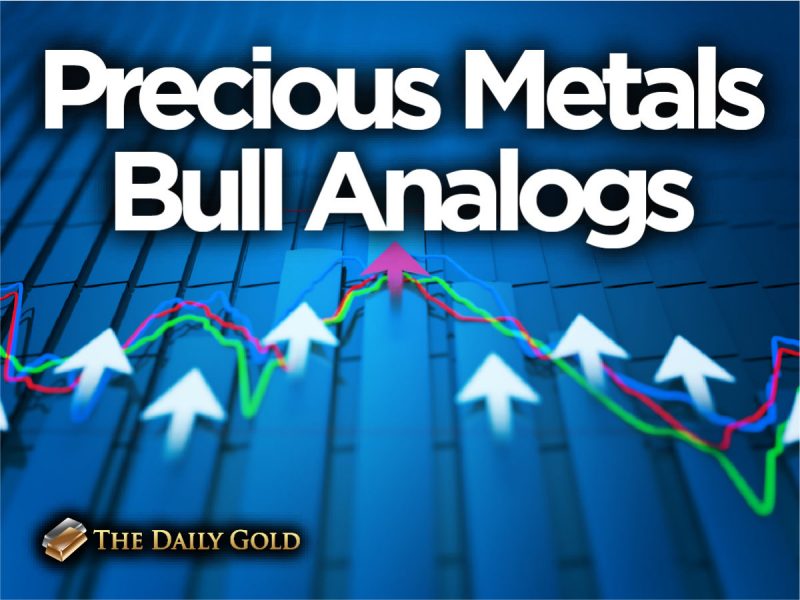
We started employing analog charts during the latter stages of the seemingly forever bear market in precious metals. Comparing current to past trends by using price data is not considered technical analysis but it is extremely valuable because history tends to repeat itself. It also helps us identify extremes as well as opportunities. For example, in 2015 it was clear the epic bear market in gold stocks was due for a major reversal. Today, precious metals appear to be in the early innings of a cyclical bull market and the analogs suggest there is plenty of room to run to the upside.
The first chart compares the current recovery in Gold to past recoveries. In recent quarters we had anticipated a similar, explosive rebound like in 2008 and 1976. However, with 18 months of evidence we can now say the current rebound most resembles the rebounds that started in 1985 and 2001. Both of those rebounds imply Gold could reach $1700/oz by Q4 of 2018. However, if Gold cannot takeout the resistance around $1375 then it could end up following the path of the 1993 rebound.
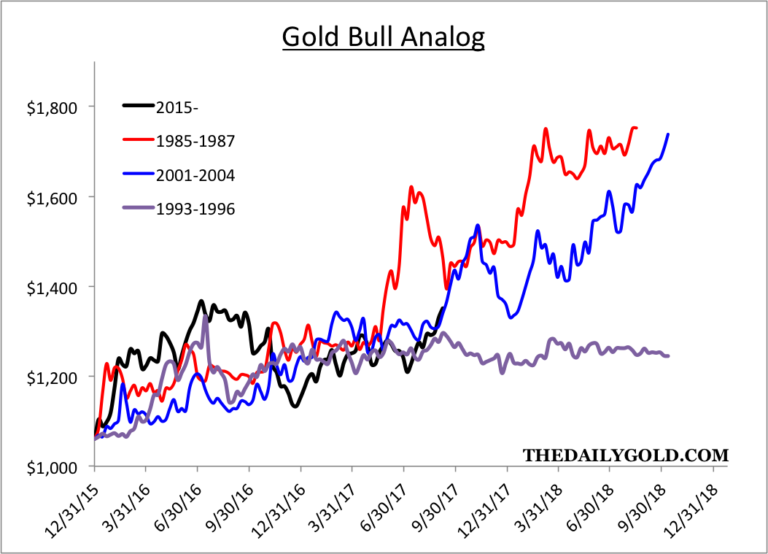
Next we look at the large cap gold stocks. The data is from the Barron’s Gold Mining Index (BGMI) which is one of the few indices with a multi-decade history. If one were to look at the HUI or GDM (parent index of GDX) it would show the gold stocks are currently behind the rebound that began in the fourth quarters of 2000 and 2008. Data from the BGMI implies the rebound in gold stocks is ahead of schedule. In a broader sense, the BGMI certainly has plenty of room to run as many of its bull markets have achieved 7-fold returns.
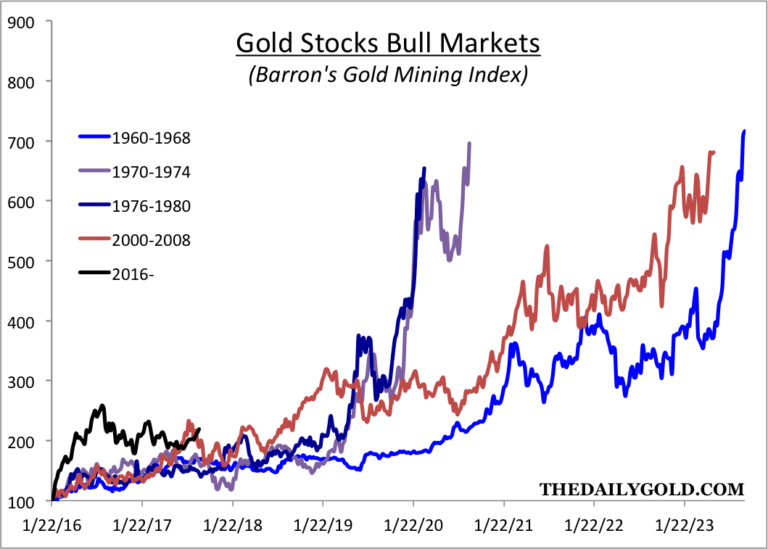
Next is an analog constructed from data from my custom junior gold indices. The juniors are currently right at the point where the 2001-2007 bull made a massive move higher over the next 12 months. The two bulls for comparison are a very long cycle (+6 years and less than 3 years). At worst, I’d expect this bull to last somewhere in between. If Gold makes a clean break above $1375/oz then I’d expect this bull to advance to the 14x peak the other bulls achieved before 2019.
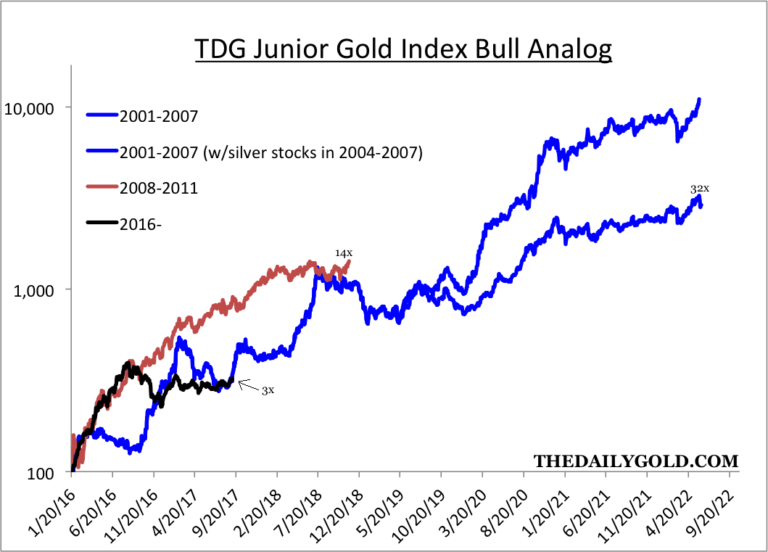
Finally, here is the TSX Venture Index. The three previous bulls averaged close to a 250% gain. The current bull is up roughly 60%. The gains for the overall index are muted as the index contains a large amount of worthless companies. Nevertheless, the bull market has plenty of room to run in terms of time and price.
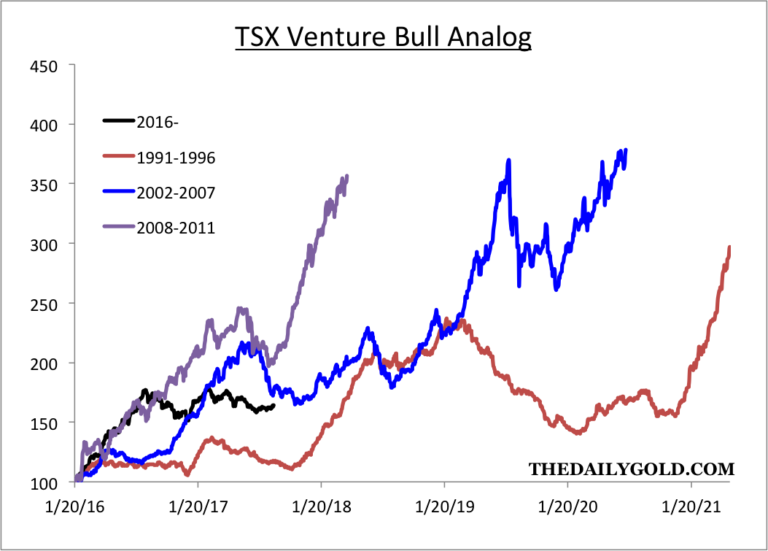
The analogs show that the current bull market in Gold, gold stocks and juniors is obviously in the early innings in both time and price. Interestingly, the analog for Gold and the junior gold stocks suggests there is the possibility of strong upside potential over the next 12 months. If Gold breaks above major resistance around $1375/oz, then the juniors and large gold stocks could realize that upside potential over the next 18 months. Although the fledgling correction in precious metals could continue and expand, the broader risk to reward is skewed to the upside. Therefore, we want to accumulate the best opportunities in the juniors on weakness. To find out the best buys right now and our favorite juniors for 2018, consider learning more about our premium service.
Jordan Roy-Byrne CMT, MFTA
Jordan@TheDailyGold.com
- It’s not easy to build wealth in any asset class. It’s even more difficult to retain it.
- On that golden note, please click here now. Double-click to enlarge this short term gold chart.
- Over the past week or two, my wealth building mantra has been, “Book profit now”. From a technical standpoint, the world’s mightiest metal has begun to show signs of “head and shouldering”.
- Head and shoulders top patterns are negative for the price, and it’s normal for them to appear when gold reaches strong resistance.
- Strong resistance is not created out of thin air. It’s created by major fundamental events.
- To view the ramifications of one of those events, please click here now. Double-click to enlarge.
- In November of 2016, many gold market players were buying gold aggressively as it became obvious that gold enthusiast Donald Trump had won the US election.
- The gold price spiked higher as Trump won, and then imploded when the Indian government’s shocking demonetization announcement ruined the party. Conspiracy buffs will find it very suspicious that the Indian demonetization announcement seemed to happen just minutes after Trump had won.
- Regardless, the Trump victory became bitter-sweet for Western gold bugs as they watched the gold price crash.
- From a technical perspective, the tremendous volume that occurred on demonetization night has turned the $1350 price zone into powerful resistance.
- The good news is that compared to the violence of the November sell-off, the current decline is very mild. I’m a light buyer now, and a much bigger buyer at $1308 and $1280, basis December futures.
- It’s important that investors wait for emotional discomfort before rebuying with size. The bottom line is that to build gold market wealth that is sustained, significant patience is required.
- Please click here now. Double-click to enlarge this dollar versus yen chart. The 108 area is the “line in the sand” for the dollar.
- That line in the sand has been severely tested, but so far it has held. When it fails, I expect gold to make a serious charge at major resistance in the $1377 – $1392 price zone.
- The SPDR fund (GLD-nyse) gold holdings have climbed to the 834 tonnes area during this gold price rally. I have suggested that the rise in tonnage is related to a“gold market game changer” mentality amongst a growing number of institutional money managers.
- They are not buying gold because of any particular market event (low real rates, Korea, the dollar index, etc), but because of a newfound respect for the precious metals as an investment asset class.
- Jeff Currie of Goldman Sachs recently suggested that physical gold ownership is a good idea and a key diversifier for equity market investors.
- Please click here now. Bank America is now quoted by Kitco News suggesting that a holding of slightly under 5% is beneficial for an equity portfolio.
- The big picture for gold is fabulous. In the past, a rising equity market was negative for gold. Now, a rising equity market forces money managers to buy more gold to maintain their fixed allocation percentage to it.
- Chinese and Indian money managers recommend higher portfolio allocations to gold than their Western counterparts. As they begin to dominate the market, I predict that the larger Chindian allocations will become “the new normal”.
- Also, Merrill notes that Chinese jewellery demand is soft. That’s normal at this time of year, and my Chinese jewellery stocks are making multi-year highs. These stocks are key lead indicators for Western gold/silver mining stocks, and they are flashing big green lights.
- Please click here now. GDX has had a fabulous summer rally. Given the $1350 gold market resistance and the arrival of GDX itself at my $25 – $26 target zone, a pause in the action is normal.
- Once the consolidation ends, I expect GDX to charge towards $28 – $29. I’m also predicting that the next stage of the rally will be much broader, with many of the more speculative junior stocks joining the upside fun in a much bigger way than they have so far.
- Please click here now. Double-click to enlarge. Silver is also poised for a very big move higher. It’s carving out a beautiful inverse head and shoulders bottom pattern, and an upside breakout should coincide with gold surging above $1392!
Stewart Thomson
Graceland Updates
https://www.gracelandupdates.com
Email:
Risks, Disclaimers, Legal
Stewart Thomson is no longer an investment advisor. The information provided by Stewart and Graceland Updates is for general information purposes only. Before taking any action on any investment, it is imperative that you consult with multiple properly licensed, experienced and qualified investment advisors and get numerous opinions before taking any action. Your minimum risk on any investment in the world is: 100% loss of all your money. You may be taking or preparing to take leveraged positions in investments and not know it, exposing yourself to unlimited risks. This is highly concerning if you are an investor in any derivatives products. There is an approx $700 trillion OTC Derivatives Iceberg with a tiny portion written off officially. The bottom line:
Are You Prepared?
The November 1991 discovery of diamonds in the Northwest Territories by Chuck Fipke and Stu Blusson put Canada on the global diamond map. It also triggered one of the largest staking rushes in the world, as hundreds of companies hurried north to find treasure.
A few years later, many had retreated to warmer climes. One company that remained in the hunt was Gren Thomas’s Aber Resources, with a large land package staked by Thomas and partners at Lac de Gras near the Fipke find. In the spring of 1994, an Aber exploration crew led by Thomas’s geologist daughter, Eira Thomas, raced the spring melt to drill through the ice in search of kimberlite — the rock that sometimes hosts valuable diamonds.
It was a longshot. Since the Fipke find, the great Canadian diamond hunt had virtually ground to a halt — despite the millions of dollars spent in search of the glittery stones. But the drill core from that final spring hole had a two-carat diamond embedded in it. The Diavik discovery meant it was game on for Aber — and Canada’s nascent diamond industry.
DIAMOND POWER PLAYER
A quarter century after that fateful hole was punched through melting ice, Canada punches above its weight in the world of diamonds. Measured by value, the country is the third largest producer of diamonds by value globally. And the valuable diamonds that continue to be unearthed at the Diavik mine discovered by Aber are a big reason why.
The discovery unleashed a wave of shareholder value. The shares of Aber and its successor companies went from pennies to more than $50 as the quality of the diamonds and the asset became known. Dominion Diamond Corp., as Aber is now known and which owns the Ekati mine and 40% of Diavik, is Canada’s premiere diamond company. Diavik is expected to produce about 7.4 million carats this year, making it among the world’s largest diamond operations.

The team behind the Diavik discovery has also created a fair amount of shareholder value in the years since, led by Eira Thomas. She has co-founded two diamond players, Stornoway Diamond Corp. and Lucara Diamond Corp., and remains a director of the latter Lundin Group company. Her most recent gig, as CEO of Kaminak Gold, ended rather well — Goldcorp bought the company for $520 million last year.
Thomas is also an advisor to North Arrow Minerals (NAR-V), a cashed-up junior company at the forefront of Canadian diamond exploration. Aber’s Gren Thomas is North Arrow’s chairman and the CEO is Ken Armstrong, a former Aber and Rio Tinto geologist. North Arrow recently raised $5 million to explore its portfolio of projects and a drill program is underway at its advanced-stage Naujaat project, which hosts a population of valuable fancy orangey yellow diamonds.

In a space with few new discoveries or development projects, Canada is home to two of the world’s new diamond mines. Stornoway’s Renard mine in Quebec and Gahcho Kue, a De Beers-Mountain Province joint venture in the Northwest Territories, have both recently begun commercial production.
Globally, the diamond industry has faced headwinds, including India’s demonetization and choppy rough stone prices. But diamonds remain a money maker for some of the world’s largest mining companies, including Rio Tinto (60% owner of Diavik) and Anglo American. Incoming Rio boss Jean-Sebastien Jacques identified diamonds as a “priority area” last year in a Bloomberg interview: “I would love to have more diamonds, to be very explicit.” The company recently backed up those words by signing a three-year, $18.5-million option on Shore Gold’s Star-Orion South diamond project in northern Saskatchewan.
And Anglo’s De Beers division remains a reliable profit generator. In 2016, rough diamond sales surged for both Anglo American (up 36%) and Russian producer Alrosa (up 26%), according to The Diamond Loupe. A recent hostile takeover bid for Dominion Diamond reflects the demand for well-run diamond mines, which are powerful profit machines.
EXPLORATION DEFICIT
The picture is less promising on the exploration front. Budgets dried up during the mining slump that began in 2011, and little grassroots exploration work is being done. It’s particularly problematic for supply because diamond mines take longer to discover, evaluate and build. The new Canadian mines will help fill the gap, but it won’t be enough. Economic diamond discoveries have simply not kept pace with mine depletion, globally.
“There are definitely a lack of new projects, at least new projects that are close to infrastructure,” said Paul Zimnisky, a New York-based independent diamond analyst. “There really is not much at all in the global diamond production pipeline.”
Economic, world-class diamond projects are few and far between, and most exploration companies looking for them have failed, Zimnisky explained. That has resulted in wariness and declining interest among investors: “In general, shareholders have not done well in diamonds.”
The looming supply deficit is particularly acute for rare coloured diamonds, which fetch higher prices. Australia’s Ellendale mine produced an estimated 50% of the world’s fancy yellow diamonds before closing in 2015. The Argyle mine, also in Australia, is one of the world’s biggest mines and a source of valuable coloured diamonds, including extremely rare pinks. It, too, is slated to close in the coming years, after decades of production.
North Arrow’s Naujaat could help fill the void. The project hosts a population of fancy orangey yellow diamonds that are more valuable because of their rarity. Naujaat is on tidewater, which dramatically reduces costs, and hosts a very large diamondiferous kimberlite, Q1-4, that outcrops on surface.
It’s the focus of this year’s $3.2-million program, which will see North Arrow drill 4,500 metres and collect a 200-tonne mini bulk sample. The goal is to extend the Inferred resource to a depth of at least 300 metres below surface and better define the diamond population. The sample will be shipped south in late August and processed in the fall.
“There is excellent potential to extend the Q1-4 kimberlite at depth, beyond the reach of past drilling efforts,” said North Arrow CEO Ken Armstrong. “It’s the first drilling in more than 12 years. The work will help us confirm and update the size of Q1-4 and improve our understanding of the deposit’s internal geology and diamond distribution.”
In 2014 and 2015, North Arrow collected a small bulk sample at Naujaat (formerly known as Qilalugaq) with the goal of gauging diamond values. But the carat values on the small 384-carat package came in significantly below expectations. North Arrow shares were relegated to the market penalty box and the company has been largely under the radar since, despite important background work that set the stage for this year’s program.
RISK AND OPPORTUNITY
Contrarian investing and the ability to time cycles can lead to fortunes in the junior mining sector. Vancouver investor Ross Beaty has proven it, time and again. In the early 2000s, with copper trading for under US$1 a pound, his team assembled a portfolio of unwanted copper assets in a bear market. He developed and sold those projects during bull markets, turning $170 million in invested capital into shareholder returns of $1.87 billion. His latest win was a large bear-market investment in Kaminak Gold, later bought out by Goldcorp.
Beaty’s latest contrarian bet is on North Arrow, through a $2-million investment that was part of the recent $5-million private placement financing. Other investors included the New York-based Electrum Strategic Opportunities Fund ($2 million) and company management and directors. The money will fund an aggressive program at Naujaat including drilling and a bulk sample, as well as exploration at North Arrow’s Mel, Loki and Pikoo projects.
North Arrow also has exposure to drilling through the LDG (Lac de Gras) joint venture with Dominion Diamond Corp. That project borders on the mineral leases where Diavik is located. Ekati is 40 kilometres to the northwest. Dominion plans to drill several targets later this summer as part of a $2.8-million exploration program. North Arrow will have a 30% interest in the JV.
With a target on its back, Dominion is highly motivated to enhance shareholder value. And that extends beyond mine operations to exploration and new discoveries. In May, Dominion announced a “renewed strategic focus on exploration” and a $50-million, five-year exploration budget.
A FANCY EDGE
As for Naujaat, North Arrow is revisiting the project after a polishing exercise yielded fancy yellow diamonds that turned some heads in the industry. Several were certified “fancy vivid” diamonds, a coveted designation in the coloured diamond world. The quality of the polished stones suggests the fancy orangey yellow diamonds at Naujaat are considerably more valuable than the June 2015 valuation of the roughs indicated.
The primary conclusion of the diamond evaluators was that the 384-carat parcel of Naujaat diamonds was too small to properly evaluate. North Arrow plans to remedy that, in part, by collecting a 200-tonne bulk sample that should yield another 80 to 100 carats. The sample will be taken from the kimberlite’s highest-grade zone, A61. Lab results are expected in early 2018.
Another complicating factor at Naujaat is the presence of two distinct diamond populations of different ages, including a population of rare fancy yellow diamonds. It’s a consideration that was not factored into the prior carat valuation. It will be next time. Diamonds are a rarity play, and diamonds that occur less frequently — such as coloured diamonds and large diamonds — are more valuable. Yellow diamonds made up only 9% of the 2015 Naujaat sample by stone count, but more than 21% by carat weight.
The drilling at Naujaat is targeting kimberlite between 200 and 300 metres in order to bring material designated target for future exploration (TFFE) into the Inferred category. That drilling, plus the mini bulk sample, should help North Arrow better evaluate the diamond deposit on the path to a future Preliminary Economic Assessment. The Q1-4 kimberlite has a horseshoe shape that makes it amenable to open-pit mining and a low strip ratio. A larger bulk sample is planned for 2018.
COLOURED CARATS
Fancy yellow diamonds were thrust into the spotlight earlier this month when Dominion unveiled the striking 30.54-carat Arctic Sun, a fancy vivid yellow diamond cut from a 65.93-carat stone unearthed at Ekati. Dominion also played up coloured diamonds in their latest corporate presentation — specifically, the sweetener effect of high-value fancy yellow and orange diamonds at Misery.

The potential emergence of Canadian coloured diamonds could help solidify Canada’s position on the world diamond stage, according to analyst Zimnisky. On the branding and marketing side, Canadian diamonds continue to have strong appeal because of their high quality and ethical sourcing.
And the two recent Canadian mine openings are a bright spot for the global industry, despite early growing pains at both Gahcho Kue (lower-than-expected values) and Renard (breakage), he pointed out.
“There is absolutely an opportunity to sell Canadian diamonds at a premium, especially in North America,” Zimnisky said. The United States remains the world’s largest diamond market, despite the growth in demand from China and India.
Important hurdles remain before any mine is built at Naujaat, but the strength of North Arrow’s management team bodes well for success, according to Zimnisky.
“North Arrow is looking for something world-class and it’s high-risk, high-reward,” said Zimnisky, who has seen the company’s cut and polished fancy yellow diamonds: “They’re beautiful.”
The appetite for fancy yellow and other coloured diamonds remains strong, despite the closure or pending closure of two of the mines that produce many of them. Last year a De Beers store opened on Madison Avenue in New York, Zimnisky said, and the feature diamond on opening day was a diamond necklace with a very large fancy yellow stone of more than 100 carats.
DISCOVERY POTENTIAL
Further north of Naujaat on Nunavut’s Melville Peninsula is another North Arrow project with a good shot at a kimberlite discovery. At the Mel property, 210 kilometres north of Naujaat, North Arrow geologists have narrowed down and defined three kimberlite indicator mineral (KIM) trains through systematic soil sampling over several seasons. Last year’s till sampling defined where the KIM train is cut off, suggesting the bedrock kimberlite source is nearby.
The discovery of a new kimberlite field this season is possible, since kimberlites in the region outcrop at surface. “It’s a first look, but there’s potential for discovery without drilling,” says CEO Ken Armstrong.
As for the Lac de Gras joint venture, the US$1.1-billion hostile takeover bid for Dominion unveiled by the private Washington Corp. earlier this year may work in North Arrow’s favour. In addition to spurring a stock surge, the bid forced the diamond miner to crystallize its focus on creating shareholder value. And a key strategy for Dominion, with its two aging mines, is a renewed exploration push.
Finding new diamondiferous kimberlites in proximity to its existing operations would be a big boost for Dominion. One of its best shots is through the joint venture with North Arrow, which covers 147,200 hectares south of Ekati and Diavik. Dominion is spending $2.8 million on the project this season, including a planned drill program in the fall. North Arrow is well-positioned to capture the value of any Dominion kimberlite discoveries made.
North Arrow also plans to drill two or three promising kimberlite targets at its nearby 100% owned Loki project, dovetailing with the completion of the LDG drilling. The company has received a $170,000 grant from the Northwest Territories government to drill Loki. North Arrow will also conduct till sampling in the fall at Pikoo, its Saskatchewan diamond discovery, in advance of a potential early 2018 drill program.
Disclosure: Author owns shares of North Arrow Minerals. North Arrow is one of three company sponsors of Resource Opportunities, helping keep subscription prices low for the subscriber-supported newsletter. North Arrow Minerals is a high-risk junior exploration company. This article is for informational purposes only and all investors need to do their own research and due diligence.

The gold stocks are off to the races again, with big gains mounting. They just staged major breakouts, shattering a vexing consolidation that had trapped them for an entire year. Such momentum early in gold’s strong season is a very-bullish portent. As higher prices improve both technicals and sentiment, buying begets more buying. With gold-stock prices still quite low in secular terms, their upside remains huge.
Gold stocks are a small contrarian sector without a wide following. So their latest surge has surprised many investors and speculators. But it shouldn’t have. In the markets knowledge is profits, so staying informed about gold stocks’ fundamentals, technicals, and sentiment is crucial. The traders who did their homework this summer and bought in low when few others were willing are now sitting on fat unrealized gains.
Nearly every summer like clockwork, gold stocks slump to a summer-doldrums low. Gold miners’ profits and hence ultimately stock prices are driven by prevailing gold prices. And gold investment demand has always tended to slump seasonally in summers. On July 7th, the flagship HUI NYSE Arca Gold BUGS Index, which is closely mirrored by the leading GDX VanEck Vectors Gold Miners ETF, hit a demoralizing low of 178.9.
The gold-stock sector was down 1.9% YTD in a year where gold had rallied 5.4% over that span. That very day, I published an essay titled Gold Stocks’ Summer Bottom. I explained why summer gold-stock weakness is a great buying opportunity, concluding “So smart contrarians willing to fight the herd to deploy when it’s unpopular are subsequently richly rewarded when gold stocks’ seasonal rallies march much higher.”
From that typical summer-doldrums low, the HUI has already surged 21.7% higher as of this week! But sadly not many traders rode that whole rally, as most people hate buying low. In early August when just a third of gold stocks’ recent rally had happened, I wrote another essay explaining gold stocks’ bullish autumn seasonals. This sector has always tended to rally sharply with gold from summer lows into late September.
A week later when less than half of gold stocks’ latest surge was accomplished, I dug into their technicals to illustrate why this sector was a coiled spring. The gold stocks had just peeked their heads above their key 200-day moving average, and major breakouts were imminent. Now a month later they have indeed come to pass just as expected. These big breakouts were highly probable, leading to big profits for the informed.
Now it’s important for all investors and speculators to understand these major breakouts’ significance and implications going forward. Such events are very bullish, happening early in major new uplegs. This first chart looks at HUI technicals since early 2016, when a new bull market in gold stocks was birthed out of extreme secular lows. Today’s breakouts are the biggest and most important since February 2016, super-bullish.
Back in mid-January 2016, the gold stocks were universally despised and bearishness was off the charts. They were battered to fundamentally-absurd 13.5-year secular lows, trading at levels last seen when gold was near $305. Yet it was actually 3.6x higher at $1087! Gold-stock prices couldn’t stay radically disconnected from their underlying earnings fundamentals forever, thus that incredible anomaly couldn’t last.
So gold stocks reversed hard and took off like rockets, blasting the HUI 182.2% higher in just 6.5 months! That certainly left them very overbought last summer, which I warned about at the time. So they started correcting, which is perfectly normal in all bull markets. But that healthy correction snowballed to truly monstrous proportions thanks to another epic anomaly. Trump’s surprise election victory indirectly crushed gold.
Gold investment is so important in all portfolios because gold tends to move counter to stock markets, which is rare. Gold is effectively the anti-stock trade, the ultimate portfolio diversifier. So the incredible Trumphoria stock-market surge in the election’s wake decimated gold investment demand. That dragged the gold stocks far lower than they deserved to be fundamentally. The HUI plunged 42.5% in 4.4 months.
That left this small sector seriously out of favor as 2016 wrapped up, which was ridiculous. Despite an ugly Q4, the HUI still blasted 64.0% higher last year! Gold stocks were the best-performing sector in all the stock markets, yet traders foolishly shunned them. That irrational hyper-bearish sentiment in the wake of the post-election gold rout bled into 2017. That trapped the gold stocks in a vexing consolidation.
It is readily evident in this chart, the triangle pattern running for an entire year until recent weeks. The gold stocks enjoyed some big rallies with gold, but they sequentially failed at lower highs. That really spooked technically-oriented traders. But the action wasn’t wholesale bearish, as the gold stocks per the HUI were generally carving higher lows as well. The result was this massive triangle consolidation pattern.
Unfortunately there wasn’t much hope of a breakout during the summer. Gold’s summer doldrums lead to parallel sideways action in gold stocks in most summers. For gold-stock investors, summers are just something to be endured. They usually end up being barren sentiment wastelands where traders give up on this sector entirely. So material gold-stock gains in summers are rare, they can’t be expected in any year.
The HUI drifted 3.5% lower in June, really damaging sentiment. This was much weaker than normal in early summers, as the HUI saw average gains of 1.2% in Junes in the modern bull-market years of 2001 to 2012 and 2016. Even the HUI’s 5.6% rebound in July, far better than its 0.7% average losses, wasn’t enough to restore sentiment. So the gold stocks generally drifted lower this summer within that same triangle.
Interestingly the upper resistance line of that big chart pattern closely paralleled the HUI’s important 200-day moving average. Chart patterns like this triangle consolidation are subjective, they can be drawn in different ways. So while the general resistance line was evident to all technically-oriented traders, the timing on a breakout wouldn’t be universally recognized. But 200dmas are hard mathematical constructs.
200dmas are the most-important and widely-followed technical lines in all the markets. They smooth out the daily volatility to highlight long-term trends. Prices below their 200dmas are often considered to be in bear markets, leaving traders expecting further weakness. But once prices forge decisively above their 200dmas, traders assume they are reentering bulls. That generates bullish psychology which fuels buying.
The HUI first started flirting with its 200dma again in late July. But it wasn’t until mid-August when it started to break out decisively, closing more than 1% above that key level. And those gains weren’t solidified until late August, when traders started to realize this 200dma breakout was the real deal and not a head fake. That 200dma breakout in recent weeks is the most important of the new major gold-stock breakouts.
But because the upper resistance line of that vexing triangle consolidation paralleled the HUI’s 200dma, a simultaneous breakout from that chart pattern happened. Gold stocks have not rocketed above their bull-bear-psychology-dividing 200dma, or broken a major downtrend resistance line like this, since February 2016. And that was early in a monster upleg where this sector would nearly triple in just over a half-year!
Major breakouts are so darned bullish because they soon become self-feeding. The great majority of investors and speculators aren’t contrarians, they lack the discipline and toughness to fight popular fear and buy low. Instead most prefer chasing momentum, buying where gains are already happening. So breakouts quickly shift sentiment to bullish which drives a lot more buying. And that buying expands the breakouts.
In all markets, buying begets buying. The faster prices rise, the more traders want to buy in to ride the momentum. The more traders buy in, the faster prices rise. Major breakouts kindle this virtuous circle of buying, leading to big and growing capital inflows. Everyone loves winners, and these major gold-stock breakouts are leading to the best gains in the entire stock markets. Traders are increasingly taking notice.
All this gold-stock buying in recent weeks is just now triggering the most-important technical buy signal of all, the fabled Golden Cross! Golden Crosses are one of the most-powerful and most-widely-followed signals of new bull markets. They happen coming out of lows as a 50dma crosses back above a 200dma. As the white and black lines in this chart show, the first Golden Cross since early 2016 is triggering right now.
That last Golden Cross in February 2016 led to months on end of big capital inflows into the beaten-down gold stocks. This week’s second Golden Cross ought to lead to a similar outcome. Recent weeks’ major breakouts have just flashed an irresistible major buy signal to technically-oriented traders. Whether this is the second major upleg of last year’s bull or an entirely new bull, gold stocks are early in a major rally higher.
Their upside from here remains huge. That short-term chart above makes it appear like gold-stock prices are getting to the high side, but nothing could be farther from the truth. This next chart zooms out to the massive gold-stock bear that started in late 2011. The small shaded zone in the lower right is the entire area of the first chart. After a brutal secular bear persisting for years, gold stocks’ bull remains little and young.
Between September 2011 and January 2016, the gold stocks as measured by their flagship HUI index plunged a breathtaking 84.1% in 4.4 years! That colossal bear was driven by an extreme anomaly. The Fed’s radically-unprecedented open-ended QE3 campaign levitated the US stock markets, slaughtering demand for alternative investments led by gold. The gold stocks plummeted on massive gold dumping.
They finally bottomed in epic despair early last year, heralding a new bull market. It soon staged major breakouts from two separate bear-market resistance lines, which are rendered here. That young gold-stock bull rocketed higher, leading to that near-triple in about a half-year. But despite those wicked-fast gains, the gold stocks merely hit a 3.2-year high. At best they were only back to mid-2013 deep-bear levels.
Even after these major breakouts of recent weeks, the gold-stock sector is still languishing way down at late-bear levels from late 2014. Bull markets after exceptional bears usually see prices at least revisit the previous bull’s top, which was 635.0 on the HUI in September 2011. That implies huge upside of 196% remains from even this week’s levels. What other sector in these overvalued stock markets has tripling potential?
But if fundamentals are strong enough after exceptional bears to support symmetrical bull markets, those tend to ultimately drive prices to new all-time record highs. I strongly suspect gold stocks’ current bull will run for years, eventually pushing the HUI above its previous peak. That would take a total gold-stock bull of just 531% from gold stocks’ deep 13.5-year secular low in January 2016. That’s nothing by this sector’s standards.
During gold stocks’ last secular bull from November 2000 to September 2011, the HUI skyrocketed an epic 1664% higher! That made early contrarian investors including our subscribers rich. We only need to see a bull a third as large to propel the HUI back to new all-time record highs. And the gold miners’ fundamentals already support secular-bull-level gains, as evidenced by their latest quarterly results just reported.
Gold-mining profitability is simply the difference between prevailing gold prices and operating costs. In Q2’17, the elite gold miners of that leading GDX gold-stock ETF reported average all-in sustaining costs of just $867 per ounce. That was already $391 below Q2’s average gold price, pure profit. And at this week’s higher $1339 gold levels, those major-gold-mining profits have already ballooned to a hefty $472!
The smaller mid-tier gold miners of the related GDXJ junior-gold-stock ETF looked nearly as good in Q2, with average AISC of $879. That implies big profitability of $460 per ounce at this week’s gold prices. These fat margins coupled with the low gold-stock prices have left many gold miners trading at low price-to-earnings ratios today. This sector is wildly undervalued fundamentally, supporting a new secular bull market.
Thus odds are the major gold-stock breakouts in recent weeks are merely the beginning of a massive new gold-stock upleg. As gold stocks keep powering higher, more and more investors and speculators will want to buy in to chase those gains. Their capital inflows will push this small sector higher still, widening its circle of appeal to even more traders. Once gold stocks finally get moving, they tend to run for a long time.
Since most traders inexplicably choose to be uninformed, the bullish implications of these major gold-stock breakouts still aren’t widely known. So it’s certainly not too late to buy in, even though big gains have already been won since summer. Gold stocks’ strong season tends to run from now until next spring, driven by gold’s own strong season. The gold stocks will likely be considerably higher by year-end.
This young new upleg should get supercharged as gold investment demand surges when the stock markets inevitably roll over. With the Fed on the verge of starting to reverse its quantitative easing that levitated stock markets for years with ominous quantitative tightening, that long-overdue major stock-market selloff is likely sooner rather than later. As gold is bid higher on weaker stocks, gold stocks will soar.
The greatest gains in this young gold-stock upleg won’t be won in the popular ETFs like GDX and GDXJ, as they are far-overdiversified and burdened with way too many under-performing gold miners. So it’s much more prudent to deploy capital in the best individual gold miners with superior fundamentals. Their gains will handily trounce the ETFs, further amplifying the already-huge upside potential of this sector as a whole.
The key to riding any gold-stock bull to multiplying your fortune is staying informed, both about broader markets and individual stocks. That’s long been our specialty at Zeal. My decades of experience both intensely studying the markets and actively trading them as a contrarian is priceless and impossible to replicate. I share my vast experience, knowledge, wisdom, and ongoing research in our popular newsletters.
Published weekly and monthly, they explain what’s going on in the markets, why, and how to trade them with specific stocks. They are a great way to stay abreast, inexpensive and easy to read. Walking the contrarian walk is very profitable. As of the end of Q2, we’ve recommended and realized 951 newsletter stock trades since 2001. Their average annualized realized gains including all losers is +21.2%! That’s hard to beat over such a long span. We currently have unrealized gains on our trading books as high as +159%. Subscribe today and get invested before gold stocks really start running!
The bottom line is gold stocks just enjoyed two parallel major breakouts in recent weeks. They shattered a vexing consolidation that’s trapped them for a year, and more importantly burst back above their critical 200dma. The resulting quickly-improving technicals are rapidly shifting sentiment back to bullish, driving more buying as traders return. Since buying begets buying, major gold-stock uplegs soon become self-feeding.
But since this small contrarian sector is largely ignored, most investors and speculators don’t yet realize how bullish these major breakouts are. Despite their big gains since early 2016, the gold stocks remain very low and their young bull is still little in secular context. So it’s not too late to get deployed. With gold itself likely to rally far higher as these lofty stock markets roll over, gold stocks’ upside potential is huge.
Adam Hamilton, CPA
September 8, 2017
Copyright 2000 – 2017 Zeal LLC (www.ZealLLC.com)

Velocity Minerals (TSX-V: VLC) is a gold (“Au“) exploration and development junior focused on eastern Europe. Others in the region include Eldorado Gold, Nevsun, Freeport McMoran, Rio Tinto, First Quantum, Teck and Lundin Mining. In July, the TSX Venture exchange approved a transformational deal in which the Company acquired options on 2 highly prospective properties in southeastern Bulgaria. In conjunction with these new assets, a talented new management team and Board is in place.
Velocity is aligned with private Bulgarian gold miner Gorubso Kardzhali (owner of the optioned projects and the only company in Bulgaria with a permit for cyanide-related processing of gold ores). Gorubso has been producing from its high-grade underground Chala gold mine for over 10 years and owns / operates a newly built (2011) Carbon-In-Leach (“CIL“) processing plant that has excess capacity. Close ties with Gorubso is helps in interactions with local communities and governmental bodies. (See Corporate Presentation)
Rozino Gold Project – 70% Earn-in Option
Velocity holds an option, exercisable for 6 years, to acquire an undivided 70% Interest in the Tintyava property, granted by Gorubso Kardzhali A.D. (“Gorubso”). The Rozino project, the subject of a recently filed Technical Report, is located within the Tintyava property, which has an area of 163 sq. km. To exercise the option, the Company must deliver a NI 43-101 compliant PEA.
The Rozino project is located 20 kilometres east of the Ada Tepe gold deposit being developed by Dundee Precious Metals, 50 km southeast of Kardzhali, host to tailings and gold processing facilities operated by Gorubso, and 350 km east-southeast of the capital of Sofia.
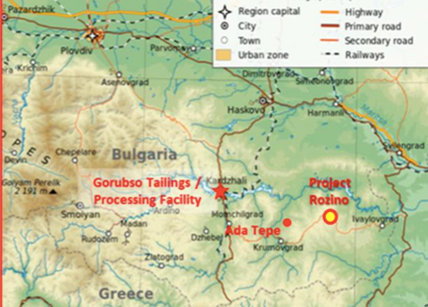
On August 21st, results of the first 2 drill holes at the Company’s Rozino gold project were released. Additional drill results are expected in the first half of September. Regarding the first 2 holes, Keith Henderson, Velocity’s President and CEO commented…
“These results are among the best grades ever returned from the project and the drill holes clearly demonstrate the potential for thick, high-grade gold mineralization between historical drill fences.”
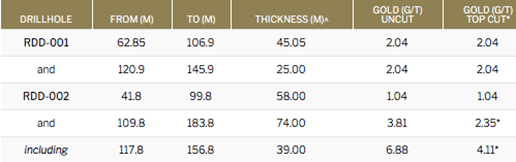
Notice that I added boldface in the above quote, “between historical drill fences.” To a large degree, the success of Velocity Minerals’ main project revolves around that sentence. In the 1980s, a Bulgarian State-run company explored Rozino under the erroneous assumption of a flat-lying exploration target (which called for routine vertical drilling). However, as Gwen Preston editor of, “Resource Maven” explained in her recent report on Velocity,
“….the gold was not in a flat lying body but in steeply dipping structures that the vertical holes missed completely. In most cases, each vertical hole cut between two steep structures and therefore only cut through the disseminated mineralization in between. The next round of exploration from 2001 to 2005 involved angled holes, but the geologic concept was still flawed – this group drilled angled holes, but to the northwest. As a result, they too drilled parallel to and between the mineralized structures at Rozino, which run northwest and dip very steeply.” — Gwen Preston, editor of Resource Maven, a weekly newsletter on investing in the metals space
Therefore, the news of the first 2 drill holes, including a near-surface interval of 39 m of 4.11 g/t Au goes a long way towards supporting the thesis that decades worth of historical drilling provided some useful information, but was largely ineffective. These results come on top of the only other angled drill hole, drilled in the right direction…. #R-245 in 2006 by Asia Gold, returned 68 m @ 3.15 g/t Au, including 11.39 m @ 8.09 g/t Au. If management is on to reasonably thick, near-surface intervals of 2-4+ g/t gold, (the Company will be drilling for several more months) then other key aspects of the Rozino project will take on new meaning.
By that I mean, for example, there are very promising historical trench samples including,
17 m @ 3.39 g/t Au, 4.53 g/t Ag and 14 m @ 4.29 g/t Au, 2.58 g/t Ag
But these samples were never followed up on, perhaps because ongoing drill results (drilled in the wrong orientation) were not as exciting as what Velocity might find. Still, according to the technical report, the potential for additional sub-parallel vein zones to the main deposit is thought to be good and the targets there are essentially untested by drilling.
And that’s not all, in addition to strong trench samples, note what the technical report had to say about preliminary metallurgical test work (– page 20),
“Preliminary metallurgical test work carried out by Geoengineering, Lakefields, Caracal and Wardell Armstrong suggests that recoveries by cyanide leaching are above 90%, with no deleterious elements and the deposit should be amenable to simple low cost processing. This is consistent with LSE deposits elsewhere in the world, where similar grade mineralisation is mined.”
There has been a substantial amount of work done on the property by at least 4 groups. According to the technical report, work included; 1:2,000 scale geological mapping (8 sq. km), soil sampling (2,079 stations), trenching (clearing of existing state trenches and new trenches) for 3,978 m, channel sampling from trenches (2,411 samples), 55 diamond drilling core holes for 7,409 m, assay results of drill core (4,918 samples), 12.2 line km of ground magnetic surveying and 1.5 line km of Induced Polarization geophysical profiling.
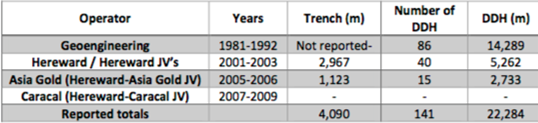
Key Management Team and Board Members
The newly assembled management / technical team and Board really stands out for a company with a market cap of just ~C$ 18 M. In addition to Bulgaria, team members have worked in eastern and southern Africa-Eurasia, central Asia, central-south America, Australia, Peru, Canada, Mexico, the U.S., Namibia, Burkina Faso, Turkey, Yemen, Argentina, Chile, Iran, Ireland, China, Siberia, DRC, Russia, Serbia and India.
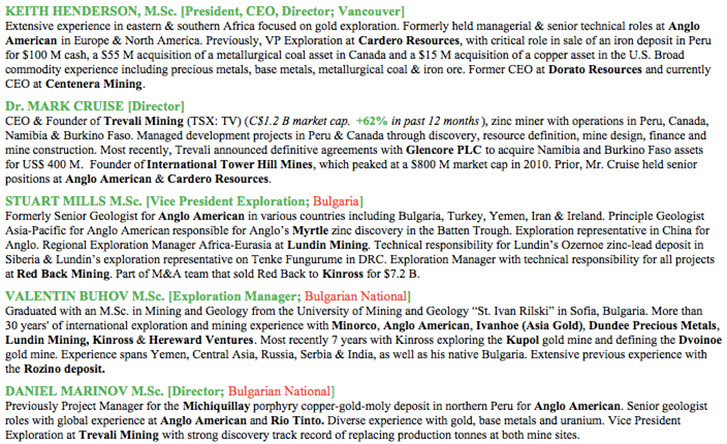
Team members have worked at major miners including Anglo American, Rio Tinto, Kinross, Lundin Mining, Teck Resources and Glencore. Director Mark Cruise has Founded 2 highly successful juniors; zinc miner Trevali Mining and gold explorer International Tower Hill Mines. CEO/Director Keith Henderson has decades of deal making/deal structuring and capital raising expertise.
Velocity Minerals scores very high in terms of boots on the ground. In addition to the close working relationship with Gorubso, 2 of Velocity’s top 5 executives are Bulgarian Nationals and VP of Exploration Stuart Mills is working full-time in Bulgaria.
Chala Gold Mine Option Agreement
Management has signed an exclusive 12-month option agreement with Gorubso to contemplate a joint venture to enhance/expand Gorubso’s Chala gold mine and, if warranted, the CIL plant. That arrangement could possibly include feeding the plant with ore from one or both of Velocity’s projects. If a win-win agreement can be reached, Velocity could effectively be in production (in partnership with Gorubso) as soon as next year.
Velocity is organizing and digitizing Gorubso’s 10+ years of mining data at the Chala gold mine to understand the likelihood of significantly more (tonnage and/or higher grade) gold mineralization being identified. Although I hesitate to enlist the overused phrase, “huge blue-sky potential,” a JV with Gorubso could be a really big deal. If structured right, it would greatly de-risk the development of Velocity’s 2 projects, slash upfront cap-ex requirements, facilitate / reduce permitting costs & time lines and simplify operational flow sheet design (especially if Gorubso’s CIL plant were to be utilized).
Near-term Catalysts – Drill Results
Management is laser focused on resource drilling to produce an open-pittable resource estimate. Importantly, since previous resource estimates were limited by mistakes in the orientation of drilling, the final resource reported to the Bulgarian government was severely restricted, it had no resource blocks between drill fences. Management believes that substantial infill potential around the main deposit exists between drill fences, and mineralization remains open to the southeast and northwest.
A total of 9 diamond drill holes (approximately 2,000 m) are planned for Phase I, of which the first 2 holes have been reported. The program is part of a larger campaign of up to 65 drill holes (~12,000 m), planned to be ongoing through the remainder of 2017 and into early 2018. Additional drill results are expected in the first half of September.
Ekuzyata Gold Project, Southeastern Bulgaria
I only briefly mention Velocity’s 2nd project, Ekuzyata, a 50% Earn-in opportunity, (or revert to 5% GSR) because the main focus is Rozino.
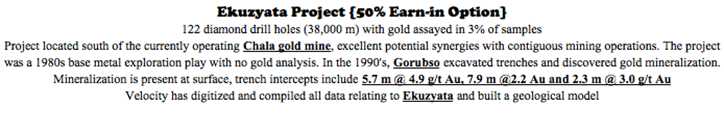
Any discovery could be within reach of existing Chala mine infrastructure, so there would be limited need for additional capital if Gorubso and Velocity were partnered. Ekuzyata is located within Gorubso’s mine concession, no additional permitting would be required.
CONCLUSION
Drill results in September/October will carry a lot of weight, if they continue to be as good or better than the first 2 assays, the Rozino project will have (both) less risk of there being no meaningful resource, and more upside potential from near-surface, high-grade zone(s) of Au mineralization.
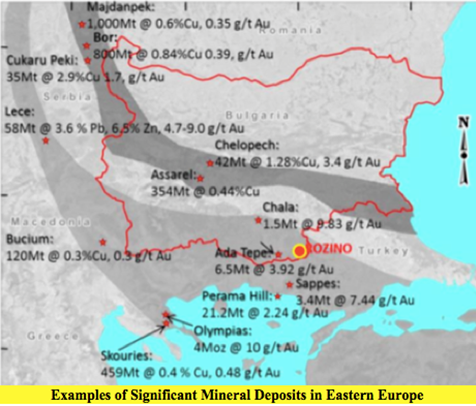
Success at Rozino should increase the likelihood of a JV with Gorubso, which would be a win-win for both companies and a win for local communities.
To recap, Velocity Minerals (TSX-V: VLC) is funded to explore an overlooked property that could be fast-tracked into development (if warranted by further drilling), potentially in partnership with existing producer Gorubso. A prospective JV could save Velocity Minerals a tremendous amount of development capital, allowing the Company to minimize equity dilution. Currently there are 57 M shares outstanding, (66 M fully-diluted), no debt or preferred shares. The market cap is ~C$ 18 M. (See Corp. Presentation)
To the extent that permitting and other key development & construction activities could be facilitated by Gorubso’s experience and connections, that too could expedite Rozino’s and/or Ekuzata’s path to potential production. Combined, Gorubso with its operating mine and CIL plant and Velocity with Rozino, Ekuzata and its strong geological, exploration & technical team, could become a regional powerhouse capable of accretive acquisitions of nearby mining assets.
–
Disclosures: The content of this article is for information only. Readers fully understand and agree that nothing contained herein, written by Peter Epstein of Epstein Research [ER], (together, [ER]) about Velocity Minerals, including but not limited to, commentary, opinions, views, assumptions, reported facts, calculations, etc. is to be considered implicit or explicit investment advice. Nothing contained herein is a recommendation or solicitation to buy or sell any security. [ER] is not responsible under any circumstances for investment actions taken by the reader. [ER] has never been, and is not currently, a registered or licensed financial advisor or broker/dealer, investment advisor, stockbroker, trader, money manager, compliance or legal officer, and does not perform market making activities. [ER] is not directly employed by any company, group, organization, party or person. The shares of Velocity Minerals are highly speculative, not suitable for all investors. Readers understand and agree that investments in small cap stocks can result in a 100% loss of invested funds. It is assumed and agreed upon by readers that they will consult with their own licensed or registered financial advisors before making any investment decisions.
At the time this interview was posted, Peter Epstein owned shares and/or stock options in Velocity Minerals and the Company was an advertiser on [ER]. Readers understand and agree that they must conduct their own due diligence above and beyond reading this article. While the author believes he’s diligent in screening out companies that, for any reasons whatsoever, are unattractive investment opportunities, he cannot guarantee that his efforts will (or have been) successful. [ER] is not responsible for any perceived, or actual, errors including, but not limited to, commentary, opinions, views, assumptions, reported facts & financial calculations, or for the completeness of this article or future content. [ER] is not expected or required to subsequently follow or cover events & news, or write about any particular company or topic. [ER] is not an expert in any company, industry sector or investment topic.
When gold began to rally in late 2015, investors breathed a sigh of relief. The longest resource bear market was finally over, and capital slowly began finding its way back into the mining sector.

During the beginning of gold’s rally, gold stocks actually declined as investors could not get a true pulse on the market. However, when the recovery was apparent, gold stocks soared, eventually yielding over 150% returns in less than a year.
Unfortunately, with such rapid gains a pull-back was inevitable and healthy. From its peak, gold decreased -17% while gold stocks gave back up to -38% in aggregate.

It appears the pull-back is now over, and gold is once again on the mends.

Since late 2016 gold has recovered 16%, but the Junior Gold Miners ETF (GDXJ) and the Arca Gold BUGS Index (HUI) are only up 21% and 29%, respectively. Just like when gold was first recovering, investors are reluctant to begin deploying capital. However, once this recovery is apparent, we expect gold stocks to once again continue its precipitous ascent.

- Gold has staged a fabulous rally from about $1220 to $1245. Using the December futures price chart, I’ve defined the $1300 – $1350 area as a spectacular profit booking opportunity for investors.
- Please click here now. Double-click to enlarge this gold chart.
- I’m an eager gold bullion seller now, but I’m less eager to sell gold stocks or silver bullion. That’s because they have not taken out their February highs while “Queen Gold” has done so easily.
- Gold has clearly been the leader. It’s been a great upside ride, and now it’s time for investors to book solid profits with a big smile.
- I’ve been adamant that gold is on the cusp of a two hundred year “bull era”. It’s themed around the love trade in China and India. For that reason, core positions should not be sold, but short term positions bought in the $1200 – $1250 area should definitely be sold aggressively now.
- Investors who are nervous that they will miss out on more upside action should buy call options while selling some bullion. Call options are like lottery tickets; if gold surges above $1350 and runs to $1400, the call options will rise in value quite significantly.
- On the other hand, if gold declines to either of my $1308 or $1280 key buy zones, the loss on the options is small, and the investor has plenty of dry powder to buy more gold bullion, ETFs, and futures.
- Please click here now. Clearly, the deep-pocketed commercial traders are aggressive sellers now.
- This COT report covers the action through last Tuesday. In my professional opinion, the commercial traders have probably shorted another 50,000 to 100,000 COMEX contracts since that report came out, and sold a significant number of long positions.
- Amateur gold investors don’t need to sell as aggressively as the commercial traders do, but history suggests that investors who book modest gold market profits when the commercial traders are aggressive sellers tend to be making a wise tactical decision.
- Please click here now. Double-click to enlarge this interesting bitcoin chart.
- I cover the entire blockchain asset class at www.gublockchain.com but gold bullion enthusiasts should take note of the fact that bitcoin price sales can sometimes be a leading indicator for gold price sales.
- Please click here now. Double-click to enlarge. That’s another look at the gold chart. Note the huge volume that occurred at the November highs in the $1338 area. Commercial traders were aggressive sellers into that price zone, as they are now.
- The rally was caused by the election of Donald Trump. It was destroyed by Modi’s demonetization announcement, and there are rumours that he may be planning “Demonetization 2.0”
- In the big picture, demonetization is increasing Indian gold demand. Indians have always been more distrustful of government than most of the world’s citizens (and rightly so), which is partly why they buy so much gold.
- Demonetization has only increased that distrust. Another round of demonetization would create a significant long term increase in demand for gold bullion. In the short term, demonetization is negative for demand, and for the price.
- Do commercial traders believe more demonetization is imminent? Is that why they are such aggressive sellers into this rally? That’s possible, but I think their selling is related more to the simple fact that there has been no serious pullback since the rally began, and a pullback is overdue from a technical standpoint.
- Please click here now. Double-click to enlarge. I’ve noted that I’m a seller of gold but not of silver. Silver is likely to pull back when gold does, but when that pull back is over I expect silver to stage a stunning advance.
- Silver should easily outperform gold during this next stage of what I call the “bull era”. As gold rises above $1392 and begins an aggressive rally towards my $1432, $1470, and $1530 target price zones, I think silver could shock investors and rally towards its $50 area highs.
- My personal plan of action is to buy silver and gold stocks with the proceeds of my recent gold bullion sales. I encourage the entire Western gold community to consider partaking in that plan, to some degree.
- Please click here now. Double-click to enlarge this fabulous GDX chart. A lot of gold stocks have arrived at my first upside target zone ($25 – $26 basis GDX), but I urge investors to keep profit booking very light and focus on building substantial gold stock core positions on all price weakness.
- For GDX, it appears that the long consolidation zone between $26 – $21 that started in February is ending. As noted, I’ll be using any price weakness to allocate my gold bullion profits to silver and gold stocks.
- Many senior and intermediate mining companies have significantly restructured, and a gold price of $1300 or higher is turning them into “cash cows”. I’ve declared the 20 year bear market of gold stocks versus gold to be over. Gold doesn’t need to rally to thousands of dollars an ounce to send gold stocks to new highs, given this restructuring and low oil prices.
- A gold price of just $1500, if it is sustained (and I think it will be) could send GDX to a new high, as institutional investors race to get in on the “restructured mining companies” action!
Stewart Thomson
Graceland Updates
https://www.gracelandupdates.com
Email:
Stewart Thomson is a retired Merrill Lynch broker. Stewart writes the Graceland Updates daily between 4am-7am. They are sent out around 8am-9am. The newsletter is attractively priced and the format is a unique numbered point form. Giving clarity of each point and saving valuable reading time.
Risks, Disclaimers, Legal
Stewart Thomson is no longer an investment advisor. The information provided by Stewart and Graceland Updates is for general information purposes only. Before taking any action on any investment, it is imperative that you consult with multiple properly licensed, experienced and qualified investment advisors and get numerous opinions before taking any action. Your minimum risk on any investment in the world is: 100% loss of all your money. You may be taking or preparing to take leveraged positions in investments and not know it, exposing yourself to unlimited risks. This is highly concerning if you are an investor in any derivatives products. There is an approx $700 trillion OTC Derivatives Iceberg with a tiny portion written off officially. The bottom line:
Are You Prepared?
Gold cleared $1300 early in the week and padded its gains on Friday even amid a bullish weekly reversal in the US Dollar. Gold’s breakout was validated by a strong monthly close on Thursday and then a strong weekly close Friday. As predicted, the miners perked up with the breakout in Gold. GDX and GDXJ gained nearly 6% and 7% respectively for the week. Look for the miners to continue to trend higher as Gold attempts to retest its 2016 highs around $1375/oz.
The miners (GDX and GDXJ) have more immediate upside potential. The daily line charts show two levels of resistance. The first level is around $26 for GDX and $38 for GDXJ while the second level is $28 for GDX and $40-$41 for GDXJ.
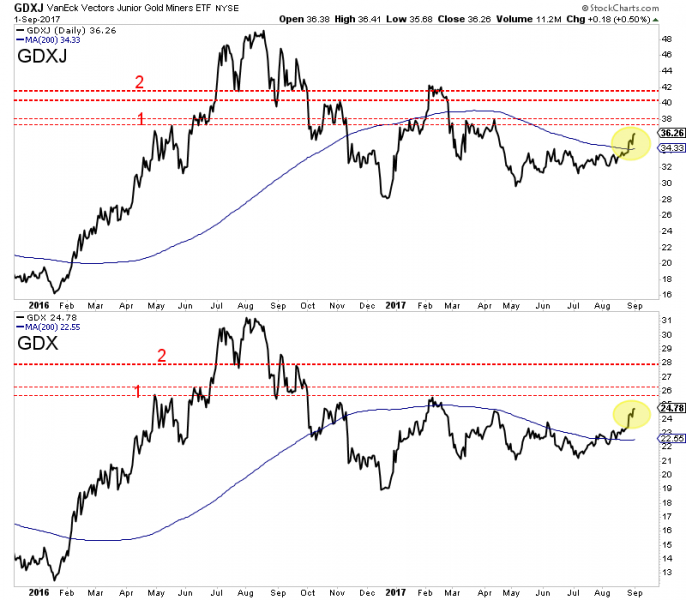
While Gold closed well above $1300 at $1330/oz, it faces resistance at the 2016 highs around $1375/oz. The net speculative position has reached 248K contracts or 46% of open interest. As the chart below shows, the 2016, 2012 and 2011 peaks in Gold all coincided with a net speculative position of 55% of open interest. If current trends continue, the net speculative position could reach 55% as Gold tests $1375/oz.
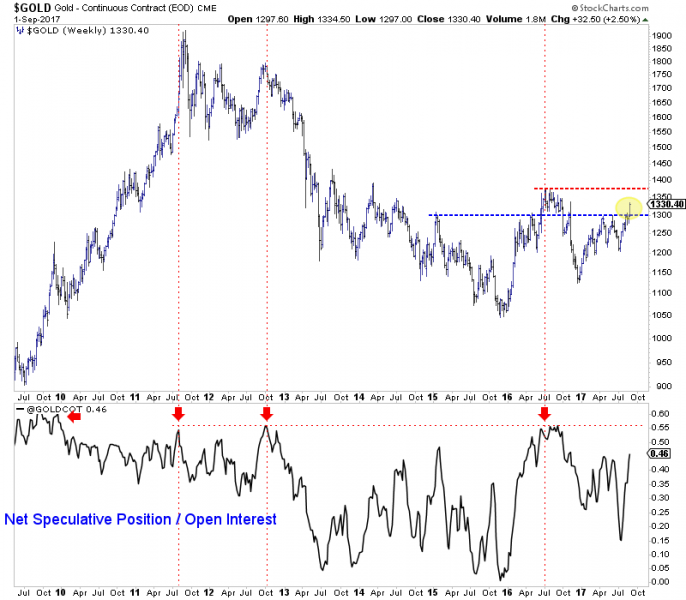
Circling back to the stocks, we see that our mini-GDXJ index, which consists of 26 stocks and has a median market cap of ~$100 Million closed the week at a +6 month high. The exploration juniors have led the entire sector this year and we expect that to continue. The price action is healthy as the index is trading above its 50-day, 200-day and 400-day moving averages which are all sloping higher. The index closed at 206 and should reach resistance at 215-220. A correction from there (perhaps in October) could setup a push to the 2016 high.
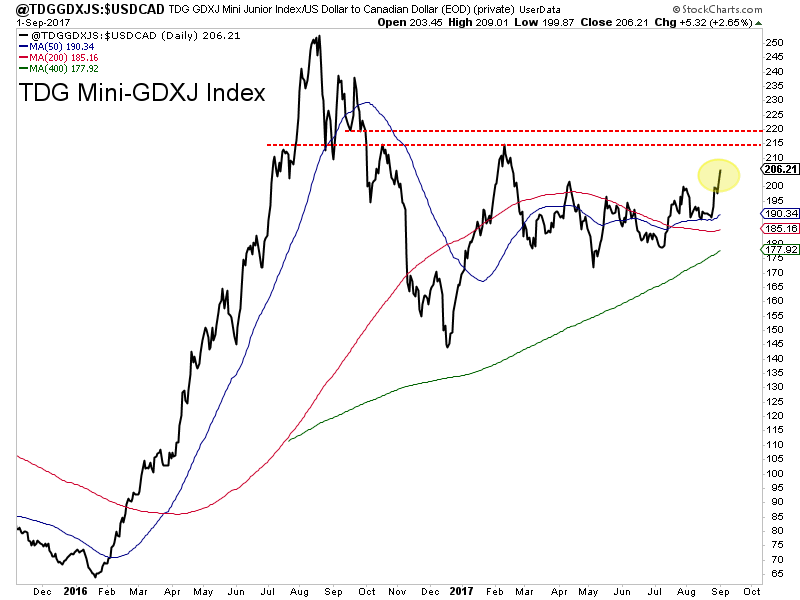
The breakout in Gold through $1300/oz has sparked the miners and juniors and we expect additional gains in the short-term as Gold has room to run. That being said, do note that the net speculative position in Gold is fairly high. It could reach an extreme level if Gold tests major resistance around $1375/oz. To find out the best buys right now and our favorite juniors for 2018 consider learning more about our premium service.
Jordan Roy-Byrne CMT, MFTA
For the week, a total of 33 Canadian-listed companies reported exploration results with 16 having a positive impact, 11 with a negative impact and 6 with no impact on the share prices of the companies.
GT Gold Corp. (TSX-V: GTT) is the big news this week. The company reported multiple intercepts of high-grade gold from six of the first eight core holes ever drilled into the Saddle South gold discovery, including a high-grade intercept of 51.53 grams per tonne (1.5 ounces per ton) gold and 117.38 grams per tonne silver over 6.95 metres in hole TTD007, and the first visible gold has been observed in core at 109 metres in hole TTD031. Assays are pending, and photos of gold from both holes are available on the company’s website. One chatroom poster commented that it is as though the company is drilling in a jewellery store with these types of results.
These results follow up earlier reported results of 10.67 m of 13.03 g/t Au at Tatogga when shares of the company could be purchased for 38 cents before the news. Coupled with the most recent results, shares have surged to an all time high of $2.20 at the close on Thursday.
SolGold PLC (TSX: SOLG) published results from holes 26 and 27 from Cascabel, the company’s 85-per-cent-owned copper-gold porphyry project in Ecuador. Hole 26 assay results returned open-ended 810 metres grading 0.72 per cent copper equivalent. Hole 27 assay results extend Alpala mineralization 100 m southeast of hole 21, and 250 m southeast of hole 16.
The company is expanding the drilling program to 10 drill rigs by January, 2018 and has signed a second drilling contractor. These results are growing the Alpala deposit as the company is focusing on high-grade porphyry centres at Alpala Northwest, Alpala Central and Alpala Southeast. Over 44,500 metres of drilling have been completed to date along the greater Alpala trend. Solgold is also commencing planning for the collection of necessary data to complete a prefeasibility assessment by the end of 2018.
Altamira Gold Corp. (TSX-V: ALTA) sampled six metres of 21.74 g/t Au at Cajueiro at the Baldo East Zone in Brazil. Results are currently pending on four drill holes, which are designed to test the vertical extent of the Baldo East zone. Three additional trenches have been developed at the Toninho claim along with three additional diamond drill holes and results are pending. This news pushed shares up 7.5 cents to 26 cents by the end of the week.
ATAC Resources Ltd. (TSX-V: ATC) published on Tuesday the results of an additional four drill holes from the Conrad and Osiris zones within the Osiris project at the Rackla gold property, Yukon. Hole OS-17-238 at the Conrad zone intersects 12.50 metres of 20.78 grams per tonne gold of newly identified and near-surface mineralization. A total of 8,300 metres of diamond drilling have been completed at the Osiris project. Two drills continue to test the Conrad, Osiris and Sunrise zones. Shares in the company went up 11 cents to 79 cents for the week.
Denison Mines Corp. (TSX-V: DMI), a Lukas Lundin company, intersected uranium mineralization in drill hole WR-689D3 on the company’s 60-per-cent-owned Wheeler River project. Preliminary radiometric-equivalent probe results (triuranium octoxide equivalent (eU3O8)) from drill hole WR-689D3 are highlighted by an interval of 5.0 per cent eU3O8 over 4.7 metres, including 8.5 per cent eU3O8 over 2.7 metres. The results did little to move the company’s share price which currently sits at 75 cents.
Garibaldi Resources Corp. (TSX-V: GGI) has intersected two long intervals of nickel-copper sulphide mineralization totalling 176 metres in the first drill hole at its 100-per-cent-owned E&L project at Nickel Mountain near Eskay Creek. The company plans to drill a second hole soon. These results pushed shares in the company up 21 cents to close the day at 91 cents on Friday.
Other companies that reported drill results this week are (percentage of share price on the day of the press release or the next day in trading):
Goldsource Mines Inc. (TSX-V: GXS) drills 19 m of 3.04 g/t Au at Eagle Mountain (-7.41%)
Banyan Gold Corp.(TSX-V: BYN) drills 3.1 m of 2.62 g/t Au at Aurex-McQuesten
Liberty Gold Corp. (TSX-V: LGD) drills 30.5 m of 0.69 g/t Au at Goldstrike (+1.12%)
Eastmain Resources Inc. (TSX: ER) drills 16.8 m of 5.84 g/t Au at Eau Claire
Metallis Resources Inc. (TSX-V: MTS) intersected mineralized and altered monzonite (+11.84%)
West Red Lake Gold Mines Inc. (CSE: RLG) drills 1 m of 26.19 g/t Au at Mount Jamie (-3.03%)
Benton Resources Inc. (TSX-V: BEX) drills 23 m of 0.8 g/t Au at Bedivere (-8.33%)
DNI Metals Inc. (TSX-V: DNI) drills 51 m of 6.37% Cg at Vohitsara (+8.00%)
Cornerstone Capital Resources Inc. (TSX-V: CGP) drills 0.72% CuEq over 810m at Cascabel (-1.11%)l
Superior Gold Inc. (TSX-V: SUP) drills nine m of 10.3 g/t Au at Plutonic (-1.04%)
Monarques Gold Corp.(TSX-V: MQR) drills new zone at Croinor (-3.85%)
Panoro Minerals Ltd. (TSX-V: PML) drills 39.7 m of 0.54% Cu at Cotabambas (share price moved up before release of results) (-7.69%)
Victoria Gold Corp. (TSX-V: VIT) drills 22.5 m of 2.78 g/t Au at Dublin (1.96%)
GGX Gold Corp. (TSX-V: GGX) drills 0.48 m of 24.1 g/t Au, 192 g/t Ag in B.C. (-6.90%)
Endeavour Silver Corp. (TSX: EDR) drills 3.4 m of 836 g/t AgEq in Mexico (-1.67%)
Ascot Resources Ltd. (TSX-V: AOT) drills 2.5 m of 321 g/t Au at Premier (1.67%)
Premier Gold Mines Ltd. (TSX: PG) drills 181 m of 2.14 g/t Au at Hasaga (-0.51%)
Kootenay Silver Inc. (TSX-V: KTN) drills 12 m of 121.25 g/t Ag at Cigarra
Happy Creek Minerals Ltd. (TSX-V: HPY) drills 105.5 m of 0.37% Cu at Rateria
Abraplata Resource Corp. (TSX-V: ABRA) drills five m of 348.8 g/t Ag at Diablillos (13.64%)
Barkerville Gold Mines Ltd. (TSX-V: BGM) drills 10.55 m of 14.03 g/t Au at Cariboo
Altamira Gold Corp. (TSX-V: ALTA) trenches six metres of 21.74 g/t Au at Cajueiro (24.32%)
Sierra Metals Inc. (TSX: SMT) drills 13.85 m of 498 g/t AgEq at Cusi (0.30%)
Sphinx Resources Ltd., (TSX-V: SFX) drills 7.93 m of 0.35 g/t Pd-Pt-Au at Green (20.00%)
Newcastle Gold Ltd. (TSX-: NCA) drills 179.8 m of 1.01 g/t Au at Castle (1.05%)
Metanor Resources Inc. (TSX-V: MTO) drills 8.2 m of 7.1 g/t Au at Barry (5.56%)
Aquila Resources Inc. (TSX: AQA) drills 120.2m of 1.14g/t Au, 13.18g/t Ag at Back (-3.92%)
Dolly Varden (TSX-V: DV) drills 6.72 m of 1,271.9 g/t AgEq at Dolly (13.51%)
***If you would like this data in an excel spreadsheet please email me and I would be happy to provide a copy: nicholas@miningfeeds.com
***Also, feel free to provide any information on companies, I may have missed.
The silver miners’ stocks have largely languished this year, grinding sideways near lows for months on end. This vexing consolidation has fueled near-universal bearishness, leaving silver stocks deeply out of favor. But once a quarter when earnings season arrives, hard fundamentals pierce the obscuring veil of popular sentiment. The silver miners’ recently-reported Q2’17 results reveal today’s silver prices remain profitable.
Four times a year publicly-traded companies release treasure troves of valuable information in the form of quarterly reports. These are generally due by 45 days after quarter-ends in the US and Canada. They offer true and clear snapshots of what’s really going on operationally, shattering the misconceptions bred by the ever-shifting winds of sentiment. There’s no silver-miner data that is more highly anticipated than quarterlies.
Silver mining is a tough business both geologically and economically. Primary silver deposits, those with enough silver to generate over half their revenues when mined, are quite rare. Most of the world’s silver ore formed alongside base metals or gold, and their value usually well outweighs silver’s. So typically in any given year, less than a third of the global mined silver supply actually comes from primary silver mines!
The world authority on silver supply-and-demand fundamentals is the Silver Institute. Back in mid-May it released its latest annual World Silver Survey, which covered 2016. Last year only 30% of silver mined came from primary silver mines, a slight increase. The remaining 70% of silver produced was simply a byproduct. 35% of the total mined supply came from lead/zinc mines, 23% from copper, and 12% from gold.
As scarce as silver-heavy deposits supporting primary silver mines are, primary silver miners are even rarer. Since silver is so much less valuable than gold, most silver miners need multiple mines in order to generate sufficient cash flows. These often include non-primary-silver ones, usually gold. More and more traditional elite silver miners are aggressively bolstering their gold production, often at silver’s expense.
So the universe of major silver miners is pretty small, and their purity is shrinking. The definitive list of these companies to analyze comes from the most-popular silver-stock investment vehicle, the SIL Global X Silver Miners ETF. This week its net assets are running 6.0x greater than its next-largest competitor’s, so SIL really dominates this space. With ETF investing now the norm, SIL is a boon for its component miners.
While there aren’t many silver miners to pick from, major-ETF inclusion shows silver stocks have been vetted by elite analysts. Due to fund flows into top sector ETFs, being included in SIL is one of the important considerations for picking great silver stocks. When the vast pools of fund capital seek silver-stock exposure, their SIL inflows force it to buy shares in its underlying companies bidding their prices higher.
Back in mid-August as the major silver miners finished reporting their Q2’17 results, SIL included 29 “silver miners”. This term is used loosely, as SIL includes plenty of companies which can’t be described as primary silver miners. Most generate well under half their revenues from silver, which greatly limits their stock prices’ leverage to silver rallies. Nevertheless, SIL is today’s leading silver-stock ETF and benchmark.
The higher the percentage of sales any miner derives from silver, naturally the greater its exposure to silver-price moves. If a company only earns 20%, 30%, or even 40% of its revenues from silver, it’s not a primary silver miner and its stock price won’t be very responsive to silver itself. But as silver miners are increasingly actively diversifying into gold, there aren’t enough big primary silver miners left to build an ETF alone.
Every quarter I dig into the latest results from the major silver miners of SIL to get a better understanding of how they and this industry are faring fundamentally. I feed a bunch of data into a big spreadsheet, some of which made it into the table below. It includes key data for the top 17 SIL component companies, an arbitrary number that fits in this table. That’s a commanding sample at 93.2% of SIL’s total weighting.
While most of these top 17 SIL components had reported on Q2’17 by mid-August, not all had. Some of these major silver miners trade in the UK or Mexico, where financial results are only required in half-year increments. If a field is left blank in this table, it means that data wasn’t available by the end of Q2’s earnings season. Some of SIL’s components also report in gold-centric terms, excluding silver-specific data.
In this table the first couple columns show each SIL component’s symbol and weighting within this ETF as of mid-August. While most of these silver stocks trade in the States, not all of them do. So if you can’t find one of these symbols, it’s a listing from a company’s primary foreign stock exchange. That’s followed by each company’s Q2’17 silver production in ounces, along with its absolute year-over-year change.
After that comes this same quarter’s gold production. Pretty much every major silver miner in SIL also produces significant-if-not-large amounts of gold. While gold stabilizes and augments the silver miners’ cash flows, it also retards their stocks’ sensitivity to silver itself. Naturally investors and speculators buy silver stocks and their ETFs because they want leveraged upside exposure to silver’s price, not gold’s.
So the next column reveals how pure the elite SIL silver miners are. This is mostly calculated by taking a company’s Q2 silver production, multiplying it by Q2’s average silver price, and then dividing that by the company’s total quarterly sales. If miners didn’t report Q2 revenues, I approximated them by adding the silver sales to gold sales based on their quarterly production and these metals’ average second-quarter prices.
Then comes the most-important fundamental data for silver miners, cash costs and all-in sustaining costs per ounce mined. The latter determines their profitability and hence ultimately stock prices. Those are also followed by YoY changes. Finally comes the YoY changes in cash flows generated from operations and GAAP profits. But an exception is necessary for companies with numbers that crossed zero since Q2’16.
Percentage changes aren’t relevant or meaningful if data shifted from negative to positive or vice versa. Plenty of major silver miners suffered net losses in Q2’17 after earning profits in Q2’16. So in cases where data crossed that zero line, I included the raw numbers instead. This whole dataset offers a fantastic high-level fundamental read on how the major silver miners are faring today, and it’s reasonably well.
That’s reassuring given silver’s serious under-performance relative to gold this year. As a far-smaller market, silver usually amplifies gold’s advances by at least 2x. But as of the end of Q2, silver was only up 4.5% YTD compared to 7.9% for gold. That’s dismal 0.6x leverage. And by mid-August as Q2’s earnings season wrapped up, silver’s YTD gain of 4.6% fell even further behind gold’s 10.6%. That’s horrible 0.4x leverage!
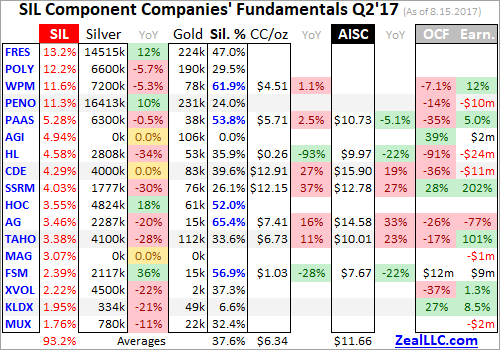
Production is the lifeblood of mining companies, and thus the best place to start fundamental analysis. In Q2’17, these top 17 SIL components collectively produced an impressive 78.6m ozs of silver. If 2016’s world-silver-mining run rate is applied to this year’s second quarter, that implies 221.5m ozs of silver mined. Thus these top SIL silver miners would account for over 35% of that total, they truly are major silver players.
But these elites still weren’t able to significantly grow their collective silver production, it was up just 0.9% YoY. Instead they invested heavily in expanding their gold production, which surged 6.4% YoY to 1354k ounces. Interestingly 10 of these top 17 SIL components, a majority representing 45.3% of SIL’s total weighting, are also included in the leading GDX gold miners’ ETF. SIL is mostly made up of primary gold miners!
Many of these elite major silver miners don’t just mine gold as a silver byproduct, but actually operate at least one primary gold mine. The silver miners have collectively decided to diversify into gold due to its superior economics. Consider hypothetical mid-sized silver and gold miners, which might produce 10m and 300k ounces annually. What would those cash flows look like at last quarter’s average metals’ prices?
In Q2’17, silver and gold averaged $17.18 and $1258. Silver was up 2.3% YoY, while gold slipped by a slight 0.1% YoY. At 10m ounces, that silver miner would generate $172m in sales. But the similar-sized gold miner’s sales of $377m more than doubles that. At recent years’ prevailing prices, the cash flows from gold mining are much more robust than those from silver mining. That makes it easier to pay bills and expand.
Silver mining is often as capital-intensive as gold mining, requiring similar large expenses for planning, permitting, and constructing mines and mills to process ore. Similar heavy excavators and haul trucks are necessary to dig and haul the ore, along with similar staffing levels to run mines. So silver’s lower cash flows to support all this activity make silver mining harder than gold mining, which isn’t lost on silver miners.
Silver-mining profits do skyrocket when silver soars occasionally in one of its massive bull markets. But during silver’s long intervening drifts at relatively-low price levels, the silver miners often can’t generate sufficient cash flows to finance expansions. So the top silver miners are increasingly looking to gold, a trend that isn’t likely to reverse given the relative economics of silver and gold. Primary silver miners are getting rarer.
Technically a company isn’t a primary silver miner unless it derives over half its revenues from silver. In Q2’17, the average sales percentage from silver of these top SIL components was just 37.6%! That is right on trend over this past year, with Q2’16, Q3’16, Q4’16, and Q1’17 weighing in at 46.3%, 38.5%, 40.5%, and 37.9%. In Q2’17, only 5 of the top SIL component companies qualified as primary silver miners!
While I understand this, as a long-time silver-stock investor it saddens me primary silver miners have apparently become a dying breed. When silver starts powering higher in one of its gigantic uplegs and way outperforms gold again, this industry’s silver percentage will rise. But unless silver not only shoots far ahead but stays there while gold lags, it’s hard to see major-silver-mining purity significantly reversing.
Unfortunately SIL’s mid-August composition was such that there wasn’t a lot of Q2 cost data reported by its top component miners. 3 of its top 4 companies trade in the UK and Mexico, where reporting only comes in half-year increments. Lower down the list there are more half-year reporters, an explorer with no production, and primary gold miners that don’t report silver costs. So silver cost data was fairly scarce.
Nevertheless, it’s always useful to look at the data we have. Industry wide silver-mining costs are one of the most-critical fundamental data points for silver-stock investors. As long as the miners can produce silver for well under prevailing silver prices, they remain fundamentally sound. Cost knowledge helps traders weather this sector’s fear-driven plunges without succumbing to selling low like the rest of the herd.
There are two major ways to measure silver-mining costs, classic cash costs per ounce and the superior all-in sustaining costs. Both are useful metrics. Cash costs are the acid test of silver-miner survivability in lower-silver-price environments, revealing the worst-case silver levels necessary to keep the mines running. All-in sustaining costs show where silver needs to trade to maintain current mining tempos indefinitely.
Cash costs naturally encompass all cash expenses necessary to produce each ounce of silver, including all direct production costs, mine-level administration, smelting, refining, transport, regulatory, royalty, and tax expenses. In Q2’17, these top 17 SIL-component silver miners that reported cash costs averaged $6.34 per ounce. That surged a major 19.1% YoY from Q2’16’s $5.32, which seems like a troubling omen.
But it’s not. Flighty silver-stock investors are always on the verge of panicking, fleeing this volatile and psychologically-challenging sector. But the only event worthy of such extreme bearishness would be prevailing silver prices falling near cash costs. And even at $6.34-per-ounce cash costs and today’s low silver, a vast buffer exists. There’s no way silver is going to plummet down under $7 in any conceivable scenario!
These high cash costs are actually an anomaly mainly driven by two companies. First, SSR Mining (TSX: SRR) is now winding down its rapidly-depleting silver mine as planned. It produced 10.4 million ounces of silver in 2016, but only 5.5m is forecast this year! As silver throughput drops each quarter, the per-ounce costs are rising. Without SSRM’s outlying super-high cash costs, the rest of these top SIL miners averaged just $5.51.
Another company Silvercorp Metals (TSX: SVM) had slid out of SIL’s top 17 components as of mid-August. It was the 18th one, removing it from this particular calculation. Due to SVM’s enormous lead and zinc byproducts, its costs are the lowest in the industry. In Q2’16 it reported cash costs of $0.08 per ounce, which really dragged down that comp-quarter average. So the major silver miners’ collective cash costs were just fine in Q2.
Way more important than cash costs are the far-superior all-in sustaining costs. They were introduced by the World Gold Council in June 2013 to give investors a much-better understanding of what it really costs to maintain a silver mine as an ongoing concern. AISC include all direct cash costs, but then add on everything else that is necessary to maintain and replenish operations at current silver-production levels.
These additional expenses include exploration for new silver to mine to replace depleting deposits, mine-development and construction expenses, remediation, and mine reclamation. They also include the corporate-level administration expenses necessary to oversee silver mines. All-in sustaining costs are the most-important silver-mining cost metric by far for investors, revealing silver miners’ true operating profitability.
In Q2’17, these top 17 SIL components reporting AISC averaged $11.66 per ounce. That was up 16.0% YoY from Q2’16s $10.05. Coeur Mining was a big factor, with AISC surging 19% to a lofty $15.90 per ounce! That was due to lower-grade ore on the way to better zones. Ex-CDE, this average ran $10.96 which was closer to year-ago levels. SVM was also a factor, with low $7.06 AISC feeding into Q2’16 comps.
Two other elite silver miners suffered major production problems in Q2’17, resulting in big production drops. With fewer ounces to spread mining’s heavy fixed costs across, all-in sustaining costs soared. First Majestic Silver (TSX: FR), the purest major silver miner at 65.4% of Q2 revenues, saw production fall 20% YoY which forced AISC 33% higher. Unprecedented labor unrest in Mexico temporarily halted 3 of its 6 silver mines.
Those issues have since been resolved, so AG’s production should bounce back in Q3 which will push its AISC back down. Meanwhile Tahoe Resources (TSX: THO) saw its Q2 production plunge 28% YoY forcing its own AISC 23% higher. It got sucked into a legal battle between anti-mining activists and the government of Guatemala where its silver mine is. That mining license was temporarily suspended for an unmerited lawsuit.
The activists allege the government shouldn’t have granted Tahoe its Escobal mining license in the first place because it didn’t consult with a particular indigenous tribe first. But those people don’t even live anywhere near the mine site, it’s ridiculous! Tahoe doesn’t know when Escobal operations will be allowed to resume, but estimates a range between a couple months from now out to 18 months for a full resolution.
Tahoe’s large gold production from its two other gold mines in Peru, 110k ounces in Q2’17, ensures it won’t have any serious problems weathering this Guatemalan nightmare. But the point for our purposes today is that anomalous special situations fed the steep jump in the major silver miners’ all-in sustaining costs in Q2. But even at these elevated levels, this industry is still enjoying hefty silver-mining margins.
At $11.66 AISC, the major silver miners still earned big profits in the second quarter. Once again silver averaged $17.18, implying fat profit margins of $5.52 per ounce or 32%! Most industries would kill for such margins, yet silver-stock investors are always worried silver prices are too low for miners to thrive. That’s why it’s so important to study fundamentals, because technical price action fuels misleading sentiment!
Today’s silver price remains really low relative to prevailing gold levels, which portends huge upside as it mean reverts higher. The long-term average Silver/Gold Ratio runs around 56, which means it takes 56 ounces of silver to equal the value of one ounce of gold. Silver is really underperforming gold so far in 2017, with the SGR averaging just 72.6 YTD as of mid-August. So silver is overdue to catch up with gold.
At a 56 SGR and $1300 gold, silver is easily heading near $23.25. That’s 35% above its Q2 average. Assuming the major silver miners’ all-in sustaining costs hold, that implies profits per ounce soaring 110% higher! Plug in a higher gold price or the typical mean-reversion overshoot after an SGR extreme, and the silver-mining profits upside is far greater. Silver miners’ inherent profits leverage to rising silver is incredible.
Still Q2’17’s relatively-weak silver price weighed on miners’ cash flows generated from operations and GAAP accounting profits. Despite their big gold production, operating cash flows plunged 28.4% YoY to $1038m for these top SIL components. That’s not quite a righteous comparison though, because only 13 of this year’s top 17 had reported Q2 financial results by mid-August. Last year that number totaled 15.
And one of the silver miners not reporting OCF by the usual Q2 deadline this year was the Mexican silver giant Fresnillo (NASDAQ: FNLPF). Its OCF last year was fully 1/6th of these top SIL components’ total! So their operating-cash-flows situation in Q2’17 is nowhere near as bad as the drop implies. The same is true on the GAAP-earnings front. Last year Fresnillo contributed nearly 22% of the profits of these top 17 SIL components.
Another huge Mexican silver miner, the conglomerate Industrias Penoles (NASDAQ: IPOAF), saw its profits plunge about $140m YoY. These two Mexican silver giants alone account for the entire drop in these top SIL miners’ profits in Q2’17, which plummeted 57.5% YoY or $221m. Without them, silver-mining profits were flat. That’s pretty darned good considering all the super-anomalous company-specific problems that plagued Q2 results.
Silver miners’ earnings power and thus stock-price upside potential will only grow as silver mean reverts higher. In mining, costs are largely fixed during the mine-planning stages. That’s when engineers decide which ore bodies to mine, how to dig to them, and how to process that ore. Quarter after quarter, the same numbers of employees, haul trucks, excavators, and mills are generally used regardless of silver prices.
So as silver powers higher in coming quarters, silver-mining profits will really leverage its advance. And that will fundamentally support far-higher silver-stock prices. The investors who will make out like bandits on this are the early contrarians willing to buy in low, before everyone else realizes what is coming. By the time silver surges higher with gold so silver stocks regain favor again, the big gains will have already been won.
While investors and speculators alike can certainly play the silver miners’ ongoing mean-reversion bull with this leading SIL ETF, individual silver stocks with superior fundamentals will enjoy the best gains by far. Their upside will trounce the ETFs’, which are burdened by companies that don’t generate much of their sales from silver. A handpicked portfolio of purer elite silver miners will yield much-greater wealth creation.
At Zeal we’ve literally spent tens of thousands of hours researching individual silver stocks and markets, so we can better decide what to trade and when. As of the end of Q2, this has resulted in 951 stock trades recommended in real-time to our newsletter subscribers since 2001. Fighting the crowd to buy low and sell high is very profitable, as all these trades averaged stellar annualized realized gains of +21.2%!
The key to this success is staying informed and being contrarian. That means diligently studying and buying great silver stocks before they grow popular again, when they’re still cheap. An easy way to keep abreast is through our acclaimed weekly and monthly newsletters. They draw on our vast experience, knowledge, wisdom, and ongoing research to explain what’s going on in the markets, why, and how to trade them with specific stocks. For just $10 per issue, you can learn to think, trade, and thrive like contrarians. Subscribe today and get deployed in great silver stocks before they surge far higher!
The bottom line is the major silver miners fared fine in Q2 despite some real challenges. A combination of silver continuing to seriously lag gold, along with anomalous company-specific problems, weighed on miners’ collective results. Yet they continued to produce silver at all-in sustaining costs way below Q2’s low prevailing silver prices. And their accelerating gold-production growth leaves them financially stronger.
With silver-stock sentiment remaining excessively bearish, this sector is primed to soar as silver itself continues mean reverting higher to catch up with gold’s current upleg. The silver miners’ profits leverage to rising silver prices remains outstanding. After fleeing silver stocks so aggressively this year, investors and speculators alike will have to do big buying to reestablish silver-mining positions. That will fuel major upside.
Adam Hamilton, CPA
September 1, 2017
Copyright 2000 – 2017 Zeal LLC (www.ZealLLC.com)
If you would like to receive our free newsletter via email, simply enter your email address below & click subscribe.
 Follow us on Twitter
 Become our facebook fan
CONNECT WITH US
Tweets
Tweet with hash tag #miningfeeds or @miningfeeds and your tweets will be displayed across this site.
MOST ACTIVE MINING STOCKS
Daily Gainers
 CMC Metals Ltd. CMC Metals Ltd. |
CMB.V | +900.00% |
 Eden Energy Ltd Eden Energy Ltd |
EDE.AX | +200.00% |
| GoviEx Uranium Inc. |
GXU.V | +42.86% |
| Eagle Nickel Ltd. |
ENL.AX | +41.67% |
| Citigold Corp. Limited |
CTO.AX | +33.33% |
| Mount Burgess Mining NL |
MTB.AX | +33.33% |
| Exalt Resources Limited |
ERD.AX | +31.94% |
| Casa Minerals Inc. |
CASA.V | +30.00% |
| Cariboo Rose Resources Ltd |
CRB.V | +28.57% |
| Belmont Resources Inc. |
BEA.V | +28.57% |


