
By Jennifer Schell, B.COMM, MBA
Investment Advisor
Making it Rain!

This morning I was reading the paper on my way to the office and I learned that gold was formed by a neutron star collision, resulting in pressurized debris that rained down onto our Earth— fresh from the Universe. This is why people are so star struck with gold!
As an industry, mining is extremely capital intensive and relies heavily on investments from the public to make their projects come to fruition. These projects cost millions upon millions to fund. But as an investor, it’s difficult to know how to differentiate a good project from one that can leave investors broke and jaded.
Skim the corporate presentation and they will generally break this out for you. Here’s what you need to know:
| Sound Capital Structure | |
| Shares Outstanding:The shares indicate the ownership of the Company. | Usually ranges from 60 Million to 150 MillionBe on the lookout for the fully diluted shares, such as stock options and warrants which when added together, contains all of the shares. This is called: “fully diluted shares.” Once these are exercised, they can dilute your holdings because more shares are added to the float for the buyers and sellers of the stock. It’s in your best interest to include those in your calculation. It will take more momentum for the stock to move up. |
| Working Capital | Money in the bank is good and this money is what is needed to pay for the expenses. Use your judgement. If management doesn’t have enough money to complete the next phase of the project (see *Pipeline from part 2 of 3), they will likely do a capital raise. This will involve diluting equity, so your shares outstanding will go up and this may cause the stock price to drop. |
| Debt | Look to see how much is owed and pay attention to the terms, because the debt will have to be paid back at some point and the interest rates and payments may be steep. Debt holders also get paid before you do as a shareholder if the company defaults. If the terms don’t seem reasonable or achievable, this can be a red flag. If there’s no mention of debt in the corporate presentation, you can check the company’s financial statements. |
| Market Capitalization = Shares Outstanding
X Share price |
This will give you an idea of how much money is invested in the company already. It shows the value of the Company. This is useful because you can compare the market capitalizations of similar companies to see where your junior gold company compares with other juniors. |
During my many conversations with mining professionals, they described having a “gut instinct” as to whether or not the people they chose to work with would be synergistic. One individual described his team as “only as good as its weakest member.” This is very true. because good people like to invest with good people. This is why the management team is the most important part of the project. If they can’t properly execute, it won’t get off the ground.
Now that you know the basics, before drilling down to the core of the quality of the resource and capital structure, assess management first and proceed down the checklist. Remember, to keep the gold standard. Good luck with your digging and don’t forget to rock on!
CIBC Wood Gundy is a division of CIBC World Markets Inc., a subsidiary of CIBC and a Member of the Canadian Investor Protection Fund and Investment Industry Regulatory Organization of Canada.
This information, including any opinion, is based on various sources believed to be reliable, but its accuracy cannot be guaranteed and is subject to change. CIBC and CIBC World Markets Inc., their affiliates, directors, officers and employees may buy, sell, or hold a position in securities of a company mentioned herein, its affiliates or subsidiaries, and may also perform financial advisory services, investment banking or other services for, or have lending or other credit relationships with the same. CIBC World Markets Inc. and its representatives will receive sales commissions and/or a spread between bid and ask prices if you purchase, sell or hold the securities referred to above. © CIBC World Markets Inc. 2017.
Jennifer Schell is an Investment Advisor with CIBC Wood Gundy in Toronto The views of Jennifer Schell do not necessarily reflect those of CIBC World Markets Inc.

By Jennifer Schell, B.Comm, MBA
Investment Advisor
Some Dig it, We Drill it!
I’m frequently asked why I have such a youthful glow to my skin. “What’s your secret?”: they always inquire. To the horror of ‘helicopter’ parents everywhere, I explain that my Dad is a geotechnical engineer and he designed mining tailings sites. Back in the day, he used to bring my sister and I to his site visits, regularly. Before toxins and pollution were of major concern, we used to play in the giant tailings, sand dunes which were comprised of uneconomical waste rock. Therefore, I guess you could say that I was “resourceful” with my skincare regime.
The objective of a junior mining company is to convert Mineral Resources to Mineral Reserves. With every step, when new data and research is obtained, the resource is modified into the next stage of the process.
| Mineral Resources: Geological Evidence and Sampling has been done to confirm that solid material exists to be economically interesting to extract from the Earth. | Mineral Reserve: Mineral Resources that have been converted to reserves by doing more detailed and extensive studies, under the blessing of the Qualified Person. | |
| Inferred Mineral ResourceThere is some evidence to support grade and quality but more exploration is needed for confirmation. | Needs more work to morph into the next category.
*Only used in the Pre-Economic Assessment (PEA) |
|
| Indicated Mineral ResourceThe physical characteristics, such as density and shape are modelled. This is where the qualified person (QP) comes in. At this stage, the resource can be used for the Pre-Feasibility Report. | Probable ReservesIt’s economical, but there are some reservations or “unknowns.” These have to be explained by the QP. | |
| Measured Mineral ResourceAt this point, you have enough information to start designing a mine. | Proven ReservesIt’s predictably economical! |
Every time a mining company publishes news to the public regarding their Mineral Resources, Mineral Reserves and Mining Studies, they have to be up to the Standards of Disclosure for Mineral Projects, called the (National Instrument 43-101). 1 The National Instrument 43-101 is a Canadian set of rules and guidelines to ensure that mining companies report their results in a transparent way to the capital markets. It ensures that proper scientific methods and that “Qualified People” (QP) assess the results. These people are the overlords of the mining project and they are generally geologists and engineers with professional designations and are qualified with over 5 years’ experience. This technical reporting is a big deal. It verifies the validity of the resource to ensure that sneaky people don’t shave down their ex’s gold jewellery and melt it onto a core sample.
Good news makes the stock price rise and so you should be on the lookout for the following events to occur within the mining pipeline:
| A Series of Fortunate Events: Mining Pipeline | |
| Environmental Study | In Canada, mining and the resource industry in general, are very important economic drivers for the economy. It’s also very important that these companies operate in a socially responsible way. Although there is always room for improvement, as a country, we are lucky to have some of the highest environmental and safety standards and there are many benefits to the communities surrounding these projects. Before the project can begin, the team must consult with the First Nations communities and provide the ministry of environment with a satisfactory plan that any pollutants will be managed and contained. Licensing and permitting are also obtained during environmental due diligence. |
| The Pre-Economic Assessment | The PEA accompanies Mineral Resources. It’s a pre-economic study to see if the project is worthwhile pursuing before the real spending begins. The Pre-Economic Assessment discusses everything in terms of Resources and this is the only report where you are allowed to include the Inferred Resources into your calculations.
Proven Reserves are actually there, Probable Reserves are most likely there given the calculations and data, while Inferred Resources are there in an ideal world. If you find more resources than the inferred estimate, the stock price can rise but keep in mind that technical reports must be validated by the qualified person before they can become actual “Mineral Reserves.” The success of the mining project depends on the assets that are in the ground and how capable management is to assemble a process to make its extraction cost effective. After, there is a feasibility study to discuss the capital costs involved in the development of the project into a mine. Drilling Companies will usually have a colourful map of their property with a legend showing their drill holes, often represented by red dots. The good ones with the most probability for gold are called “targets.” They also draw horizontal and vertical lines through the holes. When they drill, they often drill on an angle. Drill holes, although they seem quite simple in theory, are actually very pricy and can cost about $100,000 to drill one hole of core. So, you have to be very precise where you choose to drill, or you could spend millions of dollars for nothing. Metallurgy Report This section often gets overlooked, but it is very important. You can have the best gold reserves in the world, but if you can’t separate the gold effectively from the rest of the surrounding rock, then the project may no longer be feasible. For clarification, rocks are made up of minerals, which are inorganic, naturally occurring solid substances. In mining, ore refers to minerals (such as metals) that are economically valuable and can be extracted profitably. The ‘gangue’ minerals are everything else. They are essentially economically worthless minerals that surround the ore. Once chemicals have been used to separate the gold from the other minerals, there is often heavy metal waste. Also, some naturally occurring toxic elements exist with the gold in the earth’s crust, such as arsenic. Fortunately, new technologies are being developed because mining is crucial for the inputs to create all that we love: including cell phones, cars, planes buildings etc. There is a very cool science called 2bioremediation, “that uses bacteria to remove the noxious ions from the environment.” If you’re environmentally conscious, I encourage you to look into it. For gold recoveries, consensus prefers a rate of recovery of 75% or better. Resource Estimation Calculating the Production Rate for your Discovery The economic feasibility of the project depends on the Production Rate of the project. Some Notable Benchmarks:
The Formula is: Tonnes (Mt) X Grade (grams/tonne) / Conversion factor to Troy Ounces 31.1035 = Ounces (Moz)
|
| Pre-Feasibility Study also called (Preliminary Feasibility Study) | 1This is the minimum prerequisite for the conversion of mineral Resources to Mineral Reserves. At this point, management has determined the preferred mining method – either open pit or underground mining and pit configuration. The mineral processing method is also established, meaning that the way they extract the gold from the ore will be identified. There is also a financial analysis to assess the costs of the operation. Everything has to be ready so that a “Qualified Person” can take a look at the work and rightfully determine if these Mineral Resources are worthy of conversion to Mineral Reserves. |
| Feasibility Study | 1The feasibility study is highly technical and has a lot of economic studies done to determine the appropriate development option for the mineral project. It determines if it is worth the investment in the ground, for additional drill holes and eventual development to make the project feasible to sell into the market. At this point, things get real and the resource is essentially audited by a professional to confirm that all of the resources are actually there as stated. This stage is imperative so that they can get institutions to provide them with financing, which requires sound capital structure. |
These figures were provided by the mining executives that I’ve met over the last couple of years and can be used as a reference point for evaluation. All projects are unique, so there is likely to be some deviation from the benchmarks. When necessary, further research into the project may be required.
References:
1 www.cim.org, The Canadian Institute of Mining, Metallurgy and Petroleum
CIM DEFINITION STANDARDS – For Mineral Resources and Mineral Reserves,
Prepared by the CIM Standing Committee on Reserve Definitions, Adopted by CIM Council on May 10, 2014, 10/18/2017
2 Muibat Omotola Fashola,1 Veronica Mpode Ngole-Jeme,2 and Olubukola Oluranti Babalola1,*
Yu-Pin Lin, Academic Editor, Heavy Metal Pollution from Gold Mines: Environmental Effects and Bacterial Strategies for Resistance, 13(11): 1047., Int J Environ Res Public Health. 2016 Nov; PMCID: PMC5129257; Published online 2016 Oct 26. doi: 10.3390/ijerph13111047; P.2,10/18/2017
- I’ve suggested that investors may need to look beyond the head and shoulders top formations that recently appeared on bullion and many precious metal stocks.
- Please click here now. Double-click to enlarge this daily gold chart. Intermediate uptrends often consist of three legs. In 2017, gold has had two legs up.
- The next US jobs report is scheduled for release on Friday. Will it be the catalyst that launches a third leg higher for gold? I’m not sure, but I am sure of what’s important for gold, which is that it is generally very well supported here, both technically and fundamentally.
- The bottom line: Gold held in ETFs is quite steady. China’s economy has softened, but only modestly. That light softness is almost certainly related to the government’s action taken to reduce pollution.
- Chinese mine production has fallen as excessively polluting operations have been shut down. That’s adding support to the gold price.
- In India, the economic growth has slowed more noticeably than in China, and that does have an effect on gold demand. This growth slowdown has been mitigated by a rise in the rupee against the dollar, which lowers the cost of gold for Indians.
- Along with commercial traders on the LBMA and the COMEX (aka “the banksters”), Indian buyers are the most eager buyers when the gold price drops.
- On that note, please click here now. The US Treasury wants India’s central bank to reduce its purchases of US dollars.
- As India recovers from the disastrous demonetization program that pounded the nation’s GDP growth, the dollar could enter the “meat and potatoes” zone in a major bear market against the rupee.
- That would put gold on sale in a major way for Indians, and demand could surge.
- Please click here now. The dollar looks like a train wreck against the rupee on this one year chart, and that happened with the Indian central bank buying the dollar aggressively!
- What happens if US government pressure works, and the Indian central bank pares back its dollar buying?
- For the likely answer, please click here now. This seven year chart shows how strong the dollar was against the rupee from 2011 – 2016.
- The dollar has now started what is likely to be a multi-decade bear market against the rupee. This should add significantly to the (already relentless) growth in Indian citizen demand for gold.
- In America, most analysts predict there will be only a few rate hikes in the 2018 – 2019 time frame. In contrast, the US central bank predicts seven. Goldman Sachs’ top economist predicts nine.
- I predict there will be six. Regardless of what the exact number turns out to be, if its six or more, American M2 money velocity should begin a major bull cycle. Of the three main money velocity measurements used by the Fed, M2V tends to correlate best with the action of gold stocks versus bullion. A major bull cycle in M2V would blast gold stocks higher in a bull cycle with intensity that has not been seen since the 1970s.
- The St. Louis Fed has stated that the US inflation rate would have reached 33% as a result of QE, if money velocity had not collapsed. A more relentless pattern of rate hikes and accelerated QT will almost certainly create a surge in M2 velocity.
- I think most of the world will be stunned by what happens with inflation over the next 24 months. That’s because the QE “money ball” that is only inflationary potential energy becomes kinetic energy as it is flushed out of government and central banks and into the fractional reserve banking system.
- Trump’s tax cuts against a background of rising government debt should ice that inflationary cake in a very big way.
- Please click here now. GOAU-AMEX/ARCA is a relatively new gold stocks ETF.
- I like the fact that about 60% of the holdings are in Canada, which is arguably the best mining jurisdiction in the world, and certainly one of them. I’m a buyer on every 50 cents price decline until the price rises to $20. I would urge all gold stock enthusiasts to check out the main holdings in this ETF carefully, and eagerly!
- Please click here now. Double-click to enlarge this key GDX chart. GDX is bouncing from an important triangle apex point. It’s unknown whether the bounce will fail in the neckline area of the head and shoulders top pattern.
- What is known is that investors need to be focused on a major worldwide transition from QE, low rates, and deflation… to QT, higher rates, and inflation.
- Bullion has outshined the miners for twenty years, and now it’s becoming time for the miners to lead, and lead for a very long period of inflationary time!
Thanks
Cheers
St
Stewart Thomson
Graceland Updates
Written between 4am-7am. 5-6 issues per week. Emailed at aprox 9am daily.
https://www.gracelandupdates.com
Email:
Stewart Thomson is a retired Merrill Lynch broker. Stewart writes the Graceland Updates daily between 4am-7am. They are sent out around 8am-9am. The newsletter is attractively priced and the format is a unique numbered point form. Giving clarity of each point and saving valuable reading time.
Risks, Disclaimers, Legal
Stewart Thomson is no longer an investment advisor. The information provided by Stewart and Graceland Updates is for general information purposes only. Before taking any action on any investment, it is imperative that you consult with multiple properly licensed, experienced and qualified investment advisors and get numerous opinions before taking any action. Your minimum risk on any investment in the world is: 100% loss of all your money. You may be taking or preparing to take leveraged positions in investments and not know it, exposing yourself to unlimited risks. This is highly concerning if you are an investor in any derivatives products. There is an approx $700 trillion OTC Derivatives Iceberg with a tiny portion written off officially. The bottom line:
Are You Prepared?

Over the past two years, Gold has been inversely correlated to bond yields. In a low inflation environment, falling bond yields drive real interest rates lower which benefits Gold. Conversely, rising yields are generally negative for Gold. When long-term yields exploded higher in the second half of 2016, Gold declined hard. Now with long-term yields threatening a potential major move higher, Gold and gold stocks have sold off and there is a risk of further losses. However, at somepoint rising yields can push Gold higher.
To answer the question of when we must understand what drives Gold.
Gold performs best amid falling or negative real interest rates. That occurs when inflation is rising faster than interest rates or when interest rates are falling faster than inflation.
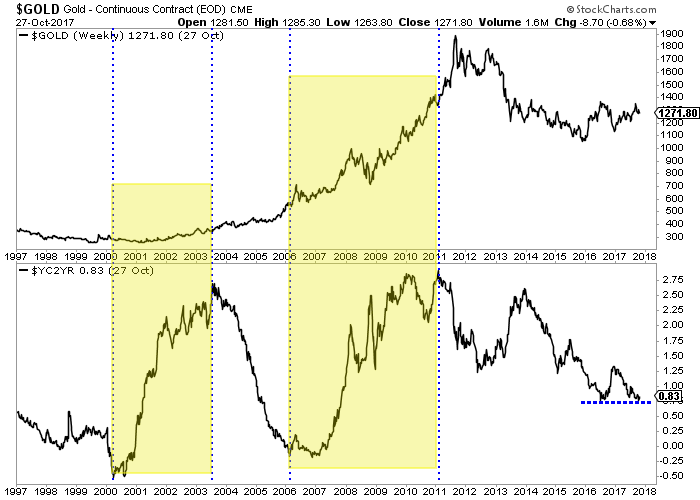
In terms of the yield curve, a steepening curve is bullish for Gold. Two analysts I enjoy reading (Gary Tanashian and Steve Saville) write about this frequently. Steve Saville recently wrote that a steepening yield curve reflects either increasing inflation expectations or risk aversion linked to declining confidence in the economy or financial system. The curve can steepen due to rising inflation or plummeting interest rates and in particular short-term rates. The chart below, which plots Gold and the yield curve (bottom) highlights recent periods of a steepening yield curve. Both periods were driven by a sharp decrease in short-term yields.
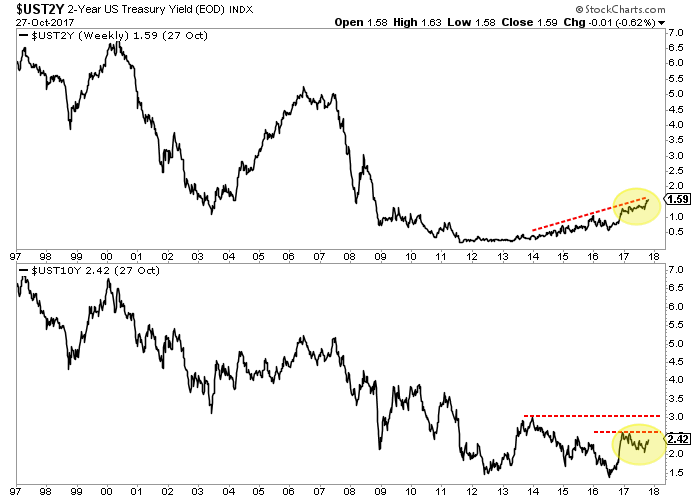
The yield curve (above) has stabilized at present as both short (2-year) and long-term bond yields (10-year) are rising again. To answer the original question, rising yields will be bullish for Gold only when long-term yields are rising faster or in other words, when inflation is rising faster than short-term yields. For example, if the 2-year yield (often a proxy for the Fed funds rate) peaks at 2.00%-2.25% but the 10-year yield surges well above 3.00%, that would be bullish for Gold.
Gold and gold stocks have failed to surpass their 2016 peaks and continue to go nowhere because the fundamentals are not yet bullish. Real interest rates are currently trending higher and the yield curve is flattening, not steepening. That could change if inflation expectations increase which would cause long-term yields (10-year) and inflation to rise faster than short-term rates or the Fed funds rate. The prognosis for Gold and gold stocks remains bearish into year end as we wait for lower prices and a low risk buying opportunity. The good news is those who buy weakness in the months ahead could position themselves for strong profits in 2018. Find the best companies and wait for the sector to get oversold and test strong support. To follow our guidance and learn our favorite juniors for 2018, consider learning more about our premium service.
Jordan Roy-Byrne CMT, MFTA

By Jennifer Schell, B.COMM, MBA
I grew up in Sudbury, Ontario in the 1980’s, where mining was ingrained into our childhoods…
Every morning before school—while eating breakfast— the local radio station would host a contest giveaway. All you had to do was call in and provide a safety tip on-air. If you were the lucky caller, the station would then send you an “Inco-branded-industrial-grade-backpack” (*Inco has since been taken over by Vale.) The best part was that the backpack contained pretty packaged samples of copper flakes, nickel and pyrite—fool’s gold. As I recall, the pyrite was shiny and very popular with the kids, myself included.
Since that moment, I’ve never lost my affinity for shiny things. Over the years, I’ve met with hundreds of talented women and men in the mining industry who have executed on these projects. After listening to many presentations, here are some basic factors to consider when you’re evaluating a mining project to invest in.
Identify your Mining Company
If you want to do a quick assessment, “google” the company’s name and go to their corporate website. Most of this information will be located in the corporate presentation in a PDF document, where they highlight all of the best features of the project. You can also go to www.sedar.com and you can look up further documents if you feel so inclined.
Can you Dig it?
There are 3 major categories of mining stocks: explorers, developers and producers. True gold-diggers want big rewards for all of their trouble, and so, the focus will be junior explorers. Junior explorers hope that they find a large deposit so that the developers and producers can take them over in a buyout. Geologists and investors get very giddy over undiscovered parcels of land with loads of unexplored potential because it’s like a treasure hunt for them and the payoff can be huge. Most financial analysts do not cover the explorers, so it’s difficult to find research on them. Junior exploration projects are hit or miss. You can either win big or you can lose everything.
Look at the Management Section: Super Important!
The first thing to do, is to check out the management tab. Under this tab, the Bios of the team are listed. The team usually boasts about their previous achievements in this section. The idea is that if they have a track record for success, they are likely to pull a good team together to replicate the process again.
Mining is an expensive business, so look for a combination of competent business people, geologists, engineers and lawyers. The CEO has to be a good marketer so that people are aware of the story. Look for issued press releases and for those regarding trade shows and media appearances, as well as recorded interviews to assess their interactions.
Since it’s hard to meet these people in person, watching them on television or on some online podcasts can give you an indication as to whether or not they demonstrate passion for their company and if they are decent people. Notice how the executive responds to the interviewer’s questions. If the executive is respectful, confident and knowledgeable, this is a good sign. If however, the executive is arrogant and condescending, you may want to shy away. The mining circle is small and friendly. If the leader of the Company displays toxic personality traits, they are likely to cause board and management disagreements.
Location, Location, Location!
When it comes to an ideal mining location, the country should be politically stable and situated in a place with a positive mining track record, in the right geological environment. I always like to hear how the team was drawn to the property. People like to hoard real estate—especially land. Since the places I look for are known gold destinations, I like the stories where the land has been in the family of non-miners for a number of years until their heirs lost interest and decided to sell it.
Just like when you buy a piece of real estate, it’s vital that your deposit is located on a good piece of property and you need to know the key development risks. To eventually tap into the full potential of the resource, you need proper infrastructure, such as roads, water and electricity, as well as workers. The more remote the property, the more expensive it is to get the resource out of the ground and into the proper outlets to sell the commodity. For example, if you had to build electric powerlines, it could cost at least $1.5 Million per KM. Fortunately, you can go onto Google Earth and you can locate your project to see what’s around it in terms of infrastructure.
Now that you’ve identified a company; have looked into management and found a good location, you can begin to mine your own business!
CIBC Wood Gundy is a division of CIBC World Markets Inc., a subsidiary of CIBC and a Member of the Canadian Investor Protection Fund and Investment Industry Regulatory Organization of Canada.
This information, including any opinion, is based on various sources believed to be reliable, but its accuracy cannot be guaranteed and is subject to change. CIBC and CIBC World Markets Inc., their affiliates, directors, officers and employees may buy, sell, or hold a position in securities of a company mentioned herein, its affiliates or subsidiaries, and may also perform financial advisory services, investment banking or other services for, or have lending or other credit relationships with the same. CIBC World Markets Inc. and its representatives will receive sales commissions and/or a spread between bid and ask prices if you purchase, sell or hold the securities referred to above. © CIBC World Markets Inc. 2017.
Jennifer Schell is an Investment Advisor with CIBC Wood Gundy in Toronto. The views of Jennifer Schell do not necessarily reflect those of CIBC World Markets Inc.
This epic central-bank-easing-driven global stock bull is starting to be strangled by the very central banks that fueled it. This week the European Central Bank made a landmark decision to drastically slash its quantitative easing next year. That follows the Fed’s new quantitative-tightening campaign just getting underway this month. With CBs aggressively curtailing easy-money liquidity, this stock bull is in serious trouble.
The US flagship S&P 500 broad-market stock index (SPX) has powered an incredible 280.6% higher over the past 8.6 years, making for the third-largest and second-longest bull market in US history! The resulting popular euphoria, a strong feeling of happiness and confidence, is extraordinary. So investors brazenly shrugged off the Fed’s September 20th QT and the ECB’s October 26th QE-tapering announcements.
That’s a grave mistake. Extreme central-bank easing unlike anything witnessed before in history is why this stock bull grew to such grotesque monstrous proportions. Without QE, it would have withered and died years ago. Central banks conjured literally trillions of new dollars and euros out of thin air, and used that new money to buy assets. This vast quantitative easing inarguably levitated the world stock markets.
QE greatly boosted stocks in two key ways. Most of it was bond buying, which forced interest rates to deep artificial lows nearing and even under zero at times. This bullied traditional bond investors looking for yield income into dividend-paying stocks. The record-low interest rates fueled by QE were also used to justify extremely-expensive stock prices. QE aggressively forced legions of investors to buy stocks high.
The super-low borrowing costs driven by QE’s crushing downward pressure on interest rates also unleashed a vast corporate-stock-buyback binge unlike anything ever witnessed. Corporations borrowed trillions of dollars and euros to use to buy back their own stocks, boosting their stock prices. QE both enabled and provided the incentives for this anomalous extreme financial engineering, indirectly levitating stock markets.
Stock traders’ apparent belief over this past month that the Fed starting to reverse its QE through QT and the ECB greatly slowing its QE will have no meaningful impact on QE-levitated stock prices is absurd. The simultaneous reversal and slowing of QE in the States and Europe is a hellstorm relentlessly bearing down on hyper-complacent traders. It’s the financial equivalent of a Category 5+ super-hurricane, a juggernaut.
This Thursday the ECB announced it is slashing in half its ongoing QE bond monetizations from their current €60b-per-month pace to €30b per month for the first 9 months of 2018. After that the ECB’s QE will likely cease entirely, since it is running out of available bonds to buy because the ECB’s total QE has been so vast. That means ECB QE will collapse from €720b this year to €270b next year, a radical 62.5% plunge!
The idea that stock markets won’t miss €450b of ECB bond buying next year is ludicrous. The ECB has been monetizing bonds continuously with at least a €60b-per-month pace since March 2015. That will make for colossal total QE from then to December 2017 exceeding €2040b, growing to over €2310b by September 2018. €60b per month falling to €30b for most of next year and then likely zero will have a huge impact.
At current exchange rates, that €450b drop of ECB QE from 2017 to 2018 translates into $530b. That is likely enough all alone to tank global stock markets reliant on aggressive central-bank QE like crack cocaine. But add that on top of the Fed’s first-ever quantitative tightening now getting underway, and 2018 will see the greatest central-bank tightening in history. How can that not drive an overdue stock bear?
I discussed the Fed’s new QT campaign and likely market impact in great detail a month ago right after it was announced. While the Fed’s own QE bond buying formally ended in October 2014, it held all those bonds on its balance sheet until this month. Starting this quarter, the Fed is allowing $10b per month to roll off as they mature. That effectively destroys the money created to buy those bonds, removing QE capital.
$10b per month isn’t much initially, but the Fed is slowly ramping that to a target of $50b per month by Q4’18. The math is simple. Total Fed QT in 2017 will only run $30b, a rounding error relative to the vast size of QE’s trillions of monetized bonds. But in 2018 that Fed QT will add up to $420b. Add that to the $530b of ECB QE here in 2017 but not coming in 2018 due to the taper, and markets face $950b of CB tightening!
Can the world’s two most-important central banks collectively withdraw almost a trillion dollars of liquidity in 2018 alone without blowing a gaping hole in these lofty stock markets? Not a freaking chance! And 2019 looks even worse. Total ECB QE will likely run at zero, down from €720b this year. That translates into $850b. And the Fed’s QT will run at its terminal full speed of $600b annually. That adds up to $1450b!
So on top of 2018’s $950b less of ECB QE and new Fed QT compared to this year, 2019 faces another $1450b of collective tightening from the Fed and ECB relative to 2017. That means $2.4t of central-bank liquidity that exists in this record stock market year will vanish over the next couple years. I can’t imagine a more-bearish omen for excessively-large QE-inflated stock bulls than such a vast reversal of CB flows.
This first chart ought to shatter the Wall Street myth that today’s monster stock bull was driven by profits instead of extreme central-bank QE. It superimposes the SPX over the Fed’s balance sheet, which is where those QE-financed bond purchases rest. This is the most-damning chart in the stock markets, no mean feat at such extremes. Fed QT and far-less ECB QE is the stuff of nightmares for QE-inflated stock markets!
While the Fed initially birthed QE back in late 2008’s first stock panic in a century, QE’s primary impact on the stock markets started in early 2013. That was soon after the Fed first launched and then quickly more than doubled its third QE campaign. QE3 was radically different from QE1 and QE2 in that it was open-ended, with no predetermined size or duration. That gave it a gargantuan impact on stock psychology.
Whenever the stock markets started to sell off, Fed officials would rush to their soapboxes to reassure traders that QE3 could be expanded anytime if necessary. Those implicit promises of central-bank intervention quickly truncated all nascent selloffs before they could reach correction territory. Traders realized that the Fed was effectively backstopping the stock markets! So greed flourished unchecked by corrections.
This stock bull went from normal between 2009 to 2012 to literally central-bank-conjured from 2013 on. The Fed’s QE3-expansion promises so enthralled traders that the SPX went an astounding 3.6 years without a correction between late 2011 to mid-2015, one of the longest-such spans ever! With the Fed jawboning negating healthy sentiment-rebalancing corrections, psychology grew ever more greedy and complacent.
QE3 was finally wound down in October 2014, leading to this Fed-evoked stock bull soon stalling out. Without central-bank money printing behind it, the stock-market levitation between 2013 to 2015 never would’ve happened! Without more QE to keep inflating stocks, the SPX ground sideways and started topping. Corrections resumed in mid-2015 and early 2016 without the promise of more Fed QE to avert them.
2013 was the peak-QE3 year, when the Fed monetized a staggering $1020b in bonds through QE. Such vast central-bank liquidity injections catapulted the SPX 29.6% higher that year! The Fed tapered QE3 in 2014, which added up to $450b of additional bond buying that year. And the SPX only rallied 11.4%. Fed QE dropped by 56% between 2013 and 2014, and stocks’ rallying shrunk 62%. That’s certainly no coincidence.
Then in 2015 when Fed QE was zero, the SPX slipped 0.7%. See the pattern here? The more QE from central banks, the more the stock markets rise. Those vast capital injections from the Fed levitated the US stock markets by forcing yield-starved bond investors into stocks and facilitating immense corporate stock buybacks. This QE-driven stock bull peaked in mid-2015 soon after the Fed ceased its own QE!
The bear market that follows every stock bull should’ve started in late 2012, but the Fed warded it off with its massive open-ended QE3 campaign. That ultimately totaled $1590b before it ended in late 2014, when the delayed stock bear should’ve begun. Indeed it looked like it had, as the SPX started rolling over without Fed QE boosting it. The SPX suffered its first corrections in 3.6 years in mid-2015 and early 2016.
There’s a stellar probability the dominant reason the overdue stock-market bear didn’t arrive in 2015 was the ECB started its own QE campaign in March that year. The ECB effectively took the QE baton from the Fed, keeping world stock markets levitated through massive liquidity injections. ECB QE levitated European stock markets through the same mechanisms as the Fed QE had earlier levitated the US ones.
The global stock markets are heavily interconnected. Both rallies and selloffs in either the United States, Europe, or Asia often create the psychology necessary to drive similar moves in the other markets. So the ECB’s QE directly buoying European stock markets bled into US stocks, fending off the overdue bear that the end of the Fed’s QE should’ve awoken. It was hopes for more ECB QE that rekindled this tired bull.
The Fed’s QE3 bond buying was tapered to zero in November 2014. From that announcement in late October that year, the SPX would rally another 7.3% into May 2015 on sheer momentum and euphoria. After that it drifted sideways to lower for the next 13.7 months, suffering two corrections. It wasn’t until July 2016 that a new bull high was finally seen. That was soon after the UK’s surprise Brexit vote to leave the EU.
That June 2016 referendum stunned European leaders, potentially threatening their entire project to unite Europe. Thus the ECB’s central bankers rushed to vociferously promise to do anything necessary to maintain market stability through the Brexit process. So the SPX only broke out of its mounting bear trend thanks to hopes for more ECB QE! That rally soon fizzled until Trump’s surprise victory unleashed Trumphoria.
This extreme Trumphoria stock rally since early last November was driven by euphoric hopes for big tax cuts soon, not central-bank easing. But without the ECB’s colossal €720b or the equivalent of $850b in QE over the past year since the election, odds are this Trumphoria rally would’ve either been far more muted or never even existed. The Fed’s QT and ECB QE tapering are grave threats to QE-inflated stock markets.
The chart above proves how heavily dependent the SPX is on the Fed’s balance sheet, which has never materially shrunk before 2018. The European stock markets have seen a similar phenomenon as the ECB’s balance sheet ballooned under QE. Germany’s flagship DAX stock index is Europe’s leading one. In 2016 the DAX rallied 6.9% on over €720b of ECB QE. So far this year the DAX is up 12.8% on €600b of QE YTD.
There is absolutely no doubt these global stock markets are greatly reliant on extreme central-bank QE to keep levitating to new record highs. So the stock markets are in world of hurt in 2018 and 2019, with total central-bank liquidity from the Fed and ECB falling by $950b and $1450b respectively relative to 2017! There’s probably never been a greater bear-market catalyst than record QE being thrown into reverse.
If the Fed’s QT and the ECB’s QE taper proves so devastating to stocks, won’t these central bankers simply stop doing it? They certainly don’t want to tank stock markets, as both the US and European economies really need high stocks’ wealth effect to thrive. If stock markets fall enough to spawn some real fear in Americans and Europeans, they will pull in their horns on spending which hurts the real economies.
Still I suspect the Fed and ECB won’t and can’t stop their new tightening campaigns for several reasons. Both central banks are doing everything they can to be as gradual and transparent as possible to avoid spooking markets, which is wise. Such slow rampings of the Fed’s QT and the ECB’s QE taper aren’t likely to spark a sharp stock-market plunge. They’ll just gradually turn the screws to stocks, slowly forcing them lower.
Major bear markets tend to cut stock prices in half, although worse losses are likely after such extreme fake central-bank-goosed bull-market toppings. But these bears that inevitably follow bulls generally play out over a couple years. There are about 250 trading days per year, so a 50% loss spread across two years works out to a trivial average of 0.1% per day! No one will panic if CB tightening slowly boils the bulls.
And the reason both the Fed and ECB are tightening is to reload easing ammunition for the inevitable next financial crisis. The more QE the Fed can reverse with QT, and the less the ECB’s balance sheet bloats, the more room they will have to relaunch QE when they get scared again in the future. Central bankers know it’s critical to slow, stop, and unwind QE so they rebuild room to aggressively ease again later.
Finally both the Fed and ECB spent long months if not years preparing traders psychologically leading into these CBs’ QT and QE tapering. If either central bank chickens out and pulls back in response to stock markets slowly rolling over, that itself risks igniting intense selling. The only reason the CBs would slow their crucial normalizations from extreme QE is if they feared another looming massive financial crisis.
Traders would read any course change to less tightening by either central bank as an admission of serious problems in global markets, and rush for the exits. Not carrying through on these carefully-laid tightening plans would also severely hobble these CBs’ credibility, and thus their future abilities to calm markets in a crisis. The die is cast on Fed QT and ECB QE tapering, it can’t be changed without creating big problems.
If this radically-unprecedented transition from extreme easing to extreme tightening was happening in normal fairly-valued stock markets, it would still ominously portend a major bear. But thanks to these goofy central banks artificially enlarging and prolonging this stock bull through their QE, stocks have soared way up to bubble valuations! The extreme overvaluation rampant in stock markets today greatly magnifies the risks.
This last chart looks at the average trailing-twelve-month price-to-earnings ratio of the 500 SPX stocks, both in simple-average and market-capitalization-weighted-average terms. The past year’s Trumphoria rally on big-tax-cuts-soon hopes catapulted valuations into nosebleed bubble territory. Such extremes would herald an imminent bear market even if the most extreme CB easing in all of history wasn’t reversing.
This is a complex chart with dire ramifications for investors, which I last discussed in depth in late June. For our purposes today on central banks starting to strangle this extreme bull they’ve nurtured, look at the blue SPX-valuation lines. The average SPX-component P/E ratio in both simple and MCWA terms is now over 28x. At Zeal we calculate this crucial valuation data each month-end, so September’s is the latest.
Weighted by market capitalization, the SPX stocks’ average P/E in late September was 28.7x earnings! In simple-average terms, it looked even worse at 29.3x. These numbers are conservative too, because we cap all trailing-twelve-month P/E ratios at 100x to avoid outliers skewing the overall average. Amazon alone with its insane 250x P/E would catapult these up to 31.7x and 29.6x respectively. Valuations are extreme.
The US stock markets’ average trailing P/E over the past century and a quarter is 14x, which is fair value. Double that at 28x is formally a bubble, where we are today. Euphoric traders get so excited about stock markets rallying forever that they are willing to pay any price to get in, eagerly buying stocks high instead of prudently waiting to buy low. The higher the prevailing valuations, the greater the downside risk stocks face.
While valuations aren’t a market-timing tool, bubbles always eventually pop. There are no exceptions to this rule in history. When bubbles fail stocks fall sharply, entering major new bear markets. In order to trade at 14x fair value based on today’s corporate earnings, the SPX would have to literally be more than cut in half to 1225ish! The white line above shows where the SPX would trade at that historical 14x fair value.
Even more ominous, valuation mean reversions following stock prices getting too high in bulls never just stop at the mean. Instead momentum carries them through 14x to a proportional overshoot below that to undervalued levels. So there’s a high probability the inevitable next stock bear won’t bottom until stocks are trading well under 10x earnings, which would make for a bigger-than-50% bear from today’s bubblicious levels.
The key point here is stock markets are exceedingly risky on bubble valuations alone after central banks’ unprecedented extreme easing forced them so high for so long. Even if the Fed wasn’t embarking on QT to reload for future easing, even if the ECB wasn’t tapering QE because it’s running out of bonds to buy, a new stock bear would be a near-certainty on extreme valuations alone. Bulls are always followed by bears.
But throw in Fed quantitative tightening and ECB quantitative-easing tapering on top of that, and we are set up for one of the worst stock bears on record after one of the biggest and longest bulls ever. Truly these central banks that fostered this monstrous bull are now starting to strangle it. The next couple of years are going to see literally trillions of dollars less CB liquidity than the markets have enjoyed in 2017!
Again between Fed QT ramping and ECB QE tapering, 2018 is on track to see a colossal total $950b less capital injected from the Fed and ECB compared to this year. And based on the Fed’s and ECB’s current plans which are hard to slow or stop without destroying market confidence, 2019’s CB liquidity will come in at another $1450b lower than 2017’s. We are talking about $2.4t of effective tightening over the next 2 years!
There is zero chance stock markets will be able to ignore such radically-unprecedented CB tightening. $1.2t a year is a devastating hit to liquidity. Remember in 2013 the SPX soared 29.6% on $1020b of Fed QE via QE3. What’s going to happen to stock markets in 2018 when that reverses to -$420b with Fed QT alone, or 2019 at another -$600b with Fed QT running full speed? Add ECB tapering on top of that.
The unpopular hard truth euphoric investors don’t want to hear is stock markets ain’t gonna be pretty under Fed QT and ECB QE tapering. For the love of all things good and holy, take this seriously! Just like in all past stock-market toppings, greed and complacency are extreme so traders have no fear of this imminent central-bank-tightening threat. But it’s a Category 5+ hellstorm, unprecedented in stock-market history.
Investors really need to lighten up on their stock-heavy portfolios, or put stop losses in place, to protect themselves from the coming valuation mean reversion in the form of a major new stock bear. Cash is king in bear markets, as its buying power increases as stock prices fall. Investors who hold cash during a 50% bear market can double their stock holdings at the bottom by buying back their stocks at half price!
Put options on the leading SPY S&P 500 ETF can be used to hedge downside risks. They are cheap now with euphoria rampant, but their prices will surge quickly when stocks start selling off materially. Even better than cash and SPY puts is gold, the anti-stock trade. Gold is a rare asset that tends to move counter to stock markets, leading to soaring investment demand for portfolio diversification when stocks fall.
Gold surged nearly 30% higher in the first half of 2016 in a new bull run that was initially sparked by the last major correction in stock markets early last year. If the stock markets indeed roll over into a new bear in 2018, gold’s coming gains should be much greater. And they will be dwarfed by those of the best gold miners’ stocks, whose profits leverage gold’s gains. Gold stocks rocketed 182% higher in 2016’s first half!
The key to thriving and multiplying your fortune in bull and bear markets alike is staying informed, about broader markets and individual stocks. That’s long been our specialty at Zeal. My decades of experience both intensely studying the markets and actively trading them as a contrarian is priceless and impossible to replicate. I share my vast experience, knowledge, wisdom, and ongoing research in our popular newsletters.
Published weekly and monthly, they explain what’s going on in the markets, why, and how to trade them with specific stocks. They are a great way to stay abreast, easy to read and affordable. Walking the contrarian walk is very profitable. As of the end of Q3, we’ve recommended and realized 967 newsletter stock trades since 2001. Their average annualized realized gain including all losers is +19.9%! That’s hard to beat over such a long span. Subscribe today and get ready before CB tightening crushes stocks!
The bottom line is the Fed and ECB have started strangling this extraordinary stock bull they nurtured. After being levitated for years by trillions of dollars and euros of quantitative easing, these central banks have started tightening. The Fed has birthed quantitative tightening, which will increasingly reverse its own extreme QE. On top of that the ECB will radically slow its own QE next year, for unprecedented tightening.
This is the death knell for QE-inflated stock markets driven to extreme bubble valuations by epic central-bank monetary injections. The Fed and ECB are finally taking away their easy-money punch bowls, with truly-dire implications for stock markets. Trillions of dollars and euros of tightening in the next couple years will finally unleash the long-overdue stock bear delayed by QE, which will likely prove proportionally oversized.
Adam Hamilton, CPA
October 27, 2017
Copyright 2000 – 2017 Zeal LLC (www.ZealLLC.com)

By now, most readers invested in the Lithium (“Li“) sector know about brine deposits, especially those located in South America’s “Lithium Triangle” (Chile, Argentina & Bolivia). And, many are familiar with conventional hard rock mining for Li, most of which takes place in western Australia.
However, readers likely know very little about a third source of potential Li supply; from claystone deposits. One small company betting on a technology solution to unlock its mineral wealth is Cypress Development Corp. (TSX-V: CYP) / (OTCBB: CYDVF). 49.5 M shares outstanding @ C$0.185 = C$ 9 M market cap. C$1.5 M in cash.
Cypress controls 100% of the contiguous Dean and Glory claim blocks covering an area totaling 4,220 acres in Clayton Valley, Nevada, immediately east of Albemarle’s Silver Peak Li operations and Pure Energy Minerals’ project (PEA-stage, C$330 M after-tax NPV(8%) on its southwest boundary. Management believes that the consistent nature of the currently known Li mineralization is highly encouraging for both the potential size and potential resource extraction methodologies. (see corporate presentation, but please return!)
To date, all of Cypress’ drilling has been on the Dean property where a 9-hole drill program was completed earlier this year. But, a recent press release explains that Cypress plans to drill 12 holes totaling 4,000 feet. The 2017 fall program will be divided between the Dean and Glory projects…. Upcoming drill results represent an important near-term catalyst for the company.
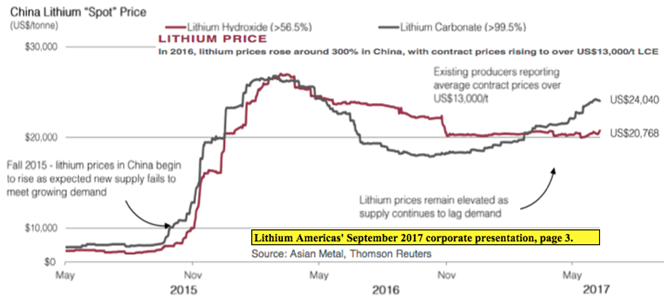
Li Prices up 200% — a Game Changer For Unconventional Li Deposits
What readers have probably heard about what I call “unconventional Li deposits” (i.e. not brine or hard rock) is true, there’s currently no meaningful commercial-scale production from claystone deposits anywhere in the world. However, it’s very important to recognize one crucial observation…. Li prices have roughly tripled in just the past 2 years. In fact, spot prices in China have quadrupled, (see chart below) currently perched above US$ 20k/metric tonne, at or near all-time highs.
Today’s very strong Li prices are a game changer, greatly incentivizing the world to invent a better mousetrap. The exciting thing in my view is that more and more mousetraps are being built and tested. Not just methods to extract Li from claystone, but dozens of Li brine processing technologies, some of which could be amenable to unconventional Li deposits.
Simply put, if or when a commercial technology or technologies to exploit unconventional Li deposits is developed, the value of claystone properties such as those held by Cypress could soar.
We’ve seen this movie before…. Consider the oil shale industry 10-15 years ago when the benefits of horizontal drilling were first becoming known. Speculators started grabbing acres surrounding known fracking hotspots, (not knowing how much, if any, hydrocarbon abundance was in place) initially paying $100-$200/acre. Within a few years, the best located acres were trading at $10,000-$20,000/acre.
Unlike outright speculation on oil shale, in Cypress’ case we already know there’s Li in the ground, possibly high-grade compared to brine deposits, possibly large tonnage compared to hard rock deposits. What we don’t know yet is if it’s technically and environmentally feasible to separate the Li from the clay, mud and other materials and profitably sell it. So, again, that’s the primary risk of investing in Cypress Development Corp. A big risk, but a known risk that can be weighed against other risks that Li juniors face.
There is another notable risk factor. Access to water in Nevada is extremely important. In Clayton Valley, and many other arid parts of the State, it can be very difficult to obtain water rights. However, Cypress might not have the same risk exposure as peers looking to exploit traditional brine resources. The Company does not propose to tap Li-saturated brine that a neighboring party could claim to own or control.
Cypress will need access to process water, not the minerals (lithium/boron/potassium) in the water– a big difference. And, the amount of water required would presumably be far less (and probably recyclable) because Cypress would not be filling giant solar evaporation ponds like Albemarle’s nearby Silver Peak processing facilities.
Neighbor Lithium Americas’ Delivering New PFS in Mid-2018…
So, how close is the industry to solving these complex technical & environmental challenges of commercial extraction of Li from claystone deposits? In my opinion, closer than many might guess, but with the important caveat that each deposit is unique. For example, Lithium Americas (TSX: LAC) / (OTCQX: LACDF) has a clay deposit, the Lithium Nevada project, (formerly Kings Valley) that was actively explored, developed and promoted in 2009-2013, when the company was called Western Lithium USA Corp.
A Preliminary Feasibility Study (“PFS“) on Kings Valley was completed in 2012, and a pilot plant running Kings Valley ore operated successfully in Germany for years. A substantial amount of effort and capital was deployed, but with a Li price in the US$5,000/t area, LAC decided not to pursue the project. Fast forward to 2017, LAC is developing a new production flow sheet that will incorporate a number of operational improvements, but by far the biggest enhancement to the project’s actual economics will be a much higher long-term Li price assumption.
As I write this, LAC just committed to delivering a brand new PFS by June 30, 2018, and commented,
“While proprietary, much of our work relies on the application of commercially available solutions that could be deployed quickly and reliably.” Also, according to LAC management, “…the Lithium Nevada Project’s Li clay resource is the largest known lithium resource in the U.S.”
This suggests, in my opinion, that LAC will be putting out a PFS next year that contains a Net Present Value (“NPV”) in the hundreds of millions of U.S. dollars. The market will take notice, and since LAC’s market cap is currently ~C$ 1 billion (due almost entirely to the company’s JV with SQM on a world-class Li brine project in Argentina), LAC should meet with success in attracting global battery & car manufacturers, among others, to the table to talk about strategic investments and off-take agreements.
Will Global Geoscience & Bacanora Prove Clay Deposits Economic?
Bacanora Minerals (TSX-V: BCN) has done a tremendous amount of work on unconventional Li deposits. In its case, in Mexico, on the Sonora Lithium clay deposit. Management is close to delivering a Bank Feasibility Study (“BFS“). Bacanora has been operating a pilot plant for over 2 years and reportedly has the kinks worked out. Japanese trading giant Hanwa is a strong financial backer and has a robust off-take agreement in place with Bacanora.
Nevada neighbor Global Geoscience Ltd. (ASX- GSC) is an Australian-listed junior with a clay deposit in Nevada. It is finishing up a PFS on its Rhyolite Ridge Lithium-Boron Project that has an estimated 3.4 million tonnes of Li carbonate. Unlike Cypress’s project, Rhyolite Ridge’s economics rely on the co-production of boric acid. This is not necessarily a good or bad thing; it just highlights that each project is unique. GSC shares have nearly quadrupled in the past year.
Bacanora’s market cap is ~C$ 190 M. Global Geoscience’s market cap is ~C$ 310 M. Both are making steady progress towards unlocking the value of their unconventional Li deposits. I believe that positive developments for these and other unconventional Li companies will provide a flow of really good news for Cypress. The Company has about 49.5 M shares outstanding post the recently closed capital raise. Its market cap is just ~C$ 9 M.
I strongly believe that with big news from Lithium Americas, Bacanora Minerals and Global Geoscience next year, Cypress will be on the radar screens of a number of global Li players, both financial & strategic companies.
MGX Minerals (TSX-V: XMG) is another technology-backed unconventional Li deposit winner that grabbed the attention of investors in 2017. Its stock price is up ~500% in the past year. MGX is harnessing technology to extract Li from oilfield brine wastewater. Like LAC, BCN & GSC, MGX is not in operation. MGX’s market cap is about C$ 80 M.
Cypress; in the Right Place at the Right Time and a Cheap Valuation
First Cypress has to prove up an attractive maiden resource, then it simply needs to continue following in the footsteps of Lithium Americas, Bacanora & Global Geoscience as those companies publish a PFS and/or a BFS, lock-in large strategic/financial partners and off-take agreements. But fear not, none of the clay deposits will be in large-scale production anytime soon, so they won’t even put a dent in a possible supply crunch around the turn of the decade, and won’t put a cap on Li prices!
Make no mistake, Cypress’ projects are earlier-stage than the companies I’ve mentioned, but in some respects might not be higher risk. For example, the Dean and Glory projects would probably have lower strip ratios than many global Li projects (both conventional & unconventional).
Management Team is Amazing for a Small Company
Typically, small companies have trouble attracting big talent, but not so in this case. Why? Because smart people saw the opportunity, they saw what I’m describing in this article, basically, they saw the writing on the wall…. there’s not going to be enough Lithium! All potential commercial-scale Li sources will be pursued to the ends of the earth. And, with the Li price at US$20k/t+ vs. US$5k/t, the “when” can’t come fast enough.
That’s why Bill Willoughby, PE, PhD joined the Company this year. What better person to have as CEO than a rock star, PhD mining Engineer during a once in a lifetime opportunity like this? (the paradigm shift from ICE- powered to EV). Bill has nearly 30 years’ experience at natural resource development companies. Will this be his greatest success to date? Dr. Willoughby was kind enough to provide the following quote, an exclusive for this article,
“We feel our project is unique due to its location and physical traits. To our knowledge, Clayton Valley has the only deposits of lithium claystone that are situated next to an existing brine operation. Besides location, our deposit is shallow, flat-lying soft rock in which the lithium appears readily soluble. With the large apparent size, we’ve seen from our drilling and the lateral extent of the deposit, we believe all these factors combine to a unique opportunity to develop a significant new source of lithium.”
In addition, the Cypress team has used, and continues to work with, very well-known and respected ALS / Chemex in Reno, NV and SGS lab in Ontario.
Cypress is sitting on Li–bearing property that could be worth a hell of a lot more than its C$ 9 M market cap. This will not be an overnight success, a near-term commercial-scale producer, but actual production is not what’s required for a higher valuation. What’s needed is a credible path towards that end, management is on that path and working diligently.
All 9 previous holes at Dean encountered significant Li values within claystone, which ranged up to 1,790 ppm Li (1,790 mg/L Li) and averaged 900 ppm Li (900 mg/L Li) throughout the average drill-depth of 243 feet. Mineralization outcrops at surface, and average Li mineralization thickness is greater than 210 feet. The program covered an area measuring about 12,000 feet in length by 4,000 feet in width. The Li-bearing claystone is considered open in all directions.
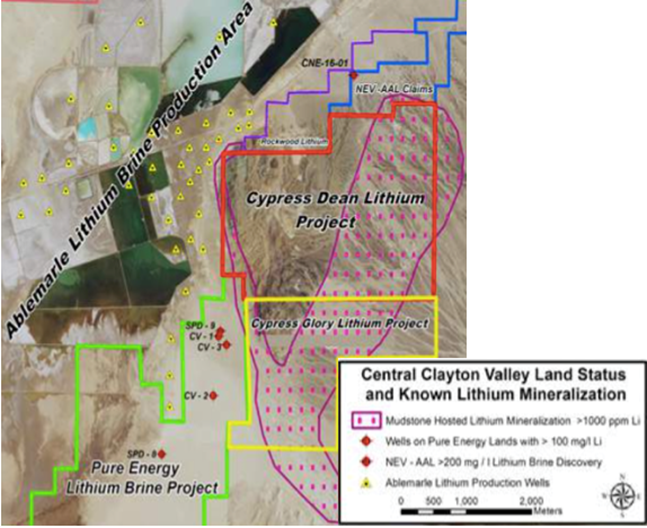
South of the Dean claim block, extensive sampling by Cypress on the Glory claims identified Li mineralization in surface exposures of claystone which ranged up to 3,800 ppm Li (3,800 mg/L Li) over 9,500 feet along the same trend encountered on the adjoining Dean claims. Results suggest a strong possibility of continuous mineralized volume of a highly leachable Li-rich claystone at surface on the Glory project.
The goal of the work on both properties is to substantiate the potential to produce Li directly from the mineralized claystone with a low-cost and environmentally friendly approach, without the need for roasting or other costly mining and complex treatments. Cypress is proceeding with additional leach studies to determine the amount of Li extraction possible from the claystone and provide further data on the feasibility of a large-scale leach extraction method.
So, to recap so far; in my opinion it seems reasonable that Cypress will be able to come up with a maiden mineral resource estimate in the next 6 months. Further, based on historical samples, drilling and other exploration, there’s reason to believe that the maiden resource could be sizable and relatively high-grade. The claystone mineralization is soft and near-surface, so there’s no doubt that ore would be easy and low-cost to extract. The main risk is that there is no known technology that can process Cypress’ Li deposits cost effectively and in an environmentally friendly manner.
From the latest Cypress press release, quote,
“Cypress believes its claystone deposit in Clayton Valley has the potential to contain a significant resource of lithium, and may have physical and logistical features that could make it a productive, long-term source of lithium. In addition to the ongoing drilling program, Cypress is continuing studies to determine the exact nature and distribution of the lithium mineralization in the claystone, and identify an effective means of extraction.”
Conclusion
Boy this time next year, there could be two half-billion dollar Li clay projects in Nevada! Either or both project owners might have lined top Battery or EV manufacturers to drive them forward. Notice I haven’t even mentioned Nevada’s Tesla, there’s no need, it could be anyone, literally dozens and dozens of companies. If so, will tiny Cypress Development Corp. (TSX-V: CYP) / (OTCBB: CYDVF) still be valued at C$ 9 M?
Although years away from commercial-scale production, Cypress is year(s) ahead of unconventional Li deposits that have not been staked, permitted for initial exploration, sampled or had preliminary testing or metallurgy done…. Remember, each deposit is unique, and most high-grade Li deposits might not be nearly as amenable as Cypress’ Dean and Glory projects to potential exploitation due to distance from infrastructure, depth of deposit, grade, continuity, chemistry (concentration of coincident deleterious elements) jurisdiction, and other factors.
Cypress Development is a company worthy of further investigation by readers. Here are some places to go for further information.
JuniorStockReview by Brian Leni P.Eng
Ahead of the Herd article by Rick Mills
The Stateside Report by Vince Marciano
Energy & Gold Ltd. Website by Scott Armstrong
Disclosures: The content of this interview is for illustrative and informational purposes only. Readers fully understand and agree that nothing contained herein, written by Peter Epstein of Epstein Research, [ER] including but not limited to, commentary, opinions, views, assumptions, reported facts, estimates, calculations, etc. is to be considered implicit or explicit, investment advice. Further, nothing contained herein is a recommendation or solicitation to buy or sell any security. Mr. Epstein and [ER] are not responsible for investment actions taken by the reader. Mr. Epstein and [ER] have never been, and are not currently, a registered or licensed financial advisor or broker/dealer, investment advisor, stockbroker, trader, money manager, compliance or legal officer, and they do not perform market making activities. Mr. Epstein and [ER] are not directly employed by any company, group, organization, party or person. Shares of Cypress Development Corp. are highly speculative, not suitable for all investors. Readers understand and agree that investments in small cap stocks can result in a 100% loss of invested funds. It is assumed and agreed upon by readers that they consult with their own licensed or registered financial advisors before making investment decisions.
At the time this article was posted, Peter Epstein owned shares in Cypress Development Corp. and the Company was an advertiser on [ER]. By virtue of ownership of the Company’s shares and it being an advertiser on [ER], Peter Epstein is biased in his views on the Company. Readers understand and agree that they must conduct their own research, above and beyond reading this article. While the author believes he’s diligent in screening out companies that are unattractive investment opportunities, he cannot guarantee that his efforts will (or have been) successful. Mr. Epstein & [ER] are not responsible for any perceived, or actual, errors including, but not limited to, commentary, opinions, views, assumptions, reported facts & financial calculations, or for the completeness of this article. Mr. Epstein & [ER] are not expected or required to subsequently follow or cover events & news, or write about any particular company or topic. Mr. Epstein and [ER] are not experts in any company, industry sector or investment topic.
The silver miners’ stocks have mostly drifted sideways this year, looking vexingly comatose. Such dull price action repels speculators and investors, so they’ve largely abandoned this lackluster sector. That weak trader participation has led to silver stocks’ responsiveness to silver price moves decaying. What can shock silver stocks out of their zombified stupor? And how soon is such an awakening catalyst likely?
Silver stocks’ flatlined behavior so far in 2017 is surprising and odd. Silver-stock prices are ultimately driven by silver-mining profits, which are overwhelmingly driven by prevailing silver price levels. Silver in turn is slaved to gold’s fortunes, the yellow metal is the white metal’s dominant primary driver. With gold faring quite well this year despite the euphoric record stock markets, silver and its miners’ stocks should be shining.
Since silver is a tiny market compared to gold, silver’s moves tend to leverage gold’s. The best global silver and gold supply-and-demand fundamental data available comes from the Silver Institute and World Gold Council respectively. According to them, worldwide silver and gold demand last year ran 1027.8m ounces and 4337.4 metric tons. Along with average prices, these can be used to approximate market sizes.
Silver and gold averaged $17.12 and $1250 last year. Run these numbers, and 2016’s total global silver and gold markets were worth about $17.6b and $174.3b. This latest-available data shows silver’s market is literally an order of magnitude smaller than gold’s! With silver only enjoying 1/10th the capital flows of gold, silver tends to be far more responsive. Any dollar of buying or selling is 10x more impactful for silver.
The silver market’s small size is one of this metal’s greatest strengths. Compared to the vastly-larger broader markets, it doesn’t take much new buying to catapult silver dramatically higher. Speculators and investors alike usually get interested in shifting capital into silver when gold is already rallying. Silver then tends to rally much more than gold, leveraging its upside, because silver inflows are relatively larger.
Given gold’s good performance this year, silver and the stocks of its miners should’ve surged. Year-to-date gold is up 11.3%, well ahead of full-year 2016’s 8.5% gain. But instead of amplifying gold’s 2017 advance by 2x to 3x like usual, silver is only up 6.7% YTD as of this week. This makes for really poor leverage to gold of 0.6x. Last year silver rallied 15.1%, yielding still-weak-but-more-normal 1.8x upside leverage.
Silver’s serious underperformance relative to gold this year has greatly retarded traders’ interest in the silver miners’ stocks. The leading silver miners’ trading vehicle and sector-index proxy is the SIL Global X Silver Miners ETF. Because of the great profits leverage to silver inherent in the silver miners, their stocks usually amplify silver’s upside. But YTD SIL is only up 4.0%, for extremely-poor 0.6x leverage!
Gold stocks aren’t having a great year either, with their leading GDX ETF only up 11.5% YTD compared to gold’s 11.3% gains. Like silver stocks, their gains tend to multiply their underlying metal’s gains by 2x to 3x. But the gold stocks’ weak in-line performance so far in 2017 highlights just how bad silver stocks’ lagging performance is. They have been largely drifting comatose this year, hardly even responding to silver.
Silver stocks have serious problems, and they certainly aren’t fundamental. Every quarter I analyze the latest operating and financial results from the top silver miners of SIL. They will soon start reporting their new Q3’17 results, but the prior quarter’s are the latest now available. In Q2’17 SIL’s elite top silver miners reported average all-in sustaining costs of $11.66 per ounce, well below average silver prices of $17.18.
That implies hefty industrywide silver-mining profits of $5.52 per ounce. While the average silver price did slump 2.0% sequentially in Q3 to $16.84, that’s certainly no fundamental threat. Assuming flat mining costs, the silver miners still should’ve been able to earn $5.18 per ounce last quarter. That’s down 6.2% quarter-on-quarter, but is still very profitable. Fundamentals can’t explain silver stocks’ vexing malaise this year.
That narrows down the suspect list to technicals and sentiment. This first chart looks at the price action in SIL and silver over the past couple years or so. Silver miners’ responsiveness to silver moves was excellent last year, but is decaying dramatically this year. With speculators and investors abandoning this sector, it’s barely budging. That has spawned a vicious circle convincing other traders to avoid silver stocks.
Silver stocks’ troubling lethargy is new this year. Back in December 2015 two days before the Fed’s first rate hike of this cycle, silver slumped to a major 6.4-year secular low in concert with gold. Silver stocks bottomed just over a month later in January 2016 paralleling the gold stocks. SIL fell to an all-time low in split-adjusted terms that day. A couple months earlier, Global X had executed a 1-for-3 reverse split in SIL.
Silver stocks were so deeply out of favor in late 2015 that this leading ETF’s managers feared SIL’s price would collapse low enough to risk delisting! Out of that very despair, strong new bull markets in silver and its miners’ stocks were born. In just 6.9 months from mid-January to mid-August 2016, SIL rocketed 247.8% higher on a 40.6% silver rally! That made for outstanding 6.1x upside leverage to silver prices.
Naturally silver and its miners’ stocks were soon sucked into gold’s correction following its own new bull’s initial upleg. Those silver and SIL corrections ballooned to monstrous proportions, thanks to gold-futures stops being run then Trump’s surprise election victory unleashing stock-market euphoria. So over the next 4.2 months, silver and SIL plunged 20.1% and 42.5%. SIL’s downside leverage to silver of 2.1x was modest.
2016’s behavior is the way silver stocks normally react to silver-price moves. The blue SIL and red silver lines above were closely intertwined last year. Silver stocks generally rallied and fell sharply in lockstep with silver itself. This normal behavior carried over into the first couple months of 2017, when SIL surged 33.6% between late December 2016 and early February 2017 on a mere 12.5% parallel rally in silver itself.
Silver stocks were leveraging silver’s upside by 2.7x, near the high end of their usual 2x to 3x range. So back in late January the silver stocks’ 2017 prospects looked really bullish. Things started going awry in February and March. The silver stocks corrected hard, plunging 21.1% in a month on a relatively-small 4.5% silver pullback. That made for big 4.7x downside leverage that was quite excessive, scaring traders.
So they started to flee silver miners’ stocks, a trend that’s continued ever since. With each subsequent silver rally since March, silver stocks have become less and less responsive to silver upside. This year’s blue SIL line above is no longer mirroring and amplifying the underlying volatility in the red silver line. It’s as if silver stocks are flatlining relative to silver, which is very strange. I can’t recall seeing anything like this.
Thus silver stocks have been stuck in a descending-triangle consolidation pattern for much of this year. They finally enjoyed breakouts from this triangle’s upper resistance and SIL’s 200-day moving average in August, mirroring similar major breakouts in gold stocks. But silver stocks’ responsiveness to silver continued decaying. In a month leading into early September, SIL only climbed 11.3% on an 11.5% silver rally.
Technically it looks like silver stocks have largely disconnected from silver. They’ve lapsed into this super-weird zombified comatose state. Speculators and investors alike aren’t the least bit interested in silver miners today, because they’re performing so poorly. And the resulting lack of participation in this sector scares away other traders, exacerbating the problem. Silver stocks have effectively been left for dead.
After decades studying and actively trading silver stocks, I’ve pondered this strange anomaly quite a bit in recent months. It’s certainly not fundamentally-driven, as silver miners’ earnings are looking good. It’s likely not technical either. While silver stocks are really underperforming, they haven’t suffered a serious selloff. SIL’s triangle support around $33 has held rock solid all year long, so this is a consolidation not a correction.
That leaves sentiment as the culprit behind silver stocks’ vexing stupor this year. Traders’ psychology is important in all markets, but disproportionately so in silver. Silver is a tiny highly-speculative market, exceptionally sensitive to shifting winds of sentiment. While weak technicals breed bearish sentiment and that becomes self-reinforcing, there had to be some root causes poisoning silver psychology earlier this year.
I suspect multiple factors are to blame. Once again silver sentiment is heavily dependent on gold. In the wake of Trump’s election win almost a year ago, stock markets soared in Trumphoria on hopes for big tax cuts soon. That hammered gold, which is hostage to stock-market fortunes. Gold is an anti-stock trade that usually moves counter to stock markets, so gold investment demand collapsed after the election.
Gold’s own psychology was utterly miserable late last year, exceedingly bearish. When gold fell to $1128 right after the Fed’s second rate hike of this cycle last December, Wall Street forecasts calling for a plunge under $1000 exploded. Traders don’t get interested in silver until gold is already rallying, so the extreme gold gloom and doom late last year certainly tainted silver sentiment. It has yet to recover from that.
Though gold bounced sharply and has enjoyed a good 2017, silver oddly didn’t join in. Gold itself likely played a major role. Despite gold’s gains this year, gold sentiment has remained pretty bearish. With the stock markets magically levitating in Trumphoria on those fervent big-tax-cuts-soon hopes, gold was flying under traders’ radars. With virtually no enthusiasm for gold, silver psychology had nothing to feed on.
The speculative traders who flock to silver for its sharp rallies and big gains were finding greener pastures elsewhere. Throughout the year various mainstream stock-market sectors have surged, so traders could find strong gains outside the precious metals. I’m certain this year’s extraordinary bitcoin bubble diverted interest away from silver too. The stratospheric skyrocketing of bitcoin prices has captivated traders.
Bitcoin’s value is hyper-speculative, as bitcoins are a synthetic virtual construct given perceived worth by software creating artificial scarcity. Having been in the financial-newsletter business for almost a couple decades now, I hear and read endless market anecdotes. This year I’m seeing the same types of traders who are usually interested in speculative silver raving about bitcoin instead. Bitcoin is a speculative mania!
Both in my own private feedback from countless traders around the world, and on the Internet’s popular gold and silver forums, the usual gold and silver conversations have shifted to gold and bitcoin this year. There’s no doubt bitcoin has stolen some limelight from silver, and almost certainly sucked away some of the capital that would’ve flowed into silver in 2017 too. Bitcoin is this year’s alternative speculation of choice.
But bitcoin’s meteoric rise won’t eclipse silver forever. Silver investment has been around for millennia, but bitcoin was just introduced in January 2009. As of this week bitcoin is up an astounding 485% YTD in 2017 alone! Such extreme vertical gains are never sustainable, as history has abundantly proven. So bitcoin’s epic competition this year for mindshare and capital from traditional silver speculators won’t last.
While bitcoin is definitely a factor in the lack of interest in silver and silver stocks this year, these record-high Trumphoria-goosed stock markets are far more important. As long as gold psychology is bearish as stocks seemingly do nothing but rally forever, silver’s speculative appeal will languish. Once these lofty stock markets inevitably roll over, gold and therefore silver investment will return to favor just like in early 2016.
Gold and silver slumped to brutal 6.1-year and 6.4-year secular lows in December 2015, everyone hated the precious metals. But the US stock markets finally succumbed to their first corrections in 3.6 years, an extreme near-record span. As the S&P 500 fell 12.4% in 3.2 months in mid-2015 followed by another 13.3% in 3.3 months into early 2016, long-neglected gold and silver demand returned with a vengeance.
Gold and silver surged 29.9% and 50.2% higher over the next half-year or so, igniting their first new bull markets in years! The next correction-grade stock-market selloff, over 10% on the S&P 500, will spark another renaissance in gold and silver investment demand. After being miraculously delayed for so long, that next major stock-market selloff is overdue and imminent. The risk factors stacking against stocks are legion.
The US stock markets are literally trading in bubble territory, over 28x earnings on the traditional trailing-twelve-month basis. They’ve rallied so long and so high that euphoria is extreme, with all measures of sentiment showing dangerous bull-slaying levels. And the Fed just birthed quantitative tightening for the first time in history, which is exceedingly bearish for these quantitative-easing-inflated artificial stock markets.
The stock markets finally decisively rolling over is the most-likely catalyst to shock silver and the stocks of its miners out of their comatose malaise. The silver stocks are perfectly poised for a first-half-of-2016-like scenario, where SIL rocketed 247.8% higher in just 6.9 months. The driver will be silver’s next major bull-market upleg. Silver remains radically undervalued relative to gold, thus enjoying colossal upside potential.
This next chart looks at the Silver/Gold Ratio, which simply divides the daily silver close by the daily gold close. Technically that results in little decimals that are hard to parse mentally, so I prefer using a scale-inverted gold/silver ratio which is the same thing. It yields more-meaningful whole numbers like 75.5 where the SGR stands today. This is way too low based on historical precedent, an unsustainable anomaly.

This week it took over 75 ounces of silver to equal the value of one ounce of gold. That’s a really-high SGR historically, meaning silver prices are really low relative to gold. Silver’s extreme undervaluation is a key reason speculators and investors aren’t interested in silver stocks today. That will change dramatically as silver inevitably resumes mean reverting higher relative to gold. Silver will outperform for a long time.
Before 2008’s stock panic, the SGR averaged 54.9. After the stock panic between 2009 to 2012, the SGR averaged 56.9. So outside of the extreme SGR anomalies driven by the stock panic and later the Fed’s QE3-conjured stock-market levitation from 2013 on, a mid-50s SGR is normal. This has proved true all throughout modern history due to geological and relative silver-and-gold supply-and-demand reasons.
During late 2008’s stock panic, the SGR briefly averaged an extremely-low 75.8. That soon gave way to a sharp mean reversion higher to reestablish silver’s usual relationship with gold. That mean reversion overshot dramatically, as is often the case with silver after an SGR extreme. In April 2011 when silver was enjoying mania-like popularity the SGR briefly peaked at 31.7! Silver’s upside is extreme after low SGRs.
Incredibly since Q4’15, when silver and gold hit their major 6-year secular lows, the SGR has averaged just 73.6. That’s not much better than late 2008’s stock-panic levels! So silver is long overdue to mean revert relative to gold, rallying much faster than gold for months on end until this relationship is restored. We don’t need to assume a likely overshoot, as a simple mean reversion alone would drive huge silver gains.
Assuming a 56 normal SGR, at this week’s $1280 gold price silver should be trading over $22.75. That’s 35% above prevailing price levels. But with gold itself readying to rally, silver’s mean-reversion targets climb much higher with gold prices. Another 30% gold upleg like in early 2016, which is modest by gold’s historical standards, would take it to $1665. At a 56 SGR, silver would have to soar 75% to around $29.75!
Since silver prices remain so depressed relative to their primary driver gold’s, the silver upside potential from here is enormous. This overdue silver mean reversion higher is what will shock silver stocks back to life. Once speculators and investors see silver starting to run, they are going to flood back into beaten-down silver stocks with reckless abandon. That will catapult this small sector radically higher like in early 2016.
The trigger reigniting silver will be gold powering higher, and again that will likely result from these crazy stock markets rolling over. Once these bubble-valued stock markets start decisively weakening, traders will rush to return to gold, silver, and their miners’ stocks to prudently diversify their stock-heavy portfolios. The Fed’s QT juggernaut ramping up over the next year will likely set this chain of events in motion.
Recent months’ comatose silver stocks are largely the product of general-stock euphoria leaving silver radically undervalued relative to gold. Silver psychology is very bearish, so traders aren’t the least bit interested in owning its miners. Sprinkle in the extreme allure of the bitcoin mania for the speculative traders who crave silver’s normal volatility, and that explains 2017’s serious anomaly in silver and silver stocks.
When this all changes, silver will move fast. This restless and volatile metal has a long history of drifting sideways and doing little. But occasionally the winds of sentiment shift enough to ignite enormous bull markets and uplegs generating fortunes. Traders who have the discipline to wait out silver’s sometimes-vexing consolidations are greatly rewarded when capital really flows into silver again, catapulting it far higher.
The greatest gains in this next major silver upleg won’t be won in silver-stock ETFs like SIL. They are burdened with too many companies that aren’t primary silver miners, the majority of their revenues come from other metals. So they aren’t very responsive to silver’s upside. But the purer individual silver miners with superior fundamentals will enjoy massive gains trouncing the ETFs. They are the best way to play silver.
The key to riding any silver-stock bull to multiplying your fortune is staying informed, both about broader markets and individual stocks. That’s long been our specialty at Zeal. My decades of experience both intensely studying the markets and actively trading them as a contrarian is priceless and impossible to replicate. I share my vast experience, knowledge, wisdom, and ongoing research through our popular newsletters.
Published weekly and monthly, they explain what’s going on in the markets, why, and how to trade them with specific stocks. They are a great way to stay abreast, easy to read and affordable. Walking the contrarian walk is very profitable. As of the end of Q3, we’ve recommended and realized 967 newsletter stock trades since 2001. Their average annualized realized gain including all losers is +19.9%! That’s hard to beat over such a long span. Subscribe today and get invested before silver stocks power way higher!
The bottom line is silver stocks have largely drifted comatose this year, with decaying responsiveness to silver moves. The extreme stock-market euphoria has left gold psychology bearish, bleeding into silver sentiment. And the spectacular bitcoin bubble has diverted speculative traders’ interest and capital away from silver as well. All this has led traders to largely abandon silver miners, condemning their stocks to consolidate.
But the likely catalyst to shock silver stocks from their zombified stupor is nearing with each passing day. Once these QE-inflated stock markets inevitably succumb to QT, gold and silver investment demand will return. The tiny silver market will rapidly surge on major capital inflows, with lots of room to mean revert far higher relative to gold. Then speculators and investors alike will rush to buy the cheap silver miners’ stocks.
Adam Hamilton, CPA
October 20, 2017
Copyright 2000 – 2017 Zeal LLC (www.ZealLLC.com)

According the United Nations, the world’s population is projected to reach 9.8 billion by 2050 and 11.2 billion by 2100. Countries will need to maximize resources and reduce their reliance on imports to feed their citizens. This reality, in turn, is creating opportunities for companies to play an important role in developing the necessary infrastructure to make agriculture sustainable and reduce carbon emissions.
This year, Brazil Potash, a potash mine development company located in Brazil, received the “Top Engenharia” award as the most recognizable engineering project currently underway in the country’s agribusiness sector by the Federal University of Minas Gerais (“UFMG”) Alumni Association. Every year, UFMG conducts a survey of over 3,000 alumni of its Engineering School, asking them to identify which companies in each sector demonstrate engineering excellence. Brazil Potash’s Autazes project stood out not only for the critical infrastructure it would provide, but also the environmental benefits it will bring.
Potash is an essential nutrient to growing food with no substitute and is therefore vital to feeding the rising global population. At 8.8MTpa of consumption, Brazil is the world’s second largest and fastest growing market for potash, but imports 95% of its needs from mines located 14,000 to 20,000 kilometers away.
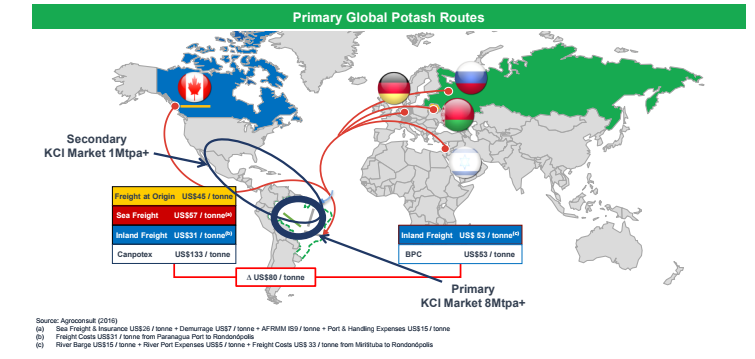
Brazil Potash holds exclusive title to a world-class scale potash basin located in the Amazon State of Brazil only 8 kilometers from a major river system that will be used to transport initial planned production of 2.4MTpa on river barges to farmers in Brazil. Based on today’s depressed global oil prices and shipping rates, Brazil Potash is able to mine, process and deliver its potash for the same cost as importers logistics costs alone. This substantial and sustainable logistics cost advantage will increase with anticipated global raising oil prices and results in a Green House Gas (GHG) emission savings of roughly 508kTpa. This project could substantially reduce the country’s reliance on potash imports, while enhancing food security, increasing crop yields and improving supply chain management for Brazilian farmers.
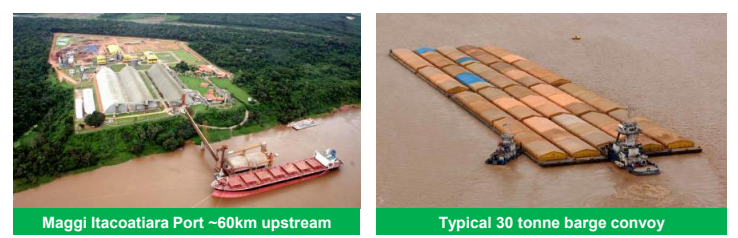
Brazil Potash plans to bring its Autazes potash deposit into production in a low-density cattle farming region of the Central Amazon Basin. Autazes is located 120km southeast of Manaus (population 1.8 million), which is the major economic hub in the region with an international airport. This project will create thousands of good jobs for people, providing stable and secure sources of income in a region with few jobs.
Brazil Potash has completed a Bankable Feasibility Study (BFS), Environmental Impact Assessment (EIA), obtained the Preliminary Social and Environmental License (LP), acquired majority of the land required for the plant and port and diamond drilled 65 holes totaling 59,000m. The company has proven and probable reserves supporting 34 years of mine life based on drilling only ~10% of the land package held.
Construction of a 165-km long electrical transmission line will connect over 100,000 people in the region to the national electricity grid, people who are largely dependent on diesel generated power. The local municipality will benefit from increased tax revenues, which will result in improved schools, water quality, roads and healthcare services.
With over US$185 million invested to date on development, the project is fast approaching the construction phase. This project is critical to the development and security of Brazil’s food supply and will ensure a robust agricultural industry for years to come.
If it seems like the number of record-breaking and other noteworthy diamonds discovered has been increasing in recent years, it’s because they are. Over the last nine years 66 press-released-diamonds were recovered, and 61 of those have been found within the last five years.
These diamonds were considered special enough that the company that discovered them subsequently issued a press release to announce the occasion.
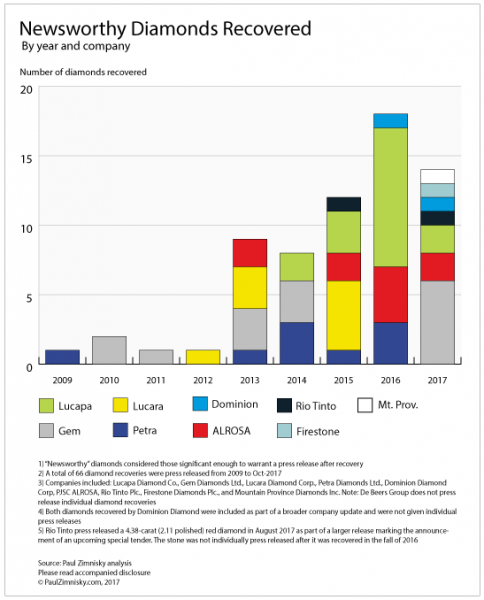
For publicly traded companies, securities laws generally require notifying the public when a “material” event occurs. In this case “material” typically means information that will have an impact on the company’s stock price, or the announcement will likely change the perceived value of the company’s stock. Given the unusual asymmetric valuation of diamonds compared to other commodities, for a diamond miner, a material event could include the discovery of a single very-valuable diamond.
The greater the value of the diamond recovered and the smaller the size of the company, the more material a diamond discovery is to a particular company.
A good example was when Lucara recovered the 1,111-carat “Lesedi La Rona” in November 2015. At the time of the discovery the market cap of Lucara was just over $500M and the perceived value of the diamond was upwards of $75M, or 15% of the value of the whole company. When Lucapa Diamond (ASX: LOM) discovered a pure 404-carat stone in February 2016 the situation was similar. The market cap of the company was under $100M but the diamond was worth over $15M.
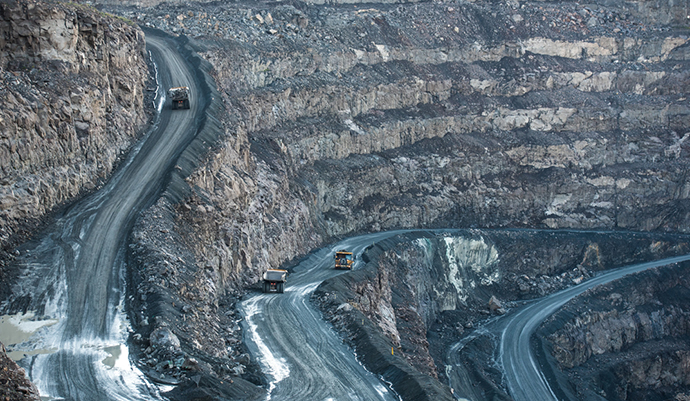
Over just the last 2-years multiple historic gems have been found. In addition to the “Lesedi,” Lucara also found an 813-carat stone the same weekend, which later sold for $63M, making it the most expensive rough diamond ever sold (The Lesedi sold for $53M).
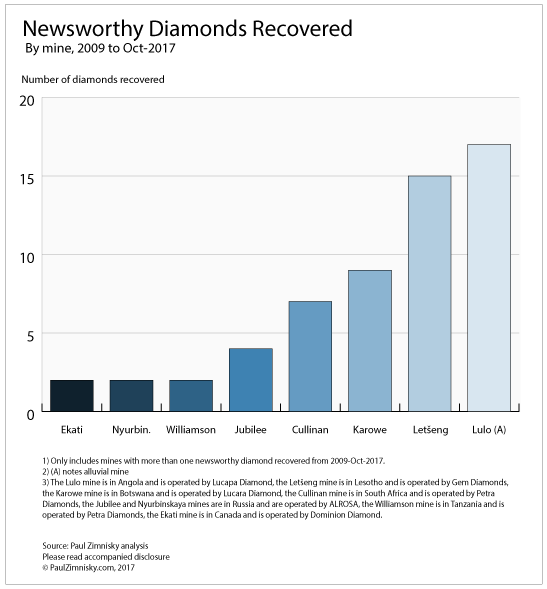
The aforementioned 404-carat diamond that Lucapa recovered was the largest ever found in Angola. In December 2015, Rio Tinto recovered a 187-carat diamond at its Diavik mine in Canada, the largest gem-diamond ever found in North America. And just last month ALROSA produced a 28-carat fancy-pink diamond (see image below), the largest of its kind ever found in Russia.
Lucara’s Karowe mine in Botswana, the source of the Lesedi and 813-carat “Constellation” is relatively new having commenced production in the summer of 2012. The company has continually worked to enhance the successful recovery of large-diamonds. Just this summer the mine’s processing plant was fitted with industry-leading technology aimed at identifying and recovering mega-stones without breakage.
However, current large-diamond recovery technology still has its limits. Breakage during processing has been an ongoing challenge for Gem Diamonds (LSE: GEMD), owner of the Letšeng mine in Lesotho, another primary source of the world’s large diamonds. During the company’s most recent analyst call in August, management gave average-price-per-carat guidance that included a breakage rate of 80%, saying that while ameliorating breakage has been a priority, the results have been disappointing due to the limitations of current technology.
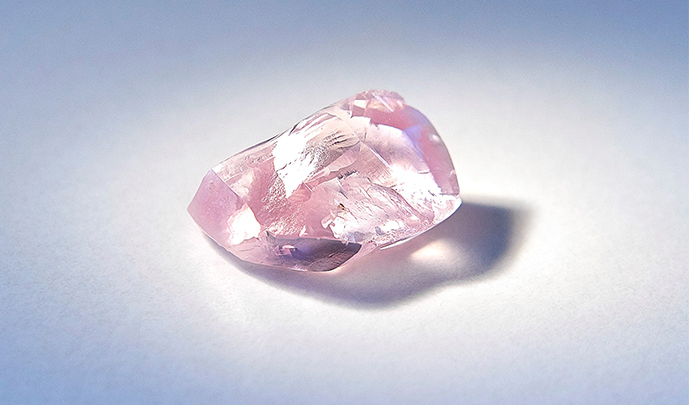
Lucapa commenced commercial production at its alluvial Lulo mine in January 2015. Last year, Lulo diamonds averaged $2,983 per carat, the highest average-price-per-carat figure in the world for a commercial operation, but the mine only produced 19,800 carats.
Over the last 3 years Lucapa press released 15 diamond recoveries, more than any other company, despite being one of the smallest publicly-traded diamond miners by market capitalization.
Gem Diamond’s Letšeng mine produced 108,000 carats last year at an average-price-per-carat of $1,695, giving it the highest figure for a non-alluvial mine. The company has already produced 6 press-released diamonds in 2017 including 4 colorless diamonds in excess of 100 carats.
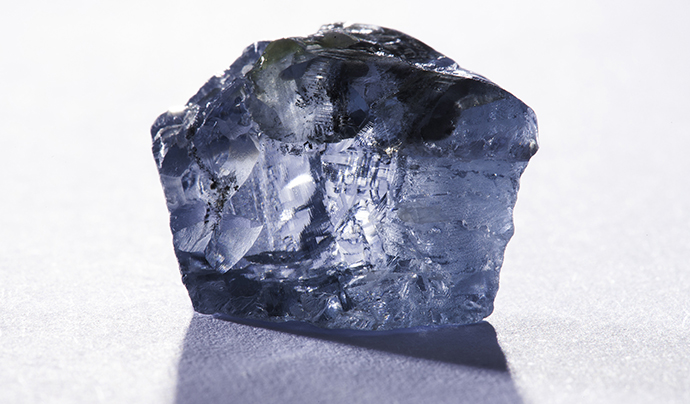
Lucara’s Karowe mine had an average-price-per-carat of $824 last year, producing 354,000 carats. Over the last year Lucara has been mostly processing Karowe tailings and has not produced any press-release-worthy diamonds, as torrential rain, a new contract miner, and increased waste-rock removal limited mining. However, with a processing plant upgrade now complete the company is well positioned to resume mining Karowe’s South Lobe, the portion of the ore body that produced the Lesedi and Constellation.
Petra Diamond’s (LSE: PDL) Cullinan mine in South Africa is perhaps the prolific source of special diamonds in history. The mine has been in production since 1903 and is the source of the “Cullinan Diamond,” the largest rough diamond ever recovered at 3,106 carats, which resides in the British Crown Jewels. In January 2014, a 29.6 carat vivid blue diamond with “extraordinary saturation, tone and clarity” was recovered from the mine (see image above), and as recently as last year the mine produced 2 “newsworthy” white diamonds, both over 100 carats.
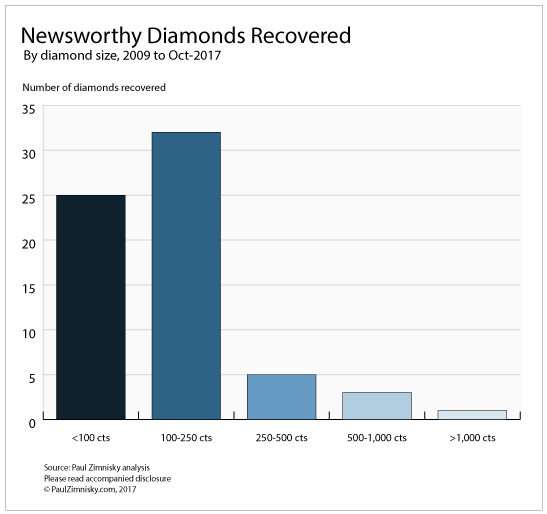
It’s important to note that while serving as a proxy for spectacular diamonds recoveries, press releases are not a conclusive database. Some companies are more aggressive than others with regards to publicizing specific recoveries and some producers do not announce individual recoveries at all.
The second-largest diversified miner in the world, Rio Tinto (LSE: RIO), has only press released one rough diamond recovery in recent years despite being the sole-owner of the Argyle mine, the world’s primary source for ultra-valuable pink, purple and red diamonds. Instead Rio has press released the dates and offerings of its special Pink Diamond Tenders in two of the last three years, in essence debuting more than a year of production at once. In 2015 the special tender included 65 diamonds, this year the tender includes 58 diamonds, but the company has specifically highlighted a 2.11 (polished) fancy-red, the largest high-quality red diamond ever recovered.
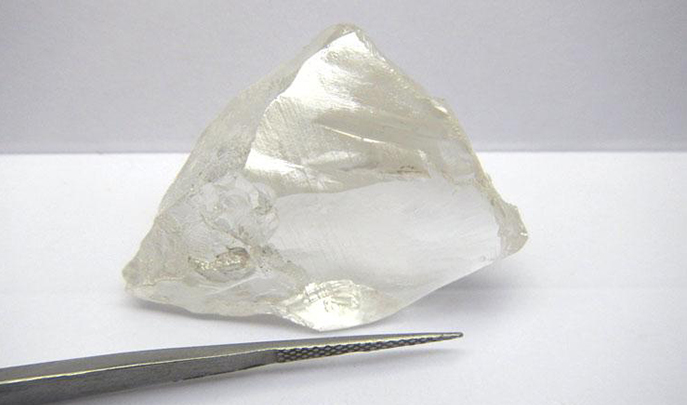
Russia’s ALROSA didn’t press release special diamond recoveries until they publicly offered a minority stake of the company in the fall of 2013, and subsequently increased financial reporting transparency. The largest diamond producer in the world by value, De Beers, does not announce the recovery of special diamonds, nor does its parent Anglo American (LSE: AAL). Privately held diamond mining companies and governments rarely publicize the recovery of individual diamonds.
More detailed data on all 66 press-released diamonds over the last 9 years can be found here.
—
All figures in U.S. dollars unless otherwise noted.
At the time of writing Paul Zimnisky held a long position in Lucara Diamond Corp, Stornoway Diamond Corp, Kennady Diamonds Inc, Peregrine Diamonds Ltd, and a covered-call position in Signet Jewelers Ltd.
Paul Zimnisky is an independent diamond industry analyst and consultant, and publisher of the State of The Diamond Market monthly industry newsletter. He can be reached at paul@paulzimnisky.com and followed on Twitter @paulzimnisky.
1. Gold’s recent rally from the $1268 area lows has stalled, and the reasons for that are both fundamental and technical.
2. Please click here now. Double-click to enlarge this daily gold chart. Gold fell about $100 from the $1362 area highs as seasonally soft Chinese buying was accompanied by a collapse in Indian demand.
3. That collapse was caused by the “Know Your Client” rule imposed by the government on gold jewellery purchases.
4. The price decline was exacerbated by the “Golden Week” holiday in China. Also, the Chinese government chopped commercial bank reserve requirements. That created a huge “risk-on” mentality in global stock markets during what is normally a weak period.
5. As the Golden Week holiday ended, the US jobs report was released, and the Indian government killed the “Know Your Client” rule.
6. Gold surged about $40 higher from the $1268 area Fibonacci line to the neckline of the head and shoulders top pattern.
7. Please click here now. Unfortunately, there isn’t enough demand to sustain the rally, and the short term target of $1215 is still a probable one.
8. Put options are a nervous gold bug’s best friend, as I’ve repeatedly noted since gold traded above $1330.
9. Please click here now. Double-click to enlarge this long term gold chart. In the big technical picture, the short term weakness is healthy.
10. There are several huge bullish price patterns in play on the weekly gold price charts, including the bull wedge pattern I show here. A pullback to the trend line is normal after a major breakout.
11. That pullback is in play now, and it is targeted to end at about $1215, which is also the target of the head and shoulders top pattern.
12. Please click here now. Double-click to enlarge. That’s another look at the weekly chart.
13. In addition to the huge bull wedge, there’s an enormous inverse head and shoulders bottom pattern in play.
14. The target of that pattern is at least $1650.
15. Please click here now. I consider Jeff Christian to be the Western world’s top gold market fundamentalist.
16. He sees the growing institutional investor loss of respect for the Fed as a theme that will continue. That’s good news for gold.
17. Jeff and I differ in our short term outlook (I see $1215 as probable and he sees $1340+), but we both are focused on a decent acceleration in upside price action to occur over the next 12 – 18 months.
18. That acceleration should begin as gold moves above $1392. January – February 2018 (Chinese New Year gold buy season) is the most likely time frame for that move above $1392 to happen.
19. Please click here now. Double-click to enlarge this dollar versus yen chart.
20. The dollar looks like a train wreck in slow motion. Clearly, the Fed’s rate hikes have been dollar-negative. To make America “great” again, a modern version of the homestead program would be required.
21. Going forwards, America would need at least a billion new immigrants with an incredible work ethic to stop China and India from economically leaving it in the dust. That’s not happening now, and it’s not going to happen. The dollar will continue to decline, albeit very slowly.
22. More rate hikes will only cause problems for a debt-soaked government that can barely finance itself now. That’s dollar-negative and gold-positive.
23. Please click here now. Double-click to enlarge this GDX weekly chart. I’ve suggested that nervous investors can use put options to manage that nervousness.
24. Those who are flush with cash or new to the gold stocks asset class should have an aggressive buy program in the $23 – $18 price area, in preparation for a sustained uptrend to my $31 and $37 target zones. Keep an eye on Chinese New Year as the time frame to nail the first target at $31!
Thanks
Cheers
St
Stewart Thomson
Graceland Updates
Risks, Disclaimers, Legal
Stewart Thomson is no longer an investment advisor. The information provided by Stewart and Graceland Updates is for general information purposes only. Before taking any action on any investment, it is imperative that you consult with multiple properly licensed, experienced and qualified investment advisors and get numerous opinions before taking any action. Your minimum risk on any investment in the world is: 100% loss of all your money. You may be taking or preparing to take leveraged positions in investments and not know it, exposing yourself to unlimited risks. This is highly concerning if you are an investor in any derivatives products. There is an approx $700 trillion OTC Derivatives Iceberg with a tiny portion written off officially. The bottom line:
Are You Prepared?
![]()
Vancouver-based B2Gold is suing SRK Consulting (U.S.) and several engineers over engineering and design work for the Bellavista heap leach gold mine, which was destroyed by a landslide on Oct. 21, 2007. Months prior to the disaster, the operator had suspended production after detecting evidence of ground movement and cracks in the leach pad.
The operator of the Bellavista mine was Glencairn Gold, which later became Central Sun Mining. Central Sun was taken over by B2Gold in 2009. Professional engineers working for SRK (US) worked on the Feasibility Study design of the heap leach facility as well as detailed engineering for the mine.
When a mine fails, who is responsible? It’s the multi-million-dollar question when things go dramatically wrong at mine sites. Two recent examples are the tailings dam failure at Imperial Metals’ Mount Polley mine in B.C. in August 2014 and the Samarco tailings dam failure in Brazil in 2015. The latter disaster caused a mudslide that buried a village, killing 19 people.
No lives were lost in the Bellavista disaster, but it could have been catastrophic if the mine had been operating when the landslide hit. About 35 million cubic metres of earth and mud — the equivalent of 22 SkyDomes full — slid down the mountain. Mine infrastructure that was damaged or destroyed included the heap leach pad, the tailings facility and the processing plant. The latter contained cyanide solution — used to process the gold — in concentrated form and a stream down-slope was the water source for a nearby town.
The Bellavista mine was located on a mountainside in a seismically active area of Costa Rica. The climate is tropical, with heavy rainfall in the winter. SRK did Feasibility and detailed design stage work on the mine project for different operators, including Wheaton River Minerals, which sold the Bellavista project to Glencairn. Glencairn put the mine into production, pouring the first gold bar in April 2005. 2006 was Bellavista’s first — and only — year of full production.
McCarthy Tetrault lawyer Chris Hubbard, acting for B2Gold, said SRK engineers ignored warning signs — including local geological advice — and made “aggressive assumptions” about the safety and stability of the slope and the mine site. Geotechnical expertise was critical because of the location, he noted.
“It’s primarily a professional negligence case,” Hubbard said. “SRK repeatedly assured the owner that the project site was much safer and more stable than it actually was. In reliance on these assurances, the owner invested many millions of dollars to construct and begin operating SRK’s design for the mine.”
Ground conditions at the mine site consisted of a layer of soil or overburden on top, a layer of volcanic ash known as “lahar” in the middle, and bedrock, where the gold ore is found. According to Hubbard, SRK did not drill boreholes beneath the intended footprint of the massive heap leach pad or to test the lahar, the most unstable and volatile soil layer. The oversight came despite warnings from a local geologist that the Bellavista mine site had been the location of an ancient landslide, he said.
“SRK made assumptions about the lahar, the volcanic layer of ash, instead of getting actual samples which were readily available. They assured the owner that their assumptions were conservative when in fact they grossly over-estimated the safety and stability of the site and structures,” Hubbard said.
For its part, SRK denies responsibility for flawed engineering at the mine site. Other engineering firms were involved in engineering and design work at Bellavista both before and after SRK’s involvement, according to Terry Braun, a practice leader with SRK Consulting (U.S.).
“SRK’s work on the Bellavista mine did not contribute in any way to the 2007 landslide, which took place over three years after it left the project,” Braun said in an emailed statement. “SRK had no further involvement in the project after December 2003. … SRK will continue to vigorously defend this action.”
B2Gold is suing the U.S. division of SRK Consulting, a mining and engineering consultancy whose operations straddle the globe. SRK North America is headquartered in Vancouver. SRK’s engineering and geotechnical studies for Bellavista went through the Vancouver office before being sent to Toronto, where Central Sun Mining was located. Several other engineering firms sued by B2Gold have since settled with the company.
The stakes are high. B2Gold had originally claimed damages of US$150 million, but the two parties have agreed to damages of US$100 million (subject to liability of other parties). B2Gold had about $103.2 million in the treasury as of March 31, 2017. The trial is being heard before Justice Arthur Gans of the Superior Court of Justice in Ontario.
The Central Sun acquisition was a key transaction for B2Gold, one of Canada’s major intermediate gold producers. The two Nicaraguan mine projects, La Libertad and El Limon, that B2Gold picked up along with Bellavista were the company’s foundational mines, producing its first gold in 2010.
It’s been a rapid trajectory. B2Gold recently announced first gold production at its Fekola mine in Mali, which will produce more than 400,000 ounces of gold a year at full capacity. That will take the company’s annual production to almost 1 million ounces of gold.
For B2Gold, getting the case heard in the Ontario Superior Court of Justice was itself a victory of sorts, after years of legal wrangling. SRK’s legal team from Blaney McMurtry LLP had challenged the jurisdiction of Ontario courts, bringing a motion to stay or dismiss the plaintiff’s action because there were few links to Ontario. The disaster had taken place in Costa Rica and the engineering work was largely done by SRK (U.S.) engineers and consultants in both Costa Rica and Denver, Colorado, Blaney McMurtry lead lawyer Tim Alexander argued. The studies passed through SRK’s Vancouver office en route to Central Sun Mining in Toronto.
In a 2012 ruling, Ontario Court of Appeal Justice David Stinson agreed. He described the link to Ontario as “tenuous” and said the events at issue lacked “the requisite real and substantial connection” to Ontario. “At its heart, this dispute involves complaints by an Ontario company about a loss to property in a foreign country, that was allegedly caused by foreign defendants, performing services in a foreign country or countries,” he ruled.
But B2Gold appealed that decision and it was overturned by Ontario Court of Appeal Justice Stephen Goudge on Oct. 2, 2013 — setting the stage for the trial. Goudge ruled that the negligent misrepresentation was “received and acted upon” in Ontario.
“That is where it relied on the studies to take the decisions about where to locate the mine and how to build and operate it,” Goudge ruled. “In the modern world where corporations have various offices in various locations, corporate defendants should not escape liability simply because they send their studies to an office of the plaintiff outside Ontario with the clear understanding that it will be acted on in Ontario.”
Stephen Pitel, a Western Law professor and an expert on jurisdiction issues, said the Goudge decision has become a bit of a benchmark in tort cases where jurisdiction is at issue. It has been cited 19 times since Goudge’s 2013 ruling.
“It could fairly be said to be one of the leading cases on that question of where the tort of negligent misrepresentation has occurred,” Pitel said in an interview.
The challenge is determining how strong the link is between the negligent misrepresentation and the jurisdiction in question. It’s an evolving area of law, Pitel said.
“It’s easy to identify where, say a car crash happened. But some torts aren’t as easily nailed down as happening in a particular place,” Pitel said. “The misrepresentation may for example be written out in one place, provided to someone in a different place, acted on in yet another place, and then a loss is suffered in yet a fourth place.
“Where does the negligent misrepresentation happen?”
In the Goudge decision, the judge repeatedly used the phrase “received and acted upon” in describing Central Sun’s receipt of SRK’s engineering and geotechnical recommendations. That was a strong enough link to establish the Ontario court’s jurisdiction. “Those two things taken together represent a presumptive connecting factor,” Pitel noted.
“It’s a to-be-continued story at this point, because I don’t know if there’s a definitive view of whether only receiving it or only acting on it in a certain jurisdiction is enough,” he said. “The Central Sun case does not answer that question.”
In a case such as B2Gold vs. SRK, damages would typically be awarded on a joint and several basis, Pitel said. That means the plaintiff, B2Gold, could recover the full amount from each or any of the liable defendants. It’s a structure — highly criticized in some quarters — designed to shift the risk of insolvency away from the plaintiff and toward the defendants, according to Pitel.
“The magic of joint and several awards, for plaintiffs, is it’s specifically designed to prevent a plaintiff not being frustrated in collecting on the judgment because of the inability of any defendant to pay.”
In practice, the corporate entity usually pays the full amount and the damages may be further split among defendants once that happens, Pitel said.
“It’s typical that in cases where the defendants are a corporate entity and a bunch of individuals who worked for that entity, it’s the corporate entity that ends up bearing the payment to the plaintiff,” he said.
As for the possibility of a larger corporate entity cutting loose a local consultancy that is found liable for a large damage amount, Pitel said it is up to the plaintiff to ensure its lawsuit covers the corporate entities that have money or assets. (In this case, B2Gold is suing Steffen Robertson Kirsten/SRK Consulting, SRK (U.S.) and SRK Field Services LLC.)
Each of the named individual defendants — engineers Richard Frechette, David Hallman, Charles Khoury, Rob Dorey and Allan Breitenbach — did not respond to requests for comment. None work for SRK any more. However, several continue to work in the engineering and mining industries, including as experts around heap leach and mine safety issues.
Engineer Allan Breitenbach, formerly of Vector Engineering, has authored academic papers on heap-leach safety and stability. In 2013, he presented on “Static and Seismic Slope Stability for Heap Leach Pads” at a Vancouver mining conference.
After joining SRK, engineer Rob Dorey completed a master of philosophy in soil mechanics, according to a book SRK published to mark the company’s 40th anniversary. Dorey worked on the Thompson Creek molybdenum mine project in Idaho, including having responsibility for the design of three 70-foot-high sediment dams at the base of the rock dumps, according to the book.
In 2015, B2Gold sold the Bellavista project to Alray Investments for $1 million cash and a 2% net smelter royalty. B2Gold also retained the right to continue the Bellavista litigation.

With the third quarter’s earnings season now underway, the gold miners will soon join in and report their latest results. No data is more highly anticipated by investors, for good reason. Quarterly reports dispel the dense fogs of herd sentiment that usually obscure gold stocks, revealing their operations’ underlying fundamental realities. Q3’17’s upcoming results are likely to prove quite bullish for this neglected sector.
Four times a year publicly-traded companies release treasure troves of valuable information in the form of quarterly reports. Companies trading in the States are required to file 10-Qs with the US Securities and Exchange Commission by 45 calendar days after quarter-ends. The gold miners generally release their quarterly reports in the latter half of this span. So Q3’17’s will arrive between late October and mid-November.
After spending decades intensely studying and actively trading this contrarian sector, there’s no gold-stock data I look forward to more than the miners’ quarterly financial and operational reports. They offer a true and clear snapshot of what’s really going on, shattering the misconceptions bred by ever-shifting winds of sentiment. Nearly all fundamental analysis is based off the data gold miners provide in these reports.
So for many years I’ve delved deeply into gold miners’ quarterly results. They are the dominant source of information I use to winnow down the universe of gold stocks to the fundamentally-superior ones with the greatest upside potential. Every quarter after their latest earnings season ends, I research and write essays discussing the newest results from the major gold miners, junior gold miners, and silver miners.
Q3’17’s analyses are coming starting in mid-November, once that 45-day post-quarter reporting deadline has passed. But before that I eagerly dive into individual companies’ results as they’re reported, since there’s so much to digest. And even earlier right after a quarter ends, I start thinking about what gold miners’ latest quarterly results are likely to show collectively. They can actually be predicted to some extent!
In high-level fundamental terms, gold mining is a simple business. These companies painstakingly wrest gold from the bowels of the Earth, then generally sell all they can produce at prevailing market prices. So their profits are effectively the difference between current gold levels and operating costs. The former is easy to calculate once a quarter ends, and the latter can be fairly-accurately estimated for this sector as a whole.
Gold’s average closing price in Q3’17 was just under $1279, up 1.7% sequentially from Q2’17’s average near $1258. Higher gold prices portend better quarterly results, because gold-mining costs are largely fixed. They are mostly determined back when mines are being planned. That’s when engineers carefully decide which ore bodies to mine, how to dig to them, and how to process the resulting gold-bearing ore.
Quarter after quarter, generally the same numbers of employees, excavators, haul trucks, and mills are used regardless of prevailing gold prices. There are some variable costs like diesel fuel, but they are dwarfed by massive fixed costs. Thus higher gold prices flow right through directly to the miners’ bottom lines, boosting profits. And the relationship between gold’s gains and higher earnings is leveraged, not linear.
The major gold miners are all included in the leading GDX VanEck Vectors Gold Miners ETF, which is the world’s most-popular gold-stock investment vehicle. Every quarter I dig into the latest results from its top 34 component companies, which account for 90%+ of its total weighting. In Q2’17, these top GDX major gold miners reported average all-in sustaining costs of $867 per ounce. These AISC determine profits.
All-in sustaining costs include everything necessary to maintain and replenish operations at current gold-production levels. They include all direct and indirect cash costs of production, exploration for new gold to mine to replace depleting deposits, mine-development and construction expenses, remediation, and mine reclamation. AISC are the most-important gold-mining cost metric by far for investors to follow.
At Q2’s $1258 average gold price and $867 average major-gold-miner all-in sustaining costs, this sector was generating profits around $391 per ounce. That’s pretty impressive, implying fat 31% profit margins most other industries would die for. Making the reasonable assumption that AISC will be pretty flat in Q3, its $1279 average gold price would yield profits of $412 per ounce. That’s up 5.4% quarter-on-quarter!
Potential 5.4% sequential gains in quarterly earnings in Q3’17 are big absolutely, probably better than the great majority of stock-market sectors. And 5.4% QoQ profits growth on a 1.7% QoQ gold rally makes for excellent 3.2x profits leverage to gold from the major gold miners. That’s the primary reason gold-mining stocks yield such massive gains in rising-gold-price environments. Their profits explode as gold rallies.
But the major gold miners’ potential to bullishly surprise in their upcoming third-quarter earnings season goes well beyond that. Between Q2s and Q3s, all-in sustaining costs actually tend to fall rather sharply. Last year between Q2’16 and Q3’16 for example, the average AISC of GDX’s top-34-component major gold miners fell 3.5% from $886 to $855. I fully expect to see a similar third-quarter drop in AISC this year.
The reason is global gold-mining production tends to surge between Q2s and Q3s. This phenomenon is readily evident in the latest data from the World Gold Council, which collects the best gold fundamental data available. During the seven Q3s from 2010 to 2016, world gold production soared 8.0%, 4.4%, 5.3%, 9.0%, 8.8%, 6.1%, and 7.0% sequentially quarter-on-quarter from Q2 to Q3! That averages out to +7.0%.
Such big and consistent quarterly growth in Q3s is interesting. I suspect at least a couple major factors feed into it, mining-plan management to boost managers’ compensation and summer. The managers of gold miners are usually partially paid in stock or stock options, giving them big incentives to do everything they can to boost stock prices. Their annual stock-based bonuses are usually figured late in calendar years.
Thus these guys seem to plan mining to attack any necessary lower-grade ores that yield fewer ounces earlier in years if possible. Then they shift back to higher-grade ores in the second halves when stock prices matter more for compensation. Exceeding investors’ expectations of production rates in Q3s also leads them to bid gold-mining stocks higher into year-ends, compounding gains from mining-plan management.
In addition most of the world’s major gold mines are in the northern hemisphere, where mining is easier in the summer. The weather is warmer and clearer, with less snow or monsoon rains to slow down mining operations and mess with heap-leaching gold recoveries. I’m amazed at the number of quarterly reports I’ve seen over the years that attributed lower gold production to unexpected weather interfering with operations.
Because most gold-mining costs are largely fixed, production and costs are inversely related. The more ounces being produced in any quarter, the more ounces to spread gold mining’s big fixed costs across. So higher production directly leads to lower all-in sustaining costs. Higher production and the resulting lower per-ounce costs will make Q3’17’s results look way more bullish than from just higher gold prices alone.
Gold production varies seasonally within calendar years partially due to mining-plan timing. Gold-bearing ore was certainly not created equal, with even individual deposits seeing big internal variations in their metal-to-waste-rock ratios. Miners often have to dig through lower-grade ore to get to the higher-grade zones underneath. This still has economically-valuable amounts of gold, so it is run through the mills.
These mills are essentially giant rock grinders that break ore into smaller pieces, vastly increasing its surface area for chemicals to later leach out the gold. Mill capacity is fixed, with limits on ore tonnage throughput. So when miners are blasting and hauling lower-grade ore, fewer ounces are produced. As they transition into higher-grade zones, the same amount of rock naturally yields more payable ounces.
Regardless of the ore grades being blasted and milled, the overall quarterly costs of mining don’t change much. Operations require the same levels of employees, diesel, maintenance, and electricity no matter how rich the rock being processed. So higher gold production directly leads to lower per-ounce mining costs. The big fixed costs of gold mining are spread across more ounces, making this business more profitable.
Back to the upcoming Q3’17 results from the major gold miners, where profits should surge on the order of 5.4% QoQ due to higher gold prices alone. Let’s conservatively assume their gold production rose 4.0% sequentially, far below Q3’s 7.0% average since 2010 and making for the worst Q3 growth in at least 8 years. Naturally 4% higher gold production should lead to a proportional increase in gold-mining profits.
That takes the projected Q3’17 profits growth in the top major gold miners included in GDX to the 9%-to-10% range quarter-on-quarter. But that doesn’t take into account the lower production costs generated by higher production. Once again a year ago in Q3’16, the top 34 GDX components saw their average all-in sustaining costs fall 3.5% QoQ. Let’s conservatively assume average AISCs are 2.0% lower in Q3’17.
That would drag the major gold miners’ sector-wide AISC back down near $850 per ounce. Incidentally that is totally plausible, in line with Q3’16’s $855. At Q3’s average gold price near $1279 and $850 AISC, operating profits would surge to $429 per ounce. That’s up a whopping 9.9% sequentially from Q2’17’s $391! Add in that 4% higher production likely, and we’re talking big quarterly profits growth around 14%.
Now don’t read too much into the precise number, it’s merely an estimate based on simple sector-level math. The Q3’17 profits growth in the top-GDX-component major gold miners won’t exactly match, as each of these individual companies will have its own triumphs or challenges in Q3. The key takeaway here is we are set up for big quarterly profits growth in the upcoming results of the major gold miners.
While 14% quarterly profits growth would be extreme for most other stock-market sectors, it’s nothing for the gold miners. Last year in Q3’16, the average gold price surged a much-larger 6.0% QoQ to $1334. That fueled a huge 41.6% QoQ surge in the total operating cash flows generated by the top 34 GDX gold stocks, and a staggering 230.7% QoQ rocketing in their total GAAP accounting profits! 14% in Q3’17 isn’t a stretch.
The gold miners are truly set up to report excellent Q3’17 results in the coming weeks. I expect to see many upside surprises fueled by higher production and the resulting lower costs per ounce. That might lead to widespread favorable guidance changes for full-year 2017, upping production forecasts while lowering per-ounce cost estimates. Good Q3’17 results will make investors take notice of gold stocks again.
Any material new capital inflows from impressed investors ought to light a fire under today’s beaten-down gold stocks. While they enjoyed some major technical breakouts back in August, gold’s sharp pullback in September weighed heavily dragging them lower again. That leaves the major gold miners’ stocks ready to rally fast if good Q3’17 results start bringing back scared or indifferent investors. The upside potential is huge.
All stock prices are ultimately dependent on underlying corporate profits. And for gold miners, nothing is more important for earnings than prevailing gold prices. Again gold-mining profits really leverage gold rallies, so their fundamental relationship is ironclad. Higher gold drives higher gold-mining profits which leads to higher gold-stock prices. And today gold stocks remain radically undervalued relative to gold.
That leaves them with lots of room to rally in the coming months if their Q3’17 results indeed manage to impress investors. The HUI/Gold Ratio is a great proxy for distilling down that core fundamental link between gold prices and gold-stock prices. It simply divides the daily close in the leading HUI NYSE Arca Gold BUGS Index that mirrors GDX by gold’s daily close, revealing whether gold stocks are high or low.
As this blue HGR line shows, gold stocks remain very low relative to prevailing gold prices. This week the HGR was merely running 0.157x, which is extremely low historically. Gold stocks have only been lower relative to the metal that drives their profits briefly in late 2014, in much of 2015, and in the first few months of 2016. That happened to be late in a major secular bear driven by a deep parallel secular bear in gold.
If today’s 0.16x HGR was actually righteous, it would’ve been seen plenty of times in modern history. But it hasn’t been. Such extremely-low gold-stock prices relative to gold were only able to persist for a short spell late in a massive bear. But back in early 2016, the gold stocks soared with gold to birth a major new bull market. That persists to this day, with the HUI still up 101.5% bull-to-date since mid-January 2016.
With gold stocks in a young bull market, seeing them at deep-bear-low valuations relative to gold is truly absurd. It makes no sense at all fundamentally! Gold stocks have vast room to rally from here merely to return to normal levels relative to current gold prices. Good Q3’17 results could very well be one of the sparks, along with gold rallying, that motivates investors to resume returning and normalizing gold-stock prices.
Remember the Fed started aggressively levitating the US stock markets in early 2013, wreaking havoc on alternative investments led by gold. The gold market’s last normal years were sandwiched between 2008’s stock panic and 2013’s radical Fed distortions. That’s the best recent baseline for where the HGR ought to trade. And between 2009 to 2012, it was running way up at 0.346x. That’s over double today’s levels!
To simply mean revert back up to those last normal levels relative to gold, the major gold miners dominating the HUI and GDX would have to power 120% higher from here to 447! To restore some semblance of normalcy fundamentally, the gold stocks need to more than double from here even at this week’s $1293 prevailing gold levels! Gold stocks certainly can’t stay disconnected from their own earnings realities forever.
All markets are cyclical, including gold stocks. Extreme undervaluations relative to gold are followed by overvaluations as the pendulum swings back the other way. Mean reversions after extremes never stop in the middle. Their momentum leads them to overshoot to the opposite extreme! That makes gold stocks’ coming upside far more impressive. A proportional overshoot heralds radically-higher gold-stock prices ahead.
At worst in mid-January 2016, the HGR fell to an all-time low of 0.093x. That was a staggering 0.253x under that post-panic normal-year-average HGR of 0.346x. So a proportional overshoot would briefly boost the HGR 0.253x above that mean, to 0.599x. Such an upside extreme wouldn’t last long, as greed wouldn’t be sustainable. But it could happen in a blowoff top after gold stocks are popular following a bull.
At $1293 gold, that yields a potential HUI topping target of 775! That’s a stupendous 282% above this week’s levels. Is there any other stock sector with the potential to quadruple in the coming years? No way. Gold stocks are the only severely-undervalued sector left after this Trumphoria stock rally, so their upside is unparalleled. And incredibly these simple HGR-derived gold-stock targets are actually conservative.
They assume gold is static, stuck at $1293. That’s exceedingly unlikely. As these Fed-levitated stock markets inevitably roll over with Fed quantitative tightening ramping up, gold itself will catch a major bid as investment capital returns. As a rare asset that generally moves counter to stock markets, gold is hostage to them. So when the stock markets suffer their long-overdue major selloff, gold will soar on capital inflows.
10%, 20%, and 30% gold uplegs from here would take this metal to $1422, $1551, and $1680. Plug in the HGR of your choice, the post-panic average or the mean-reversion overshoot, and you get some potential HUI targets so high they defy belief. And don’t think a 30% gold rally is out of the question. In response to the last stock-market correction, gold powered 29.9% higher in just 6.7 months in early 2016!
Don’t get bogged down in HUI upside targets, they only serve to illustrate a critical point for investors and speculators today. Gold stocks are not only radically undervalued at today’s gold prices, but even more so compared to where gold is heading in its own still-very-much-alive bull market. Even if you think gold stocks only have 50% to 100% upside, that’s vastly better than everything else in these overvalued stock markets.
And gold miners’ upcoming Q3’17 results could very well prove the catalyst that ignites the next major gold-stock upleg. The large gold miners will likely soon report big profits growth on higher production and lower costs, easily surpassing investors’ low expectations. As they start shifting capital back into this forgotten sector, gold stocks will rally. That will soon attract in other investors, fueling a self-feeding upleg.
While investors and speculators alike can certainly play gold stocks’ coming upleg with the major ETFs like GDX, the best gains by far will be won in individual gold stocks with superior fundamentals. Their upside will trounce the ETFs’, which are burdened by over-diversification and underperforming gold stocks. A carefully-handpicked portfolio of elite gold and silver miners will generate much-greater wealth creation.
The key to riding any gold-stock bull to multiplying your fortune is staying informed, both about broader markets and individual stocks. That’s long been our specialty at Zeal. My decades of experience both intensely studying the markets and actively trading them as a contrarian is priceless and impossible to replicate. I share my vast experience, knowledge, wisdom, and ongoing research through our popular newsletters.
Published weekly and monthly, they explain what’s going on in the markets, why, and how to trade them with specific stocks. They are a great way to stay abreast, easy to read and affordable. Walking the contrarian walk is very profitable. As of the end of Q3, we’ve recommended and realized 967 newsletter stock trades since 2001. Their average annualized realized gain including all losers is +19.9%! That’s hard to beat over such a long span. Subscribe today and get invested before gold stocks power way higher!
The bottom line is the major gold miners’ upcoming Q3’17 results should show strong sequential profits growth. Q3’s higher average gold prices alone will drive higher profits if gold-mining costs are flat. But Q3s have a long history of seeing big sequential jumps in gold-mining production directly leading to lower per-ounce costs. If that proves true again last quarter, the major gold miners ought to report excellent results.
The potent combination of higher prevailing gold prices and bigger production to spread gold mining’s large fixed costs across should lead to sector profits surging rather dramatically. Investors will likely take interest and start bidding gold stocks higher again, fueling a major upleg. And since gold stocks remain so darned low relative to prevailing gold prices, their upside from here is vast as investment capital returns.
Adam Hamilton, CPA
October 13, 2017
Copyright 2000 – 2017 Zeal LLC (www.ZealLLC.com)
Kincora Copper Ltd (CVE:KCC, FRA:BS4B) – The Next Mega-Copper Discovery
Current Price: C$0.34
Shares Outstanding: 63.9 million
Market Capitalization: C$21.7 million
Cash: ~C$5.92 million (post-EBRD financing)
A discovery in copper of the proposed magnitude significantly rewards investors.

SolGold (TSX:SOLG, Mkt Cap: $1.1B), is a very comparable case study, sky-rocketing 19x with just 10 drill holes in between. Recent examples also include Camino Minerals (TSXV:COR, Mkt Cap: $27M), who’s stock jumped from $0.35 to a high of $2.23 in a matter of days upon announcement of their first two drill holes (106 meters of 1.3% Cu) at the Los Chapitos project in south Peru.
Kincora is armed with extensive data, modern exploration techniques, and hard-hitting backers such as Robert Friedland. The company will have the next significant copper discovery this cycle. The technical team already has multiple tier-1 discoveries under their belts, and are convinced Kincora is sitting on the biggest one yet.
Geopolitics
Mongolia is once again open to mining.
The Democratic Party, solely responsible for running the country into the ground, has been removed and the Mongolian People’s Party now control 85% of Parliament, wielding clear legislative power and authority. Their mandate from the get-go has been clear, turn the economy around.
In support of the newly-elected government’s Economic Recovery Plan, the IMF has approved a three-year, $434 million loan for Mongolia as part of a broader $5.5 billion financing package. In terms of GDP, this is the fourth-largest package in IMF history, stressing the international community’s commitment to Mongolia’s future economic success.
A large part of this reform and IMG financing hinges on the reform of the mining sector, which constitutes a large part of Mongolia’s economy.
These developments are significant, and for the first since 2012, Rio Tinto is now resuming drilling and revisiting corporate opportunities in the belt.
Mongolia’s saw significant exploration between 1996-2006, which included discovery of the Oyu Tolgoi deposits. Significant regional exploration continued through 2009 and included the joint-venture between Robert Friedland’s Ivanhoe (now Turquoise Hill Resources) and BHP Billiton. Robert Friedland was responsible for the lion’s share of exploration, and at Ivanhoe’s peak, it owned portfolio of assets encompassing over 126,000 km2 of prospective land.
The geological data collected gave incredible understanding of the regional geology and controls on mineralization. These included an understanding of the local geology of the Oyu Tolgoi porphyry systems, as well as other copper occurrences such as Tsagaan Suvarga, Kharmagtai and Bronze Fox.
When the windfall tax was announced in May 2006, Ivanhoe released the majority of its regional landholding, however, the tax was repealed in in August 2009. The best acreage was picked up again, this time by IBEX, an entity indirectly controlled by Robert Friedland’s by High Power Exploration Inc.
Kincora Copper was formed in mid-July 2011, and began the consolidation of the area. First was the RTO of the Bronze Fox license, originally part of the original Ivanhoe Bronze Fox project, which in 2005 was designated as one of four, alongside Oyu Tolgoi, Kharmagtai and Nariin Sukhait, high priority targets for large scale porphyry and skarn copper mineralization.
Previous drilling included 72 holes for over 12,000 metres confirming continuous mineralization on a 9-kilometer strike, mostly at the Kincora named “West Kasulu”, a large low-grade copper-gold feature from surface to depth (returning between 0.4% and 0.9% copper equivalent).
In 2012, Kincora acquired Golden Grouse LLC, to consolidate the rest of the original “Ivanhoe” Bronze Fox project, including the Western license and extension of the West Kasulu target.
Exploration on the Bronze Fox and Western license border returned over 800 meters of over 0.40% copper equivalent, including 37 meters at over 1% copper equivalent. Furthermore, 9 of the 15 holes drilled in 2012 at the Tourmaline Hills gold prospect in the Western license have returned intervals of at least 1g/t Au, up to 7.7g/t Au and with up to 75g/t Ag locally in the mineralization zone, often with elevated copper values.
In Q1 2016, Kincora secured a new exploration license, Ulaan Khudag (Red Well), located 15 kilometers along the mineralized trend from the Rio Tinto controlled, Oyu Tolgoi project. An identified contact one continues to the eastern and western sections of the license, the margin just to the east returning a previous 2% copper and 0.25g/t gold sample with anomalous values also to the west.
In May 2016, Kincora announced its agreement with IBEX, resulting in Kincora more than tripling its landholding in the Southern Gobi copper belt, totaling over 1,500 km2.

Kincora has two drill ready targets, which are analogies to the existing two large scale mines in belt. East TS is a “brownfield” Tsagaan Suvarga (TS) style target. TS is over a $1 billion project, owned by Mongolyn Alt (MAK). It contains 1.5 million tonnes of copper reserves, as well as 59,874 tonnes of molybdenum.
Bayan Tal is an “Oyu Tolgoi” style target, which of course is Rio Tino’s US$14 billion mega project, home to 32.4 million tonnes of copper, 34.0 million ounces of gold, 262.2 million ounces of silver, and 12,900 tonnes of molybdenum.
The company closed a $4.52 million in financing in August 2017, and recently announced the second tranche $1.4 million investment by the European Bank for Reconstruction and Development (EBRD), for a total of $5.92 million.
Kincora is currently drilling the East TS copper porphyry target. The maiden reverse circulation and diamond drill program at the East TS target comprises approximately 2,870 metres to less than 265 m depth for 12 holes. It is proposed that during a second phase Kincora will undertake infill geophysics and a follow-on 5,000-metre drill program.

Powerpoint: http://www.kincoracopper.com/sites/default/files/corporate_presentations/20170828_Kincora_Deck.v2.pdf
Cheers,
Sean & Palisade Global Investments
- The traditional post jobs report rally for gold is in full swing. Please click here now. Double-click to enlarge this daily gold chart. Gold arrived at a key Fibonacci line at about $1268 as the US jobs report was released.
- Please click here now. Double-click to enlarge. The dollar has stalled against the yen, and that’s also good news for gold.
- Gold tends to stage great rallies in the days following the jobs report, and this rally is a particularly interesting one. Here’s why:
- First, Trump has ratcheted up his “hawk talk” in regards to North Korea and Iran. He’s scheduled to make a key speech on Thursday about Iran, a country which is now exporting two million barrels of oil a day.
- Second, the Chinese government recently chopped commercial bank reserve requirements. That triggered a massive rally in bank stocks around the world, and in most stock market indexes.
- Chinese citizens tend to buy more gold when stock markets are rallying and economic sentiment is positive.
- Friday also marked the last day of COMEX gold trading during the Golden Week holiday in China. Chinese gold markets are now open again, and eager buyers are clearly in action.
- Perhaps most importantly of all, on Friday the Indian government cancelled the “Know Your Client” rule for gold jewellery buyers and that happens just in time for the launch of Diwali.
- Please click here now. This is pretty big news for gold price enthusiasts around the world.
- Given all of this gold-positive news, it’s pretty easy to understand why gold has bounced so firmly from the $1268 area Fibonacci line.
- Fundamentally, there is nothing negative for gold right now. Gold has rallied after every rate hike. It did that in the 1970’s as the Fed Funds rate soared to 20%. The precious metals and the mining stocks soared like a flock of golden eagles as that happened, and 2018 could see that repeated, albeit on a smaller scale.
- The Fed has three rate hikes scheduled for 2018, and aggressive quantitative tightening (QT). By December of 2018, money velocity should reverse and begin a long term bull cycle.
- The QE money ball is essentially “toast”. Bond prices will get a haircut as rates rise and QT accelerates. Money will pour out of government bonds and central banks and into the fractional reserve banking system, and… into gold.
- Please click here now. Central banks and governments have not propped up their economies since the 2008 financial crisis occurred.
- What they have done is prop up financial markets while insidious inflation and no wage gains on Main Street have seen the plight of the average citizen get worse.
- That can change. Please click here now. Donald Trump’s three main campaign promises were to cut taxes, chop the price of the US dollar against other fiat currencies, and to give government bond market creditors a haircut.
- His promises are essentially a mechanism to move a portion of the fifteen trillion dollars in financial markets liquidity towards Main Street. He has yet to do that, but I think 2018 will probably be recorded in history books as“The Golden Year”.
- I’m predicting that 2018 will be the year that Trump begins talking more openly about the bond market and the need for creditors to be realistic about what they can expect to get paid.
- Along with the “motherlode” of positive demand coming out of China and India, Trump’s actions and words should help make 2018 the year that gold ends its sideways trading pattern of the past three years, and starts a significant trending move higher.
- Please click here now. Double-click to enlarge this fabulous silver chart. There’s a beautiful inverse head and shoulders bottom formation in play, with an ultimate target in the $22 area.
- Please click here now. Double-click to enlarge this key GDX chart. GDX has started a strong rally. All fundamental lights are green for the entire precious metals asset class.
- Most technical lights are green, except for one. Please click here now. Double-click to enlarge. My “line of concern” at $1300 relates to the head and shoulders top neckline that gold is rallying towards now.
- The technical target of that pattern is about $1215. Whether the “Queen of Assets” can successfully surge through that neckline area is likely to be determined in the short term by Trump’s speech on Thursday about Iran. In the medium term, it will be determined by the amount Diwali gold demand that appears (or doesn’t) over the next two weeks.
- Tactics? Nervous investors should buy put options and buy them today! On the buy-side, the key for gold bugs is to be light buyers of all their favourite precious metals investments if gold trades at $1270 and to be substantially bigger buyers at $1215 or lower. Do that, while cheering that the price only goes higher!
Thanks
Stewart Thomson
Graceland Updates
Stewart Thomson is a retired Merrill Lynch broker. Stewart writes the Graceland Updates daily between 4am-7am. They are sent out around 8am-9am. The newsletter is attractively priced and the format is a unique numbered point form. Giving clarity of each point and saving valuable reading time.
Risks, Disclaimers, Legal
Stewart Thomson is no longer an investment advisor. The information provided by Stewart and Graceland Updates is for general information purposes only. Before taking any action on any investment, it is imperative that you consult with multiple properly licensed, experienced and qualified investment advisors and get numerous opinions before taking any action. Your minimum risk on any investment in the world is: 100% loss of all your money. You may be taking or preparing to take leveraged positions in investments and not know it, exposing yourself to unlimited risks. This is highly concerning if you are an investor in any derivatives products. There is an approx $700 trillion OTC Derivatives Iceberg with a tiny portion written off officially. The bottom line:
Are You Prepared?
Canada’s North is a mysterious and forbidding land. There are stories of European explorers disappearing without a trace and place names such as Deadman’s Island. Native legends from the original occupants – not to mention strangely colourful lights that often dance across the night sky – add to the intrigue. I saw the Northern Lights for the first time during the site visit. The scientific explanation does little to diminish their mystique.

Flying over the barren lands of Northwest Territories and Nunavut gave me a renewed respect for Chuck Fipke and all the other Northern pioneers who identified mineral deposits there. Between Yellowknife and Sabina Gold & Silver’s Goose camp, the plane travelled over hundreds of kilometres of waterlogged tundra with nary an interruption. Then, rather suddenly, an open-pit diamond mine – a mineralized pin prick in a pin cushion measuring millions of square kilometres. The diamond mine was Diavik; Ekati is nearby.
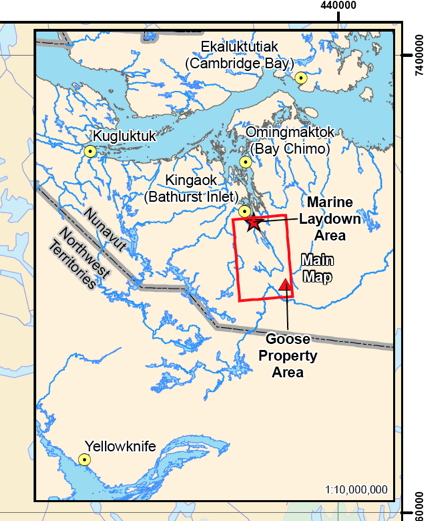
This is about as far from “civilization” as it’s possible to get. For perspective, driving from Billings, Montana to Edmonton, Alberta, a major Canadian northern outpost, takes about 11 hours – roughly akin to driving from Durango to Los Angeles. It takes another 15 hours to drive from Edmonton to Yellowknife — the equivalent of travelling from Los Angeles to Portland. Sabina’s Back River project is a further 520 kilometres beyond Yellowknife, to the northeast.
As for Sabina, the main mystery on the company’s vast Back River property may be just how many high-grade ounces are buried under the Arctic tundra. It’s a puzzle this summer’s drill program should go some way to solving. A single early result from the 10,000-metre summer exploration program was promising. The first drill hole, 17GSE516B – released the morning I flew into Yellowknife en route to the site visit – intercepted 9.48 g/t gold over 38.55 metres in a down-plunge extension of the Llama deposit. Not bad for a 460-metre step-out hole.
FIRST IMPRESSIONS
Our plane of analysts landed at the Goose camp on a high-quality air strip made from gravel produced on-site. The camp gets its name from adjacent Goose Lake, which serves as the winter landing strip for 737s that come in laden with fuel. The well-run camp felt more like a mining operation than an exploration camp.
Inside, we were briefed on the objectives of the summer drill program and the path forward by CEO Bruce McLeod, VP Exploration Angus Campbell and Exploration Manager Jamex Maxwell. The broad outlines of the mine were established by the initial project 3,000-tonnes-per-day Feasibility Study (3KFS) McLeod commissioned when he took over in February 2015. At US$1,150/oz gold, C0.80 exchange and a 5% discount rate, the FS showed:
- 240,000 oz annually for first 8 years, about 200,000 oz for 12-year life of mine;
- $415 million initial capex, $185M sustaining capex;
- 6.3 g/t Au average head grade, 93% recovery;
- life-of-mine, all-in cash costs of US$763/oz (incl initial & sustaining capex & closure costs)
VP Ex Campbell spoke about uber-high-grade exploration upside (more on that later), while derisking was the major theme for McLeod: “We can’t afford to make mistakes in this part of the world.” Sabina has spent about $5.5 million on basic engineering since the completion of the Feasibility Study, he said, and is now into detailed engineering.
The CEO describes the Back River project as a straightforward mine in a complex environment. From a geotechnical perspective, McLeod says Back River is probably the simplest project he’s been involved with. His assertion was confirmed by a visit to the nearby mill site, the helicopters landing on flat bedrock terrain. One of the benefits of a vast property is the ability to choose exactly where the mill will be. Standing on the flat terrain of scrub and bedrock, with a 360-degree panorama view, it was easy to visualize a mine taking shape.

I found an analogy McLeod used in his recent presentation at the Beaver Creek precious metals summit useful: “To a layperson, a feasibility is a concept, basic engineering is a plan and detailed engineering is a blueprint.” As Sabina constructs the blueprint, the focus is on investing upfront to avoid problems down the road. During the site visit, McLeod talked about his love for technology and some of the high-tech toys at his house, which he said “has lots of gizmos and bells and whistles and shit that breaks down all the time. It won’t happen here.”
It’s not typical CEO bluster: McLeod has already built a mine in Canada’s North. That was Capstone’s Minto copper mine in the Yukon, built by Sherwood Copper and the first hard-rock mine constructed in the territory in a decade. Sherwood was founded and run by McLeod and later bought by Capstone for $244 million. Minto was built on time and under budget – no small feat in Canada’s North.
Recent problems experienced by Nunavut neighbour TMAC Resources (TMR-T) at its recently opened Hope Bay gold mine illustrate the importance of “doing it right the first time.” TMAC recently slashed its annual guidance in half – from 100,000 to 120,000 ounces of gold to 50,000 to 60,000 ounces – due to processing issues and recovery problems. Sabina is paying close attention to metallurgy and a potential processing change from whole ore leach to flotation is one of the optimizations Sabina is studying.
BACK TO THE FUTURE
Some background on Back River: Sabina Silver became Sabina Gold & Silver with its 2009 purchase of the high-grade gold project from Dundee Precious Metals (DPM-T). Prior to that, the flagship was the silver-rich Hackett River VMS deposit 45 kilometres to the west, which Sabina sold to Xstrata (now Glencore) in 2011 for $50 million cash and a significant silver royalty. That transaction put Sabina into the rare category of well-funded junior, where it remains. More on the silver royalty later.
Sabina has since added about 5 million ounces, bringing the Back River resource to 7.2 million ounces in all categories. Most of the added ounces were drilled in the first two years, followed by a lull in drilling during the 2011-16 bear market. The most recent drill program has taken the number of metres drilled above 500,000.
The scale of the core-cutting facility at Goose is an indication of the size of previous programs. It can comfortably handle 85,000 metres in a single season, so is not stretched at 10,000 metres, McLeod noted. It may seem like a minor detail, but is another box ticked for any major that buys the district-scale project (Goldcorp, for example, is carrying out an aggressive exploration drill program at Coffee).
The Back River project is a banded iron formation project that consists of 10 high-grade gold deposits on Sabina’s 53,000-hectare properties. It’s an 80-kilometre district. Llama is one of four deposits at the main Goose project area, the focus of the 3KFS that McLeod commissioned. (An earlier FS modelled a 6,000tpd operation producing 350,000 oz over a 10-year mine life.) Three of the four Goose deposits are part of the 3KFS: Goose main pit, Umwelt open pit and underground and the Llama open pit. The Llama underground, including hole 17GSE516B, is not.
ECONOMICS OF EXPLORATION
One of the objectives of Sabina’s drilling is to determine if there are enough high-grade ounces underground to define a “treasure box” that could be mined up front. If the company is successful, that would involve shifting sustaining capex into the front end of the mine plan. But it could significantly improve already strong project economics, especially at the front end of the mine life. An increase of just 500 tonnes per day – to 3,500tpd – could vault Sabina into 300,000 oz/year territory.
Angus Campbell, Sabina’s VP Exploration, shed some light on how rich some of the exploration potential is on Sabina’s ground. Being the guy in charge of running exploration programs in a gold-rich 80-kilometre belt must have a kid-in-a-candy-store feel to it. But with McLeod in charge of the candy allocation, Campbell’s targets must be chosen wisely and justified. Despite 500 kilometres of drilling, there remain multiple opportunities for resource expansion, both at existing deposits and at deposits not included in either Feasibility Study.
Consider Sabina’s George deposits, about 50 kilometres away from Goose. George hosts about 2.1 million gold ounces included in the 6KFS but NOT in the 3KFS. Drilling there in the 1980s, outside the resource envelope, also hit several wide, shallow intersections of 6 and 7 g/t Au, McLeod said – rich ore by any standard. Sabina geologists were puzzled why these near-surface intercepts were not followed up at the time.
The answer, from people directly involved in the drill programs: the predecessor company was looking for higher Lupin-like grades of 9 and 10 g/t material. The nearby Lupin mine produced about 3.35 million ounces of gold between 1982 and 2004 at an average head grade of 9.27 g/t.
Under the 6,000tpd plan, George ore was slated to be trucked to the mill at Goose. But McLeod believes George is destined to become a second standalone mine once Goose is put into production. It’s a strategy both Agnico Eagle (Amaruq) and TMAC Resources (Boston) are following with their multi-deposit Nunavut gold districts.
EXPLORING A VAULT
The greatest upside potential, however, is probably where Sabina is drilling now – at the Llama extension and the Umwelt Vault zone. Particularly the latter. Vault assays are outstanding from the summer drill program, which included about 4,000 metres of Vault drilling. A spring hole there hinted at the richness, returning 16.86 g/t gold over 13.5 metres, including 27.11 g/t over 7.95 metres.

The Vault targeting is follow-up from rich 2011-12 intercepts, including 17 metres of 49.24 g/t Au. For perspective, that grade is roughly equal to GT Gold’s (GTT-V) recent intercept that helped send that Golden Triangle focused play to a $200 million market cap briefly (Sabina’s market cap is $517 million. Except Sabina’s 2012 hole was 17 metres, compared to 6.95 metres for GTT. I asked VP Ex Angus Campbell why the rich hits weren’t followed up on at the time – he said the focus then was on building open-pit ounces.
On the infrastructure and development front, Sabina plans to truck supplies to the mine via a 157-km winter road built every year at a cost of $8 million. The CEO described it as a “fairly simple” road, logistically. Sabina will have about 45 days to truck supplies from the marine laydown area, in southern Bathurst Inlet, to the Goose camp.
Sabina is not banking on it, but a Northern road plan that has been decades in the making could also intervene to lower costs for the project. That’s the Grays Bay port and road initiative, a plan for an all-season 230-km road from a deep-water Arctic port that connects to the Yellowknife winter road. With the buy-in of the Kitikmeot Inuit Association, which also strongly supports Back River, this iteration of the plan looks closer to reality than it has for some time. The road would be closer to the George deposit than Goose, but could result in significant savings.
THE PATH FORWARD
Resource Opportunities initiated coverage on Sabina Gold & Silver on May 18, 2015, during the bear market. The catalyst for coverage was McLeod’s hiring. When I met him and Sabina’s VP Communications Nicole Hoeller in a Vancouver coffee shop, McLeod gave me a taste of his tenacity: “My philosophy is like the Italian rule of driving: you rip the rear-view mirror off, put your foot on the gas and it doesn’t really matter what’s behind you but you’re moving forward … You’re not going to let your foot off the gas.” The line implies recklessness, but it’s more about a single-minded focus on advancing projects.
McLeod could not have foreseen the dark days of summer 2016, but the philosophy served him well during that period. That’s when the Nunavut Impact Review Board (NIRB) recommended to the federal government the rejection of the Back River project as currently constituted, despite widespread Inuit and community support. The reasons given were concern over caribou and climate change implications. Ottawa flipped the tables, rejecting the NIRB’s conclusions and ordering the regulatory agency to re-examine its findings. That resulted in a positive recommendation. A final ruling from the federal government is expected before year-end.

The number of high-quality gold discoveries in recent years has dropped along with the exploration budgets of the majors. Ore grades have steadily fallen and the miners are more reliant than ever on junior exploration companies to fill the supply gap. There are precious few district-scale, high-grade gold projects in safe jurisdictions. Sabina’s Back River fits the bill and has no fatal flaws. I expect Sabina to be acquired by a large gold mining company, at prices well above the current levels. In a rising gold price environment – not a given, a bidding war could well be the outcome.
CONCLUSIONS
I have described Sabina previously in the newsletter as a kind of triple leverage play, and it still holds true. The shares were at bear market levels of 39 cents when I initiated coverage, and Sabina had 194 million shares outstanding. Importantly, the share count has risen only 30 million since then as the stock has increased sixfold.
That’s in the rear-view mirror, of course, and the key question is what kind of upside exists from current levels. Gold is showing weakness again, following an increase through US$1,300/oz and rapid rise to $1,350. But I expect the precious metal to resume its rise in an easy-money world, and Sabina’s 7.2 million ounces make the company’s shares an ideal vehicle for exposure to gold. I have added to my position at levels above the current share price. The following factors give Sabina multibagger potential from these levels, and tremendous leverage:
1) Exploration – Drill plays have been getting much of the love in recent months. GT Gold Corp and other plays focused on British Columbia’s Golden Triangle plays have been leading the charge, but there have been others. The junior market’s enthusiasm for drill plays and ambivalence towards development plays reminds me of the Benjamin Graham quote: “In the short run, the market is a voting machine but in the long run it is a weighing machine.” Sabina’s recent drill results compare favourably with many drill plays that have added tens of millions of dollars of market cap on favourable assays. In Sabina’s case, the assays are overlain on a very high-grade, FS-stage gold project and potentially have a direct favourable impact on project economics. Votes come and go but the weight remains.
2) Takeover premium. Recent takeover premiums in the gold space have been at healthy premiums (see below). In Sabina’s case, the strength of the project means the premium should at least match the highest-ranking, Integra at about 50%. That offer came from a major (Eldorado Gold) that already owned about 13% of Integra shares. Sabina has no such partner, one of the reasons a bidding war is quite possible. Dundee Precious Metals and Sun Valley Gold are the largest shareholders, each with just above 10%. Here are the takeover premiums a few of the more recent takeovers. The premium to the last close is first, followed by the premium to the 20-day volume-weighted average share price:
- Eldorado – Integra Gold ($590 million): 46%, 52% (gold at US$1,233/oz)
- Kirkland Lake Gold – Newmarket Gold ($1 billion): 9.4%, 23% (US$1,318/oz)
- Goldcorp – Kaminak Gold ($520 million): 33%, 40% (US$1,279/oz).
3) Silver royalty: Sabina retained a valuable royalty when it sold the prior flagship project, the Hackett River polymetallic deposit, to Xstrata (now Glencore). It’s a 22.5% royalty on the first 190 million ounces of silver produced, and 12.5% on the remainder. Hackett River is one of the world’s largest undeveloped VMS deposits and the main price is zinc. Zinc has soared from below US70 cents/lb in January 2016 to about $1.40 today. The royalty was previously assigned a value of $300 million by analysts, and McLeod contends it would trade at a valuation of $300-$400 million in the portfolio of a larger royalty company such as Wheaton Precious Metals or Royal Gold. The silver royalty gets little to no value in Sabina’s portfolio.
Suitors? It’s a long list. Goldcorp has telegraphed its intention to only acquire district-scale projects, and Back River fits the bill. The project is superior on almost every level – grade, size, scalability – to Kaminak’s Coffee project and Goldcorp spent $520 million to purchase that operation. This is pure speculation, but I bet B2Gold CEO Clive Johnson would also love to open a high-grade gold mine in Canada to go with operations in more exciting jurisdictions that include Mali, the Philippines and Burkina Faso.
Management is the single most important ingredient in the junior mining sector, and Sabina’s is impressive. When he took over as CEO, McLeod refocused the company, trimming some fat and beefing up insider skin in the game. Under his stewardship, Sabina has smartly increased the quality of the gold ounces while controlling the share structure. I was impressed during the site visit by both VP Ex Angus Campbell and Exploration Manager James Maxwell.
Finally, a small detail. Sometimes, they tell a tale. There was no swag on the site visit – company shirts, ball caps, pens, etc – and clearly cost considerations were front and centre for Sabina. I’ve seen lots of swag from plenty of lesser projects in my travels. As a shareholder, seeing that kind of focus on the lesser details reassured me that Sabina will pay close attention on the big details, too – such as a fair takeout price.
Sabina Gold & Silver (SBB-T)
Price: $2.31
Shares outstanding: 224 million (243M f-d)
Treasury: $36.6 million (as of June 30, not including financing proceeds)
Market cap: $517.4 million
Disclosure: I own shares of Sabina Gold & Silver and the company paid for costs associated with the site visit. Readers are advised that the material contained herein is solely for information purposes. Readers are encouraged to conduct their own research and due diligence, and/or obtain professional advice. Nothing contained herein constitutes a representation by the publisher, nor a solicitation for the purchase or sale of securities. The information contained herein is based on sources which the publisher believes to be reliable, but is not guaranteed to be accurate, and does not purport to be a complete statement or summary of the available data. Any opinions expressed are subject to change without notice. The author and their associates are not responsible for errors or omissions. They may from time to time have a position in the securities of the companies mentioned herein, and may change their positions without notice. (Any positions will be disclosed explicitly.)
Gold suffered a sharp pullback this past month, spawning bearish sentiment. Futures speculators fled on surging Fed-rate-hike odds and new stock-market record highs. That pounded gold lower despite strong investment demand. This healthy sentiment-rebalancing retreat has left gold ready to rally again. Both its technicals and seasonals are very bullish, and futures speculators’ selling overhang has considerably abated.
On September 7th, gold powered 1.1% higher to $1348. That was exactly a 1.0-year high, gold’s best level seen since before Trump’s surprise election victory and the resulting extreme Trumphoria stock-market rally. But since gold had surged 4.9% higher in less than two weeks, greed was mounting again. So a couple trading days later, gold started selling off sharply and birthed this past month’s pullback.
As is usually the case in gold, the pullback spark was multifaceted. When gold had peaked, futures-implied Fed-rate-hike odds for its mid-December meeting were under 32%. But they shot up to 42% on Monday September 11th, when gold’s initial 1.5% drop kicked off this pullback. That day saw a strong relief rally in the stock markets, following a weekend where North-Korea and hurricane-Irma fears failed to materialize.
North Korea didn’t launch another ballistic missile or detonate another nuclear bomb for its Founder’s Day holiday, the anniversary of Kim Jong-un’s grandfather founding the modern country in 1948. And Irma’s eye veered south over Cuba before slamming Florida, dissipating enough of its energy. Thus Florida was thankfully spared from being razed like some of the Caribbean islands that bore Irma’s full force.
So the S&P 500 surged 1.1% that day, hitting its first new record high in five weeks. That lifted perceived Fed-rate-hike odds. As the anti-stock trade that often moves counter to stock markets, gold fell sharply on heavy gold-futures selling. That was pretty much the whole story of this past month’s entire pullback, a parade of new stock-market record highs and higher Fed-rate-hike odds fueling big gold-futures selling.
Thus by this week, gold had retreated 5.7% to $1271 in less than a month. During that span, no fewer than 11 new all-time-record-high S&P 500 closes were witnessed. That’s actually the biggest cluster seen in the entire post-election Trumphoria rally! And futures-implied Fed-rate-hike odds for its December meeting skyrocketed from 32% to 83% in that gold-pullback span. No wonder gold suffered heavy selling.
Big pullbacks always weigh on sentiment, breeding bearishness. So traders are now naturally quite pessimistic on gold’s near-term outlook. But that’s the very reason pullbacks and corrections exist, to rebalance sentiment. That keeps bull markets healthy. The excessive greed seen at major interim highs threatens to suck in too many buyers too soon, exhausting near-term buying. That can prematurely kill bulls.
Major mid-bull selloffs work to bleed away this topping greed. This is especially true for the gold-futures speculators who dominate gold’s short-term price action. As a herd they tend to get excessively long in strong gold rallies leading to interim highs. Pullbacks and corrections force these momentum players to start unwinding those overweight upside bets. Their selling quickly feeds on itself in this hyper-leveraged market.
That ultimately generates fear, restoring psychological balance. This paves the way for buyers to return and drive gold’s next rally higher. That’s where we are today. The past month’s sharp gold pullback has likely largely run its course, close to a major bottoming. This is evident in gold’s technicals, the collective gold-futures positions held by speculators, and gold’s seasonals. Gold’s technicals keep this pullback in perspective.
While a sharp 5.7% drop in just 18 trading days feels miserable, it was no big deal in the grand scheme. Gold’s current bull was born in late 2015, fueled by huge investment demand following the first stock-market corrections in years. This gold bull’s first upleg powered 29.9% higher in just 6.7 months into July 2016. Then gold corrected, which is perfectly normal and expected after all uplegs in healthy bull markets.
But thanks to the extreme Trumphoria stock-market rally ignited by Trump’s surprise win, this gold bull’s first correction snowballed to monstrous proportions. Gold is often hostage to stock-market fortunes, as they effectively control gold investment demand. When stock markets are high, investors feel no need to prudently diversify their stock-heavy portfolios with counter-moving gold. Thus gold languishes in stock euphoria.
That anomalously-large gold correction finally bottomed in December 2016 after a brutal 17.3% loss in just 5.3 months. Nevertheless that remained short of new-bear-market territory at -20%, so gold’s young bull remained very much alive and well. This gold bull’s second upleg has powered higher on balance all year, up 19.5% at best over 8.7 months in early September. This current upleg has proven very impressive.
Gold has carved a well-defined uptrend this year, despite major obstacles. They include the seemingly-endless parade of Trumphoria-fueled stock-market record highs, the Fed’s third and fourth rate hikes of its current cycle, and gold’s usual summer-doldrums low which I warned about in advance. Despite all that, gold kept marching higher. This second upleg’s uptrend is truly outstanding given 2017’s stiff gold headwinds.
As I discussed back in early August, gold usually enjoys a major autumn rally between mid-summer and late September. This year’s proved quite strong, with gold powering 11.2% higher in just 2.0 months by early September. That catapulted gold above its uptrend resistance, and generated plenty of greed. As of early September, gold’s 17.2% year-to-date gain trounced the S&P 500’s 10.1%. Gold is thriving this year!
Again mid-upleg pullbacks are essential to keeping sentiment balanced, ultimately both prolonging and enlarging uplegs. Pullbacks are sub-10% selloffs within ongoing uplegs. Corrections are 10%+ selloffs between uplegs within ongoing bulls. Bull markets without pullbacks and corrections, like these surreal stock markets today, are very dangerous. Suppressing selloffs only delays then later exacerbates them.
Despite gold’s sharp 5.7% pullback in the past month, this current upleg’s technicals are still very bullish. Gold remains well within its upleg’s strong uptrend, well above lower support. And other than the weeks straddling that early-September interim high, this week’s $1270s levels are still among the best seen this year. On top of that gold remains above its trend-defining 200-day moving average, which continues to rise.
So from a pure technical perspective, the bearish gold sentiment these days is totally unjustified. Rather than fearing gold is heading much lower, smart speculators and investors should be salivating at buying relatively low within a strong bull-market upleg. Sharp mid-upleg pullbacks nearing trend support offer the best buying opportunities seen within bull markets outside of the major-correction lows between uplegs.
Most if not nearly all of the gold selling driving this recent healthy pullback came from futures speculators. These traders run extreme leverage that can exceed 25x! Such vast risk forces them to be short-term momentum players. This is evident in this chart showing speculators’ total long and short contracts per the weekly Commitments of Traders reports rendered under gold. These guys have been heavy sellers.
Because of gold futures’ extreme leverage, their speculators punch way above their weight in terms of bullying gold’s price around. It’s impossible to figure out why gold’s price does what it does without first understanding what’s going on in gold futures. Last week I wrote an essay on gold uplegs’ three stages that dives into gold-futures trading in depth. You may need that background to understand this critical chart.
Speculators’ collective gold-futures positions are only reported once a week, current to Tuesdays. Gold peaked at $1348 on Thursday September 7th, which was part of the CoT week ending the next Tuesday the 12th. Total spec gold-futures longs had surged to 400.1k contracts that day, an 11.5-month high. 400k+ is high absolutely too, as the all-time record peak seen in early July 2016 was 440.4k contracts.
That left gold with a futures selling overhang in early September. With these traders largely fully deployed on the long side, they didn’t have much more room to buy. But they had lots of room to sell if something spooked them. And there’s nothing gold-futures speculators fear more than Fed rate hikes. So as the December rate-hike odds rocketed higher in September, these hyper-leveraged traders were quick to sell.
In the first CoT week after that peak, they dumped 23.2k long contracts. In the second CoT week, which is the latest as this essay is published, they jettisoned another 25.1k. Anything over 20k in a single CoT week is huge. So speculators’ gold-futures selling has been fast and furious. The 48.3k long contracts they cast into the markets were the equivalent of 150.2 metric tons of gold! That’s far too much to digest quickly.
According to the World Gold Council’s latest fundamental data, global gold investment demand in the first half of 2017 totaled 699.6t. Divide that by 26 weeks, and it works out to 26.9t per week. So there’s no way the gold-futures speculators’ colossal 75.1t-per-week selling can be absorbed. That’s far too much gold too fast for investment demand to offset. Thus gold fell sharply as supply temporarily overwhelmed demand.
Such extreme selling rates are just as unsustainable from the futures speculators’ side. Out of 978 CoT weeks since early 1999, only 21 or 2.1% have seen spec long-side selling exceed 48.3k contracts in a 2-CoT-week span. Such extreme selling soon peters out, which helps gold bottom. There’s no way that 24k-contract-per-CoT-week spec-long-selling pace can be maintained for long, as long selling is self-limiting.
Speculators’ gold-futures longs are finite. Even in the deep gold despair of late 2016 following that epic Trumphoria-driven gold correction, they bottomed around 254k contracts. They were sitting at 351.8k back on September 26th, the latest CoT data when this essay was published. Since then gold fell still-another 1.8% at worst as of Tuesday this week. So the next CoT report Friday afternoon will show more selling.
If speculators dumped another 20k long contracts, that only leaves 78k over this gold bull’s rock-bottom support. And those levels are seldom seen within uplegs, only between uplegs at the bottoms of major corrections. So a case can be made that the lion’s share of the gold-futures selling that drove this past month’s pullback is likely over. While speculators could sell more, they’ve probably already dumped enough.
Total spec longs certainly aren’t low, but they don’t get low within bull-market uplegs. And spec shorts aren’t high, but they don’t get high without some super-bearish catalyst to drive risky short selling. With those December Fed-rate-hike odds already up at 83%, that eventuality is nearly fully priced in. Those futures-implied Fed-rate-hike odds seldom exceed the mid-80s until a week or so before a hiking FOMC meeting.
Another reason this past month’s gold-futures selling has likely largely run its course is investors are still aggressively buying gold. Futures speculators dominate gold’s short-term trends with their epic leverage, but investors with their far-larger pools of capital drive broader upleg and bull-market trends. While futures speculators rushed to sell last month, stock investors flooded into gold ETFs led by the GLD SPDR Gold Shares.
Again in last week’s essay on gold uplegs’ three stages I explained the crucial GLD mechanics and gold-price impact in depth. In a nutshell, when stock investors buy GLD shares faster than gold itself is rising it forces this ETF to shunt that excess demand and capital into physical gold bullion. In September while gold plunged 3.1%, GLD’s holdings surged 5.9% or 48.2t higher! That reveals very-strong investment demand.
GLD hadn’t enjoyed a bigger monthly holdings build, and thus seen more stock-market capital inflows, since June 2016. That was when gold was in favor as this young bull’s first powerful upleg was starting to top. So to see gold investment demand soaring back toward those levels despite rocketing Fed-rate-hike odds and the biggest Trumphoria cluster of stock-market record highs was remarkable and very bullish.
If investors are already flocking to gold despite these lofty stock markets, imagine how gold investment demand will soar when they inevitably roll over. Remember this entire gold bull was ignited back in late 2015 and early 2016 on the first stock-market corrections in 3.6 years. The next stock-market correction, which is long overdue, will lead to another scramble by investors to prudently diversify their stock-heavy portfolios.
Gold’s seasonals also argue that its pullback is likely largely over, with a major rally imminent. This chart individually indexes gold prices to a 100 baseline within each bull-market year from 2001 to 2012 and 2016. Then all these annual indexes are averaged together to discern bull-market seasonal tendencies. It’s perfectly normal and expected for gold to suffer a major seasonal pullback in late September and October.

In modern bull-market years, gold’s autumn rally tends to top in late September. Specifically it peaks on last month’s 15th trading day on average. That translates this year to Friday September 22nd. Instead gold’s seasonal peak came a couple weeks earlier last month. That may have simply been because gold was overbought, having surged 11.2% in 2.0 months which is much better than the 6.9% autumn-rally average.
After that autumn-rally interim high, gold tends to suffer a seasonal pullback in bull-market years ending in late October. That averages out to this month’s 16th trading day, or Monday October 23rd this year. But since this year’s typical seasonal pullback was pulled forward 11 trading days, it’s not unreasonable to expect it to end proportionally early. That would peg today the 6th as the potential seasonal bottom for gold!
This duration-shifted rationale is flimsy alone, but it gains weight due to the magnitude of gold’s seasonal pullback this year. Gold only tends to retreat 2.2% on average in this late-September-to-late-October span. But this year it has again fallen 5.7% in that rough timeframe, 2.6x the seasonal average. Selloffs generally have a size-and-time tradeoff. The bigger and sharper they are, usually the shorter their duration.
Remember selloffs within healthy ongoing uplegs exist to rebalance sentiment. Greed can be bled away slowly with a gradual shallow pullback, or blasted away rapidly with a sharp deep pullback. And there’s no doubt this past month’s one was the latter in seasonal terms. It should’ve done more than enough work to eradicate early September’s excessive greed and inject fear back into gold-futures speculators.
The really exciting thing is gold’s October seasonal bottom is the last one before this metal’s strongest seasonal rally of the year. On average gold’s winter rally propels it 9.5% higher in bull-market years by late February. That 9.5% winter rally well outguns the 6.9% average autumn rally that recently ended, and dwarfs the 3.8% average spring rally. We are right at gold’s most-bullish time of the year seasonally!
Gold has real potential to enjoy a monster winter rally this year, especially if these insane stock markets start to roll over under the Fed’s just-unleashed quantitative-tightening juggernaut. Just like back in early 2016, gold investment demand will skyrocket again when the long-overdue stock selloff starts generating some fear. This year has again proven gold can rally without weaker stock markets, but they really accelerate it.
And the Fed’s likely December rate hike is nothing to fear despite futures speculators’ paranoia. Gold actually thrives during Fed-rate-hike cycles. It averaged gains of 26.9% in all 11 since 1971 before this current one. During the last one between June 2004 to June 2006, gold soared 49.6% higher despite 17 consecutive rate hikes totaling 425 basis points! In the current cycle to date, this week gold was still up 20.1%.
Despite all the bearishness out there thanks to this past month’s sharp pullback, gold is readying to rally. Its technicals continue to look very bullish, gold-futures speculators’ extreme selling can’t be sustained, investors are still buying big, and gold’s biggest seasonal rally of the year is imminent. These coming major gains as this upleg resumes can be ridden in physical gold bullion or that leading GLD gold ETF.
But far greater upside is coming in the gold miners’ stocks with superior fundamentals. They enjoy big profits leverage that really amplifies rallying gold prices, starting at 2x to 3x for major gold miners and going even higher for smaller ones! The gold miners’ stocks have naturally fallen sharply with gold over the past month. They remain radically undervalued even at today’s gold prices, let alone where gold is heading.
The key to riding any gold bull to multiplying your fortune is staying informed, both about broader markets and individual stocks. That’s long been our specialty at Zeal. My decades of experience both intensely studying the markets and actively trading them as a contrarian is priceless and impossible to replicate. I share my vast experience, knowledge, wisdom, and ongoing research through our popular newsletters.
Published weekly and monthly, they explain what’s going on in the markets, why, and how to trade them with specific stocks. They are a great way to stay abreast, easy to read and affordable. Walking the contrarian walk is very profitable. As of the end of Q3, we’ve recommended and realized 967 newsletter stock trades since 2001. Their average annualized realized gain including all losers is +19.9%! That’s hard to beat over such a long span. Subscribe today and get invested before this young gold upleg matures!
The bottom line is gold is readying to rally. The sharp pullback it suffered over the past month is normal and healthy, serving to rebalance sentiment. Despite the falling prices and resulting bearishness, gold remains well within its bull-market upleg’s strong uptrend channel. The futures speculators responsible for gold’s selloff can’t keep jettisoning long contracts at the extreme and unsustainable rate seen last month.
Meanwhile stock investors continued aggressively buying gold, driving GLD’s biggest monthly holdings build of this gold bull’s second upleg. Their investment demand will explode when these crazy stock markets inevitably roll over. On top of all that, gold is on the verge of starting its biggest seasonal rally of the year. This past month’s sharp pullback created a fantastic opportunity to buy low before gold starts surging again.
Adam Hamilton, CPA
October 6, 2017
Copyright 2000 – 2017 Zeal LLC (www.ZealLLC.com)

Not every discovery becomes a mineral resource, not every mineral resource becomes a mine and not every mine turns a profit; mining is a tough business. It takes a keen eye for opportunity to identify troubled mining projects worth salvaging and then navigating a mining company to profit. It’s a talent that James Xiang has proven, which has led to his reputation as an astute and competent company builder — a reputation he hopes to build further with North American Lithium (NAL).
A native of China, James Xiang has been making his mark in Canadian and international business circles as an entrepreneur, investor and a mining leader since immigrating to Canada in 2001 to pursue his education while exploring new business opportunities. He has carved out a niche in the mining industry, supported by his ability to connect global investment partners with local leaders to drive successful projects.
His first foray into the mining industry was with a China based Nickel-Copper project, GobiMin, which he brought to Toronto for listing on the Toronto Stock Venture Exchange. After listing, he served as CFO in charge of all the public company matters, including reporting, investor relations, various financing and forming a team in Canada and coordinating with the Chinese team.
In less than one and half years, GobiMin grew its market cap by 10 times, with the projects generating solid production cash flow and expanding its resource base. During the financial crisis in 2008, almost every resource company saw their shares prices decline. GobiMin, however, was able to sell its main project to a Chinese company with significant capital gain, which proved Xiang’s unique strategy to leverage North American and Chinese markets.
James Xiang was also instrumental in the turnaround of Canadian Royalties Inc. in 2014. As the company’s BOD member and key leader, Xiang re-built the company’s senior management and corporate strategy, which ultimately led to a company turnaround that caught the attention of the market, especially Investissment Québec, which partnered with Xiang at NAL.
Xiang currently serves as Chief Executive Officer and Director of North American Lithium (NAL), a North American near-term lithium producer formerly owned by RB Energy. The company is aggressively working to bring its fully-permitted lithium mine in Val-d’Or, Quebec to commercial production. Xiang and management have implemented an operational turnaround at North American Lithium, having brought in lithium experts, re-engineered the project, permitted and remediated all legacy environmental issues. With this hard work, the company achieved a milestone last month as it began its first production of salable lithium concentrates.
We recently sat down with James Xiang to discuss the global market for lithium and how he and his team have progressed after two years of restructuring of North American Lithium.
Thanks for joining us, James. We’re curious about lithium mining and the current thinking around the lithium market. What has the investment climate been so far to help NAL achieve production at its lithium mine in Quebec?
James Xiang: I appreciate the opportunity to talk about a project that has excited many people – our management team, as well as our investment consortium. It’s hard not to be enthusiastic, given the trends pushing demand.
Lithium, as you know, is the lightest metal with the highest energy density, allowing it to supply efficiently the maximum amount of energy storage per kilogram of material. What does that mean? Well, it’s ideal for a variety of industrial uses, but is best known for its use in batteries, particularly those used to power cell phones and tablets and also implanted medical devices.
We all know the strong demand for these technologies, so it’s no surprise that lithium demand is on a steep upward curve, too. Some reports project annual consumption to double to ~300,000 metric tons in 2020 from 2012 levels. Demand is growing by 12 percent annually, surpassing availability by 25 percent. So you can see how we’re positioning ourselves for the trends, with ~$500 million invested so far to bring the mine back on line.
What stage has NAL reached in bringing commercial production online?
James Xiang: We have brought in some of the top names in the business and over the past two years we have been re-engineering, re-testing and devising solutions to some of the issues that marked past commissionings of the mine. For example, we’ve done a thorough audit of material handling practices, which revealed solutions specifically for cold-weather storage and handling issues. Our thoroughness has paid off. The mine is now in operation and the first production of salable lithium concentrate began this August. We are pushing the production to commercial level in the next few months.
Currently, you are mining spodumene to extract lithium but what about production of lithium carbonate?
James Xiang: That’s the next phase. Our back-end review of operations found flaws in the hydromet plant, leading us to undergo further studies on what a restart of the plant will take. Its complete re-engineering should be completed early next year, so that we will be able to move into production of lithium carbonate in 2019. Then we expect to ramp up to full capacity of some 23,000 tonnes of battery grade of lithium carbonate in long term.
Why will your NAL’s current team succeed now where others have fallen short?
James Xiang: Well, timing is important. Being able to achieve operational efficiencies is, too. Our team is all local, seasoned experts with track records of diagnosing project issues and fixing them, especially strong in the local Quebec environment. And having the right financing in place, and the confidence of our investors is crucial. On the first front, well, we talked about the supply/demand picture for lithium. Benchmark Minerals Intelligence estimates prices of lithium carbonate will average $13,000 a ton over the 2017-2020 period from around $9,000 a ton in 2015-2016.
We have brought our cost structure in line with other lithium producers, putting us on sound competitive footing. And our investors have seen that we have a compelling value proposition in our aim to be North America’s only near-term, vertically integrated lithium producer, made all the more compelling as we have delivered against all of our milestones.
Disclaimer:
These materials may contain inaccuracies or typographical errors. NAL is not responsible for any errors or omissions contained in these materials and do not guarantee the accuracy, completeness or timeliness of the information contained herein. This article contains certain statistical, market and industry data that was based upon information taken from industry publications and reports or was based on estimates derived from the same and management’s knowledge of, and experience in, the markets in which NAL operates. Actual outcomes may vary materially from those forecast in such reports or publications. NAL has not independently verified any of the data from third party sources referred to or ascertained the underlying assumptions relied upon by such sources.
Production estimates and timelines relating to the commissioning and start-up of the hydrometallurgical plant and hydromet plant are based on preliminary estimates provided by BBA Inc. and Hatch Engineering to NAL. There is no assurance that the estimated timelines and related milestones will be met as planned or at all.
MiningFeeds.com is being compensated by the subject of this article and the article is meant to serve informational purposes only, not investment advice and does not constitute a recommendation to buy or sell securities in North American Lithium.
MiningFeeds.com does not own any shares or have any financial interest in the company.
- Since I issued my “book profits now” call for gold several weeks ago, the price has declined relentlessly from the $1360 area high.
- Investors want to know if I see signs that a fresh rally could begin. The good news is that gold/silver stocks and silver bullion look better than gold bullion. Some stocks are rallying strongly while gold oozes lower.
- Please click here now. This is the main problem for gold right now; a collapse in Indian market demand.
- Prime Minister Modi has acted more like Prime Minister Napoleon over the past year. He’s lorded over a collapse in manufacturing, anemic jobs growth, and tanking GDP. He has essentially devolved into what I call a “taxaholic”. He’s maniacally obsessed with expanding government size at the expense of the economy.
- Modi has ordered jewellers to file what he calls “Know Your Client” forms on gold jewellery purchases of 50,000 rupees or more. That has helped hammer demand by about 50%. It coincided with major flooding that prevented buyers from going to the stores.
- Over the past few weeks, Indian gold imports have been negligible. Commercial COMEX traders have sold into that demand vacuum, pushing the gold price down by about $90 an ounce.
- Dhanteras marks the start of Diwali on October 17. I expect some pick-up in demand then. Unfortunately, that doesn’t happen for another two weeks.
- The Chinese “Golden Week” holiday is also in play. Gold markets in China close for the holiday. Western gold bugs are finding the holiday is anything but golden for them, as the price seems to melt lower on a daily basis.
- Fear trade selling tends to produce violent price sell-offs. Love trade demand vacuums tend to produce the current “oozing” in the price. It’s not frightening for investors, but it’s disappointing and disheartening.
- The bottom line: Physical demand in both China and India is weak, and while buying in the SPDR fund (GLD-nyse) has been solid, it is nowhere near enough to overwhelm total supply.
- Please click here now. Double-click to enlarge this gold chart. The technical picture reflects the fundamentals. Gold has a head and shoulders top pattern in play. Unfortunately, the target of the pattern is about $1215.
- As the price rallied towards $1360, I noted that key Indian dealers were adamant that they would only be buyers in the $1200 area. At the time, that price seemed impossible to most Western investors. How impossible does it seem now?
- For a closer look at the price action, please click here now. Double-click to enlarge. The H&S top pattern is just plain “nasty”, but gold is now near a key Fibonacci line that sits at about $1268 on this December gold futures chart.
- The next US jobs report is scheduled for release on Friday. Gold has a rough general tendency to rally after the report is issued. A rally from either $1268 or the 76% retracement line at $1245 is likely, but a sustained move higher is unlikely to begin until Dhanteras ushers in Diwali on October 17.
- A crash in the stock market could jump start the rally, but please click here now. Chinese regulators just cut the amount of reserves banks need to hold. That’s pouring liquidity into the stock market. It happens just after a great US manufacturing activity report yesterday. So, a stock market crash soon is possible,but unlikely.
- Gold market fear trade enthusiasts should focus on the December debt ceiling issue, rate hikes, and QT (quantitative tightening).
- Please click here now. Because government lunatics keep borrowing money, it takes very little in the way of rate hikes to create a bear market for general equities.
- The Fed is on track to raise rates three times in 2018, and to launch accelerated quantitative tightening. It will be very difficult for the stock and bond markets to keep rising in that environment.
- I suggested that the 2014 – 2015 period would see gold trade sideways with a slight downward bias, and 2016-2017 would see it trade sideways with a slight upwards bias. That’s exactly what has occurred.
- 2018 should see gold begin a trending move to the upside. The fundamentals auger for that, and so do the charts. Please click here now. Double-click to enlarge. The current vacuum in love trade demand is creating needed right shouldering symmetry on the long term gold chart.
- I expect Trump to continue to essentially do what he promised to do in his election campaign. His most important promise is to give government bond market creditors a haircut on what they get paid.
- The US government bond market will collapse if the debt ceiling isn’t raised. Trump will get the bulk of his tax cuts platform passed, in return for raising the debt ceiling. He’ll then “finance” the rising deficit by attacking foreign holders of US government debt.
- This will occur as China launches its new oil for gold contract, which is optional for oil exporters. I doubt it creates the price parabola that many investors envision, but it should be generally supportive for the price of gold. It should help launch the price up and out of the huge inverse head and shoulders bottom on the long term gold chart. For the time being, the right shouldering process rolls on and investors should be eager accumulators.
- Please click here now. Double-click to enlarge. Next, please click here now. Double-click to enlarge. Both silver bullion and GDX look better than gold. Investors should focus on these assets during the final accumulation phase, and prepare for blast-off during Chinese New Year in early 2018
Thanks!
Cheers,
Stewart Thomson , Graceland Updates
https://www.gracelandupdates.com
Email:
Stewart Thomson is a retired Merrill Lynch broker. Stewart writes the Graceland Updates daily between 4am-7am. They are sent out around 8am-9am. The newsletter is attractively priced and the format is a unique numbered point form. Giving clarity of each point and saving valuable reading time.
Risks, Disclaimers, Legal
Stewart Thomson is no longer an investment advisor. The information provided by Stewart and Graceland Updates is for general information purposes only. Before taking any action on any investment, it is imperative that you consult with multiple properly licensed, experienced and qualified investment advisors and get numerous opinions before taking any action. Your minimum risk on any investment in the world is: 100% loss of all your money. You may be taking or preparing to take leveraged positions in investments and not know it, exposing yourself to unlimited risks. This is highly concerning if you are an investor in any derivatives products. There is an approx $700 trillion OTC Derivatives Iceberg with a tiny portion written off officially. The bottom line:
Are You Prepared?
Gold bull markets offer outstanding opportunities for traders to grow their wealth. These bulls consist of series of alternating uplegs and corrections. Naturally the best times to buy low within ongoing bulls are right after corrections when major new uplegs are being born. Gold uplegs have three distinct stages that are evident in real-time in key datasets. Understanding how gold uplegs play out leads to superior gains.
Bull markets in gold can be exceedingly profitable for investors and speculators. The last secular gold bull ran between April 2001 to August 2011. During that 10.4-year span, gold powered 638.2% higher! That radically bested the general stock markets’ 1.9% loss per the S&P 500 over that same time frame. Hardened contrarians willing to buy low as gold bottoms after long bears can ride all of gold’s big bull gains.
Unfortunately the great majority of investors lack the experience, discipline, and mental toughness to fight the herd to buy low when all hope seems lost. So they end up buying into gold bulls later after they are already well underway. Understanding the evolution of gold uplegs, what births them and fuels their growth, really helps later investors deploy capital at better prices. Buying relatively low is still essential mid-bull.
Knowing gold uplegs’ three-stage anatomy is very valuable for speculators too. By actively trading the upleg-correction cycles within ongoing bulls, traders can earn ultimate gains much bigger than buy-and-hold investors. Speculators buy relatively low early in major uplegs, then sell relatively high when they mature. This profitable trading cycle can continue as long as the bull persists, creating more effective upside.
Consider gold’s current young bull, which was stealthily born in deep despair in mid-December 2015. As of this week, gold was up 22.1% bull-to-date. But the gains possible actively trading its uplegs are much larger. Gold surged 29.9% higher by early July 2016 in this bull’s first upleg, then plunged 17.3% by mid-December 2016 in its first correction. Since then gold has rallied 19.5% in its second upleg as of early September.
That means traders had a shot at 49.4% total gains so far from this bull’s upleg-correction cycles, more than doubling buy-and-hold gains! While precisely timing bull markets’ major interim lows and highs is impossible, traders can capture more of these upleg gains by understanding how gold uplegs unfold. I’ve discussed gold uplegs’ three stages in our newsletters for years, but hadn’t yet put it all together in an essay.
Gold bull-market uplegs usually unfold in the same telescoping fashion. They are initially ignited by gold-futures speculators covering shorts. These traders are usually the only buyers at major lows following corrections when sentiment is hyper-bearish. They buy offsetting gold-futures long contracts to close out their existing short contracts at profits. This short covering is the spark that first kindles major gold uplegs.
That short covering soon burns itself out, as short-side traders have relatively-little capital compared to the other gold buyers. But it often propels gold high enough for long enough to entice long-side gold-futures speculators to return. They command much more capital than the shorts, and their buying soon becomes self-feeding. The more gold-futures contracts they buy, the more their peers start chasing that momentum.
That long-buying second stage eventually evokes gold uplegs’ third stage, the primary one and largest by far. All the gold-futures buying extends gold’s rally enough to get investors interested in returning. They control vastly more capital than futures speculators, so once they start buying gold is off to the races in a major new upleg. Unlike short-lived gold-futures buying, gold investment buying can run for many months on end.
Stage-one gold-futures short covering is the initial trigger that ignites stage-two gold-futures long buying. And all that futures buying together eventually jump-starts stage-three investment buying. As investors start to return to gold in a material way, gold’s upleg accelerates in a self-sustaining virtuous circle. The more capital investors pour into gold, the more it rallies. The more gold rallies, the more investors want to buy.
The neat thing about gold uplegs’ three stages is their distinctive buying is readily identifiable in real-time in a couple key datasets! These are not widely followed either, which grants big advantages to traders who take the time to stay abreast. The futures data to track gold uplegs’ first two stages comes from the weekly Commitments of Traders reports published late every Friday afternoon by the US government’s CFTC.
These CoTs slice gold-futures traders into commercial hedgers, large speculators, and small speculators. Both speculator groups lumped together create this chart, showing their collective total gold-futures short contracts in red and long contracts in green. With gold superimposed over the top in blue, the stage-one and stage-two gold-upleg buying is readily apparent. That flags gold uplegs’ births and early gains as they happen.
The most-important clue that a major new gold upleg is likely imminent is relatively-high or excessive gold-futures shorting by speculators. Every major gold upleg in recent years, during bull and bear alike, started powering higher immediately after elevated spec shorts. That is readily evident above in the red spec-short line. Higher spec shorts coincide exactly with major bottoms in gold, the best times to buy low.
Gold-futures trading is a surreal alternate reality due to the extreme leverage inherent in it. For decades in stock markets, margin has been legally limited to 50%. That makes for 2x maximum leverage, limiting risk. Futures trading is a radically-different beast. Today speculators are only required to have $4900 of cash in their accounts for each gold-futures contract they’re trading, so running maximum margin creates huge risk.
Every gold-futures contract controls 100 troy ounces of gold, which is worth $130,000 at $1300 gold. So speculators can run leverage to gold up to 26.5x today, which is incredible. At 26.5x leverage, all it takes to wipe out 100% of the capital risked is a mere 3.8% adverse move in gold! That doesn’t leave much room for error, as 1% to 2% daily gold moves aren’t uncommon. Traders can literally be destroyed overnight.
Trading gold at such supremely-unforgiving leverage greatly compresses the time horizons gold-futures speculators operate in. Since the present is so overwhelmingly dangerous to their capital, all they care about is short-term momentum measured in days on the outside. As a herd they pile on to whatever side of the trade is following gold’s short-term trend, exacerbating it. When gold is falling, they aggressively short it.
The resulting groupthink makes speculators’ collective gold-futures bets a powerful contrarian indicator. As gold plunges late in corrections due to heavy shorting, speculators’ selling firepower quickly exhausts itself. Once their short selling peters out, the downward pressure on gold prices evaporates. That marks the bottoms of gold corrections, and births major gold uplegs. That’s the optimum time for all traders to buy low.
The higher prevailing spec shorts, the faster they surged to that peak, and the sharper the resulting gold-price plunge, the greater the odds a major new gold upleg is imminent. Traders diligent enough to follow the weekly CoT data regularly can see and recognize these spec-shorting extremes as they happen. In December 2015 as gold languished near deep secular-bear lows, I forecasted “a mighty new gold upleg in 2016.”
As you can see on this chart, spec shorts had soared near all-time record highs. That portended huge short-covering buying to reverse those overextended bearish bets. A year later in December 2016 as gold was bottoming in despair ahead of another major upleg, I wrote another essay using this same spec-gold-futures analysis to explain why gold was soon going to surge dramatically higher on futures buying.
And then just recently in July 2017, another near-record spec gold-futures shorting spree marked another major gold bottom. At the time I pointed out how spec shorts had spiked almost as high as back in late 2015 when they birthed this gold bull. When speculators are heavily short gold futures by recent or all-time standards, it heralds an imminent big gold rally. In bull markets that usually means a major new upleg.
Speculators short selling are effectively borrowing gold they don’t own to sell it. They hope to sell high up front in hopes of later buying back lower to earn profits. They are contractually obligated to repay those gold-futures debts. Mechanically they are settled by buying offsetting long contracts to cover and close out shorts. So all gold-futures shorting is guaranteed near-future buying as those shorts are unwound!
That drives the first stage of gold uplegs. Short covering tends to be fast and furious, catapulting gold out of major lows rapidly. Once speculators start to buy to cover, gold moves higher on that demand. The rallying gold price quickly forces other speculators to cover, or risk catastrophic losses of capital due to their extreme leverage. So gold-futures short covering is self-feeding until it largely runs its course.
Those initial sharp spec-short-covering-driven gold rallies out of major lows usually spark stage-two gold-futures long buying. Unlike short-side speculators where gold-futures buying is mandatory to unwind those bets, long-side speculators have no obligation to buy. But they start getting bullish after short covering pushes gold high enough for long enough. So they soon take the gold-buying baton from the short guys.
Long-side speculators control much more capital than short-side ones, as evidenced in this chart. Note how the green total-spec-longs line is usually way above the red total-spec-shorts line. So once their buying kicks in, gold’s young upleg really accelerates. The delay from initial short covering to sizable long buying tends to run several weeks or so. Long-side gold-futures speculators don’t return until gold has rallied.
In this chart check out how short covering and long buying evolved out of the major gold lows seen in December 2015 and July 2017. The red total-spec-shorts line started dropping immediately out of gold’s lows, showing short covering underway. But the green total-spec-longs line didn’t start rising until a few weeks or so after that initial short covering. Stage-one short covering ignites stage-two gold-futures long buying.
While spec short covering usually largely fizzles out in a month or so, spec long buying can persist for months. That continues to propel young gold uplegs higher. As gold’s gains driven by futures buying mount, both technicals and sentiment really improve. The bearishness rampant at the preceding major bottom before the short covering bleeds away. The longer and higher gold rallies, the more bullishness grows.
Almost without exception, all major gold uplegs are initially birthed by spec gold-futures short covering. Then they grow from the resulting spec gold-futures long buying. So speculators and investors alike should closely follow the weekly gold-futures CoT data. In real-time it flags when gold is likely to bottom and when major new uplegs are likely to ignite. Then subsequent long buying confirms they are the real deal.
What the gold-futures speculators are collectively doing as a herd is so important to gold’s fortunes that I always analyze the latest weekly CoT data in depth in every issue of our weekly newsletter. There’s little chance of successfully buying gold relatively low and selling relatively high within ongoing bulls unless you are following these CoT reports. Their absolute levels and trends are the best gold indicators available.
But ultimately gold-futures speculators are a small group of traders. Even their long-side buying nears exhaustion after a couple months or so, their capital firepower exhausted. That stage-one and stage-two gold-futures buying needs to catapult gold high enough for long enough to get investors interested again. Their stage-three buying is what drives the lion’s share of major gold uplegs. But futures buying needs to ignite it.
Investors’ stage-three buying was historically far harder to track than the preceding futures buying. Good gold investment data was only available quarterly from the World Gold Council. That was far too seldom to catch major correction bottoms and upleg tops. Thankfully there’s a great proxy for gold investment demand that’s published daily, the physical-gold-bullion holdings of the leading SPDR Gold Shares gold ETF.
Stage-three gold-upleg buying data comes from GLD’s holdings. As I explained a couple weeks ago in an essay on gold investment resuming in our current upleg, GLD capital flows dominate gold trends. Rising GLD holdings indicate stock-market capital is flowing into gold via that ETF conduit, which bids it higher. Conversely falling GLD holdings reveal stock-market capital is exiting gold, which pushes it lower.
This last chart looks at GLD’s daily gold-bullion holdings in blue superimposed over the gold price in red. When GLD’s holdings start rising consistently after a major gold low, it means investors are returning to gold. Major gold uplegs are only possible if stage-three investment buying takes the baton from the gold-futures speculators. And GLD’s holdings are the key dataset that enables that to be observed in real-time.
The first massive upleg of this young bull propelled gold 29.9% higher from mid-December 2015 to early-July 2016. Differential buying of GLD shares was its major driver. GLD shares have their own supply and demand independent from gold’s. So when stock investors buy GLD shares faster than gold itself is being bought, this ETF’s share price threatens to decouple from gold to the upside and fail its tracking mission.
That can only be averted by shunting that excess demand into the underlying gold market. So GLD’s managers issue new shares to offset that differential buying. Then the capital raised from those sales is immediately plowed into physical gold bullion, boosting this ETF’s holdings held in trust for shareholders. GLD is effectively a conduit for the vast pools of stock-market capital to flow into and out of the gold market.
In early 2016 gold entered a new bull market out of a deep 6.1-year secular low because stock investors flooded back into gold via GLD shares. The stock markets were plunging in their worst correction since mid-2011, rekindling interest in prudently diversifying stock-heavy portfolios with gold. It’s a rare asset that tends to move counter to stock markets, so investment demand soars when stocks materially weaken.
Over the next 6.7 months, American stock investors poured so much capital into GLD shares that its holdings surged an epic 55.7% or 351.1 metric tons! That GLD buying alone accounted for nearly all of the total increase in world gold demand in the first half of 2016. That on top of the 82.8k contracts of gold-futures short covering and 249.2k contracts of gold-futures long buying fueled gold’s new bull market.
Without that stage-three investment buying taking the lead from the igniting gold-futures buying, gold probably wouldn’t have rallied 20%+ to officially enter bull territory. And just recently investment buying started returning which confirms this gold bull’s second major upleg is well underway. Unlike the gold-futures buying which exhausts itself in a few months at most, investment buying tends to run for many months.
Investors love chasing winners, nothing drives buying like higher prices. The more investors bid up gold through differential GLD-share buying, the more its price rallies. The more gold rallies, the more other investors want to join in to ride the momentum. Buying begets buying. That’s true for all forms of gold investment, not just gold ETFs. But the daily reporting of gold-ETF holdings makes their buying more visible.
Each of gold uplegs’ first two stages of buying drives gold high enough to trigger the next larger stage. And each stage transition yields important signals to speculators and investors. Understanding where gold is in these three stages is essential to gaming where it is likely heading. With the data necessary to track these stages available in real-time, traders following it can really boost their odds of buying low and selling high.
New gold uplegs start at major lows driven by excessive speculator gold-futures shorting. That selling soon exhausts itself, then these traders have to buy proportionally to reverse and close out their shorts. That stage-one short-covering buying launches new gold uplegs, and drives gold high enough for long enough to get the long-side gold-futures speculators interested. They soon take the gold-buying baton.
Between peak spec shorts and spec long buying starting as evidenced by rising longs is the best time to buy into gold in an ongoing bull market. Those events are unambiguous, as once spec shorts start falling from highs they rarely reverse. Total spec longs are relatively low when short covering starts too, and they don’t start rising materially for a few weeks. So if you know what to look for, those buying signals are clear.
Later on the young gold upleg is confirmed first by sustained spec long buying and later by sustained investor buying. Once stock investors’ differential GLD-share buying starts pushing this leading ETF’s holdings consistently higher, the gold upleg is fully verified. By that point it’s pretty much unstoppable barring some weird anomaly, totally self-feeding. Nothing drives gold investment demand like rallying gold!
The recent surge in GLD’s holdings in gold’s current upleg confirms investors’ stage-three buying is now underway. This will likely run for many months. If the stock markets finally seriously roll over under the ominous Fed quantitative tightening, that gold investment buying could last much longer than normal. So odds are gold’s current upleg has a long ways to run yet, both in terms of price and time. That’s very bullish.
This bull market’s latest upleg can certainly be played with GLD, but that will merely pace gold’s gains. Far greater upside will come in the gold miners’ stocks with superior fundamentals. Their profits really amplify rallying gold prices, fueling leveraged stock-price gains relative to gold. Despite their major breakouts in recent months, gold stocks remain deeply undervalued relative to gold. Their upside potential is vast.
The key to riding any gold bull to multiplying your fortune is staying informed, both about broader markets and individual stocks. That’s long been our specialty at Zeal. My decades of experience both intensely studying the markets and actively trading them as a contrarian is priceless and impossible to replicate. I share my vast experience, knowledge, wisdom, and ongoing research through our popular newsletters.
Published weekly and monthly, they explain what’s going on in the markets, why, and how to trade them with specific stocks. They are a great way to stay abreast, easy to read and affordable. Walking the contrarian walk is very profitable. As of the end of Q2, we’ve recommended and realized 951 newsletter stock trades since 2001. Their average annualized realized gain including all losers is +21.2%! That’s hard to beat over such a long span. Subscribe today and get invested before this young gold upleg matures!
The bottom line is gold uplegs within ongoing bull markets have three distinct stages of buying. They are first birthed by gold-futures speculators covering shorts. That pushes gold high enough for long enough to convince long-side gold-futures speculators to return. Their larger buying eventually grows young gold uplegs big enough to rekindle investment demand. Once investors start buying, gold uplegs are off to the races.
Identifying these three stages and their transitions as they happen is essential to optimizing buy and sell timing within gold bull markets. So following speculators’ gold-futures data in the weekly Commitments of Traders reports, and the daily GLD-holdings data revealing stock-investors’ gold capital flows, is truly essential. Investors and speculators greatly increase their odds for success by staying informed on this.
Adam Hamilton, CPA
September 29, 2017
Copyright 2000 – 2017 Zeal LLC (www.ZealLLC.com)
If you would like to receive our free newsletter via email, simply enter your email address below & click subscribe.
 Follow us on Twitter
 Become our facebook fan
CONNECT WITH US
Tweets
Tweet with hash tag #miningfeeds or @miningfeeds and your tweets will be displayed across this site.
MOST ACTIVE MINING STOCKS
Daily Gainers
 CMC Metals Ltd. CMC Metals Ltd. |
CMB.V | +900.00% |
 Eden Energy Ltd Eden Energy Ltd |
EDE.AX | +200.00% |
| GoviEx Uranium Inc. |
GXU.V | +42.86% |
| Eagle Nickel Ltd. |
ENL.AX | +41.67% |
| Citigold Corp. Limited |
CTO.AX | +33.33% |
| Mount Burgess Mining NL |
MTB.AX | +33.33% |
| Exalt Resources Limited |
ERD.AX | +31.94% |
| Casa Minerals Inc. |
CASA.V | +30.00% |
| Cariboo Rose Resources Ltd |
CRB.V | +28.57% |
| Belmont Resources Inc. |
BEA.V | +28.57% |


