
If you mention Ecuador in mining circles, you will get some raised eyebrows and mumbled cuss words from Canadian mining executives. This is because of Ecuador’s reaction in 2013 that looked like resource nationalism which resulted in a moratorium on mining activity and a hefty tax on profits. Ecuador’s infamous windfall profits tax and a series of other unfavorable provisions made almost any mining project unprofitable
The windfall profits tax was a 70-per-cent levy on excess profits, the terms of which, such as what are excess profits, had previously been subject to negotiation between company and government, leading to an uncertain business environment.
However, lessons were learned and Ecuador hopes to position itself as the up-and-coming mining investment destination in Latin America. The Ecuadorian government hired consultants Wood Mackenzie to provide recommendations and the country is adopting them quickly.
Ecuador, which depends on crude oil for half its national budget, is seeking to drum up more foreign investment after the recent crude price slump slashed government revenue. The government in 2015 separated the mining ministry from its oil ministry and announced plans to promote 36 projects to produce gold, copper and molybdenum estimated to be worth US$200bn.
It started in 2013 when Kinross Gold (TSX: K) walked away from the negotiating table after two years of fruitless talks with the Ecuadorian government over the investment conditions for the Fruta del Norte (FDN) project, one of Latin America’s biggest undeveloped gold deposits.
It also didn’t help that shortly before, IAMGOLD (TSX: IMG) had sold its Loma Larga project and left the country, and shortly afterwards, International Minerals sold its Río Blanco gold project and also said goodbye.
Kinross’ decision telegraphed to investors that negotiations with Ecuador were difficult and indicated to the country that its mining framework was not working. In exasperation and desperation, Kinross sold the construction-ready Fruta del Norte in 2014 for US$240 million, close to a quarter of what it paid to acquire the project in 2008.
Kinross bet on FDN and lost. The same year that Lundin Gold (TSX: LUG) bought the project, Ecuador embarked on a mission to make its mining framework more competitive and attractive.
Lundin obtained approval for the FDN environmental impact study in October 2016 and in December signed an exploitation agreement and an investment protection contract with the government. Construction of the 340,000 ounces per year mine has begun.
Lenin Moreno, who took office as President in May 2017, wants to attract US$4.6 billion in investment over his term in office for large-scale mining projects from companies including Lundin Gold, EcuaGold Mining, INV Metals, EcuaCorriente, Cornerstone Capital Resources (TSX-V: CGP), BHP Billiton and China Explorcobres. The investments hope to quadruple employment in the mining industry through 2022, according to Wood Mackenzie.
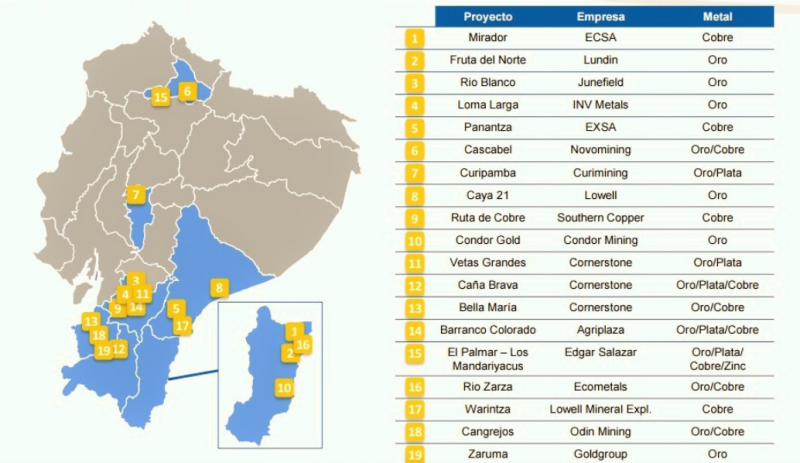
Two Chinese-owned mines are due for startup in the near term; the large-scale Mirador copper mine, controlled by the CRRC-Tongguan consortium, and the smaller Río Blanco, now operated by Junefield Mineral Resources.
There is a resurgence in exploration with several junior mining companies increasing activity in the country. Ecuador is looking to create a mining venture exchange. The plan is to link trading in junior mining stocks on the Toronto and Quito exchanges as part of a bid to finance US$488 million in exploration, the mining ministry said.
“We’re democratizing the industry. Local investors will be able to invest in mining, which is becoming a prosperous sector,” says deputy industrial mining secretary Henry Troya. “We’re building a sustainable industry.”
Other countries have gone down this road; Peru’s pioneering Lima venture exchange managed to list a dozen exploration companies at its height, including Karmin Exploration (TSX-V: KAR), Duran Ventures (TSX-V: DRV) and Red Eagle Mining (TSX-V: R). Santiago followed its example with its own venture exchange in 2014. However, with scant data on these exchanges, the scale of participation from Peruvian and Chilean retail investors is yet to be proved.
Ecuador has started to awarding exploration concessions after a hiatus of some six years, mines minister Javier Cordova told Mining Journal. Ecuador has overhauled its mining concessions registry and 237 concessions have been awarded to date to local and international mining companies, according to the ministry.
The ministry aims to boost mining exploration investment to US$600 million by the end of the year according to the newspaper El Telégrafo, citing Troya’s presentation at a mining conference in Quito. At least 27 companies have set up offices in Ecuador this year, including BHP Billiton, Newmont Mining, Fortescue Metals Group, Hancock Prospecting and Newcrest Mining.
The ministry is tracking mining exploration projects including Codelco-Enami JV Llurimagua and Cornerstone’s Cascabel. Ecuador’s mining chamber is further pushing the government to change both a tax on windfall profits and a capital gains tax to make the industry more competitive.
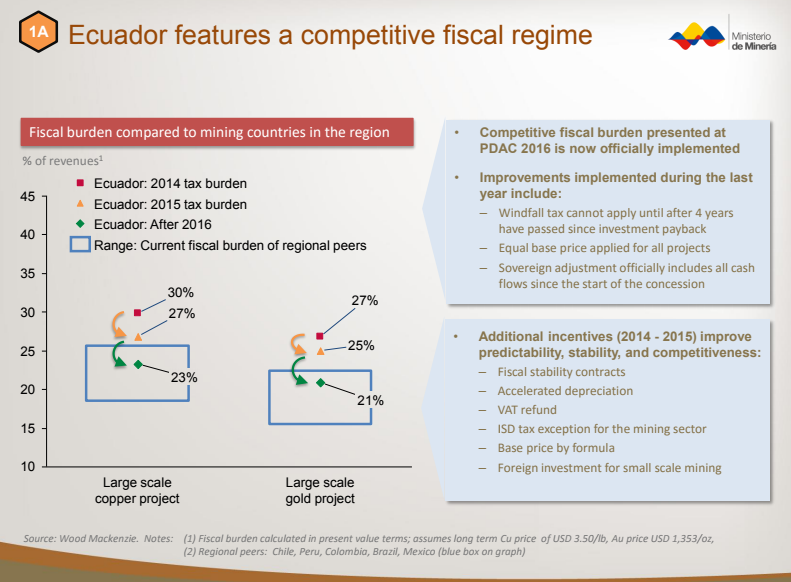
Improvements to the tax code that were implement in 2016 include: windfall tax cannot apply until after four years have passed since investment payback and an equal base price applied for all projects. These are some reforms and there is plenty of way to go.
With big pushes, often come big push backs, the question remains whether Ecuador can commit to mining reform and development without a backlash from its residents, it has happened in the past.
Mining is cyclical and investors need to make hay while the sun shines. Timing is everything and it appears senior Canadian mining companies are missing out on a period of economic optimism in the Ecuadorian mining industry after bearing the brunt of an unreceptive local climate in the past. Ecuador has made significant reforms and be sure there will be a lot of exploration news coming out of this region.

Too many technical analysts dismiss fundamentals. True, technicals usually lead fundamentals but understanding the fundamental drivers (when it comes to Gold) can give you an edge. Gold and gold stocks have remained below their 2016 peaks even in the face of a very weak US Dollar because the fundamentals are not there. Real rates have been stable in 2017 while the yield curve has been flattening. Until things change, Gold and gold stocks have little chance to breakout.
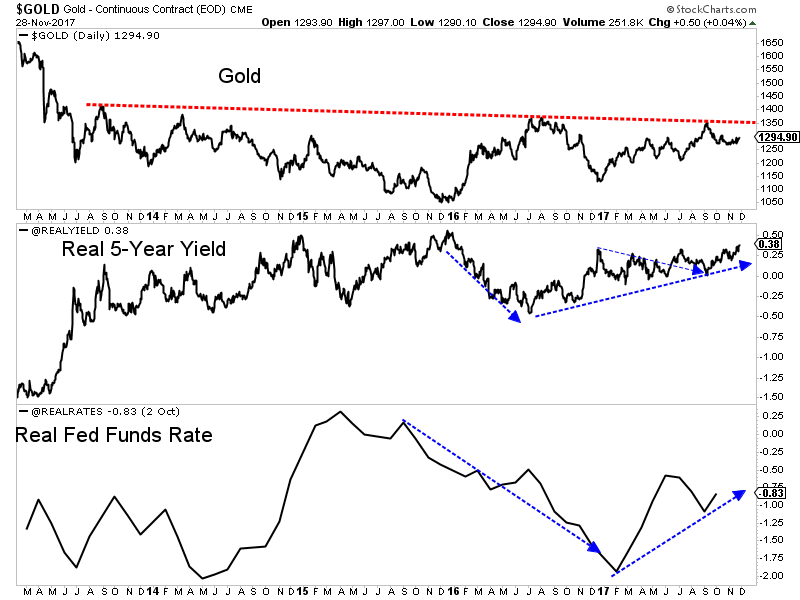
If you follow my work you know that there is a strong inverse correlation between the Gold price and real interest rates. Gold performs best when real rates are declining and especially when real rates decline while in negative territory. Real rates declined sharply into and during 2016 but have been rising or stable this year. The current problem for Gold is nominal yields have trended higher and faster than the rate of inflation.
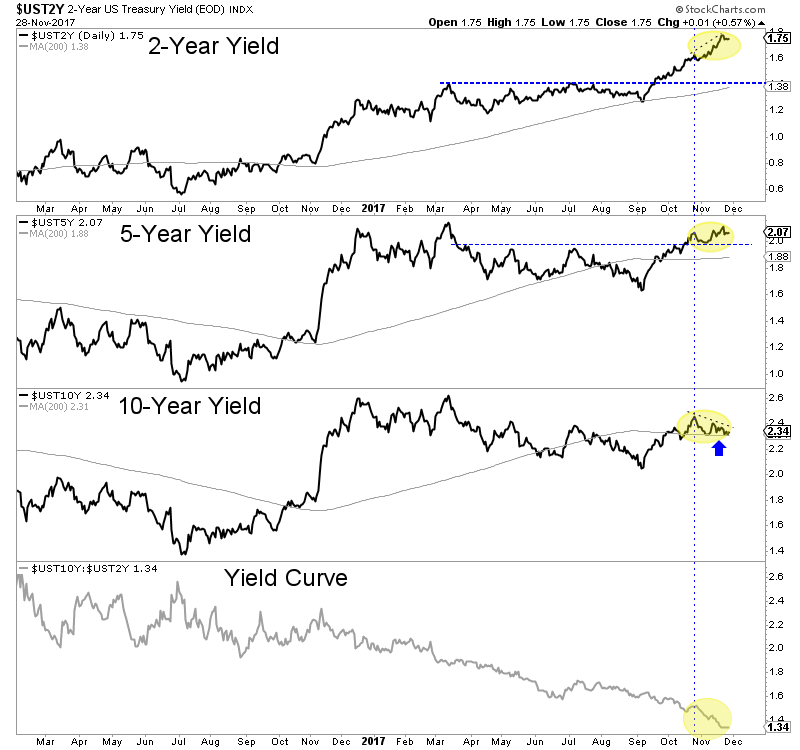
In the chart below we plot Gold, the real 5-year yield (as calculated from the TIPS market) and the real Fed Funds Rate (rFFR). The US Treasury provides daily data of the real 5-year yield and we can see that it has trended higher since summer 2016 and is currently at its highest levels since Q1 2016. It has advanced nearly half a percent since its low a few months ago. Meanwhile, the rFFR has increased by more than 1% this year. That was after falling by nearly 2%.
As we discussed weeks ago, a steepening yield curve (caused by falling short-term rates or rising long-term rates) is bullish for Gold. Some gold bugs are excited about a flattening yield curve as it could lead to inversion. While this may be true, a flattening curve is not bullish for Gold. Below we see that the yield curve continues to plunge (flatten) as the 2-year yield has surged and the 10-year is at the same level as two months ago. A bullish development for Gold would be the 5-year and 10-year yields exploding above their March 2017 highs while the 2-year yield arrests its torrid rise.
Gold and gold stocks are going to continue to struggle until the fundamentals align bullishly. Market action will of course lead fundamental changes but knowing the drivers to look for can help us anticipate the fundamental changes in advance. We think rising inflation is more likely than falling short-term rates to be the driver for Gold in 2018. In that case, we would anticipate hard assets to perform better, long-term rates to rise faster than short-term rates and inflation to outpace short-term rates. These things would sustain Gold beyond just a few months. In the meantime, the key for traders and investors is to find the companies with strong fundamentals and seek oversold situations with value and catalysts that will drive buying. To follow our guidance and learn our favorite juniors for 2018, consider learning more about our premium service.
Jordan Roy-Byrne CMT, MFTA

- The big picture for gold continues to strengthen. Please click here now. Double-click to enlarge.
- In 2016, gold began the year at about $1100, soared $300 an ounce to about $1400, but then it gave back about $250, and ended the year at about $1150 with only a $50 gain.
- That price action fit perfectly with my 2014 – 2017 theme of “rough sideways action, initially with a downside bias that develops into an upside bias”.
- The year 2018 should see solid Chindian demand, a reversal in US money velocity, and a peak in mine supply. That should push gold up from the enormous sideways trading pattern and into a substantial uptrend.
- Please click here now. Double-click to enlarge this key weekly gold chart.
- Note the fabulous increase in volume since 2016. This is very positive.
- One of my most important market mantras is that fundamentals make charts. I postulated the “gold will trade sideways with a slight downside bias” thesis in 2014 because I saw gold price discovery transitioning (slowly) away from the fear trade of the West and towards the love trade of the East.
- The imposition of the vile 10% import duty in India put millions of jewellery workers on the unemployment line and it caused a huge restructuring of the jewellery industry.
- The way it was playing out fundamentally suggested that an enormous inverse head & shoulders pattern would be created as that restructuring progressed.
- The transition in America from deflation to inflation and the peak in mine supply are supporting fundamental factors for the way the inverse head and shoulders pattern has been built.
- The bottom line is that in the right shouldering area of a massive inverse head and shoulders bottom pattern, investors should expect the price to trade sideways with an upside bias, and as the pattern nears completion, that upside bias will intensify.
- That’s exactly what is happening now. Gold is poised to end 2017 giving back very little of what it gained.
- Please click here now. Double-click to enlarge. The dollar’s action against the yen is a key indicator of the amount of risk that institutional investors are likely to take.
- On that note, the dollar has been very weak recently against the yen, breaking down from a bear wedge formation and forming a potential head & shoulders top. A potential weak right shoulder has yet to even materialize.
- Why is the dollar so weak? For the possible answer, please click here now. The US stock market has no more QE and falling interest rates to power it higher in the face of rather anemic real economy growth.
- Institutional investors are betting on tax cuts to keep the stock market party going, but it’s possible that major bank FOREX traders are selling the dollar in anticipation of a delay in getting the cuts done.
- I’m very disappointed with Corker’s plan to raise revenues (taxes) if tax cuts don’t generate growth. A chainsaw needs to be taken to US government spending, but it’s not happening. The US stock market could take a major hit if the tax cuts legislation fails.
- That could cause institutions to buy a lot more gold and assets like it. On that note, please click here now. Double-click to enlarge this spectacular bitcoin chart.
- Effective immediately, I’m raising my long term bitcoin target from $500,000 to $2million. I’ll go over the fundamentals and mathematics of that target upgrade in my nextwww.gublockchain.com update, but I’ll note that the reasoning is quite mundane.
- Still, I advised my subscribers to book some solid partial profits in the current $10,000 round number area early this morning. My accountant tells me that nobody gets poorer by booking a profit, and I agree!
- Do I think bitcoin has inherently more risk or less risk than the US dollar? That’s hard to quantify, but great profits can be booked now, and that’s really all that matters.
- Please click here now. Double-click to enlarge this nice GDX chart.
- There’s no question that some of the risky junior miners have had a very disappointing year, but most of the seniors are starting to look quite “perky”.
- GDX sports a beautiful bull wedge pattern, and the next US jobs report is scheduled for Friday, December 8. That report should be the catalyst for a great gold stocks rally. It should also start gold on its final advance towards the key $1400 neckline area of the massive inverse H&S bottom pattern, with an upside breakout occurring in 2018!
Thanks and Cheers!
Stewart Thomson, Graceland Updates
https://www.gracelandupdates.com
Email:
Risks, Disclaimers, Legal
Stewart Thomson is no longer an investment advisor. The information provided by Stewart and Graceland Updates is for general information purposes only. Before taking any action on any investment, it is imperative that you consult with multiple properly licensed, experienced and qualified investment advisors and get numerous opinions before taking any action. Your minimum risk on any investment in the world is: 100% loss of all your money. You may be taking or preparing to take leveraged positions in investments and not know it, exposing yourself to unlimited risks. This is highly concerning if you are an investor in any derivatives products. There is an approx $700 trillion OTC Derivatives Iceberg with a tiny portion written off officially. The bottom line:
Are You Prepared?
With the recent close of the sale of the company’s Crucero property to GoldMining (TSX-V: GOLD), Lupaka Gold Corp. (TSX-V: LPK) has secured the funds to take the next step with its Invicta Gold project. Today, the company announced the commissioning of a Preliminary Economic Assessment “PEA” for the Invicta Gold Project.
With the backing of Pandion Finance and its gold purchase agreement providing the necessary funding, Lupaka is motivated to meet its obligations which makes now an exciting time for the company and its shareholders.
The company has hired SRK to prepare the PEA. This provides a continuity of project knowledge as the project’s 2012 resources estimate was prepared by SRK and the company’s own internal mining studies of Invicta were prepared with assistance from SVS Ingenieros of Lima “SVS”, Peru, a subsidiary of the SRK Consulting Group. The company plans the completion of the PEA technical report in the first quarter of 2018.
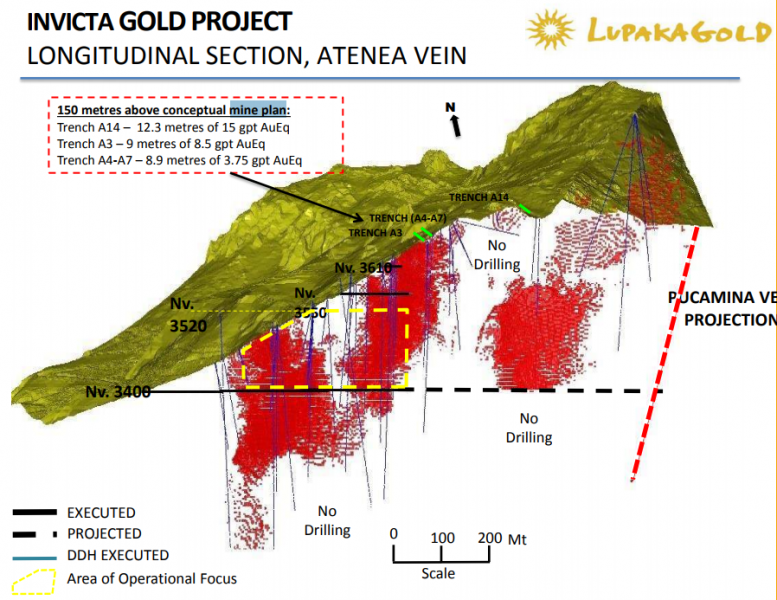
The initial six-year mine plan that was developed and prepared by SVS, which outlined ~735,000 tonnes at a grade of ~6.1 g/t AuEq. for 23,000 oz. of gold equivalent a year, according to a rough calculation. The plan was developed from the 3,400-metre level and extends up 120 metres.
Drill results indicated that the mineralization extends at least as far below the 3,400 level as it does above. In addition, there is a well-defined section of measured and indicated directly along strike to the northeast that is within a few hundred metres, and of the same characteristics as the segment in the mine plan.
The first bulk sample in October 2015 produced a copper, lead and zinc concentrate that was sold to an off-taker. The concentrate was exceptionally clean and was absent of any penalty elements, so buyers could pay well for it because they can mix it with less clean concentrate and blend it.
The company completed its second run-of-mine bulk test in February 2016 and achieved good recoveries in concentrate streams — returning 87.5% gold, 91.2% silver, 91.5% copper, 90.03% lead and 90.1% zinc. The sample was a blend of approximately 80 % run-of-mine material and 20 % from a low grade stockpile derived from development.
The bulk sample was processed with the prime objective of producing a saleable concentrate and no effort was made to optimize content of specific metals, according to the company. The resulting concentrate was clean, with few penalty elements which is ideal for sale and blending with other concentrates.
Once in production, the hope is that cash flow from Invicta will be used to grow the operation. There are numerous zones outside of the Atenea vein that contain mineralization, and the targeted Atenea resource could increase, as development offers access to high-grade intercepts and underground drill sites. In addition, based on gold and copper within the under-explored quartz-sulphide vein zones, the company believes the Invicta resource could expand.
At 350 tonnes per day, Invicta could operate for between 10 and 15 years based on the current measured and indicated resource in the Atenea zone. However, the project is permitted to operate at 1,000 tonnes per day and the company would like to increase their resources through drilling, expand operations to the 1,000 tpd rate and build their own mill on site but for the time being will use third party transport and processing contractors. All of this could take production to over 70,000 AuEq. oz/yr, according to a cocktail napkin calculation.
Proceeds from Invicta will also be used for more exploration at its other projects in Peru — Josnitaro which is a whole other story, worthy of an update of its own.
***MiningFeeds was compensated to provide marketing services. As always, do your own diligence. The writer of this article, Nicholas LePan does own shares.
The following interview of Stephen Dunn, President & CEO of Crown Mining Corp. (TSX-v: CWM) was conducted by phone & email over about a 10-day period ended November 21st. Crown Mining has a NI 43-101 compliant mineral resource estimate of 2.1 billion Indicated & Inferred pounds Copper (“Cu“). In about 4 months, management plans to deliver a Preliminary Economic Assessment (“PEA“) on a portion of its 2.1-billion-pound resource.
Steve, please give readers an overview of Crown Mining.
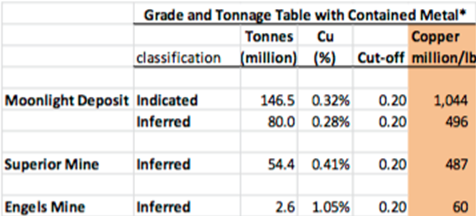
Crown Mining Corp. (TSX-v: CWM) is focused on advancing its 100% controlled Moonlight-Superior Copper project in Plumas County, which is in northeastern California. Moonlight-Superior has a NI-43-101 resource of 2.1 billion pounds Cu, 750,000 ounces Gold and 25,000,000 ounces Silver. At today’s spot prices, the gold & silver ounces equate to more than 400,000,000 pounds Cu Eq. Our property hosts 4 known Cu deposits.
The Moonlight deposit alone hosts a NI 43-101 Indicated mineral resource of ~161 M short tons at an average grade of 0.324%, equal to ~1 billion pounds Cu, and an Inferred mineral resource of ~88 M tons at an average grade of 0.282%, equal to ~ 500 M pounds Cu. So, combined, the Moonlight deposit hosts 1.54 billion pounds Cu [Indicated (68%) & Inferred (32%)].
Two other deposits, Superior & Engels, have a combined NI 43-101 Inferred mineral resource of ~63 short tons at an average grade of ~0.44%, equal to ~ 550 M pounds Cu.
Crown recently had third-party metallurgical testing done and is awaiting final results. Findings will be used in a PEA report that will be started soon and is expected to be finished by the end of March, 2018.
And, how about a brief summary of the history of your controlled property.
Copper was discovered in the 1880’s and the most prolific mining period took place from 1915 to 1930. During that time, 4.7 million short tons of ore were extracted, yielding 161,500,000 pounds Cu, (Cu grade 2.2%), 1,900,000 ounces Silver, and 23,000 ounces Gold. Recoveries were reportedly around 80%.
From 1962 to 1994, Placer AMEX drilled over 400 holes and calculated a (non NI 43-101 compliant) 4-billion-pound Cu resource. We have a lot of the Placer data. Even though our team is not relying on that 4-billion-pound figure, we think it speaks to significant exploration potential.
From 2004 to 2011, various juniors drilled 54 holes and conducted airborne geophysics, which supported a 2007 technical report containing a mineral resource estimate. That report remains NI 43-101 compliant today.
From 2013-2017 we acquired 132 unpatented claims and a lease for the 36 patents covering the Superior and Engels mines. In 2013 we published a third-party NI 43-101 compliant mineral resource report at Superior of about 500 M pounds Cu. In March 2016, we option 300 claims covering the Moonlight deposit and started a scoping study and metallurgical tests this year.
Is Crown Mining’s 2.1 billion pounds of Indicated & Inferred Copper (“Cu“) resource NI 43-101 compliant?
Yes, it is. That 2 billion + pound figure comes from two reports, one from 2013 and one from 2007, but both are NI 43-101 compliant. The reports cover 3 deposits, (Moonlight, Superior & Engels) but they are part of the same system, about 1.5 miles across as the crow flies. There are 4 known deposits in an area of about 7 sq. miles (18 sq. kms) in northeast California.
We hope to find one or more new deposits before it’s all said and done.
We already know we’re sitting on a large, bulk-scale, open-pittible Cu resource that will likely have meaningful Silver credits. We plan to publish a PEA in the first quarter of 2018 that will provide indicative answers to many important questions.
How much capital will you need to raise to deliver a PEA next year?
We run a tight ship, our cash burn is quite manageable. The avoidance of undue equity dilution is very important to us, that’s why we capped our recent capital raise at C$ 200k. [NOTE: Crown Mining has just 34 M shares outstanding]. That, along with cash on hand, will cover us through March or April. So, we don’t need to raise capital anytime soon. If all goes well, our share price will be meaningfully higher next spring after we release the PEA.
I believe we are in the early stages of a multi-year bull market in Copper that will be a tailwind for us next year. Analysts and pundits seem to indicate that a sustained Cu price above US3.50/lb., is an important milestone; a price at which producers are willing to put money to work through investments in new projects and pursue outright acquisitions of juniors like Crown Mining.
In fact, just a few days ago, Copper Mountain Mining (TSX: CMMC) announced a takeover of Australian-listed Altona Mining Ltd. at a headline valuation of ~ C$0.024 per pound of Cu resource. That valuation is 10x that of ours. {See chart below}. To be fair, Altona is well more advanced than we are, which accounts for some of the premium.

Large-scale, near-surface mineralization, in a safe jurisdiction, with good access to infrastructure is great, but poor metallurgy could end the story. What do you know about the project’s metallurgy?
That’s a good question. We are very much aware of the critical importance of what are recoveries might look like, and how much processing the ore will cost. Historical mining activity from 1915 to 1930 had recoveries around 80%. Placer Amex did various studies in the 1960’s that pointed to recoveries closer to 85%.
Earlier this year we commissioned a round of metallurgical testing by a well-respected third-party. We are awaiting the final detailed results, but I’m happy to report that, generally speaking, recoveries were approximately 85%, similar to the findings of Placer Amex.
Although the U.S. is obviously a safe jurisdiction with many mining friendly attributes, some readers will be concerned about “California permitting risk.” Are investor concerns warranted?
You’re right, we do get asked a lot about permitting risks in California. We believe that that once the permitting process starts, probably not before the 2nd half of 2018 at the earliest, we could be facing a timeline of roughly 3 years.
Most investors don’t understand the permitting process in California. The way in which it proceeds can actually work in favor of a company. The County is the lead agency to collaborate with in presenting proposed projects at the State level. Moonlight-Superior is in a remote, low population density, mining-friendly County near the Nevada State line.
We’ve spoken with a number of people in the area and have received positive feedback, but our main focus is really on delivering a PEA and then attracting a strategic partner.
We covered these topics, but to reiterate, what are the near-term catalysts for Crown Mining over the next 3-6 months?
Near-term catalysts include the release of a PEA around the end of March next year. Before then, we will be putting out a press release that details the results of third-party metallurgical testing done earlier this year. Finally, we expect to be in the position next month to announce a prominent new addition to our team.
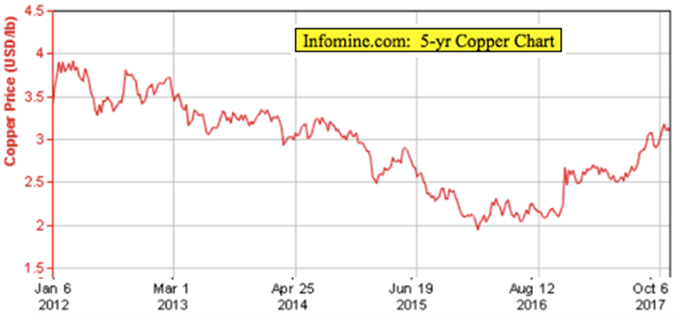
Underlying all of this is a strong Cu price, up about 50% from the summer of 2016’s prices near US$2/lb., and down about 4% from a high of US$3.24/lb. a month ago.
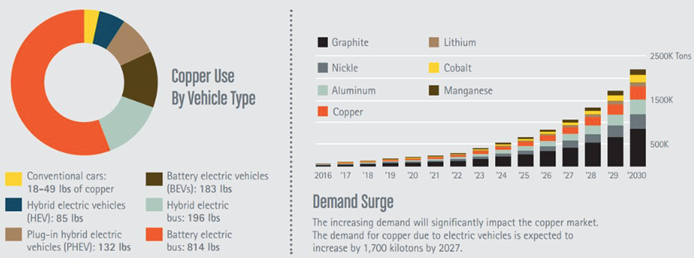
As the chart above clearly shows, Cu demand is very likely to be much stronger than anyone expected even just a year ago. The electrification of the global transportation fleet, grid-scale energy storage and the ongoing transition to renewable energy sources, especially wind power, are Cu intensive.
Yet, global supply constraints — (decades of declining ore grades at existing mines, fewer large Cu discoveries and ever growing geopolitical risks) — suggest that prices need to move higher, possibly a lot higher, to entice companies to invest large sums of capital on big projects.
We think 2018 will be an exciting year for juniors like Crown Mining Corp. (TSX-V: CWM) as more and more investors realize how incredibly important Cu is, and will be, to the world economy over the next few decades.
Thank you Stephen, I think we covered a lot of ground here. Good luck with the PEA!
Disclosures: The content of this interview is for illustrative and informational purposes only. Readers fully understand and agree that nothing contained herein, written by Peter Epstein of Epstein Research, [ER] including but not limited to, commentary, opinions, views, assumptions, reported facts, estimates, calculations, etc. is to be considered implicit or explicit, investment advice. Further, nothing contained herein is a recommendation or solicitation to buy or sell any security. Mr. Epstein and [ER] are not responsible for investment actions taken by the reader. Mr. Epstein and [ER] have never been, and are not currently, a registered or licensed financial advisor or broker/dealer, investment advisor, stockbroker, trader, money manager, compliance or legal officer, and they do not perform market making activities. Mr. Epstein and [ER] are not directly employed by any company, group, organization, party or person. Shares of Crown Mining are highly speculative, not suitable for all investors. Readers understand and agree that investments in small cap stocks can result in a 100% loss of invested funds. It is assumed and agreed upon by readers that they consult with their own licensed or registered financial advisors before making investment decisions.
At the time this article was posted, Peter Epstein owned shares in Crown Mining and the Company was an advertiser on [ER]. By virtue of ownership of the Company’s shares and it being an advertiser on [ER], Peter Epstein is biased in his views on the Company. Readers understand and agree that they must conduct their own research, above and beyond reading this article. While the author believes he’s diligent in screening out companies that are unattractive investment opportunities, he cannot guarantee that his efforts will (or have been) successful. Mr. Epstein & [ER] are not responsible for any perceived, or actual, errors including, but not limited to, commentary, opinions, views, assumptions, reported facts & financial calculations, or for the completeness of this article. Mr. Epstein & [ER] are not expected or required to subsequently follow or cover events & news, or write about any particular company or topic. Mr. Epstein and [ER] are not experts in any company, industry sector or investment topic.
![]()
On Oct. 25, NewCastle (TSX-V: NCA), Trek Mining (TSX-V: TREK), and Anfield Gold (TSX-V: ANF) announced a three-way business combination to form Equinox Gold (TSX-V: EQX). The new company will be led by mining entrepreneur Ross Beaty as Chairman (who is investing US$20 million), Christian Milau as CEO, and Greg Smith as President (both from Trek). This will immediately create a well funded mid-tier gold company on the path to production with plenty of potential for investors.
A note from TD Securities’ Analyst Daniel Earle, outlined the value this deal will create. TD Securities views this transaction positively as the merger will create a company that is more than the sum of its parts.
“In essence, we have what we view to be two unfunded and poorly understood development stories merging with a cash shell to create a higher profile company, both in terms of its leadership and market size, with a fully funded path to eventual mid-tier production.“
The combined company is expected to have $98 million in cash less costs at closing, excluding any asset sales, plus a US$85-million credit facility with Sprott and a US$200-million development facility. TD has a $2.00 12-month target price which is based on 0.9x its pro forma Equinox corporate NAV5% of $2.25/share.
If investors were looking to benefit early from the merger of the three companies, TD notes that NewCastle is currently trading at 0.32x their corporate NAV of 5% as of Nov. 1 which represents a significant discount to its peer group of gold development-stage companies in TD’s precious metals coverage, which are trading at an average of 0.49x NAV5%.
The new company’s main two assets will be the 100-per-cent owned Aurizona Mine in the Brazilian State of Maranhao and the Castle Mountain Project in California. However, there are plenty of projects that could generate other sources of value.
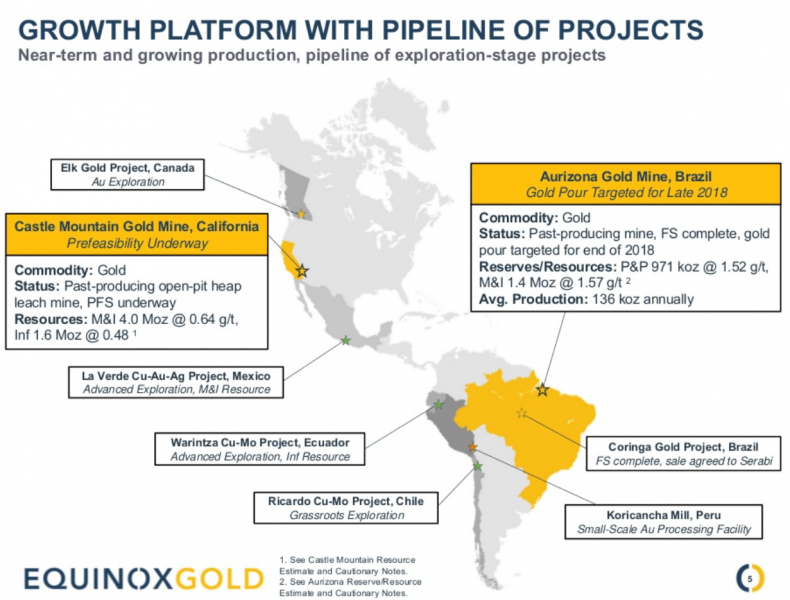
The Aurizona Mine is a past producer from 2010 to 2015 under Luna Gold, which failed under the heavy burden of a 17-per-cent gold stream and debt facility owed to Sandstorm Gold. The stream was restructured in March 2015 to a sliding-scale royalty of three to five per cent (3% at <US$1,500/oz Au). The mine has 971 koz @ 1.52 gpt in reserves and 1.4 Moz @ 1.57 gpt (Measured & Indicated Resources, inclusive). Annual production of 136 koz at US$691/oz (AISC: US$754/oz) over a 6.5-year mine life. First gold coming out of the mine is expected in the first quarter of 2018.
The Castle Mountain project is a past producer from open pit/heap leach and a small mill from 1991–2002. An updated resource estimate is due in September following a 44 km infill drill program, with a Pre-Feasibility study expected in Q1/18. The property has a resource of 4.0 Moz @ 0.64 gpt (Measured & Indicated Resources). There is plenty of potential for further exploration and resource expansion at Castle Mountain, if permitting proceeds smoothly.
The company also has prospective claims and spin out possibilities in Ecuador, British Columbia, Mexico, Chile and Peru. The company has generated more cash from the sale of assets from Anfield raising $22 million from the sale of the Coringa Gold project and the spin-out of copper assets in Mexico (La Verde — 746 Mt @ 0.4% CuEq M&I+I), Ecuador (Warintza — 195 Mt @ 0.6% Inf.) and Chile (Ricardo — concept/exploration) in 2018.
The transaction, if approved by the shareholders of Newcastle and Anfield, is expected to close on or about Dec. 22, 2017, just in time for Christmas, a possible gift for weary gold investors.

Eight Colombian municipalities banned mining in their jurisdictions after local referendums won a majority vote in support of banning mining.
A series of municipalities across Colombia this year have demonstrated an overwhelming support for curtailing mining activities within their regions; a serious concern for investors and resource companies after the government of Colombia has been encouraging development to further build the peace with FARC.
An important sector that will benefit from the peace will be the extraction industries, especially the gold mining industry. During the years of conflict, the gold industry was plagued by internal criminal activity with unlicensed illegal mines bringing in approximately $7bn per year for armed groups and other criminal factions. The illegal mining also damaged the environment through polluting the water with substantial amounts of mercury used to separate gold from other minerals.
In an effort to clamp on down the violence and environmental damage of illegal mining, the government of Colombia has been encouraging foreign investment into the mineral industry while encouraging local governance in an effort to build the peace. FARC agreed to disarm but they have moved from the battlefield to politics, and with them come a very strong anti-development stance against foreign resource companies. Not all opposition to development is politically motivated but it also a part and parcel of changes to the mining code and as communities are experiencing control over projects for the first time.
The first vote of this year, held in February, took place in Cabrera with seven other municipalities followed to ban mining in their territory, according to Colombia Reports. Residents of Colombian municipalities have expressed a growing concern over the environmental impacts of mining on their towns––while some that farm for their livelihood are worried of how this may also impact crops nearby mining locations.
Colombia’s mining code had prohibited local authorities from suspending projects in their region, according to Bloomberg. A ruling enforced by Colombia’s Constitutional Court last year made these votes possible, as the ruling overturned the Colombian government’s exclusive authority to authorize mining projects. Now local politicians or residents that have obtained a certain number of signatures can call a referendum, reported Bloomberg. A mine or oil field that was already licensed to produced would not be impacted by the vote.
Residents of Cajamarca, located in the municipality of Tolima made headlines in March. The vote to man mining froze the current La Colosa project, controlled by AngloGold Ashanti, a gold mining company from South Africa. AngloGold Ashanti has invested $900 million towards mining projects in Colombia within the past decade, according to Reuters.
If the La Colosa project were to be completed, it would be one of the world’s largest open-pit gold mines. However, locals worry the mining in Tolima will negatively impact their water sources and pollute their environment, according to the BBC. The vote in Tolima, held on March 26, displayed overwhelming opposition against mining with 98.8 per cent against the project.
Just a few months later, in June 2017, a majority of locals in the Cumaral municipality voted in the first oil ban referendum passed in the country, which bans crude exploration, drilling and production, according to TeleSur.
Tauramena was the first municipality to enforce the ban, when a majority favoured to exile oil exploration in the country in December 2013, motivated by the population’s concern over the threat to water sources this practice may generate. The municipality located in Casanare, the central east region of Colombia, won the vote by 4,426 in favour of the ban out of 4,610 citizens that participated in the vote, according to El Espectador, a Columbian newspaper.
The municipality Cabrera, was the first to ban mining this year, as they voted in February, winning with 97 per cent in favour, according to El Espectador. The official question voters answered was, “Do you agree, yes or no, that mining projects and/or hydroelectric projects that transform or affect the use of land, water or agricultural vocation should be implemented in the municipality of Cabrera, Cundinamarca, as a Peasant Reserve Zone Township?” Only 23 voters approved this, according to the same source.
EMGESA, the Colombian electric power company that wants to impose mining and hydroelectric projects recently before the vote, the company restructured plans not to affect the municipality. However, a majority of voters in Cabrera wanted to protect the territory, as Cabrera has been recognized as a peasant reserve zone since 2000.
In response, the community of Cabrera has been working on a Sustainable Development Plan that does not consist of mining or hydroelectric plants. Paola Bolaños, a member of the Committee to Promote the Peasant Reserve Zone, said this project will ensure that the agricultural vocation is respected, reported by El Espectador.
Thus, a new era of peace is crucial for the government to take control of illegal mines in order to allow the economy to prosper while protecting the environment through greater provisions of the sector. Fundamentally, despite the peace plan costing $44bn over a 10-year period, it can be viewed as an investment into the stability of Colombia’s long-term peace prospects by ensuring effective governance.
Some resistance to mining is inevitable in a democracy especially in the nascent form of local governance permitted under the peace process. A further estimated 50 other municipalities will hold a referendum considering banning mining or not, within the next coming months, according to Colombia Reports.
This may be a setback for certain mining companies and the attractiveness of the country as mining jurisdiction in the short term. In the long run, if companies and communities can learn to work together it could improve the appeal of inviting extraction industries into the country. One should prefer the ballot box over a return to armed conflict. Colombians will be better off and so will the extraction industries with peace.
***MiningFeeds would like to make a special note that Savanna Craig contributed heavily to the writing and research of this article
The silver miners’ stocks have really languished this year, grinding sideways to lower for months on end. This vexing consolidation has fueled near-universal bearishness, leaving silver stocks deeply out of favor. But once a quarter when earnings season arrives, hard fundamentals pierce the obscuring veil of popular sentiment. The silver miners’ recently-reported Q3’17 results reveal today’s silver prices remain profitable.
Four times a year publicly-traded companies release treasure troves of valuable information in the form of quarterly reports. These are generally due by 45 days after quarter-ends in the US and Canada. They offer true and clear snapshots of what’s really going on operationally, shattering the misconceptions bred by the ever-shifting winds of sentiment. There’s no silver-miner data that is more highly anticipated than quarterlies.
Silver mining is a tough business both geologically and economically. Primary silver deposits, those with enough silver to generate over half their revenues when mined, are quite rare. Most of the world’s silver ore formed alongside base metals or gold, and their value usually well outweighs silver’s. So typically in any given year, less than a third of the global mined silver supply actually comes from primary silver mines!
The world authority on silver supply-and-demand fundamentals is the Silver Institute. Back in mid-May it released its latest annual World Silver Survey, which covered 2016. Last year only 30% of silver mined came from primary silver mines, a slight increase. The remaining 70% of silver produced was simply a byproduct. 35% of the total mined supply came from lead/zinc mines, 23% from copper, and 12% from gold.
As scarce as silver-heavy deposits supporting primary silver mines are, primary silver miners are even rarer. Since silver is so much less valuable than gold, most silver miners need multiple mines in order to generate sufficient cash flows. These often include non-primary-silver ones, usually gold. More and more traditional elite silver miners are aggressively bolstering their gold production, often at silver’s expense.
So the universe of major silver miners is pretty small, and their purity is shrinking. The definitive list of these companies to analyze comes from the most-popular silver-stock investment vehicle, the SIL Global X Silver Miners ETF. This week its net assets are running 6.6x greater than its next-largest competitor’s, so SIL really dominates this space. With ETF investing now the norm, SIL is a boon for its component miners.
While there aren’t many silver miners to pick from, major-ETF inclusion shows silver stocks have been vetted by elite analysts. Due to fund flows into top sector ETFs, being included in SIL is one of the important considerations for picking great silver stocks. When the vast pools of fund capital seek silver-stock exposure, their SIL inflows force it to buy shares in its underlying companies bidding their prices higher.
Back in mid-November as the major silver miners finished reporting their Q3’17 results, SIL included 29 “silver miners”. This term is used loosely, as SIL holds plenty of companies which can’t be described as primary silver miners. Most generate well under half their revenues from silver, which greatly limits their stock prices’ leverage to silver rallies. Nevertheless, SIL is today’s leading silver-stock ETF and benchmark.
The higher the percentage of sales any miner derives from silver, naturally the greater its exposure to silver-price moves. If a company only earns 20%, 30%, or even 40% of its revenues from silver, it’s not a primary silver miner and its stock price won’t be very responsive to silver itself. But as silver miners are increasingly actively diversifying into gold, there aren’t enough big primary silver miners left to build an ETF alone.
Every quarter I dig into the latest results from the major silver miners of SIL to get a better understanding of how they and this industry are faring fundamentally. I feed a bunch of data into a big spreadsheet, some of which made it into the table below. It includes key data for the top 17 SIL component companies, an arbitrary number that fits in this table. That’s a commanding sample at 92.7% of SIL’s total weighting.
While most of these top 17 SIL components had reported on Q3’17 by mid-November, not all had. Some of these major silver miners trade in the UK or Mexico, where financial results are only required in half-year increments. If a field is left blank in this table, it means that data wasn’t available by the end of Q3’s earnings season. Some of SIL’s components also report in gold-centric terms, excluding silver-specific data.
In this table the first couple columns show each SIL component’s symbol and weighting within this ETF as of mid-November. While most of these silver stocks trade in the States, not all of them do. So if you can’t find one of these symbols, it’s a listing from a company’s primary foreign stock exchange. That’s followed by each company’s Q3’17 silver production in ounces, along with its absolute year-over-year change.
After that comes this same quarter’s gold production. Pretty much every major silver miner in SIL also produces significant-if-not-large amounts of gold! While gold stabilizes and augments the silver miners’ cash flows, it also retards their stocks’ sensitivity to silver itself. Naturally investors and speculators buy silver stocks and their ETFs because they want leveraged upside exposure to silver’s price, not gold’s.
So the next column reveals how pure the elite SIL silver miners are. This is mostly calculated by taking a company’s Q3 silver production, multiplying it by Q3’s average silver price, and then dividing that by the company’s total quarterly sales. If miners didn’t report Q3 revenues, I approximated them by adding the silver sales to gold sales based on their quarterly production and these metals’ average third-quarter prices.
Then comes the most-important fundamental data for silver miners, cash costs and all-in sustaining costs per ounce mined. The latter determines their profitability and hence ultimately stock prices. Those are also followed by YoY changes. Finally comes the YoY changes in cash flows generated from operations and GAAP profits. But an exception is necessary for companies with numbers that crossed zero since Q3’16.
Percentage changes aren’t relevant or meaningful if data shifted from negative to positive or vice versa. Plenty of major silver miners suffered net losses in Q3’17 after earning profits in Q3’16. So in cases where data crossed that zero line, I included the raw numbers instead. This whole dataset offers a fantastic high-level fundamental read on how the major silver miners are faring today, and it’s reasonably well.
That’s reassuring given silver’s serious underperformance relative to gold this year. As a far-smaller market, silver usually amplifies gold’s advances by at least 2x. But as of the end of Q3, silver was only up 4.6% YTD compared to 11.3% for gold. That’s horrendous 0.4x leverage! And by mid-November as Q3’s earnings season wrapped up, silver’s YTD gain of 6.6% was still way behind gold’s 11.1% for 0.6x leverage.
Production is the lifeblood of miners, and thus the best place to start fundamental analysis. In Q3’17, these top 17 SIL components collectively produced an impressive 79.0m ounces of silver. If 2016’s world-silver-mining run rate is applied to this year’s third quarter, that implies 221.5m ounces of silver mined. Thus these top SIL silver miners would account for nearly 36% of that total, they truly are major silver players.
Their collective silver production looks robust, surging 3.7% YoY and climbing 0.6% sequentially quarter-on-quarter. Unfortunately that is misleading, with huge growth in a couple mining conglomerates masking sharp-to-catastrophic YoY declines for most of the rest of these elite silver miners. Fresnillo and Industrias Peñoles enjoyed gigantic 24% and 34% YoY gains in silver production off already-massive bases!
Fresnillo and Industrias Peñoles have an incestuous relationship, as the former used to be wholly owned by the latter. Industrias Peñoles spun off Fresnillo back in May 2008 on the London Stock Exchange. While Fresnillo’s financial reporting is decent, Industrias Peñoles’ is murky. Neither my decades studying financial statements as a Certified Public Accountant nor my rudimentary Spanish can penetrate very deep.
So I haven’t been able to track down how much of Fresnillo that Industrias Peñoles still owns, nor whether the silver production reported by these silver-mining behemoths is actually mutually exclusive. I’m assuming it is for this analysis, but I’m skeptical. Both companies reported their huge YoY growth in silver production was the result of Fresnillo’s new San Julián silver mine coming online, which is a big one.
San Julián produced 3499k ounces of silver in Q3’17 alone, along with fairly-large gold, zinc, and lead byproducts. It’s anticipated to produce 11.6m and 63.7k ounces of silver and gold annually for 12 years. Without San Julián, which could be double-reported between Fresnillo and Industrias Peñoles, the top SIL silver miners’ production would look very different. These elite silver miners have had a challenging year.
Excluding Fresnillo and Industrias Peñoles, the rest of these top SIL components saw their collective silver production fall a sharp 9.3% YoY to 45.9m ounces! It’s been quite ugly out there in silver-land, for both industry-wide and company-specific reasons. Between Q3’16 and Q3’17, the average silver price dropped 13.9% YoY to just $16.84. That was far worse than gold’s 4.2% YoY decline, testing silver’s economics.
With silver prices so weak, sentiment so bearish, and silver-stock prices so darned low, silver miners are both starved of capital for expansions and reluctant to invest heavily in the silver side of their businesses. Mining gold is far more profitable at today’s precious metals’ prices, so they continue to allocate scarce resources to growing their gold production. That certainly isn’t helping the purity of the major silver miners.
A couple long-time favorites of American investors saw silver production plummet over this past year. Tahoe Resources was originally spun off by Goldcorp to develop the incredible high-grade Escobal silver mine in Guatemala. Over the past year that country’s corrupt government shut this mine down after a frivolous and baseless lawsuit by anti-mining activists. They sued the government regulator, not Tahoe itself!
That lawsuit claimed Guatemala’s Ministry of Energy and Mines did not properly consult with the Xinca indigenous people before granting Escobal’s permits! That shouldn’t even be Tahoe’s problem if the government bureaucrats didn’t hold enough meetings, yet Escobal’s mining license was still temporarily suspended. It has since been reinstated, but the government is not breaking up an illegal roadblock to the mine.
This whole situation is ludicrous, highlighting why third-world countries stay that way. The government of Guatemala isn’t respecting the rule of law, which will greatly hurt future investment. It’s allowing violent anti-mine militants to physically attack trucks and their drivers heading to Escobal. They should be arrested and the blockade cleared. Thus Tahoe’s silver production collapsed 100% YoY from 5000k ozs in Q3’16!
SSR Mining saw a similar sharp 62% YoY plummet in silver production to just 1156k ounces in Q3’17. It had nothing to do with geopolitics like Tahoe’s mess, but is simply due to the forecast depletion of its old Pirquitas silver mine. SSR Mining, which used to be called Silver Standard Resources, is exploring in the area trying to extend the life of this mine. But most of its financial resources are being poured into its gold mines.
That gold focus among these top silver miners is common across SIL’s component companies. As the silver-percentage column above shows, most of these elite silver miners are actually primary gold miners by revenue! Only 6 of these 17 earned more than half of their Q3’17 sales from mining silver, and they are highlighted in blue. 8 of SIL’s top 17 component stocks are also included in the leading GDX gold miners’ ETF.
While they only comprised 10.0% of GDX’s total weighting in mid-November, this highlights how difficult it is to find primary silver miners. SIL’s managers have an impossible job these days with the major silver miners increasingly shifting to gold. They are really scraping the bottom of the barrel to find more silver miners. In Q3’17 they added Korea Zinc, making it SIL’s 4th-largest holding at 9.0% of this ETF’s total weighting.
That was intriguing, as I’d never heard of this company after decades of intensely studying and actively trading silver stocks. So I looked into Korea Zinc and found it was merely a smelter, not even a miner. The latest financial data I could find in English was 2015’s. That year Korea Zinc “produced” an incredible 63.3m ounces of silver! But it also smelted large amounts of zinc, lead, copper, and gold that same year.
I ran the numbers for the heck of it, and silver was implied as 32% of Korea Zinc’s 2015 revenues. The fact SIL’s managers included a company like this that doesn’t even mine silver as a top SIL component shows how rare major silver miners have become. The economics of silver mining at today’s prices are inferior to gold mining. Thus the average silver-purity percentage of revenues of these SIL miners is only 40.1%.
That’s right in line with the trend over this past year, with Q3’16, Q4’16, Q1’17, and Q2’17 seeing SIL’s top-component silver purity averaging 42.8%, 40.6%, 38.5%, and 37.6%. Silver mining is as capital-intensive as gold mining, requiring similar large expenses for planning, permitting, and constructing mines and mills. It needs similar heavy excavators and haul trucks to dig and move the silver-bearing ore.
But silver generates much lower cash flows due to its lower price. Consider hypothetical mid-sized silver and gold miners, which might produce 10m and 300k ounces annually. At last quarter’s average metals prices, these silver and gold mines would yield $168m and $384m of yearly sales. It’s far easier to pay the bills mining gold than silver, which is unfortunate. But until silver surges again, that’s the way things are.
While I understand this, as a long-time silver-stock investor it saddens me primary silver miners have apparently become a dying breed. When silver starts powering higher in one of its gigantic uplegs and way outperforms gold again, this industry’s silver-purity percentage will rise. But unless silver not only shoots far ahead but stays there while gold lags, it’s hard to see major-silver-mining purity significantly reversing.
Unfortunately SIL’s mid-November composition was such that there wasn’t a lot of Q3 cost data reported by its top component miners. 4 of its top 5 companies trade in the UK, South Korea, and Mexico, where reporting only comes in half-year increments. Lower down the list there are more half-year reporters, an explorer with no production, and primary gold miners that don’t report silver costs. So silver cost data was scarce.
Nevertheless, it’s always useful to look at the data we have. Industrywide silver-mining costs are one of the most-critical fundamental data points for silver-stock investors. As long as the miners can produce silver for well under prevailing silver prices, they remain fundamentally sound. Cost knowledge helps traders weather this sector’s fear-driven plunges without succumbing to selling low like the rest of the herd.
There are two major ways to measure silver-mining costs, classic cash costs per ounce and the superior all-in sustaining costs. Both are useful metrics. Cash costs are the acid test of silver-miner survivability in lower-silver-price environments, revealing the worst-case silver levels necessary to keep the mines running. All-in sustaining costs show where silver needs to trade to maintain current mining tempos indefinitely.
Cash costs naturally encompass all cash expenses necessary to produce each ounce of silver, including all direct production costs, mine-level administration, smelting, refining, transport, regulatory, royalty, and tax expenses. In Q3’17, these top 17 SIL-component silver miners that reported cash costs averaged $4.86 per ounce. That plunged a whopping 13.6% YoY, making it look like silver miners are far more efficient.
But that too is misleading. This past quarter SIL’s 17th-largest component was Silvercorp Metals, which enjoys big lead and zinc byproducts at its China silver mines. These base metals are sold and used to offset the costs of silver mining. That forced SVM’s cash costs down to negative $5.16 per ounce, which dragged down SIL’s overall average. A year ago in Q3’16, SVM ranked 18th in SIL and missed the top-17 cutoff.
Still even ex-SVM, these top SIL silver miners reporting cash costs last quarter averaged just $6.54 per ounce. As long as silver prices stay above those extreme levels, the silver miners can keep the lights on. And there’s no way silver is going to plummet down under $7 in any conceivable scenario. So even at 2017’s vexingly-low gold-lagging silver prices, the major silver miners face no existential threats today.
Way more important than cash costs are the far-superior all-in sustaining costs. They were introduced by the World Gold Council in June 2013 to give investors a much-better understanding of what it really costs to maintain a silver mine as an ongoing concern. AISC include all direct cash costs, but then add on everything else that is necessary to maintain and replenish operations at current silver-production levels.
These additional expenses include exploration for new silver to mine to replace depleting deposits, mine-development and construction expenses, remediation, and mine reclamation. They also include the corporate-level administration expenses necessary to oversee silver mines. All-in sustaining costs are the most-important silver-mining cost metric by far for investors, revealing silver miners’ true operating profitability.
In Q3’17, these top 17 SIL components reporting AISC averaged just $9.73 per ounce. That was down 3.9% YoY, and far below last quarter’s average silver price of $16.84. Again SVM’s incredible byproduct production dragged down the average though. Ex-Silvercorp, these top SIL silver miners’ AISC ran at an average of $10.98 in Q3. That’s still well below prevailing silver prices, generating nice operating profits.
All-in sustaining costs and production are inversely related. Lower silver production, which many of SIL’s top components suffered last quarter, leaves fewer ounces to spread the big fixed costs of mining across. Thus AISC surged at Pan American Silver, First Majestic Silver, and SSR Mining. PAAS discontinued mining at an older mine, while other mines processed lower-grade ore that was on the way to better rock later.
AG’s lower production was due to land-access issues and mine inspections necessary following Mexico’s big earthquakes in mid-September. And of course SSRM is winding down its lone primary silver mine. Yet even with lower production driving higher per-ounce costs, the major silver miners still enjoyed solid operating profits. That’s certainly not apparent based on silver miners’ super-low stock prices mired in bearishness.
At $9.73 AISC, the major silver miners still earned big profits in the third quarter. Once again silver averaged $16.84, implying fat profit margins of $7.11 per ounce or 42%! Most industries would kill for such margins, yet silver-stock investors are always worried silver prices are too low for miners to thrive. That’s why it’s so important to study fundamentals, because technical price action fuels misleading sentiment!
Today’s silver price remains really low relative to prevailing gold levels, which portends huge upside as it mean reverts higher. The long-term average Silver/Gold Ratio runs around 56, which means it takes 56 ounces of silver to equal the value of one ounce of gold. Silver is really underperforming gold so far in 2017, with the SGR averaging just 73.5 YTD as of mid-November. So silver is overdue to catch up with gold.
At a 56 SGR and $1300 gold, silver is easily heading near $23.25. That’s 38% above its Q3 average. Assuming the major silver miners’ all-in sustaining costs hold, that implies profits per ounce soaring 90% higher! Plug in a higher gold price or the usual mean-reversion overshoot after an SGR extreme, and the silver-mining profits upside is far greater. Silver miners’ inherent profits leverage to rising silver is incredible.
While all-in sustaining costs are the single-most-important fundamental measure that investors need to keep an eye on, other metrics offer peripheral reads on the major silver miners’ fundamental health. The more important ones include cash flows generated from operations, actual accounting profits, revenues, and cash on hand. They generally corroborated AISC in Q3’17, proving silver miners are weathering low prices.
The collective operating cash flows of these top 17 SIL silver miners slumped 14.4% YoY to $1350m. That’s really impressive considering the 13.9% YoY drop in average silver prices, so these miners are holding their own despite silver really lagging gold this year. GAAP accounting profits looked far worse though, plunging 77% to just $88m. Many of these top SIL silver miners suffered net losses in Q3’17.
That was generally just the result of lower silver prices. There were two outliers, Tahoe Resources and Coeur Mining. With its silver mine temporarily shuttered by Guatemala, TAHO’s profits swung massively from +$63m in Q3’16 to -$8m in Q3’17. That $71m drop alone was responsible for 24% of the YoY drop in these top SIL silver miners’ GAAP profits. CDE simply had higher costs as it worked on expanding mines.
So its profits plunged from +$68m in Q3’16 to -$17m in Q3’17, for an $85m total drop. That accounted for another 29% of the total slide in collective top SIL miners’ profits. Other than that, the YoY declines were reasonable based on the lower silver prices. Interestingly these top 17 SIL miners’ collective sales surged 15.2% YoY to $3003m, driven by their aggregate silver and gold production rising 3.7% and 2.4% YoY.
And despite the weak silver prices, serious operational challenges, and ongoing expansions especially on the gold side of their businesses, these elite SIL miners’ total cash balances only edged 0.1% lower YOY to $2682m. So overall the silver miners’ operating results were pretty good in Q3’17 considering all the big trials they faced. Based on the individual miners’ travails, I was steeling myself for much worse.
Silver miners’ earnings power and thus stock-price upside potential will only grow as silver mean reverts higher. In mining, costs are largely fixed during the mine-planning stages. That’s when engineers decide which ore bodies to mine, how to dig to them, and how to process that ore. Quarter after quarter, the same numbers of employees, haul trucks, excavators, and mills are generally used regardless of silver prices.
So as silver powers higher in coming quarters, silver-mining profits will really leverage its advance. And that will fundamentally support far-higher silver-stock prices. The investors who will make out like bandits on this are the early contrarians willing to buy in low, before everyone else realizes what is coming. By the time silver surges higher with gold so silver stocks regain favor again, the big gains will have already been won.
While investors and speculators alike can certainly play the silver miners’ ongoing mean-reversion bull with this leading SIL ETF, individual silver stocks with superior fundamentals will enjoy the best gains by far. Their upside will trounce the ETFs, which are burdened by companies that don’t generate enough of their sales from silver. A handpicked portfolio of purer elite silver miners will yield much-greater wealth creation.
At Zeal we’ve literally spent tens of thousands of hours researching individual silver stocks and markets, so we can better decide what to trade and when. As of the end of Q3, this has resulted in 967 stock trades recommended in real-time to our newsletter subscribers since 2001. Fighting the crowd to buy low and sell high is very profitable, as all these trades averaged stellar annualized realized gains of +19.9%!
The key to this success is staying informed and being contrarian. That means buying low when others are scared, like late in this year’s vexing consolidation. An easy way to keep abreast is through our acclaimed weekly and monthly newsletters. They draw on my vast experience, knowledge, wisdom, and ongoing research to explain what’s going on in the markets, why, and how to trade them with specific stocks. Easy to read and affordable, they’ll help you learn to think, trade, and thrive like contrarians. Subscribe today and get 20% off in our Black Friday Sale!
The bottom line is the major silver miners fared fine in Q3 despite some real challenges. A combination of silver continuing to seriously lag gold, along with anomalous company-specific problems, weighed on miners’ collective results. Yet they continued to produce silver at all-in sustaining costs way below Q3’s low prevailing silver prices. And their accelerating gold-production growth leaves them financially stronger.
With silver-stock sentiment remaining excessively bearish, this sector is primed to soar as silver itself resumes mean reverting higher to catch up with gold’s current upleg. The silver miners’ profits leverage to rising silver prices remains outstanding. After fleeing silver stocks so aggressively this year, investors and speculators alike will have to do big buying to reestablish silver-mining positions. That will fuel major upside.
Adam Hamilton, CPA
November 24, 2017
Copyright 2000 – 2017 Zeal LLC (www.ZealLLC.com)

- Gold surged higher on Friday. Then it gave all the gains back yesterday. Looking beyond this short term noise, gold is not an exciting market right now. What could make that change?
- Please click here now. Double-click to enlarge. Gold is trading in a rough sideways trend with an upside bias. This bias continues to strengthen, albeit very slowly. The technical action reflects the fundamentals and liquidity flows and clearly, patience.
- On that note, please click here now. I jokingly refer to the SPDR fund as “Spider Man”. Chindian demand is decent, but Spider Man looks like he’s caught in his own web; while there’s no significant selling, buying has come to a standstill.
- If Chindian demand is solid, gold doesn’t really need a lot of Western fear trade buying to move higher, but it must have some. That’s just not happening right now.
- The winds of change may be in the air, with US wage inflation pressures intensifying, an approaching debt ceiling debate, and a new Fed chair who stands ready to significantly reduce bank regulation.
- Without a bull cycle in money velocity, gold stocks and silver stocks will have a very hard time outperforming bullion on a consistent basis.
- The good news: these winds of change (especially the small bank deregulation favoured by Fed chair Powell) mean there is a very high probability that US money velocity ends its two decade bear market in 2018.
- Like Reagan, Trump’s administration is decreasing regulation and taxes while increasing debt. The main difference is that Reagan operated at the start of a business up cycle and at the end of an inflationary era. So, the Reagan administration could deflect government debt growth concerns with positive economic growth accolades.
- In contrast, the Trump administration is operating in the tail end of the business up cycle and in the tail end of a deflationary era. The bottom line: US GDP can grow for another year or two and hit 4% to 6% on the upside, but liquidity is going to flow from Wall Street and government bonds into the fractional reserve banking system as that happens.
- That’s because of quantitative tightening and rate hikes. Elderly American savers have essentially been nuked by QE and interest rates that are at multi-generational lows. Goldman predicts nine rate hikes in 2018 – 2019. I predict six, and the Fed dot plot suggests there will be seven.
- Whatever the number turns out of be, with a tail wind of tax cuts and bank deregulation, significant liquidity flows are going to move into thousands of America’s small banks.
- From there, it won’t be wasted on government bonds, which is deflationary. It won’t be used for stock market buybacks to give scummy corporate fat cats giant bonuses instead of giving American workers a pay raise.
- That money is going to go to Main street small business loans, and money velocity stands to make a significant reversal as that happens.
- As the business cycle peaks, even more money is going to flow into these banks… and into gold. In an economic downturn, Trump may need to look at unconventional policy like a new US Treasury gold buy program and high tariffs to manage the huge US government debt.
- Please click here now. Double-click to enlarge this dollar-yen chart. Different price drivers drive the gold price at different times. Sometimes gold leads a market, and at other times it follows. Currently, gold is playing follow the dollar-yen leader.
- An important head and shoulders top is forming on the dollar against the yen. I told my intestinally fortified readers to prepare for some gold market pain early yesterday morning, and the “reign of pain” arrived just hours later, exactly on cue!
- Nothing is out of order here. The dollar is rallying to form a right shoulder high against the yen, and that’s putting annoying but modest pressure on gold. Without the institutional support for gold stocks that comes with rising money velocity (particularly M2), the stocks get hit a lot harder than bullion.
- Fund managers like Ray Dalio recommend keeping 5% to 10% of assets in gold. Ray owns a lot of gold stocks as well. In the gold community, gold is generally owned more aggressively, often representing 40% in an investor’s portfolio, and more!
- I have no issue with the higher percentages (and partake in them myself). To build retained wealth (and maintain emotional stability) in the sector though, gold bugs need to buy significant price weakness.
- Holding some assets besides bullion and the miners is also important. Just as gold is a stock/bond investor’s tool to maximize returns and reduce drawdowns, mainstream stocks and bonds serve a gold investor in the same way.
- On that note, please click here now. Double-click to enlarge. I coined the term “gold bull era” to describe the long term growth of gold demand related to growth in China, India, and other Asian and mid-East markets.
- Please click here now. Double-click to enlarge. I’ve highlighted a solid upside breakout from a massive triangle pattern on this South Korean stock market ETF chart. I urge all gold bugs to buy and hold some China, India, South Korea, and Japan stock market ETFs and individual stocks. The bottom line: The Asian stock market upside breakouts represent stage one of the gold bull era. Don’t miss out on the wealth building fun!
- Please click here now. Another great holding for gold bugs is bitcoin. A lot of investors ask me how bitcoin staged a “forty bagger” move while gold has gone nowhere. The answer is simply that the supply of bitcoin is only 21 million coins. My long term (not that long) target for bitcoin is $500,000. If the supply of gold was only 21 million ounces, gold would already easily be at $500,000, but the demand-supply balance for gold is much more even (for now) than it is for bitcoin. Bitcoin shouldn’t be viewed as a competitor to gold. I’ve labelled bitcoin a positive member of the precious metals asset class family, and predicted it will play a major role in the gold bull era.
- Please click here now. Double-click to enlarge this exciting Chow Tai Fook chart. Chow is the largest gold jewellery retailer in China. I cover the wealth building action for Chow in my www.gracelandjuniors.com newsletter. Chow’s price action is also a truly vital indicator of what lies ahead for the Western gold mining stocks. It looks set to usher in the new year with an upside blast higher from a broadening consolidating pattern which should send the miners higher too!
Cheers
St
Stewart Thomson
Graceland Updates
Stewart Thomson is a retired Merrill Lynch broker. Stewart writes the Graceland Updates daily between 4am-7am. They are sent out around 8am-9am. The newsletter is attractively priced and the format is a unique numbered point form. Giving clarity of each point and saving valuable reading time.
Risks, Disclaimers, Legal
Stewart Thomson is no longer an investment advisor. The information provided by Stewart and Graceland Updates is for general information purposes only. Before taking any action on any investment, it is imperative that you consult with multiple properly licensed, experienced and qualified investment advisors and get numerous opinions before taking any action. Your minimum risk on any investment in the world is: 100% loss of all your money. You may be taking or preparing to take leveraged positions in investments and not know it, exposing yourself to unlimited risks. This is highly concerning if you are an investor in any derivatives products. There is an approx $700 trillion OTC Derivatives Iceberg with a tiny portion written off officially. The bottom line:
Are You Prepared?
It has been a while since we’ve applied historical analysis to the precious metals sector. It is something we really enjoy as history can help define and contextualize current trends and help us spot opportunities. Back in March of this year we noted that the gold stocks could be following the path of recovery of housing stocks since their 2009 bottom. Recently, James Flanagan of Gann Global Financial has produced some excellent videos discussing some historical comparisons that are quite relevant to the gold stocks at present. We saw his videos, remembered our housing analog and wanted to take it a step further. What was the path of recovery of markets following mega bear markets?
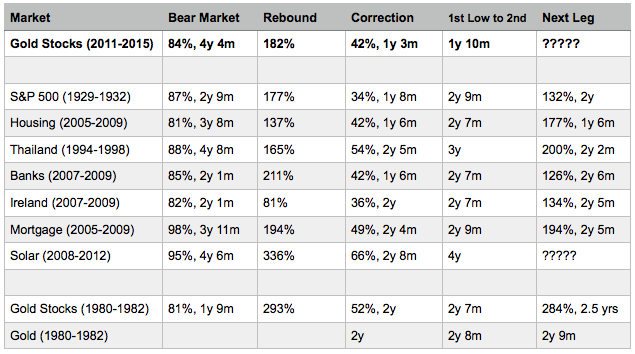
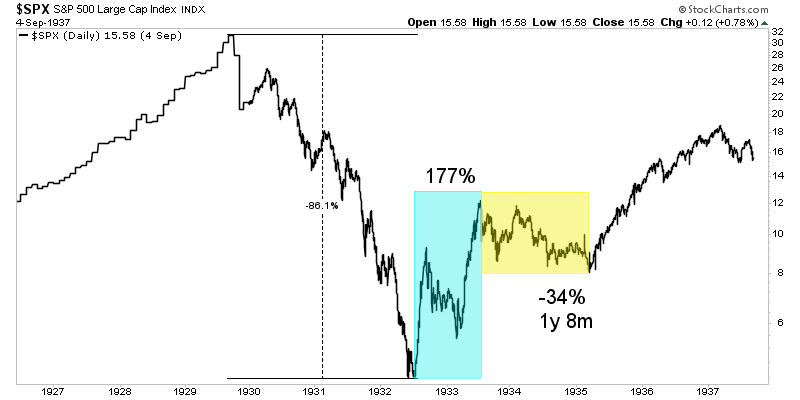
We define a mega bear market as at least an 80% decline that lasted roughly three to four years. The image below highlights the data we’ve compiled. Some of the bears are only two years long but they follow the general recovery path. That consists of a very strong initial rebound that lasts six to twelve months which is followed by a correction and consolidation which usually lasts 18 months to two years. Then, the market begins its next impulsive advance.
Next we will look at the three best fits to the gold stocks at present.
The housing stocks may be the best analog. They lost 81% during a bear market which lasted nearly four years. Then they recovered 137% before correcting 42% over 18 months. Over the next 18 months (from the 2011 low to 2013), the housing stocks gained 177%.

The S&P 500 during the Great Depression is also a good fit. The market lost 86% over nearly three years. That led to a 177% rebound which was followed by a 34% correction over one year and eight months. The market then rebounded 132% over the next two years.
Finally, Thailand is an interesting example. It lost 87% over a greater than four year bear market. Both time and price were similar to the bear market in gold stocks. After rebounding 142%, Thai stocks lost 54% over the next year and four months. While that low in late 2000 marked the corrective low in price, the market did not begin an impulsive advance for another year. However, it was worth the wait as the market gained 200% over the following two years.
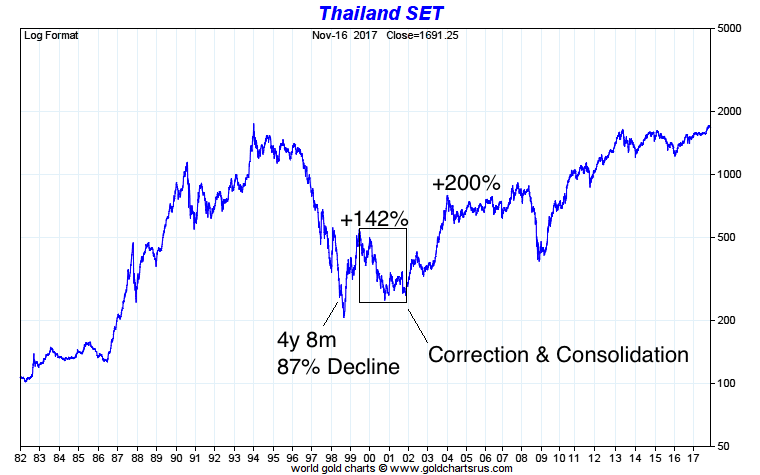
The gold stocks have followed the recovery path of these markets but there are some slight differences. The corrections and consolidations in Housing and the S&P 500 were less severe as those markets tested or at least came close to testing their initial rebound peaks. The correction in Thailand was more severe as that market shed 54% in 16 months. At present, gold stocks are in the 16th month of their correction and are down roughly 30%-35%. In any case, we expect the current correction and consolidation to continue into 2018.
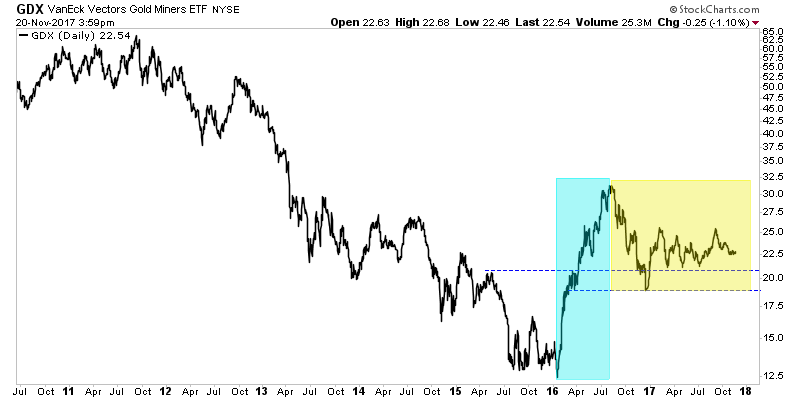
There is no guarantee of a future breakout move in precious metals but the gold stocks are following a specific history of recoveries following mega bear markets and that history implies a major move higher should begin sometime in 2018. When we consider the time of the corrections and time between the two bottoms along with the slight weakness in gold stocks as compared to some of the examples, we expect the next significant low to be in Q2 or Q3 2018. The low does not necessarily have to be an absolute price low. It would mark the point from which the gold stocks would begin an impulsive advance. In the meantime, the key for traders and investors is to find the best companies and seek oversold situations with value and catalysts that will drive buying. To follow our guidance and learn our favorite juniors for 2018, consider learning more about our premium service.
Jordan Roy-Byrne CMT, MFTA
On November 1st, De Beers said that it will be closing its nearly depleted Victor diamond mine in northern Ontario in early 2019. Victor is the first in a line of legacy diamond mines world-wide that will be closing over the next 5-years.
Most notably, Rio Tinto’s illustrious Argyle mine in Australia is expected to shut operations in 2021. At peak production, in the mid-90’s, Argyle produced over 40M carats annually. To put that into perspective, total 2017 global diamond output is estimated at less than 150M carats.
De Beers Voorspoed mine in Botswana is on pace to reach end-of-life by the end of the decade, and a slew of the company’s alluvial mines in Namibia are planned to be phased out by 2022.
With global diamond demand forecast to grow at approximately 3.5% annually over the next five years, driven by middle class consumers in Mainland China and India, the industry’s fastest growing large markets, a supply gap down the line seems inevitable if forecasts hold.

Globally there only two new diamond projects in the works with annual production potential of in excess of 1M carats, one in Angola, the other in Russia. Further, new diamond project exploration has been limited by challenges in the upstream diamond industry’s primary jurisdictions.
Greenfields diamond exploration in South Africa is at multi-decade lows due to delays in granting of prospecting licenses and perceived risks of a new Mining Charter, and this year there was a production disruption at the Williamson diamond mine in Tanzania related to government changes in mining legislation.
In Botswana, home to De Beers’ primary asset base, the country has been heavily explored and most major diamond discoveries are assumed to already have been made. In Russia, most major diamond production in is controlled by government entities.

This makes Canada, already the third largest diamond producing nation in the world by value (see chart above), arguably the most prospective diamond exploration jurisdiction in the world. In May of this year, Canada’s leading diamond producer, Dominion Diamond (private), pledged to spend C$50M on exploration over next 5 years, the company’s first major greenfields exploration since 2007.
After being acquired for US$1.2B in July by private-held the Washington Companies (at a 44% premium to where the stock was trading the day before initial indication of interest was made), on November 1st Dominion reiterated plans of “reinvigorating” exploration programs in Canada.
Dominion is partnered with North Arrow Minerals (TSX-V: NAR) on the prospective “Lac de Gras” property, which is located within a diamondiferous kimberlite field in the Northwest Territories that is the source to some of the richest diamond deposits in the world, including Dominion’s two world-class mines, Ekati and Diavik.

Dominion’s partner is known for making 2 of the only 5 kimberlite discoveries made in Canada over the last 5 years, and both of North Arrow’s discoveries were diamond bearing. Just last month North Arrow announced a discovery at the company’s 100%-owned Mel project in in the Nunavut territory of Canada. The company has plans to set up an exploration camp and drill the property next year.
Mel is approximately 200km northeast of the North Arrow’s 100%-owned Naujaat property which already has an inferred resource of over 26M carats and contains fancy yellow and orangey-yellow diamonds. In September, the company completed a C$2M drilling and mini-bulk sampling program at the property with results expected in the coming months. North Arrow also has pending results from a till sampling program at its Pikoo project, a 100%-owned diamond bearing kimberlite project in Saskatchewan that was discovered by North Arrow in 2013.
This coming March, Dominion will lead a drill program at the aforementioned Lac de Gras joint-venture (69% Dominion/31% North Arrow) in hopes of discovering new diamondiferous kimberlites. At around the same time North Arrow will also be drilling at its 100% owned Loki project, also in the Northwest Territories, and approximately only 30-40km away from both Ekati and Diavik.
With active programs across multiple worthy projects in Canada’s premier diamond territories, North Arrow appears well positioned to add to previous success and maintain its status as Canada’s leading publicly-traded stand-alone diamond explorer.
Disclosure: Paul Zimnisky has been compensated by North Arrow Minerals to produce the above content. The content includes views that are based on observations and opinions. The author has made every effort to ensure the accuracy of information provided, however, accuracy cannot be guaranteed. The above content is strictly for informational purposes and should not be considered investment advice. Consult your investment professional before making any investment decisions. None of the parties involved accept culpability for losses and/or damages arising from the use of content above.
The gold miners’ stocks have spent months adrift, cast off in the long shadow of the Trumphoria stock-market rally. This vexing consolidation has left a wasteland of popular bearishness. But once a quarter earnings season arrives, bright fundamental sunlight dispelling the obscuring sentiment fogs. The major gold miners’ just-reported Q3’17 results prove this sector remains strong fundamentally, and super-undervalued.
Four times a year publicly-traded companies release treasure troves of valuable information in the form of quarterly reports. Companies trading in the States are required to file 10-Qs with the US Securities and Exchange Commission by 45 calendar days after quarter-ends. Canadian companies have similar requirements. In other countries with half-year reporting, many companies still partially report quarterly.
The world’s major gold miners just wrapped up their third-quarter earnings season. After spending decades intensely studying and actively trading this contrarian sector, there’s no gold-stock data I look forward to more than the miners’ quarterly financial and operational reports. They offer a true and clear snapshot of what’s really going on, shattering the misconceptions bred by ever-shifting winds of sentiment.
The definitive list of major gold-mining stocks to analyze comes from the world’s most-popular gold-stock investment vehicle, the GDX VanEck Vectors Gold Miners ETF. Its composition and performance are similar to the benchmark HUI gold-stock index. GDX utterly dominates this sector, with no meaningful competition. This week GDX’s net assets are 23.2x larger than the next-biggest 1x-long major-gold-miners ETF!
Being included in GDX is the gold standard for gold miners, requiring deep analysis and vetting by elite analysts. And due to ETF investing eclipsing individual-stock investing, major-ETF inclusion is one of the most-important considerations for picking great gold stocks. As the vast pools of fund capital flow into leading ETFs, these ETFs in turn buy shares in their underlying companies bidding their stock prices higher.
This week GDX included a whopping 51 component “Gold Miners”. That term is used somewhat loosely, as this ETF also contains major silver miners, silver streamers, and gold royalty companies. Still, all the world’s major gold miners are GDX components. Due to time constraints, I limited my deep individual-company research to this ETF’s top 34 components, an arbitrary number that fits neatly into the tables below.
Collectively GDX’s 34 largest components now account for 91.9% of its total weighting, a commanding sample. GDX’s components include major foreign gold miners trading in Australia, the UK, and South Africa. These companies report in half-year increments instead of quarterly, so their Q3 data is limited. They usually publish quarterly production results, but generally don’t disclose quarterly financial results.
The importance of these top-GDX-component gold miners can’t be overstated. In Q3 they collectively produced over 9.9m ounces of gold, or 309.4 metric tons. The World Gold Council’s recently-released Q3 Gold Demand Trends report, the definitive source on worldwide supply-and-demand fundamentals, pegged total global mine production at 841.0t in Q3. GDX’s top 34 miners alone accounted for nearly 4/10ths!
Every quarter I wade through a ton of data from these elite gold miners’ 10-Qs, and dump it into a big spreadsheet for analysis. The highlights made it into these tables. If a field is left blank, that means a company didn’t report that data for Q3’17 as of this Wednesday. Companies always try to present their quarterly results in the best-possible light, which leads to wide variations in reporting styles and data offered.
In these tables the first couple columns show each GDX component’s symbol and weighting within this ETF as of this week. While most of these gold stocks trade in the States, not all of them do. So if you can’t find one of these symbols, it’s a listing from a company’s primary foreign stock exchange. That’s followed by each company’s Q3’17 gold production in ounces, which is mostly reported in pure-gold terms.
Most gold miners also produce byproduct metals like silver and copper. These are valuable, as they are sold to offset some of the considerable costs of gold mining. Some companies report their quarterly gold production including silver, a construct called gold-equivalent ounces. I only included GEOs if no pure-gold numbers were reported. That’s followed by production’s absolute year-over-year change from Q3’16.
Next comes the most-important fundamental data for gold miners, cash costs and all-in sustaining costs per ounce mined. The latter determines their profitability and hence ultimately stock prices. Those are also followed by YoY changes. Finally the YoY changes in cash flows generated from operations, GAAP profits, revenues, and cash on balance sheets are listed. There’s one key exception to these YoY changes.
Percentage changes aren’t relevant or meaningful if data shifted from positive to negative or vice versa. Some major gold miners earning profits in Q3’16 suffered net losses in Q3’17. So in cases where data crossed that zero line, I included the raw numbers instead. This whole dataset offers a fantastic high-level fundamental read on how the major gold miners are faring today. They’re actually doing quite well!
After spending days digesting these elite gold miners’ latest quarterly reports, it’s fully apparent their vexing consolidation this year isn’t fundamentally righteous at all! Traders have abandoned this sector since the election because the allure of the levitating general stock markets has eclipsed gold. That has left gold stocks exceedingly undervalued, truly the best fundamental bargains out there in all the stock markets!
Since gold miners are in the business of wresting gold from the bowels of the Earth, production is the best place to start. The 9947k ounces of gold collectively produced last quarter by these elite major gold miners is up 0.5% YoY from Q3’16. That’s relatively solid, as the World Gold Council’s supply data shows a 1.3% YoY drop in global gold mine production. So the GDX majors effectively gained market share.
Yet on a sequential quarter-on-quarter basis, these top-34 GDX miners only grew production 0.9% from Q2’17. That’s definitely disappointing. The WGC reported world mine production grew 3.1% QoQ. Even that is down sharply from the average 7.2% sequential growth between Q2s and Q3s from 2010 to 2016. The major gold miners are collectively having a hard time expanding their production, which is bullish for gold.
Gold deposits economically viable to mine are very rare in the natural world, and the low-hanging fruit has largely been harvested. It is growing ever more expensive to explore for gold, in far-less-hospitable places. Then even after new deposits are discovered, it takes well over a decade to jump through all the Draconian regulatory hoops necessary to secure permitting. And only then can mine construction finally start.
That takes additional years and hundreds of millions if not billions of dollars per gold mine. But because gold-mining stocks have been deeply out of favor most of the time since 2013, capital has been heavily constrained. When banks are bearish on gold prices they aren’t willing to lend to gold miners except with onerous terms. And when investors aren’t buying gold stocks, issuing new shares low is heavily dilutive.
The large gold miners used to rely heavily on the smaller junior gold miners to explore and replenish the gold-production pipeline. But juniors have been devastated since 2013, starved of capital. Not only are investors completely uninterested with general stock markets levitating, but the rise of ETFs has funneled most investment inflows into a handful of larger-market-cap juniors while the rest see little meaningful buying.
So even the world’s biggest and best gold miners are struggling to grow production. While that isn’t great for individual gold miners, it’s super-bullish for gold. The less gold mined, the more gold supply will fail to keep pace with demand. That will result in higher gold prices, making gold mining more profitable in the future. Some analysts even think peak gold has been reached, that mine production will decline indefinitely.
There are strong fundamental arguments in favor of peak-gold theories. But regardless of where overall global gold production heads in coming years, the major gold miners able to grow their own production will fare the best. They’ll attract in relatively more investor capital, bidding their stocks to premium prices compared to peers who can’t grow production. Stock picking is more important than ever in this ETF world!
But despite these top-34 GDX components’ abnormally-slow Q3’17 production growth, they remain quite strong fundamentally. The viability of gold miners is measured by the difference between prevailing gold prices and what it costs to produce that gold. Even with the average gold price falling significantly between Q3’16 and Q3’17, the major gold miners collectively remain very profitable. Their costs are well under control.
There are two major ways to measure gold-mining costs, classic cash costs per ounce and the superior all-in sustaining costs per ounce. Both are useful metrics. Cash costs are the acid test of gold-miner survivability in lower-gold-price environments, revealing the worst-case gold levels necessary to keep the mines running. All-in sustaining costs show where gold needs to trade to maintain current mining tempos indefinitely.
Cash costs naturally encompass all cash expenses necessary to produce each ounce of gold, including all direct production costs, mine-level administration, smelting, refining, transport, regulatory, royalty, and tax expenses. In Q3’17, these top-34 GDX-component gold miners that reported cash costs averaged just $591 per ounce. That plunged a remarkable 8.8% YoY from Q3’16’s $648! Production costs are falling.
Today the gold miners’ stocks are trading at crazy-low prices implying their survivability is in jeopardy. This week the flagship HUI gold-stock index was languishing near 186, despite $1278 gold. The first time the HUI hit 186 in August 2003, gold was only in the $360s! Gold stocks are radically undervalued today by virtually every metric. They collectively face zero threat of bankruptcies unless gold plummets under $600.
Way more important than cash costs are the far-superior all-in sustaining costs. They were introduced by the World Gold Council in June 2013 to give investors a much-better understanding of what it really costs to maintain a gold mine as an ongoing concern. AISC include all direct cash costs, but then add on everything else that is necessary to maintain and replenish operations at current gold-production levels.
These additional expenses include exploration for new gold to mine to replace depleting deposits, mine-development and construction expenses, remediation, and mine reclamation. They also include the corporate-level administration expenses necessary to oversee gold mines. All-in sustaining costs are the most-important gold-mining cost metric by far for investors, revealing gold miners’ true operating profitability.
In Q3’17, these top-34 GDX-component gold miners reporting AISC averaged a level of just $868 per ounce. That was up a slight 1.5% YoY and a trivial 0.1% QoQ, pretty much flat. That AISC gold price is effectively this industry’s breakeven level. As long as gold stays higher, the major gold miners can earn profits mining it indefinitely. In spite of Q3’s lower gold prices, the major gold miners remained very profitable.
Gold’s $1279 average price in Q3’17 fell a significant 4.2% YoY from Q3’16’s $1334 average. $56 lower gold prices definitely took a bite out of operating profits. At $1279 gold and $868 AISC, GDX’s top 34 gold miners were collectively earning $411 per ounce last quarter! That’s down 14.2% YoY from Q3’16’s $479 fueled by higher average gold prices and slightly-lower all-in sustaining costs. But $411 is still hefty.
That implies fat 32% operating margins, levels most industries would kill for. The serious bearishness in precious metals has led many investors to assume the gold miners must be struggling fundamentally. But they are thriving with high-$1200s gold! This metal would have to collapse under $900 before the long-term viability of today’s major gold miners would be called into question, which definitely isn’t in the cards.
Gold miners offer such compelling investment opportunities because of their inherent profits leverage to gold. Gold-mining costs are largely fixed during mine-planning stages, when engineers and geologists decide which ore to mine, how to dig to it, and how to process it. The actual mining generally requires the same levels of infrastructure, equipment, and employees quarter after quarter regardless of gold prices.
So gold-mining profits really leverage rising and falling gold prices. Q3’17 experienced this on the downside, with a 4.2% drop in average gold prices leading to a 14.2% YoY operating-profit decline. But this certainly doesn’t justify the sharply-lower gold-stock prices. Average HUI levels plunged 22.5% from 255 in Q3’16 to just 197 in Q3’17. The latest $411-per-ounce profits are already high, and are heading far higher.
Gold itself is overdue for a major new upleg driven by investment demand returning. As I discussed in depth last week, investment demand has stalled thanks to the extreme stock-market euphoria. These bubble-valued stock markets are due to roll over imminently as the Fed and European Central Bank both start aggressively choking off liquidity. That will strangle this stock bull, reigniting big gold investment demand.
The impact of higher gold prices on major-gold-miner profitability is easy to model. Assuming flat all-in sustaining costs at Q3’17’s $868 per ounce, 10%, 20%, and 30% gold rallies from this week’s levels will lead to collective gold-mining profits surging 31%, 62%, and 93%! And another 30% gold upleg isn’t a stretch at all. In essentially the first half of 2016 alone after the last stock-market correction, gold surged 29.9%.
The major gold stocks as measured by the HUI, which closely mirrors GDX, skyrocketed 182.2% higher in roughly that same span! Gold-mining profits and thus gold-stock prices soar when gold is powering higher. And incidentally Q3’17’s major-gold-miner AISC levels are overstated thanks to the South African gold miners. They face serious political and operational problems as I discussed in my previous Q2’17 GDX essay.
Gold-mining costs are spiraling higher in South Africa as production fades due to both aging super-deep mines and government interference. AngloGold Ashanti, Gold Fields, and Sibanye Gold have extensive South African exposure and thus higher AISC. Pull those companies out of the average, and the major-gold-miner AISC falls to $846. That’s closer to the true global gold production cost, around $850 per ounce.
The key takeaway for investors is the major gold miners are very profitable even at the lackluster high-$1200s gold prices of recent months. Anything above $850 or so is pure profit, and those profits really amplify higher gold prices. So the bearish-sentiment-fueled notion today that the major gold miners are struggling fundamentally is totally false. Their low stock prices are the result of psychology, not operations.
While all-in sustaining costs are the single-most-important fundamental measure that investors need to keep an eye on, other metrics offer peripheral reads on the major gold miners’ fundamental health. The more important ones include cash flows generated from operations, actual accounting profits, revenues, and cash on hand. They generally corroborated AISC in Q3’17, proving the gold miners are faring quite well.
These top-34 GDX-component gold miners reporting operating cash flows for Q3 collectively generated $4.1b. That’s down 28.5% YoY, which isn’t surprising given lower prevailing gold prices. Interestingly OCF was still up 22.0% QoQ though, a big jump considering this gold-price environment. Every one of these elite GDX gold miners reported positive OCF in Q3, with many results fairly large relative to market caps.
Within individual gold miners operating cash flows can vary considerably quarter to quarter depending on what they are doing with their operating gold mines. As long as OCFs remain massively positive, the gold miners’ operations are quite profitable. That certainly remained true as a sector in Q3’17 despite the lower prevailing gold price. The other major-gold-miner accounting metrics remained much more stable YoY.
These top GDX gold miners’ GAAP accounting profits only retreated 6.6% YoY to $854m, which is really impressive considering the 4.2% lower average gold price. While gold miners have struggled in the deep bearish psychology plaguing this sector since 2013, it has forced them to become ruthless in controlling their costs. Thus a few of these elite gold miners are sporting super-cheap single-digit price-to-earnings ratios.
Sequentially quarter-on-quarter these major gold miners’ profits did plunge 64.0% from Q2’17’s, certainly sounding ominous. But as I explained a quarter ago, Q2’s profits were artificially boosted by huge one-time gains from a couple companies selling interests in major gold projects and reversing impairment charges. Such events are rare, but they have to be watched for since they can greatly skew accounting profits.
The revenues front was much less volatile, just as expected given the relatively-flat gold production. The collective sales of these top 34 GDX components fell 5.2% YoY to $10.4b, right in line with Q3’17’s lower average gold prices. Sales moved even less QoQ, merely retreating 2.6% from Q2. Unlike most other industries, gold miners have no problem selling every single ounce of gold they can manage to produce.
The final metric for investors to watch is cash on balance sheets. Having sufficient cash gives companies both flexibility in growing operations and financial resilience to weather unforeseen challenges. The more cash gold miners have on hand, the more opportunities they have to acquire new projects and the greater their protection against individual-mine problems. These top GDX gold miners reported $11.8b in Q3’17.
That was only down 6.6% YoY, proving operating-cash-flow generation was high. Cash did drop 14.0% QoQ, but that’s not necessarily bad. As long as gold miners are cash-flow positive, big drops in cash tend to come from expanding operations which will yield more future production. Bringing new gold mines online or improving infrastructure at existing ones is very expensive, requiring big spending to execute.
Pretium Resources is a great example, having one of the worst cash showings in Q3’17. Its total cash plummeted 69% YoY to $54m, which could be concerning without context. But Pretium was spending big as planned to bring its amazing new Brucejack gold mine to commercial production right as Q3 was dawning. Pretium went from a mere explorer building that mine a year ago to producing 82k ounces in Q3!
So overall the major gold miners’ fundamentals looked quite impressive in Q3’17, a stark contrast to the miserable sentiment plaguing this sector. Gold stocks’ vexing consolidation this year wasn’t the result of operational struggles, but purely bearish psychology. That will soon shift as the stock markets roll over and gold surges, making the beaten-down gold stocks a coiled spring today. They are overdue to soar again!
Though this contrarian sector is widely despised now, it was the best-performing in all the stock markets last year despite that sharp post-election selloff in Q4. The HUI blasted 64.0% higher in 2016, trouncing the S&P 500’s mere 9.5% gain! Similar huge 50%+ gold-stock gains are likely again in 2018, as gold mean reverts higher on the coming stock-market selloff. The gold miners’ strong Q3 fundamentals prove this.
While investors and speculators alike can certainly play gold stocks’ coming rebound rally with the major ETFs like GDX, the best gains by far will be won in individual gold stocks with superior fundamentals. Their upside will trounce the ETFs, which are burdened by over-diversification and underperforming gold stocks. A carefully-handpicked portfolio of elite gold and silver miners will generate much-greater wealth creation.
At Zeal we’ve literally spent tens of thousands of hours researching individual gold stocks and markets, so we can better decide what to trade and when. As of the end of Q3, this has resulted in 967 stock trades recommended in real-time to our newsletter subscribers since 2001. Fighting the crowd to buy low and sell high is very profitable, as all these trades averaged stellar annualized realized gains of +19.9%!
The key to this success is staying informed and being contrarian. That means buying low when others are scared, like late in this year’s vexing consolidation. An easy way to keep abreast is through our acclaimed weekly and monthly newsletters. They draw on my vast experience, knowledge, wisdom, and ongoing research to explain what’s going on in the markets, why, and how to trade them with specific stocks. Easy to read and affordable, they’ll help you learn to think, trade, and thrive like contrarians. Subscribe today, and get deployed in the great gold stocks on our trading books before they surge far higher!
The bottom line is the major gold miners’ fundamentals remained quite strong in the just-reported third quarter. Slight production growth coupled with stable costs helped offset some of gold’s decline from the same quarter a year earlier. The gold miners continued to earn hefty operating profits while generating good cash flows. Sooner or later investors will take notice of this forgotten sector’s strong fundamentals.
The universally-despised gold stocks are the last dirt-cheap sector in these Trumphoria-inflated stock markets. No one wants anything to do with them, which is the best time to buy low before they soar. All it will take to ignite gold stocks’ overdue mean-reversion rally is gold investment demand returning. The miners’ profits will really leverage gold rallying higher, making gold stocks even more fundamentally compelling.
Adam Hamilton, CPA
November 17, 2017
Copyright 2000 – 2017 Zeal LLC (www.ZealLLC.com)
- Without growth in Western gold ETF holdings, the “decent but not spectacular” demand from China and India is not strong enough to move the gold price higher.
- Please click here now. The SPDR (GLD-nyse) fund gold holdings currently sit at about 843 tonnes. There has been very little change in the total tonnage for several months. That’s neutral for the gold price.
- Governments don’t like their citizens to own much gold. Restrictions they impose (like India’s import duty as a recent example) dampen demand enough so that the price rises very slowly most of the time.
- Economic growth in China and India are increasing demand (the love trade) and mine supply is contracting, but the process is essentially “Chindian water torture” for investors who want to see the price skyrocket like it did in the late 1970s.
- Investors that want “big action” in the gold price need to wait patiently for the US business cycle to peak.
- For the price of gold to really sizzle, the business cycle needs to have an inflationary peak. That hasn’t happened since the 1970s. Many gold price analysts have used overlap charts that suggest the gold market now is akin to the 1976-1978 period.
- I look at fundamentals first, and charts second. From an inflationary standpoint, the US economy looks more akin to the late 1960s than the late 1970s.
- The winds of inflation are beginning to blow, but they won’t become a hurricane for some time. Having said that, I’ve noted that the St. Louis Fed has calculated that the QE program would have sent the US inflation rate above 30% if money velocity had been at normal levels.
- The Fed is projecting seven rate hikes over the next 24 months, and Goldman Sachs projects there could be nine. I’ve predicted there will be six. Whatever the number turns out to be, it will likely be enough to move a lot of money into bank accounts.
- As that happens, banks are likely to become very aggressive with new loans, because the fractional reserve banking system makes the potential reward worth the risk. The Fed’s new accelerated quantitative tightening program will also help push money into banks.
- Odds are very high that money velocity begins to rise quite strongly later in 2018 and into 2019. The bottom line is that inflation could rise much faster than anticipated over the next 24 months.
- That could essentially create an institutional and retail investor stampede into gold.
- For now, in the $1200 – $1000 price zone gold is well-supported but sluggish.
- I don’t expect that to change until money velocity moves higher, and that’s unlikely to happen until institutions see that the Fed is serious about consistent hikes and accelerated QT.
- Trump’s tax cuts and tariffs can speed up the arrival of inflation, but the tariff action has been modest, and his tax cuts are bogged down in congress and the senate. The meandering gold price reflects this quagmire.
- Please click here now. Double-click to enlarge. Gold’s technical price action also fits with the slow arrival of inflation. Bulls and bears are equally frustrated.
- My www.gudividends.com investors are happy, because they get paid to wait. There’s no question that gold investors need to wait. If investors must wait for something, they should get paid with a bird in the hand, not just a promise of a bird in the bush!
- Dividends are probably the least exciting type of investment for gold bugs. A lot of the stock market’s gains have really come from dividends, but few investors think about this fact.
- Compounded 4% – 8% payouts can build significant wealth over time, and reduce the frustration of waiting for gold market “blastoff” moments.
- Please click here now. Double-click to enlarge. The dollar-yen price action correlates strongly with dollar-gold.
- There’s a bear wedge in play and overhead resistance at about 114. There’s also a potential head and shoulders top formation. The dollar “should” fall down, but it may not happen until Chinese New Year gold buying begins and the Fed does its next rate hike.
- Please click here now. Double-click to enlarge this GDX chart. A beautiful bull wedge is in play and my 14,7,7 Stochastics oscillator is moving higher.
- Unfortunately, without a rally in gold bullion, GDX is unlikely to perform as well as the bull wedge pattern implies it will.
- Gold bugs have incredible patience and intestinal fortitude. That’s necessary because debt-soaked governments will do anything and everything to avoid paying the piper. I’ve described the $23 – $18 price zone as a key accumulation zone for investors, and GDX is in the upper part of that zone now. Buying gold stocks value is vastly more important than predicting the price, and that value is here for the taking in this key accumulation zone!
Stewart Thomson
Graceland Updates
https://www.gracelandupdates.com
Email:
Stewart Thomson is a retired Merrill Lynch broker. Stewart writes the Graceland Updates daily between4am-7am. They are sent out around 8am-9am. The newsletter is attractively priced and the format is a unique numbered point form. Giving clarity of each point and saving valuable reading time.
Risks, Disclaimers, Legal
Stewart Thomson is no longer an investment advisor. The information provided by Stewart and Graceland Updates is for general information purposes only. Before taking any action on any investment, it is imperative that you consult with multiple properly licensed, experienced and qualified investment advisors and get numerous opinions before taking any action. Your minimum risk on any investment in the world is: 100% loss of all your money. You may be taking or preparing to take leveraged positions in investments and not know it, exposing yourself to unlimited risks. This is highly concerning if you are an investor in any derivatives products. There is an approx $700 trillion OTC Derivatives Iceberg with a tiny portion written off officially. The bottom line:
Are You Prepared?
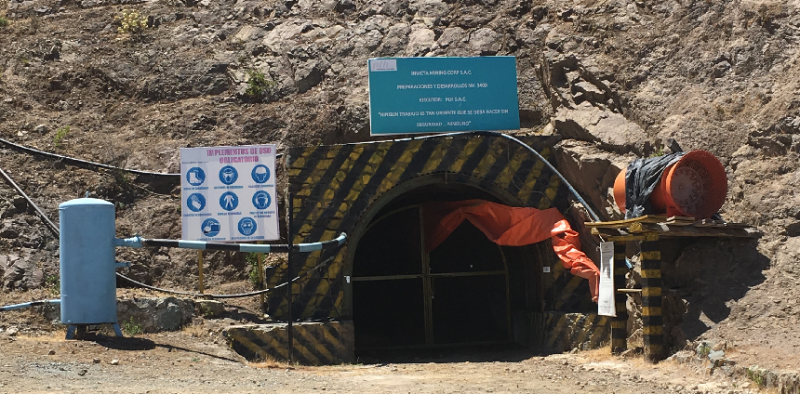
On Nov. 8, 2017, Lupaka Gold Corp. (TSX-V: LPK) received $2 million to further advance its Invicta Gold Project in Peru. This funding was Tranche 2 of the forward gold purchase agreement with Pandion Mine Finance (PLI). This is an important step on the path to production for Lupaka and is an effective alternative to equity financing that links success to production not just share price appreciation.
The receipt of this money satisfied the company’s agreement with Pandion to register the Lacsanga Community Agreement in the Public Registry system in Peru, which was completed on Nov. 6, 2017. These funds will partially go towards the widening of the road up to the site which the company hopes to complete before the rainy season in Peru.
With the registration of the Lacsanga Community Agreement now complete, the only significant conditions remaining to be completed in order to receive Tranche 3 are the requirements to put a mineral offtake agreement in place and to raise an additional US $2 million from other sources.
To meet the conditions for third and final tranche, the company entered into an agreement to sell the Crucero Gold Project to GoldMining Inc. (TSX-V: GOLD) for total approximately $6 million ($750,000 in cash and 3,500,000 shares of GoldMining).
The prepaid forward gold purchase deal with Pandion was announced at the end of June and is an attractive way to finance Lupaka’s Peruvian development project because it is non-dilutive to shareholders and has a fixed end-date.
In an interview earlier this year in the Northern Miner, Chairman of Lupaka Gold Gold Ellis outlined the strategy and benefits of this agreement.
“This is not a royalty agreement that goes on forever…We don’t pay anything for the first 15 months and we only pay them a small percent of what we produce for the next 45 months, and we’re done. It’s gone, it’s clean, there is no residual.”
Furthermore the agreement allows for a 15-month payment holiday which is important as it allows Lupaka the ability to complete development of the mine and ramp up cash flow before having to make any gold repayments.
A prepaid commodity forward agreement is where a buyer agrees to purchase a certain quality and quantity of a commodity from a producer in exchange for an upfront payment. In short, the buyer is acting as a lender in the sense that it is providing money up-front in exchange for future production.
Getting up and running will not be as onerous as other development mining projects as the company plans on using contract miners, contract trucking, and using toll milling facilities.
Tying financing to certain conditions and goals is an excellent way to ensure capital is not wasted on “general corporate purposes” plus tying financing to production is a great way to avoid dilution for shareholders. Lupaka Gold is on the path to production with a clear vision of how to fund and become the next producing mine in Peru.
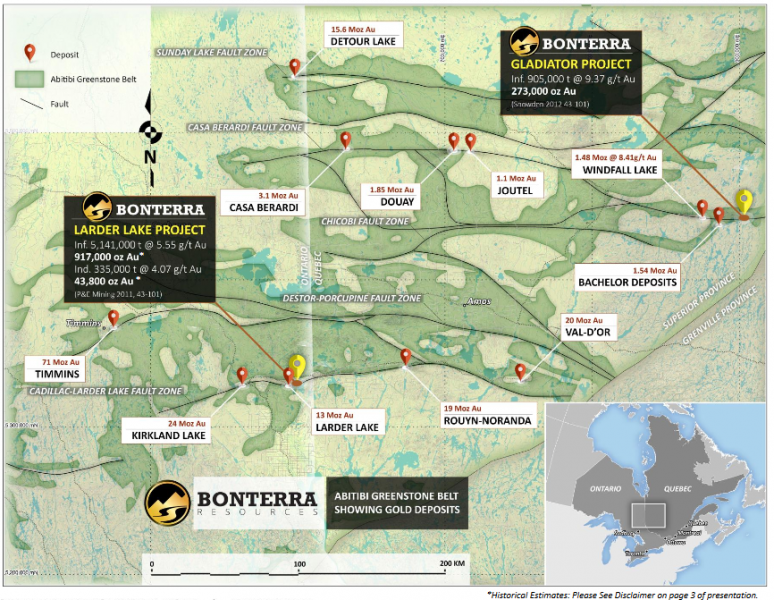
Bonterra Resources, Inc. (Bonterra) was a story I wanted to bring to your attention a few years back but it rose in price so rapidly I left it behind in favor of others that appeared to offer better price-to-value opportunities at that time. However, based on the company’s aggressive drill program this year, which will continue aggressively through the winter months with six drills turning, Bonterra should soon be reporting a dramatic increase from its Gladiator Deposit in Quebec. In addition, its secondary project, the Larder Lake Deposit in Ontario, which has a resource of 917,000 ounces of gold grading 5.55 g/t, should also increase in size simply by factoring in past drill data that had not been factored into the existing resource. So Bonterra has two very worthwhile projects. But with the magnitude of success on the Gladiator Project, management is focusing its resources there for the time being. When tax loss selling is out of the way and as we enter a new year, I believe Bonterra’s shares have the potential to double or triple from their current level through 2018.
The Gladiator Deposit
The reason I am so optimistic about this company’s shares is because I’m convinced the Gladiator Deposit is going to become much larger than the current 273,000 ounces grading 9.37 g/t. I say that because the existing resource is based on a strike length of 200 meters to a depth of 200 meters. Ongoing drilling since then has expanded the dimensions of gold mineralization over 1.2 km to a depth of 1,000 meters in this high-grade multiple vein system. At this stage, six vein sets have been identified and this mineralization is open along strike at below the 1,000 meters intercepted to date. The grades remain high and mining widths are good. In addition, management states that this steeply dipping mineralized system with sharp contacts have excellent rock mechanics for underground mining.
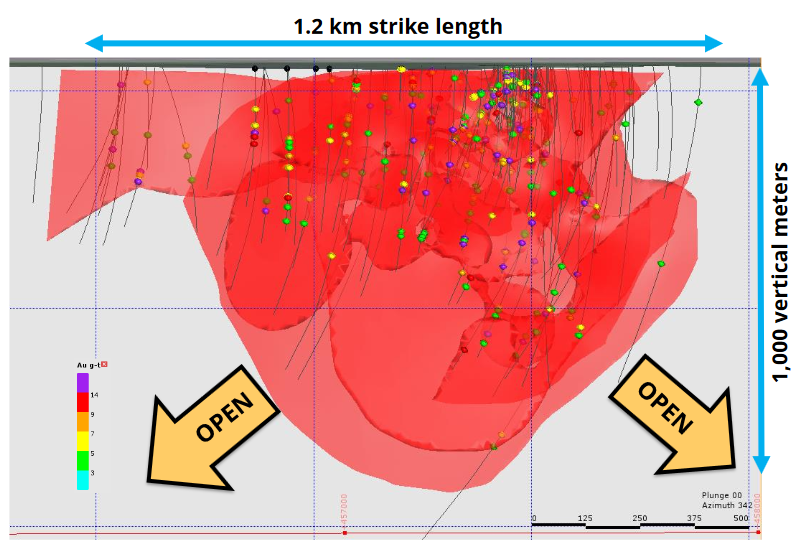
In its latest press release relating to the Gladiator deposit, management reported that it has extended these multiple gold zones by an additional 300 meters along strike and to depth by another 300 meters, thus expanding the deposit to its current size of 1.2 km along strike by 1 km at depth. But with the deposit remaining open at depth and along strike, and with drilling taking place all through the winter, investors should have a lot to look forward to in the way of high-grade assays and eventually a new, much larger high-grade gold deposit at Gladiator.
Ongoing drill success has not only confirmed continuity of gold mineralization along strike and at depth as drilling moves westward, but management believes that its geological model is proving to be very dependable in predicting the location of mineralization. Moreover, management stated in its last press release that “Our geological model has demonstrated additional success up to eight km westward, in the southern part of our Coliseum property.” (Note the green circles to the northeast and in particular to the southwest of the growing Gladiator Gold Deposit. Also note the three assays denoted by yellow stars in the illustration below with nice grades of gold and one with 44.6 g/t silver.)
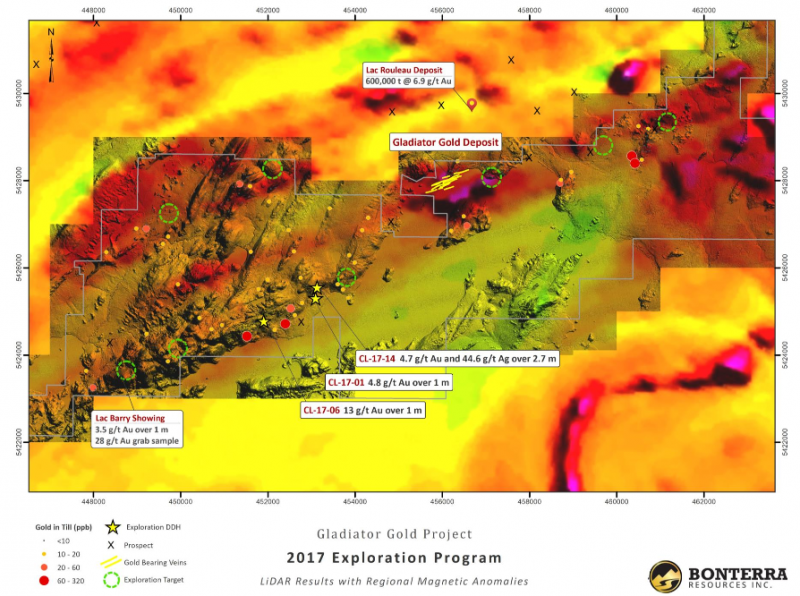
As you can see from the illustration above, mineralization either from surface samples or drill holes has been traced from about 4 km west of the existing deposit for another 6 km along trend to the southwest. It’s my understanding that some drilling will take place in this area during the winter when this marshland freezes over. I don’t expect any drilling to add to the existing resource when a new resource is announced in mid 2018. But it clearly provides a potentially large blue-sky prospect toward the end of 2018 and into 2019.
What might the picture above left mean in terms of a gold resource at the Gladiator Project? The initial resource of 273,000 ounces was calculated from a small area measuring 200 by 200 meters denoted by the very dense areas of drilling pictured toward the top of the mineralized zone. With ongoing drill assays holding with the 9.37-g/t grade in the maiden resource, I believe it is fairly safe to get an idea of the extent of gold mineralization through extrapolating a value in line with the increased dimensions known to date, to something like 2.7 million ounces. I’m not saying enough drilling will be carried out to meet 43-101 specifications. But by the end of this drill season through the end of March 2018, some 40,000 more meters of drilling beyond those shown in the diagram above will have been drilled, leaving the total drill program this year for the Gladiator at 60,000 or 65,000 meters.
The bottom line for me is that Bonterra is on to a multimillion-ounce high-grade discovery. While the several veins that host the gold are too far apart to be mined together, the high grade of these veins means that the amount of ounces per vertical depth is very high, which is an important economic consideration. Also positive for the economics is the fact that mining widths are a reasonably good 2½ to 3 meters, and they begin on surface. So while access is likely to be via a ramp, the cost of ramping down to pay dirt shouldn’t be overly expensive.
Regarding metallurgy, a standard milling operation is anticipated. At this time or in the very near future, a more specific recovery process will be determined from wide core drill samples that will be drilled solely for that purpose. As far as infrastructure and geopolitical jurisdiction, it doesn’t get much better than operating in the Abitibi Gold Belt of Quebec. All of what I can see for now bodes well for a gold deposit considerably in excess of this company’s current market cap likely being developed.
Larder Lake
The first illustration shown on this report under the stock chart is a map showing the Gladiator Property in Quebec and the Larder Lake Property across the border in Ontario. This project has a 43-101 resource of 43,800 ounces in the indicated category grading 4.07 g/t and an inferred resource of 917,000 ounce grading 5.55 g/t. Although this project actually has more ounces than the Gladiator, management has prioritized and stayed focused on the higher-grade Gladiator. But make no mistake. Larder Lake is a very strong project. In fact, it is my understanding that the ounces on this project will likely grow without putting another drill hole down because there is a large amount of drill core previously drilled by Goldfields that Bonterra is in possession of that has been assayed but never factored into the existing resource. With management’s focus strictly on Larder Lake in quest for a multimillion-ounce high-grade gold deposit, I’m not sure when this project will be worked on in a serious manner. But it’s a very good second project that, as long as the bull market persists, is an asset worth holding.
MANAGEMENT
Nav Dhaliwal, President & Chief Executive Officer – Mr. Dhaliwal brings a wealth of entrepreneurial, sales, and financing experience. He is particularly adept at nurturing early stage companies through their critical phases of evolution, having founded a number of companies over his career. Mr. Dhaliwal is also very experienced in corporate development, corporate communications and investor relations, bringing valuable business relationships with international analysts, brokers and investment bankers from Canada, the United States and Asia.
Dale Ginn, B.Sc., P.Geo., VP of Exploration & Director – Mr. Ginn is an experienced mining executive and geologist of nearly 30 years. He is the founder of a number of exploration and mining companies and has led and participated in numerous gold and base metal discoveries, many of which are in production today. While specializing in complex, structurally-controlled gold deposits, he also has extensive mine-operations, development and startup experience. Mr. Ginn is recognized as an advocate of First Nations and local community participation in mining and exploration.
Mr. Ginn’s career has included mine and exploration geology, mine management and various executive roles. Dale has held senior positions with Sprott Mining, Jerritt Canyon Gold and was a founder of San Gold Corporation. Prior to that, he held positions with Harmony Gold Mining, Hudbay, Westmin, Goldcorp and Granges Exploration. Mr. Ginn is a registered professional geologist in Manitoba and Ontario and is a graduate of the University of Manitoba.
Richard Boulay, B.Sc, Director – Over 40 years of experience in the exploration and mining industries in Canada and internationally, including 15 years of mining and infrastructure financing experience gained with Bank of Montreal, Royal Bank of Canada and Bank of Tokyo. He has extensive experience in the management and financing of public companies in Canada and the United States. He is a also a Director of Moneta Porcupine and Latin American Minerals Inc.
Robert Gagnon, Geo., Director, Mr. Gagnon has +10 Years as a professional geologist, earning his Mining Techniques Diploma from the Collège de la Région de l’Amiante (1995) . Ordre des géologues du Québec (circa 2002), Board of Directors of the Quebec Mineral Exploration Association (circa 2009). President of the Association des prospecteurs du Nord du Québec (circa 2012) BSc., Geology from the University of Quebec (1999)
Joseph Meagher, Chief Financial Officer & Director – Mr. Meagher is a Director at Triumvirate Consulting Corp., a financial consulting firm, where he specializes in accounting and financial reporting. Mr. Meagher currently serves as the Chief Financial Officer and a Director for several publicly listed companies. Prior to joining Triumvirate, Mr. Meagher worked at Smythe Ratcliffe LLP as a manager focusing on publicly listed and private company audits, as well as staff training and development. He was a member of Smythe Ratcliffe’s IFRS conversion team as well as a technical reviewer for complex accounting topics. Mr. Meagher holds a CPA, CA designation and a Bachelor of Commerce from the University of British Columbia.
Allan J. Folk, Director – Mr. Folk brings over 35 years of extensive leadership experience in the Canadian mining finance industry. During his career, he has financed and advised both junior and advanced Canadian companies at the senior board or executive level. Mr. Folk is a graduate of the University of Wisconsin, and currently is Vice President of Brant Securities Ltd. He is also a director of Barkerville Gold Mines Ltd., Interim CEO of Monarca Minerals Inc. and is the Chairman of Atlanta Gold Inc.
THE BOTTOM LINE
Having a high regard for the geological and exploration skills of geologist Dale Ginn, I wanted to follow this company when the markets turned in early 2016. Some good drill results early in that year drove the stock to levels that made it less attractive at the time compared to some others stories I was following. So I put Bonterra on the back burner. However, given the fact that the stock has not risen much at all despite the fact that so much has been accomplished since early 2016, I view this as a good time to pick up shares. By mid 2018, I anticipate a 2+ million-ounce high-grade deposit will have been outlined with the potential for much more upside from the new discoveries along trend to the southwest.
I believe a very strong high-grade underground mine at Gladiator is in the making. But that does not dismiss the company’s second very good asset, the Larder Lake Project, which will likely rise well over 1 million ounces once the Goldfields data is baked into the resource. With a lot of drill results to be reported between now and mid 2018 when a new and much larger resource will be reported, and with no need to raise additional capital until a new resource is reported, I believe this is a stock you may want to pay attention to, and pick up some shares during this period of weakness due to tax loss selling.
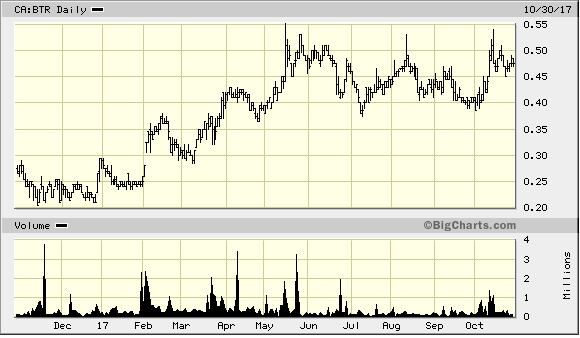
Business: Exploration and development of gold mining projects in Quebec and Ontario
Traded Toronto: BTR
USOTC: BONXF
Price 11/3/17: US$0.36
Shares Outstanding: 161.8 million
Market Cap: US$58.2 million
Insiders & Institutional Holdings: ~44%
- Eric Sprott 5%
- Kinross 5%
- Kirkland Lake 5%
- Van Eck Gold Fund 5%
- Osisko Gold Royalty 0%
Progress Rating: A3
Telephone: 604 678 5308
Website: www.Bonterraresources.com
________
J Taylor’s Gold, Energy & Tech Stocks (JTGETS), is published monthly as a copyright publication of Taylor Hard Money Advisors, Inc. (THMA), Tel.: (718) 457-1426. Website: www.miningstocks.com. THMA provides investment ideas solely on a paid subscription basis. Companies are selected for presentation in JTGETS strictly on their merits as perceived by THMA. No fee is charged to the company for inclusion. The currency used in this publication is the U.S. dollar unless otherwise noted. The material contained herein is solely for information purposes. Readers are encouraged to conduct their own research and due diligence, and/or obtain professional advice. The information contained herein is based on sources, which the publisher believes to be reliable, but is not guaranteed to be accurate, and does not purport to be a complete statement or summary of the available information. Any opinions expressed are subject to change without notice. The editor, his family and associates and THMA are not responsible for errors or omissions. They may from time to time have a position in the securities of the companies mentioned herein. No statement or expression of any opinions contained in this report constitutes an offer to buy or sell the shares of the company mentioned above. Under copyright law, and upon their request companies mentioned in JTGETS, from time to time pay THMA a fee of $250 to $500 per page for the right to reprint articles that are otherwise restricted solely for the benefit of paid subscribers to JTGETS.
To Subscribe to J Taylor’s Gold, Energy & Tech Stocks Visit: https://www.miningstocks.com/select/gold
Gold has largely been drifting sideways for the better part of a couple months now, sapping enthusiasm. Gold investment demand has stalled due to extreme stock-market euphoria. Investors aren’t interested in alternative investments led by gold when stocks seemingly do nothing but rally indefinitely. But once stock-market volatility inevitably returns, so will gold investment demand which fuels major gold uplegs.
Like nearly everything else in the global markets, gold prices are heavily dependent on investment capital flows. When investors are buying gold in a meaningful way, demand exceeds supply which drives gold’s price higher. When they’re materially selling, supply trumps demand thus gold’s price naturally retreats. The past couple months have been stuck in the middle, with gold investment flows neutral on balance.
The World Gold Council is the leading authority on global gold supply and demand, publishing quarterly Gold Demand Trends reports that offer the best fundamental reads available on the gold markets. The latest Q3’17 GDT was just released early yesterday morning. While it doesn’t cover the ongoing Q4 where gold is drifting, it does offer great insights into what’s happening with gold investment demand.
Overall world gold demand was quite weak in Q3, dropping 8.6% YoY to 915.0 metric tons. That made for an 86.1t absolute drop. Investment demand, though it only accounted for just over a quarter of the total, was responsible for this entire demand decline. Gold investment demand plunged 27.9% YoY in Q3, or 93.4t! The WGC further breaks down that category into bar-and-coin demand and ETF demand.
The traditional physical-bar-and-coin gold demand was actually quite strong in Q3, surging 16.9% YoY to 222.3t. That’s up a healthy 32.1t YoY. But the stock-market gold demand via exchange-traded funds far more than offset this, plummeting an astounding 86.9% YoY or 125.4t! If ETF demand had been stable in Q3, overall global gold demand would’ve climbed a healthy 3.9% YoY. Gold has stalled because of ETFs.
Gold exchange-traded funds act as conduits enabling vast amounts of stock-market capital to slosh into and out of physical gold bullion. These big changes in collective buying or selling really move gold. Since the gold ETFs seek to mirror the underlying gold price, they have to shunt excess ETF-share supply or demand directly into actual gold bars. There’s no other way for gold ETFs to successfully track their metal.
The world’s leading and dominant gold ETF is the venerable American GLD SPDR Gold Shares. Every quarter the World Gold Council also ranks the world’s top-ten gold ETFs. At the end of Q3, GLD alone accounted for a whopping 36.9% of their total gold-bullion holdings! GLD was 3.8x larger than its next biggest competitor, which is the American IAU iShares Gold Trust. GLD is the behemoth of the gold-ETF world.
The supply and demand of GLD shares, and all gold ETFs, are totally independent from underlying gold’s own supply and demand. So when stock investors buy GLD shares faster than gold is being bought, the GLD share price starts decoupling from gold to the upside. That is unacceptable, as GLD would fail its mission to track gold. So GLD’s managers must vent this differential buying pressure directly into gold.
They do this by issuing sufficient new GLD shares to meet the excess demand. All the money raised by these GLD-share sales is then plowed into physical gold bars that very day. This mechanism enables stock-market capital to flow into physical gold. Of course this is a double-edged sword, as excess GLD-share selling pressure forces this ETF to sell real gold bars to raise the capital to buy back its share oversupply.
What American stock investors are doing with GLD shares is the primary driver of gold’s trends! GLD has grown massive since its launch 13 years ago this month, and acts as a direct pipeline into gold for the immense pools of stock-market capital. So nothing is more important for gold prices now than GLD inflows and outflows. These are very transparent, as GLD reports its physical-gold-bullion holdings daily in great detail.
I call stock-market capital inflows into GLD as evidenced by rising holdings builds, and outflows as seen by falling holdings draws. In recent years there have been plenty of quarters where GLD builds and draws accounted for the entire global change in gold demand! That wasn’t the case in Q3 though. While the world gold-ETF demand fell 125.4t YoY, GLD’s holdings were actually up 12.1t in Q3. So gold edged up 1.4%.
But if American stock investors had been buying or selling GLD shares aggressively, gold certainly would’ve risen or fallen accordingly. Gold has been drifting in recent months because GLD’s holdings are flat, with stock investors neither buying nor selling GLD shares at differential rates relative to gold. That’s why gold investment demand has stalled. GLD has grown into the tail that wags the global-gold-price dog!
Amazingly many if not most investors still don’t grasp GLD’s critical role in gold price trends. They attempt to understand today’s gold’s price action in historical pre-gold-ETF-era terms. But for better or for worse, the gold world is radically different now. GLD, and to a lesser extent the other large gold ETFs trading in foreign stock markets, changed everything. Gold investors ignoring GLD’s holdings are flying blind.
This chart drives home this critical point. It superimposes GLD’s daily physical-gold-bullion holdings in blue over the gold price in red. Carved into calendar quarters, gold’s performance in each one is noted above GLD’s quarterly holdings changes in both percentage and absolute terms. The correlation between GLD’s physical-gold-bullion holdings and gold prices is very strong. GLD capital flows explain much for gold.
Rising GLD holdings reveal stock-market capital is flowing into gold bullion via GLD, due to differential GLD-share demand. Conversely falling GLD holdings show stock-market capital coming back out of gold, thanks to differential GLD-share selling. When American stock investors are either buying or selling GLD shares at much-faster rates than gold is moving, their collective capital flows greatly impact its price.
This is readily evident in strategic and tactical terms. GLD’s holdings are highly correlated with gold price levels. American stock investors sold down GLD’s holdings in 2015, and gold fell in lockstep. But that all reversed sharply in early 2016, when stock investors flooded back into GLD which catapulted gold into a new bull. Gold kept surging as long as differential GLD-share demand persisted, then stalled when it abated.
After Trump’s surprise election win a year ago, stock investors dumped GLD shares at dizzying rates and gold plunged. Then since GLD’s holdings have largely drifted sideways on balance this year, so has gold. GLD capital flows and gold prices are joined at the hip. So what American stock investors are doing and likely to do with GLD shares collectively is absolutely critical for gaming where gold is likely heading next.
Thus the key question for gold investors is what motivates American stock investors to buy or sell GLD shares en masse? The answer is simple, stock-market fortunes. Gold is effectively the anti-stock trade since it tends to move counter to stock markets. So gold investment demand via GLD shares surges as stock markets suffer major selloffs, and withers when stock markets rally to lofty euphoria-generating highs.
The entire reason gold investment demand has stalled out in recent months, which has left gold drifting, is the extreme euphoria in US stock markets. Wall Street constantly claims there’s no euphoria, but that’s not true. The words “euphoria” and “mania” are often confused. Mania means “an excessively intense enthusiasm, interest, or desire”. In the stock markets, manias are associated with bubbles at bull-market tops.
Euphoria is a milder term meaning “a strong feeling of happiness, confidence, or well-being”. While the stock markets haven’t rocketed vertical in a mania, there’s no doubt euphoria is extreme. Investors feel happy and confident about stocks after this past year’s incredible Trumphoria rally. Polls now universally show investors are the most confident stocks will keep rallying over the next year since 2000, a bubble peak!
Following gold’s usual summer doldrums, gold investment demand as evidenced by rising GLD holdings was robust until late September. Differential GLD-share demand started petering out as the flagship S&P 500 stock index (SPX) started powering to seemingly-endless new record highs with no meaningful selloffs in between. Gold peaked at $1348 in early September right before the first SPX record close in 5 weeks.
The 43 trading days since then have seen a mind-boggling 23 record stock-market closes! The worst SPX down day in that entire surreal span was merely -0.5%, trivial. The SPX’s VIX implied-volatility fear gauge has averaged just 10.1 since then, exceedingly-low levels betraying extreme complacency. The stock investors as a herd don’t have a care in the world. They are totally convinced stocks can rally indefinitely.
So why bother with gold? Why prudently diversify stock-heavy portfolios with counter-moving gold if the perceived risk of a major stock-market selloff is nil? Investors have little interest in gold when the stock markets are trading near record highs after an exceedingly-long and exceptionally-massive bull. Gold investment demand has always had a strong negative correlation with stock-market fortunes, they are opposed.
That new Q3 GDT from the World Gold Council said overall global gold demand last quarter was actually the weakest since Q3’09. In Q3’17 the SPX powered 4.0% higher, seeing 15 new all-time record closes. Back in Q3’09, the stock markets were also exciting. Coming out of a once-in-a-century stock-panic low, the SPX rocketed 15.0% higher in that single quarter! Exciting stock markets really retard gold demand.
Conversely one of gold’s best global-demand quarters was Q1’16, when stock markets were weak. The SPX suffered two corrections in a row leading into early 2016, after going a near-record 3.6 years without a single one. The first 10 trading days of January that year ignited much fear. In that short span the SPX suffered serious down days of 1.5%, 1.3%, 2.4%, 1.1%, 2.5%, and 2.2%! So gold investment demand exploded.
Gold had been deeply out of favor before that, suffering a 6.1-year secular low in mid-December 2015 just after the Fed’s first rate hike of this cycle. GLD’s holdings slumped to a 7.3-year low of their own that same day. Yet once the stock markets started rolling over, investors were quick to remember gold’s role as the ultimate portfolio diversifier. Total global gold demand rocketed up 17.1% YoY or 185.8t in Q1’16!
American stock investors were overwhelmingly responsible, as GLD’s colossal 176.9t quarterly holdings build accounted for 95.2% of that total jump in world gold demand per the latest WGC data! Gold was catapulted into a new bull market on a mere couple of stock-market corrections. Q2’16 saw this major GLD-share buying momentum continue, with GLD’s 130.8t build alone driving gold’s entire 120.2t world demand growth.
Make no mistake, gold investment demand will explode again and drive gold sharply higher when today’s lofty hyper-complacent bubble-valued stock markets inevitably roll over again. Leading into Q1’16 the SPX corrections were only 12.4% and 13.3%, not serious. Corrections can grow as big as 20% before they become new bear markets. Imagine what an SPX selloff around 20% would do for gold investment demand.
And that’s coming far sooner than most think. Investors as a herd are always wrong at major market turning points. Major bull-market toppings are always marked with extreme euphoria just like today’s. Countless sentiment indicators are showing investors are now the most complacent or most bullish since late 2007 or early 2000. Those were the last bull-market toppings before brutal 49.1% and 56.8% SPX bears!
Stock-market bulls fail once valuations grow excessive. Over the past century and a quarter, the stock markets have averaged a 14x trailing-twelve-month price-to-earnings ratio which is fair value. Twice that at 28x is formally bubble territory, exceedingly dangerous. As October ended, the simple-average TTM P/E of all 500 SPX companies was a terrifying 30.1x! Stock markets can’t trade at bubble valuations for long.
But these super-bearish sentiment and fundamentals pale in comparison to what’s coming from the Fed and European Central Bank in 2018 and 2019. This stock bull grew so monstrous because major central banks were injecting hundreds of billions of dollars a year into markets via quantitative easing, which is a euphemism for money printing. Next year this QE stock-market rocket fuel will slam to a screeching halt.
A couple weeks ago I explained what’s coming in depth in an essay on the Fed and ECB strangling this stock bull. Because of the Fed’s new quantitative tightening reversing its QE, and the ECB just starting to taper its own QE bond buying, 2018 will see these dominant central banks effectively tighten by $950b compared to 2017! Then again in 2019 that will expand to another $1450b of tightening compared to this year.
The QE era that helped levitate stock markets is over, with $2.4t of central-bank liquidity that exists this year vanishing over the next couple years. There’s nothing more ominous for QE-inflated stock markets than the Fed starting to reverse QE through QT and the ECB greatly slowing its own QE. There’s simply no way possible that won’t eventually fuel a major stock-market selloff, a large correction or more likely a new bear.
When these stock markets roll over materially, when investors face a couple weeks of big down days like in January 2016, gold investment demand will explode again. Investors will stampede back to counter-moving gold to stabilize their bleeding stock-heavy portfolios. GLD’s holdings will soar again like they did in the first half of 2016, which catapulted gold 29.9% higher igniting a major new bull. Gold stocks fared far better.
The leading HUI gold-stock index skyrocketed 182.2% higher in essentially the first half of 2016 on that gold rally! When American stock investors aggressively buy GLD shares in response to stock-market selloffs reintroducing fear, gold surges and gold stocks soar. This well-worn pattern will play out again in the next major stock-market selloff. Once differential GLD-share buying resumes, gold is off to the races.
So if you want to understand why gold is doing what it’s doing and where it’s likely heading next, it’s imperative to follow GLD’s holdings. Stock investors’ capital flows into and out of gold via that key ETF conduit have utterly dominated recent years’ gold trends. Quite literally, gold is hostage to stocks! The higher the stock markets, the less gold investment demand. The more they sell off, the more gold demand surges.
With stock euphoria so extreme today after this past year’s incredible Trumphoria rally, gold investors need to focus on the stock markets. As long as stocks remain high which stalls gold investment demand, gold will likely continue to drift on balance. But once stocks sell off long and deep enough to rekindle sufficient fear, gold investment demand will explode again. Big GLD-share buying will catapult gold sharply higher.
Gold and especially its miners’ stocks remain deeply undervalued today due to the extreme stock-market euphoria. But that never lasts. Gold’s bull market will resume with a vengeance once American stock investors get interested in GLD shares again. That should coincide with the coming months’ major winter rally, the strongest seasonal span for gold and its miners’ stocks. Gold miners have enormous upside potential.
At Zeal our core mission has always been profitable real-world trading, so we doggedly focus on what’s actually moving the markets and why. And really since 2013, the dominant driver of gold’s fortunes has been American stock investors’ capital flows via GLD. Following GLD’s holdings and the stock-market trends driving them is crucial for all gold and gold-stock investors and speculators, enabling better trading decisions.
Staying informed is essential for market success, which is why we’ve long published popular weekly and monthly newsletters. They are easy to read and affordable, with an explicitly-contrarian focus to help you avoid being deceived by herd sentiment. They draw on my decades of experience, knowledge, wisdom, and ongoing research to explain what’s going on in the markets, why, and how to trade them with specific stocks. We’ve recommended and realized 967 newsletter stock trades since 2001, with average annualized realized gains including all losers of +19.9%! Subscribe today to get smarter and make better trades!
The bottom line is gold investment demand has stalled out in recent months, condemning gold to drift sideways. American stock investors in particular aren’t doing any differential GLD-share buying, which is essential to fuel gold uplegs. Mesmerized by the extreme stock-market euphoria, they no longer fear any material stock-market selloff. Thus they feel no need to diversify their portfolios with counter-moving gold.
But this anomaly can’t and won’t last for long. Sooner or later the hard bearish realities of bubble-valued stock markets and looming epic central-bank tightening will shatter today’s hyper-complacency. Then once again vast amounts of stock-market capital will migrate back into gold, catapulting it dramatically higher. As always the prudent contrarians who invest before the herd arrives will reap massive gains.
Adam Hamilton, CPA
November 10, 2017
Copyright 2000 – 2017 Zeal LLC (www.ZealLLC.com)
After a severe selloff, precious metals have enjoyed a bit of a respite. Corrections are a function of time and/or price. The correction to the recent selloff has been more in time than than price. Metals and miners have stabilized over the past nine trading days but have not rebounded much in price terms. Gold has barely rallied $20/oz while GDX and GDXJ have rebounded less than 4% and 5% respectively. In addition to the weakness of this rally, the gold stocks are sporting a negative divergence and that does not bode well for an end of the year rally.
The negative divergence is visible in the daily bar charts below. We plot Gold along with the gold stock ETF’s and are own “mini” GDXJ index. The price action in Gold since October looks constructive. The market has held its October low and the 200-day moving average. It could have a chance to reach $1300-$1310. However, the miners are saying no to that possibility. Everything from large miners to small juniors made a new low while Gold did not. The second negative divergence is in regards to the 200-day moving average.
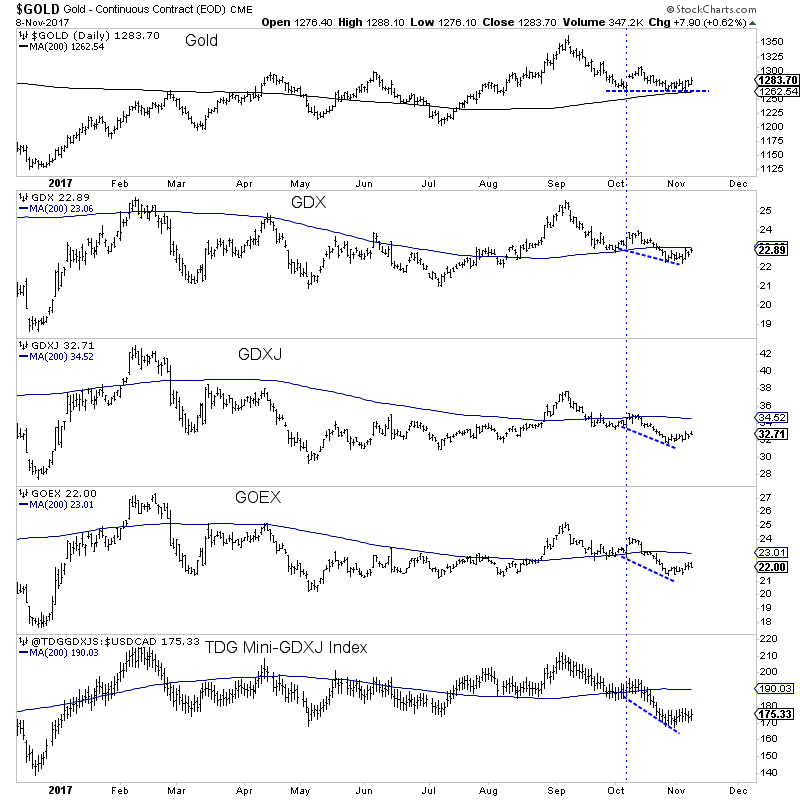
Gold has corrected $100/oz over the past seven weeks but the relevant sentiment indicators do not indicate much of a shift in sentiment. In the chart below we plot the net speculative position in Gold as a percentage of open interest (Gold CoT) and the GLD put-call ratio. The CoT remains elevated at 40%. The two important lows of the past 12 months occurred at 16% and 26%. The put-call ratio (which is smoothed by a 20-day moving average) has some work to do before it reaches a level associated with market lows. Finally, Gold is not oversold based on a simple 50-day ROC.
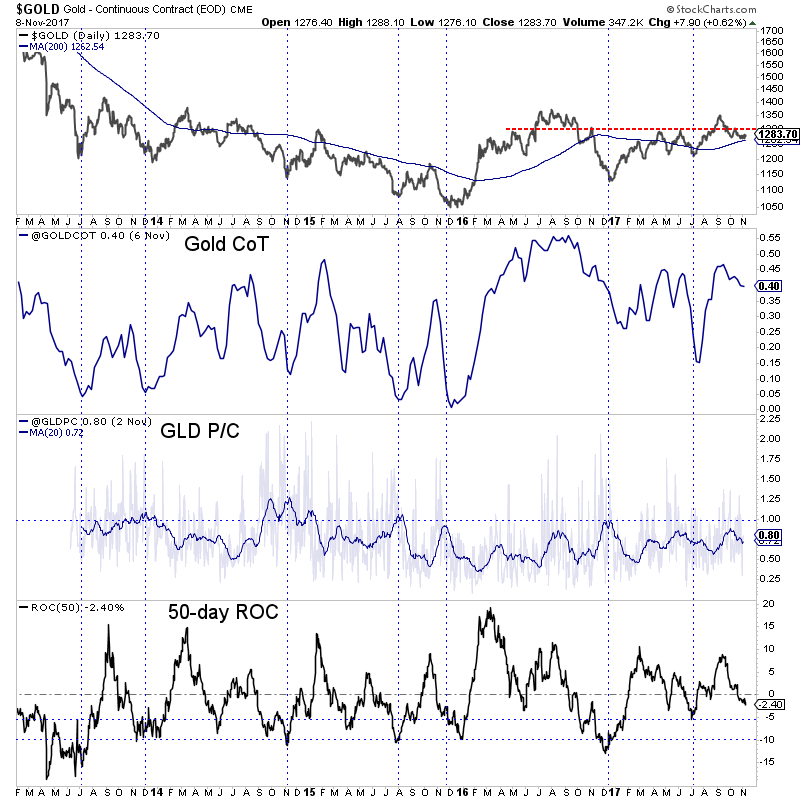
The relative weakness and negative divergence in the gold stocks coupled could portend to lower Gold prices by the end of 2017. Gold has important support at $1260 and if it loses that it threatens a decline to $1200-$1220. The gold stocks are lagging Gold across the board with the worst performers being the smaller juniors. Given the weak technicals and questionable fundamentals for Gold, we will continue to wait for lower prices, worse sentiment and a low risk buying opportunity in the coming months. The good news is those who buy weakness in the months ahead can position themselves for strong profits in 2018. In the meantime, find the best companies and evaluate their potential value and catalysts that will drive buying. To follow our guidance and learn our favorite juniors for 2018, consider learning more about our premium service.
Jordan Roy-Byrne CMT, MFTA
Jordan@TheDailyGold.com

The following interview of Lawrence Roulston, newly appointed non-executive Chairman of Metalla Royalty & Streaming was conducted by phone and email in the week ended November 5th. Lawrence has 35 years’ of diverse hands-on experience. He recently founded WestBay Capital Advisors, providing business advisory & capital markets expertise to the junior & mid-tier sectors of the mining industry.
From 2014 to 2016, he was President of Quintana Resources Capital, which provided resource advisory services for U.S. private investors, focused primarily on streaming transactions. Before Quintana, he was a mining analyst and consultant, as well as the editor of “Resource Opportunities”, an independent investment publication focused on the mining industry. He has graduate-level training in business and holds a B.Sc. in geology.
Regarding the appointment, detailed in a press release dated October 6, 2017, CEO Brett Heath commented as follows,
“Lawrence’s extensive knowledge of the resources industry, finance, and listed company governance makes him exceptionally well qualified to lead the Metalla Board in helping to deliver long-term, sustainable returns for the Company’s shareholders”
Metalla has a lot going on, without further ado, here’s a timely update on the Company.
Can you please give readers a high-level overview of what Metalla Royalty & Streaming does, and what assets it owns?
Metalla acquires royalties and streams on gold and silver deposits. A royalty is a fixed percent of the revenue produced from a mine; a stream is the right to purchase a portion of the metal output from a mine at a fixed price. Royalties and streams both offer upside exposure to increases in the metal prices, and to exploration success (they are typically for the life of the mine).
Importantly, because royalties and streams are based on revenues, they do no expose investors to operating costs and to capital costs.
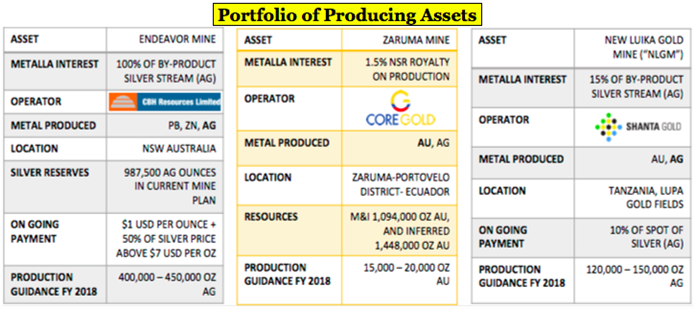
Metalla currently owns three cash-flowing assets, including a royalty on a gold mine in Ecuador; we have part of a stream that involves all the silver produced at a gold mine in Tanzania, for a fixed price of 10% of the silver spot price. We also have the right to buy all the silver byproduct from a big zinc mine in Australia, for a price of about $6 an ounce. We also hold gold-silver royalties on three development-stage projects, two of which are in Canada.
We expect those development projects to generate cash in the next 1-5 years: Two involve extensions of existing mines and one development asset that will have ore trucked to a nearby processing plant. All of them are operated by large producers. We own another dozen royalties on earlier stage projects, mostly in Canada.
How did you find Metalla Royalty & Streaming, or did MTA find you?
I had known 2 of the directors for several years. In addition to being very familiar with the mining industry, I had particular experience in royalties and streaming, most recently as President of Quintana Resources Capital. In that role, I helped a Texas oil family and another big private investment group to set up an investment vehicle that was aimed at streaming. So, it was a good fit.

Please tell readers about other key members of your team, including Brett Heath, E.B. Tucker & Charles Beaudry?
E.B. is Editor of the Casey Report. He has 15 years’ experience in fund management and security analysis. Charles is a Canadian P.Geo. with over 30 years’ experience in project generation, business development, exploration and project management.
Brett, the CEO, has many years of experience in putting deals together in the mining industry. He did an outstanding job to buy the royalty package from Coeur Mining, which made the major our largest shareholder. He is now working with other large mining companies on similar deals.
The latest FY quarterly earnings (as of August 31st) were released on October 26th, can you hit upon the highlights? When will Metalla be cash flow positive?
Metalla is now cash flow positive. When including all production (and inventory) for June, July & August, the Company produced 115,667 ounces of silver with an average cash margin of over US$10. We expect next quarter to be even better as the Endeavor operation ramps up.
How can a company with a market cap of only [~C$ 42 M = ~US$ 33 M] operate in the Royalty & Streaming business alongside billion dollar companies like Franco-Nevada, Wheaton Precious Metals & Royal Gold?
Those larger companies, with values from U$5 to U$15 billion, are focused on larger deals. Wheaton’s last deal, for example, was a year ago and involved the acquisition of additional 25% gold stream on the Salobo mine in Brazil for total upfront consideration of $800 million. There aren’t a lot of deals around of that size, and so the deals that do come along are intensely competitive.
We are looking at deals that are under the radar of the larger companies. The purchase price on the Coeur deal, for example, was US$13 million. That size of deal is of no interest to the larger players, but by putting a few of them together, we are well on our way to building a company.
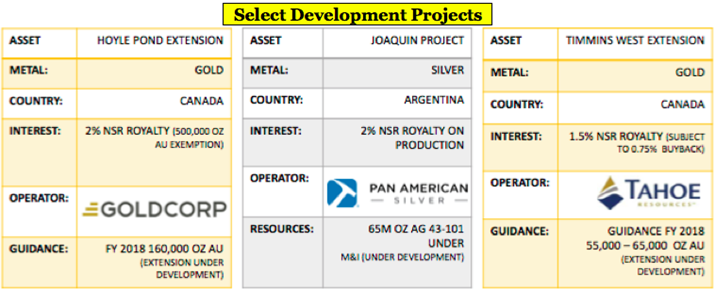
As a highly experienced investor & research analyst in natural resource companies, how does Metalla stack up against other precious metals juniors?
It is one of the very few juniors that is cash flow positive. Metalla is diversified, with 18 separate precious metals royalties or streams, most of which already have a resource outlined. With the deals now in hand, Metalla has a solid base of cash flow from 3 mines, and a very strong organic growth pipeline, with 3 other projects already in the development stage. Those assets put the company in a very strong position to make further acquisitions and continue to grow.
Can you comment on your Company’s acquisition pipeline? What kinds of deals, in what metals, in what jurisdictions, are you looking at?
We have great relationships with majors, mid-tiers, and juniors regarding their non-core royalties. The majors specifically grew over the past decade through mergers and acquisitions. Along the way, they picked up a lot of assets that are now non-core.
With Coeur, for example, they looked at the value of what to them were small assets, and compared that to the value of owning a piece of Metalla. They elected to convert the steady cash flow to a stake in a company that they saw as having potential to greatly appreciate in value. We expect to be able to repeat that success.
Do you care to comment on precious metals prices, where they might be headed? Does Metalla need the gold & silver price to move higher for its share price to perform well?
Deep down, we believe in higher precious metal prices. But, we are very pragmatic. Anything we do has to make good sense at the current metal prices. Our plan is to create substantial shareholder value based on current prices. We are continuing to add to our inventory of gold and silver ounces that we have access to via royalties and streams.
We are committed to enhancing the cash flow that we generate. In that way, we will increase shareholder value, aside from whatever happens to the metal prices. Any gain in the gold or silver price will add to what should already be an attractive investment.
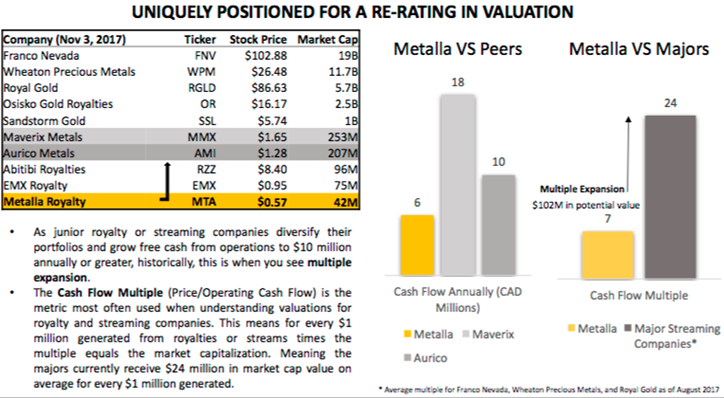
Do you have a view on the cryptocurrency craze (bitcoin / ethereum, etc), a view on if that market is pulling investors away from junior metals & mining stocks?
A lot of investors in precious metals are attracted by the tangible nature of gold and silver; hard assets, if you will. Those folks aren’t likely to give that up for the abstraction of block chains. There are some junior mining speculators who may take an interest, but those are not the people we are targeting to invest in a cash-flowing company based on gold and silver.
When your team acquired the assets from Coeur Mining this summer, there was talk about extending the mine life of the Endeavor mine. Can you update readers on the status of that initiative?
The Endeavor zinc mine is a small unit of a big Japanese metals smelting and refining group, so there is little news about the mine itself. As part of the due diligence process, I visited Endeavor and toured the underground mine and the processing facility. I had meetings with the onsite management, the geological, engineering and processing teams, as well as senior corporate management of the mining division.
They are very committed to extending the mine life. Management is presently evaluating a target zone just below the current mining area. There is clearly a lot of metal down there and they are conducting a Feasibility Study aimed at developing that zone. When I was there, they were quite positive on the potential. At that time, the zinc price was $1.10/lb.
Today, the zinc price is nearly $1.50/lb. One would have to believe that if it was attractive at $1.10, it would be even more so at nearly $1.50. That zone could add several years to the mine life. And, they are continuing to explore the property for additional deposits.
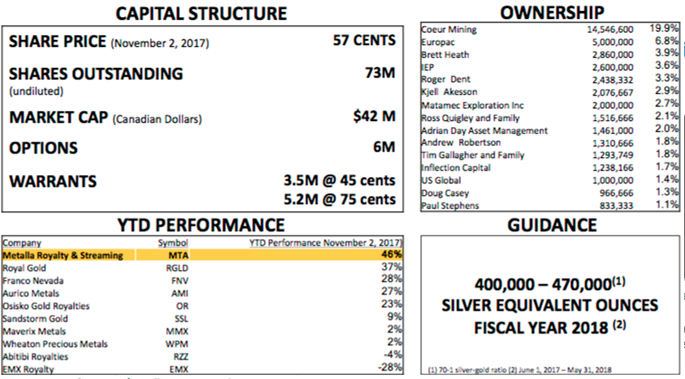
We valued this deal on the basis of a 2-yr mine life. Anything beyond 2 years is a bonus, and it is now looking highly likely that the mine life will extend well into the future. That would be huge, as investors are giving us no value for anything beyond the initial mine life.
There have been indications by CEO Brett Heath that a cash dividend could be in the works. Does it make sense for a high-growth company to distribute cash to shareholders?
Given that the majority of our counter-parties prefer to hold Metalla shares instead of receiving cash, it allows the Company to grow exponentially with much less financing risk compared to peers. We feel linking a portion of cash flow to dividends is necessary to give shareholders true exposure to gold and silver prices. There are plenty of small cap resource companies that will never return any capital to shareholders.
We want to stand out among this group. We also plan to reinvest a portion of the cash into more accretive transactions. An announcement will be coming before year-end.
To sum things up, why should readers take the time to do further due diligence on Metalla Royalty & Streaming? Is there a reason to consider buying shares sooner, rather than later?
Metalla offers shareholders exposure to gold & silver, without operating cost and capital cost risk. We are cash flowing, with excellent prospects for further acquisitions, which would add substantial value in the near term. We are now working hard to put together that next deal.
This story is not well known, and is not well understood. (For example, we get no credit for an extended mine life in Australia.)
So far, we have only had a single quarter of cash flow. The next quarter will confirm that we are generating cash flow, and that the cash flow from the existing deals is growing. Enhanced investor awareness and the potential for another deal should see the share price begin to move in the near term.
Thank you Lawrence, this was very interesting. I look forward to following events unfold over the next few months.
Disclosures: The content of this interview is for illustrative and informational purposes only. Readers fully understand and agree that nothing contained herein, written by Peter Epstein of Epstein Research, [ER] including but not limited to, commentary, opinions, views, assumptions, reported facts, estimates, calculations, etc. is to be considered implicit or explicit, investment advice. Further, nothing contained herein is a recommendation or solicitation to buy or sell any security. Mr. Epstein and [ER] are not responsible for investment actions taken by the reader. Mr. Epstein and [ER] have never been, and are not currently, a registered or licensed financial advisor or broker/dealer, investment advisor, stockbroker, trader, money manager, compliance or legal officer, and they do not perform market making activities. Mr. Epstein and [ER] are not directly employed by any company, group, organization, party or person. Shares of Metalla Royalty are speculative, not suitable for all investors. Readers understand and agree that investments in small cap stocks can result in a 100% loss of invested funds. It is assumed and agreed upon by readers that they consult with their own licensed or registered financial advisors before making investment decisions.
At the time this article was posted, Peter Epstein owned shares in Metalla Royalty and the Company was an advertiser on [ER]. By virtue of ownership of the Company’s shares and it being an advertiser on [ER], Peter Epstein is biased in his views on the Company. Readers understand and agree that they must conduct their own research, above and beyond reading this article. While the author believes he’s diligent in screening out companies that are unattractive investment opportunities, he cannot guarantee that his efforts will (or have been) successful. Mr. Epstein & [ER] are not responsible for any perceived, or actual, errors including, but not limited to, commentary, opinions, views, assumptions, reported facts & financial calculations, or for the completeness of this article. Mr. Epstein & [ER] are not expected or required to subsequently follow or cover events & news, or write about any particular company or topic. Mr. Epstein and [ER] are not experts in any company, industry sector or investment topic.

1. The synergistic relationship between gold and economic growth is quite healthy, and poised to become even more healthy in 2018 – 2019.
2. Please click here now. Double-click to enlarge this fabulous South Korean stock market ETF chart.
3. Big name Western money managers are finally racing to move money into Asian markets, and this is great news for both gold and global stock markets.
4. For several years I’ve recommended that the gold community slightly reduce (but not drop) their focus on gold’s Western world fear trade and increase their focus on the Eastern stock markets and the love trade for gold.
5. South Korea’s stock market sports 50% earnings growth and a P/E ratio of just 10! Japan’s market is also red hot, and so are the markets of China and India.
6. US markets have risen strongly, but with anemic economic growth and nosebleed valuations. Growth is vastly stronger in Asia, but without European and US money manager participation, Asian stock markets have previously languished.
7. This situation has changed dramatically in 2017, and 2018 should see an acceleration of this new trend.
8. The bottom line: American markets are hot but overvalued. Asian markets are red hot but not overvalued.
9. I own ETFs (and some individual stocks) in the “Big Four” Asian markets; India, China, Japan, and Korea. I urge all Western gold bugs to “get with the (good) times”. The fear trade for gold will never disappear, but it’s a new era, and this new era is dominated by Asia.
10. Investors should be very comfortable owning Asian stock markets and gold… at the same time. The bottom line: America isn’t out, but Asia is in!
11. When times are good (and they are now very good in Asia), Asians buy more gold. Exponentially more. Chinese demand reflects this fact. It’s rising again; demand is up almost 20% over 2016, and poised to rise even more strongly in 2018.
12. Please click here now. Next, please click here now. Double-click to enlarge this daily gold chart.
13. Technically, gold’s rally ended in early September because of significant resistance at $1362 (the demonetization night high).
14. Fundamentally, gold peaked then because of the Modi government’s August 23rd launch of the hideous PMLA program. That launch immediately sent Indian imports plunging towards the zero marker. When Indian gold imports sink, the price of gold sinks. It’s that simple.
15. The good news: The government has rescinded PMLA and imports are growing again. Wedding season is beginning and Chinese New Year buy season approaches. As a result, the price is showing firmness, and a gold price rally appears imminent.
16. I’ve predicted that Indian GDP growth should hit 10% by 2020. America’s could fall to 1% by then while US inflation starts surging and gold mine production shrinks noticeably. This is an epic win-win situation for gold.
17. Sentiment in the gold and hedge fund communities is now generally negative, as it always is when significant rallies begin.
18. Please click here now. Double-click to enlarge. There’s a bear wedge in play on this dollar-yen chart now, which is more good news for all gold price enthusiasts. The commercial traders are also adding to their short positions in the dollar against both the yen and the Swiss franc.
19. Please click here now. Double-click to enlarge this GDX chart. There’s a modest head and shoulders top pattern in play, and that has a lot of old timer gold bugs nervous.
20. Unfortunately, these old timers may be too obsessed with the Western fear trade era of the past, and missing out on the Asian stock markets and gold price synergy that defines the new gold bull era.
21. Minor H&S top patterns like this one are irrelevant in the big picture, and this one may be getting technically voided anyways.
22. On that note, please click here now. Double-click to enlarge. This is just what the gold bug doctor ordered, to spread some bull era cheer!
23. A fabulous bull wedge pattern is destroying the H&S top pattern, which makes sense given the great fundamental action taking place in India and China.
24. Owning the “Big Four” stock markets of India, China, Korea, and Japan while engorging on gold, silver, gold stocks (with some bitcoin for extra wealth building fun), is perhaps the greatest “no-brainer” investor play in the history of markets!
Special Offer For Website Readers: Please send me an Email to freereports4@gracelandupdates.com and I’ll send you my free “All Aboard The Golden Train!” report. I highlight eight must-own gold stocks, growth stocks, and key ETFs to participate in the biggest upside markets action from now until December 2018!
Thanks
Cheers
St
Stewart Thomson
Graceland Updates
https://www.gracelandupdates.com
https://gracelandjuniors.com
www.guswinger.com
Email:
stewart@gracelandupdates.com
Risks, Disclaimers, Legal
Stewart Thomson is no longer an investment advisor. The information provided by Stewart and Graceland Updates is for general information purposes only. Before taking any action on any investment, it is imperative that you consult with multiple properly licensed, experienced and qualified investment advisors and get numerous opinions before taking any action. Your minimum risk on any investment in the world is: 100% loss of all your money. You may be taking or preparing to take leveraged positions in investments and not know it, exposing yourself to unlimited risks. This is highly concerning if you are an investor in any derivatives products. There is an approx $700 trillion OTC Derivatives Iceberg with a tiny portion written off officially. The bottom line:
Are You Prepared?
The gold miners’ stocks have largely ground sideways this year, consolidating their massive 2016 gains. That lackluster trading action, along with vexing under performance relative to gold, has left gold stocks deeply out of favor. But these uninspiring technicals and resulting bearish sentiment should soon shift. The gold stocks are just now entering their strongest seasonal rally of the year, the super-bullish winter rally.
Gold-stock performance is highly seasonal, which certainly sounds odd. The gold miners produce and sell their metal at relatively-constant rates year-round, so the temporal journey through calendar months should be irrelevant. Based on these miners’ revenues, there’s little reason investors should favor them more at certain times of the year than others. Yet history proves that’s exactly what happens in this sector.
Seasonality is the tendency for prices to exhibit recurring patterns at certain times during the calendar year. While seasonality doesn’t drive price action, it quantifies annually-repeating behavior driven by sentiment, technicals, and fundamentals. We humans are creatures of habit and herd, which naturally colors our trading decisions. The calendar year’s passage affects the timing and intensity of buying and selling.
Gold stocks exhibit strong seasonality because their price action mirrors that of their dominant primary driver, gold. Gold’s seasonality generally isn’t driven by supply fluctuations like grown commodities experience, as its mined supply remains fairly steady all year long. Instead gold’s major seasonality is demand-driven, with global investment demand varying dramatically depending on the time within the calendar year.
This gold seasonality is fueled by well-known income-cycle and cultural drivers of outsized gold demand from around the world. And the biggest seasonal surge of all is just now getting underway heading into winter. As the Indian-wedding-season gold-jewelry buying that drives this metal’s big autumn rally winds down, the Western holiday season is ramping up. The holiday spirit puts everyone in the mood to spend money.
Men splurge on vast amounts of gold jewelry for Christmas gifts for their wives, girlfriends, daughters, and mothers. The holidays are also a big engagement season, with Christmas Eve and New Year’s Eve being two of the biggest proposal nights of the year. Between a quarter to a third of the entire annual sales of jewelry stores come in November and December! And jewelry historically dominates overall gold demand.
According to the World Gold Council, between 2010 to 2016 jewelry accounted for 49%, 44%, 45%, 60%, 58%, 57%, and 47% of total annual global gold demand. That averages out to just over half, which is much larger than investment demand. During those same past 7 years, that ran 39%, 37%, 34%, 18%, 20%, 22%, and 36% for a 29% average. Jewelry demand remains the single-largest global gold demand category.
That frenzied Western jewelry buying heading into winter shifts to pure investment demand after year-end. That’s when Western investors figure out how much surplus income they earned during the prior year after bonuses and taxes. Some of this is plowed into gold in January, driving it higher. Finally the big winter gold rally climaxes in late February on major Chinese New Year gold buying flaring up in Asia.
So during its bull-market years, gold has always tended to enjoy major winter rallies driven by these sequential episodes of outsized demand. Naturally the gold stocks follow gold higher, amplifying its gains due to their great profits leverage to the gold price. Today gold stocks are once again now heading into their strongest seasonal rally of the year driven by this robust winter gold demand. That’s super-bullish!
Since it’s gold’s own demand-driven seasonality that fuels the gold stocks’ seasonality, that’s logically the best place to start to understand what’s likely coming. Price action is very different between bull and bear years, and gold is absolutely in a young bull market. After being crushed to a 6.1-year secular low in mid-December 2015 on the Fed’s first rate hike of this cycle, gold powered 29.9% higher over the next 6.7 months.
Crossing the +20% threshold in early March 2016 confirmed a new bull market was underway. Gold corrected after that sharp initial upleg, but normal healthy selling was greatly exacerbated following Trump’s surprise election win. Investors fled gold to chase the Trumphoria stock-market surge. Gold’s correction cascaded to monstrous proportions, hitting -17.3% in mid-December. But that was shy of a new bear’s -20%.
Gold’s last mighty bull market ran from April 2001 to August 2011, where it soared 638.2% higher! And while gold consolidated high in 2012, that was technically a bull year too since gold just slid 18.8% at worst from its bull-market peak. Gold didn’t enter formal bear-market territory at -20% until April 2013, thanks to the crazy stock-market levitation driven by extreme distortions from the Fed’s QE3 bond monetizations.
So the bull-market years for gold in modern history ran from 2001 to 2012, skipped the intervening bear-market years of 2013 to 2015, and resumed in 2016 to 2017. Thus these are the years most relevant to understanding gold’s typical seasonal performance throughout the calendar year. We’re interested in bull-market seasonality, because gold remains in its young bull today and bear-market action is quite dissimilar.
This chart averages the individually-indexed full-year gold performances in those bull-market years from 2001 to 2012 and 2016. 2017 isn’t included in this analysis yet since it remains a work in progress. This chart distills out gold’s bull-market seasonal tendencies in like percentage terms. Quantifying gold’s bull-market seasonal tendencies requires all relevant years’ price action to be recast to be perfectly comparable.
That’s accomplished by individually indexing each calendar year’s gold price action to its final close of the preceding year, which is recast at 100. Then all gold price action of the following year is calculated off that common indexed baseline, normalizing all years regardless of price levels. So gold trading at an indexed level of 105 simply means it has rallied 5% from the prior year’s close, while 95 shows it’s down 5%.
This methodology renders all bull-market-year gold performances in like percentage terms. That’s critical since gold’s price range has been so vast, from $257 in April 2001 to $1894 in August 2011. Finally each calendar year’s individually-indexed gold prices are averaged together to arrive at this illuminating gold-bull seasonality. Gold has always had a strong tendency to enjoy major winter rallies, starting right about now.
During its modern bull-market years from 2001 to 2012 and 2016, gold’s major winter rally started on average in late October. Technically gold’s key seasonal bottom averaged being carved on that month’s 16th trading day, which was October 23rd this year. From there gold surges into its strongest seasonal rally of the year. Between late October and late February in these bull years, gold blasted 9.5% higher on average!
These big winter-rally seasonal gains are much larger than the 3.8% and 6.9% averages seen in gold’s other major seasonal rallies in spring and autumn. That makes late October one of the best times of the year to deploy capital into gold. That Western holiday gold-jewelry buying fuels such outsized demand that November has long proved one of gold’s best months of the year with average bull-year gains of 3.1%.
While this bullish gold seasonality really moderates in December with an average 0.6% bull-year gain, it soon accelerates again in January on that surplus-income gold investment buying. The 2.9% average gain gold enjoyed in January during those bull years between 2001 to 2012 and 2016 makes for this metal’s third best month of the calendar year. This winter-rally span is when gold enjoys peak seasonal tailwinds.
Unfortunately the great majority of speculators and investors remain wary of deploying into gold to ride its strong seasonal winter rally. Just like the last couple years, traders are worried about the Fed’s next rate hike once again very likely in mid-December. Gold-futures speculators in particular have spent recent years fooling themselves into believing Fed rates hikes are gold’s mortal nemesis, despite history proving that totally false.
The record is crystal-clear, gold actually thrives during Fed-rate-hike cycles! Before today’s there have been 11 since 1971, and gold has averaged impressive 26.9% gains across the exact spans of all these Fed-rate-hike cycles. In the majority 6 of these where gold actually rallied, its average gains were a staggering 61.0%! In the other 5 where gold retreated, its average losses were an asymmetrically-small 13.9%.
Gold blasted higher during Fed-rate-hike cycles when they started with gold relatively low, and unfolded at a gradual pace. Gold not only entered today’s 12th modern rate-hike cycle at major secular lows, but the Fed has never been slower in raising rates. Gold is still up 20.2% cycle-to-date since the day before the Fed finally started hiking again in December 2015. Fed rate hikes are bullish for gold, contrary to the myths.
During its last rate-hike cycle between June 2004 to June 2006, the FOMC hiked at 17 consecutive meetings for a total of 425 basis points! That more than quintupled the federal-funds rate to 5.25%, an inconceivably-high level today. Even though that was a very-aggressive rate-hike cycle, gold still managed to power 49.6% higher over that exact span! Rate hikes are no threat to gold’s strong winter seasonals.
Meanwhile investors remain distracted by this past year’s absurd Trumphoria rally, which is retarding gold investment demand. When stock markets melt up to endless record highs drenched in stellar complacency, investors aren’t interested in prudently diversifying into gold. Since gold tends to move counter to stock markets, investment demand surges when stocks weaken. A stock correction ignited this young gold bull.
As the Fed’s surreal stock-market levitation cracked in early 2016, American stock investors flocked to gold via shares in the flagship GLD SPDR Gold Shares gold ETF. When they buy its shares faster than gold itself is being bought, this ETF’s managers must issue sufficient new shares to offset all this excess demand and maintain gold tracking. The proceeds from these GLD-share sales are then used to buy gold bullion.
Thus GLD holdings builds show stock-market capital migrating into gold. In 2016 massive differential GLD-share buying drove a 28.0% or 179.8 metric-ton holdings build, helping drive gold 8.5% higher. But year-to-date in 2017, GLD’s holdings are only up 3.3% or 27.4t. Despite that gold is still impressively up 10.9% YTD, but it will surge dramatically when investment demand returns as these euphoric stock markets roll over.
That day of reckoning is inevitable. Back in late September the Fed finally started unwinding its trillions of dollars of quantitative easing that levitated stock markets for years. Quantitative tightening has never before been attempted, and it is exceedingly ominous for QE-inflated stock markets. While QT is starting small, it will ramp up to a $50b-per-month pace in Q4’18. That accelerating QT juggernaut will strangle stocks.
When these lofty Trumphoria-fueled stock markets finally mean revert, investors’ capital will flood back into gold for prudent portfolio diversification. If that happens in the coming months, it will really amplify gold’s strong winter seasonals. But gold’s biggest seasonal rally doesn’t need to be kick started by flight capital from bubble-valued stock markets. All that’s necessary is November’s usual outsized gold-jewelry demand.
So neither speculators’ Fed-rate-hike fears nor investors’ current apathy towards gold thanks to record stock markets are likely to short circuit gold’s strong winter rally this year. And if gold’s bull-market seasonals again prevail, that’s super-bullish for gold stocks in the coming months! They also enjoy strong winter seasonals thanks to gold’s, because gold miners’ profitability and thus stock prices leverage gold’s price action.
This next chart applies this same bull-market-seasonality methodology to the leading benchmark HUI NYSE Arca Gold BUGS Index. Naturally gold-stock seasonals closely mirror gold’s, so the miners too are also just entering their strongest seasonal rally of the year. On average in those last bull-market years from 2001 to 2012 and 2016, the HUI powered a big 15.4% higher between late October and late February!
Gold stocks’ strong 15.4% average winter rally bests their 14.0% and 11.2% rallies heading into spring and autumn. On average gold stocks’ major seasonal bottoming heading into their winter rally arrives on October’s 19th trading day, which translated into October 26th this year. Like their primary driver gold, gold stocks tend to rally strongly in November, moderate in December, and then surge again in January and February.
And given the sentimental, technical, and fundamental setups for gold stocks entering this year’s winter rally, the usual seasonal tailwinds are likely to help propel them much farther than usual. Just like gold and because of it, gold stocks entered a mighty new bull market early in 2016 as well. Between mid-January and early August last year, the HUI soared 182.2% higher in just 6.5 months! It was a wildly-profitable run.
That left the red-hot gold stocks very overbought last summer, then they got sucked into gold’s correction. Just like gold, their correction ballooned to monstrous proportions thanks to that post-election Trumphoria stock rally’s impact on gold investment demand. At worst the HUI plunged 42.5% in 4.4 months, a brutal drop. But ever since then gold stocks consolidated sideways on balance, recently seeing major upside breakouts.
But after surging 8.4% in August, the very next month the gold stocks were whacked back down 7.5% in sympathy with gold. Gold-futures speculators fled as futures-implied Fed-rate-hike odds at its upcoming mid-December meeting skyrocketed from 32% to 83% in less than three weeks! So the HUI spent late September and much of October languishing under 200, low technical levels breeding bearish sentiment.
The gold stocks are now entering their seasonally-strongest time of the year deeply out of favor at weak prices. These are powerful buy signals within ongoing bull markets, really upping the odds this year’s new winter rally will prove exceptionally large. Bullish sentiment and technicals really amplify the usual seasonal tailwinds. Even better, the gold miners’ fundamentals are all lined up to drive major gains in coming months.
Every quarter I analyze the operating performances of the top individual gold miners’ stocks included in the leading gold miners’ ETFs. These of course are the GDX VanEck Vectors Gold Miners ETF for the larger majors, and its sister GDXJ VanEck Vectors Junior Gold Miners ETF for the smaller juniors. The gold miners are now in the midst of reporting their Q3’17 earnings season, which should end up being impressive.
As always I’ll write comprehensive essays analyzing the latest quarterly results from the top GDX and GDXJ components once they finish reporting in mid-November. But a few weeks ago I gave a preview of what they are likely to collectively report based on average gold prices and Q3 seasonals in production and costs. Crunching the numbers for GDX yields big potential Q3’17 quarter-on-quarter profits growth around 14%!
Thus as the rest of the gold miners report their Q3’17 results by mid-November, there will likely be plenty of upside surprises. That includes higher production, lower costs, and better full-year-2017 guidance for the gold miners than today’s bearish traders expect. So good fundamentals could supercharge this first month of gold stocks’ winter rally this year. Improving fundamentals aligning with seasonals portends big upside!
If the gold stocks were entering this winter-rally period drenched in greed after a major upleg, seasonal tailwinds probably couldn’t overcome the healthy correction tendency. If the gold miners’ fundamentals were deteriorating, that would likely prove too much heavy lifting for seasonals. But with the strong winter-rally seasonals synchronizing with very bullish technicals, sentiment, and fundamentals, gold stocks should surge.
This last chart breaks down gold-stock seasonality into more-granular monthly form. Each calendar month between 2001 to 2012 and 2016 is individually indexed to 100 as of the previous month’s final close, then all like calendar months’ indexes are averaged together. While this November-to-February winter-rally period doesn’t encompass most of gold stocks’ strongest months, it does enjoy the most-consistent gains.
On average in bull-market years, November enjoys the fifth-best gold-stock gains of the calendar year at 4.6% in HUI terms. That’s not far off August’s and September’s average bull-market-year rallies of 4.7% and 4.8%, weighing in at fourth and third. May is better yet, ranking second at 5.3%. But gold stocks’ second-, third-, and fourth-best months are largely surrounded by flat or lower months offsetting those big gains.
That’s not the case during gold stocks’ winter-rally months, where the solid-gains streak persists for the whole time. November’s 4.6% average gains are followed by December’s respectable 2.3%, January’s accelerating 3.1%, and February’s massive first-place 6.2%! This unbroken winter-rally streak is what makes this period between late October and late February the best time of the year to be heavily long gold stocks.
There is no other seasonal streak with such unparalleled consistency of big gold-stock gains. Since they continue to march higher on balance throughout their winter-rally span, it yields the best seasonal gains of the calendar year. The rest of the year’s two-steps-higher-one-step-back action just doesn’t happen during the winter on average. There are no significant gold-stock selloffs in this amazing winter-rally span!
Of course the standard seasonality caveat applies that these are mere tendencies, not primary drivers of gold or gold stocks. Seasonal tailwinds can be easily drowned out by bearish sentiment, technicals, and fundamentals. Seasonality doesn’t always work, especially when it doesn’t align with the primary drivers of sentiment, technicals, or fundamentals in that order. Thankfully that certainly isn’t the case this year.
The gold miners’ stocks aren’t heading into November at overbought levels following a major upleg, thus sentiment is quite bearish. And with the HUI up just 2.2% YTD compared to gold’s 10.9% gains, the gold stocks are far underperforming the dominant driver of their earnings. Their big profits leverage usually translates into upside running 2x to 3x gold’s, so they are overdue to mean revert much higher to normalize.
And the gold miners’ fundamentals look excellent heading into this seasonally-strongest span, with big sector-wide sequential profits growth likely to come in around 14% in their latest Q3’17 results. That will probably generate plenty of exciting upside surprises for traders who’ve largely abandoned gold stocks this year. Add in a major gold upleg fueled by stock markets rolling over, and this winter rally ought to be huge.
The greatest gains in this coming winter rally won’t be won in the popular ETFs like GDX and GDXJ, as they are far-overdiversified and burdened with way too many under-performing gold miners. So it’s much more prudent to deploy capital in the best individual gold miners with superior fundamentals. Their gains will handily trounce the ETFs, further amplifying the already-huge upside potential of this sector as a whole.
The key to riding any gold-stock bull to multiplying your fortune is staying informed, both about broader markets and individual stocks. That’s long been our specialty at Zeal. My decades of experience both intensely studying the markets and actively trading them as a contrarian is priceless and impossible to replicate. I share my vast experience, knowledge, wisdom, and ongoing research through our popular newsletters.
Published weekly and monthly, they explain what’s going on in the markets, why, and how to trade them with specific stocks. They are a great way to stay abreast, easy to read and affordable. Walking the contrarian walk is very profitable. As of the end of Q3, we’ve recommended and realized 967 newsletter stock trades since 2001. Their average annualized realized gain including all losers is +19.9%! That’s hard to beat over such a long span. Subscribe today and get invested before gold stocks power way higher!
The bottom line is gold stocks are just entering their seasonally-strongest period of the year. Their big winter rally is fueled by gold’s own, which is driven first by outsized demand from holiday jewelry buying and later new-year investment buying. So both the metal and its miners’ stocks have strong tendencies to rally between late October and late February in bull-market years. It’s the best calendar span to own gold stocks.
And this year’s coming winter rally looks exceptionally bullish because the seasonal tailwinds won’t be overpowered by bearish sentiment, technicals, or fundamentals. All of these primary drivers are bullish today and closely aligned with the strong seasonals, making for a powerful united force to propel gold stocks dramatically higher. Speculators and investors alike should be fully deployed for the coming months.
Adam Hamilton, CPA
November 3, 2017
Copyright 2000 – 2017 Zeal LLC (www.ZealLLC.com)
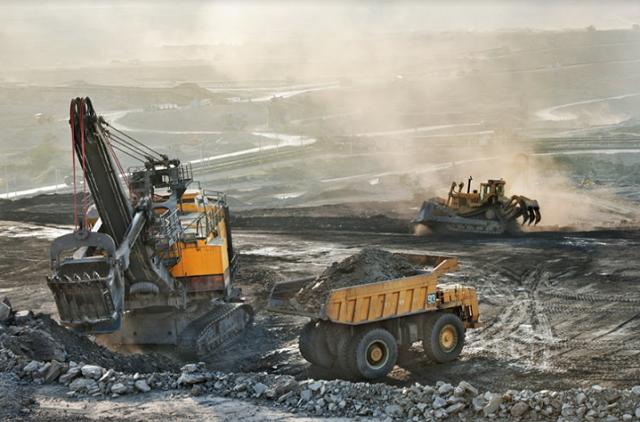
Current market conditions coupled with World climate has put certain Iron Ore focused companies in a position to possibly outperform big mining companies.
Several companies in this vein are attracting interest and one junior miner in particular, Black Iron Inc. (TSX: BKI, OTC: BKIRF), has a strong formula for success and low-cost production.
The market for iron ore has been hot, especially for higher grade ore. Big mining companies with massive iron interests have seen a rally of investor support because of their low valuations, high earnings and big dividends. Rio Tinto for instance paid its largest interim dividend in its history last month.
But things are shifting. The demand for steel from China, the major consumer of iron ore, was dampened in September as that country slowed its forecast based on economic output and said it would lessen steel production during winter to help curb pollution (1).
Interestingly, other Asian countries including India and Vietnam look like they will take advantage of any price drop in iron ore and buy in. That should offset any lack of demand from China and put iron ore back where it was headed: up once again.
For those uncertain about the potential gains in iron ore, consider one well known mining company focused completely on iron ore: Cleveland-Cliffs jumped 12% in August 2017 alone (2).
That’s just one good reason to look at pure iron ore focused companies right now.
As our readers know, we are very positive on the junior mining sector. Many investors have done very well this year in that end of the market. That is why we suggest taking a hard look at Black Iron Inc.(TSX: BKI) (OTC: BKIRF), which is developing a large iron ore project in Ukraine to production.
We like the play, we like the economics and we think you think you’ll agree that the company can double or triple gains made by the more diversified miners, based on its unique opportunity.
You Could BUY a Pure Iron Ore Mining Stock at Pennies Per Share. See Our Recommendation.
Iron Ore Companies Have Been Good to Investors
If you take a moment to review the leaders from our Winners List (below) you’ll likely recognize that these are very large mining companies, save for one iron ore only miner. Our top three selections had a one year return of 54.66%, 19.53% and 92.03% respectively (4). This group has provided strong dividends and solid value.
The challenge for many investors is that these big board stocks trade in the over $40 to $50 a share or above range. They’re comparatively stable, but they already have any large gains and speculation built in to their pricing.
In order to achieve leverage, like 10 to 1, 20 to 1 or better, we realize you need to look at the early stage mining business with the focus on an immediate path to production and a means to expand the resource.
That is the exact description of Black Iron Inc.
Black Iron’s Ukraine Location is Pivotal to Its Success
Black Iron Inc. is a junior Canadian mining company advancing its 100% owned Shymanivske Project located in Kryvyi Rih, Ukraine, to production.
The project is located in an established mining region with five other operating iron ore mines in close proximity.
Black Iron has been at work in Ukraine since 2010 to develop this large scale project and was moving to production, but they were delayed when Russia decided to invade Eastern Ukraine and the Crimean Peninsula Region in 2014. Things have since stabilized in the rest of Ukraine and global consensus is that if Putin wanted to take the rest of Ukraine, he would have already done it. He has apparently achieved his strategic objective of securing the country’s naval base and assets most valuable to Russia.
After more than three years of stability, its business as usual in the rest of Ukraine including the region where Black Iron is located.
Black Iron has really moved into high gear as world iron ore economics have been ramping up.
The Shymanivske Project contains 646 million tonnes measured and indicated resources grading 31.6% iron and 188 million tonnes inferred resources grading 30.1% iron.
A bankable feasibility study for the project completed in 2014 provides excellent economics for 9.9 million tonnes per year of 68% iron ore concentrate production, including a Net Present Value of US$3.3 billion at an 8% discount rate and before tax Internal Return Rate of 48%(3).
As a rule of thumb: for base metal projects an after tax IRR of at least 15% is preferred by financiers of mining projects.
Importantly, since the report was issued, the Ukrainian currency (Ukrainian Hryvnia) has depreciated significantly, currently at around UAH 27 to US $1. The original value placed on the resource used an exchange rate of UAH 8 to US $1.
This means that Black Iron has lowered its costs dramatically from the original estimate based on a very favorable exchange rate, which could easily offset any lowered value in global ore prices.
Black Iron’s high grade of ore (68%) also fetches a premium to regular or low grade ores produced in many other regions.
What Black Iron has is a large, bankable ore deposit with significant potential expansion that it is bringing to production. And while the resource itself is the major asset, it’s the location in Ukraine that makes Black Iron’s project so attractive.
Location, Location, Location
As any mining company will tell you, in order to mine ore, you need ready access to move the product to markets, a secure power source and a reliable labor force. Of course being able to access all these at low cost makes or breaks the project.
This is where Black Iron has a potential grand slam.
The project location itself has paved roads to the site and lies just two kilometers from main state-owned rail line. There’s also a surplus of low-cost electricity readily accessible from high voltage power lines that run beside the company’s property. The site is also just 8 kilometers away from the major city of Kryvyi Rih (population 750,000) which has very skilled work force to draw from.
The region where Black Iron operates has rail access to Western Europe and it’s just 140 kilometers to nearest water port providing access to the Black Sea and global seaborne iron ore markets. The obvious targets for its product include Asia, Western Europe, Turkey, and the Middle East.
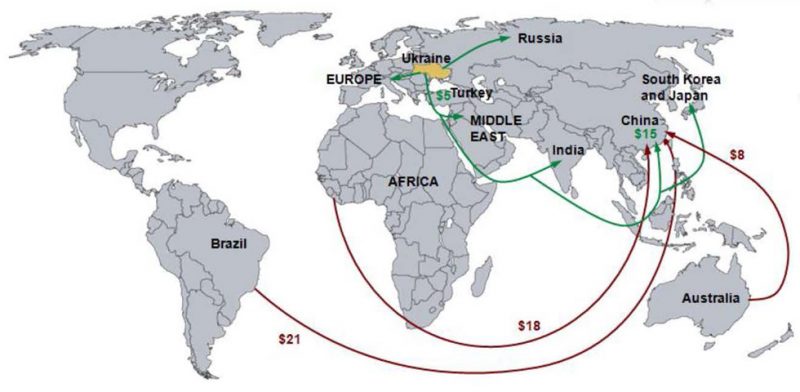
Besides the favorable exchange rate, Black Iron is also able to able to leverage low-cost electricity, transportation, a skilled work force that makes about $5.00 an hour and all this is rounded out by a highly affordable tax rate paid to the Ukraine government of just 18%.
Ukraine is an ideal spot for this project.
Imagine an IronOre Mining Stock That Could See Returns of 10x, 20x or more! – See Our Recommendation
The Smart Play in Iron Ore: Junior Miners
Leaders in iron ore mining are typically large companies with part of their interests tied to steel production. They likely mine other metals or develop petroleum etc. For really big returns, we seek out early stage companies with strong economics. These are nearly always junior mining companies, as is the case with Black Iron Inc.
Why juniors? They are flexible and able to move quickly to scoop up opportunities. They don’t bear large overheads and they can shift when needed. Obviously they carry more risk than the BIG mining companies, but the returns can be outstanding.
Black Iron(TSX: BKI) (OTC: BKIRF) is a junior mining company that has put itself in a unique position. Their advanced Shymanivske project in Ukraine represents a $3.3 billion asset that ready to move to production with highly capable management and an impressive board. By any measure that is a huge project with legs and real potential for big pay back.
Take note that Black Iron must report its project by mining regulations NI 43-101 standards. However, the company has said that it will update the 2014 NI 43-101 information to reflect current market economics in Q4 of this year.
FEATURE STOCK: FOR COMPARISON
| Black Iron Inc. (TSX: BKI OTCQB: BKIRF) Market Cap: $16.7 Million |
 |
| Black Iron Inc., together with its subsidiaries, explores for and develops iron ore projects in Ukraine. The company holds a 100% interest in the Shymanivske project, which covers an area of 2.56 square kilometers located in Kryviy Rih. Black Iron Inc. was incorporated in 2010 and is headquartered in Toronto, Canada. | |
Iron Ore Winners: Too Late for Big Gains, But Still Good to Study
We’ve pulled from the leaders in mining that have seen excellent returns this year already based on their focus on iron ore. Investors enjoy the safety of the fact that they are, for the most part, large and diversified across other mining interests and metals. Unfortunately, that’s the very same reason that these companies are not likely to see the kind of major returns that we are looking for in a pure iron ore player like our feature stock.
| Rio Tinto PLC (NYSE: RIO) Market Cap: $81.9 billion |
|
| Rio Tinto plc, a mining and metals company, finds, mines, processes, and markets mineral resources. It has operations in Australia, North America, Asia, Europe, Africa, and South America. Latest Headline: Rio Tinto unveils new $2.5 billion share buy-back to return Coal & Allied Industries Ltd sale proceeds to shareholders. |
|
| BHP Billiton (NYSE: BBL) Market Cap: $34.4 billion |
 |
| BHP Billiton Limited is an international resources company. The Company’s principal business lines are mineral exploration and production, including coal, iron ore, gold, titanium, ferroalloys, nickel and copper concentrate, as well as petroleum exploration, production, and refining. Latest Headline:BHP Results for the year ended 30 June 2017. |
|
| Vale S.A. (NYSE: VALE) Market Cap: $47.21 billion |
|
| Vale S.A., together with its subsidiaries, engages in the production and sale of iron ore and iron ore pallets for steelmaking in Brazil and internationally. Vale S.A. was founded in 1942 and is headquartered in Rio de Janeiro, Brazil. Latest Headline: Vale sees net debt falling to $14-16 bln by year end |
|
| Cliffs Natural Resources (NYSE: CLF) Market Cap: $2.1 billion |
|
| Cleveland-Cliffs Inc., a mining and natural resources company, produces and supplies iron ore. The company operates four iron ore mines in Michigan and Minnesota; and Koolyanobbing iron ore mining complex located in Western Australia. Latest Headline: Cleveland-Cliffs Buys Remaining Equity Stake in Tilden Mine |
|
Cleveland-Cliffs Inc., a mining and natural resources company, produces and supplies iron ore. The company operates four iron ore mines in Michigan and Minnesota; and Koolyanobbing iron ore mining complex located in Western Australia.
Latest Headline: Cleveland-Cliffs Buys Remaining Equity Stake in Tilden Mine.
Our Recommendation: We Give BKI Our Highest Pure Play BUY Rating
Our scan of the market indicates that there’s a wide variance in the iron ore sector and that spells opportunity. You have to remember that it’s a commodity, so it is affected directly by demand and supply.
Iron ore markets are volatile and moves up of 100% up or down by 70% are the norm.
Despite the volatility, it’s possible to invest in iron ore miners and make outstanding returns, but you have to be aware of the impact of product grade on price, proximity to rail port and power. Not all miners are the same.
Pure play iron ore companies have potential for huge upside in both the short and long term. Short term they offer speculation on iron ore’s upswings. Long term they offer security of a well-established, predictable industry.
Given the competitors, we think BKI has one of the best positions for iron ore out of any in the global junior mining sector. They certainly have a lot going for them.
Their cost of production, location to world markets in Ukraine, ultra high-grade 68% iron content product, existing infrastructure and strong mining management make the company a shoe-in for success. They have the permitting, available labor and a huge resource to grow a valuable iron ore operation.
Ultimately, Black Iron’s Shymanivske iron ore project could be a leading resource in the region. It’s already valued in the billions.
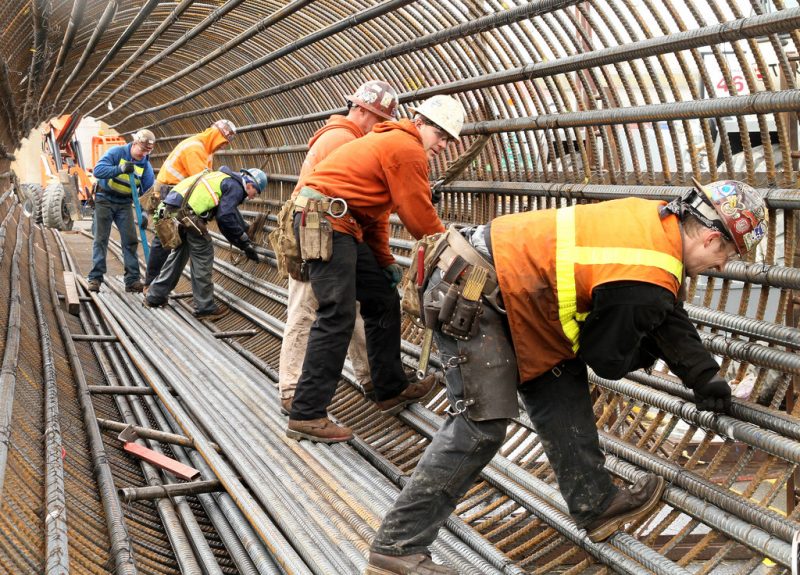
Bottom Line: You can get in on what is a very affordable point in the iron ore trend now. There is the potential for major leverage in backing a junior mining company that has a proven resource, but that is not yet in production.
We are looking for BKI to move to production rapidly, establish operations, ramp up their capacity and expand the overall resource size and valuations.
Early investors, like those that slip in prior to reaching production, could see an immediate double, triple or more from an initial stake. And although the long-term will be determined by supply economics, we feel that steel production and investments in infrastructure that power the iron ore market are solid bets through to the next administration, at the very least.

Over the summer, violence erupted across Venezuela as citizens persevered through the streets of Venezuela in anti-regime protests, while some participants have faced police brutality and mass arrests. While some fight to change the government, others in the nation also experience hunger, the resurgence of malaria and harsh conditions as they try to combat the nation’s plummeting currency and government run economy.
Many Venezuelans have denounced Maduro’s policies, which he has continued from his predecessor, Hugo Chávez. These policies place Venezuela’s economic dependence on oil and the fate of the nation’s economy in the hands of oil prices. As a result of the fall of oil prices in 2014 the country’s economy has been in a downward spiral as the Bolívar, Venezuela’s official currency, continues to devalue. This places the current exchange rate at approximately 10,987 Bolívars per one US dollar, according to DolarToday.
As the economic crisis of the country intensifies, civilians protest against President Nicolas Maduro’s government for deteriorating democracy, a result of the election on July 30, leading to a new legislative assembly. Being granted new unconditional powers, the assembly is set to rewrite the Venezuelan constitution in favour of Maduro––sending the socialist regime into a dictatorship. Supporters of the opposition have taken to the streets since earlier this year to boycott the government. The government has responded with harassment of its opposition.
Since spring, more than 120 people have died due to protest-related circumstances. Last month, the United Nations announced they are concerned about human rights violations, as a study conducted by the UN detailed the rates of police brutality resulting in death, as reported by the Daily Mail. The study reveals that since April, 46 deaths have been associated with security forces and 27 deaths caused by pro-government armed groups––Maduro’s government has arrested 5,000 people, while 1,000 are reported to be still held in custody.
Oil revenues account for nearly all export earnings and almost half of the Venezuelan government’s revenue, as the nation’s economy is severely dependent on oil. Since the fall of oil prices in 2014, the economic crisis in Venezuela has intensified. In March 2013, the month of Hugo Chávez’s death, before Maduro took office, the cost of oil per barrel stood at $102.30, while the current market price is $47.89 per barrel.
In the past couple of weeks according to OilPrice.com, the government failed to pay bond coupons worth a total of $586 million. But these payments have grace periods of 30 days, which Venezuela has made use of. Venezuela is now pulling together the cash to pay the maturities due Oct. 27, and Thursday, Nov. 2. According to Bloomberg, the state controlled company responsible for the bonds, PDVSA, says they have met their obligations but bondholders have yet to see the money in their accounts.
State-controlled oil firm PDVSA must first pay $985, and another $1.2 billion six days later. These nearly $2.2-billion payments do not have grace periods like the ones it has most recently skipped, and missing them would give bond investors the default gitters.
If this were to happen, the economy would fall into an even deeper crisis, and possibly shut down some oil production, which has declined in the past year anyway due to lack of investment. Not only is oil production dropping, but Venezuela’s crude oil quality has also been deteriorating due to a shortage of funds at PDVSA to treat its heavy crude oil.
Mismanagement of the economy and the fall of oil prices––Venezuela’s highest source of revenue––have left the country in poverty. Venezuela has an abundance of resources, including petroleum, natural gas, iron ore, gold, bauxite, other minerals, hydropower and diamonds. However, as the country has and continues to focus its aim on economic growth via natural resource extraction, this is what has led to its current economic catastrophe. The term “resource curse” is a paradoxical circumstance where countries acquiring a bounty of non-renewable resources encounter stagnant growth and sometimes economic deflation.
The resource curse progresses as a country focuses of all its energies on one industry––in the case of Venezuela, its focus has been on petroleum; however, Maduro is making the shift to focus on mining and is therefore further entrenching his country’s resource curse. As a consequence of these economic choices, the country becomes exceedingly reliant on the financial value of commodities and the overall gross domestic product (GDP), while the GDP turns highly volatile, according to Investopedia.
Additionally, government corruption often results when proper resource rights and an income distribution framework is not established in the society, resulting in unfair regulation of the industry. The resource curse most often occurs in emerging markets following a major natural resource discovery. If the lesson of oil in Venezuela was any indicator, new mineral wealth would further condemn the country and its people to the resource curse and its horrible effects.
The effects of the resource curse are evident in Venezuela, the average rate of living expenses is on the rise, making it impossible for many to afford basic needs, Venezuelans flock to illegal mines to earn a wage and support themselves. This places many in great threat to being exposed and contracting malaria, at large.
In search of a means to obtain access to food and basic necessities, many have turned to illegal mining, which is often controlled by gangs. Due to being unlicensed and unsupervised, many civilians who are mining for these gangs face death, as a result of many being infected with malaria, according to Mining. Unlicensed and unsupervised, gang-controlled mining has threatened civilians not only working in the mine, but all over the nation as malaria is spreading at significantly high rates. According to the BBC, Venezuela registered the topmost rates of malaria in the last 50 years–– 300 of every 100,000 civilians were reported to be contaminated with malaria in 2015. To a certain extent, the government has connected the spike in malaria to the increase of illegal mines in Venezuela.
Desperate citizens are not the only ones turning to mining to make ends meet. The country is turning towards its other natural resources to bolster its economy and its regime, but its legacy of nationalization has stifled, delayed and stumbled its own efforts to develop its geological resources, leaving many to wonder whether the government has learned anything at all.
In August of 2016, President Maduro opened the Arco Minero, a spot in the Amazon accounting for 12 per cent of government-owned land in Venezuela, to allocate large-scale mining operations. Experts presume the location, rich in natural resources, is worth approximately $10 billion. The President said Canada, Europe, and Africa have all expressed interest. However, foreign capital from democratic countries should question how secure their investments will be given the country’s socialist prerogatives and history of nationalization of its natural resources.
The decision to nationalize Venezuela’s gold industry was first announced in August 2011 by the late Hugo Chávez, former President of Venezuela, who wanted to nationalize Venezuela’s industry to have more state control over the economy. This prompted the government takeover of the gold industry from the Russian-controlled company Rusoro, in addition to the movement of the country’s gold reserves from western banks into banks in countries that are allies of Venezuela, including Russia, China and Brazil.
Before Chávez officially declared that the government of Venezuela was set to nationalize the gold mining industry on July 28, 2011, the government had already taken action to seize one foreign mining companies’ assets in the country prior to their official announcement. On October 26, 2009, personnel from the Venezuelan government arrived at the Brisas Project camp site owned by American mining firm Gold Reserve (TSX-V: GRZ), claiming ownership of the Brisas alluvial concession, seized company assets, removed company personnel and enforced physical possession of the property. Through an issuance of the Administrative Act dated Oct. 20, 2009, the Venezuelan government notified the company on November 4, 2009 of its decision to suspend Gold Reserve’s underlying hard rock concession, and did not send a formal notification to the company until June of 2010.
The nationalization of Venezuela’s gold industry struck another company, Rusoro Mining Ltd. (TSX-V: RML) The company won its claim against the government in 2016 when an international arbitration tribunal had enforced Venezuela to pay Rusoro more than US$1.2 billion, after being detailed as illegally confiscating the company’s gold mines situated in Venezuela. Rusoro, which owned two mining operations in the country, tried to negotiate with Venezuela for compensation over the ordeal.
With no success in negotiating, the company filed a claim of US$1.9-billion against Venezuela at the World Bank’s International Centre for Settlement of Investment Disputes in 2012. In conclusion Venezuela was ordered by the arbitration tribunal to make a payment to Rusoro for US$967.77 million as a result of the government expropriating the company in September 2011 with interest, according to the Financial Post. Venezuela must also pay US$1.2 billion to compensate Rusoro. If it was not for the Canada – Venezuela, Bolivarian Republic of BIT bilateral trade agreement of 1996, Canadian mining companies would have little legal recourse in international courts.
In order for Venezuela to continue to pay off current debts, the country––currently under the rule of Chávez’s chosen succeeder, Nicolas Maduro––is printing money to pay off its debt, which has been devaluing the Bolívar, according to Forbes, leading to the drastically low exchange rate of 10,987 Bolívars per one US dollar.
As Venezuela continues to struggle to pay settlements and bond holders, enter multinational mining companies; the country has signed deals to further position the country into natural resource exploitation. In August 2016, President Maduro announced that Venezuela had signed deals worth more than $5.5 billion with companies Barrick Gold Corp of Canada and Shandong Gold of China, according to Reuters. The contracts are intended to calm the economic crisis of nations part of the Organization of Petroleum Exporting Countries (OPEC) that have faced riots and food shortages. The medicine may be worse than the disease.
As Venezuela sparks deals to exploit the country’s natural resources, the country lacks any semblance of appropriate levels of governance given their history of nationalization, the oil price collapse and the ensuing chaos.
According to the Natural Resource Governance Institute, Venezuela has been ranked 74th for its administration of oil, gas and mining in the 2017 Resource Governance Index (RGI). The RGI details that the current political crisis in Venezuela is undoubtedly connected to the management of the oil sector, as the report mentions; the politicization of sector institutions and spending of a non-sustainable nature during boom times have made Venezuela ill-prepared for a drop in prices, leaving economic shock resulting in violence and repression in the nation. Not only the economy of Venezuela is in crisis; as the country pushes for higher oil revenues and greater exploitation of natural resources, it is further assigning itself to volatility down the road.
While this may seem beneficial to the Maduro regime, he puts the environment and wellbeing of many civilians at risk, as just south of the Arco Minero, 70 per cent of the country’s fresh water is situated, according to Newsweek. This threatens many indigenous people who reside in the area, as many in opposition of the Maduro government’s plans worry that natural resource exploitation will threaten the water, polluting it and leaving it unsafe to consume.
With a horrible human rights track record, horrible resource governance, legacy of nationalisation of mines, country’s economy in freefall, mining companies have to ask themselves how in the world are they going to secure their investments?
With reparation payments for nationalization of mines in the past, plus bond payments coming due, it is clear that anybody with cash has Maduro by the horns and international law does still have power in the courts as evidenced by recent rulings. However, if the past is any indicator, if the regime gets any confidence, there is precedent for nationalization or a reconsideration of terms.
For the time being Maduro has secured his cash but running an inefficient regime can get expensive, be sure that he will look to other ways and partners to fund his government; China is deploying significant amounts of capital in the region.
As an investor, one would do well to stay away from Venezuela unless you have big guns, big funds, big business and a high tolerance and tact for dealing with corruption.
https://www.youtube.com/watch?v=vR4LLaxQikE

Ian Telfer’s office at Goldcorp looks nothing like the rest of the company’s double story headquarters atop Park Place, a pink marble tower that is one of Vancouver’s largest skyscrapers.
The Goldcorp chairman’s corner suite overlooks a spectacular view, like an eagle’s nest atop the city. The walls are painted dark, giving the impression of a chic hotel lounge more than a workspace. Warm paintings of local landmarks decorate them. Ian Telfer, a trim, dapper figure and a giant of the gold business, is seated behind the desk. He shrugs his shoulders, nonchalantly, and tells me he bought the paintings from a local artist he found in a coffee shop.
I used to work in the building myself, as a summer student for RBC Dominion Securities. During a 2006 building renovation, there was a lot of buzz about the new tenant taking over the penthouse suite. That tenant was Goldcorp. Ian Telfer and Frank Giustra’s Wheaton River Minerals had successfully navigated the gold boom of the early 2000s and acquired Goldcorp to become Canada’s second largest producer. It was the talk of the town then and still is today.
I had no connections to the gold business then, but was curious about what was going on upstairs. It was a surreal experience to be back in the building last month to meet the man behind Goldcorp and hear his insights on an array of topics.
Telfer says he learned the resource business through osmosis, working alongside a group of extremely colourful and talented entrepreneurs.
His first job in mining was with brash Brazilian Eike Batista, who later became one of the world’s richest people, before losing nearly everything and landing in jail on bribery charges (wrongdoing which he denies). Their Brazil-focused gold venture, TVX Gold, eventually merged with Kinross (TSX:K), and the experience enabled Telfer to cut his teeth in the gold business and in Latin America; he lived in Brazil for five years and even learned Portuguese.
Following the TVX experience, Telfer was asked by legendary mine developer Robert Friedland to lead a much hyped Venezuelan gold explorer: Vengold.
Telfer was reluctant to take the job. He discussed the opportunity with his friend Pierre Lassonde, another gold legend. Lassonde encouraged Telfer to accept the offer, but also suggested he request a piece of the action on Friedland’s other deals. It was a smart move — Friedland agreed and Telfer ultimately got an early seat at the table of Diamond Fields International, Friedland’s famous $4 billion nickel find in 1995, and one of the most successful mining deals ever.
“Satisfaction comes from solving problems, not material success,” says Telfer. He found more than his share of problems in Venezuela, where Vengold came up empty. Although the company was able to acquire an interest in the rich Lihir mine in Papua New Guinea, the timing was lousy. Gold prices plummeted to $250, along with Vengold’s share price. The company owed $100 million and Telfer was the last man standing as CEO. Still, he was smart enough to capitalize on a brief recovery in the gold price, when he sold the Lihir interest, saving the company from certain insolvency and repaying the creditors. He was left with a shell and $30 million cash.
With this shell, Telfer would launch a tech incubator called Itemus — it was 1999 after all and the tech boom was in full swing. Itemis had a great run from pennies to around $3 a share, but like so many companies at the time, it went down with the 2001 dot-com crash.
Not one to stay down after a setback, Telfer soon linked up with Giustra to map out plans to launch Wheaton River Minerals, now Goldcorp, and the rest is history. Today, the company has more than 20,000 employees and $15 billion in market capitalization.
He also conceived the idea behind Goldcorp spinoff Silver Wheaton (now Wheaton Precious Metals, TSX:WPM, market cap $12 billion) and the now-prevalent mining financing technique we refer to as ‘metal streaming’.
Telferisms
“Make big life decisions based on whether you would regret not doing it later,” Telfer says.
“When you make an acquisition [in mining], you know you paid the wrong price. Only later do you find out if you paid too much or too little.”
“Success is not about buying the fancy new car, it is in the work you do that enables you to buy the car. In other words, happiness comes from solving problems.”
Giustra says Telfer’s managerial secret is in dealing with one problem at a time, starting with the most urgent, and not getting too fussed with problems that aren’t immediate or get in the way of solving today’s problem.
“That and absolute secrecy in anything he’s looking at,” Giustra says, “Absolute.”
Portfolio manager Frank Holmes says Telfer’s personality sets him apart from other gold executives. He’s charismatic and fun to be with. Telfer’s knowledge base is broad and deep, Holmes says, as a result of voracious reading, watching movies, and spending time with an eclectic group of friends and a devoted family. As an accountant with financial discipline and a flare of personality, other executives can’t help but want to work with him.
Renaissance Oil (TSXV:ROE)
The main reason I came knocking on Mr. Telfer’s door was to learn about his recent big bet on Mexico’s oil privatization. A few years ago, he co-founded Renaissance Oil (TSXV:ROE) with energy executive Craig Steinke, to build an oil company focused on Mexico, where Goldcorp is already the largest gold producer. The country is in the midst of privatizing much of its oil and gas industry, which was nationalized 70 years ago. Renaissance is becoming the go-to name for international energy investors interested in Mexico and at 1,500-2,000 barrels per day, it is now the second largest producer in the country after state-owned Petróleos Mexicanos (PEMEX).
Telfer tells me that at this stage of his career, he’s only interest in doing something he’s really excited about — a project that can scale into something big. He says, somewhat ruefully, that the oil and gas business is easier than hard rock mining. “With oil, when you drill a hole and find something, your troubles are over. With gold, when you drill a hole and find something, your troubles are just beginning.”
The Renaissance opportunity came about 3-4 years ago when PEMEX decided to commence the privatization process. The state-owned enterprise was having problems with technology and obtaining sufficient capital to effectively operate its oil and gas assets. When they announced that they were going to launch an auction process to sell them off, Telfer’s ears perked up — it was perfectly suited to his skill set and ambition. He had extensive experience operating in Mexico with Goldcorp (for 15 years) and had become very comfortable with the country.
He decided to dive in head first and launched Renaissance. When the first auction came up for onshore assets — Telfer calls them “neglected fields” — Renaissance bid aggressively and was the most successful bidder, and the only foreign winner. They have since worked hard to optimize the acquired properties, and they are now generating positive operating cash flow.
With the price of oil eventually dipping into the $30 range, the company was able to build a world-class technical team. With this team and its capital position, Renaissance is eligible and well-positioned to bid on everything else as it comes up in the privatization process.
According to Telfer, while the auction process has been slower than expected, it is starting to gain momentum, and is being noticed by the major oil companies around the world. The whole process is speeding up and Telfer is clearly excited.
“Larger companies are looking at Mexico and wondering, ‘How do we get in?’ ‘Who knows anything about this?’ So we are feeling the love right now. Anything is possible,” he says.
Hearing Mr. Telfer speak it’s hard not to share his enthusiasm for Renaissance and opportunities in the resource business. By the end of the meeting I’m thinking, maybe this could be my office someday. “Anything is possible.”
Learn more about Renaissance Oil in Mexico at www.renaissanceoil.com and follow ROE on the TSXV.
If you would like to receive our free newsletter via email, simply enter your email address below & click subscribe.
 Follow us on Twitter
 Become our facebook fan
CONNECT WITH US
Tweets
Tweet with hash tag #miningfeeds or @miningfeeds and your tweets will be displayed across this site.
MOST ACTIVE MINING STOCKS
Daily Gainers
 CMC Metals Ltd. CMC Metals Ltd. |
CMB.V | +900.00% |
 Eden Energy Ltd Eden Energy Ltd |
EDE.AX | +200.00% |
| GoviEx Uranium Inc. |
GXU.V | +42.86% |
| Eagle Nickel Ltd. |
ENL.AX | +41.67% |
| Citigold Corp. Limited |
CTO.AX | +33.33% |
| Mount Burgess Mining NL |
MTB.AX | +33.33% |
| Exalt Resources Limited |
ERD.AX | +31.94% |
| Casa Minerals Inc. |
CASA.V | +30.00% |
| Cariboo Rose Resources Ltd |
CRB.V | +28.57% |
| Belmont Resources Inc. |
BEA.V | +28.57% |


