
The US stock markets enjoyed an extraordinary surge in 2017, shattering all kinds of records. This was fueled by hopes for big tax cuts soon since Republicans regained control of the US government. But such relentless rallying has catapulted complacency, euphoria, and valuations to dangerous bull-slaying extremes. This has left today’s beloved and lofty stock markets hyper-risky, with serious selloffs looming large.
History proves that stock markets are forever cyclical, no trend lasts forever. Great bulls and bears alike eventually run their courses and give up their ghosts. Sooner or later every secular trend yields to extreme sentiment peaking, then the markets inevitably reverse. Popular greed late in bulls, and fear late in bears, ultimately hits unsustainable climaxes. All near-term buyers or sellers are sucked in, killing the trend.
This mighty stock bull born way back in March 2009 has proven exceptional in countless ways. As of mid-December, the flagship S&P 500 broad-market stock index (SPX) has powered 297.6% higher over 8.8 years! Investors take this for granted, but it’s far from normal. That makes this bull the third-largest and second-longest in US stock-market history. And the superior bull specimens vividly highlight market cyclicality.
The SPX’s biggest and longest bull on record soared 417% higher between October 1990 and March 2000. After it peaked in epic bubble-grade euphoria, the SPX soon yielded to a brutal 49% bear market over the next 2.6 years. The SPX wouldn’t decisively power above those bull-topping levels until 12.9 years later in early 2013, thanks to the Fed’s unprecedented QE3 campaign! The greatest bull ended in tears.
The second-largest bull was a 325% monster between July 1932 to March 1937. But that illuminated the inexorable cyclicality of stock markets too, as it arose from the ashes of a soul-crushing 89% bear in the aftermath of 1929’s infamous stock-market crash. Seeing today’s central-bank-inflated bull balloon to such monstrous proportions rivaling the greatest stock bulls on record highlights how extreme it has become.
All throughout stock-market history, this binary bull-bear cycle has persisted. Though some bulls grow bigger and last longer than others, all eventually give way to subsequent bears to rebalance sentiment and valuations. So stock investing late in any bull market, which is when investors complacently assume it will last indefinitely, is hyper-risky. Bear markets start at serious 20% SPX losses, and often approach 50%!
Popular psychology in peaking bull markets is well-studied and predictable. Investors universally believe “this time is different”, that some new factor leaves their bull impregnable and able to keep on powering higher indefinitely. This new-era mindset fuels extreme euphoria and complacency, with memories of big selloffs fading. Investors’ hubris swells, as they forget markets are cyclical and ridicule any who dare warn.
To any serious student of stock-market history, there’s little doubt today’s stock-market situation feels exactly like a major bull-market topping. All the necessary ingredients are in place, ranging from extreme greed-drenched sentiment to extreme bubble valuations literally. If this bull was merely normal, the risks of an imminent countertrend bear erupting to eradicate these late-bull excesses would absolutely be stellar.
But the downside risks in the wake of this exceptional bull are far greater than usual. That’s because much of this bull is artificial, essentially a Fed-conjured illusion. And that was even before the incredible 2017 taxphoria surge in the wake of Trump’s surprise victory! Back in early 2013 as the SPX was finally regaining its previous bull’s peak, the Fed unleashed its wildly-unprecedented open-ended QE3 campaign.
Understanding the Fed’s role in fomenting this anomalous stock bull is more important than ever. Not only is the Fed deep into its 12th rate-hike cycle of the past half-century or so, it has begun quantitative tightening for the first time ever. This QT is starting to unwind the trillions of dollars of QE that levitated the stock markets for years. While QT started small in Q4’17, it’s ramping to a $50b-per-month pace in Q4’18!
The Fed’s QE giveth, so the Fed’s QT taketh away. Literally trillions of dollars of capital evoked out of nothing by the Fed to monetize bonds directly and indirectly bid stock markets higher. The Fed’s deep intertwinement in this stock bull’s fortunes is easiest to understand with a chart. Here the SPX in blue is superimposed over its implied-volatility index, the famous VIX that acts as a proxy for popular greed and fear.
This anomalous stock bull was again birthed in March 2009 in the wake of the first true stock panic since 1907. After that epic maelstrom of fear fueled such an extreme plummet to climax a 57% bear market, a new bull was indeed overdue despite rampant bearishness and pessimism. The very trading day before the SPX bottomed, I wrote a hardcore contrarian essay explaining why a major new bull market was imminent.
Back in early 2009 stock-market valuations were so low after the panic that a new bull was fully justified fundamentally. And its first four years or so played out perfectly normally. Between early 2009 to late 2012, this bull market’s trajectory was typical. It rocketed higher initially out of deep bear lows, but those gains moderated as this bull matured. And its upside progress was punctuated by healthy major corrections.
Stock-market selloffs are generally defined in set ranges. Anything under 4% isn’t worth classifying, it is just normal market noise. Then from 4% to 10%, selloffs become pullbacks. Beyond that in the 10%-to-20% range are corrections. Selloffs greater than 20% are formally considered bear markets. In both 2010 and 2011 the SPX suffered major corrections in the upper teens, which are essential to rebalance sentiment.
As bull markets power higher, greed naturally grows among investors and speculators. They start to get very complacent and expect higher stocks indefinitely. Eventually this metastasizes into euphoria and even hubris. Major corrections, big and sharp mid-bull selloffs, rekindle fear to offset excessive greed and keep bulls healthy. Interestingly even in 2010 and 2011 the Fed played a key role in stock-market timing.
Those early bull years’ major corrections coincided exactly with the ends of the Fed’s first and second quantitative-easing campaigns. QE is an extreme monetary-policy measure central banks can use after they force interest rates, their normal tool, down to zero. The Fed’s zero-interest-rate policy went live in mid-December 2008 in response to that first stock panic in a century, and QE1 then QE2 soon followed.
Quantitative easing involves creating new money out of thin air to buy up bonds, effectively monetizing debt. While QE1 and QE2 certainly caused market distortions, both campaigns had predetermined sizes and durations. When traders knew a particular QE campaign was nearing its end, they started selling stocks which drove the major corrections. So the Fed decided to change tactics when it launched QE3.
As the SPX approached 1450 in late 2012, that normal stock-market bull was topping due to expensive valuations. After peaking in April, stock markets started rolling over heading into that year’s presidential election. Stock-market fortunes in the final several months leading into elections can greatly sway their outcomes. So in mid-September 2012 less than 8 weeks before the election, a very-political Fed hatched QE3.
QE3 was radically different from QE1 and QE2 in that it was totally open-ended. Unlike its predecessors, QE3 had no predetermined size or duration! So stock traders couldn’t anticipate when QE3 would end or how big it would get. Stock markets surged on QE3’s announcement and subsequent expansion a few months later. Fed officials started to deftly use QE3’s inherent ambiguity to herd stock traders’ psychology.
Whenever the stock markets started to sell off, Fed officials would rush to their soapboxes to reassure traders that QE3 could be expanded anytime if necessary. Those implicit promises of central-bank intervention quickly truncated all nascent selloffs before they could reach correction territory. Traders realized that the Fed was effectively backstopping the stock markets! So greed flourished unchecked by corrections.
This stock bull went from normal between 2009 to 2012 to literally central-bank conjured from 2013 on! The Fed’s QE3-expansion promises so enthralled traders that the SPX went an astounding 3.6 years without a correction between late 2011 to mid-2015, one of the longest-such spans ever. With the Fed jawboning negating healthy sentiment-rebalancing corrections, sentiment grew ever more greedy and complacent.
QE3 was finally wound down in late 2014, leading to this Fed-goosed stock bull stalling out. Without central-bank money printing behind it, the stock-market levitation between 2013 to 2015 never would’ve happened! One of the most-damning charts of recent years shows the SPX perfectly tracking the growth in the Fed’s balance sheet as its monetized bonds accumulated there. This great stock bull is largely fake.
Without the Fed’s QE firehose blasting new money into the system, stock-market corrections resumed in mid-2015 and early 2016. After topping in May 2015 not much higher than QE3-ending levels, the SPX drifted sideways to lower for fully 13.7 months. That too should’ve proven this artificially-extended bull’s top, giving way to the overdue subsequent bear. But it was miraculously short-circuited by the Brexit vote.
Heading into late June 2016, Wall Street was forecasting a sharp global stock-market selloff if British people actually voted to leave the EU. What was seen as a low-probability outcome promised to unleash all kinds of uncertainty and chaos. And indeed when that Brexit vote surprised and passed, the SPX plunged for a couple trading days. Then meddling central banks stepped in assuring they were ready to intervene.
So this tired old bull again started surging to new record highs in July and August 2016, although they weren’t much better than May 2015’s. After that euphoric surge on hopes for post-Brexit-vote central-bank easings, the SPX started to roll over again heading into the US presidential election. Wall Street warned just like Brexit that a Trump win would ignite a major stock-market selloff, and again proved dead wrong.
The shocking post-election stock surge has been called Trumphoria or taxphoria. Capital flooded into stocks for a variety of reasons. In addition to hopes for far-superior government policies boosting corporate profits, funds rushed to buy to chase good year-end gains to report to their investors. And the resulting stock-market record highs, and fevered anticipation for big tax cuts, started seducing investors back.
This exuberant psychology greatly intensified in 2017, with the SPX periodically surging to series of new record highs on political news fanning investors’ optimism. Since Trump won the election, nearly all of the SPX’s significant daily rallies ignited on news implying big tax cuts were indeed coming soon as widely hoped. The wealth effect from that stock elation unleashed big spending, which really boosted corporate profits.
But this Fed-goosed stock bull was already very long in the tooth, and stock valuations were already near formal bubble territory, even before Trump was elected. The resulting Trumphoria surge on hopes for big tax cuts soon really exacerbated serious pre-election risks. That included extending the span since the end of the last SPX correction to 1.9 years. Normal healthy bull markets see correction-grade selloffs annually.
Between the SPX’s original top in May 2015 soon after QE3 ended and Election Day 2016, at best stock markets simply ground sideways. At worst they were rolling over into what should’ve grown into a major new bear. Trumphoria short-circuited all that, sending stocks sharply higher and delaying the inevitable cyclical reckoning. By mid-December 2017 the SPX had rocketed a crazy 25.7% higher since Election Day alone!
An ominous side effect of that anomalous late-bull surge was extremely-low volatility, with all kinds of low-volatility records set. The VIX S&P 500 implied-volatility index on this chart reflects that, slumping to multi-decade lows throughout 2017! Low volatility reflects low fear and high complacency, the exact herd sentiment ubiquitous at major bull-market toppings. Just like stock markets, volatility is forever cyclical too.
Volatility often skyrockets off exceptional lows, as the great sentiment pendulum must swing back to fear after peaking deep in the greed side of its arc. And the only thing that generates fear late in stock bulls is sharp selloffs. No matter how bad news is, euphoric investors happily ignore it if it doesn’t drive stocks lower. But eventually some catalyst always arrives, usually unforeseen, that finally stakes the geriatric bull.
When the last stock bulls peaked in March 2000 and October 2007, there was no specific news that killed them. Lofty euphoric stock markets simply started gradually rolling over, mostly through relatively-minor down days which generated little fear. These modest grinds lower kept most investors unaware of the waking bears, boiling them slowly like the proverbial frog in the pot. But even little losses eventually add up.
Since nearly all the amazing stock-market gains between late 2012 to mid-2015 were directly fueled by the Fed’s QE3 money printing, fears of the coming quantitative tightening may prove the bull-slaying catalyst. The Fed conjured money out of thin air to buy bonds in QE, and it will destroy that very money by effectively selling bonds in QT. QT’s capital outflows should prove as bearish for stocks as QE’s inflows were bullish!
The FOMC actually started discussing QT at its early-May meeting, and formally announced it at its late-September meeting. QT actually got underway in Q4’17 at a modest $10b-per-month pace. But it’s on autopilot to grow by $10b per month each quarter until it reaches terminal speed at a $50b-per-month pace in Q4’18. That will make for $600b per year of QE-injected capital removed from markets and destroyed.
QT is utterly unprecedented in history, and its acceleration in 2018 has profoundly-bearish implications for these QE-inflated record stock markets. As QT started late in 2017 at low levels, it only totaled $30b this year. But in 2018 alone that will explode 14x higher to a total of $420b of QT! Prudent investors will sell in anticipation of QT hitting full steam, as unwinding the Fed’s huge QE-bloated balance sheet is a grave threat.
Back in the first 8 months of 2008 before that stock panic, the Fed’s balance sheet averaged $849b. By February 2015, it had ballooned to a freakish $4474b. That’s up a staggering 427% or $3625b over 6.5 years of QE! QE levitated the stock markets in two primary ways. That Fed bond buying bullied yields to artificial lows, forcing bond investors starving for yields to buy far-riskier stocks that were paying dividends.
More importantly, those unnatural contrived extremely-low yields courtesy of QE fueled a boom in stock buybacks by corporations unlike anything ever witnessed. American companies took advantage of the crazy-low interest rates to literally borrow trillions of dollars to buy back their own stocks! Between QE3’s launch and Trump’s victory, corporate stock buybacks were the dominant source of stock-market capital inflows.
QT along with the Fed’s current rate-hike cycle will allow bond yields to rise again, eventually greatly retarding corporations’ desire and ability to borrow vast sums of money to use to manipulate their own stock prices higher. In late December, the Fed’s balance sheet was still way up at $4408b. These QE-inflated stock markets have never experienced QT, and it ain’t gonna be pretty no matter how slowly QT is implemented.
While this easy Fed is far too cowardly to fully reverse $3.6t worth of QE since late 2008, even a trillion or two of QT over the coming years is going to wreak havoc on these QE-levitated stock markets! That’s a serious problem for today’s extreme Fed-goosed bull with a rotten fundamental foundation. Underlying corporate earnings never supported such extreme record stock prices, and the coming reckoning is unavoidable.
Regardless of the Fed’s balance sheet, quantitative tightening, or valuations, the near-record-low VIX slumping into the 9s since back in May shows these stock markets are ripe for a major selloff anyway. At absolute minimum, it needs to be a serious correction approaching 20%. But with this stock bull so big, so old, and so fake thanks to the Fed, that selloff is almost certain to snowball into the long-overdue next bear.
And investors aren’t taking the threat of a new bear seriously. Crossing the bear threshold just requires a 20% retreat. Even such a baby bear would erase all SPX gains since mid-2016. A normal bear market at this stage in the Long Valuation Waves is actually 50%, cutting stock prices in half! That would wipe out the great majority of this entire mighty stock bull, dragging the SPX all the way back down to mid-2011 levels.
Even more ominously, bear markets naturally following bulls tend to be proportional. That makes sense since bears’ job is to rebalance sentiment and work off overvalued conditions. So there’s a high chance the coming bear after such an anomalous Fed-goosed bull won’t stop at 50%! The downside risks from here are incredibly dire after such a huge bull driven by extreme central-bank easing instead of corporate profits.
And that finally brings us to valuations, this old stock bull’s core problem. This final chart looks at the SPX superimposed over a couple key valuation metrics. Both are derived from averaging the trailing-twelve-month price-to-earnings ratios of all 500 elite SPX companies. The light-blue line is their simple average, while the dark-blue one is weighted by market capitalization. Today’s valuations ought to terrify investors.
Unfortunately today corporate earnings are intentionally obscured by Wall Street to mask the dangerous overvaluation that is rampant. Analysts make up blatant fictions including forward earnings, which are literally guesses about what companies will earn in the coming year! These almost always prove wildly optimistic. Analysts also look at adjusted earnings, another Pollyannaish farce where companies ignore expenses.
Wall Street also plays a deceptive estimate game to make quarterly-earnings results look way better than they really are. Instead of comparing actual hard quarterly profits with the same quarter a year earlier, they intentionally lowball estimates so companies beat regardless of their actual earnings trends. Investors are being bamboozled, with the only honest way of measuring corporate profits buried and forgotten.
That is based on generally-accepted accounting principles which are required when companies actually report to regulators. The only righteous way to measure price-to-earnings ratios is using the last four quarters of GAAP profits, or trailing twelve months. Those numbers are hard, established in the real world based on real sales and real expenses. They are not mere estimates like totally-bogus forward earnings.
Every month at Zeal we look at the TTM P/Es of all 500 SPX companies. At the end of November, the simple average of all SPX companies actually earning profits so they can have P/Es was an astounding 30.5x! That’s literally in bubble territory, just as Trump had warned about during his campaign. 14x earnings is the historical fair value over a century and a quarter, and double that at 28x is where bubble levels start.
If you study the history of the stock markets, stock prices never do well for long starting from bubble valuations. Such extreme stock prices relative to underlying corporate earnings streams actually herald the births of major new bear markets. Again these usually cut stock prices in half. So buying stocks here, late in a huge old bull market artificially levitated by the Fed, is the height of folly. Massive losses are inevitable.
Remember stock markets perpetually meander through alternating bull-bear cycles. Back in late 2012 before the Fed stepped in to try and brazenly short-circuit these valuation-driven cycles, valuations were actually in a secular-bear downtrend. After secular bulls drive valuations to bubble extremes, with greed forcing stock prices far beyond underlying corporate earnings, secular bears emerge to reverse those excesses.
During secular bears, stock prices grind sideways on balance for long enough for earnings to catch up with lofty stock prices. Before QE3 temporarily broke stock-market cycles, that process had been happening as normal between 2000 to 2012. Secular bears don’t end until valuations get to half fair value, 7x earnings. So instead of being into bubble levels, valuations would normally be between 7x to 10x today.
That’s the massive downside risk stocks face due to their Fed-conjured bubble valuations! While the red line above shows the actual SPX, the white line shows where it would be trading at 14x fair value. Even that is way down around 1235 today, less than half current levels! But mean reversions from extremes nearly always overshoot in the opposite direction, so the potential SPX bear-market bottom is much lower.
Sadly Wall Street will never bother telling investors that valuations matter. Stock-market history proves beyond all doubt that buying stocks high in valuation terms nearly always leads to considerable-to-huge losses. All the financial industry cares about is keeping people fully invested no matter what, since that maximizes their fees derived from percentages of assets under management. Talk about a conflict of interest!
The more expensive stocks are in valuation terms when they are purchased, the worse the subsequent returns will be. And no matter how awesome Trump’s policies may ultimately prove, they aren’t going to rescue corporate profits anytime soon. Republicans’ corporate-tax cuts have long been way more than fully priced in to stock prices. Wall Street analysts love to claim 2017’s extraordinary rally was earnings-driven.
But valuations prove otherwise. By late November the SPX had soared 24.2% since Trump won the US presidency. But during nearly that same span the SPX’s simple-average TTM P/E surged 15.9%. That implies only about a third of the entire Trumphoria rally was driven by higher corporate profits! And even that is suspect, since the wealth effect from this year’s record stock markets fueled exceptionally-high spending.
The stock markets’ lofty valuations before Trumphoria and the bubble valuations since are a very serious problem that can only be resolved by an overdue major bear market! Only that will drag stock prices low enough for existing and future corporate earnings to support reasonable valuations again. Investors sure don’t believe a new bear market is possible, but they never do when bull markets are topping in extreme euphoria.
It’s not just the Fed’s QT that’s coming in 2018 and 2019, but the European Central Bank is also slashing its own QE campaign. That ran at a blistering €60b-per-month pace in 2017, totaling €720b. But it will be cut in half to just €30b a month starting in January. The combination of Fed QT and ECB QE tapering is going to strangle this stock bull! A QE-conjured stock bull can’t persist when QE is reversed and slashed.
Together these leading global central banks so critical to stock-market fortunes are effectively tightening massively in 2018 and 2019 compared to 2017. Next year alone will see the equivalent of $950b more Fed QT and less ECB QE than this year. Can bubble-valued stocks survive nearly a trillion dollars less central-bank liquidity in 2018? And two years from now that will swell to another $1450b less than this year!
Investors really need to lighten up on their stock-heavy portfolios, or put stop losses in place, to protect themselves from the coming central-bank-tightening-triggered valuation mean reversion in the form of a major new stock bear. Cash is king in bear markets, as its buying power grows. Investors who hold cash during a 50% bear market can double their stock holdings at the bottom by buying back their stocks at half price!
Put options on the leading SPY S&P 500 ETF can also be used to hedge downside risks. They are cheap now with euphoria rampant, but their prices will surge quickly when stocks start selling off materially. Even better than cash and SPY puts is gold, the anti-stock trade. Gold is a rare asset that tends to move counter to stock markets, leading to soaring investment demand for portfolio diversification when stocks fall.
Gold surged nearly 30% higher in the first half of 2016 in a new bull run that was initially sparked by the last major correction in stock markets early that year. If the stock markets indeed roll over into a new bear in 2018, gold’s coming gains should be much greater. And they will be dwarfed by those of the best gold miners’ stocks, whose profits leverage gold’s gains. Gold stocks rocketed 182% higher in 2016’s first half!
Absolutely essential in bear markets is cultivating excellent contrarian intelligence sources. That’s our specialty at Zeal. After decades studying the markets and trading, we really walk the contrarian walk. We buy low when few others will, so we can later sell high when few others can. While Wall Street will deny the coming stock-market bear all the way down, we will help you both understand it and prosper during it.
We’ve long published acclaimed weekly and monthly newsletters for speculators and investors. They draw on my vast experience, knowledge, wisdom, and ongoing research to explain what’s going on in the markets, why, and how to trade them with specific stocks. As of the end of Q3, all 967 stock trades recommended in real-time to our newsletter subscribers since 2001 averaged stellar annualized realized gains of +19.9%! For only $12 per issue, you can learn to think, trade, and thrive like contrarians. Subscribe today!
The bottom line is today’s euphoric record stock markets are hyper-risky. They are trading up at bubble valuations thanks to 2017’s stunning post-election rally. Such lofty stock prices are risky any time, but exceedingly dangerous late in an enormous bull market artificially extended by the Fed. A major new bear market is long overdue that will at least cut stock prices in half. Don’t be fooled by the extreme complacency!
Prudent investors have to overcome this groupthink herd euphoria and protect themselves from what’s coming. That means lightening up on overvalued stocks, building cash, and buying gold. Central banks have a long history of trying and failing to eliminate stock-market cycles. The longer they are artificially suppressed, the worse the inevitable reckoning as these inexorable market cycles resume with a vengeance.
Adam Hamilton, CPA
December 29, 2017
Copyright 2000 – 2017 Zeal LLC (www.ZealLLC.com)

1. While many gold market technicians have been neutral to slightly negative about gold in the short term, I’ve been extremely positive.
2. As of today, I’ve become outrageously more positive. To understand why that is, please click here now. Double click to enlarge this spectacular daily gold chart.
3. I’ll dare to suggest that gold investors have behaved very well this year.
4. As a result of that behaviour, Santa has put a beautiful bull wedge breakout into everybody’s Christmas stocking!
5. The near-immediate price target is $1310, but $1360 should also be hit during what looks to be a very positive Chinese New Year season.
6. Do the festivities extend to gold stocks as well?
7. Absolutely! Please click here now. Double click to enlarge this GDX chart.
8. GDX is sporting a great looking inverse head and shoulders bottom, and the rally from the head of the pattern has a bull pennant formation breakout in it.
9. This is quite exciting. For gold stock investors around the world, it is really ushering in the new year in a great way.
10. I’ve suggested that the $25 – $26 target zone is likely to turn out to be little more than a pitstop on the road to the $35 area.
11. I’ve argued that the biggest bubble of all time is the bubble of government fiat money, and that bubble has started to burst. The initial bursting of the bubble has seen all global fiat collapse against blockchain currencies like bitcoin.
12. That’s a lot like how the stock market crashes when it becomes a bubble. The initial collapse happens in the most speculative stocks. From there, the collapse spreads to the big Dow Jones Industrial Average component stocks.
13. In the case of the fiat bubble, I’ve predicted that the collapse of fiat against bitcoin is only the very beginning of a horrific collapse that will ultimately see fiat fall hard against gold, silver, and mining stocks.
14. Please click here now. Double-click to enlarge this exciting bitcoin chart. Technically, the double bottom pattern is arguably the most difficult one for investors to handle emotionally.
15. A great double bottom appears to be in play now on this short term bitcoin chart. Note the immense panic volume on the first low, and the much lighter volume on the second one.
16. That’s classic technical action. There’s also a potential flag-like pattern in play, which is quite positive. A breakout above $15,000 is likely, and it would serve as a lead indicator for an imminent and powerful rally in the precious metal markets.
17. The bottom line: gold investors don’t need to be invested in bitcoin, but it’s important to follow the price action as a lead indicator for the spread of the global fiat wildfire.
18. Please click here now. Some heavyweight institutional analysts are concerned that a fall in bitcoin against fiat could trigger a stock market crash.
19. Governments and central banks are becoming pushed into a corner. They need to quickly regulate bitcoin markets so that a rogue bank or other nefarious entity doesn’t try to cause a global markets crash by crashing bitcoin.
20. Please click here now. Tom Lee was head of equities for JP Morgan. He turned bullish on the US stock market at almost the exact low in 2009, and stayed bullish until 2016 when be saw the market as fully valued.
21. He’s started his own firm now. He’s moved his focus to bitcoin and was an eager buyer on Friday, as I was. With heavyweights like Tom in the blockchain house, the global fiat fire is likely to intensify.
22. On that exciting note, please click here now. Double click to enlarge this key money velocity chart. I think most mainstream analysts are underestimating the commitment of Trump and new Fed chair Powell to small bank deregulation.
23. That deregulation can end the twenty-year money velocity bear market, and usher in an era of inflation.
24. Please click here now. Double click to enlarge. Hi ho silver! When inflation becomes widely accepted by institutional investors, they will flock to silver more than gold. This is particularly true if global growth continues. Watch for a trendline breakout fuelled by bank deregulation to send silver soaring to my initial $26 target, and on to higher prices after a brief rest there!
Cheers
Stewart Thomson, Graceland Updates
Stewart Thomson is a retired Merrill Lynch broker. Stewart writes the Graceland Updates daily between 4am-7am. They are sent out around 8am-9am. The newsletter is attractively priced and the format is a unique numbered point form. Giving clarity of each point and saving valuable reading time.
Risks, Disclaimers, Legal
Stewart Thomson is no longer an investment advisor. The information provided by Stewart and Graceland Updates is for general information purposes only. Before taking any action on any investment, it is imperative that you consult with multiple properly licensed, experienced and qualified investment advisors and get numerous opinions before taking any action. Your minimum risk on any investment in the world is: 100% loss of all your money. You may be taking or preparing to take leveraged positions in investments and not know it, exposing yourself to unlimited risks. This is highly concerning if you are an investor in any derivatives products. There is an approx $700 trillion OTC Derivatives Iceberg with a tiny portion written off officially. The bottom line:
Are You Prepared?
Back in early 2016 as precious metals rebounded, our work showed that gold stocks were arguably the cheapest they had ever been. They had the worst 5-year and 10-year rolling performance ever, they were trading at potentially 40-year lows on a price to cash flow basis, they were the cheapest ever relative to the stock market and Gold and most notably, the Barron’s Gold Mining Index was trading at the same level as 42 years ago! The gold stocks enjoyed a massive recovery in 2016 but it was short lived as the sector corrected and then consolidated (far from the highs) for over a year. Although we have a tendency to be too conservative at times, over a month ago we noted a historical pattern that bodes extremely well for gold stocks over the next few years. That outlook is reinforced by the continued historic value in the gold stocks as exhibited by the following charts.
First, we focus on the long-term rolling performance in the gold stocks. The chart below plots the S&P TSX Gold Index (data obtained from Global Financial Data) along with its rolling 5-year and 10-year performance. By that metric, the gold stocks (going back +80 years) were the most oversold in late 2000 and early 2016. If we were to run a 15-year and 20-year rolling performance then the three most oversold periods would be late 2000, early 2016 and the late 1950s. The gold stocks enjoyed massive long-term returns from the late 1950s and the year 2000.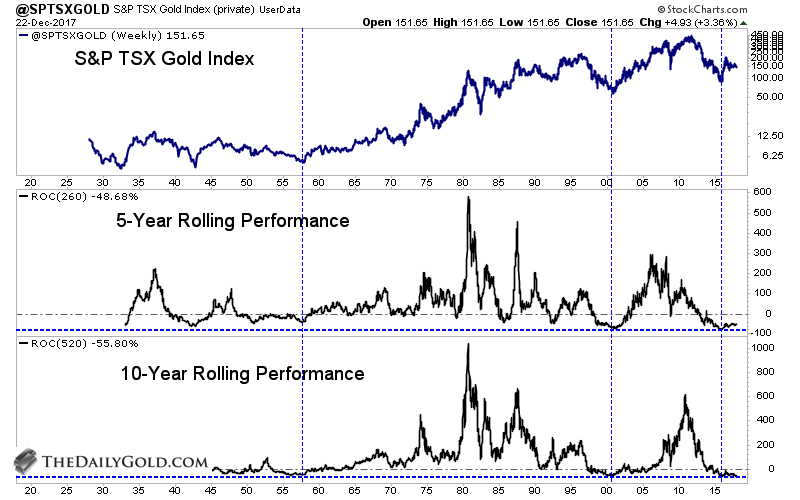 Next we compare the gold stocks to the stock market. We plot the S&P TSX Gold Index against the S&P 500. The ratio appears to be in position to form a double bottom or a higher low as compared to its 2016 low. The 2016 low (in the chart below) is second by a tick to the 2000 low as to when the gold stocks relative to the stock market were the cheapest ever. (However, the Barron’s Gold Mining Index against the S&P 500 did make an all-time low in January 2016). In any case, the gold stocks right now are likely trading at the 97th percentile (out of 100) as far as value relative to the stock market.
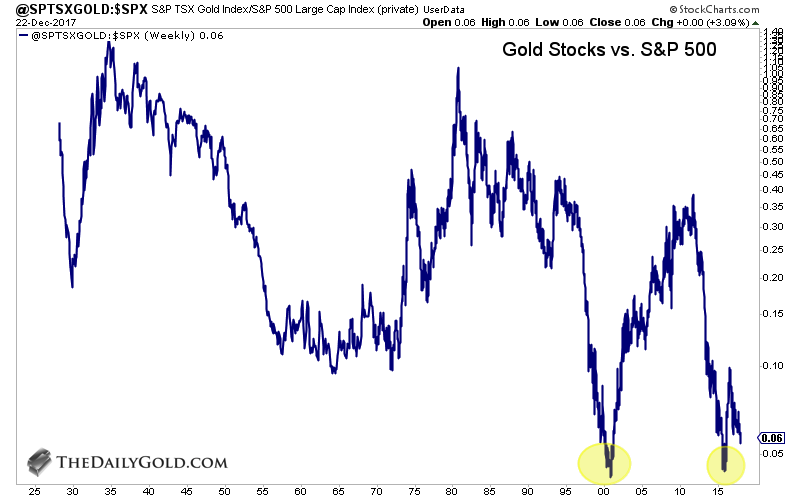
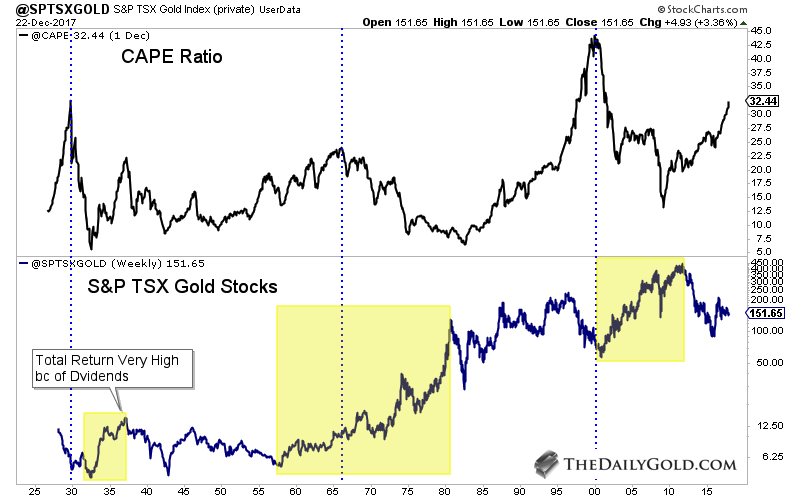
 Next is one of my favorite charts. We compare the valuation in the stock market with the performance in the gold stocks. We plot the CAPE Ratio along with the S&P TSX Gold Index. The gold stocks performed fabulously after the CAPE Ratio reached major peaks in 1929, 1966 and 2000. The gold stocks bottomed several years prior to the CAPE peak in 1966 and perhaps we are seeing a repeat of that now. The gold stocks bottomed in early 2016 though the CAPE ratio has continued to rise. We hear plenty of talk about future returns being very low and there being no place to invest. To that, I present this chart!
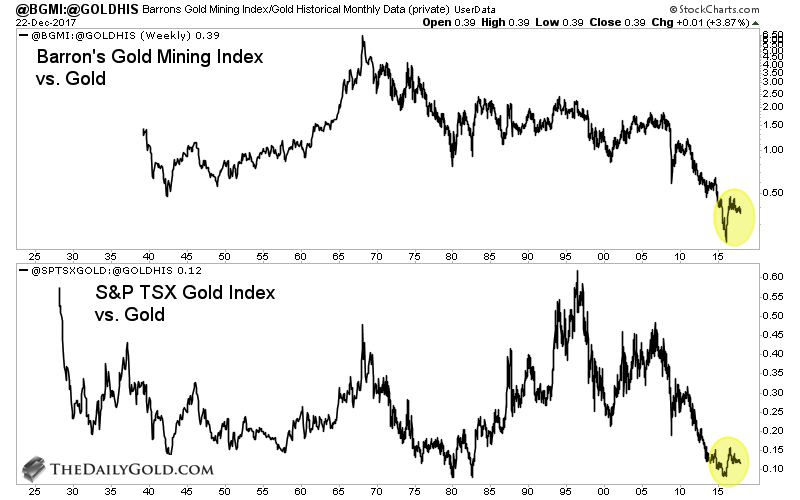
 Next we plot the gold stocks relative to Gold. We use both of the historical gold stock indices, (the S&P TSX Gold Index and the Barron’s Gold Mining Index). By the end of 2015 the gold stocks were historically cheap by many metrics. Interestingly, that includes Gold even though Gold itself at the time was down 45%!
 Finally, the last chart shows how cheap Gold potentially is. It’s important because the gold stocks could be very cheap when Gold itself may not be cheap. This was somewhat the case in 2012-2013 and that is why gold stocks remained a deep value for several years. However, since then Gold has become so much cheaper relative to the money supply, monetary base, equities, and even bonds. The chart below is from GoldMoney. They plot Gold against FMQ which is the quantity of fiat money.
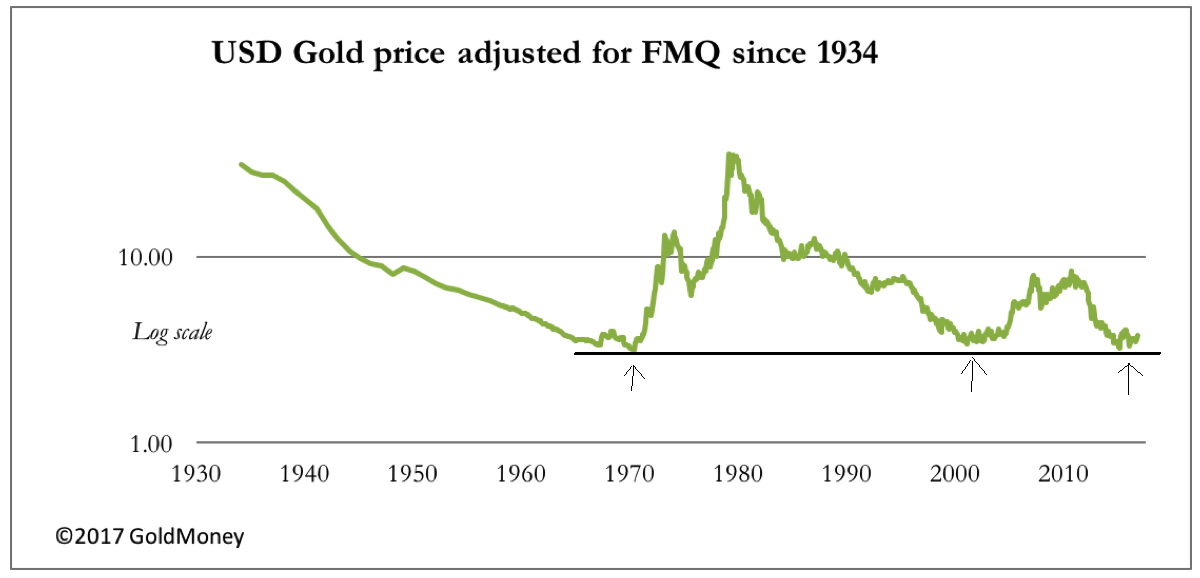 When we step back from the day to day and week to week wiggles in the gold stocks, we need to realize that a historic low is in place (January 2016) and after a nearly 18-month long correction and consolidation the sector remains extremely and extraordinary cheap on a historical basis. This, and not the wiggles in charts or market sentiment ensures that forward returns in the sector will be strongly positive. Those tools help with market timing and spotting risks and opportunities. While the recent low in gold stocks may be more significant than we think, history suggests a very strong second half of 2018 for the gold stocks. Moving forward, the key for traders and investors is to find the companies with strong fundamentals with value and catalysts that will drive buying. To follow our guidance and learn our favorite juniors for 2018, consider learning more about our premium service.
The gold miners’ stocks largely ground sideways in 2017, lagging gold’s solid rally. Being trapped in this vexing consolidation has decimated sentiment, leaving a bearish wasteland bereft of hope. But contrary to perceptions, this deeply-out-of-favor sector is actually a coiled spring today. Gold stocks are ready to surge dramatically higher as psychology inevitably shifts, pointing to much higher prices coming in 2018.
The main appeal of gold-mining stocks is their underlying profits’ leverage to gold. The gold miners are much riskier than gold itself, facing many operational, geological, and geopolitical challenges that the metal doesn’t share. Thus investors and speculators alike must be compensated for these large added risks with superior returns to gold. That didn’t happen in 2017, which is why gold stocks are so widely despised.
All year long, the extreme stock-market rally driven by hopes for big tax cuts soon stole the limelight from gold. The flagship S&P 500 stock index has blasted 19.7% higher year-to-date, stoking incredible levels of euphoria. That sucked all the oxygen out of the investment world, overshadowing everything else. So investors have largely shunned gold this year, since it is normally the anti-stock trade moving counter to stocks.
Usually soaring stock markets crush gold, like back in 2013. That year the Fed’s new third quantitative-easing campaign conjured $1020b out of thin air to monetize bonds. The resulting artificially-low interest rates fueled a stock-buyback boom, catapulting the S&P 500 29.6% higher. So investors felt no need to prudently diversify their stock-heavy portfolios with gold, thus this metal plummeted 27.9% lower that year!
Considering gold is often hostage to stock-market fortunes, it performed remarkably well in 2017 despite the endless record highs in major stock indexes. Gold was up 10.0% YTD as of the middle of this week, very impressive considering the circumstances. Gold miners’ inherent profits leverage usually enables their stock prices to amplify underlying gold rallies by 2x to 3x, so they should be up 20% to 30% this year.
The dominant gold-stock index is the HUI NYSE Arca Gold BUGS Index, which is closely mirrored by the leading GDX VanEck Vectors Gold Miners ETF. Unfortunately its performance this year has been utterly dismal compared to gold, with the HUI up just 1.8% YTD! That makes for horrendous leverage of 0.2x, wildly unacceptable considering gold miners’ big additional risks compared to the metal they bring to market.
There have been exceptions, with some miners far outperforming their languishing peers. This Tuesday in our weekly newsletter, we just realized 184% gains on a year-old trade in a leading mid-tier gold miner! The gold stocks have been tradable this year, seeing sizable rallies within their consolidation grind. But overall they’ve been drifting listlessly on balance, naturally wreaking great damage on sector sentiment.
Gold stocks are underperforming so massively this year due to sentiment. Because this small contrarian sector is languishing, traders want nothing to do with it. And because they are widely avoided, the gold stocks are trapped in consolidation hell. The only thing able to start shifting sentiment back to bullish is a meaningful gold rally igniting material gold-stock buying. The resulting gains would win back capital inflows.
Sentiment and technicals are inexorably intertwined. No matter what else is going on, when stocks are high traders get excited and bullish. That’s obviously happened in the stock markets this year, despite the Fed and the ECB on the verge of radical tightenings that will strangle this stock bull. The parabolic bitcoin mania is another wild case in point. But when stocks are down, traders naturally wax sullen and bearish.
As at all sentiment extremes, traders assume gold stocks are doomed to suffer this frustrating weakness indefinitely. But that’s a bad bet, as sentiment perpetually meanders back and forth between excessive greed and fear. The longer psychology remains on one side of that arc, and the more extreme it gets, the greater the odds for an imminent mean-reversion swing back the other way. Those tend to overshoot proportionally.
The last time gold stocks were this out of favor drifting near lows was the second half of 2015. The gold miners were left for dead, with nearly everyone predicting they would spiral lower forever. Yet sentiment shifted out of that bearish echo chamber, and the gold stocks skyrocketed like North Korean ICBMs. In merely 6.5 months, the HUI soared 182.2% higher! That amplified gold’s concurrent 25.2% rally by a big 7.2x.
2017’s painful consolidation is the perfect breeding ground for another monster gold-stock upleg in 2018. After spending a year basing at deeply-undervalued prices relative to today’s gold levels, it shouldn’t take much of a sentiment shift to catapult gold stocks way higher. From a contrarian standpoint this unloved sector’s technicals are actually quite bullish today, with the gold miners’ stocks wound up like a coiled spring.
Last year’s colossal gold-stock upleg that has already been forgotten is crystal-clear here. Contrarians willing to fight the herd and buy low in late 2015 when gold stocks were shunned made out like bandits. They nearly tripled their capital in a half-year! Once this sector starts moving, the resulting uplegs tend to be massive. The key is bucking popular bearish sentiment to get invested early before the crowd rushes back in.
That enormous upleg birthing a mighty new gold-stock bull last year was followed by a huge drop driven by gold. Since prevailing gold prices directly drive miners’ profits, gold stocks follow and amplify moves in the metal they mine. In the second half of 2016, gold plunged sharply thanks to a highly-improbable series of events. That was super-anomalous, thus gold bounced back this year despite the record stock markets.
First gold was hit by gold-futures stop losses being run, then slammed by the Trumphoria stock-market surge in the wake of November 2016’s surprise election results, and finally by the Fed’s second rate hike of this cycle. Seeing an isolated event-driven selloff isn’t unusual, but suffering three in a row back-to-back is unheard of! I explained each anomaly in depth in an April essay if you’re interested in getting up to speed.
Gold dropped 17.3% in 5.3 months, certainly a massive correction but shy of new-bear-market territory at -20%. Gold stocks as measured by the HUI amplified gold’s downside by 2.5x, smack in the middle of that historical 2x-to-3x-leverage range. So the huge gold-stock selloff in the second half of 2016 wasn’t outsized at all compared to the anomalous carnage in gold. That’s the way this sector has always worked.
Once again gold miners’ profits leverage to gold explains their price action. Consider an example, a gold miner producing gold at all-in sustaining costs of $1000 per ounce. At $1250 gold, that yields earnings of $250 per ounce. If gold rallies or falls 10% to $1375 or $1125, this miner’s profits literally soar or plunge 50% to $375 or $125 per ounce! The higher any miner’s costs, the greater its profits leverage to gold prices.
In Q3’17, the major gold miners of GDX reported average all-in sustaining costs of just $868 per ounce. At this week’s $1265 gold levels, that yields major-gold-miner earnings of $397 per ounce. This makes for hefty operating margins of 31%, levels most industries would kill for. Yet the markets are pricing gold stocks today as if they were running catastrophic losses. At the middle of this week, the HUI was near 185.6.
The first time this leading gold-stock index hit these levels in August 2003, gold was only trading in the $360s. Now it is 3.5x higher, the gold miners are far more profitable, yet their stocks are still ludicrously languishing at 14.3-year-old levels! This makes zero sense fundamentally, revealing the gold miners’ radical undervaluations today. Such extremes can only be driven by sentiment, and never last for very long.
The catalyst that will shatter this bearish-sentiment curse is gold rallying. At the GDX major gold miners’ latest average AISC of $868 in the third quarter, a mere 10% gold advance would boost mining earnings by 32% to $524 per ounce. That will rapidly shift psychology back to bullish. Just like in the first half of 2016, these ridiculously-low gold stocks will take off like rockets once gold starts decisively moving higher again.
And that’s likely very soon thanks to major central banks. This quarter the Fed just started quantitative tightening for the first time ever, to begin unwinding the trillions of dollars evoked into existence during its long years of QE. While QT only ran $10b per month in Q4’17, it will gradually ramp up next year to its terminal $50b-per-month pace in Q4’18! QT is exceedingly bearish for these surreal QE-inflated stock markets.
On top of that the European Central Bank will slash in half its own massive QE campaign from €60b per month to €30b monthly starting in January 2018. Between the Fed’s new QT and the ECB’s new QE tapering, 2018 is going to see the equivalent of $950b less central-bank capital injections than enjoyed in 2017! And in 2019 that will keep growing to another $1450b of central-bank tightening compared to this year.
With the Fed and ECB strangling this anomalous QE-levitated stock bull, gold will really shine again. As stock markets grind lower, investors will remember the wisdom of prudently diversifying their stock-heavy portfolios with counter-moving gold. Gold investment demand will soar again like in early 2016 after the last stock-market correction. Once gold resumes powering higher, capital will flood back into its miners’ stocks.
Gold’s potential upside next year is likely much greater than most think possible. This week the famous hedge-fund investor Doug Kass of Seabreeze Partners Management wrote about the 15 surprises that he expects in 2018. He sees these red-hot stock markets steadily declining all year long partially due to extreme overvaluations today. Kass writes, “Dip buying is not rewarded, but shorting the rips is rewarded next year.”
That will help reignite massive investment capital inflows into gold. Kass is forecasting, “Interest in gold, which has been sidelined for months amid the cryptocurrency frenzy, regains popularity, reverses direction from the lower left to the upper right and moves higher in price. In an abrupt and swift flight to alternative safety, gold makes new all-time highs and becomes the single best-performing asset class in 2018.”
That’s a major gold rally next year, as gold’s existing all-time high in nominal terms is $1894 which came in August 2011. That would require a 50% gold surge in 2018, which wouldn’t be outside the realm of plausibility if the stock markets roll over into a new bear market on central banks’ unprecedented radical tightening. Again after that last stock-market correction in early 2016, gold blasted 29.9% higher in just 6.7 months.
Of course the gold-stock upside in such a banner year for gold would be epic, especially starting with this sector so wildly undervalued fundamentally today. While I’m not as bold as Doug Kass to predict new all-time gold highs in 2018, it wouldn’t surprise me one bit to see this metal power 20% to 30% higher next year. That seems fairly conservative if the long-central-bank-delayed stock bear finally starts awakening.
The potential gains in the gold miners’ stocks during such a major new upleg are actually quite easy to estimate fundamentally. This last chart looks at the HUI/Gold Ratio, which simply divides the daily HUI close by the daily gold close. This HGR acts as a proxy for that core fundamental relationship between gold, miners’ profits, and their stock prices. This really drives home the coiled-spring nature of gold stocks today.
This week the HGR was way down near 0.147x, meaning the HUI was running at just over 1/7th of gold’s prevailing price. While that means nothing in isolation, the context provided by this long-term HGR chart reveals how absurdly cheap the gold stocks remain relative to the metal which drives their earnings. The only year in modern history where gold stocks were cheaper was 2015, the end of an exceptional secular bear.
Early in 2016 gold stocks per the HUI yardstick slumped to a fundamentally-absurd 13.5-year secular low as I pointed out in real-time. Though gold was trading near $1087, still way above this industry’s all-in sustaining costs, the HUI was trading at levels last seen when gold was near $305 in July 2002! Such an extreme anomaly couldn’t and didn’t last, resulting in the battered gold stocks nearly tripling in only a half-year.
That coiled-spring reaction perfectly illustrates how explosive gold-stock upside is after this sector suffers a long, low drift resulting in extremely-bearish psychology. If today’s 0.15x HGR was actually righteous, it would’ve been seen plenty of times in modern history. But it wasn’t. Such extremely-low gold-stock price levels relative to gold were only able to persist briefly after a long secular bear, they weren’t sustainable.
Remember the Fed started aggressively levitating the US stock markets in early 2013, wreaking havoc on alternative investments led by gold. The gold market’s last normal years were sandwiched between 2008’s stock panic and 2013’s radical Fed distortions. That’s the best recent baseline for where the HGR ought to trade. And between 2009 to 2012, this key fundamental ratio for gold-stock valuations averaged 0.346x.
To simply mean revert back up to those last normal levels relative to today’s gold prices, the major gold miners dominating the HUI and GDX would have to power 136% higher from here. To merely restore some semblance of normalcy fundamentally, the gold stocks literally need to more than double even at this week’s prevailing $1265 gold levels! Their prices can’t stay disconnected from their earnings forever.
But if gold indeed powers higher in a major new upleg next year as central-bank tightening drags stock markets lower, the gold-stock upside is far greater. At my conservative 20% to 30% gold rally in 2018, this metal would climb to $1518 to $1644. That yields HUI targets from 525 to 569, which are 183% and 206% higher than this week’s low levels. The gold stocks easily have the potential to triple in 2018 alone!
But that’s pretty conservative because it’s purely fundamentally-based, ignoring the impact of sentiment. All markets are cyclical, including gold stocks. Extreme undervaluations relative to gold are followed by overvaluations as the pendulum swings back the other way. Mean reversions after extremes never just stop in the middle at neutral sentiment. Their momentum leads them to overshoot to the opposite extreme.
This natural cyclical reaction makes gold stocks’ potential upside far more impressive. A proportional overshoot in HGR terms heralds radically-higher gold-stock prices ahead. This week the HUI is 0.20x under its post-panic-average 0.346x HGR. As trader psychology gradually swings from extreme fear back to extreme greed as gold stocks climb, it wouldn’t be a stretch at all to see the HGR shoot 0.20x over to 0.546x.
That would likely mark a major topping, not lasting long. But such an overshoot HGR at 20% to 30% higher gold prices would yield gold-stock-bull peak targets of 829 to 898 on the HUI. That’s a staggering 346% to 384% higher than this week’s levels! Where else in all the stock markets does a sector have the potential to quadruple or quintuple in the coming years? Gold and gold stocks climb even during stock bears.
If Doug Kass’s 2018 surprise proves correct and gold regains its all-time high of $1894 with a 50% rally, gold stocks’ probable upside is wealth-multiplying. It yields a neutral-sentiment HUI target at that 0.346x HGR of 656, and a crazy 1036 on a sentiment mean reversion to a 0.546x greed-drenched HGR! These make for respective potential gains of 254% to 458% in the major gold miners’ stocks, dwarfing all other sectors.
Don’t get bogged down in HUI upside targets, they only serve to illustrate a critical point for investors and speculators today. Gold stocks are not only wildly undervalued at today’s gold prices, but even more so compared to where gold is heading in its own still-very-much-alive bull market. Even if you think gold stocks only have 50% to 100% upside, that’s vastly better than everything else in these overvalued stock markets.
Once gold starts powering higher decisively enough to catch investors’ attention, the gold stocks will be off to the races like in early 2016. Like bitcoin this year, the more gold stocks rally the more traders will take notice and deploy capital. This process will soon become self-feeding, with more buying fueling higher prices leading to still more buying. That will yield massive gains to early contrarians who bought in low.
That begs the question what are you going to do about it? Are you tough enough mentally to invest like a contrarian, to buy low and out of favor when few others are willing? Can you handle fighting the crowd, making unpopular investments? Or will you take the mainstream approach, which is waiting to buy gold stocks until they’ve already doubled from here? The biggest gains are won by the early birds who buy the lowest.
While investors and speculators alike can certainly play gold stocks’ coming breakout rally with the major ETFs like GDX, the best gains by far will be won in individual gold stocks with superior fundamentals. Their upside will trounce the ETFs, which are burdened by over-diversification and underperforming gold stocks. A carefully-handpicked portfolio of elite gold and silver miners will generate much-greater wealth creation.
At Zeal we’ve literally spent tens of thousands of hours researching individual gold stocks and markets, so we can better decide what to trade and when. As of the end of Q3, this has resulted in 967 stock trades recommended in real-time to our newsletter subscribers since 2001. Fighting the crowd to buy low and sell high is very profitable, as all these trades averaged stellar annualized realized gains of +19.9%!
The key to this success is staying informed and being contrarian. That means buying low when others are scared, like late in this year’s vexing consolidation. An easy way to keep abreast is through our acclaimed weekly and monthly newsletters. They draw on our vast experience, knowledge, wisdom, and ongoing research to explain what’s going on in the markets, why, and how to trade them with specific stocks. For only $12 per issue, you can learn to think, trade, and thrive like contrarians. Subscribe today, and get deployed in the great gold and silver stocks in our full trading books!
The bottom line is the gold stocks still look like a coiled spring today despite the extreme bearishness plaguing them. Following its long drift in 2017, this battered sector is ready to stage a massive breakout upleg in 2018. The gold miners’ stocks remain deeply undervalued relative to current gold prices, let alone where this metal is heading. And gold will likely power much higher next year as stock markets roll over.
These bubble-valued stock markets artificially levitated by the central banks are about to face the largest monetary tightening in world history, literally trillions of dollars in the next couple years alone. Gold will quickly return to favor as usual when stocks materially weaken. The resulting investment capital inflows will lift gold, really boost gold miners’ profits, and motivate traders to return en masse to this abandoned sector.
Adam Hamilton, CPA
December 22, 2017
Copyright 2000 – 2017 Zeal LLC (www.ZealLLC.com)

Sitting in one of the most prolific mining camps, there is a company that has been aggressively expanding its resources through good times and bad. Now with renewed interest in gold mining projects, it is time to look at teams and resources that have weathered the storm and learned discipline to advance their project with current drilling underway.
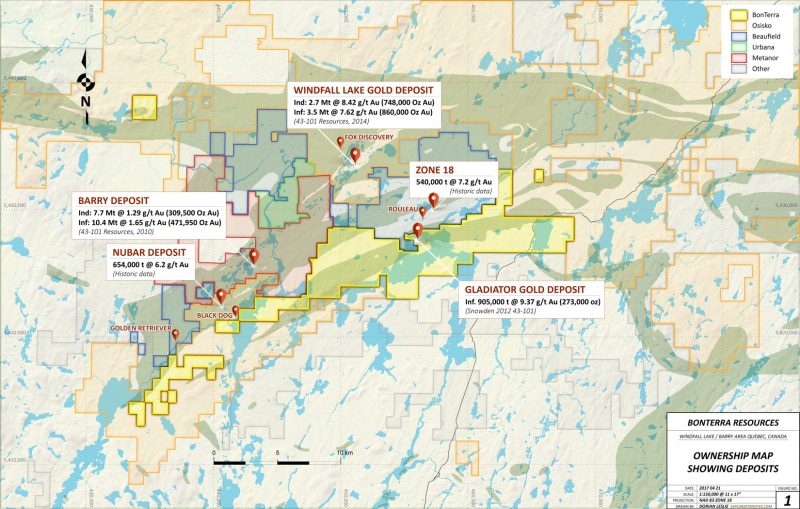
Bonterra Resources Inc. (BTR: TSX-V) ( BONXF: US) (9BR:FSE) is one such company that exemplifies determination and dedication to their deposit. Bonterra is a Canadian gold exploration company focused on expanding its NI 43-101 compliant gold resource on its properties in the Abitibi Greenstone Belt in the mining-friendly jurisdiction of Quebec.
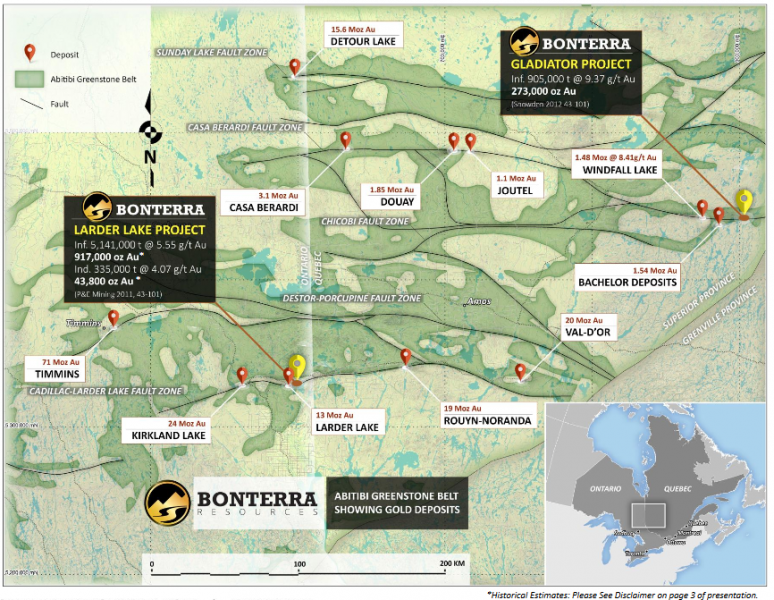
The company is currently drilling at its 10,541-hectare Gladiator Project. The drill program comprises over 50,000 meters utilizing a minimum of four drill rigs. Using a 4 g/t Au cut-off grade, the project currently contains an inferred resource of 905,000 tonnes, grading 9.37 g/t Au for 273,000 ounces of gold according to a Mineral Resource Estimate and technical report filed July 27, 2012, prepared by Snowden Mining Consultants. The company plans on completing 70,000 metres of drilling this year. With this drilling, expect the resource to expand when the company puts out its updated NI 43-101 Mineral Resource Estimate in mid-2018
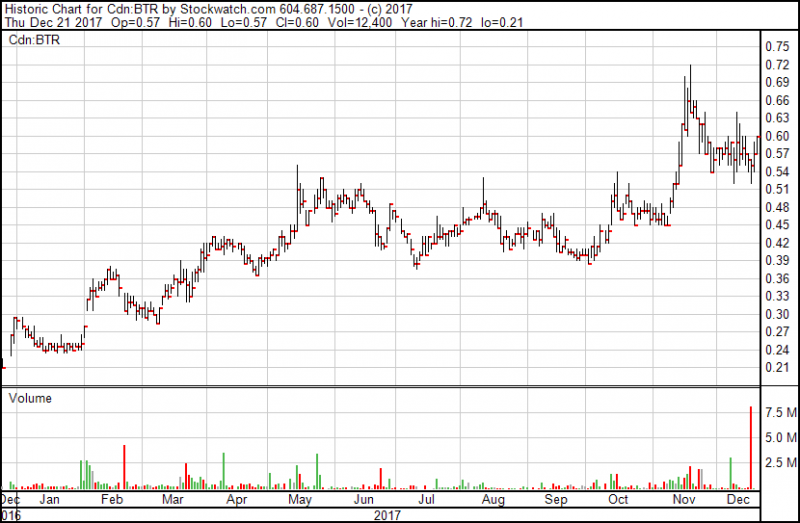
Recent drilling from Gladiator has impressed the market by reaching a year high of 72 cents. On Dec. 12, 2017, the company released drill results of 18.5 g/t Au over 4.0 m and 11.9 g/t Au over 3.2 m in the south zone which increased and further defined the size of the high-grade core area. Holes BA-17-42A and BA-17-48 improved the definition of the high-grade core of the footwall zone, with significant grade and width in hole BA-17-48, which intersected 10.1 g/t Au over 6.3 m. Holes BA-17-42, BA-17-43B and BA-17-46 confirmed the eastern continuity of the north zone, with an intersection of 9.6 g/t Au over 3.0 m. This recent drilling also extends the north zone down plunge to the east. Results from these seven recent drill holes have expanded the size and demonstrate the continuity of the north, footwall and south zones.
According to Dale Ginn, vice-president of exploration: “Drill results from Gladiator continue to demonstrate superior widths and grades in all five of our defined zones to date. These mineralized zones are not only visible with sharp contacts, but are continuous and highly predictable. Stand-alone high-grade gold deposits in Canada, especially with extensive infrastructure and easy access, are extremely rare and valuable and we look forward to demonstrating that Gladiator is among that class.”
The company can follow up on these results year round and access some of the more difficult ground with the recent upgrade to its camp to an all-season exploration camp at the Gladiator gold project. The expansion to a larger year-round exploration camp will help advance the company during at time when most explorers are taking time off and their share prices are dropping due to lack of activity. Furthermore, drilling in the winter firms up the ground and allows for improved access and drilling.
Ginn stated, “The expansion and construction of a year-round camp provides the key infrastructure required to ensure we execute our resource development program at the Gladiator gold project on budget and on time to meet the market’s expectations of a mineral resource update in 2018.”
Bonterra plans to mobilize two additional drills (totalling six) in early 2018 for a winter drilling campaign. In an interview with Jay Talyor, President Nav Dhaliwhal stated that they have about $8 to $10 million to spend on the winter campaign.
The Gladiator project has good neighbors with deep pockets and active projects on the go. In addition to good ground and neighbors, the company has a solid shareholder base with Eric Sprott holding 10%, Van Eck Gold Fund with 12% and Kirkland Lake Gold with 9.5%. The company has a cash position of $24,554,809 CAD as of its August 31, 2017 financials. The company has never been in a better cash position.
Ian Telfer once said that he invests in projects that have management who have an unshakable faith in their deposits. Bonterra has demonstrated this faith by weathering one of the longest bear markets for gold; not just weathering the storm, but advancing its project and growing the resource. With depressed gold prices, winter drilling to support share price and prove up the property, and an upcoming resource estimate due in mid-2018, right now presents an attractive entry point for investors to consider acquiring shares.
*Bonterra Resources Inc. is an advertiser with MiningFeeds.com. MiningFeeds was compensated for the creation and distribution of this article. MiningFeeds was paid a fee and does not hold any shares in Bonterra Resources. This is for informational purposes only and should not construed as investment advice.
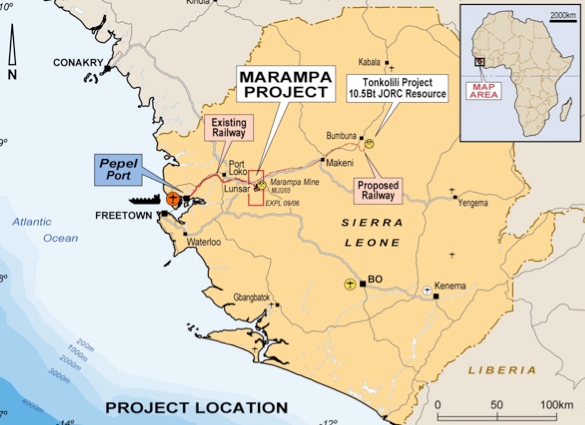
I wrote last week about ongoing concerns around the management of the Marampa mine, a massive iron-ore deposit in East Sierra Leone. After Gerald Metals failed to restart production since taking ownership of the mine in 2016 through their ‘SL Mining’ subsidiary, fears that the company’s creditors would cut their losses began to circulate. Now, it seems the situation is far worse than first thought. Troubling lawsuits, fleeing investors and some deep-seated concerns around the corporate social responsibility obligations may leave Gerald Metals’ top team of Craig Dean, Brendan Lynch, Pat Crepeault and Gary Lerner exposed as we head towards the new year.
Last week the Government of Sierra Leone, which had been dissolved for the Christmas break since early December, rushed through the ratification of legislation that renewed Gerald Metals’ mining licence at Marampa [1]. After weeks of scrutiny and claims that Gerald Metals were days from having their licence revoked, the news will have come as a great relief to the company’s management team. However, this has proven to be something of a false dawn.
Since my last article for Mining Feeds, reports have now reached me that the Revolving Credit Facility, on which Gerald Metals relies to run its Marampa project, is undersubscribed.
In 2014, the last time the Revolving Credit Facility was renewed, appetite from investors was such that the facility had to be upsized by $50m to account for interest [2]. That confidence is now in short supply. Earlier this year, Gerald’s equity partners, Pengxin International Mining Co., jumped ship, which was worrying enough [3]. But now that several lead investors in the RCF, two Lloyds of London syndicates and a pair of Israeli and French banks, have completely pulled out of renewing their credit lines, serious questions must not only be asked over Gerald Metals’ continuing ability to guide Marampa through care and maintenance; they must be asked of their credit worthiness full stop.
So, what has gone so wrong for Gerald Metals, a veteran commodities house with 50 uneventful and profitable years of business, in their dealings in Sierra Leone?
For a start, investors know more than anyone that when it comes to a faltering business, the fish rots from the head. It is easy to point the finger at the disastrous iron ore price crash that shook the global industry in 2014; but whilst plenty of firms were rattled by the drop, very few are still yet to recover. Allegations of inexperience have been levelled at Craig Dean, the CEO of Gerald Metals, since he unexpectedly took the top job, joining the firm from Deloitte in 2013. Since then, it hasn’t been the easiest of tenures for Craig Dean: between fighting allegations of sexual harassment from his former General Counsel, Roxanne Khazarian [4], and being sued by Australian commodities giant, Cape Lambert Resources, for breach of contract [5], it’s hardly surprising the embattled CEO hasn’t kept his eye on the ball.
But in truth, the issues go far beyond management. Anger on the ground in Lunsar has grown since Gerald Metals has failed to make good on pledges to support local community projects around the Marampa site. Tensions were also raised last month when Ibrahim Alusine Kamara, an investigative journalist with the Sierra Express who had been routinely reporting on management issues at Marampa, ended up in hospital after a brutal assault.
With a Presidential election around the corner in Sierra Leone, foreign investors will be keeping a very close eye on things, paying particular attention to the current business environment. Sierra Leone relies on a vibrant mining sector both as its economic base and golden ticket to the global marketplace. So, the Bai Koroma administration must make sure that the sorts of issues we are seeing at Marampa are identified and addressed before investor confidence is damaged. After all, the fish rots from the head in government too.
[1] http://www.miningglobal.com/
People are, by far, the most important facet of any business. This is especially true in the resource sector, as mining is a risky investment even when the best people are involved in the project. You might be thinking, ‘but I have to pay a premium for the best people.’ Well, that may be true sometimes, especially if you were unable to buy the best people during a bear market.
It’s my contention that, over the long haul, investing in the best people will always put you in the best possible position to succeed. But, don’t take my word for it; here’s a quote from Rick Rule, President and CEO of Sprott U.S. Holdings, from an interview I did with him a few months back:
“The truth is, if you have the guts to invest in bad markets, you can buy the best properties and the best management teams very cheaply. In the market that we are heading into, a bull market, however, other sets of circumstances are true and I would suggest to your readers, unless they are prepared to devote a minimum of 20 hours per week to their speculative portfolios, that they give up the optionality associated with new management teams and focus on investing around the best of the best, even being willing to accept those premiums.” ~ Rick Rule – Junior Stock Review Interview
Today, I have for you an interview with Brian Dalton, CEO of Altius Minerals. In my opinion, Dalton is as good as it gets when it comes to people in the resource sector, and this is the biggest reason why I am a shareholder of the company. Recently, I had the chance to meet with Dalton and to ask him a few questions, learning a little more about the company and the man leading Altius Minerals.
Enjoy!
![]()
Altius Minerals – TSX:ALS
MCAP – $625.7 M (at the time of writing)
As of October 31, 2017
Common Shares Issued – 43,187,291
Fully Diluted – 50,743,614
Annual Royalty Revenue – Last 12 months – $60.1 M
Total Debt – $70 M
Cash – $29 M
Equity Portfolio – $84 M, including $10 M convertible loan to Champion Iron
A Conversation with Brian Dalton
In my opinion, one of the biggest issues facing most people is their lack of self-awareness. Whether it be in their investments or their personal lives, many people either have no idea or are prone to lying to themselves about where they are strong and where they are weak and, thus, typically fall short of their goals and aspirations.
Dalton, however, appears to be very in-tune with his own strengths, as well as those of his team. Altius Minerals has been very successful over the last 20 years because they have played to their strengths and, therefore, in my opinion, are in a class of their own when it comes to the mining business.
Quoting Dalton from an interview he did with BNN on February 28th of this year,
“We don’t see anything in our skill set that would make us suitable to run major industrial operations, but we can evaluate projects that are going to work, and their future, and their exploration potential” ~ BNN
This is a very introspective comment, one that has proven to be very advantageous for Altius and its shareholders.
For those who aren’t familiar, Altius was founded by Dalton and the rest of the team while they were in university. Playing to their strengths, Altius’ business plan is to buy or stake exploration properties in the midst of crisis, which can later be sold in a market upturn, while keeping a royalty on each. Additionally, Altius has used proceeds from these sales to purchase a diversified portfolio of mining royalties from producing mines.
In my conversation with Dalton, I asked about the origins of the company and how they built a tiny junior into the sector’s first diversified mining royalty company.
Brian Dalton: “When the market started to get better in 2001 and 2002, we had a bit of a head start on everyone because we’d stayed busy right through the downturn. The market got behind us and we were first able to buy a royalty on Voisey’s Bay in 2003. It was a really big bet for us costing $10 million dollars, which was essentially our full market cap, but we felt comfortable with it.
The market continued to get stronger and stronger and all of these early exploration lands we’d been buying in the downturn, which we had bought really cheap, suddenly became what everyone wanted. The market wanted to pay for exploration land and we were able to make an awful lot of money over the course of that cycle just by literally monetizing the value of the exploration land, all the while keeping our royalties.
Fast-forward to about 2011 and the end of the big bull run in the market, and we found ourselves with a lot of cash, over $200 million. I can remember we started the cycle with less than a $1 million market cap. The most important thing to remember is that these were profits, not money we raised in the market selling our stock.
From here, we wondered what we should do as a business model, we had been building up a big portfolio of royalties for our exploration properties, but now we had this cash. We said, ‘let’s buy some production stage royalties as well and fill out a whole portfolio which would include production stage, exploration stage investments.’
It took a while when that strategy was first started, as the market was really hot, price expectations for the commodities were off scale and everything was just hot, and then boom, everything died, exploded actually. Suddenly, every mining company in the world looked as though they were going to go bankrupt and it was chaos. Many believed that it was over for the sector.
At which point, we said, ‘OK, it’s probably about time.’ So we put all that money to work and we borrowed on top of that and we bought 14 more royalties through that period, right through the carnage. That’s the period between 2014 and 2016.
We had a diversified approach, we bought potash, copper, iron ore, zinc. We basically created the first real diversified mining royalty company.”
For me, jurisdictional risk is an interesting subject because everyone has their own criteria for what constitutes risk. For most, jurisdictional risk is most closely tied to the politics of the country in question, or the politics of a neighbouring country.
Question – How do you view jurisdictional risk and how does it affect Altius’ investment strategy?
Brian Dalton: “Most would look at our portfolio and the places that we work as pretty low risk. I use a really simple rule of thumb. More or less, would I be willing to put someone there and feel comfortable, am I able to sleep at night and would I visit there with my kids? If I am able to get through these points, I’m usually pretty good. Now, that’s a very high level, the basic kinds of risks.
Generally, we like to make most of our investments when things are in true, utter chaos and crisis. It turns out that when money turns off, it really turns off everywhere. We tend to use the downturns as an opportunity to get into the best places.
As it turns out, the best places are the places where money returns to first. We’ve never felt the need to chase a lot of political risk to find value because we find value just by buying in the right part of the cycle.
Oddly, what we thought was the lowest risk of all the acquisitions that we have made, be it exploration or production assets, according to commentary or how institutions would have risked it. The absolute lowest risk assets were a bunch of things in Alberta that we bought, which turned out to be the biggest political disaster you’ve ever seen. You can never get it right. To me, right now, Alberta has more political risk than the Congo, I am not saying we are going to the Congo, but that is the kind of thing we’ve got.”
NOTE: In 2016, Altius recorded an impairment charge of $72 million as a result of the Alberta provincial government – NDP – committing to end coal-fired electricity generation by 2030. One of their large coal royalty assets – Genessee – is expected to produce well beyond 2030, and the impairment charge was the deduction of those years of projected cash flows that are cut off because of the government’s decision.
In October of this year, I had the chance to visit western Newfoundland. The purpose of my trip was to visit two operating mines in the northwest portion of the island, near Baie Verte, and an exploration project in central Newfoundland, just south of Millertown. (Site Visit Article Series – Part 1, Part 2 and Part 3)
During my visit to Rambler’s Ming Mine, I spoke to Larry Pilgrim, their Chief Exploration Geologist. In our conversation, Pilgrim said that there were enough prospective targets just in the Baie Verte Peninsula area to last him 3 lifetimes.
Question – What do you think about Newfoundland and Labrador as a destination for mining? How much mineral potential does the province have?
Brian Dalton: “It’s still pretty wide open. The thing about Newfoundland geology is that there isn’t anywhere else, that I know, with that size of an area, that has as many different geological terrains and environments. It is the proving ground for plate tectonics, it records everything.
In the past year, we’ve made discoveries in Northern Newfoundland for a type of mineralization that nobody has ever looked at. Two years ago, everyone would have said that Newfoundland is the last place you will find silver. What do we do? We go into an area we shouldn’t, and find a bunch of silver. Up in the same area, someone’s come up with a new style of gold mineralization, which had never been conceived.
Is there still upside potential in Newfoundland? You better believe it. Newfoundland has been a happy hunting ground for us for 20 years, and I could see another 20 there, too.”
In my view, we live in a society of paradigms or bias that lock us into thought patterns that keep many of us blind to other alternatives – alternatives that may be more efficient or beneficial.
Question – Whether it be financial, political or social, in your opinion, how does one keep an open mind and see through paradigms and their own inherent bias?
Brian Dalton: “I guess it is just experience, when you do something enough times and it works. Sometimes, things just don’t feel right and when you go the other way and it works, those things have a way of compounding over time.
The things we did in the first cycle that were clearly contrarian were the things that were the very best things we did. So when it came down to 2015 and 2016, when every headline out there was predicting the end of the mining industry as we know it, everyone is going to go bankrupt, then you step back and say, ‘everybody can’t go bankrupt. It doesn’t make any sense.’
So this must be an opportunity, I’ve been here before. The same goes for the exploration side of things. When every major says their exploration budget is zero, there must be opportunity there. This stuff becomes self-fulfilling.
The challenge that most people have is even when the fellows running the mining company believe there is a great opportunity and now is the time they should be doing it, and they have the conviction to do it, they don’t have the means.
Alternatively, at the very top of the market, prices are going and going up forever more. That’s when their shareholders are screaming at them to build, and they’re giving the money to do it. So it actually becomes one of those things where, you get in trouble if you don’t respond to the demands, and you end up doing the wrong thing, which will ultimately, probably, get you fired. So they’ve got no choice but to do it. Which then leads to two or three years after the price gets paid and then they get fired, pretty thankless.”
Question – My last question pertains to the future of Altius; where do you see the company in 15 years?
Brian Dalton: “15 years, I think this cycle could be that long. The cycles are getting longer because of the time it takes for the industry to switch from depression to optimism and then to euphoria. Our basic business plan for this, we started in ’97, saw the bottom in 2000 and a top in 2011. So around 2016 would be one full cycle for all of us.
We look at ourselves now as going into our second cycle. We have gone from a million dollar to 500 million market cap, burning money to making, you know, 70 or 80 million annually. We’re not planning to change much. There’s things we’ll try to do better, there are lessons that have been learned.
By the end of the next cycle, I just hope to see us in a similar position. We went to the top of the market and were smart enough to go long cash, at that point, and when the inevitable happens and the next big crisis unfolds, we were there and we were able to seize it.”
Before ending the interview, we did a few rapid fire questions; bull or bear?
Gold – Agnostic
Silver – Bullish
Copper – Mega bull! Geology driven supply challenge which is the best force possible to have at play
Nickel – Very Bullish
Zinc – Very Bullish right now
Iron Ore – Super Bullish
Uranium – Short-Term Bull, Long-Term quite pessimistic
Lithium – Bullish that it becomes a real commodity, Bear short-term on price
Concluding Remarks
People are what make companies successful. Investing in the best people, in my opinion, helps tilt the odds of success in your favour. From my conversation with Brian Dalton, I believe I received a good glimpse into Altius and the man in charge. I left with a few takeaways; here’s a summary of my thoughts:
- Be contrarian, don’t follow the crowd – There are two major points in my life when I have been contrarian; first was putting 2/3 of my net worth into the junior resource sector in 2014 and 2015. Second, was leaving my 10 year career in steel to pursue a passion – investing and writing. During those periods in my life, a number of people told me I was crazy, and at times, I thought I might be. Sitting here today, I can say that both moves rank among the best decisions I have ever made in my life.
- Newfoundland and Labrador is a premier jurisdiction for mining today and will continue to be in the future – I highly encourage those who haven’t visited this province on Canada’s east coast to do so, and in the process, see if you can do a few site visits; it will change your perspective on investing in the resource sector.
- Stick with a long-term view of the market – Invest in the best people and give them the time that is needed to execute a plan. Having a long-term view will help weather the intermittent periods of bearish sentiment in the sector, as even in a bull market prices have periods of down or sideways movement.
Don’t want to miss a new investment idea, interview or financial product review? Become a Junior Stock Review VIP now – it’s FREE!
Until next time,
Brian Leni P.Eng
Founder – Junior Stock Review
Disclaimer: The following is not an investment recommendation, it is an investment idea. I am not a certified investment professional, nor do I know you and your individual investment needs. Please perform your own due diligence to decide whether this is a company(s) and sector that is best suited for your personal investment criteria. Junior Stock Review does not guarantee the accuracy of any of the analytics used in this report. I do own shares in Altius Minerals. I have NO business relationship with Altius Minerals.

1. Are government, central banks, and fiat money the three biggest bubbles in the history of the world? I would suggest they are.
2. The rise of private money (bitcoin) combined with the rise of China and India as economic empires is popping these bubbles. Against bitcoin, fiat is now burning like an out of control wildfire.
3. Within a year or two, it could begin disintegrating against gold in a somewhat similar manner. Whether that happens or not depends on whether a blockchain currency backed with gold gets widely accepted in the blockchain community. I predict that it likely happens.
4. Simply put, fiat is a barbaric relic and the younger generation isn’t interested in relics. There are almost three billion citizens in China and India. Many of them are obsessed with gold, and almost all of them respect it as the ultimate asset.
5. There are about 600 million Indian citizens under the age of 35. They are now getting a taste of private money with bitcoin, and they like it! Blockchain is newer than fiat. It’s technologically superior. Fiat is like a rotary phone, and millennials want to trade up for the newest Iphone. In the currency world, that’s blockchain!
6. Many analysts have noted the strong seasonal tendency for gold to rise from late December or early January until mid-February.
7. To understand why that happens, please click here now. About 65% of all gold demand comes from China and India, and that demand increases exponentially with income growth. Incomes are growing, so Chinese New Year gold price rallies are intensifying.
8. The rally begins as Chinese New Year buying begins. It ends when that buying ends, which is in mid-February for 2018.
9. Note that China’s businesses (including gold shops) close for a week as the celebrations end. Commercial traders on the COMEX tend to buy long positions in gold ahead of Chinese New Year (now), and then short it as the demand begins to peak.
10. A huge number of savvy Indian investors will also buy gold ahead of Chinese New Year to get in on the action. The price premium in India tends to rise as that happens.
11. It’s risen to above 12% in the past few weeks.
12. Please click here now. Double-click to enlarge this daily gold chart. Chinese New Year celebratory buying should see the price easily reach my $1310 area target.
13. The bull wedge pattern looks fabulous. The current $1265 area supply zone is likely just a short term pitstop on the way to prices well above $1300 by mid-February.
14. Top analysts at Goldman Sachs are predicting a rise in Indian GDP growth to 8% for 2018. That should be occurring as the Indian gold market restructuring gets completed. In India, as incomes grow, gold demand increases even more exponentially than it does in China.
15. I’ve talked about the importance of getting more global rate hikes to boost inflation and commodity prices in the late stage of the business cycle. Gold stocks can’t really perform well relative to bullion if that doesn’t happen.
16. On that note, please click here now. Goldman analysts clearly agree with my take on the situation for 2018, and a lot of powerful institutional money managers rely on Goldman’s analysis.
17. It should be a great year for commodities in 2018. As the commodities rally, I’m predicting that new ICOs (initial blockchain coin offerings) will occur, featuring coins that are linked to various commodities.
18. If this happens, it could add intensity to the general commodity price rally.
19. Please click here now. All investor eyes should be on key 200 number for the CRB commodity index. There’s a base pattern in play, and a move above 200 would be a major breakout.
20. This base pattern is in sync with the fundamentals. There was a big move higher during the late stages of the last business cycle in 2008. That was a speculative move and OTC derivative bets were rampant.
21. This move higher in commodities should be steadier and continue for a long time. Twenty years of deflation have ended, and a long term upcycle for inflation is beginning.
22. Please click here now. Double-click to enlarge this solid looking GDX chart. GDX should be able to reach my $25 – $26 short term target zone by mid-February.
23. Note the nice inverse head and shoulders bottom pattern in play, with the head forming in a big support area near $21.
24. More importantly, I expect that as the CRB index moves towards 240 – 280, that should trigger enough inflation-oriented institutional buying of gold stocks to send GDX into my medium term $31 – $37 target area. Are all gold bugs taking their seats on the inflationary train? I hope so, because it’s pulling out of the station very soon. All aboard!
Thanks
Cheers
St
https://www.gracelandupdates.
Email:
Stewart Thomson is a retired Merrill Lynch broker. Stewart writes the Graceland Updates daily between 4am-7am. They are sent out around 8am-9am. The newsletter is attractively priced and the format is a unique numbered point form. Giving clarity of each point and saving valuable reading time.
Risks, Disclaimers, Legal
Stewart Thomson is no longer an investment advisor. The information provided by Stewart and Graceland Updates is for general information purposes only. Before taking any action on any investment, it is imperative that you consult with multiple properly licensed, experienced and qualified investment advisors and get numerous opinions before taking any action. Your minimum risk on any investment in the world is: 100% loss of all your money. You may be taking or preparing to take leveraged positions in investments and not know it, exposing yourself to unlimited risks. This is highly concerning if you are an investor in any derivatives products. There is an approx $700 trillion OTC Derivatives Iceberg with a tiny portion written off officially. The bottom line:
Are You Prepared?
In recent days the gold stocks (GDX, GDXJ) traded within 1% of our downside targets of GDX $21.00 and GDXJ $29.50. Last week we wrote: “the miners are getting oversold and a bounce could begin from those levels.” GDXJ troughed first last week at $29.84 while GDX printed a low of $21.27 on Monday. From their September peaks down to those lows, GDX and GDXJ had declined nearly 17% and 21% respectively. They are oversold, nearly touched good support and now the rate hike is behind them. We expect a rally in the sector well into January.
With a rebound underway we should turn our attention to potential upside targets. GDX closed the week at $21.99. It has resistance at $23.00 including its 200-day moving average at $22.83. GDXJ closed at $31.46. It has resistance at $33.00. Its 200-day moving average is at $33.49. In case we are being too conservative, our optimistic upside targets would be GDX $23.50 and GDXJ $33.50.
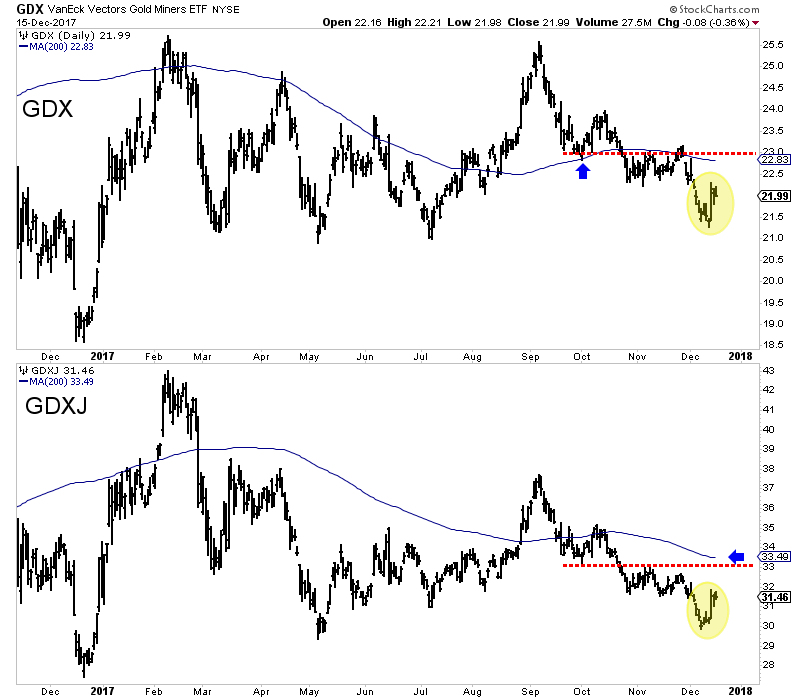
While mid to late December has been an excellent buy point over each of the past four years, we do not expect the gold stocks (this time) to match those fabulous returns. The gold stocks are not currently as oversold as they were in each of the past four years. The bullish percentage index (BPI), a breadth indicator is currently at 21.4%. Aside from the December 2015 low (which came in January 2016 at a BPI of 12%), the BPI at previous lows did not exceed 10%. Furthermore, a look at the rolling rate of change for 100 days and GDX’s distance from its 100-day exponential moving average shows that GDX currently is nowhere close to as oversold as those four previous points.
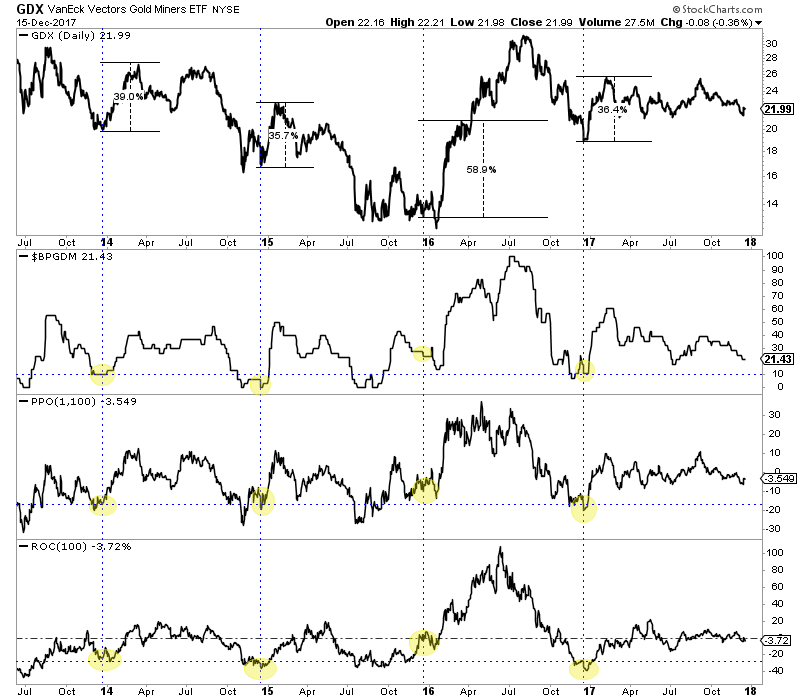
Another reason we should not expect a sizeable rebound is metals prices do not have much room to rally before running into strong resistance. Gold closed the week at $1257. It faces long-term moving average resistance at $1266-$1268 and very strong resistance above $1280. Silver meanwhile could find strong resistance at $16.60 to $16.75. Its 200-day moving average is at $17.01 and declining. Silver closed the week at $16.06.
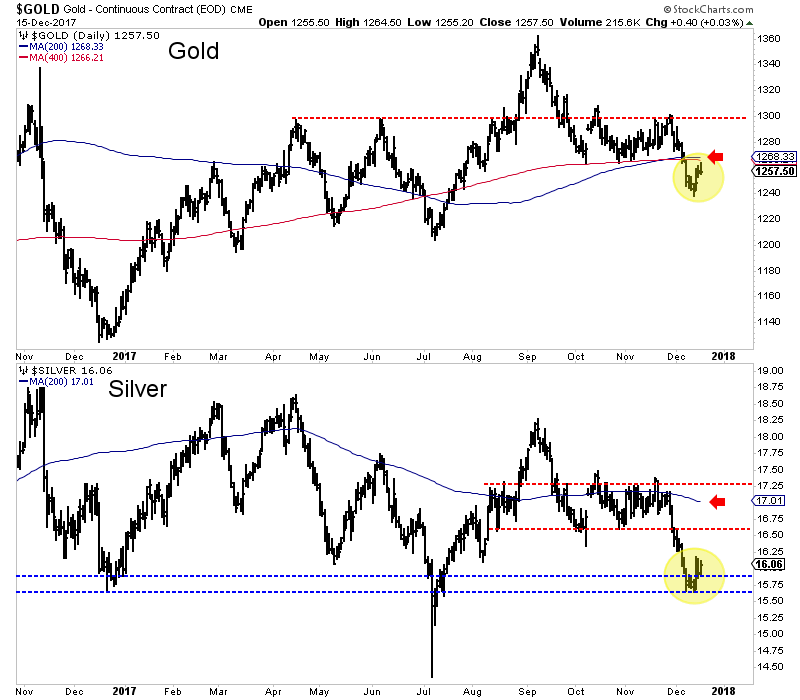
Precious metals and gold stocks especially have begun a rebound that should last at least three or four more weeks. Due to a lack of an extreme “long-term” oversold condition (like in each of the past four December’s) and the presence of nearby overhead resistance, we would not expect sizeable gains. Another reason is strong fundamentals for precious metals (namely declining real interest rates) are not yet in place. With all that being said, some values are starting to emerge in the juniors and the sentiment in the sector has become encouraging from a contrarian standpoint. Conditions are improving but it remains early to be outright bullish on the sector. In the meantime, the key for traders and investors is to find the oversold companies with strong fundamentals with value and catalysts that will drive buying. To follow our guidance and learn our favorite juniors for 2018, consider learning more about our premium service.
Jordan@TheDailyGold.com
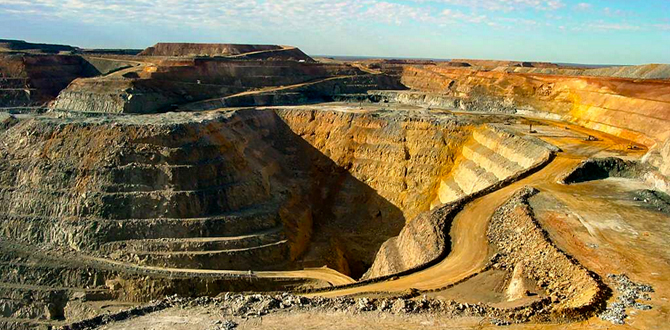
by Linus Booker
It is said that the most valuable commodity in Sierra Leone is diamonds. But in my experience, one commodity is priceless: trust. Contracts move, governments are ousted and money changes hands all the time, but the one thing you cannot buy in Sierra Leone is trust.
I’ve been based in Geneva from most of this year, but have been on a project in Freetown for the last 10 weeks. The talk of the town is all about how the creditors attached to one of the biggest foreign-owned mining investors here may be about to discover the value of trust the hard way. But if this blows up, knowing where to place the blame may raise as many questions about creative accounting as it does about management.
First, some context: there is a vast iron ore mine in the east of Sierra Leone that has the potential for 40 years of mining. The Marampa mine was first developed by London Mining, the erstwhile giant of African mining, before being snapped up and developed by one of Frank Timis’s companies when London Mining went bust. After the iron-ore price crashed in 2014, things went very quiet at Marampa before ownership quietly transferred to company called ‘SL Mining’ owned by Connecticut-based Gerald Metals. The iron ore price has since recovered, but production is yet to resume at Marampa. What’s more, lingering concerns over how Gerald secured the Marampa licence in the first place has meant that scrutiny on the ground is mounting by the day.
Since mid-November there have been concerns voiced in the local newspapers in Sierra Leone about Gerald Metals. Articles have variously claimed that Gerald Metals is under serious pressure from the government over its dismal performance, or claimed that Gerald Metals is about to lose its mining licence. Wednesday’s news from Freetown tells us Gerald Metals has some support of the government, but for many observers this too will raise more questions than it answers.
Since Gerald Metals first acquired the licence at Marampa, rumours of foul-play have surrounded the company. Their near-overnight acquisition of the mine in March this year did not go unnoticed by newspapers here in Sierra Leone, with the kindest criticism being raised over inexperience of the new management. Given the problems restarting production at Marampa, it does seem fair to ask what faith should be placed in Gerald’s CEO, Craig Dean, who trained as a forensic accountant at Deloitte, not in metals trading, not even in mining.
For creditors, keeping an eye on the Deloitte connection may be sensible. Deloitte currently represents Gerald Metals. The accountancy firm has enough trouble on the African continent already, and by all accounts, the scandal surrounding the Steinhoff empire is yet to run its full course. Newspapers are already suggesting that an investigation into Deloitte’s compliance with international audit standards is around the corner.
And those checks may come sooner rather than later. Why? Well, according to reports online, Gerald’s credit lines for Marampa are up for review.[1] Banks like BNP Paribas, Credit Suisse, Deutsche Bank and Credit Agricole will be weighing the merits of renewing the $225m float currently attached to Marampa. Presumably in response to mismanagement of Marampa, the creditors have already decreased their exposure following an initial float of $300m for Gerald in 2014. So, any news of accounting irregularities, added to the fact that production at Marampa remains dormant, could spell real trouble for Gerald’s credit lines. With BNP Paribas still smarting from the $8.9 billion fine it received for its ties with Cuba, Iran and Sudan, this is no time for their compliance teams to risk another scandal on the books.
So, Gerald may have been given a stay of execution from the Government of Sierra Leone, but it remains to be seen if their creditors will be so merciful.
[1] http://www.tfreview.com/news/
Linus Booker is principal consultant with Chavenage Mining Consultants, an independent practice he established in 2005. Previously a contractor with a number of blue-chip extractive firms, Linus has worked in Zambia, Russia and Sierra Leone, and is currently based between London and Zurich. He is married with three children.
Gold has been battered lower in recent months as gold-futures speculators fled in dread of the Fed-rate-hike boogeyman. As universally expected, the Fed’s 5th rate hike of this cycle indeed came to pass this week. When gold didn’t collapse as irrationally feared, the cowering futures traders were quick to start returning. Past Fed rate hikes have actually proven very bullish for gold, and this latest one will be no exception.
Back in early September, gold was sitting pretty near $1348. It had rallied dramatically out of its usual summer-doldrums low in its typical major autumn rally, blasting 11.2% higher in just 2.0 months. But even way back then, Fed-rate-hike fears for the FOMC’s December 13th meeting started creeping in. When gold peaked on September 7th, federal-funds futures implied December rate-hike odds running just 32%.
Over the next 8 trading days leading into the September 20th FOMC meeting where the Fed birthed its unprecedented quantitative-tightening campaign, those rate-hike odds climbed as high as 62%. That day’s FOMC statement and subsequent Janet Yellen press conference blasted the December rate-hike odds even higher to 73%. So gold slumped back down to $1300 as futures speculators sold in trepidation.
By early October as these futures-implied rate-hike odds hit 93%, gold fell as low as $1268. Over the mere one-month span where December rate-hike odds nearly tripled from 32% to 93%, gold dropped 5.9% on heavy spec gold-futures selling. That erased nearly 6/10ths of its autumn rally, which really weighed on sentiment. Gold still managed to stabilize around the $1280s in late October and November.
Starting early last month, federal-funds futures traders became so totally convinced the Fed would hike this week that their implied odds hit 100%. They stayed pegged at total certainty for 27 trading days in a row. Gold was able to stage a minor rally to $1294 surrounding Thanksgiving, but speculators resumed dumping gold futures in early December. Thus gold fell as low as $1242 leading into this week’s FOMC decision.
Gold-futures speculators have always deeply feared Fed rate hikes. Their rationale is simple and sounds logical. Since gold pays no interest or dividends, it will struggle to compete with bonds and stocks in a higher-yielding world following Fed rate hikes. Therefore gold investment demand will wane, leading to lower gold prices. Speculators always attempt to front run their forgone conclusion by selling gold futures.
This scenario has played out for three Decembers in a row now. The Fed kicked off this rate-hike cycle back in mid-December 2015 with its first rate hike in 9.5 years. A year ago in mid-December 2016 the FOMC made its second rate hike. And following two more hikes earlier this year, the Fed’s newest mid-December hike this week was the 5th of its current cycle. Gold-futures speculators sold aggressively into all.
So gold’s slump into this week on more Fed-rate-hike fears is certainly nothing new. The lead in to this December FOMC meeting is starting to feel like that old Bill Murray movie Groundhog Day. So the key question gold investors need to ask today is how did speculators’ excessively-bearish gold-futures bets play out after the prior couple Decembers’ rate hikes? Did gold crumble in the face of higher rates as feared?
This first chart superimposes gold during this current Fed-rate-hike cycle over speculators’ collective long and short positions in gold futures. Gold is rendered in blue, and speculators’ total number of upside and downside contracts in green and red respectively. This gold-futures data comes from the CTFC’s weekly Commitments of Traders reports, which are published every Friday afternoon current to the preceding Tuesday.
Gold-futures speculators have long been utterly convinced gold’s mortal nemesis is Fed rate hikes and the resulting higher prevailing interest rates. They fervently believe a sterile asset like gold simply can’t compete in a rising-rate environment. And to their credit, these elite traders sure aren’t afraid to put their money where their mouths are. Their trading surrounding past December hikes illuminates gold’s path today.
Way back in December 2008, the Federal Reserve panicked and slashed interest rates to zero for the first time in its history. For years after that, top Fed officials talked about normalizing rates but never had the courage to start. But finally in late October 2015, the FOMC started getting serious about ending its ridiculous ZIRP anomaly. The Fed warned it might “be appropriate to raise the target range at its next meeting”.
That would be December 16th, 2015. Since there hadn’t been a Fed rate hike in nearly a decade, the gold-futures speculators freaked out. Extreme selling erupted as they rushed to dump gold-futures long contracts while catapulting their short positions higher. So between mid-October and early December that year, gold plunged 11.4% to a major new secular low. Surely rate hikes doomed zero-yielding gold!
After years of broken promises to end ZIRP, the Fed indeed hiked for the first time in 9.5 years in mid-December 2015. Gold rallied 1.1% that day, but plunged 2.1% the next to edge down to a brutal 6.1-year secular low of $1051. With relatively-low longs and extreme record short positions, speculators had heavily bet that was just the beginning of gold’s woes. Their positions were exceedingly bearish into that hike.
But gold didn’t collapse as they expected, it stabilized. Speculators had sold such huge amounts of gold-futures contracts that their selling was exhausted. Thus they had no choice but to start unwinding their own hyper-leveraged bearish bets. So after that initial Fed rate hike of this cycle, speculators first bought to cover their extreme shorts and then aggressively bought long contracts. This is readily evident in this chart.
So instead of cratering on the brand-new Fed-rate-hike campaign, gold skyrocketed on massive gold-futures buying by the very speculators convinced rate hikes would slaughter it. Over the next 6.7 months gold blasted 29.9% higher into its first new bull market since 2011! One of its primary drivers was these speculators adding 249.2k gold-futures long contracts while cutting 82.8k short ones over that gold-surge span.
Unfortunately gold-futures speculators command a super-disproportional wildly-outsized impact on gold price levels because of these contracts’ extreme inherent leverage. Each contract controls 100 troy ounces of gold, which is worth $125k this week. Yet speculators are now only required to maintain $4450 margin in their accounts for each contract held, which equates to incredible maximum leverage to gold of 28.1x!
That means any amount of capital deployed in gold futures by speculators can have up to 28x the price impact on gold as investors buying it outright. 28x is exceedingly dangerous though, as a mere 3.6% adverse move in gold prices would wipe out 100% of the capital bet by futures speculators. This forces them to have an ultra-short-term focus in order to survive. They can’t afford to be wrong for very long.
While their collective conviction that Fed rate hikes are like Kryptonite for zero-yielding gold might sound logical, history proves just the opposite! Back before that initial Fed rate hike of this cycle, I undertook a comprehensive study of how gold reacted in every Fed-rate-hike cycle in modern history. If speculators were right about Fed rate hikes’ bearish impact on gold, it would be fully confirmed in past Fed-rate-hike cycles.
The history was stunning, as you can read about in an update on this groundbreaking work we published in March 2017. Prior to today’s rate-hike cycle, the Fed had executed fully 11 between 1971 and 2015. They are defined as 3 or more consecutive federal-funds-rate increases with no interrupting decreases. During the exact spans of all 11, gold averaged a strong 26.9% rally! Fed rate hikes are actually bullish for gold.
Breaking down this critical historical precedent further, gold rallied big in 6 of these cycles while slumping in the other 5. It averaged huge gains of 61.0% in the majority in which it powered higher! Generally the lower gold was relative to recent years when entering a new rate-hike cycle, and the more gradual those Fed rate hikes were, the better its upside performance. Both conditions describe today’s 12th cycle perfectly.
And in the other 5 where gold suffered losses, they averaged an asymmetrically-small 13.9% retreat. The futures speculators’ cherished notion that Fed rate hikes crush gold is totally false, an irrational myth they deluded themselves into believing. You’d think with tens of billions of dollars of capital at stake with extreme leverage these elite traders could take the time to study historical precedent on gold and rate hikes.
While gathering and crunching all this data since 1971 certainly isn’t trivial, why not simply look to the last Fed-rate-hike cycle for some guidance? Between June 2004 to June 2006, the FOMC hiked the FFR at every meeting for 17 consecutive hikes. Those totaled 425 basis points, more than quintupling the federal-funds rate to 5.25%. If higher rates and yield differentials slay gold, it should’ve plummeted at 5%+.
Yet during that exact span, gold powered 49.6% higher! There’s literally zero chance today’s hyper-easy Fed will dare hike rates 17 times or get anywhere near 5%. The new Fed chairman Jerome Powell that Trump nominated to replace Janet Yellen in early February is widely viewed as a Republican clone of the Democratic Yellen. Powell will stay Yellen’s course, gradually hiking to new norms way below past FFR levels.
But gold-futures speculators didn’t learn their lesson after getting massively burned by their excessively-bearish bets leading into this 12th modern Fed-rate-hike cycle’s opening increase. They did the same thing again a year later leading into the Fed’s heavily-telegraphed second hike in mid-December 2016. They aggressively dumped gold-futures longs, and ramped shorts, leading into the FOMC’s year-ago decision.
While irrational rate-hike fears remained a prime motivator to sell gold futures, those decisions certainly were aided by the stock markets. After Trump’s surprise election win in early November last year, the stock markets rocketed higher in Trumphoria on hopes for big tax cuts soon. Gold investment demand really wanes when record-high stock markets generate much euphoria, killing demand for alternatives led by gold.
So just like a year earlier, following last December’s second Fed rate hike of this cycle gold dropped to a major low of $1128 the very next day. In 5.3 months gold had plunged 17.3% partially thanks to gold-futures speculators dumping 164.5k long contracts while adding 25.8k short ones. But yet again just as their collective bets hit peak bearishness on another Fed rate hike, gold was ready to reverse sharply higher.
The reason is excessive gold-futures selling by speculators is self-limiting. Despite the market power their extreme leverage grants them, their capital is finite. They only have so many long contracts they are willing and able to sell, and only so much capital available to short sell gold futures. So once they near those limits, a reversal is inevitable. They soon have to resume buying longs again while covering shorts.
So for the second year in a row, gold blasted higher out of its major lows immediately after a December Fed rate hike. Over the next 8.7 months leading into early September, gold powered 19.5% higher with speculators adding 111.0k long contracts. They were starting to learn their lesson on shorting a young bull market though, as their total shorts fell just 1.0k contracts over that span. This 2017 gold upleg was impressive.
Gold not only rallied on balance through the 3rd and 4th Fed rate hikes of this cycle in mid-March and mid-June, but climbed despite this year’s extreme stock-market euphoria generated by the endless new record highs. Speculators temporarily shorted gold-futures to near-record levels leading into gold’s usual summer doldrums, but that artificial low soon gave way to a powerful autumn rally. Gold has held strong.
Despite surging Fed-rate-hike odds leading into this week’s universally-expected 5th hike of this cycle, gold was even able to stabilize from early October to early December. But as the third Fed rate hike in as many Decembers loomed closer, gold-futures speculators again lost their nerve in recent weeks. That’s readily evident in the newest CoT report before this essay was published, current to Tuesday December 5th.
As another December rate hike looked certain, gold-futures speculators jettisoned 39.2k long contracts and short sold another 17.4k more in a single CoT week! That total selling of 56.7k contracts was the equivalent of a staggering 176.2 metric tons of gold. That ranked as the third-largest CoT week of spec gold-futures selling out of the 988 since early 1999. These goofy traders were freaking out again over a rate hike.
The Fed indeed hiked for the 5th time in this 12th modern cycle as widely forecast, taking the FFR up to a range between 1.25% to 1.50%. I suspect gold-futures speculators expected top Fed officials’ outlook for 2018 rate hikes to rise from the prior dot plot’s three published a quarter earlier. But 2018 rate-hike projections didn’t budge, holding at exactly the same average in this week’s newest mostly-neutral dot plot.
So speculators resumed buying gold futures right as the FOMC released its decision and rate-hike projections at 2pm this past Wednesday. Gold surged 1.0% higher that day, paralleling its 1.1% rate-hike-day gains two years earlier that was about to kick off a major new bull market. Gold remained up 18.3% in the Fed’s current rate-hike cycle to date, solid gains considering futures speculators’ erroneous beliefs.
Odds are their excessively-bearish bets battering gold in recent months will prove every bit as wrong this December as they did in the last couple years’ Decembers! Gold will likely again stage a powerful rebound rally into 2018 as these hyper-leveraged traders reestablish long positions. They don’t have many short contracts to cover, continuing last year’s trend. Leveraged shorting of a healthy bull market is suicidal.
Just like following the prior couple Decembers’ Fed rate hikes, gold investment buying will likely resume as well. Through speculators’ collective trading’s adverse impact on gold leading into hikes, investors too get worried about gold in higher-rate environments. But once another Fed rate hike passes and gold doesn’t collapse on cue as expected, investors resume buying. Their inflows are the most important of all.
While gold investment is usually done outright with no leverage, investors’ vast pools of capital dwarf the gold-futures speculators’ limited firepower. So gold investment trumps gold-futures speculation. This final chart looks at the best daily approximation of investment available, the holdings of the leading GLD SPDR Gold Shares gold ETF. When its holdings are rising, American stock-market capital is returning to gold.
When investors aren’t interested in gold, their lack of buying allows gold-futures speculators to dominate short-term price action. But once investors buy or sell gold en masse, that easily overpowers whatever the futures traders are up to. The main reason gold exploded into a new bull market after that initial rate hike in December 2015 was massive differential GLD-share buying by American stock investors in early 2016.
During that same 6.7-month span where gold rocketed 29.9% higher in a new bull, GLD’s physical gold bullion held in trust for shareholders soared 55.7% or 351.1t! Gold then collapsed after Trump’s election win as GLD’s holdings shrunk 14.2% or 138.9t in 5.3 months leading into last December. While GLD’s holdings kept slumping after the December 2016 hike, they soon climbed modestly and stabilized in 2017.
Early 2018 is likely to see big gold investment buying much closer to early 2016’s than early 2017’s, which will help catapult gold dramatically higher again. The extreme record stock-market rally of 2017 that generated such epic euphoria isn’t likely to persist into 2018. As stock markets finally roll over into a long overdue major correction or more likely new bear market, investment capital will flood back into gold again.
Though few investors realize it yet, 2018 is going to look radically different from 2017. The major central banks that have injected trillions of dollars of capital since 2008’s stock panic that levitated stock markets are slamming on the brakes. The Fed is ramping its new quantitative-tightening campaign that destroys the QE money created out of nothing to a $50b-per-month pace by Q4’18, something never before witnessed.
At the same time the European Central Bank is slashing its own quantitative-easing campaign from this year’s €60b-per-month pace to just €30b monthly starting in January. Together Fed QT and ECB QE tapering will drive $950b of central-bank tightening in 2018 and then another $1450b in 2019 compared to this year! I explained all this in depth in late October in a critical essay for all investors to fully digest.
As the Fed and ECB reverse sharply from their unprecedented easing of recent years to unprecedented tightening in the coming years, these record-high, euphoric, bubble-valued stock markets are in serious trouble. As they roll over and sell off, investors will rush to prudently diversify their stock-heavy portfolios with counter-moving gold. There’s nothing more bullish for gold investment demand than weakening stocks.
So contrary to recent weeks’ and months’ erroneous view that Fed rate hikes are bearish for gold, history proves just the opposite is true. Gold has thrived in the 11 modern Fed-rate-hike cycles before today’s, and it has powered higher on balance in this 12th one. While you wouldn’t know it after this past year’s extreme Trumphoria rally, Fed rate hikes are actually bearish for stocks and thus quite bullish for gold.
The last time investors flooded into gold in early 2016 after that initial December rate hike, gold powered 29.9% higher in 6.7 months. The beaten-down gold miners’ stocks greatly amplified those gains, with the leading HUI gold-stock index soaring 182.2% higher over roughly that same span! Gold stocks are again deeply undervalued relative to gold, a coiled spring ready to explode higher in this gold bull’s next major upleg.
At Zeal we diligently study market history so we aren’t deceived by irrational herd sentiment. This helps us execute better real-world trades, actually buying low before selling high. As of the end of Q3, this has resulted in 967 stock trades recommended in real-time to our newsletter subscribers since 2001. Our contrarian strategies are very profitable, as all these trades averaged stellar annualized realized gains of +19.9%!
The key to this success is staying informed and being contrarian. That means buying low when others are scared, like leading into Fed rate hikes. An easy way to keep abreast is through our acclaimed weekly and monthly newsletters. They draw on my vast experience, knowledge, wisdom, and ongoing research to explain what’s going on in the markets, why, and how to trade them with specific stocks. Easy to read and affordable, they’ll help you learn to think, trade, and thrive like contrarians. Subscribe today, and get deployed in the great gold stocks on our trading books before they surge far higher!
The bottom line is Fed rate hikes are bullish for gold, and this week’s is no exception. Gold has not only powered higher on average in past Fed-rate-hike cycles, but has rallied strongly in the current one. After each past December rate hike which gold-futures speculators sold aggressively into, gold dramatically surged in the subsequent months. These guys always buy after getting excessively bearish, forcing gold higher.
Gold’s next upleg following the Fed’s 5th rate hike since late 2015 is likely to get a massive boost from weaker stock markets. The same thing happened a couple years ago during the last US stock-market correction. As the Fed and ECB drastically reverse and slash their liquidity injections in 2018, these wild central-bank-inflated stock markets are in serious trouble. Gold investment demand surges when stocks weaken.
Adam Hamilton, CPA
December 15, 2017
Copyright 2000 – 2017 Zeal LLC (www.ZealLLC.com)
Tax loss season is upon us, and with it comes discounts on some of the best companies in the junior resource sector. In particular, Marathon Gold stood out for me; it just released a great update to its NI 43-101 resource estimate, moving a portion of its inferred gold ounces to the measured and indicated categories and increasing its gold resource by roughly 30% overall. The market reaction? “Yawn,” or basically no movement in the stock. This is music to my ears – I bought another tranche.
What’s my point? Sometimes, the market doesn’t see or understand the value proposition, especially when the sector for the given company isn’t in favour.
Today, I’m sharing my research on a copper company which is set to (very soon) finalize their acquisition of a major copper project in northern British Columbia (BC). I think this should result in a re-rating in their share price, as their current MCAP is around 3 times less than the acquisition cost of the project. This company is Desert Star Resources.
Let’s take a closer look.
Desert Star Resources (DSR:TSXV)
MCAP – $8.5 million (at the time of writing)
Shares – 18,947,901
Fully Diluted – 26,169,901
Kutcho High Grade Copper-Zinc-Gold-Silver Project
On June 15th, 2017 Desert Star announced it had signed a definitive agreement to acquire 100% of the Kutcho high grade copper-zinc-gold-silver project from Capstone Mining Corporation. The deal was comprised of cash, $28.8 million CAD and, upon completion of the acquisition and concurrent financing, 9.9% of the issued and outstanding shares of Desert Star.
Wheaton Precious Metals
On August 10, 2017, the purchase of Kutcho got a huge boost with the announcement that Desert Star had agreed to terms on a non-binding Early Deposit Precious Metals Purchase Agreement with Wheaton Precious Metals Corporation. The agreement will see Wheaton pay Desert Star $65 million USD for up to 100% of the payable silver production, and up to 100% of the payable gold production produced from the Kutcho Project.
Additionally, and in line with management’s goal for the project, if the processing capacity of the mine increases to 4,500 tpd or more within 5 years of attaining commercial production, a further $20 million USD will be payable to Desert Star.
Furthermore, on October 31, 2017, Desert Star announced it had entered into a non-binding Term Sheet for a $20 million CAD Subordinated Secured Convertible Term Debt Loan with Wheaton Precious Metals. Bringing the total financing package to over $100 million CAD.
In my view, an investment by Wheaton Precious Metals speaks volumes about the quality of the people and the project. The Wheaton Precious Metals team, while not infallible, has a great track record for finding projects that are future mines. In saying this, be mindful that a stream on the project, while helping early on with the funding of the mine, does remove some of the potential future value. In the case of the Kutcho Project, the precious metals only account for 8% of the revenue, making it a small part of the overall Kutcho Project value.
Desert Star’s People – Built for Success
The acquisition of the Kutcho Project from Capstone and management’s ability to secure over $100 million CAD in funding via Wheaton Precious Metals, in my mind, speaks volumes about CEO and Director, Vince Sorace’s, ability to lead the company. Sorace has over 25 years of experience in international business and capital markets, and has held senior leadership roles in a number of other companies.
Sorace’s COO, Rob Duncan, has over 26 years of experience in mineral exploration and held senior leadership roles for a number of other mining companies. In particular, he has extensive technical experience with VMS systems such as Kudz Ze Kayah and Wolverine in the Yukon’s Finlayson District and Izok Lake in Nunavut.
Rory Kutluoglu, a professional geologist, has 10 years experience in the mining industry. His most recent success was with Kaminak Gold Corp., where he was the exploration manager and played an instrumental role in the Coffee Gold Project’s development, which was acquired by Goldcorp in 2016. Kutluoglu is Desert Star’s VP of Exploration and will be focusing on expanding Kutcho resources.
Also, Allison Rippin-Armstrong, formerly with Kaminak Gold Corp, brings her 20 years of experience in permitting, regulatory processes and environmental compliance for resource companies to the Desert Star management team. Rippin-Armstrong will play an invaluable role as she leads relations with the First Nations Tahltan Central Government (TCG) and aids the company in the permitting process.
To note, there is one particular addition to Desert Star’s Board of Directors that I think will be an x-factor for the company as they develop Kutcho. The appointment of Bill Bennett, BC’s former Mining Minister, to the Board of Directors should pay major dividends, as he helps the company navigate the permitting process.
Additionally, on the Board of Directors, is Stephen Quinn and Jay Sujir. Also, Desert Star has three advisors; Peter Meredith, former Chairman of Ivanhoe Mines; Rob Carpenter, former CEO of Kaminak Gold; and Stuart Angus, former Chairman of Nevsun Resources. This advisory board is another huge plus for this junior company, as each of these men have been successful in the mining industry.
Northern British Columbia
The Kutcho Project is made up of 46 mineral exploration claims encompassing 17, 060 hectares, and is located in northern British Columbia.
Source: Prefeasibility Study Technical Report on the Kutcho Project
As you can see on the map, Dease Lake is the largest community near Kutcho, sitting roughly 100 km west, and is cited as having a population of 335 people in the technical report. As well, Dease Lake is about 400 km north of the Port of Stewart and 600 km north of Smithers.
Access to Kutcho is via a seasonal road from HWY 37 or gravel airstrip, which is located on the property at the junction of Kutcho and Andrea creeks.
Tahltan Territory
On October 26, 2017, Desert Star announced a communications agreement with the Tahltan Central Government (TCG). The TCG is the governing body of the Tahltan Nation, which works to protect the Aboriginal rights and title, ecosystem and natural resources of the Tahltan community.
Tahltan territory encompasses 93,500 square kilometres in northwestern BC, running parallel to the Alaskan/Canadian border. Their three main communities are Telegraph Creek, Dease Lake and Iskut.
A good relationship with the TCG is integral to the future development of the Kutcho Project into an operating mine.
BC and its NDP Provincial Leadership
This past May, BC’s provincial election turned out the way many rural and business people had hoped, with the Liberals retaining control of the provincial government. This minority win, however, didn’t last long, as the NDP, the Liberals’ closet provincial leadership competitor, and the Green Party combined forces to displace the Liberals and took control of the province.
The NDP have a reputation of being bad for business – and with good cause. I cite Ontario in the 90s and, most recently, the NDP’s current control of what was formerly Canada’s richest province, Alberta. From a number of perspectives, but most importantly from a business perspective, these examples show the potential downside of the NDP ideology.
In saying this, however, it isn’t a done deal that all business is doomed because the NDP has taken over, just a higher probability, in my opinion. Further, I would be remiss if I didn’t point out that the Liberals and Conservatives aren’t without fault when it comes to bad policy decisions that have negatively affected business.
So what do I think about investing in mining in BC? Currently, I do see risk in investing in BC given the current political leadership. However, as I mentioned in the beginning of this article, investing in quality companies is the key to success in the junior resource sector. Therefore, if I’m able to find a quality company at the right price, I’m willing to take on more political risk.
In the case of Desert Star, I think that the Kutcho Project is quality and worth the associated jurisdictional risk. Bill Bennett and Allison Rippin Armstrong will prove invaluable as they help the company navigate the permitting process to ensure that this project has the best chance of being approved in a timely manner.
Updated Prefeasibility Study
Upon signing the definitive agreement with Capstone to acquire the Kutcho Project, Desert Star approached JDS Energy and Mining Inc. to update their 2011 PFS on the Project. The update to the PFS is intended to show the project’s economics based on current costs, metal prices, exchange rates, mineral resources and metallurgical interpretations.
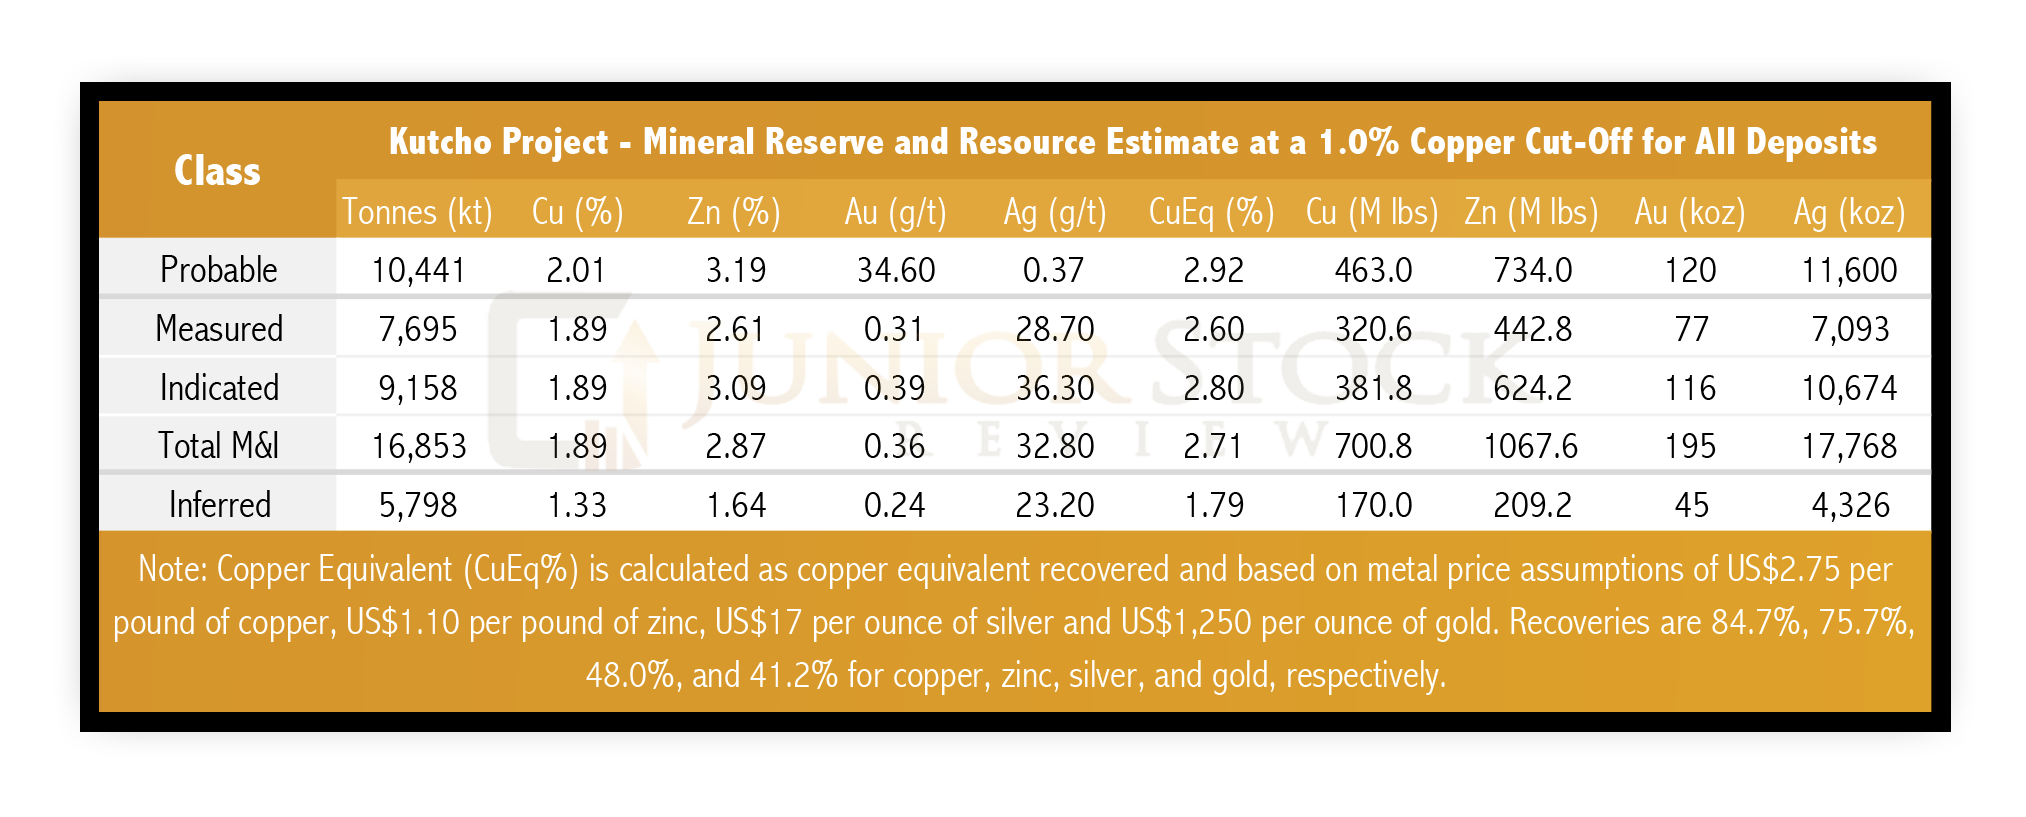
Source: Prefeasibility Study Technical Report on the Kutcho Project
The Kutcho Project is made up of 3 mineralized zones: Main, Esso and Sumac. These 3 zones are Kuroko-type volcanogenic massive sulphide (VMS) deposits and are aligned in a westerly plunging linear trend. The PFS mine planning and economics only consider the Main and Esso zones, as the Sumac Zone only has inferred resources.
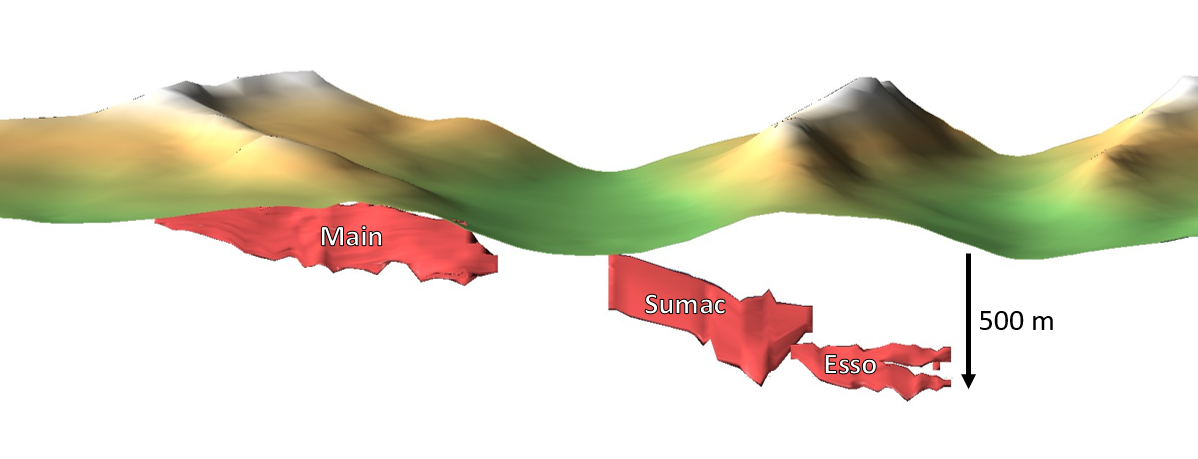
Source: Kutcho Project’s 3 Mineralized Zones
Currently, the mine plan calls for a starter pit to be constructed on the Main Zone, which will be used to mine roughly 0.4 Mt of preliminary mill feed. The pit will then give way to an underground portal which will be used to access the rest of the deposit.
As you can see in the image above, the Main Zone deposit is at surface, has a strike length of about 1.5 km, and extends approximately 260 m down dip. The Esso Zone sits about 1.5 km away from the Main Zone, and is located roughly 400 m below surface, extending 240 m down dip, and has a strike length of 640 m.
The PFS estimates the mine to have the following production and economic statistics:
- Production Rate – 2,500 tpd
- Mine Life – 12 years
- Average Annual Copper Production – 33 Mlbs
- Average Annual Zinc Production – 42 Mlbs
- After-tax NPV@8% – $265 million CAD
- After-IRR – 27.6%
- After-tax Payback – 3.5 years
- Initial CAPEX Cost – $220.7 million
Kutcho Metallurgy
The biggest question mark surrounding the Kutcho Project, in my opinion, is its metallurgy. JDS remarks,
“The mineralogy of the Kutcho deposits is complex and requires a similarly complex approach to produce copper and zinc concentrates at reasonable recoveries and concentrate grades.” ~ PFS 1-3
The PFS economic case is based off of a 84.7% copper recovery with a saleable concentrate grade of 27.6% copper, zinc content of 7.3%, gold content of 2.5 g/ton, and a silver content of 268.6 g/ton. The zinc recovery is expected to be 75.7%, with a concentrate grade of 55.1% zinc and 1.2% copper.
Deviations from the expected recoveries or further use of reagents and increased power consumption are concerns due to the complex nature of the mineralization. Further metallurgical work on the Project is scheduled for Q3 and Q4 of 2018, and will provide the company with a good chance to optimize the metallurgical process, which could have a positive impact on Kutcho’s economics.
Kutcho Expansion and Exploration Potential
The company has outlined a few scenarios for Kutcho’s upside growth potential, which are: Existing Resource Conversion, Down Dip Extension and project expansion through exploration. Let’s go through each one briefly:
- First, by lowering the cut-off grade from 1.5% to 1.0% copper, the reserve tonnage could grow roughly by 5.0 Mt. Secondly, with further infill drilling, the current inferred resource of 5.8 Mt @ 1.79% CuEq could potentially be moved into the measured and indicated resource category and, thus, be included in the economics of the project.
PUSH: Watch for infill drilling results on the deposit, which is scheduled to occur in Q2 and Q3 of 2018. Drill results showing continuity should be a sign that this deposit is going to get bigger.
PUSH: A resource update will follow the infill drilling and should be completed by the end of 2018 or the first quarter of 2019.
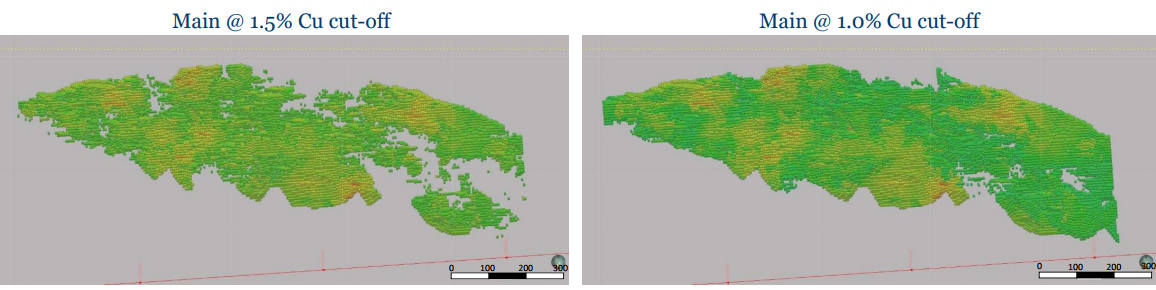
Main Zone Block Model Cut-off Comparison
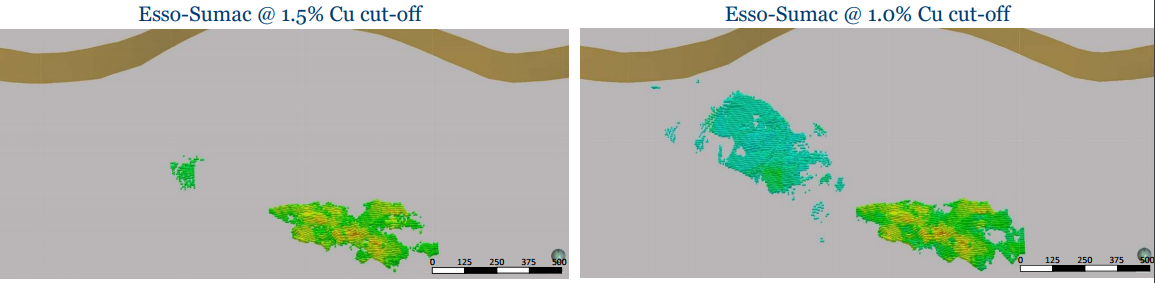
Esso-Sumac Zone Block Model Cut-off Comparison
- Secondly, the Main and Esso Zones are open at depth and along strike. Desert Star estimates 60% of the Main Zone and 50% of the Esso Zone’s strike length is open down dip, with the potential to add 1 to 3 Mt in the Main Zone and 300 to 600 Kt in the Esso Zone.
- Finally, the Kutcho Project has a large land package with multiple repeated VMS sulphide horizons that haven’t seen extensive exploration. In the image below, you can see the high priority targets outlined in blue. Currently, exploration drilling is set to occur in Q4 of 2018.
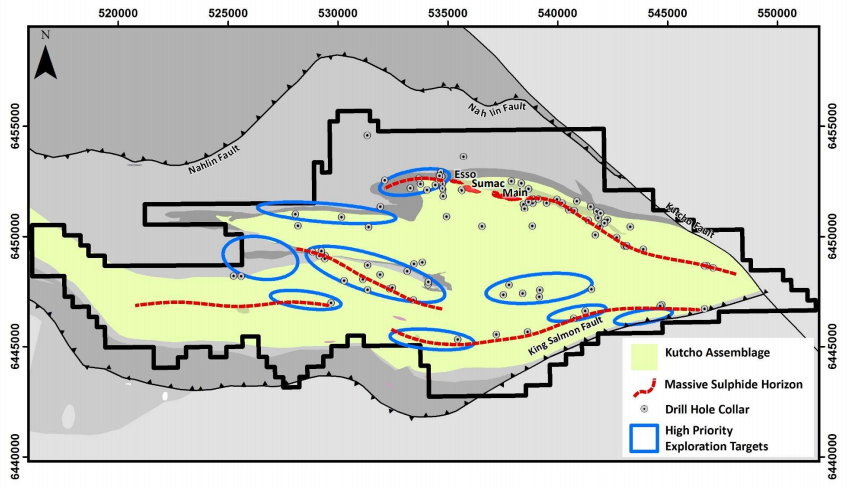
Kutcho Project Exploration Targets
Concluding Remarks
There isn’t a mining project in the world that doesn’t have at least a couple of question marks. In Desert Star’s case, I see two main areas of risk; first, the metallurgical complexity of the mineralization, and second, BC’s NDP government. The company, however, has taken steps to address both of these risks. First, with further metallurgical work scheduled for Q3 and Q4 in 2018, and for the jurisdictional risk, they have appointed Bill Bennett, to the Board and Allison Rippin-Armstrong to the management team, whose combined experience in navigating the permitting process should prove to be invaluable.
For me, the investment case for Desert Star Resources is straightforward, and I have summarized what I think are the company’s strengths and, ultimately, the reasons I think Kutcho has the potential to become BC’s next producing copper mine in the years ahead.
- Good management team and Board of Directors – In particular, Bennett has x-factor type experience and influence to move Kutcho to production in a timely manner.
- Advisory Board which includes Peter Meredith, former Chairman of Ivanhoe Mines; Rob Carpenter, former CEO of Kaminak Gold; and Stuart Angus, former Chairman of Nevsun Resources.
- Over $100 million CAD in funding via an agreement with Wheaton Precious Metals, paving the way to the final investment decision in 2020.
- After-tax NPV @8% of $265 million CAD and after-tax IRR of 27.6% – Desert Star’s Kutcho high grade Cu-Zn-Au-Ag Project has an updated PFS which shows positive economics at current metal prices and exchange rates- $2.75 USD/lbs Cu, $1.10 USD/lbs Zn, $1250 USD/oz, $17 USD/oz.
- Deposit growth potential through the reduction in the resource cut-off grade, which could see the reserve tonnage grow by roughly 5.0 Mt and the measured and indicated resource tonnage by roughly 5.8 Mt
- The Main and Esso Zones are open at depth and along strike – If the continuity of the deposit continues, Desert Star estimates that the Main Zone could grow between 1 to 3 Mt, and Esso Zone could grow between 300 and 600 Kt.
- Kutcho’s district scale land package could yield further mineralization via a few high priority targets that have been identified on the property.
Don’t want to miss a new investment idea, interview or financial product review? Become a Junior Stock Review VIP now – it’s FREE!
Until next time,
Brian Leni , P.Eng
Founder – Junior Stock Review
Disclaimer: All statements in this report, other than statements of historical fact should be considered forward-looking statements. These statements relate to future events or future performance. Forward-looking statements are often, but not always identified by the use of words such as “seek”, “anticipate”, “plan”, “continue”, “estimate”, “expect”, “may”, “will”, “project”, “predict”, “potential”, “targeting”, “intend”, “could”, “might”, “should”, “believe” and similar expressions. Much of this report is comprised of statements of projection. These statements involve known and unknown risks, uncertainties and other factors that may cause actual results or events to differ materially from those anticipated in such forward-looking statements. Risks and uncertainties respecting mineral exploration companies are generally disclosed in the annual financial or other filing documents of those and similar companies as filed with the relevant securities commissions, and should be reviewed by any reader of this newsletter.
Brian Leni is an online financial newsletter writer. He is focused on researching and marketing resource and other public companies. Nothing in this article should be construed as a solicitation to buy or sell any securities mentioned anywhere in this newsletter. This article is intended for informational and entertainment purposes only!
Be advised, Brian Leni is not a registered broker-dealer or financial advisor. Before investing in any securities, you should consult with your financial advisor and a registered broker-dealer.
Never, ever, make an investment based solely on what you read in an online newsletter, including Brian Leni’s online newsletter, especially if the investment involves a small, thinly-traded company that isn’t well known.
Brian Leni’s past performance is not indicative of future results and should not be used as a reason to purchase any stocks mentioned in his newsletters or on this website.
In many cases Brian Leni owns shares in the companies he features. For those reasons, please be aware that Brian Leni can be considered extremely biased in regards to the companies he writes about and features in his newsletters. You should conduct extensive due diligence as well as seek the advice of your financial advisor and a registered broker-dealer before investing in any securities. Brian Leni may buy or sell at any time without notice to anyone, including readers of this newsletter.
Brian Leni shall not be liable for any damages, losses, or costs of any kind or type arising out of or in any way connected with the use of this newsletter. You should independently investigate and fully understand all risks before investing. When investing in speculative stocks, it is possible to lose your entire investment.
Any decision to purchase or sell as a result of the opinions expressed in this report will be the full responsibility of the person authorizing such transaction, and should only be made after such person has consulted a registered financial advisor and conducted thorough due diligence. Information in this report has been obtained from sources considered to be reliable, but we do not guarantee that they are accurate or complete. Our views and opinions in this newsletter are our own views and are based on information that we have received, which we assumed to be reliable. We do not guarantee that any of the companies mentioned in this newsletter will perform as we expect, and any comparisons we have made to other companies may not be valid or come into effect.
Brian Leni does not undertake any obligation to publicly update or revise any statements made in this newsletter.
Desert Star is a Sponsor of Junior Stock Review. Brian Leni does not own shares in Desert Star Resources.

1. Please click here now. I’ve predicted that a long period of deflation in the Western world would end with a Fed taper, rate hikes, and quantitative tightening.
2. That’s clearly in play now, and the deregulation of America’s thousands of small banks is perhaps the most exciting event taking place on this new “inflationary frontier”. Because of these powerful monetary trends, I’ve predicted big problems ahead for Wall Street and somewhat better times for Main Street.
3. Having said, that, I think investors would be making a major mistake to assume America is going to experience any kind of fabulous rebirth and relive an economic growth era like the 1950s, let alone the Golden Age of the 1880s.
4. The country now sports some of the worst demographics on the planet with horrific debt levels that are still growing under a president who is a spectacularly successful businessman.
5. What happens when President Businessman is replaced with President Socialist? Some sort of currency revaluation endgame is what happens. The problems of America and most of the Western world are not going to be solved with pump-up speeches, sporadic tax cuts, and insane “good guys versus bad guys” wars.
6. American GDP growth is going to continue to wallow at low levels while China and India blast into what I call the “bull era” at very high velocity.
7. Global investors need to make themselves great, and the blockchain/crypto asset class is one way to do it with style. I view blockchain as a sub-sector of the gold asset class. Importantly, blockchain trading is set to become more regulated very quickly.
8. Promoting regulation that doesn’t interfere with a market’s price discovery process appears to be a key goal of the Trump administration. It looks like new bitcoin regulation will be focused mainly on specific criminal schemes. That won’t stop the great upside price action taking place now on the legitimate exchanges. That price action is defined by great demand and rock solid fixed supply.
9. Institutional-grade trading of the cryptos is already beginning to happen, as demonstrated with the superb launch of fully regulated bitcoin futures on Sunday night.
10. The launch proved that institutional money managers view the $16,000 price area as solid.
11. My long term price target is two million US dollars per bitcoin. At www.gublockchain.com I analyse the main cryptos that are ready for serious upside action. A week ago, I highlighted key currency Litecoin at $100 for the gold community, issued a $1200 target, and showed potential subscribers a solid-looking chart.
12. To view that chart, please click here now. Double-click to enlarge. To view the updated price action since then, please click here now. Double-click to enlarge.
13. Even after this mighty blast higher, the $250 area for Litecoin should probably not be viewed as anything but a minor pitstop on a rocket ride to $1200.
14. I’ll be highlighting what could be the “next Litecoin” for profit-hungry blockchain subscribers today. It’s critical for investors and freedom fighters to understand that in the big picture, both gold and bitcoin will remain investments that only create huge fiat money profits… until they are widely used in daily life for payment of regular goods and services.
15. Then they can begin to compete with fiat money as the money of choice for citizens in a very serious way. I’ve predicted that this will happen because of the ability of blockchain technology to create digital gold-backed currency. That currency can be kept in a regulated and insured account, like a bank account.
16. Debit and credit cards based on these accounts are coming, and when that happens I’ll dare to suggest that Mr. and Mrs. Fiat are going to start feeling very uncomfortable. If these blockchain payment systems go mainstream, government could soon find itself becoming obsolete in many ways.
17. I predict that central banks will begin buying bitcoin as an asset to hold once it hits $2 trillion in “market cap”.
18. The US Treasury should have initiated a bitcoin buy program years ago to help fix the government’s balance sheet. Instead it wasted precious time playing stock market cheerleader, government bond enthusiast, and ruined the bank account income of ageing citizens. That was a truly horrific mistake, one that all the citizens of the world can only hope never happens again.
19. Please click here now. Double-click to enlarge this superb daily gold chart. Gold has a rough general tendency to rally after the US jobs report, unless a Fed rate hike is upcoming. In that case, gold often stagnates until the rate hike is announced, and then surges higher.
20. The Fed is scheduled to hike rates tomorrow, and gold is now poised magnificently inside a bull wedge, ready to stage a mighty blast higher if a hike is announcedtomorrow.
21. Also, Chinese New Year buying will begin very soon. That tends to bring enormous demand from not only Chinese citizens, but also from gold-obsessed Indians who want to get in on the action. The combined population of these two countries is about three billion people. Please click here now. Goldman analysts just released a key study of gold and blockchain liquidity flows. I’ll take it a step further, and state adamantly that blockchain will increase demand for gold. Indian investors will seek to put a portion of their huge blockchain profits into physical gold because they are essentially mandated to do so by their Hindu religion. Western investors will do the same thing when the stock market finally rolls over. If gold-backed blockchain currency goes mainstream, demand for gold would increase even more significantly, and do so in a sustained way. I think it will happen.
22. Regardless of whether it happens or not, when Chindians get serious about buying gold, the most powerful traders in the West also quickly position themselves to profit from the inevitable upside price action. On that note, please click here now. Next, please click here now. The powerful commercial traders have covered huge amounts of short positions and are eagerly racing to buy longs.
23. What’s particularly exciting about these two COT reports is that the reports only cover the flows through last Tuesday. It’s highly probably that the commercial traders have taken even bigger buy-side action with gold and silver since the reports came out.
24. Please click here now. Double-click to enlarge this key GDX chart. I’ve outlined the $23 – $18 area as a vital buy zone for gold stock enthusiasts. Within that price area, the $21 and $18 price points are most technically significant. The tiny bear flag in play suggests that investors will get a chance to buy the $21 area before an imminent major gold price rally carries GDX much higher. Investors can join me in placing some larger buy orders at both price points now, to be sure we’re all poised to participate in the ensuing rally time fun!
Thanks
Cheers
Stewart Thomson
Graceland Updates
https://www.gracelandupdates.
Email:
Stewart Thomson is a retired Merrill Lynch broker. Stewart writes the Graceland Updates daily between 4am-7am. They are sent out around 8am-9am. The newsletter is attractively priced and the format is a unique numbered point form. Giving clarity of each point and saving valuable reading time.
Risks, Disclaimers, Legal
Stewart Thomson is no longer an investment advisor. The information provided by Stewart and Graceland Updates is for general information purposes only. Before taking any action on any investment, it is imperative that you consult with multiple properly licensed, experienced and qualified investment advisors and get numerous opinions before taking any action. Your minimum risk on any investment in the world is: 100% loss of all your money. You may be taking or preparing to take leveraged positions in investments and not know it, exposing yourself to unlimited risks. This is highly concerning if you are an investor in any derivatives products. There is an approx $700 trillion OTC Derivatives Iceberg with a tiny portion written off officially. The bottom line:
Are You Prepared?
View of the water from Baie Verte
The research I did on Newfoundland and Labrador as a destination for mineral exploration and production had me excited to see, in person, if the province would deliver. On October 23rd, I visited Rambler Metals and Mining, and specifically their Ming’s Mine site, which sits roughly 15 minutes from Baie Verte.
Before getting into my visit to Rambler, I want to give you a quick intro to the Baie Verte Peninsula’s mining history and, in particular, a story of how Canada’s smallest town came to be.
Tilt Cove
Tilt Cove is currently the smallest town in Canada; with a population of just 6 people, it sits just a few kilometers from Rambler’s Nugget Pond Mill. The story of how Tilt Cove came to be varies depending on who you speak to, but here’s a brief summary of what I was told.
The story begins with a man named Issac Winser. Winser was a fisherman, who frequently fished the waters surrounding the Baie Verte Peninsula. In a chance encounter on the water between Winser and another man, Smith McKay, McKay noticed Winser was in possession of a large metallic rock, which he was using as an anchor for his boat.
Curiously, McKay took a closer look at the bluish green coloured rock and asked Winser where he had found it. Winser said he’d found it on the shores of the Tilt Cove area, and that there was a great deal more sticking out of the cliffs.
McKay, having a mining background, recognized the rock to be copper ore and later made his way to the Tilt Cove area to set up a mining operation, where he and his team mined the copper ore by hand. The Tilt Cove town was quickly established and grew from a town of 3 families in 1863 to a town of over 700 inhabitants by 1869.
In the Nugget Pond Mill offices, there is a copy of a very old Tilt Cove grocery store flyer advertising sale items. Additionally, the town’s prosperity even brought a movie theatre to the area and many other unexpected perks for such a small community in northwestern Newfoundland and Labrador.
For those interested in reading more about the history of Tilt Cove, here are a couple of links to check out: CBC – Tilt Cove, Canada’s smallest town, a big draw for tourists and Newfoundland Heritage – Once Upon A Mine.
Rambler Metals and Mining (RAB: TSX-V)
MCAP – 82.4 million (at the time of writing)
Shares – 549 million
Fully Diluted – 627 million
Cash – $2 million
Institutional Shareholders – CE Mining 72%, Lombard Odier 6%, CI Global Investments 5%, Tinma International 4%
Ming’s Mine and Nugget Pond Mill
Rambler Metals and Mining owns 100% of its 1640 ha property, which is home to the Ming Mine and Nugget Pond Mill. Rambler’s operation is expanding its underground operation by blending ores from the Lower Footwall Zone with the current mining from the massive sulphide zones to produce roughly 16 million pounds of copper annually, at a cost that’s below $2 USD per pound, giving the operation good upside potential against a rising copper price.
The Ming’s Mine has a total Proven and Probable Reserve of 8.7 million tonnes at 1.79% copper and 0.48 g/t gold, for a total of 341.2 million lbs of copper and 133.5 K oz of gold. All zones of the deposit remain open at depth.

Ming Mine – New portal cover installed as part of the ventilation upgrade project
Currently, the mine is targeting 1250 mtpd, which will help drive down costs and allow Rambler to maximize their profits in what appears to be a strong future market for copper prices. Rambler’s corporate presentation gives us a glimpse of their sensitivity to a rising copper price – below is the graph.
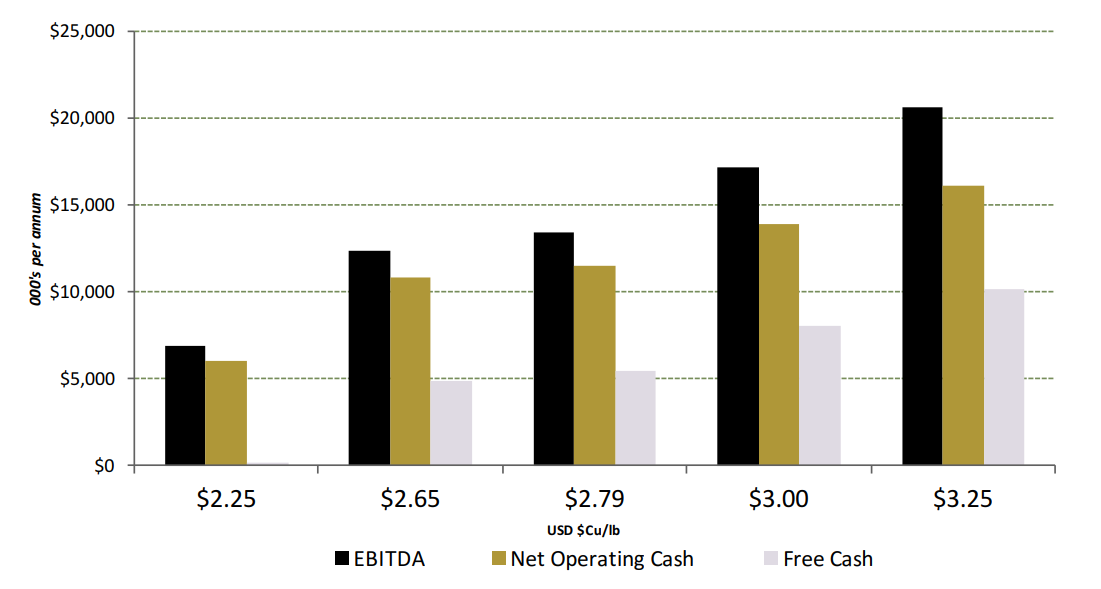
Data Source NI43-101 2015 Technical Report – Financial KPIs @ 1,250 MTPD
Although the mine site is closer to Baie Verte, where I was staying, we started the site visit at the Nugget Pond Mill, which sits roughly 40km away from the mine site, near Canada’s smallest town, Tilt Cove.
The Nugget Pond Mill is located 10km off the 414, and is at about the 5km mark where the road breaks in two. On your left, you head to Snook’ Arm, and to your right, our destination, Nugget Pond.

Ming Mine – Truck being loaded with Copper Ore
Rambler purchased the Nugget Pond Mill in October of 2009 for $3.5 million CAD, which, at the time, was owned by Crew Gold Corporation. Crew was using the mill to process their gold ore, which was mined at their Nalunaq Gold Deposit in Greenland.
NOTE: The Nugget Pond Mill was originally built back in 1996 by Richmond Mines to mine the Nugget Pond deposit. When that ore body was depleted, Richmond movedto the Hammerdown mine, near Springdale, and mined, trucked and milled the ore at the Nugget Pond mill.
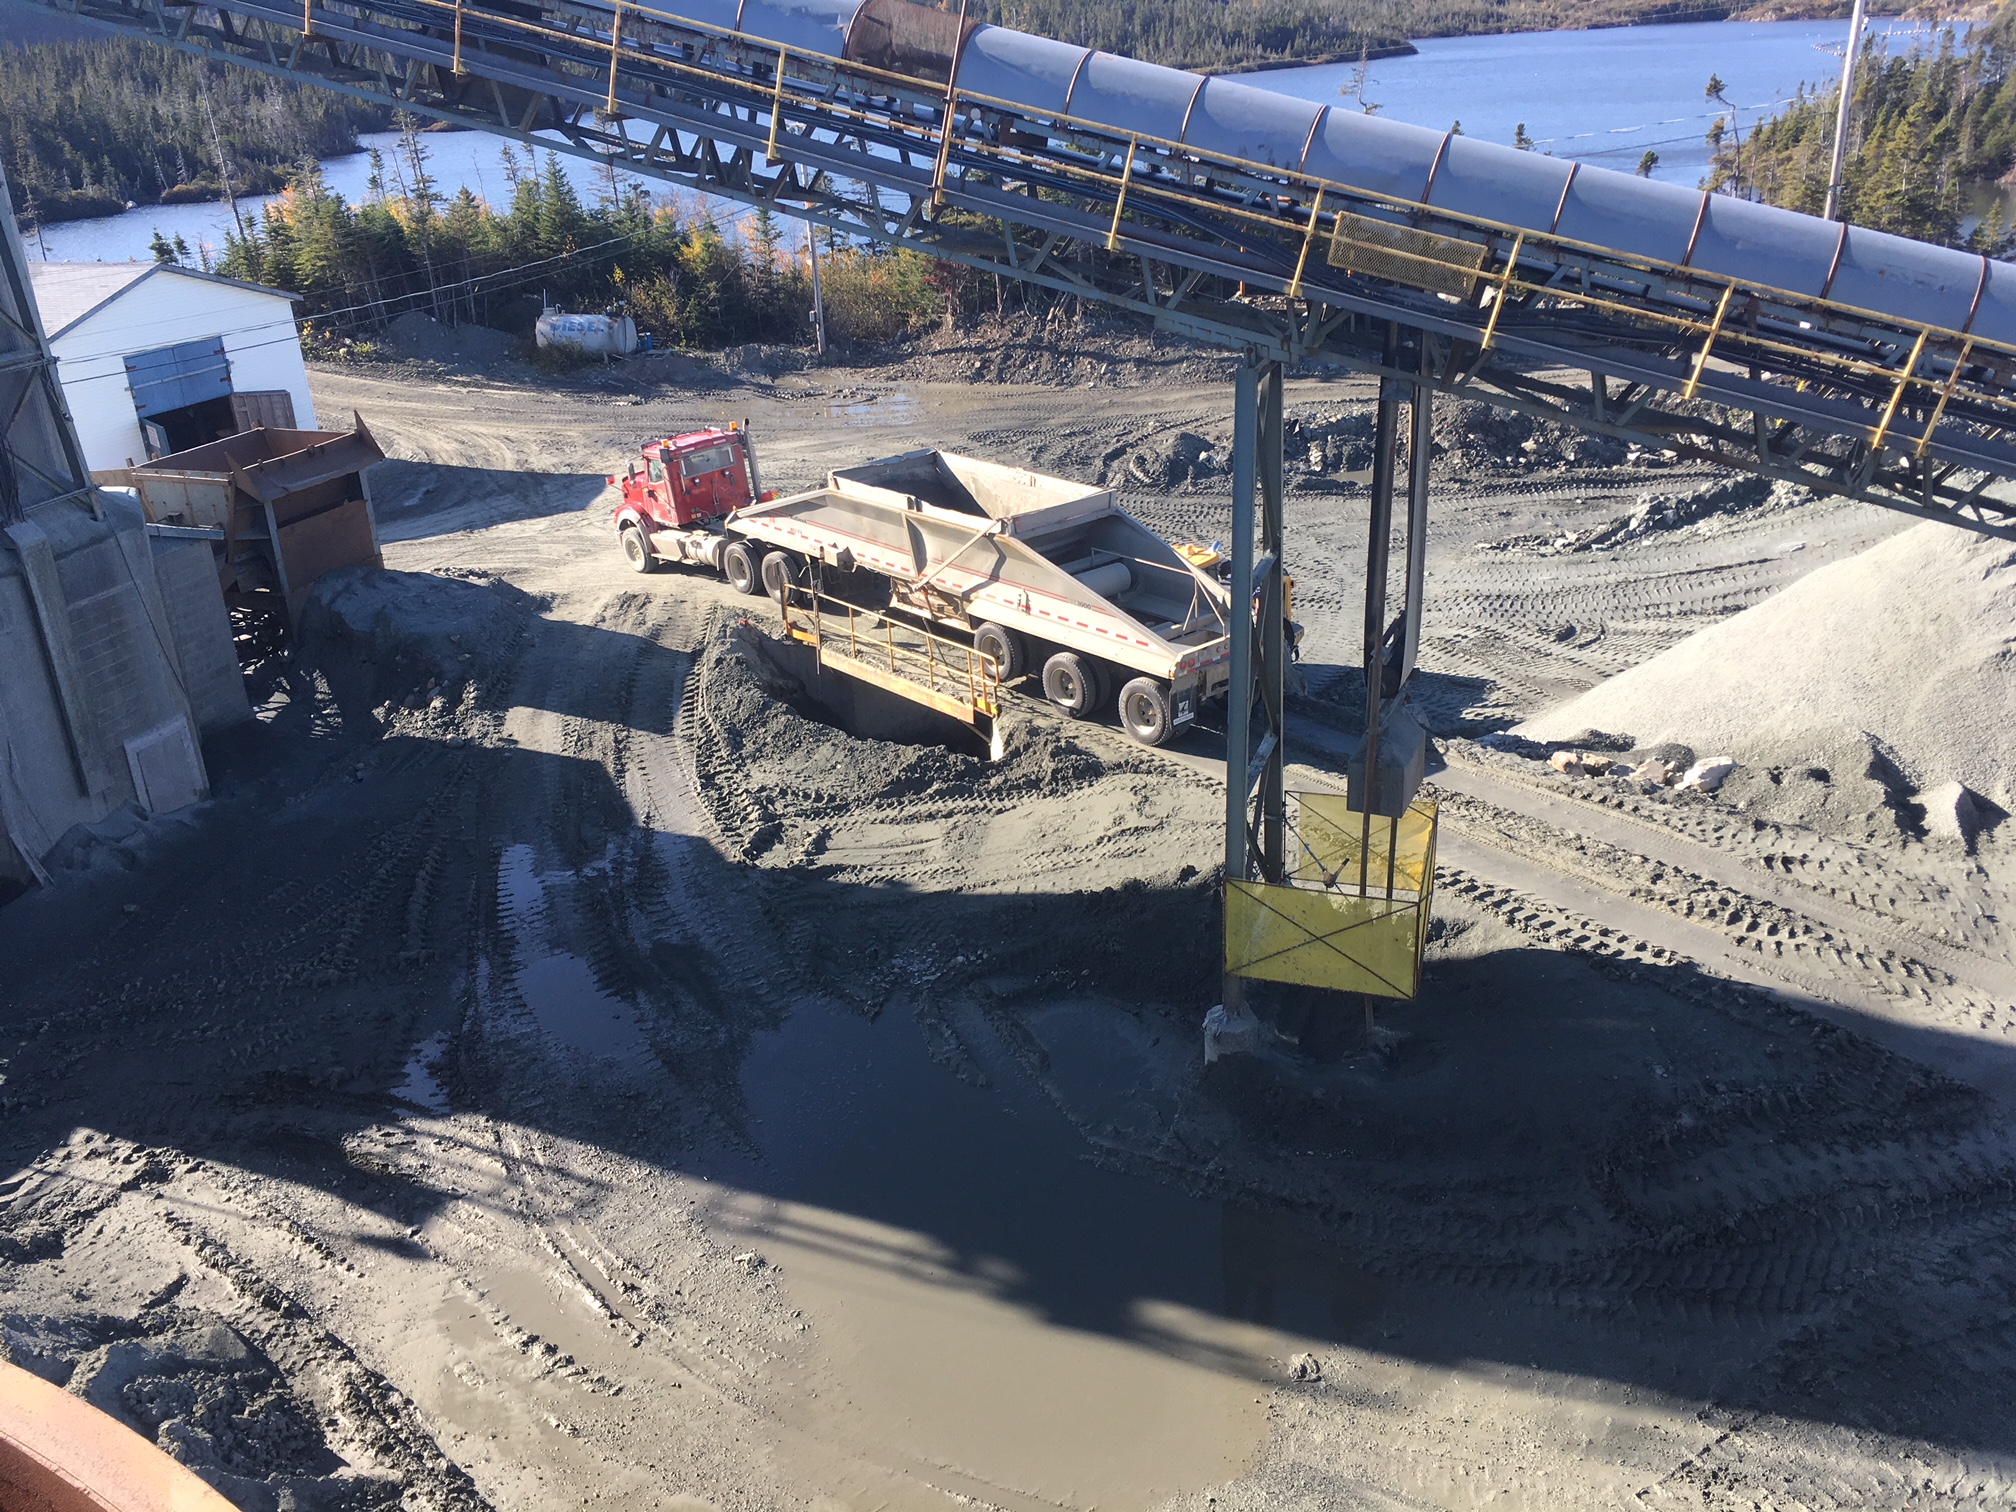
Nugget Pond Mill – Truck dumping a load of Copper Ore for Processing
The bulk of my site visit was spent at the Nugget Pond Mill, where I was given a detailed overview of the operation by the Mill Superintendent, Dwight Goudie. I then toured the facility, where I met with a couple of operators, Chester and Andrew, who took me through their respective operations and explained to me how the process works and the key parameters that they monitor.
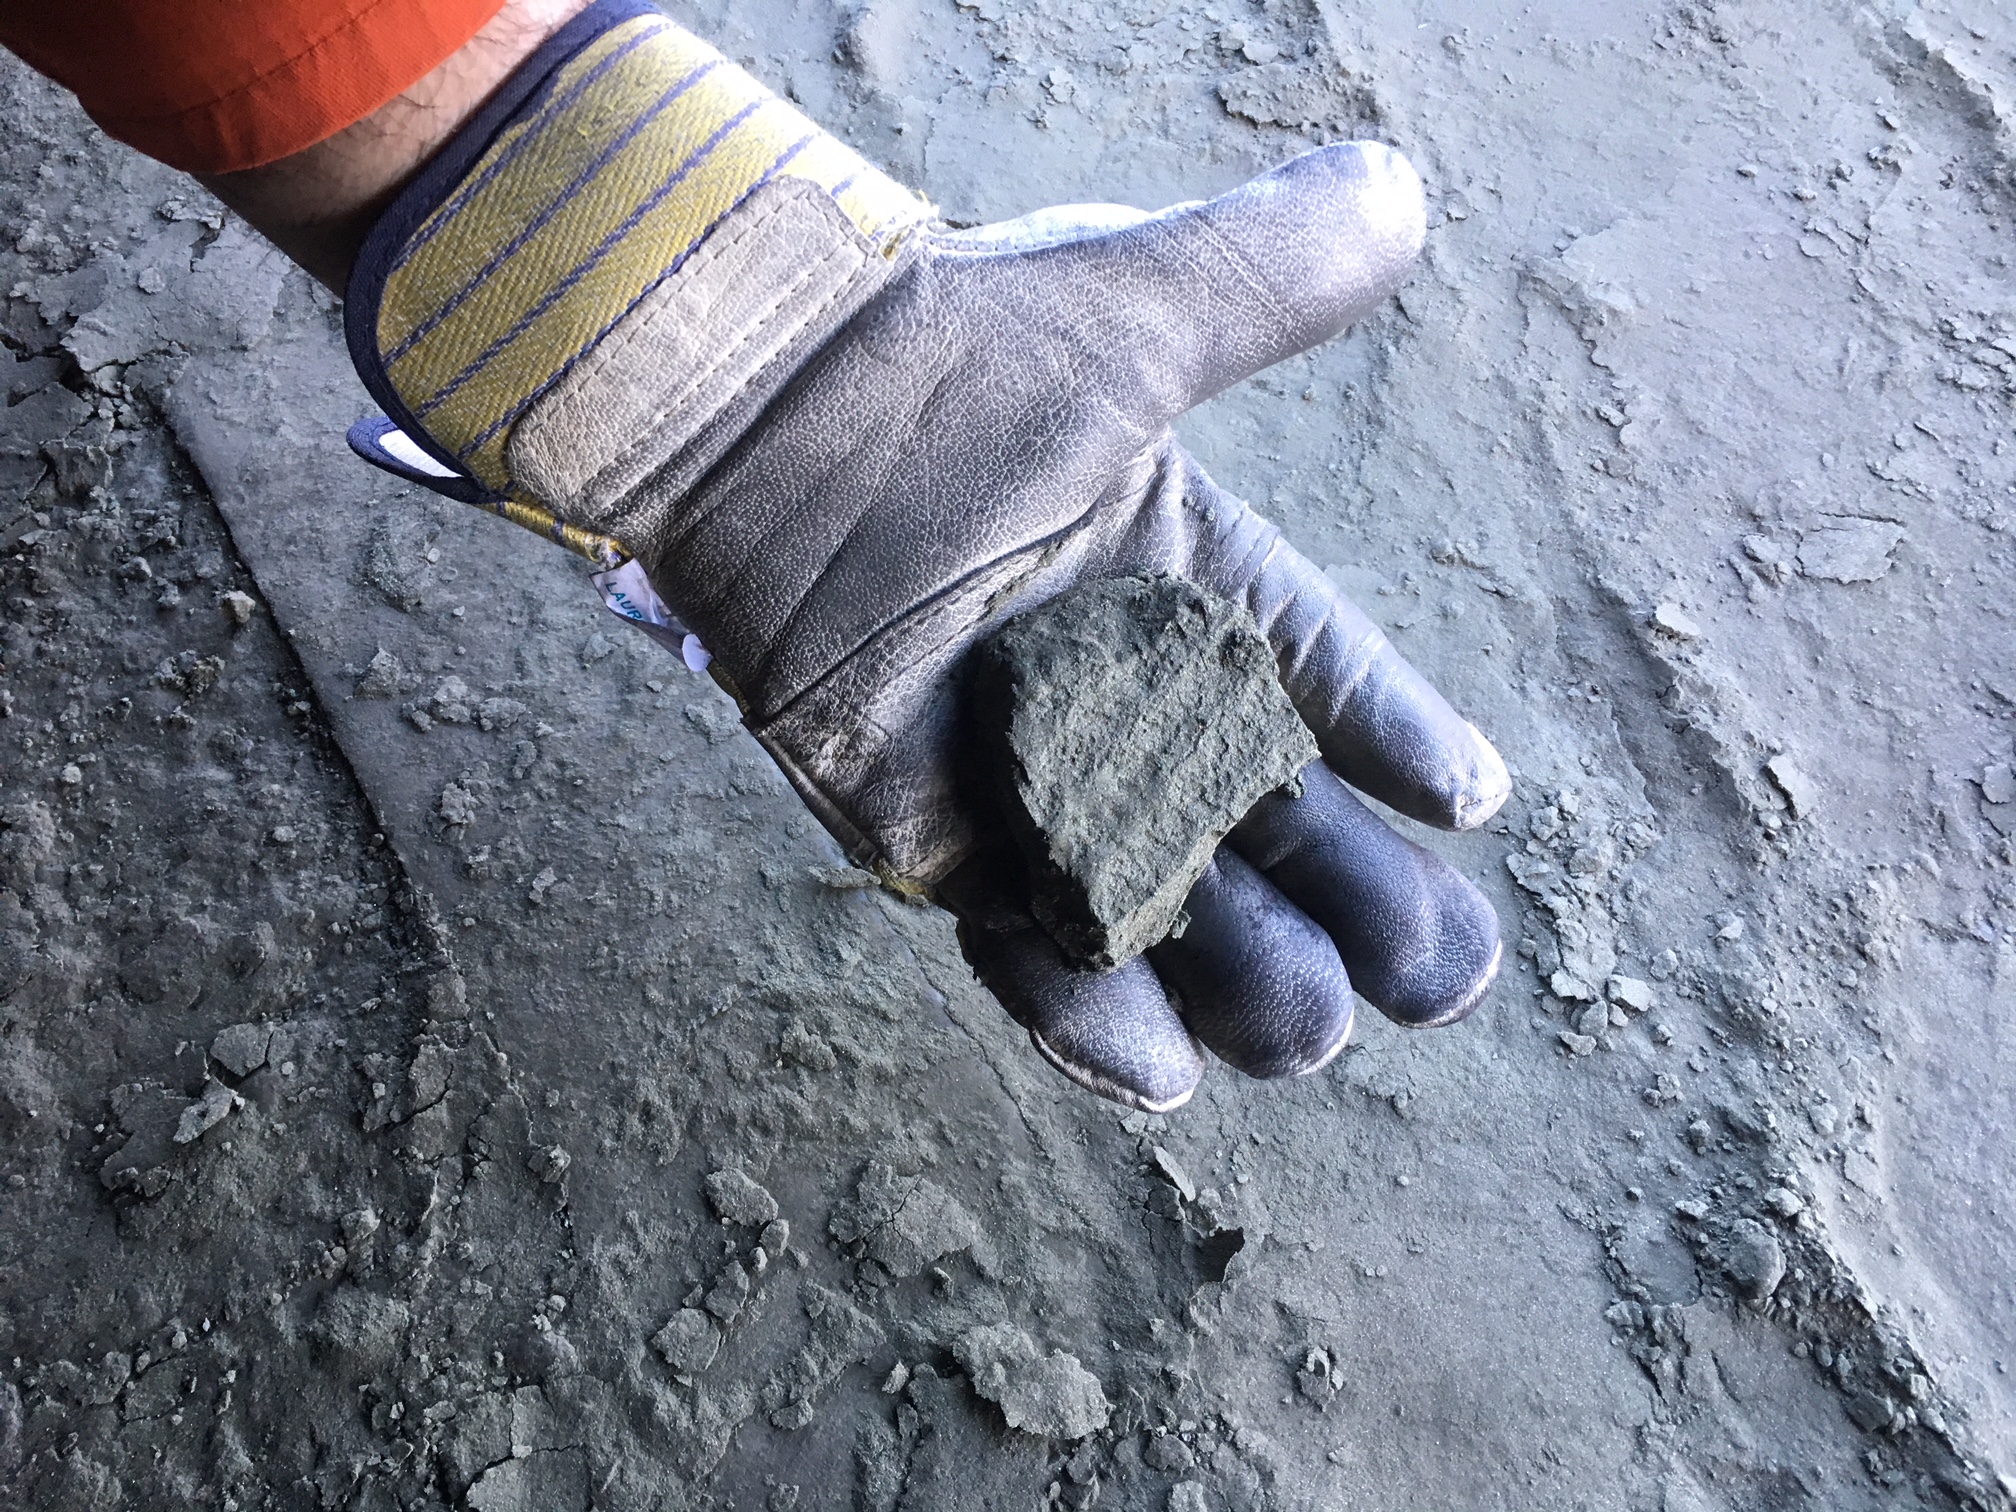
Nugget Pond Mill – Operator Andrew, holding a piece of Dry Copper Concentrate
I was very impressed at the level of knowledge which both operators displayed. Clearly, they are both fully engaged in the whole process and take great pride in what they’re doing. Speaking from experience, getting and maintaining this sort of engagement isn’t always easy, but pays huge dividends to a company that can sustain it.
Future Growth
Rambler is steering towards a definitive engineering study with regards to an expansion of the mining process, in which their target is to achieve a production rate of 2,000 mtpd, Phase III. An increase to this level of production should lower costs, ergo giving even more potential protection against a falling copper price or upside potential in a rising copper price market.
Along with a longer term production goal of 2,000 mtpd, Rambler’s Chief Exploration Geologist, Larry Pilgrim, mentioned that they are targeting further exploration of the deposit, down plunge, as all zones remain open at depth. In particular, the Ming North Zone remains largely unexplored and will be the exploration focus of the future. A surface drill program is also underway targeting the down plunge extension of the Lower Footwall Zone.
This surface drilling has been successful in expanding the LFZ zone as well as expanding the massive sulphide zone (Ming South zone). A September news release highlighted some of the results from the first hole.
- Ming Massive Sulphide (MMS) – Upper lens 1.02 m of 1.63% Cu and 1.23 g/t Au and Lower lens 6.30 m of 2.85% Cu and 2.99 g/t Au
- Lower Footwall Zone (LFZ) – 40.0 m of 1.42% Cu, including 6.0 m of 2.51% Cu and 7.57 m of 2.27% Cu
Results from the second hole are expected in the next couple of weeks.
NOTE: Pilgrim is a native Newfoundlander with a lot of experience in the mining industry. He mentioned that western Newfoundland, right up the Baie Verte Peninsula, had enough prospective geological targets to last him 3 lifetimes. I mention this because it appears we have only hit the tip of the iceberg in Newfoundland and Labrador’s exploration potential, which is great for the future of mining within the province.
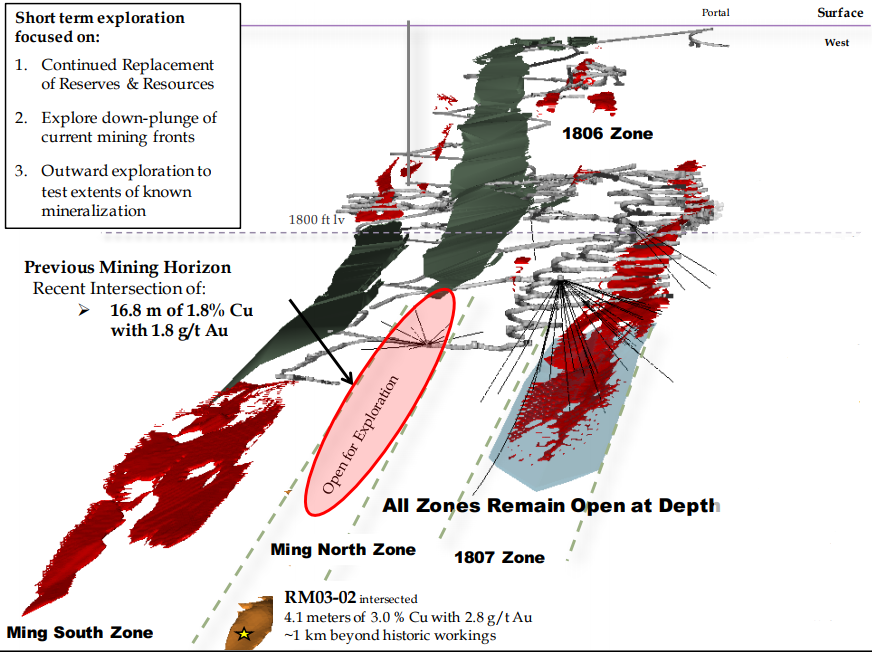
Ming Deposit – Slide from Rambler Corporate Presentation
In a news release on June 27 of this year, Rambler reported some great drill results from the Ming North Zone, which aren’t included in the current resource or reserve calculation. Some highlights were: R17-675-04: 4.00m of 3.17% Cu with 6.56 g/t Au, R17-675-05: 21.00m of 3.1% Cu with 1.13 g/t Au and R17-675-07: 17.97m of 2.79% Cu with 1.73 g/t Au. At the very least, the drill results show the potential to help replace the depleted reserves and, on the upside, show the potential to expand the resource and/or reserves in the future.
Concluding Remarks
I think it’s undeniable that the world is moving away from the use of fossil fuels as an energy source. In the coming years, alternative non-carbon emitting energy sources, such as solar and wind, appear as though they will have a larger footprint in energy generation. With this movement will come the need to store and transmit electricity on a far larger scale than we are today.
Thus, in my opinion, a major disruption in the primary battery metals and copper markets is destined to come. In saying this, positioning yourself in high quality companies such as Rambler Metals and Mining, could prove to be a good investment in the years ahead.
Don’t want to miss a new investment idea, interview or financial product review? Become a Junior Stock Review VIP now – it’s FREE!
Until next time,
Brian Leni P.Eng
Founder – Junior Stock Review
Disclaimer: All statements in this report, other than statements of historical fact should be considered forward-looking statements. These statements relate to future events or future performance. Forward-looking statements are often, but not always identified by the use of words such as “seek”, “anticipate”, “plan”, “continue”, “estimate”, “expect”, “may”, “will”, “project”, “predict”, “potential”, “targeting”, “intend”, “could”, “might”, “should”, “believe” and similar expressions. Much of this report is comprised of statements of projection. These statements involve known and unknown risks, uncertainties and other factors that may cause actual results or events to differ materially from those anticipated in such forward-looking statements. Risks and uncertainties respecting mineral exploration companies are generally disclosed in the annual financial or other filing documents of those and similar companies as filed with the relevant securities commissions, and should be reviewed by any reader of this newsletter.
Brian Leni is an online financial newsletter writer. He is focused on researching and marketing resource and other public companies. Nothing in this article should be construed as a solicitation to buy or sell any securities mentioned anywhere in this newsletter. This article is intended for informational and entertainment purposes only!
Be advised, Brian Leni is not a registered broker-dealer or financial advisor. Before investing in any securities, you should consult with your financial advisor and a registered broker-dealer.
Never, ever, make an investment based solely on what you read in an online newsletter, including Brian Leni’s online newsletter, especially if the investment involves a small, thinly-traded company that isn’t well known.
Brian Leni’s past performance is not indicative of future results and should not be used as a reason to purchase any stocks mentioned in his newsletters or on this website.
In many cases Brian Leni owns shares in the companies he features. For those reasons, please be aware that Brian Leni can be considered extremely biased in regards to the companies he writes about and features in his newsletters. You should conduct extensive due diligence as well as seek the advice of your financial advisor and a registered broker-dealer before investing in any securities. Brian Leni may buy or sell at any time without notice to anyone, including readers of this newsletter.
Brian Leni shall not be liable for any damages, losses, or costs of any kind or type arising out of or in any way connected with the use of this newsletter. You should independently investigate and fully understand all risks before investing. When investing in speculative stocks, it is possible to lose your entire investment.
Any decision to purchase or sell as a result of the opinions expressed in this report will be the full responsibility of the person authorizing such transaction, and should only be made after such person has consulted a registered financial advisor and conducted thorough due diligence. Information in this report has been obtained from sources considered to be reliable, but we do not guarantee that they are accurate or complete. Our views and opinions in this newsletter are our own views and are based on information that we have received, which we assumed to be reliable. We do not guarantee that any of the companies mentioned in this newsletter will perform as we expect, and any comparisons we have made to other companies may not be valid or come into effect.
Brian Leni does not undertake any obligation to publicly update or revise any statements made in this newsletter.
Brian Leni does not have a business relationship with Rambler Metals and Mining. Brian Leni does not own shares in Rambler Metals and Mining.
We’ve been persistently bearish on precious metals since September and that has annoyed our readers. The weak price action, negative divergences and bearish fundamentals are too much to currently overcome for the time being. The gold stocks finally cracked this week and have lost another 7%-8% in only the past seven trading sessions. Silver and Gold denominated in foreign currencies have joined the breakdown. Gold meanwhile has not broken down yet but all indications are that it will soon.
The chart below shows the daily candle charts for GDX and GDXJ which began their breakdown on Monday. They have declined sharply over the past seven trading days and are due for a bounce. A ~3% decline would take both GDX and GDXJ down to key support at GDX $21.00 and GDXJ $29.50. The miners are getting oversold and a bounce could begin from those levels.
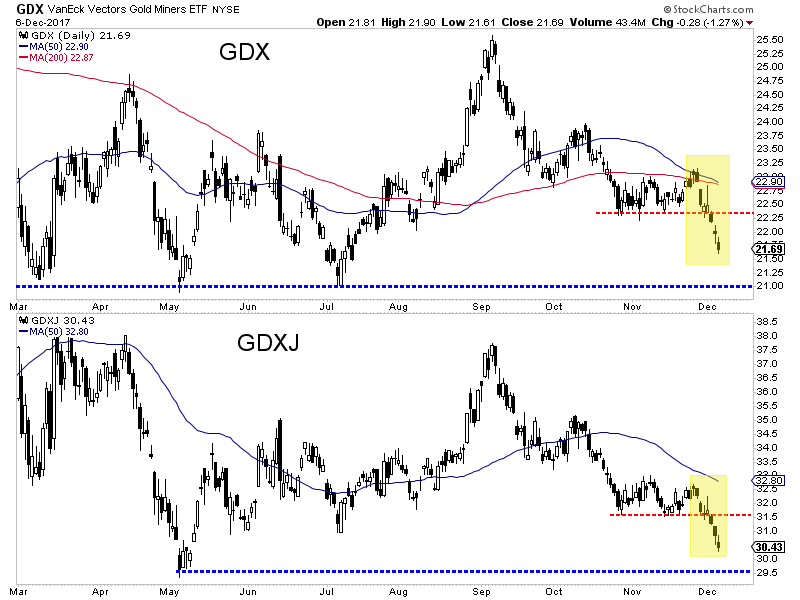
Unlike the rest of the sector, Gold has yet to crack as it maintains $1260/oz. As we can see below, Gold/FC lost support and traded down to a 4-month low. This, after Gold/FC tested its 200-day moving average seven times. Gold has held above a confluence of major support that includes lateral support and the 200-day and 400-day moving averages. All indications are that Gold will break below $1260 and if it does, look for support at $1205-$1220.
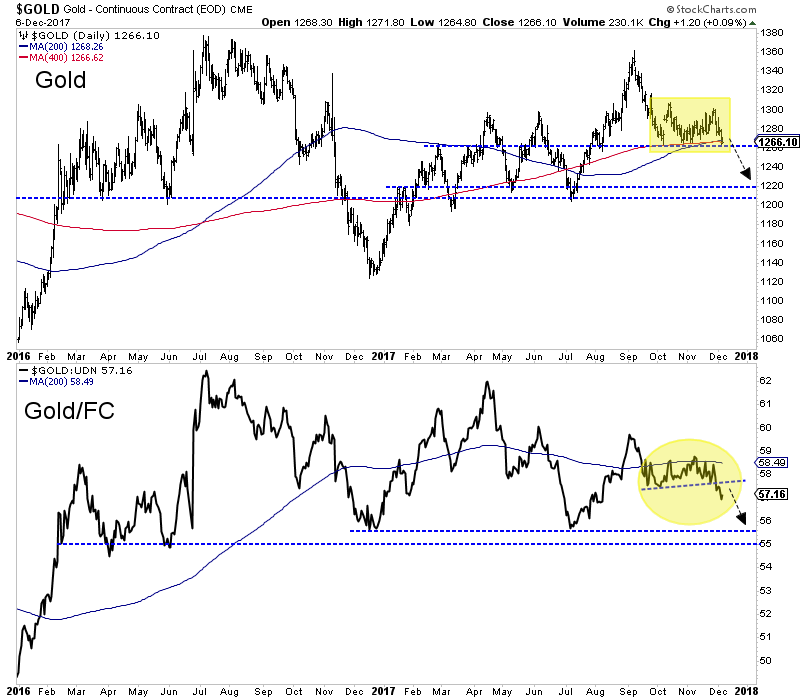
The 30,000 foot, bird’s eye view for miners remains encouraging but they need first to get through the next several months. Initial support levels (for GDX and GDXJ) are $21.00 and $29.50 while future support levels (perhaps in Q1 2018) are around the December 2016 lows. Generally speaking, I’d much rather be a buyer around those levels and not current levels.
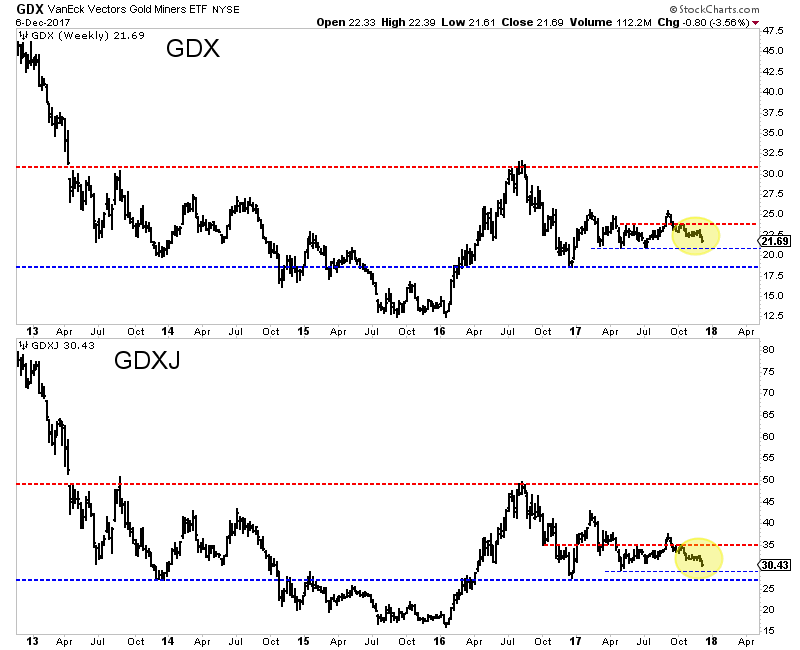
As we publish this article, Gold has broken below $1260/oz and the gold stocks have moved quite close to the initial support levels. I would not be surprised to see the gold stocks and Silver begin to bounce as Gold moves closer to strong support at $1220/oz. That being said, we are not expecting to turn bullish on the sector as a whole until sentiment worsens and the gold stocks approach strong support at their December 2016 lows. Values are starting to emerge in the juniors but it may be too early to be bullish. In the meantime, the key for traders and investors is to find the oversold companies with strong fundamentals with value and catalysts that will drive buying. To follow our guidance and learn our favorite juniors for 2018, consider learning more about our premium service.

Bitcoin’s meteoric skyrocketing this year has been astonishing, captivating traders across the globe. This once-obscure cryptocurrency has exploded into the world’s hottest market. With fortunes being won on paper, everyone is talking about bitcoin. But with its price shooting parabolic, unfortunately this wild ride has all the hallmarks of a classic popular speculative mania. And those all end badly, totally collapsing.
In the annals of financial-market history, the word “mania” is never used lightly. These are very-rare events where some market blasts higher so radically that it captures the popular imagination. The dictionary definitions of mania include “an excessively intense enthusiasm, interest, or desire” and “a pathological state characterized by euphoric mood, excessive activity or talkativeness, and impaired judgment”.
The seminal book on popular speculative manias is Charles Mackay’s “Extraordinary Popular Delusions and the Madness of Crowds”, first published way back in 1841. Manias are certainly nothing new, they have been periodically erupting for many centuries if not millennia. Mackay’s incredible work is one of the few must-read books for every investor. I’ve read it several times in my life, starting back in college.
Mackay’s title is brilliant, perfectly summing up manias. They are truly extraordinary popular delusions, illustrating the madness of crowds. Objectively, this year’s extreme bitcoin action definitely fits that bill. I say this as a lifelong student of the markets. Like the objects of lust in past popular manias, bitcoin and its underlying blockchain technology have real potential to change the world. But that doesn’t justify its price.
As a techie, I started getting interested in bitcoin about 5 years ago, well after its birth in January 2009. It was intriguing as the world’s first decentralized digital currency, an Information Age end run around the established government fiat-money systems relentlessly being inflated away by central banks. Bitcoin’s never-unmasked creator going by Satoshi Nakamoto was a marketing genius, wrapping bitcoin in gold terminology.
The “coin” suffix implied bitcoin is money, rather than a virtual fiction with artificial scarcity. And it used a novel distributed-ledger technology called blockchain. That is a record of all bitcoin transactions that is broadcast and validated by the entire bitcoin network. This ensures that bitcoins can be transferred with no counterparty risk, trust is irrelevant. Maintaining the blockchain is called “mining”, again bringing gold to mind.
The countless computers all over the world participating in recordkeeping for bitcoin’s blockchain work to simultaneously solve complex cryptographic problems, or hashes. This mining guarantees that all new bitcoin transactions are legitimate. While it is computationally-intensive which requires much electricity, bitcoin ingeniously awards participating miners with newly-created bitcoins. That’s a heck of an incentive today!
Somewhat like gold, the bitcoin supply grows at slow and ever-decreasing fixed rates. Today there are around 16.7m bitcoins in circulation. 12.5 new ones are created every 10 minutes and distributed to the miners maintaining the blockchain. That supply-growth rate will be gradually halved again and again until the bitcoin supply hits its hard-coded maximum of 21m bitcoins after 2110. So bitcoin’s supply is artificially limited.
Repurposing old computers to mining is what sparked my initial interest in bitcoin. I run a small financial-research company where we must periodically replace our high-end computers. So I investigated putting some of our old put-out-to-pasture ones to work mining bitcoins, but at the time the electricity cost well exceeded the resulting bitcoins’ value. Back then bitcoin mining didn’t require specialized custom-made rigs.
When bitcoin was younger, normal computers could solve the necessary cryptographic hashes to keep the blockchain up to date. As this distributed ledger grew, more-powerful high-end computer-graphics cards were needed. Today bitcoin mining requires computers with processors designed from scratch to do nothing but grind on the blockchain, called application-specific integrated circuits. They get very expensive.
Truly bitcoin and its brilliant blockchain distributed-ledger system are amazing technologies. They will ultimately reshape how we buy and sell goods and services, shifting the balance of power in currencies back away from centralized governments. It’s hard not to be a bitcoin enthusiast. That being said, it’s critical for traders to divorce bitcoin’s extreme mania price action from these technologies’ future potential.
For 18 years now, I’ve written an essay like this nearly every week. Wednesday mornings I decide on a market topic, research it, and build any charts. So our Zeal charts are always current to Wednesday’s close. Then on Thursday I write and proof each essay before publishing it Friday morning. Normally that day-and-a-half between finalizing the data and releasing an essay doesn’t matter, but bitcoin’s mania is crazy.
Bitcoin trades nonstop around the world, with transactions always happening and the blockchain always being updated. Around the normal US stock-market close this Wednesday, each bitcoin was priced at $12,968. So all the data, charts, and analysis in this essay is based on that ancient price. Merely 18 hours later as I pen this essay, bitcoin has rocketed another 18.6% higher to $15,379! Its ascent is meteoric.
So who knows how high bitcoin will be when you read this. But the higher bitcoin skyrockets, the more it emphasizes the extreme danger inherent in this popular speculative mania! Bitcoin is absolutely deep in a monster bubble, defined as “an increase in the price of a market that is not warranted by economic fundamentals and is usually caused by ongoing speculation in the expectation that the price will increase further”.
This first chart looks at bitcoin prices over the past couple years or so. Bitcoin has rocketed parabolic in 2017, soaring vertically in what looks exactly like a popular mania blowoff top. Vertical parabolic gains are mathematically impossible to sustain for long, as they would soon suck in all the available money on the entire planet! If this chart doesn’t terrify you, you should go read Mackay’s mania book before it’s too late.
Bitcoin was no slouch in 2016, soaring 123.6% higher in what looked like a late-stage bull market. That is hardly a blip on today’s chart though, as that morphed into a full-blown popular speculative mania this year. As of Wednesday’s sub-$13k price, bitcoin had skyrocketed 1251.9% higher year-to-date and a mind-boggling 1565.6% higher since its early-January low! These mania technicals are extreme beyond belief.
Like gold and many other investments including lots of stocks, bitcoin produces no cash yields and thus can’t be valued with conventional valuation analysis. So no one has any idea what it’s worth. The range of guesses is vast, running from zero to hundreds of thousands of dollars per bitcoin! But even in the absence of any fundamental valuation, bitcoin’s price action itself proves it’s exceedingly expensive today.
Obviously Wednesday wasn’t this bitcoin speculative mania’s peak, but let’s assume it was to use as a reference point for analysis. Bitcoin’s “terminal gains” as of the middle of this week were astounding. In the past month alone it had soared 87%, nearly doubling! It had skyrocketed 197% in 2 months, 280% in 4 months, and 459% in 5 months. This left bitcoin radically overbought, trading at 3.70x its 200-day moving average.
The problem with such extreme mania price gains is they soon collapse under their own weight. Over the past week ending Wednesday, bitcoin was surging an average of 5.9% per day. Two of those days had 9.7% gains. Literally nothing can rally 5% to 10% per day for long, as the math is truly impossible. Think of that old rule of 72, which is used to approximate how long it takes for any investment to double in price.
It is normally applied to years, where 72 is divided by the average annual return to figure out about how many years it will take to grow 100%. 72 divided by 7% for example works out to about a decade to see 100% gains. But at 5% or 10% compounded daily as bitcoin is doing, its total value will double in just under 14.3 and 7.3 trading days respectively! Even to a casual observer that sounds absurd, wildly unsustainable.
Early Thursday morning, the total market value of all bitcoins in circulation was already around $250b. If bitcoin doubles again over the coming weeks and months, that would soar over $500b. Just one more doubling after that would take it to a staggering market cap of $1t! While anything is possible, that seems wildly improbable. For comparison, the Fed’s latest read on its total M1 money supply is running near $3.6t.
When anything shoots parabolic in a popular speculative mania, exponentially more capital inflows are required to sustain such extreme gains. It doesn’t take many doublings in price and market cap to suck in all available money on the planet! While bitcoin certainly enjoys a popular niche, there’s zero chance that global investors will sell sizable fractions of their bond, stock, gold, and cash holdings to buy bitcoins.
Thus extreme gains are never sustainable, as the collective buying power of even populations caught up in manias soon exhausts itself. Eventually everyone interested in buying bitcoin has already bought, drying up their pools of available capital. When those massive bubble-fueling capital inflows peak then taper off, market gravity reasserts itself and the stratospheric price starts plummeting back down to terra firma.
Unfortunately naive speculators don’t realize how extreme doublings and quadruplings within a matter of months truly are. That makes it easier for them to get sucked into mania psychology. They read about the blistering gains, everyone is raving about the bubble market, so they throw caution to the wind and buy in super-high. Even worse, many traders rushing to buy into parabolic bubbles borrow money to do it with!
At that point all rationality is thrown out the window, it’s an extraordinary popular delusion as Mackay wisely wrote 176 years ago. The price is totally disconnected from reality, and the sole reason capital is flooding in is because it is soaring. That becomes self-reinforcing for a season, buying fueling gains and greed which leads to even more buying. While exciting, vertical parabolic blowoffs are exceedingly dangerous.
Every popular speculative mania in history has failed spectacularly, the bubbles bursting and crashing, since capital inflows can never grow exponentially for long. That’s going to happen to bitcoin too, without any doubt. The deluded speculators who succumb to the temptation to buy in high, especially if they use leverage, are going to get slaughtered. An infamous past bubble helps illustrate bitcoin’s extreme dangers today.
This final chart again assumes Wednesday was this bitcoin bubble’s peak for the sake of analysis. The past couple years’ bitcoin action is superimposed over the notorious silver bubble that crested in January 1980. Both datasets are indexed at 100 at their respective peaks to render them in perfectly-comparable percentage terms. The bottom axis shows time elapsing before and after the peaks measured in months.
The parallels between bitcoin’s extreme parabolic price action over the past 6 months or so and silver’s in its bubble’s final 6 months are uncanny. While very rare, popular speculative manias are nothing new. The terminal gains of bitcoin and silver are remarkably similar as the table above shows. If these data series were not labeled, today’s bitcoin bubble and the 1979 silver bubble would literally be indistinguishable.
As of Wednesday bitcoin had rocketed 87% in its latest month compared to 104% for the silver bubble in its terminal month. At 2 months out they were identical at 197% and 196% gains. The same was true at 3 months with 181% and 179% gains. In their final 5 months, they skyrocketed 459% and 417% higher. Their terminal 6 months saw 366% and 402% gains. This bitcoin bubble is behaving just like the silver bubble!
While bubbles are incredibly exciting and fun when they shoot parabolic, the aftermath is catastrophic for traders who buy high. Bubbles always burst, leading to full-on crashes that proceed long busts. Just a month after silver peaked at $48.00 per ounce in January 1980, it plunged 35%. In the first 2, 3, and 4 months post-peak, silver plummeted 54%, 73%, and 76%! Bitcoin faces similar extreme downside risks today.
Once this mania bitcoin bubble bursts, and it will, the odds are very high that bitcoin will lose 50% to 75% of its value within a few months on the outside! Everyone owning bitcoin today must be prepared for brutal near-term downside proportional to this year’s bubble upside. When a bubble bursts it rapidly destroys most of the paper wealth that bubble created, which was really an illusion all along if not cashed out.
And once popular speculative manias inevitably fail, prices don’t return to those extreme bubble-peak levels for an awfully-long time. That silver bubble peaked 37.9 years ago, and there are still many silver enthusiasts today. Like the hardcore bitcoin faithful, plenty of people love silver with a religious-like zeal believing it is the ultimate investment. In nominal terms, silver didn’t exceed that bubble peak until April 2011.
After taking a staggering 31.3 years to regain January 1980’s high, silver held it for a single day and has never returned since. And in real inflation-adjusted terms based on the US CPI, silver’s bubble peak in today’s dollars was over $152 per ounce! Obviously silver has come nowhere close to trading near those same real levels again. Prices are so extreme after popular speculative manias they may never recover.
A far-milder bubble than both bitcoin and silver arose in the stock markets in late 1999 and early 2000. Like bitcoin, the technology of the Internet was amazing and would forever change our world. Yet stock prices got so extreme then that the NASDAQ didn’t revisit its March 2000 closing peak for the first time until April 2015, fully 15.1 years later! And that only happened because NASDAQ’s components greatly changed.
The history of popular speculative manias proves that even if bitcoin and its underlying blockchain are here to stay, it will likely be many years or decades until bitcoin prices regain their bubble peak wherever that happens to be. Once this bitcoin bubble inevitably pops, there’s virtually no chance its traders will be made whole again. They’ll hold through the burst in hopes bitcoin will rebound, but bubble poppings are final.
And it’s not just bitcoin’s extreme price action that reveals it’s in a bubble fueled by a popular speculative mania. Anecdotal stories abound showing a huge influx of young and naive “investors” who have never lived through a bubble. The leading bitcoin broker in the US is Coinbase. Its accounts are exploding as people rush to pour money into this bitcoin mania. By late November, Coinbase’s active accounts had hit 13.3m!
This is staggering growth, as Coinbase reported just over 5m accounts as 2017 dawned. 13.3m is way bigger than stock broker Charles Schwab’s 10.6m at the end of October, and threatening to rival the 24.9m accounts stock broker Fidelity had at the end of June! As in all manias, the vast majority of these new bitcoin “investors” have drank the Kool-Aid and believe bitcoin’s technology justifies its extreme price gains.
When markets soar so high all rationality is thrown out the window, the only reason to keep buying is the greater-fool theory. Late-stage traders buy super-high in the hopes they’ll find an even greater fool to sell even higher to later! Soaring prices can entice in big new capital inflows for a season, but eventually the price levels get so high that it’s impossible to sustain exponential buying. Then the bubble bursts, prices crash.
Even if bitcoin and blockchain forever change currencies in the future, nothing justifies doublings and quadruplings in bitcoin prices in a matter of months. Such extremes are never sustainable, all popular manias fail spectacularly even though the technology investors were excited about lives on and indeed changes the world. I’m really excited to see bitcoin and blockchain applied to digital gold in coming years.
Gold has been universally valued across the world for millennia, yet it’s impractical to use as money for most transactions. But if bitcoin-and-blockchain technologies were applied to gold, this metal could easily be subdivided into the tiniest of increments and traded globally. A gold version of bitcoin would have to be 100% physically backed by gold held in secure vaults in safe, trusted countries. It’s already being worked on.
But the great value of bitcoin-and-blockchain technologies doesn’t make bitcoin immune from the natural consequences of this year’s bubble. Bitcoin is far too large now to keep doubling on a monthly basis, it’s impossible. And there’s never been a past bubble where prices stop soaring but don’t crash, instead just rallying on from there quasi-normally. Greedy traders start selling when the parabola stalls, driving the burst.
One of the reasons bitcoin has skyrocketed is there are virtually no sellers relative to the great herds of new buyers flocking in. That is all going to change soon, which presents big risks of popping this bubble. Both the CBOE and CME are set to launch actual bitcoin futures in the next week or so, which will allow professional speculators to not only buy bitcoin but short sell it at scale. That alone may very well slay this bubble.
Bitcoin is pretty inefficient too, with transactions taking up to 10 minutes to process as the blockchain gets bigger and bigger. Transaction costs are also skyrocketing, leading some major businesses like the Steam online video-gaming service to stop accepting bitcoin as payment. Its owner Valve says it now costs about $20 to process a single bitcoin payment, far too expensive for this company’s massive 67m users.
As bitcoin grows, the blockchain itself is getting ever-more unwieldy. That ledger recording every single bitcoin transfer ever is requiring progressively more computing power to process, making mining for the network much more expensive. Recent estimates place bitcoin-mining electricity usage at 0.13% of the world total. A single bitcoin transaction now requires enough electricity to power an American house for a week!
As long as bitcoin prices are sky-high, large-scale mining operations to process bitcoin’s cryptographic hashes are profitable. But when bitcoin crashes after this bubble, computers tasked to mining will likely plunge in parallel. While the hashes are dynamically adjusted to account for network mining power, this could still increase transaction times as blockchain grows. That would make bitcoin less attractive as a currency.
As a professional speculator over the past two decades or so, I wouldn’t touch bitcoin with a ten-foot pole today. Buying into a popular speculative mania that’s already rocketed parabolic is the height of folly, guaranteeing massive losses in the near-future. If you were shrewd enough to buy bitcoins before the last 6 months, you should be scaling out and taking profits. One bitcoin expert calls it a “consensus hallucination”.
At Zeal we’ve spent decades studying and trading the markets, building wealth normally and consistently through profitable real-world trading with a contrarian bent. This means buying low and selling high, so bitcoin is off the table. But as of the end of Q3 we’ve realized 967 stock trades recommended in real-time in our newsletters since 2001, which averaged stellar annualized realized gains of +19.9% over that long span!
The key to this success is staying informed and being contrarian. That means buying low when others are scared, not when they are euphoric like in bitcoin’s mania. An easy way to keep abreast is through our acclaimed weekly and monthly newsletters. They draw on my vast experience, knowledge, wisdom, and ongoing research to explain what’s going on in the markets, why, and how to trade them with specific stocks. Easy to read and affordable, they’ll help you learn to think, trade, and thrive like contrarians. Subscribe today, and build lasting wealth instead of getting obliterated when bitcoin’s bubble bursts.
The bottom line is this year’s bitcoin popular speculative mania has gone parabolic. Such extreme gains are never sustainable, as they require exponentially-growing capital inflows. Once this greed-drenched bubble stage is reached, it’s only a matter of time until the burst inevitably follows. The resulting selling from panicking traders is so violent that most of the mania gains are fully annihilated in a matter of months.
While bitcoin and its blockchain distributed-ledger technologies are amazing and will indeed likely change the world, they don’t justify bitcoin’s extreme vertical gains. Plenty of past bubbles were based on great new technologies too, but those prices still collapsed once the supply of greater fools exhausted itself. After skyrocketing so darned fast, bitcoin is certainly the riskiest major investment in the world. Caveat emptor!
Adam Hamilton, CPA
December 8, 2017
Copyright 2000 – 2017 Zeal LLC (www.ZealLLC.com)
Day 3 of my Newfoundland trip started at the crack of dawn, when I was awakened before 4am by the alarm of the logger in the room next to me at the Lakeview Inn in Millertown. I tossed and turned for the next hour and a half and then made my way downstairs, where I had a terrific breakfast with Antler Gold’s exploration team. After breakfast, we headed to the team’s exploration home base, a rented cabin a few blocks away from the Inn.

Millertown located on the Shores of Red Indian Lake
For the exploration team, each day starts here with a safety review and a delegation of assignments by Exploration Manager, Dave Evans. By about 7 am, we were on the road headed south of Millertown, down a set of logging roads, to Antler’s Wilding Lake Gold Project.
Yours Truly standing in Antler’s Elm Zone Trench
Before getting any further into my site visit report, I’m going to share some interesting facts about the history of Millertown.
Millertown
Just south of Buchans junction, which sits at the north end of Red Indian Lake in central Newfoundland, is Millertown. Millertown was established in about 1900 by Lewis Miller, a timber baron and merchant from Crieff, Scotland.
Having exhausted his timber lands in Sweden, Miller brought a team of Scots and 100 Swedish lumberman to the Red Indian Lake area, in an effort to establish a logging operation that could supply the British Empire with pine timber.

What is left of the old saw mill in Millertown
The town was created to house this team of lumbermen as they built 80 Swedish style, two-room cottages along the shores of the lake. Additionally, they constructed a school and a church on the hill overlooking the lake, which still stands today.
Millertown Church and homes along the shores of Red Indian Lake
During my visit, I asked about the logging industry in the area, and was told that since the closure of the pulp and paper mill in Grand Falls, logging in the area has really declined with only a small number of companies still in operation. Unfortunately, the industry’s decline has had a major effect on the town and many younger families have left.
Shores of Red Indian Lake
With the area’s great geology and the access provided by the logging roads, however, a mining renaissance could be coming to Millertown and the surrounding area. Companies such as Antler Gold, Marathon Gold and Torq Resources are exploring heavily in this general region. A large discovery and the development of a mine could bring much needed cash and jobs to this beautiful area in central Newfoundland.
The Wilding Lake Gold Project
After driving for about an hour on the rough logging roads, we arrived at the point of the original Wilding Lake gold mineralization discovery, which occurred just a few years ago. The gold was found in 2015 by prospectors, Brian Jones and Gary Rowsell, in quartz boulders alongside a new logging road. Grab samples from these boulders assayed up to 74.8 g/ton gold.

Approximate location of the first boulders discovered by Jones and Rowsell
Jones and Rowsell eventually sold the property to Altius Minerals, which is a large mining royalty company based in St. John’s, Newfoundland and Labrador. Altius then carried out further exploration activities in the fall of 2016, such as soil and basal till sampling, airborne and ground geophysics.
Fast-forwarding to today, Altius has since optioned the property to Antler Gold, who is currently conducting a systematic exploration program of the property with soil sampling, trenching and, most recently, a 2,500m drill program of some highly prospective targets.
To note, Antler’s Wilding Lake Project covers 215 sq. km and more than 50 km of strike length of the projected structural trend that is believed to control the regional gold mineralization. This trend is the same as Marathon Gold’s Valentine Lake Gold Camp, which currently boasts a total over 2 million ounces of 43-101 compliant gold resources in the Measured and Indicated, and Inferred Resource categories.
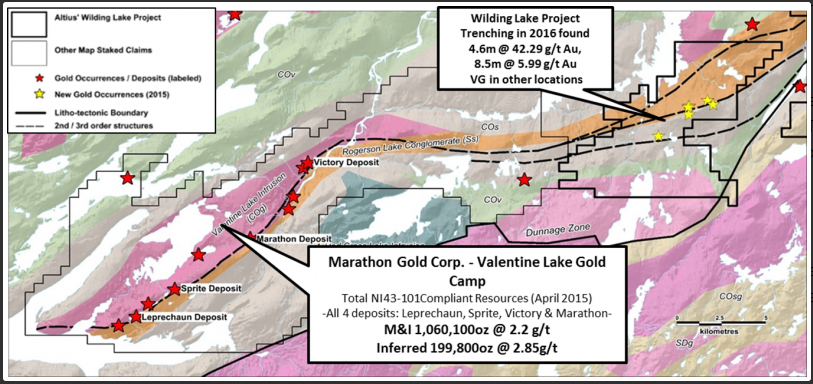
Wilding Lake Gold Project Geology Map
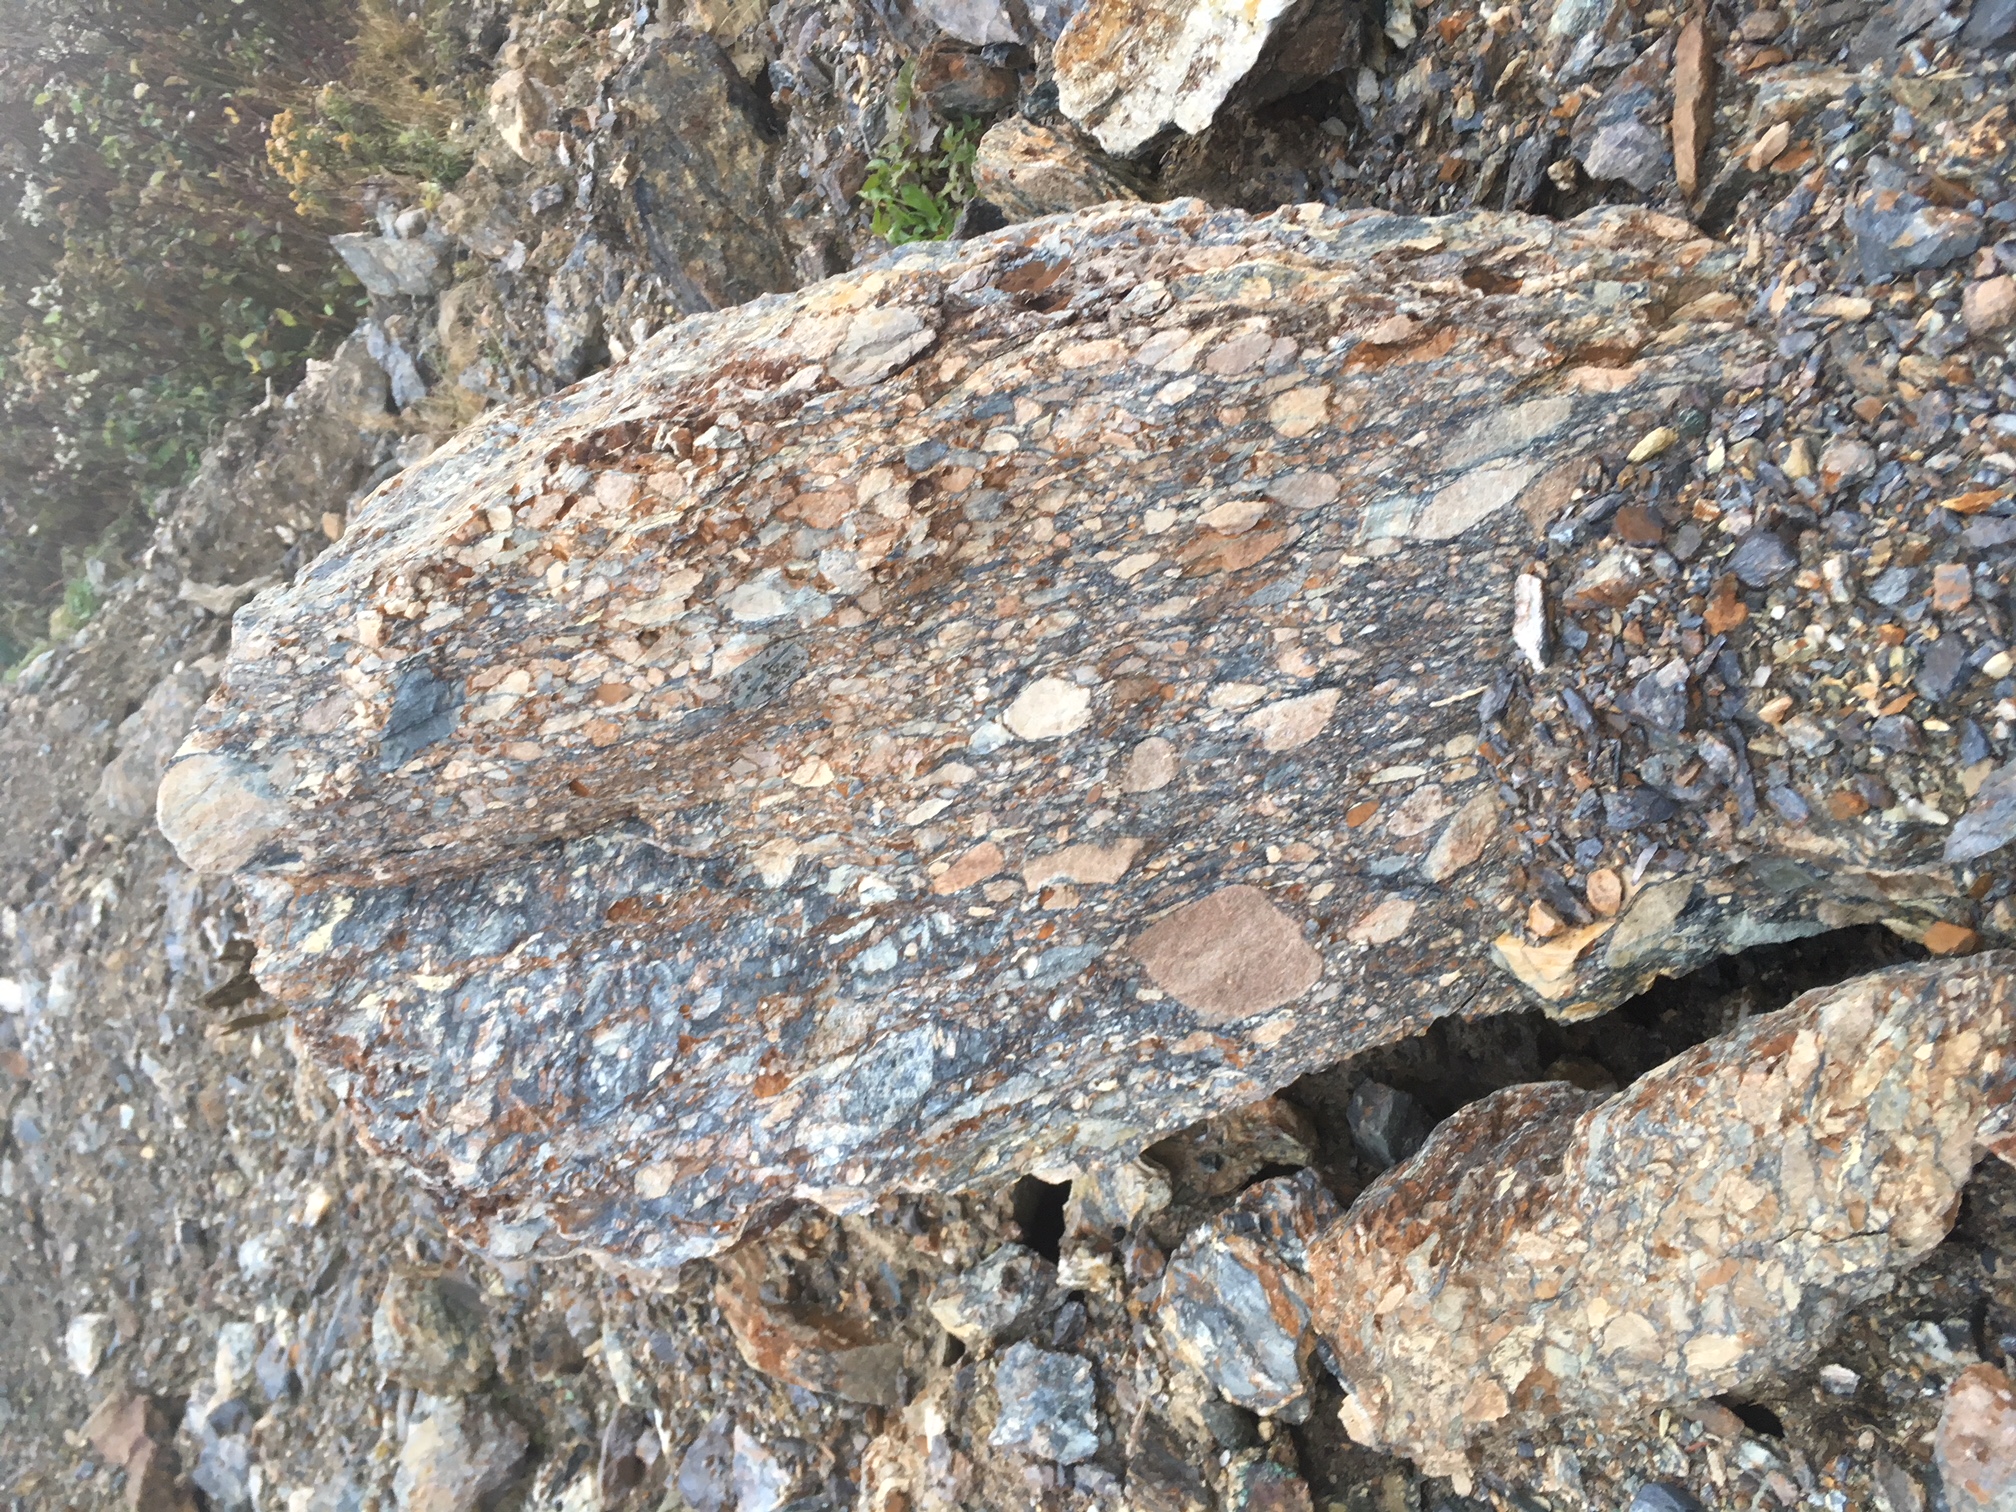
Text Book Example of Rogerson Lake Conglomerate
Gold Mineralization Zones
In 2016, 5 gold mineralization zones – Alder, Taz, Elm, Cedar and Dogberry – were found by Atlius’ exploration team. The gold showings mainly consist of quartz-tourmaline veins containing clots of coarse-grained chalcopyrite, hematite, malachite and visible gold is hosted by the Rogerson Lake Conglomerate.
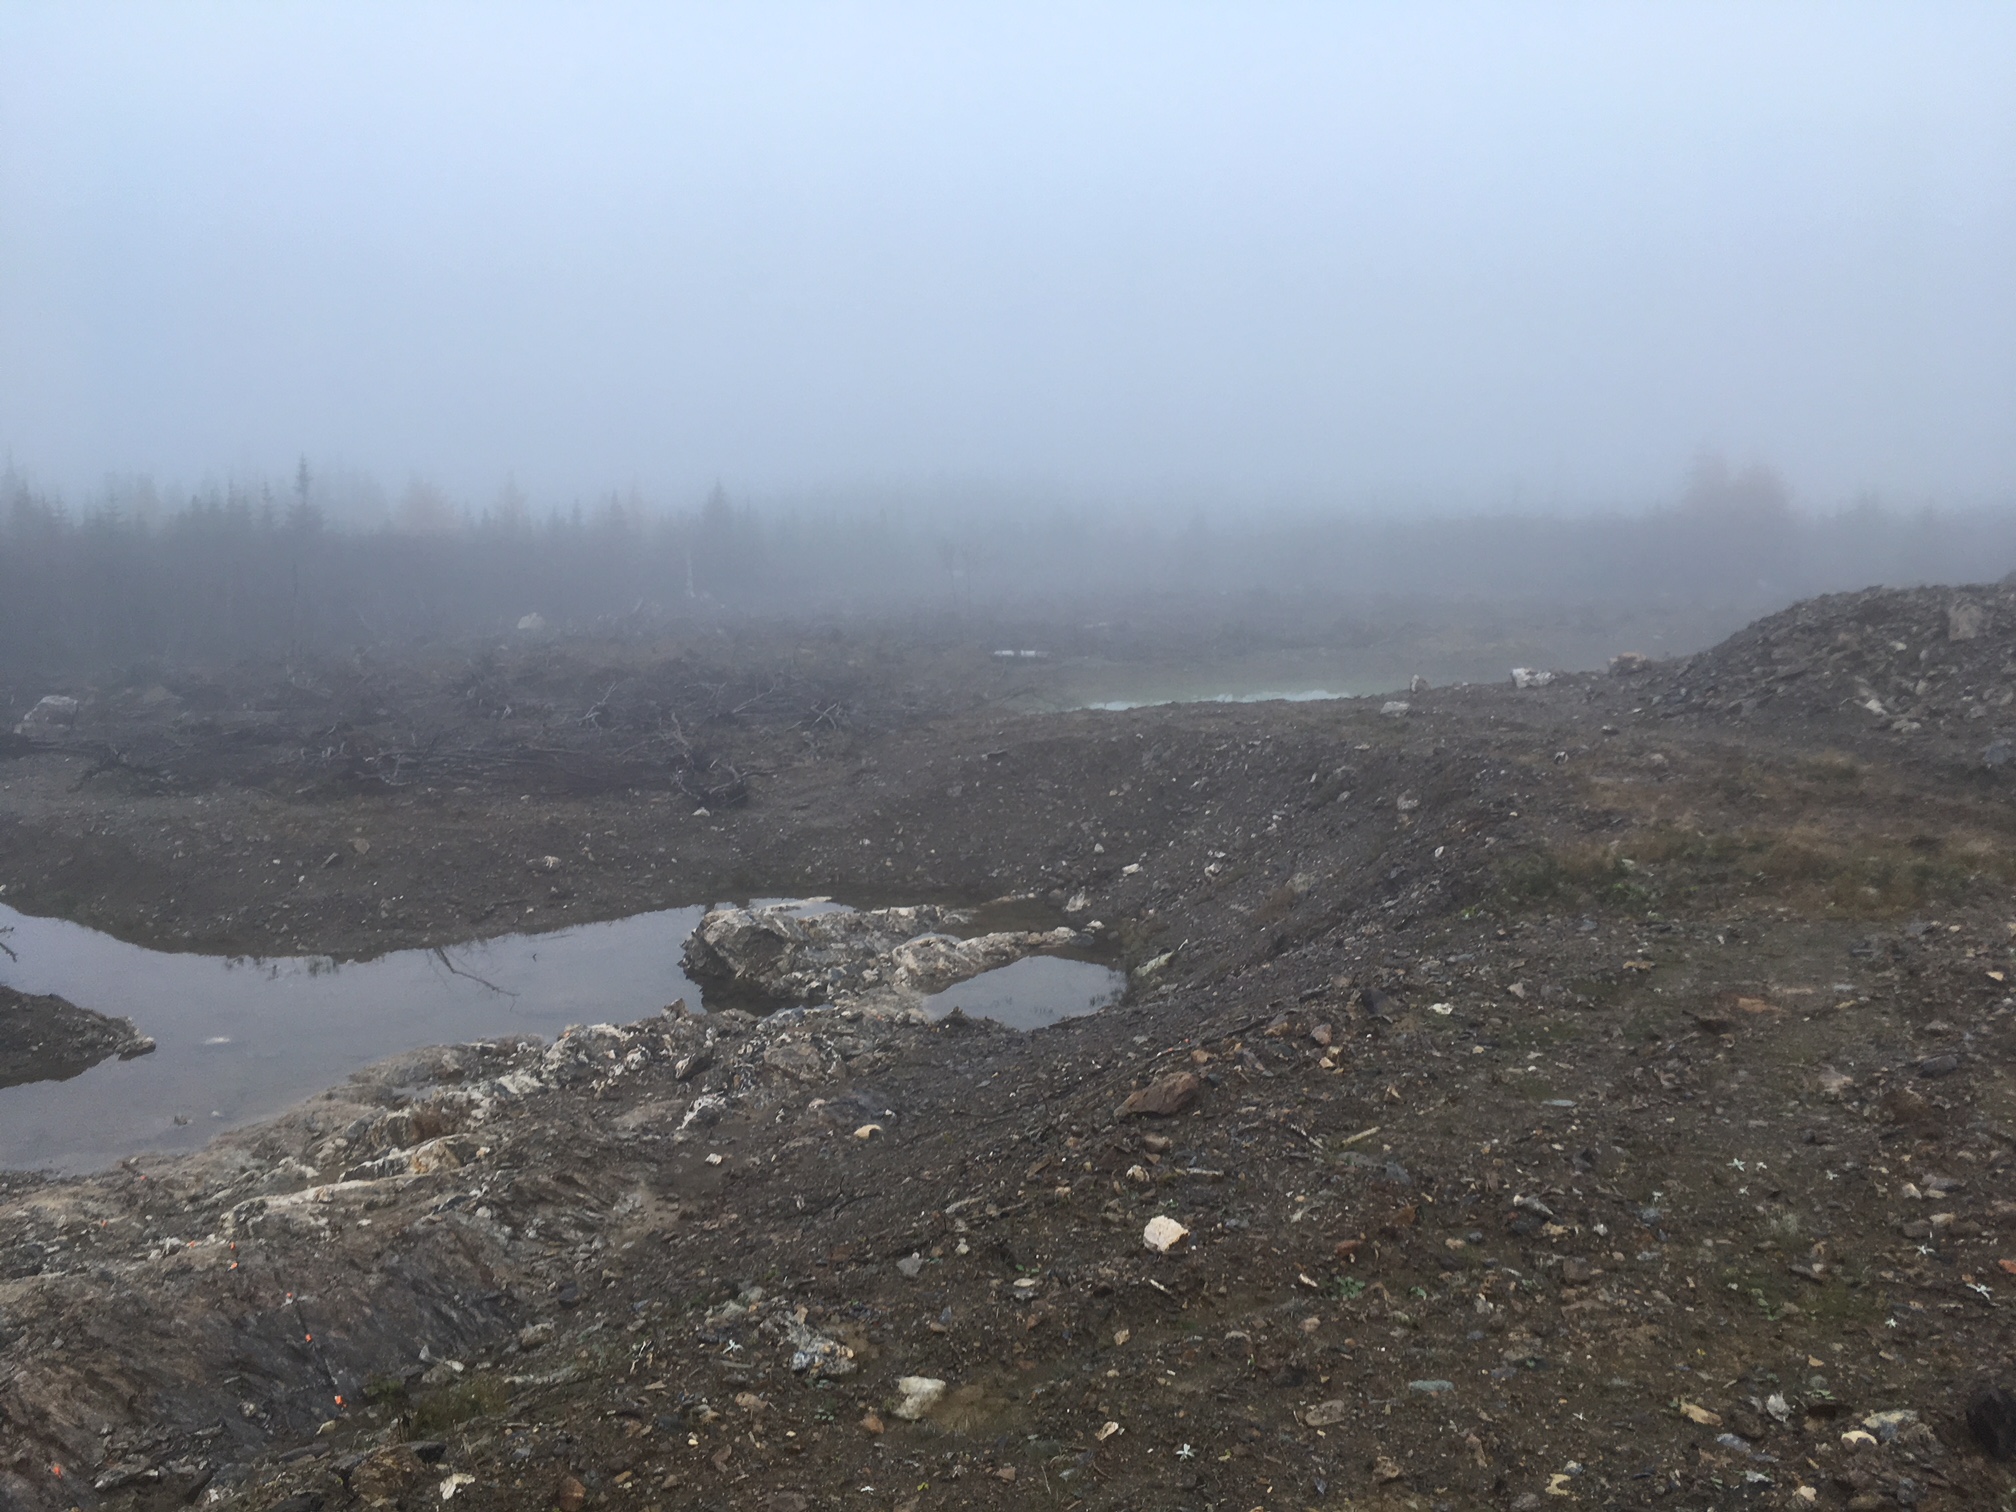
Taz Zone Trench located in Close Proximity to Original Boulder Discovery
In the picture below, the purplish coloured rock is the Rogerson Lake Conglomerate. As the conglomerate nears the quartz veining, its colour changes to brownish. The Elm Zone was the most developed trench I saw, and the focus of drilling at the time of my visit.

Elm Zone Trench – Rogerson Lake Conglomerate, bottom left purplish colour
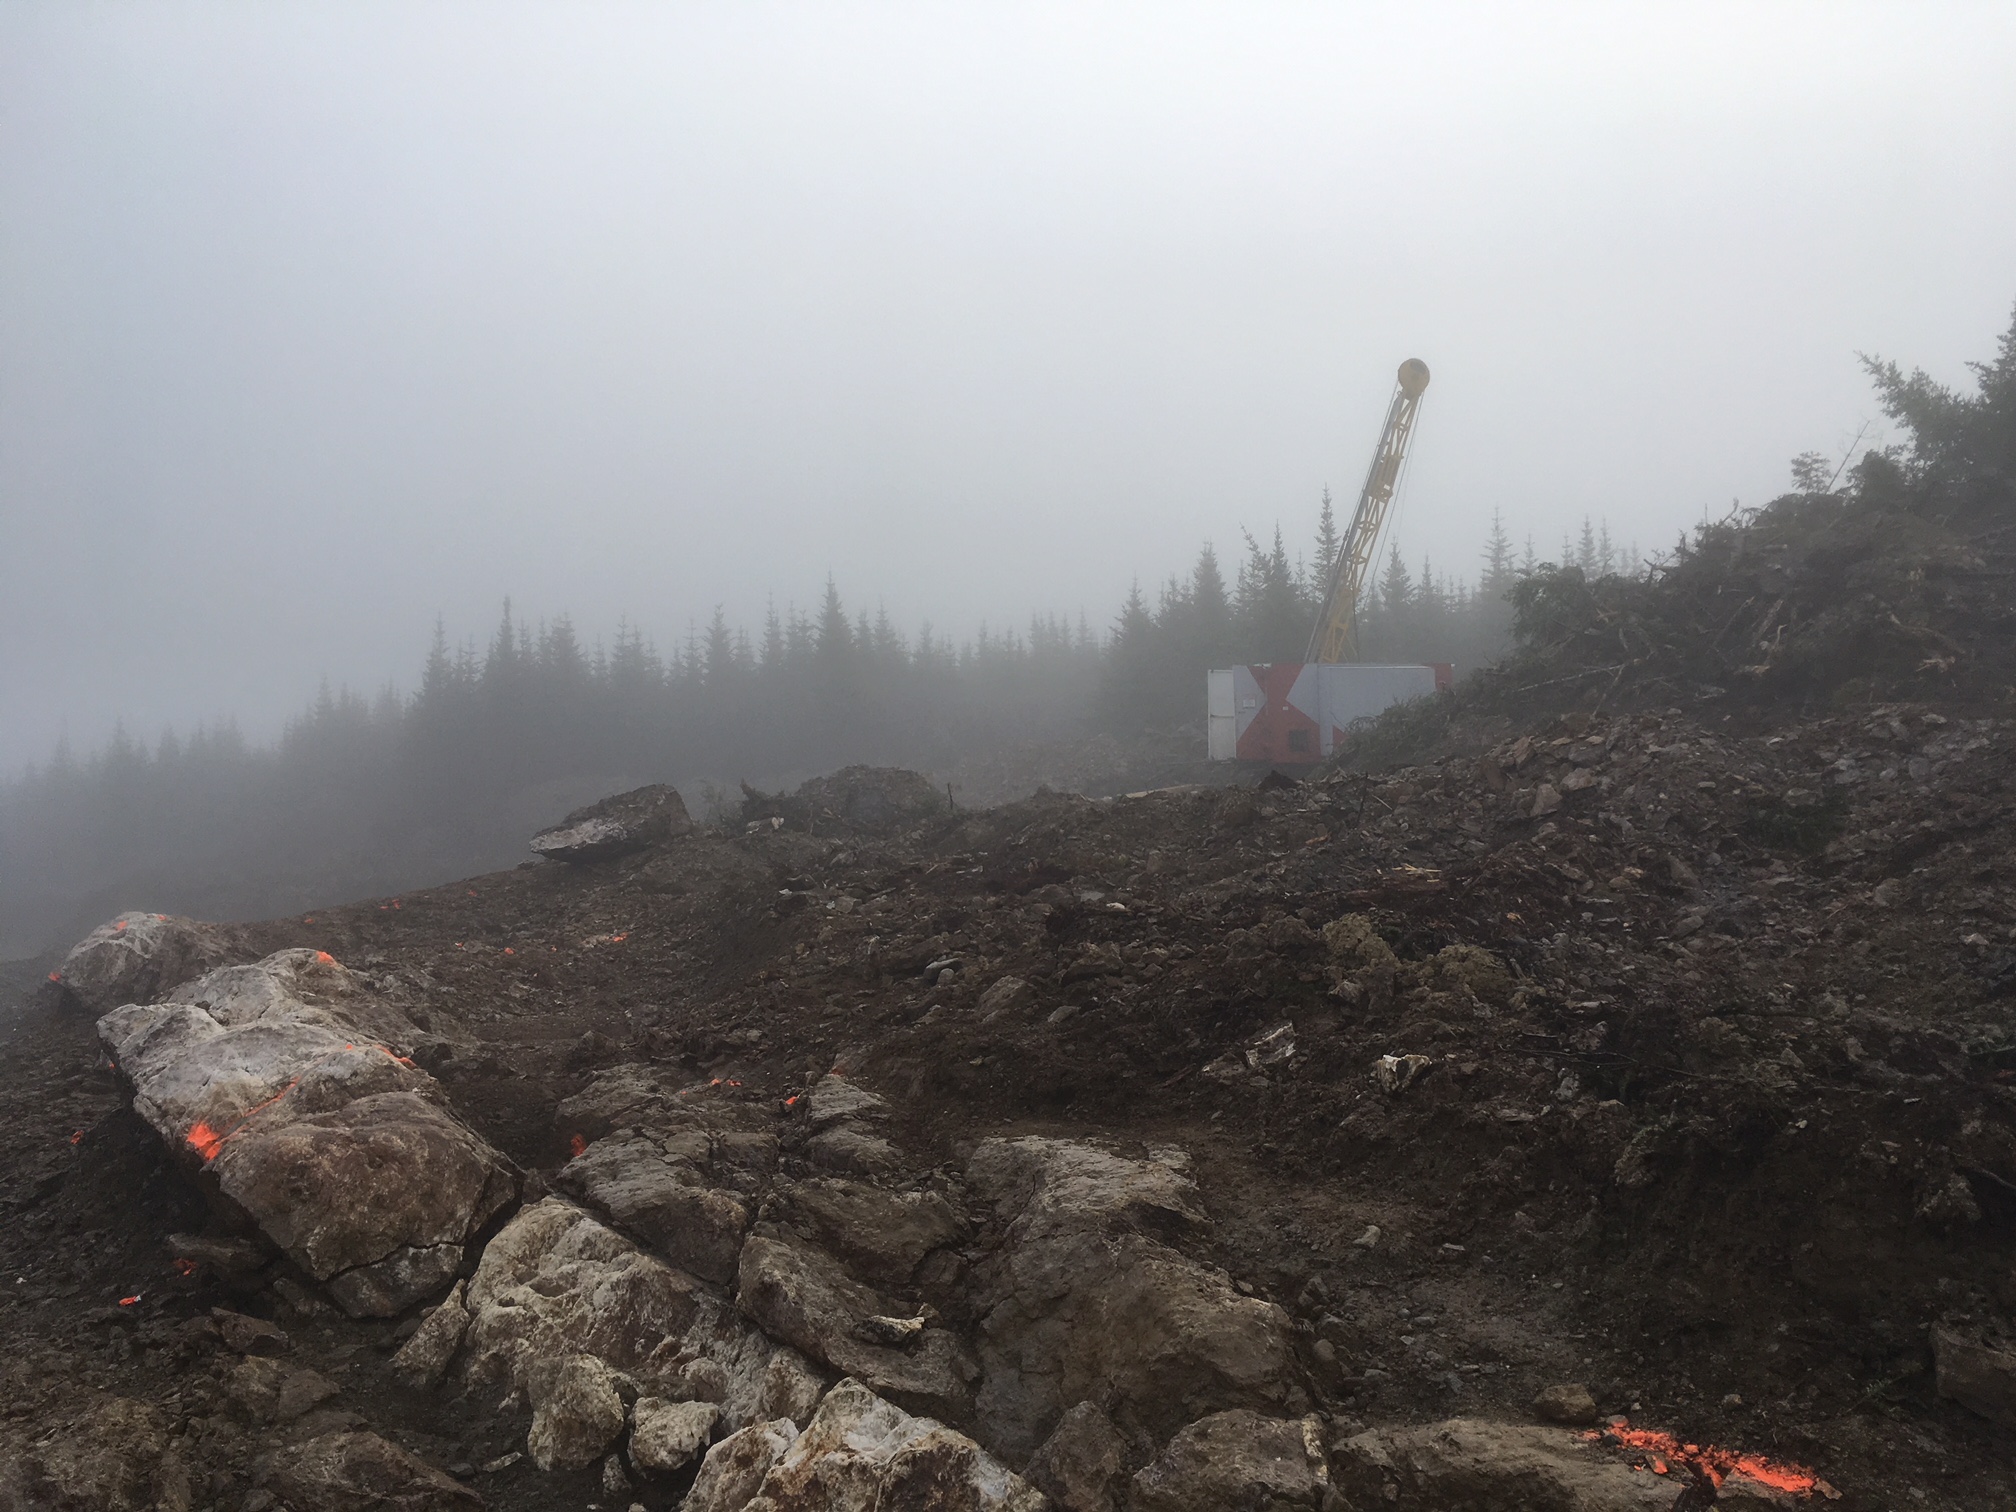
Elm Zone Trench – Site of drilling on the day of my visit
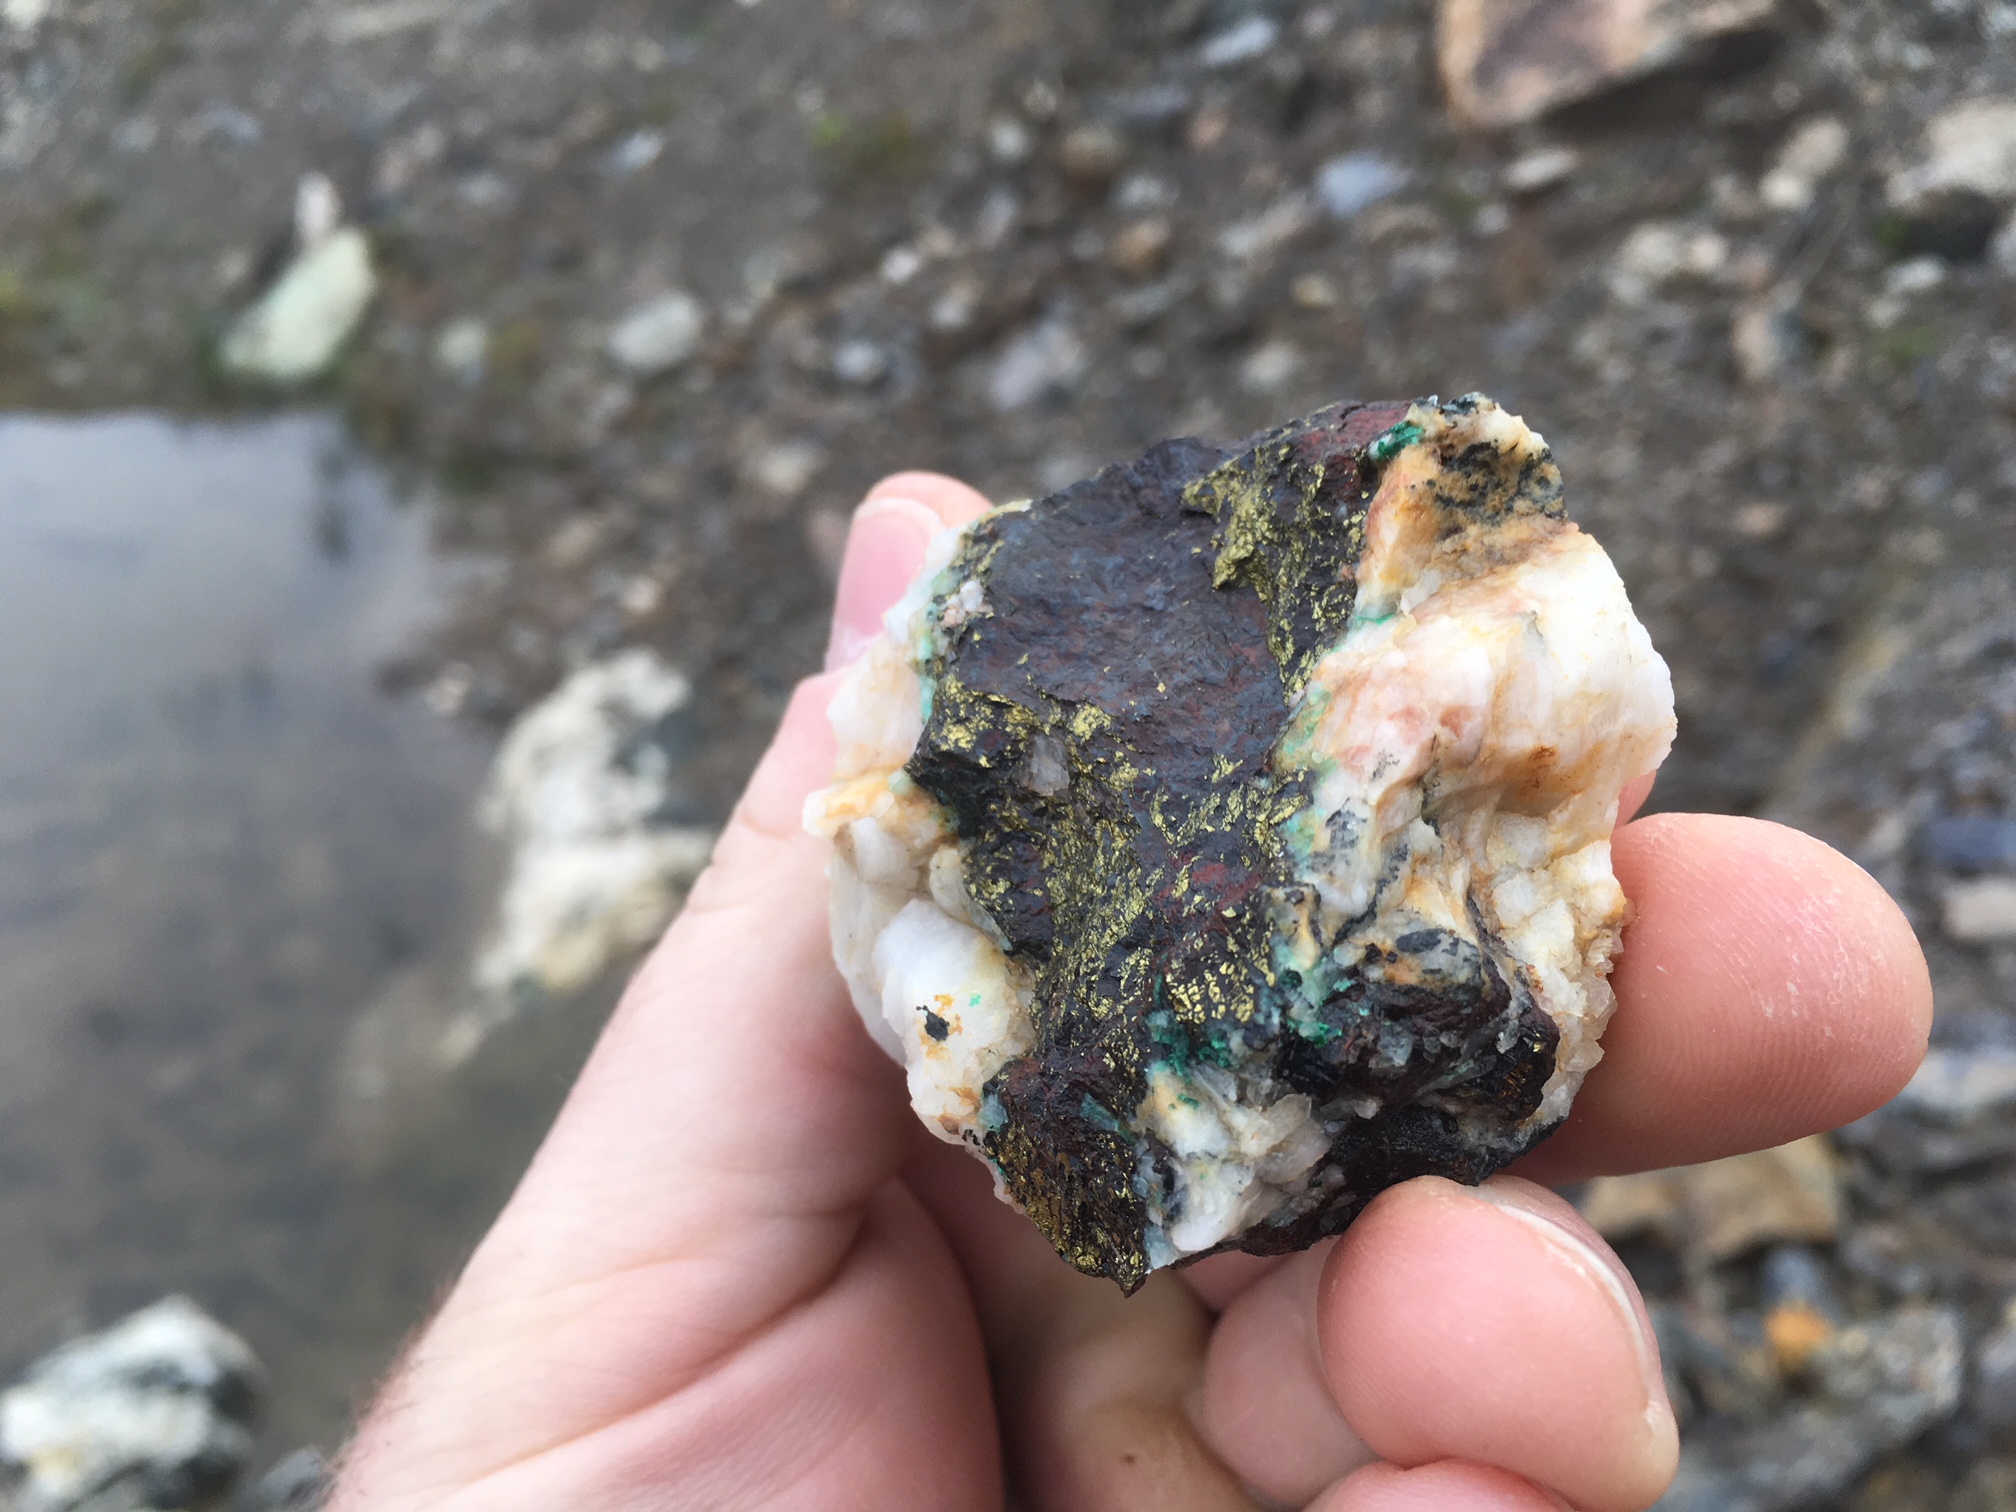
Taz Trench Rock
Systematic Exploration
The drive down the logging roads to Wilding Lake gave Exploration Manager Dave Evans and I a chance to talk about the project, and the systematic approach they are using to find gold mineralization on the property. In the mining industry, a systematic approach is paramount to conserving capital and making every dollar count.
Beginning in the summer, Evans and his team set out to explore as much of the property as possible, taking soil samples and mapping the property, in hopes of identifying further targets for this fall’s 2,500m drill program.
This systematic approach is particularly important for exploration in Central Newfoundland and Labrador because of the amount of overburden which masks most outcroppings. This overburden layer can vary in depth from 0.5m to 15m throughout Newfoundland and Labrador.
The layering of the soil can be seen when standing in the dug trenches, as the top thin layer of organics clearly sticks out on top, followed by an overburden blanket of varying thickness, which is followed by basal till along the top of the rock.
Evans pointed out that the key to proper soil sampling is to get a sample below the organics in the A horizon, down to the brownish soil, where there is the possibility for gold to be present. When high potential soil samples or boulders are found, the geologists identify the path of the glaciers, which would have worn the mineralized outcrops as they moved across, many years ago. The exploration team then moves up ice of the high gold in soil or boulder samples to (hopefully) find the buried quartz vein outcrops.
By overlaying soil and till sampling data with the geophysical data, followed by trenching and channel sampling along the quartz veins in each zone, the team has identified high potential targets which, at the time of my visit, were the focus of the drilling.
Evans told me that, to date, they have collected over 6000 samples across the property. In the July 26th, 2017 news release, Antler released the gold soil geochemistry diagram seen below.
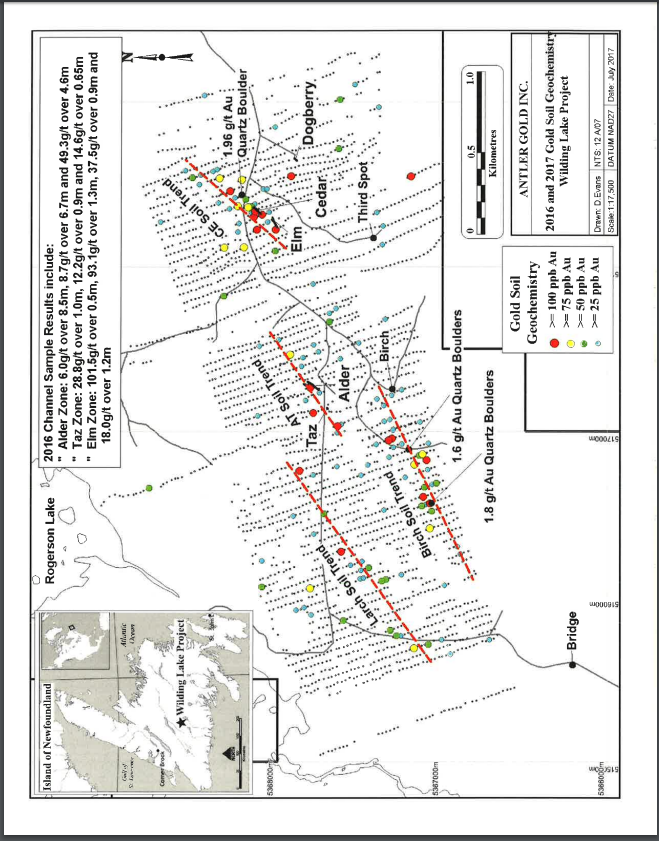
2016 and 2017 Soil Geochemistry Wilding Lake Project – News Release July 26th, 2017
Further in the August 30th, 2017 news release, Antler announced the discovery of new mineralized zones, Red Ochre and Raven. The Red Ochre Zone is located roughly 900 meters to the southwest of the Alder Zone, while the Raven Zone is located 400m to the northeast of the Red Ochre Zone.
Antler’s systematic approach to exploration is clearly working and makes me confident that if there is more gold mineralization within their claim boundaries, they will find it!
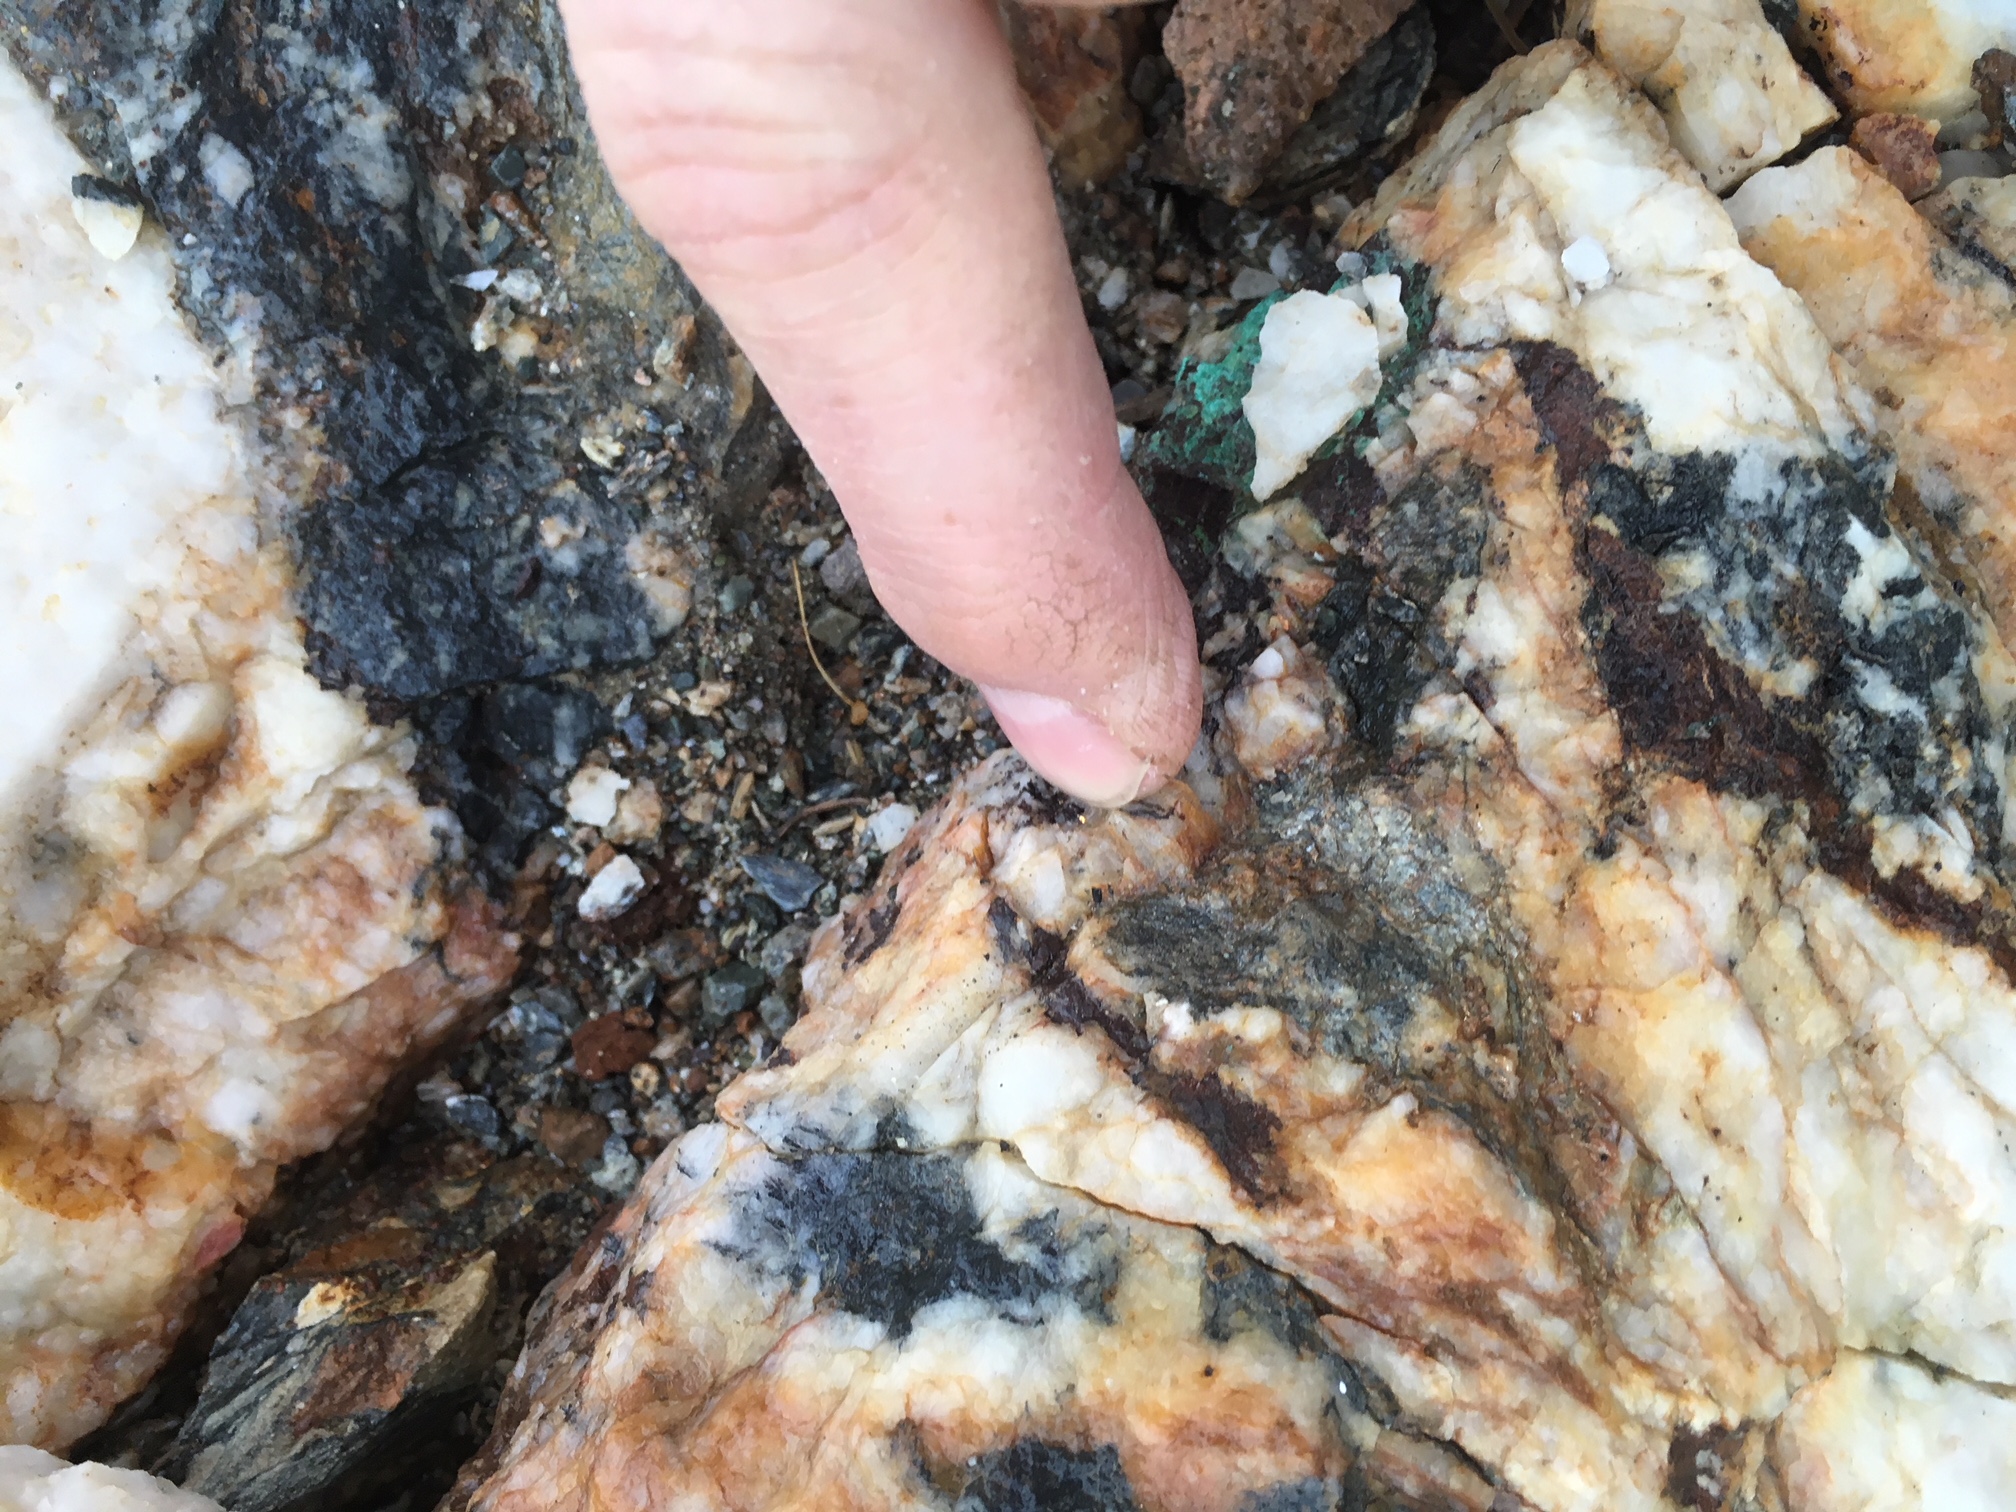
Pointing out a Fleck of Gold at the Taz Trench Outcrop
Trenching Work
I have included a few pictures from my visit and a few images produced by Antler depicting the Elm Zone, Alder Zone and Dogberry Zone trenches, which have channel sampling data included from the quartz veins. These were a part of a January 24, 2017 news release.
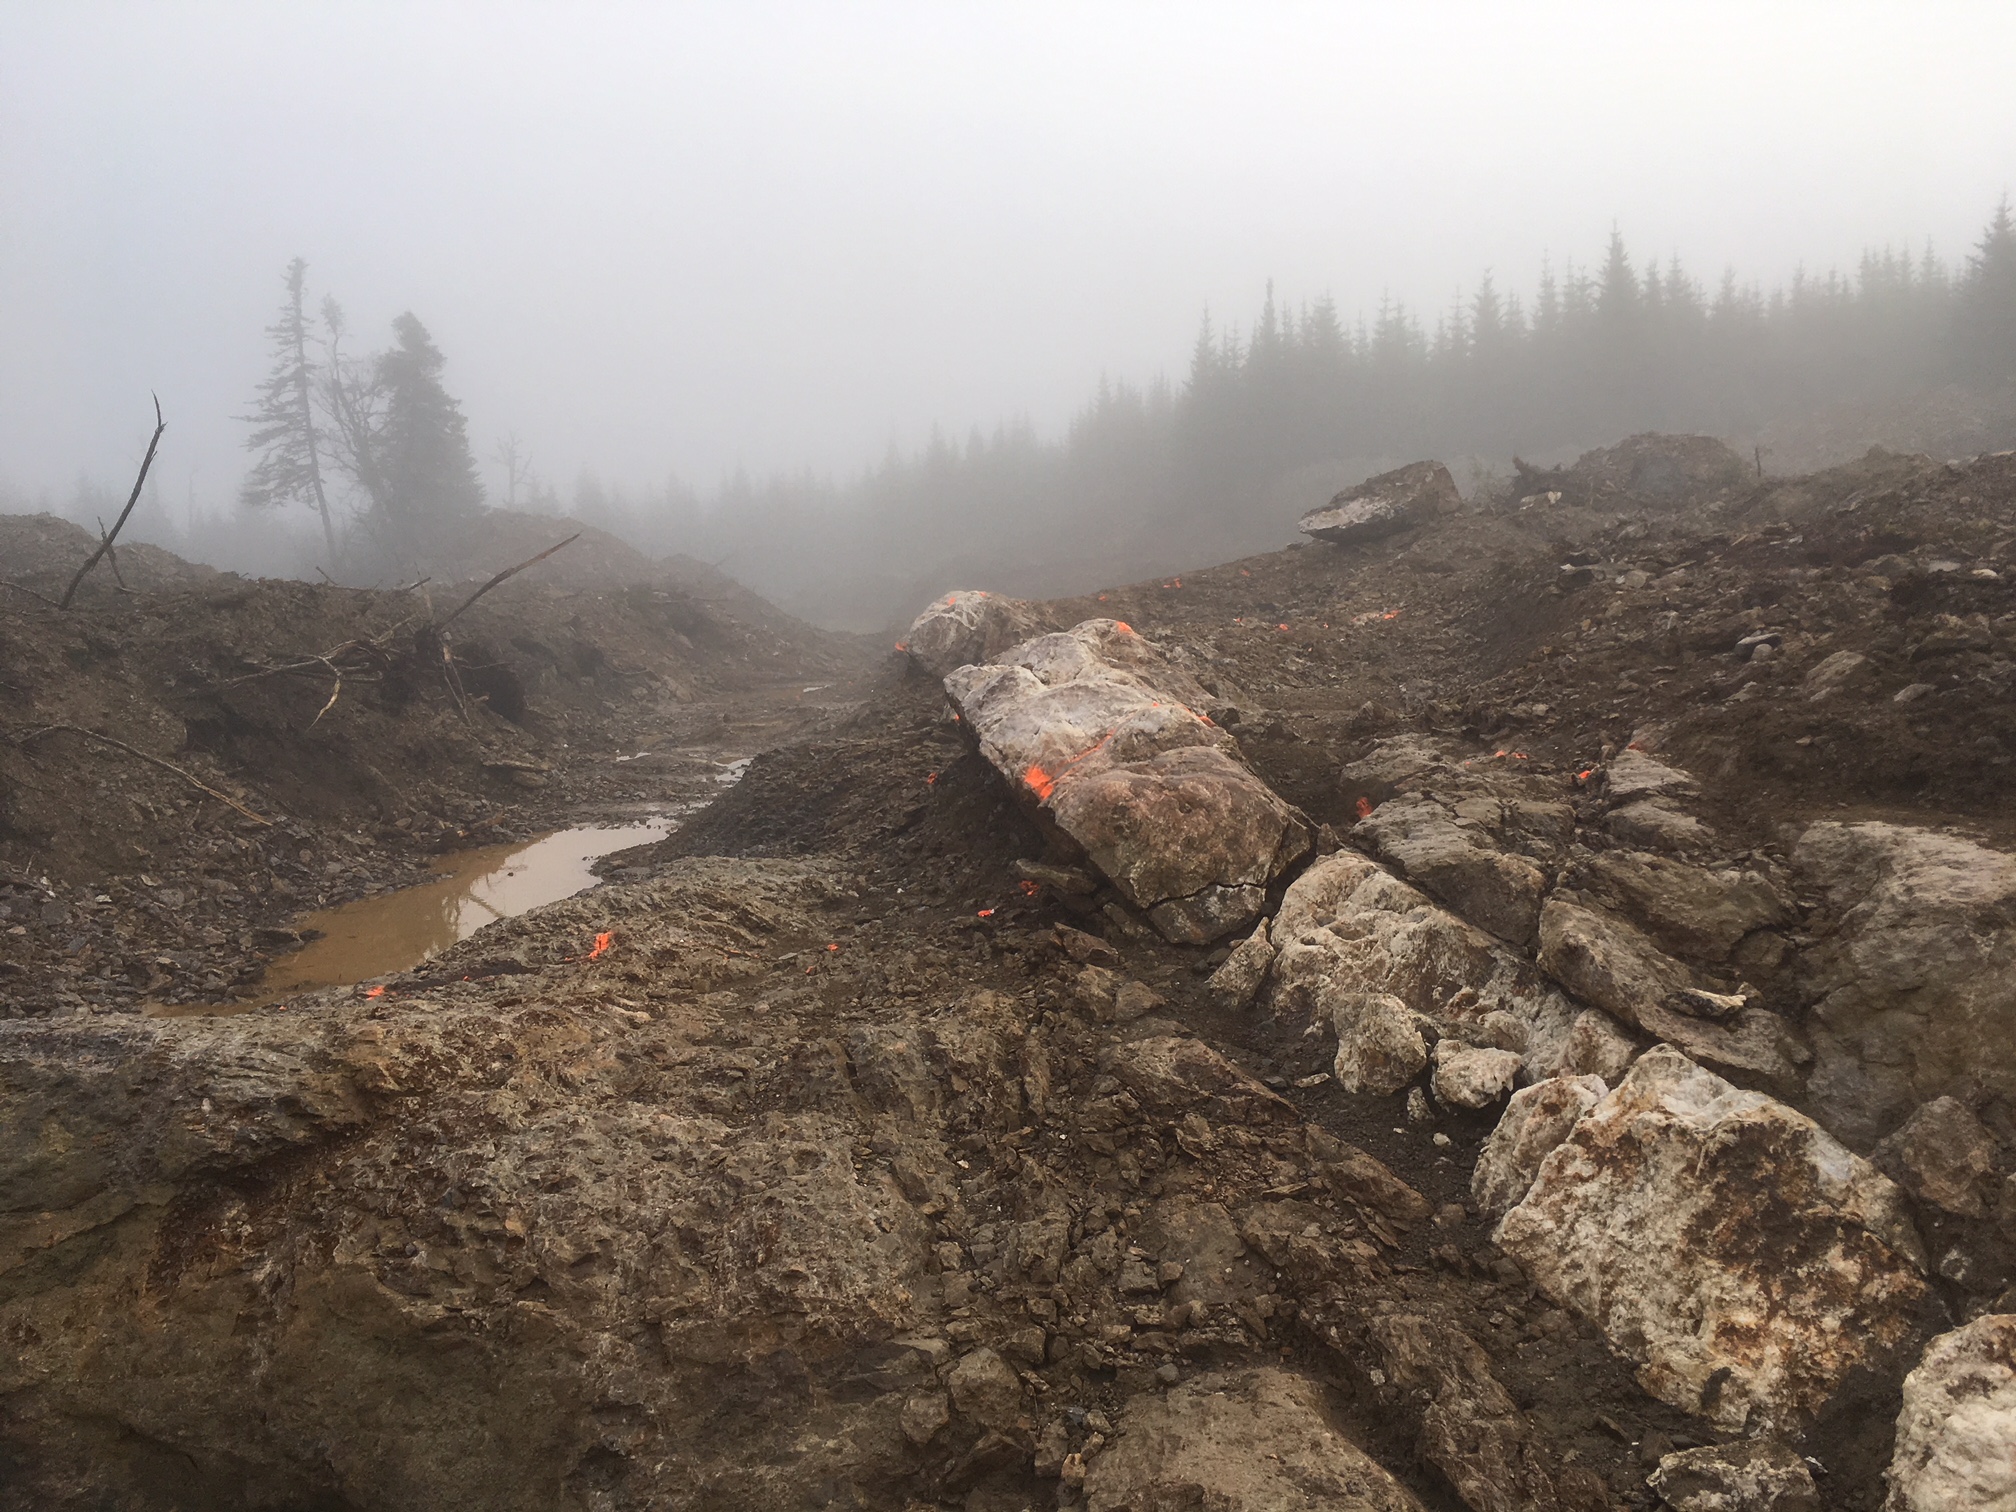
Elm Zone Trench – Quartz Vein Outcrop
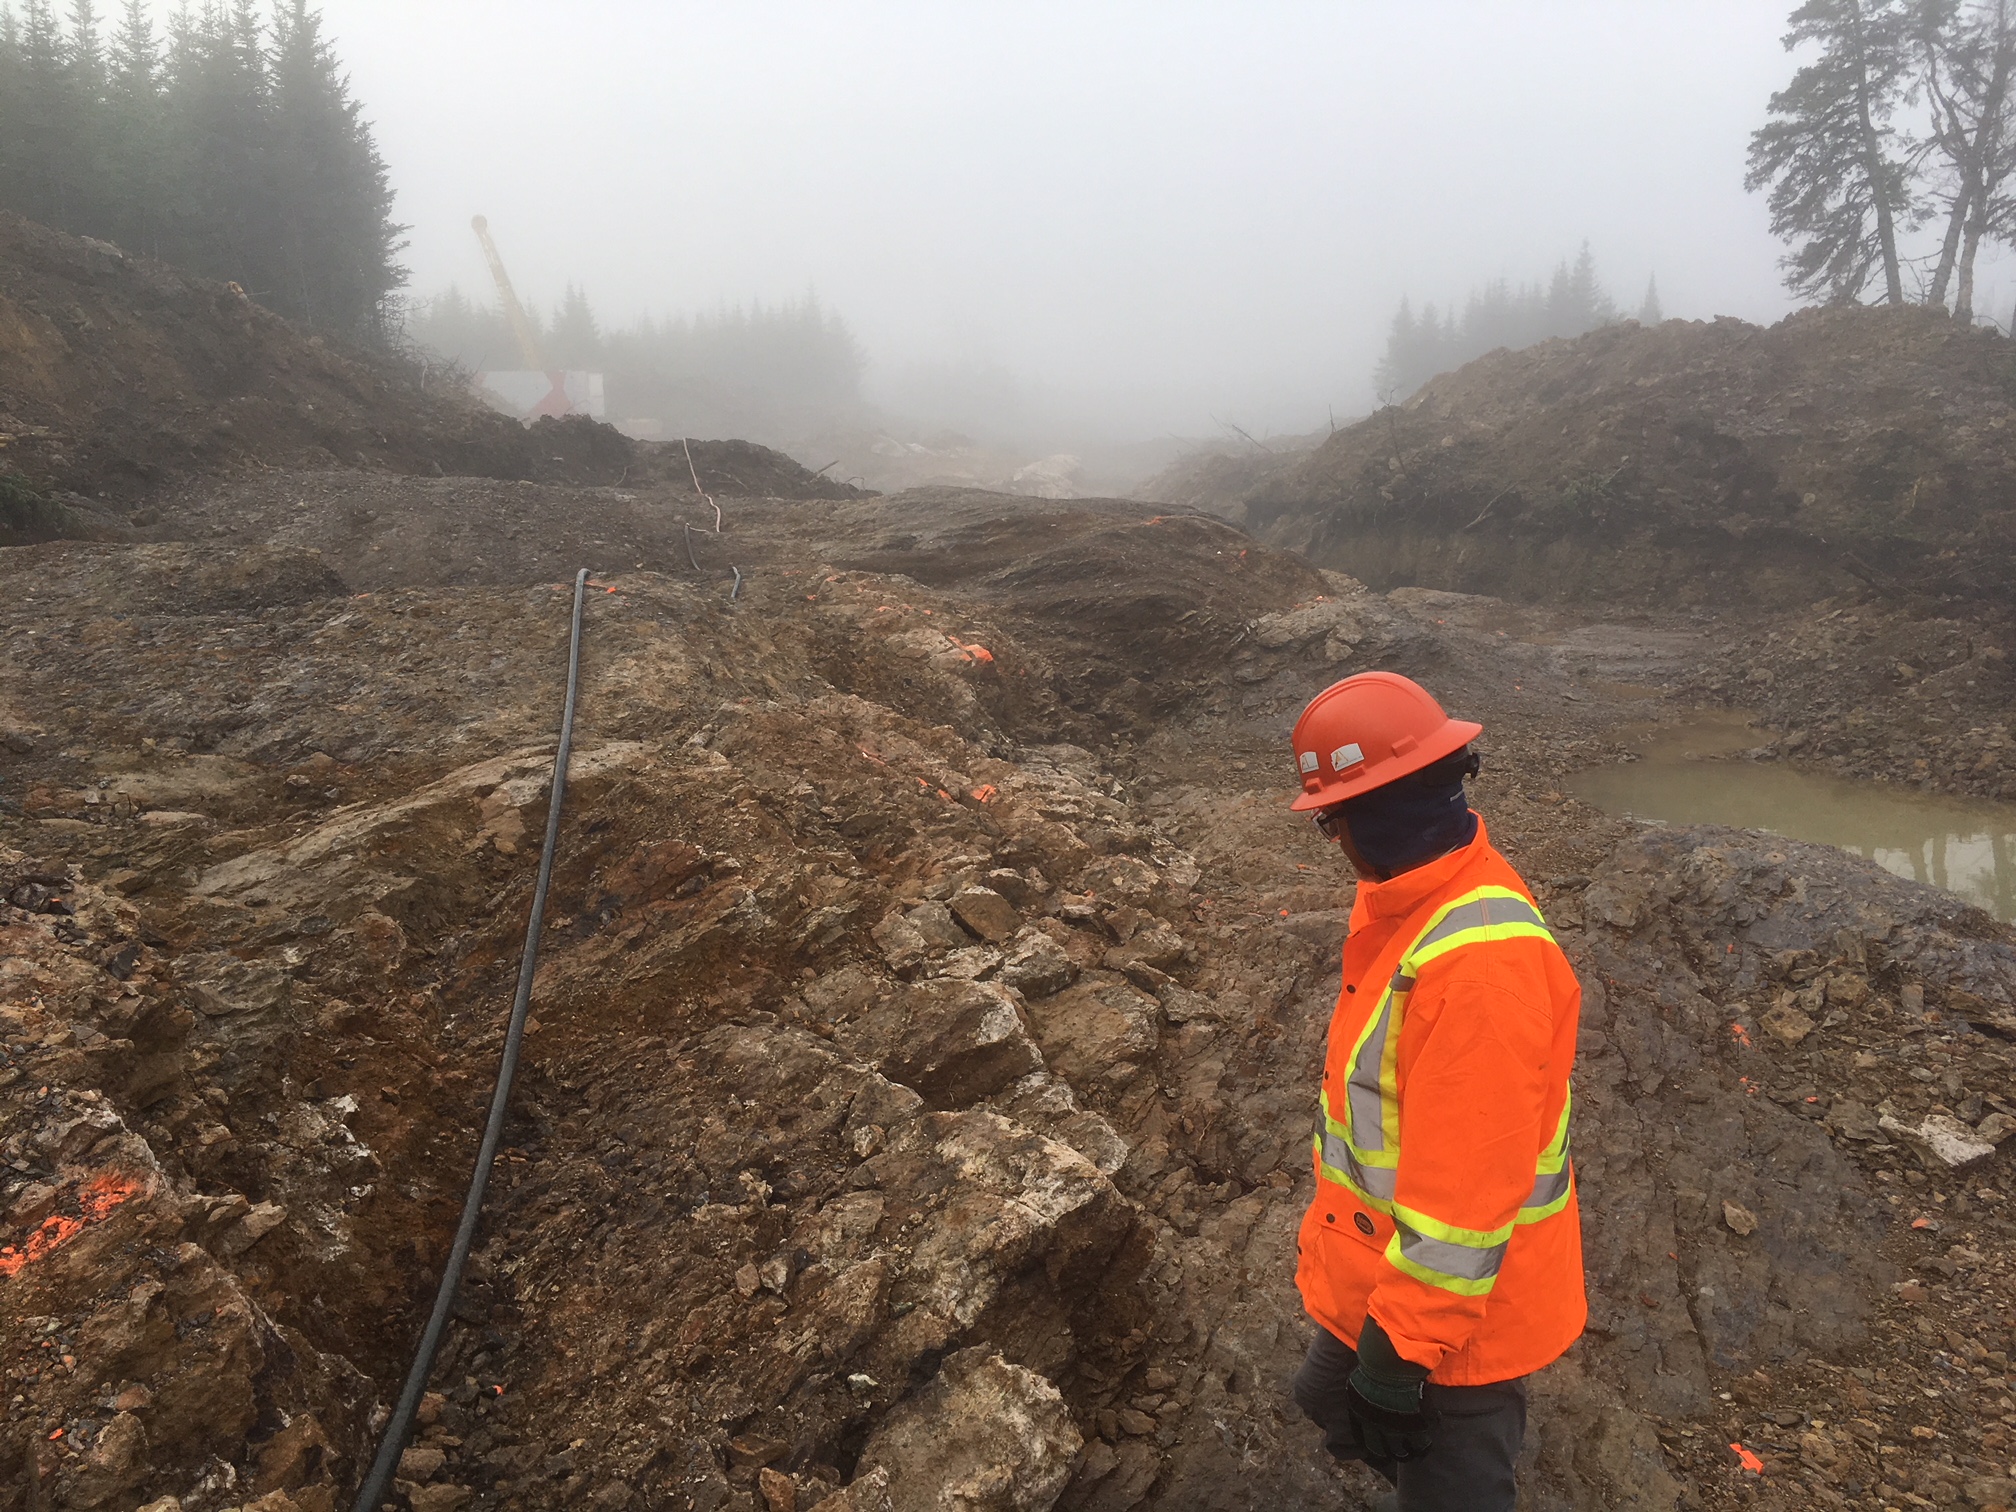
Elm Zone Trench – Exploration Manager, Dave Evans
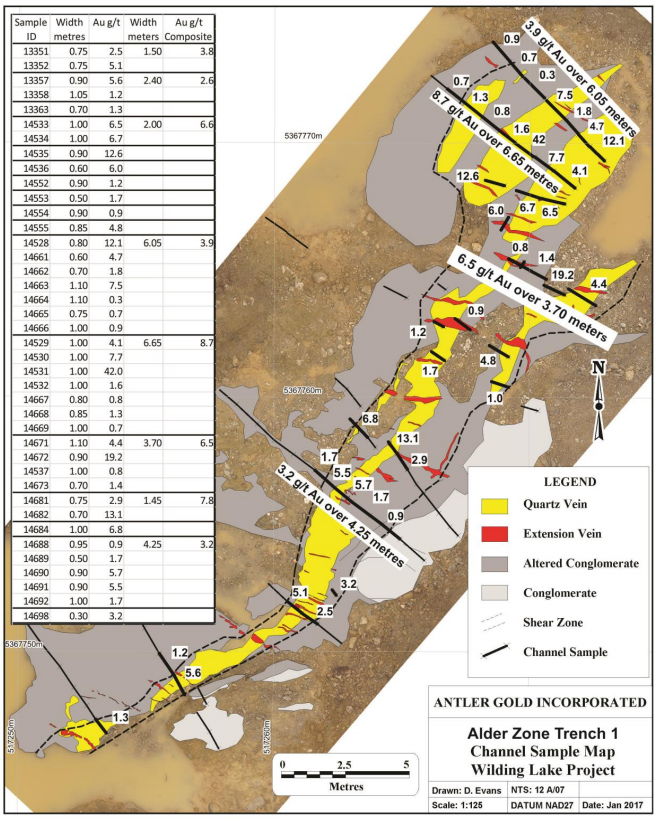
News Release Jan.24, 2017 – Alder Zone Trench
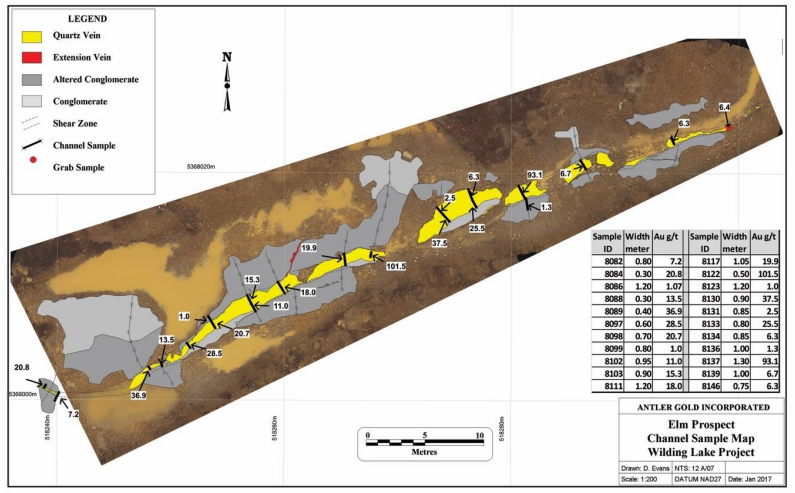
News Release Jan.24, 2017 – Elm Zone Trench
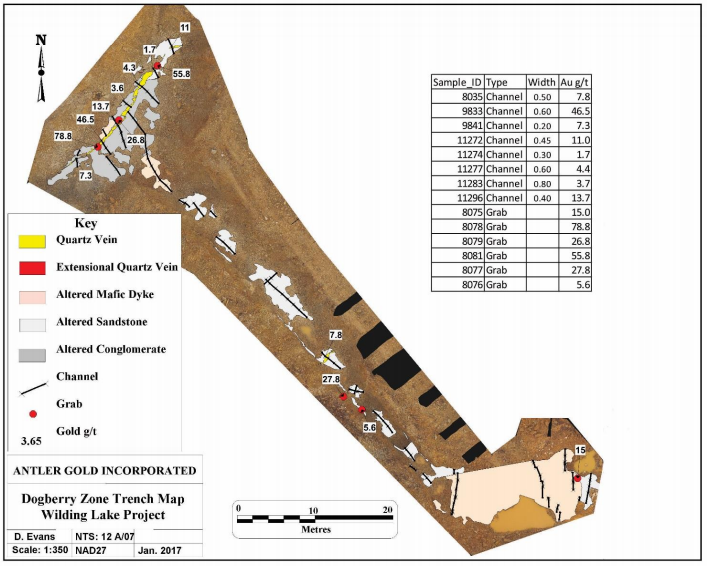
News Release Jan.24, 2017 – Dogberry Zone Trench
Newfoundland and Labrador – A New Frontier for Gold Exploration
Finally, for those who haven’t read my article on Newfoundland and Labrador as a mining jurisdiction, and/or don’t know much about this great province on Canada’s East Coast, you can find it here.
Concluding Remarks
Touring the property with Exploration Manager, Dave Evans, was an exciting and very insightful experience. In any mineral exploration endeavour, a systematic approach that ensures dollars are spent wisely is vital to the success of the operation. In the case of Antler, I had the chance to see, first hand, the dividends that are paid when you have a defined process that’s performed by an experienced team.
Secondly, having met Antler CEO, Dan Whittaker, this past summer in Toronto, I’m confident Antler shareholders, including myself, are in good hands moving forward. I am a buyer of Antler Gold and look forward to the first round of drill results in the coming weeks.
Don’t want to miss a new investment idea, interview or financial product review? Become a Junior Stock Review VIP now – it’s FREE!
Until next time,
Brian Leni P.Eng
Founder – Junior Stock Review
Disclaimer: The following is not an investment recommendation, it is an investment idea. I am not a certified investment professional, nor do I know you and your individual investment needs. Please perform your own due diligence to decide whether this is a company(s) and sector that is best suited for your personal investment criteria. Junior Stock Review does not guarantee the accuracy of any of the analytics used in this report. I do own Antler Gold shares. I have NOT been compensated to write this article and have No business relationship with Antler Gold.
1. For the past few weeks I’ve suggested that a modest US dollar rally against the yen (and thus gold) was due, and now it’s here.
2. Please click here now. Double-click to enlarge. The dollar’s right shoulder rally fits with the US senate’s decision to finally pass some corporate tax cuts. That’s modestly good news for “risk-on” investors.
3. It’s modest because it comes at a late stage in the business cycle. Many institutional money managers are trimming US stock market holdings. They are investing the proceeds into key Asian markets where corporate profits are rising but P/E ratios are lower.
4. Please click here now. This is typical market action in the late stages of the US business cycle; the Dow stocks keep rallying, and the growth stocks stumble.
5. Please click here now. I’m pretty comfortable with my Chinese stock market holdings. If there is a crash, I’ll simply buy more and urge savvy investors to do so too.
6. Please click here now. In the big picture, American citizens are outnumbered by Asians. There are about eight Chindians for every American.
7. Cars are turning into moving offices. Business owners will be happy to sit in rush hour in their electric self-driving cars, because they will be able to work.
8. Many workers will get paid the moment they leave their house and start their car engines. They will work in self-driving company cars on the way to their workplace.
9. Car accidents should decline by 95% or more.
10. Please click here now. Gold is in “mellow” mode here, but some (Western) investors are disheartened.
11. New surveys show that institutional money managers now expect three rate hikes in 2018, yet gold barely swoons on the news. In India and China, investors buy gold in both good times and bad. Rate hikes are viewed as almost irrelevant to gold price discovery.
12. Price discovery continues to move from the West to the East, and that means rate hikes will soon become even more irrelevant to gold than they are now.
13. I expect a surge in private equity deals as rate hikes cause institutional investors to look outside of the US stock market arena for capital gains.
14. Tax cuts are inflationary and good for small business. The new Fed chair stands ready to chop the red tape that has handcuffed small bank lending.
15. Regardless, just as wise equity market investors hold gold as a hedge, gold investors should hold some alternative assets as their hedge.
16. Please click here now: http://www.graceland-updates.
17. Litecoin is my third largest blockchain currency holding. It’s soared from about $1 to $100 in a very short period of time. My long term target is $1200 per coin.
18. If it hits the target, that would make it a “twelve hundred bagger”. Gold stock investors who need some blockchain currency to diversify can use my wealth building www.gublockchain.comnewsletter to get started.
19. Please click here now. GDX continues to consolidate in the $25 – $21 price zone.
20. The market feels solid, but gold stocks are well below their February high, while gold bullion sits near the levels it acquired then.
21. It’s disappointing that the market has not rewarded shareholders for backing companies that have achieved significant cuts in AISC (all-in sustaining costs).
22. In a perfect world, GDX would be trading at about $30 (or higher) right now. Unfortunately, it’s not a perfect world. The good news is that from a technical perspective, the odds of a move above $25 to $28 are about 67%, while the odds of a move under $21 to $18 are about 33%.
23. GDX and associated gold stocks are quite firm given that strong Chinese New Year buying has yet to commence. That buying should start soon after the Fed’s next rate hike. In this hiking cycle, gold has staged fabulous rallies after almost all the hikes.
24. Will the next rally be the biggest of them all? Perhaps, but if it happens, only investors with substantial “skin in the gold stocks game” will get to smile!
Special Offer For Website Readers: Please send me an Email to freereports4@gracelandupdates.
Thanks and Cheers
Stewart Thomson, Graceland Updates
https://www.gracelandupdates.
Stewart Thomson is a retired Merrill Lynch broker. Stewart writes the Graceland Updates daily between 4am-7am. They are sent out around 8am-9am. The newsletter is attractively priced and the format is a unique numbered point form. Giving clarity of each point and saving valuable reading time.
Risks, Disclaimers, Legal
Stewart Thomson is no longer an investment advisor. The information provided by Stewart and Graceland Updates is for general information purposes only. Before taking any action on any investment, it is imperative that you consult with multiple properly licensed, experienced and qualified investment advisors and get numerous opinions before taking any action. Your minimum risk on any investment in the world is: 100% loss of all your money. You may be taking or preparing to take leveraged positions in investments and not know it, exposing yourself to unlimited risks. This is highly concerning if you are an investor in any derivatives products. There is an approx $700 trillion OTC Derivatives Iceberg with a tiny portion written off officially. The bottom line:
Are You Prepared?
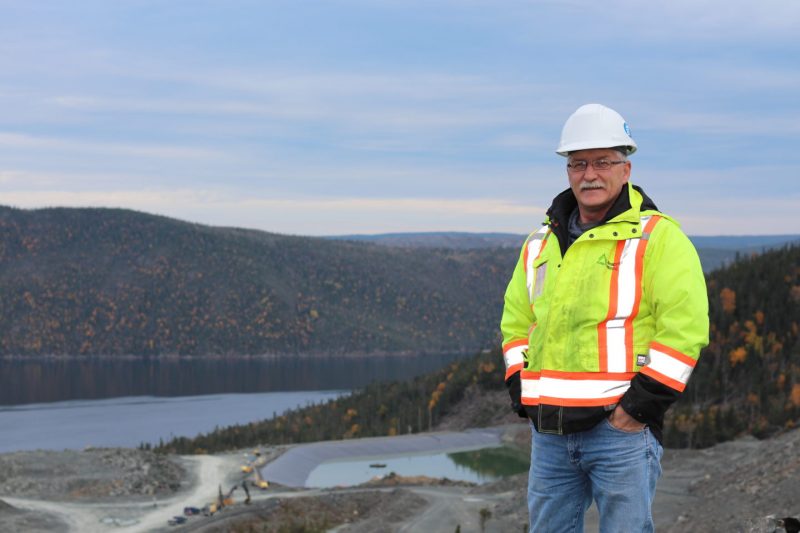
If you’re looking to take your due diligence process to the next level, you have to incorporate a site visit into your repertoire. All the analysis in the world can’t replace the effectiveness of seeing a project and meeting the people in person.
Not only can you confirm what the management team is telling you, but you can meet the people who are on the front lines, mining underground, driving loaders, collecting soil samples or simply answering the phone in the office. All of this can tell you a lot about the health of a company and how it treats its employees, which is paramount to the company’s success, in my opinion.
In October, I had the opportunity to visit Anaconda Mining’s Point Rousse Project, and was not surprised to see that Anaconda’s leadership makes it a priority to empower their workforce. For this, they’re paid back through a motivated workforce.
I returned from my visit to Newfoundland and Labrador very satisfied that Anaconda’s operational team has the right ingredients for success; they look set to put the Stog’er Tight Deposit into production, produce a maiden resource estimate for the Argyle Zone, and explore and develop the Goldboro Project toward production.
2018 looks to be a monumental year of growth for Anaconda, one that I look forward to as a shareholder!
Anaconda Mining – Site Visit October 2017
On the morning of October 22nd, I flew out of Toronto’s Pearson International Airport on my way to Deer Lake, located in western Newfoundland and Labrador. While I was here, I had the opportunity to visit Anaconda Mining’s Point Rousee Project, located on the Baie Verte Peninsula in north western Newfoundland and Labrador.

Gros Morne National Park – Western Brook Trail
The western portion of the island of Newfoundland, while sparsly populated, possesses, in my opinion, some of Canada’s most spectacular scenery and destinations. I landed in Deer Lake, an interesting town because it’s home to western Newfoundland and Labrador’s major airport, and compared to many of the other areas in this part of the island, it’s also well developed on a commerical level.
Most importantly, however, it’s the largest centre next to Gros Morne National Park, and acts as a jumping point for people looking to explore this UNESCO world heritage site.
On the last day of my trip, I spent the day hiking a few of the trails in Gros Morne and was amazed by the scenery – this is a place you will want to add to your bucket list, you won’t be disappointed!
Baie Verte, Newfoundland and Labrador

Baie Verte – HWY 410 thru the main part of town
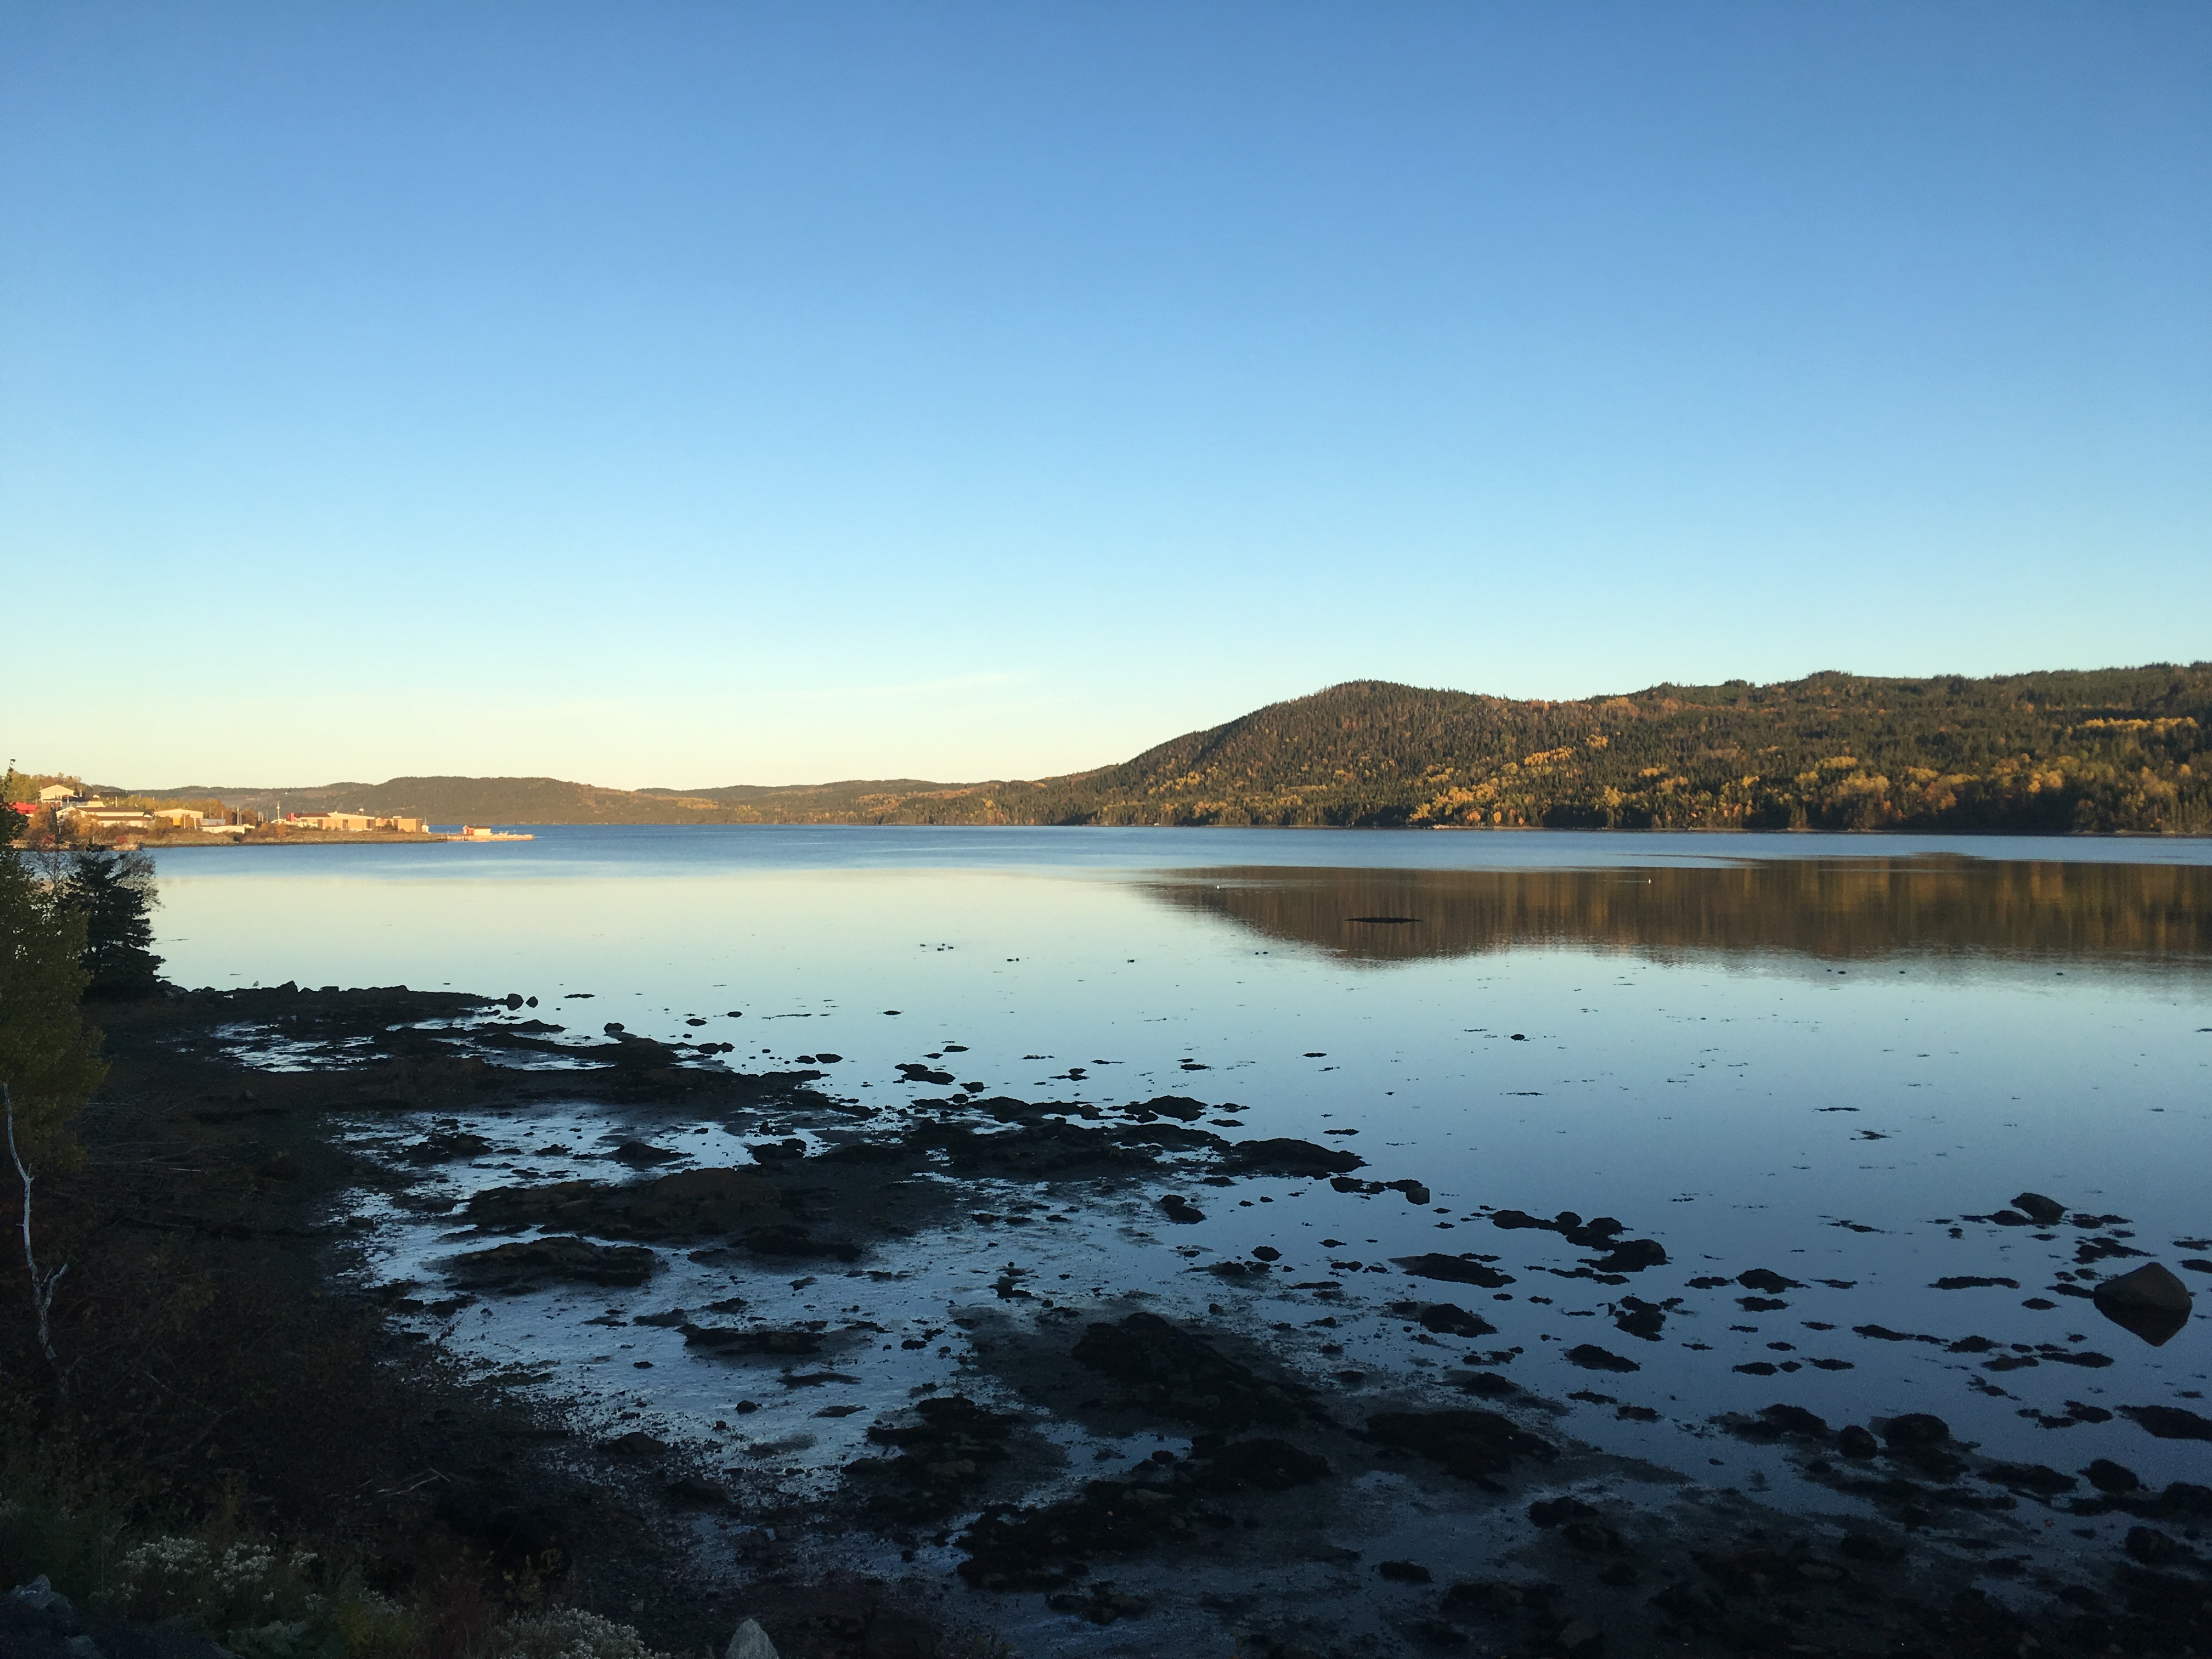
Baie Verte – A view from Bistro on the Bay
Baie Verte is a small town located on the coast of the Baie Verte Peninsula. Baie Verte’s history as a town is rooted in the pulp and paper industry, but owes its major growth to the asbestos mine which was founded in 1955 by George McNaughton and Norman Peters.
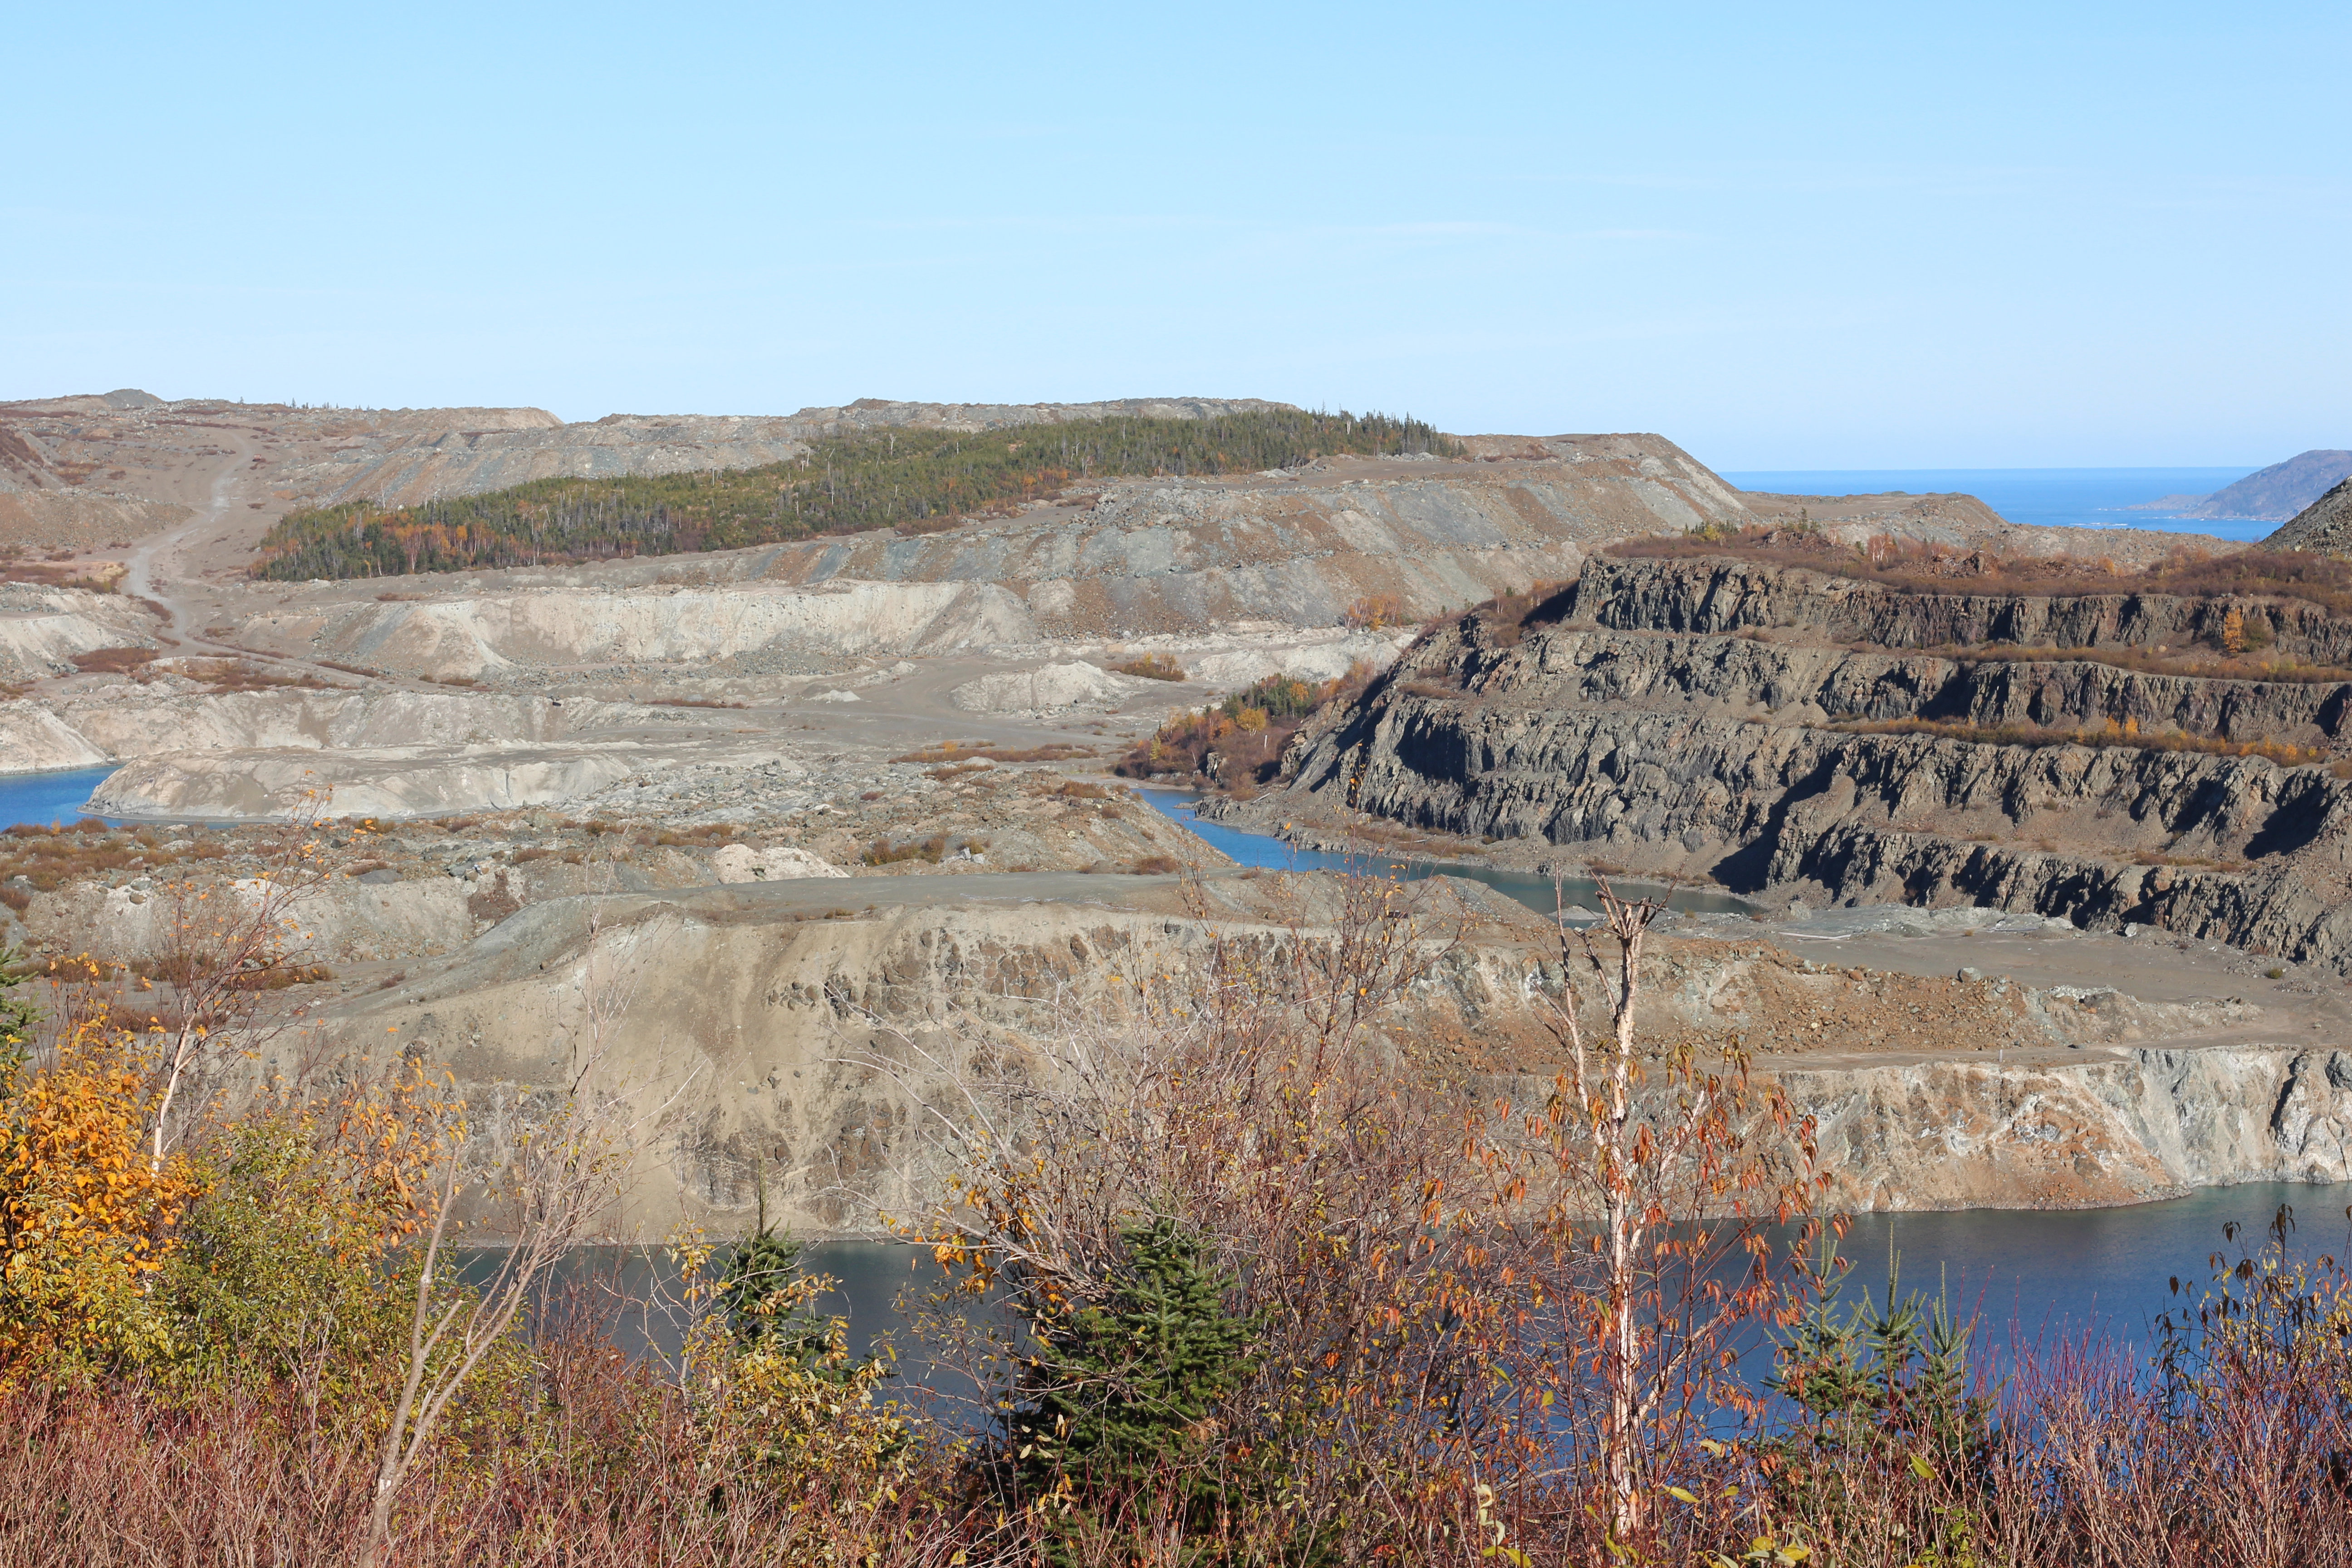
Asbestos Open Pit Mine – 1963 to 1995
The open pit asbestos mining operation, which is located a short drive north of Baie Verte, employed 500 people at its peak. The mine was operated by a number of companies throughout its history, including Advocate Mines Ltd., Baie Verte Mines Inc., and Teranova. The mine was closed permanently in 1995.
While there are other employers in this region of Newfoundland, I definitely got the feeling from speaking to a few of the residents that, outside of being employed by government, mining was the most desirable industry in which to work.
The mining operations that are closest to Baie Verte are Anaconda Mining’s Point Rousse Project and Rambler Metals and Mining’s Ming Mine and Nugget Pond Mill. The two companies, in total, employ roughly 400 people in the surrounding area.
Depending on your speed, it’s roughly a 2 hour drive from the Deer Lake airport to Baie Verte. I spent two days in Baie Verte, staying at the Dorset Inn, which is right in the heart of town. From here, Anaconda’s Point Rousse Project is about a 30 minute drive on the 418, which leads to the town of Ming’s Bight.
The Point Rousse Project
The Point Rousse Project is a collection of Anaconda’s Newfoundland assets, which include the Pine Cove Mine and Mill, the Stog’er Tight Deposit, the Aggregates Project and over 5,800 ha of prospective property.
The Point Rousse Project is located down a very well kept gravel road, about 5 km off the 418. The road makes its way through the forest, up and down hills, until reaching the site’s main offices to your left, and tailings pond to your right. Elevation-wise, the main offices, mill and tailings pond are set roughly 75 to 100 ft above the top of the Pine Cove open pit, and probably another 75 to 100 ft above the sea level at the Port Facility.
During my visit, I was accompanied by the Mine and Mill Superintendent, Tony Chislett. Chislett has been with Anaconda for 10 years, working in a few different roles before becoming Superintendent. In my experience, the best operation managers typically work their way up to the position after having extensive experience in the various jobs that they are going to manage. This not only gives them the much needed knowledge of the process, but also the respect of the workers.
Chislett and his team will be put to the test in the coming months with the conversion of the Pine Cove open pit mine to a long term tailings facility and the start up of the Stog’er Tight Mine, which should occur in early 2018. Not only this, but on the horizon there is the possible processing of the Goldboro ore, which will be an extra wrinkle for the team to deal with, as the Goldboro ore is different from what is mined along the Scrape Trend.

Pine Cove Mine and Mill Superintendent, Tony Chislett
As we drove around the property, Chislett gave me a break down of the operation, and how they have incorporated cutting-edge technology and their personnel’s input to improve the process. For instance, GPS targeting for blasting and on the company’s heavy equipment allows for precision mining and the ability to maximize efficiency with the flow of ore to and from the open pit to the mill. With the movement to Stog’er Tight getting closer, these technologies, I believe, will aid Anaconda in avoiding some of the pitfalls that could accompany the mining operation’s move.
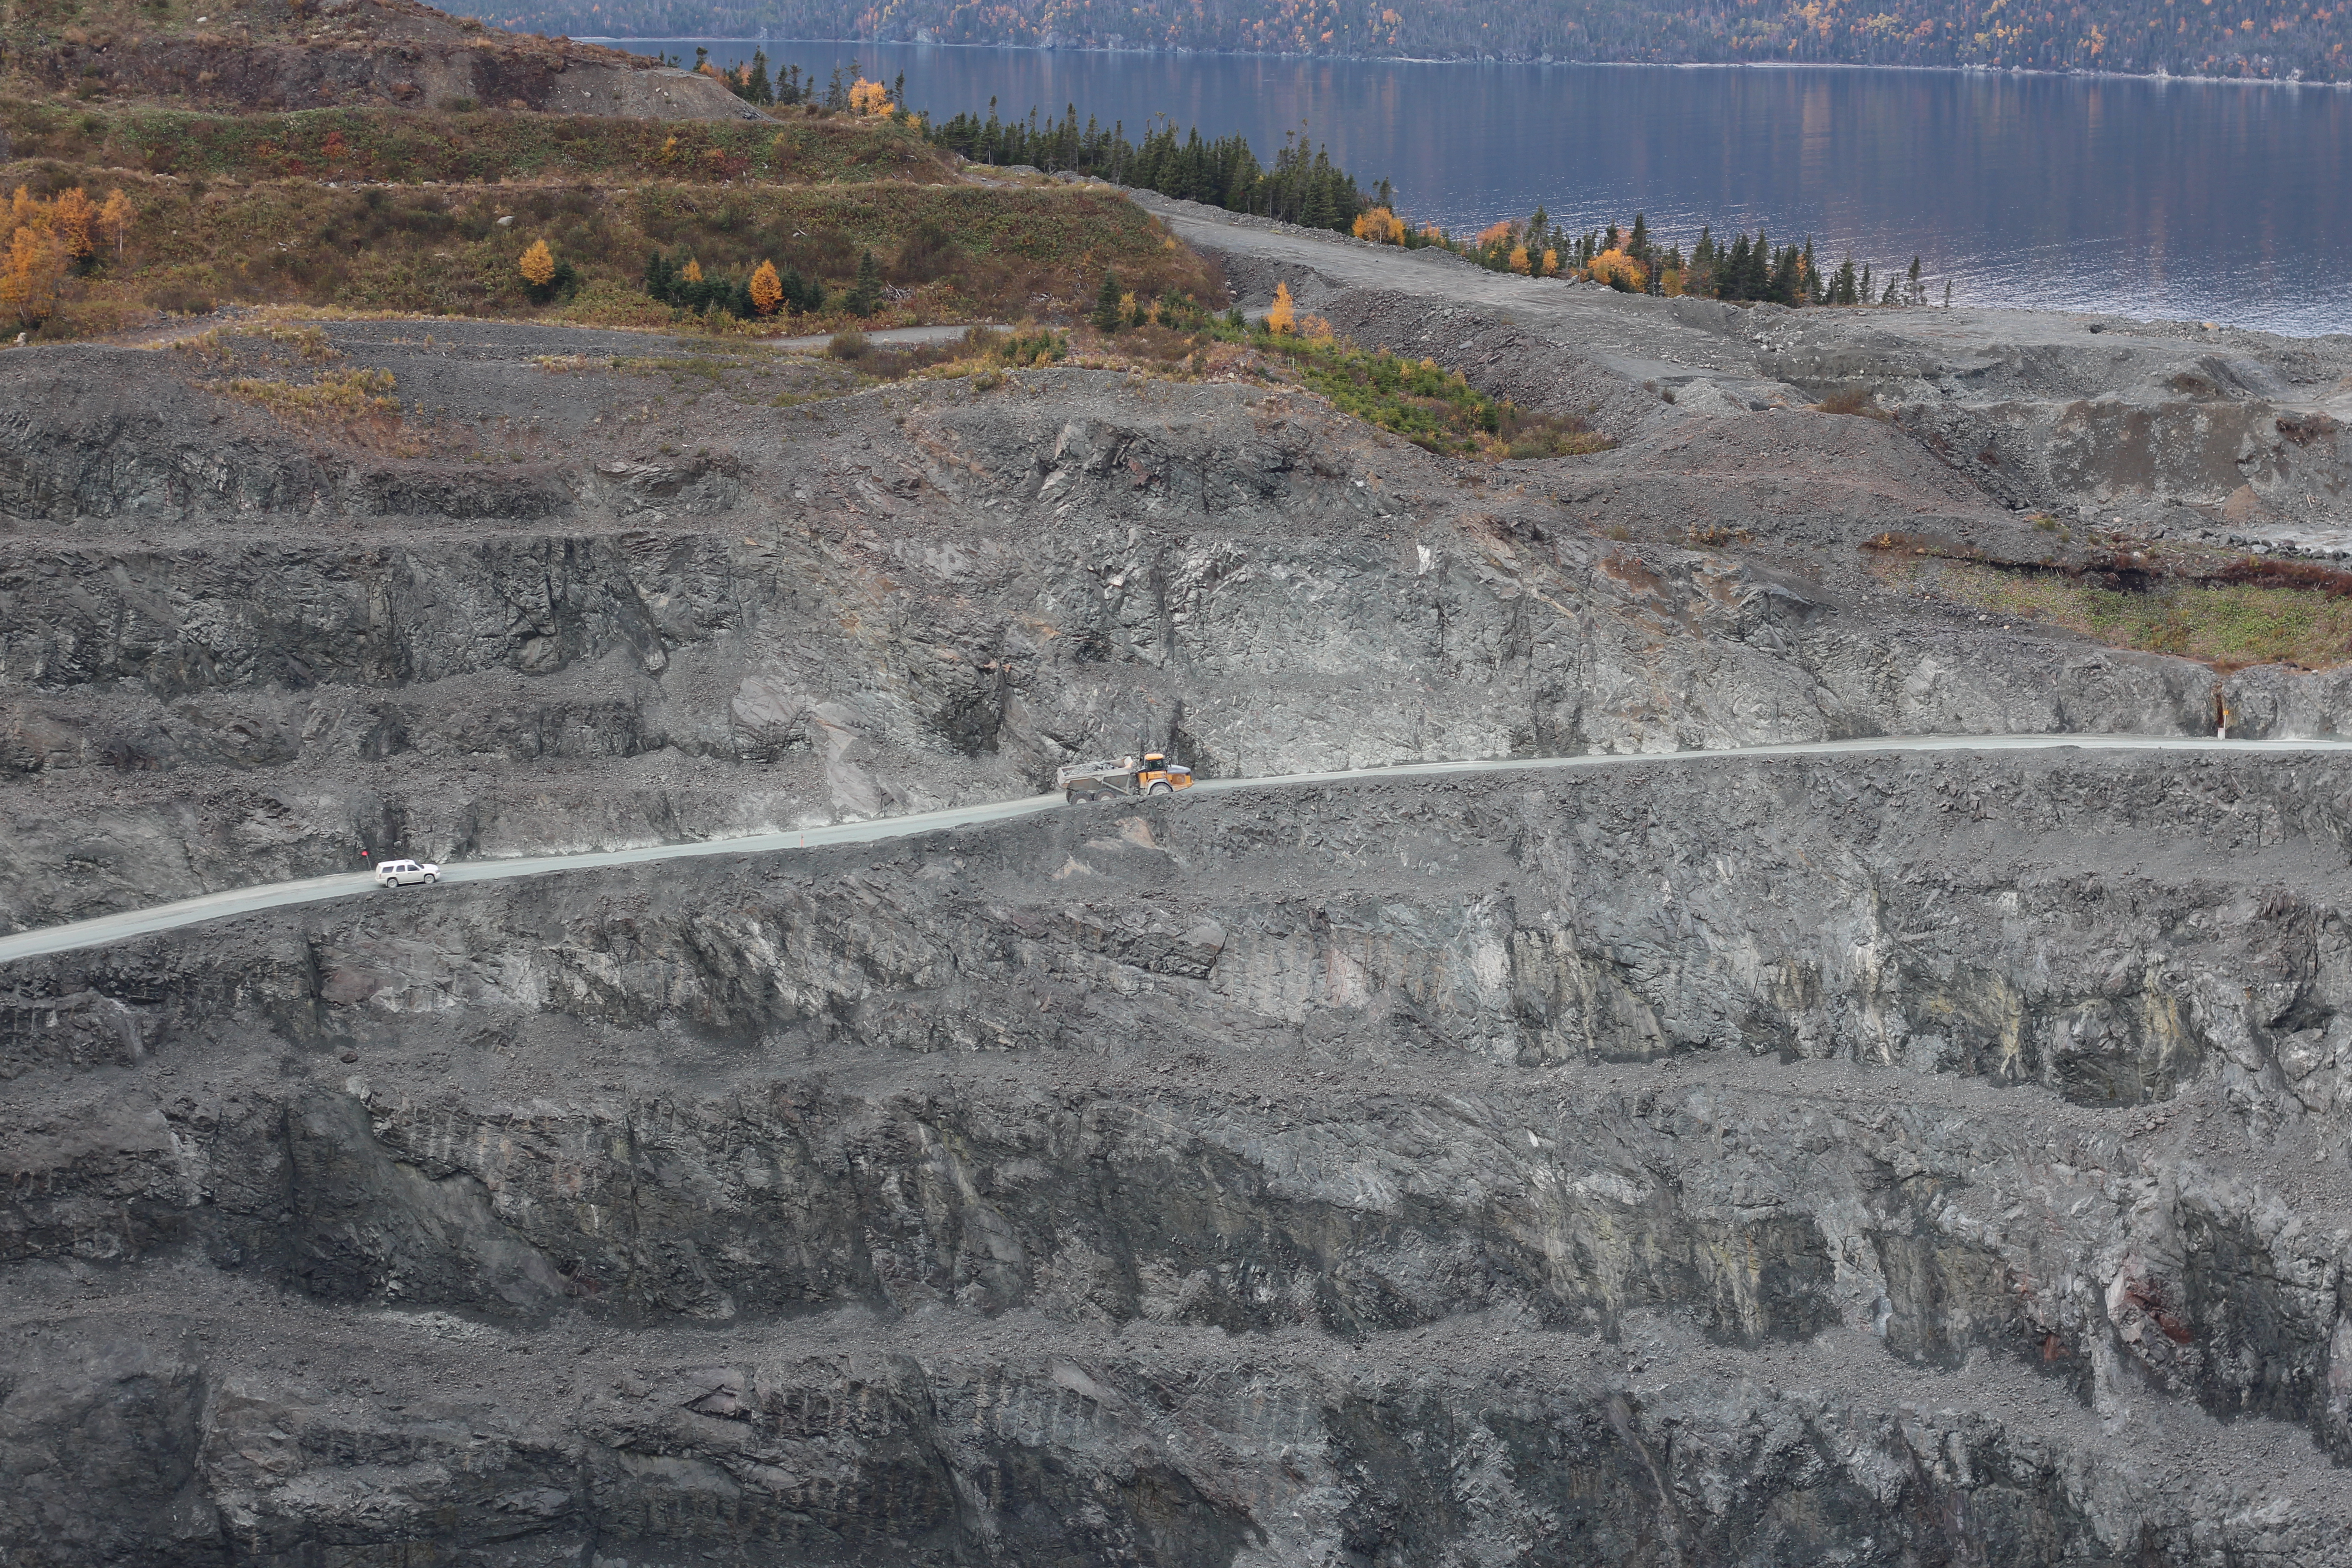
Pine Cove Open Pit Mine– Dump Truck Driving Up the Ramp
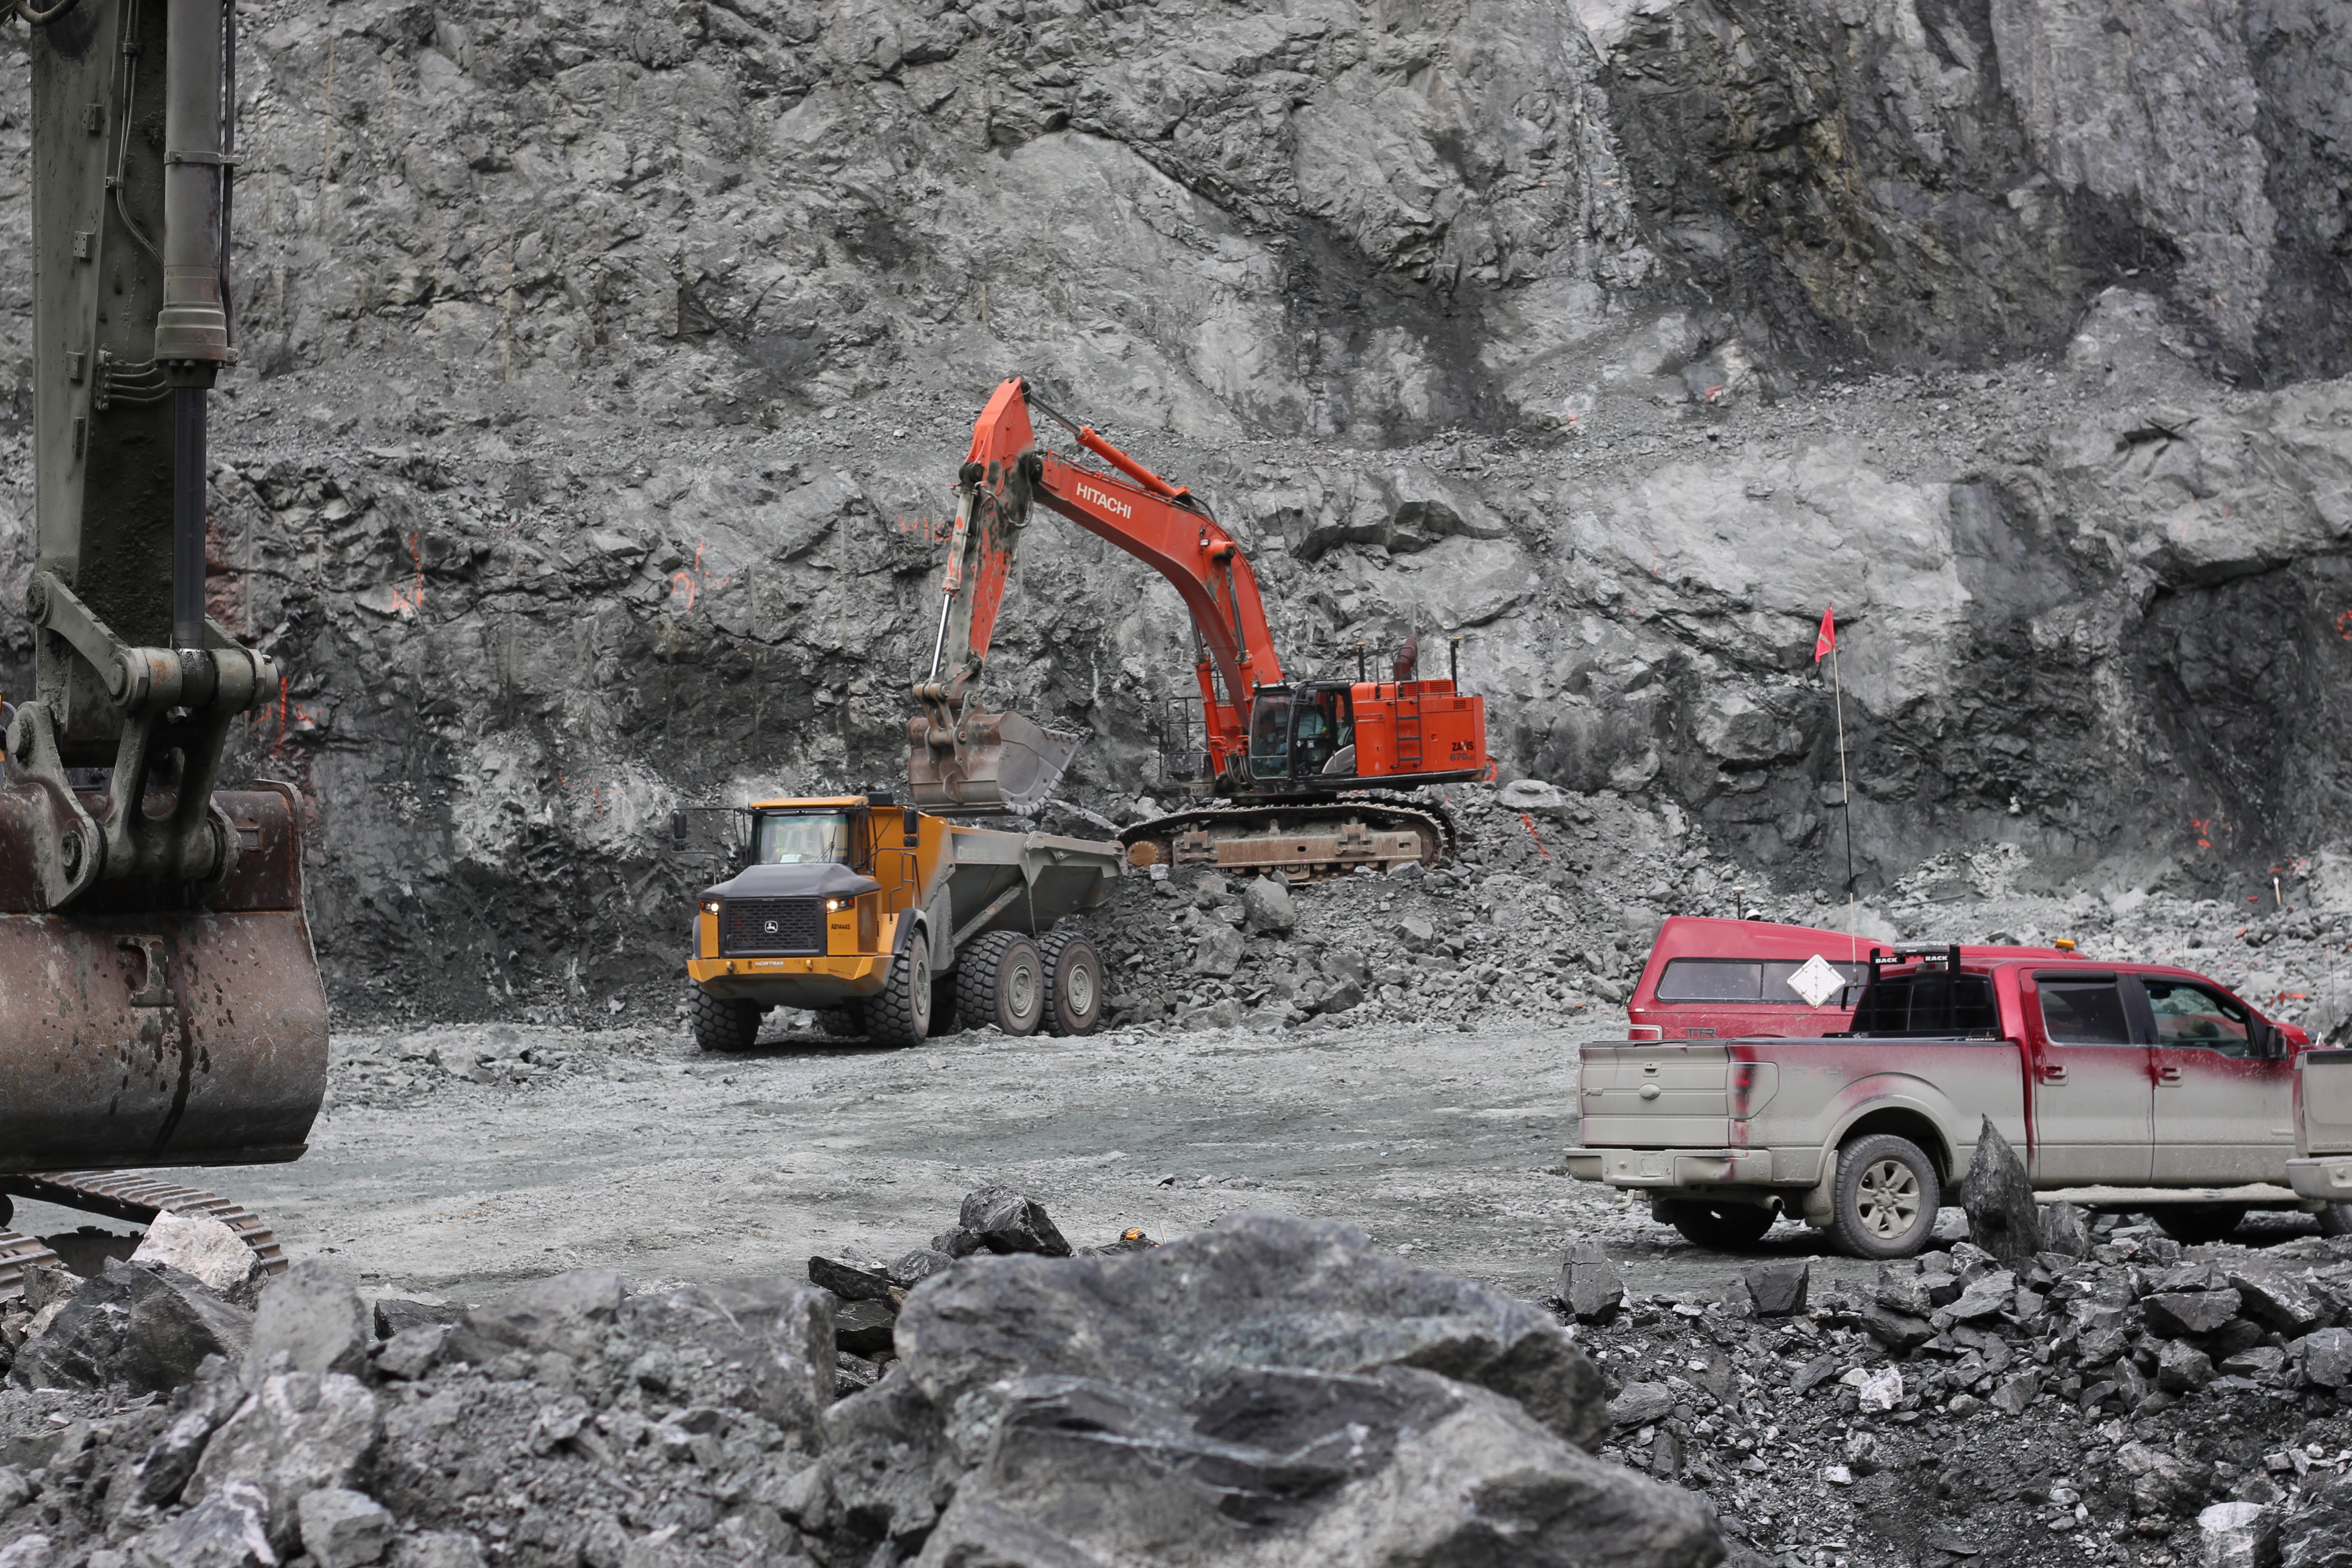
Pine Cove Open Pit Mine – Mining of Gold Ore from the Bottom of the Pit
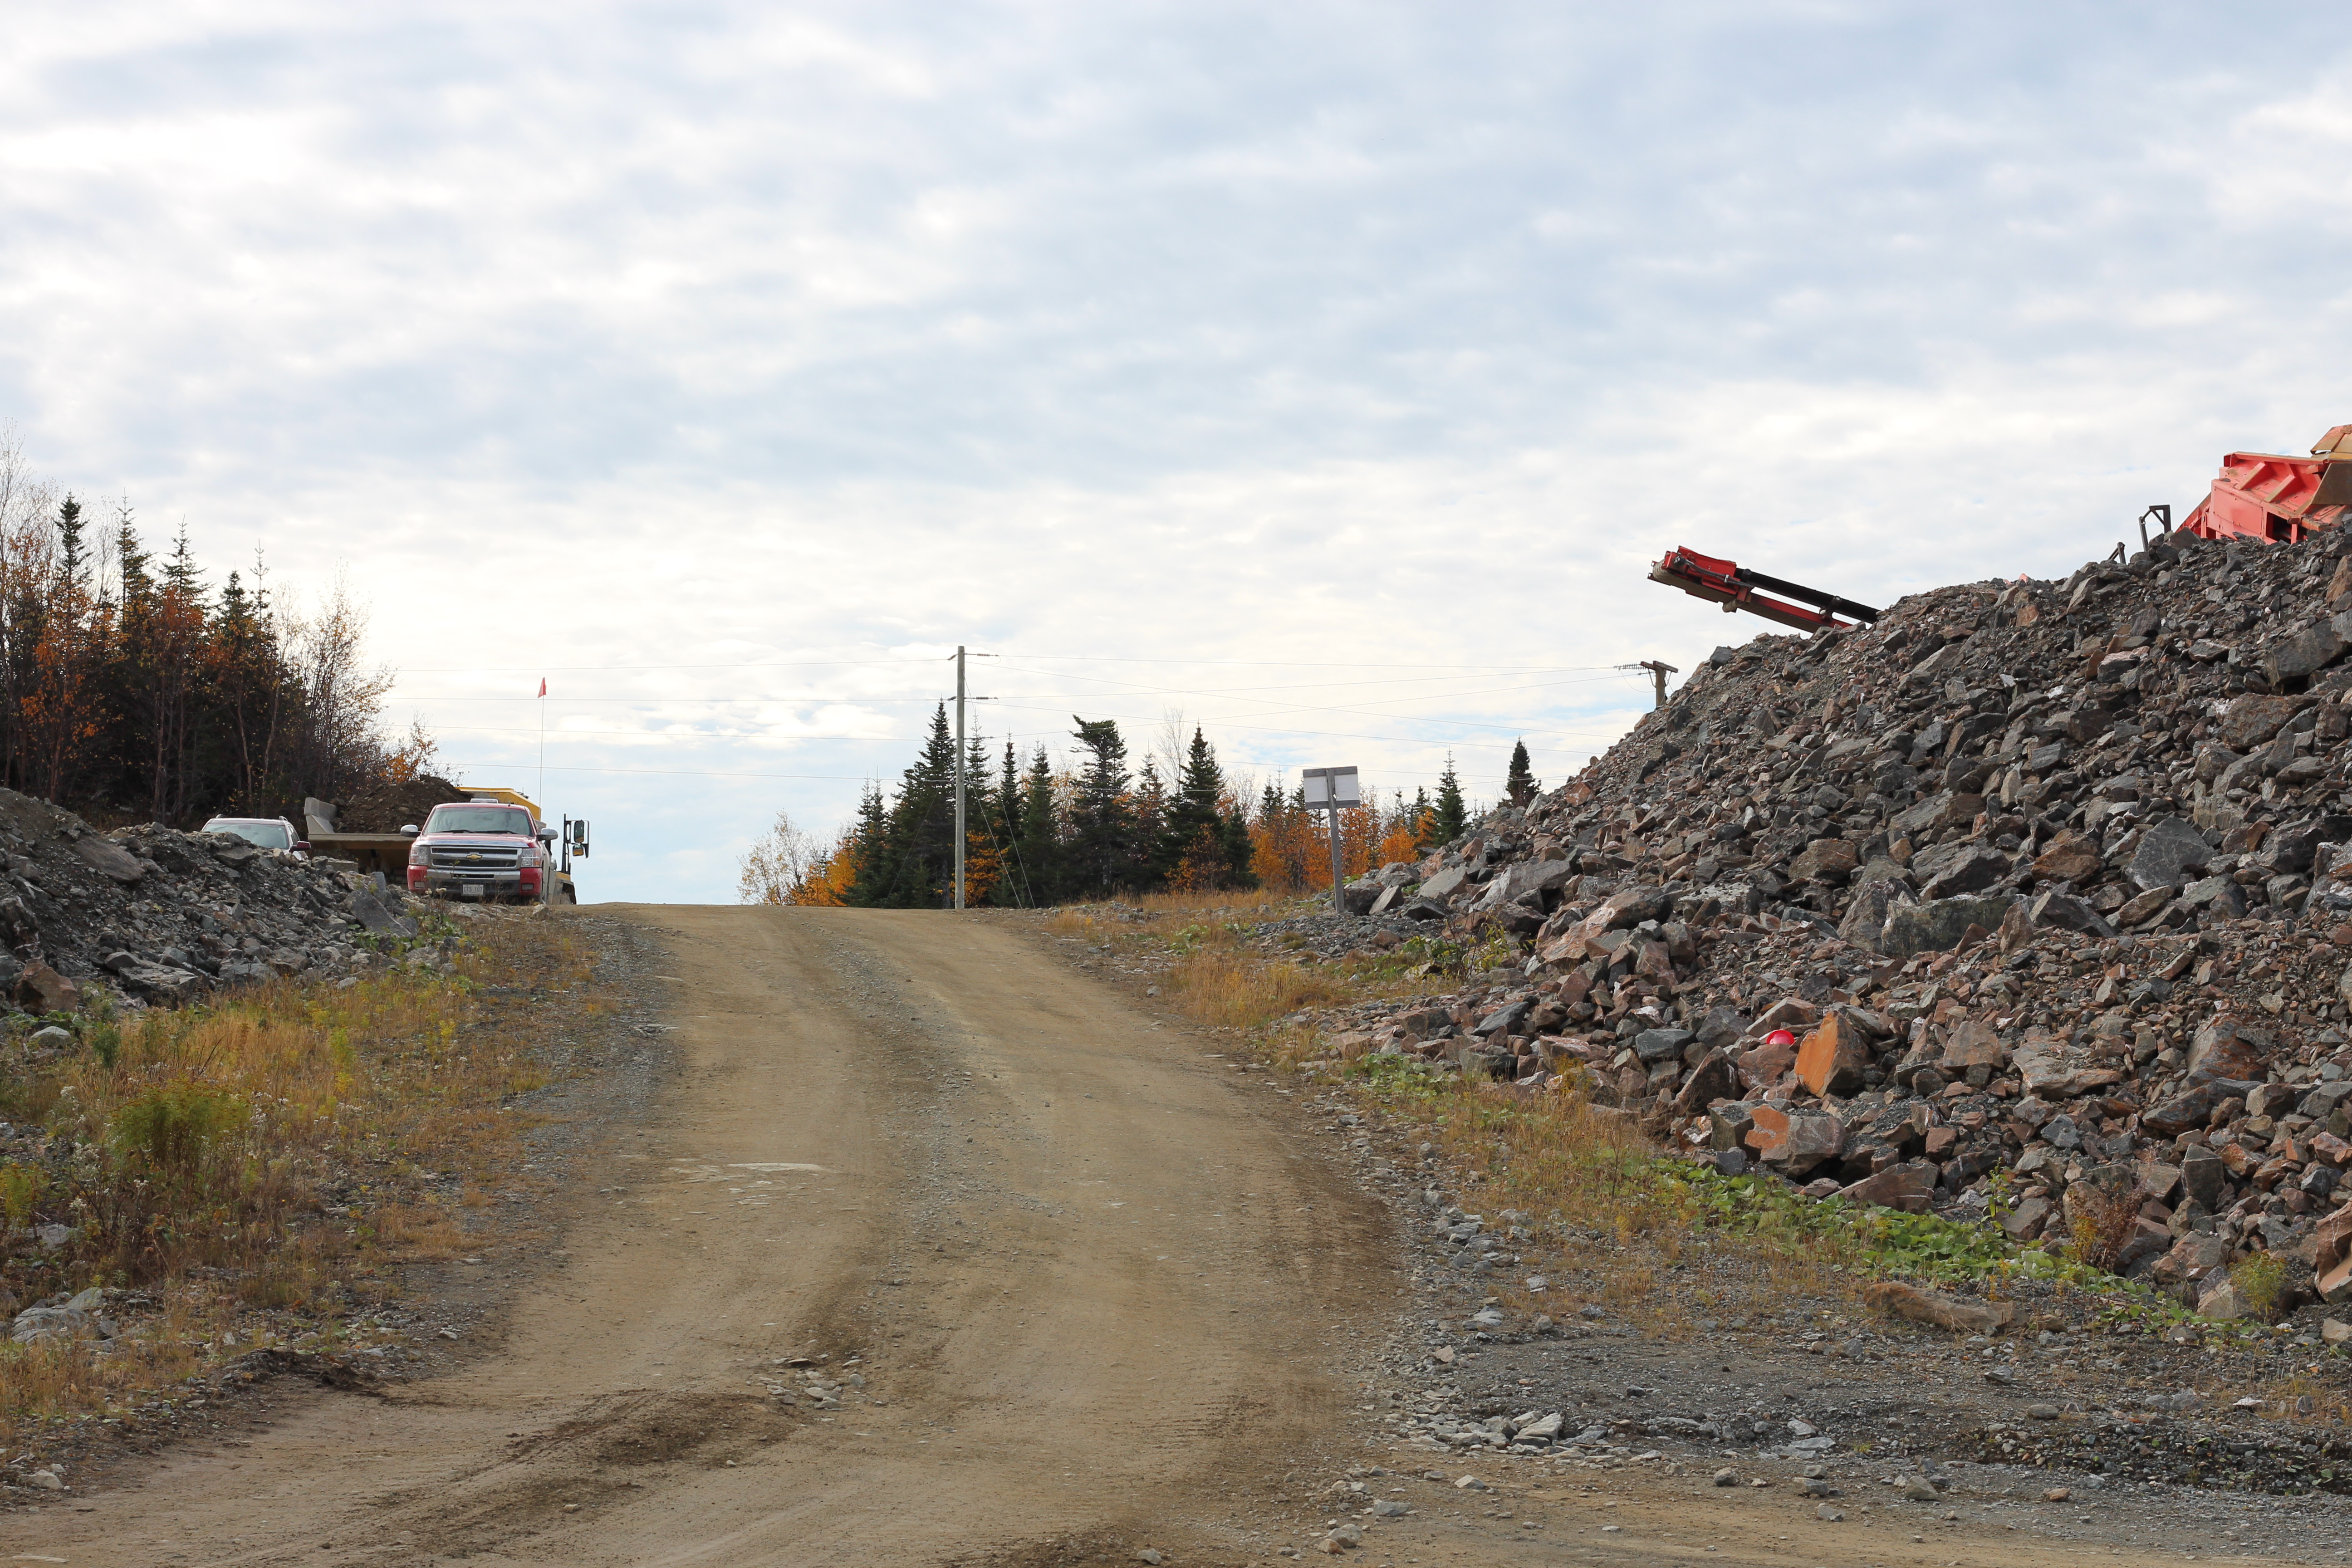
Stog’er Tight Deposit – Located in Close Proximity to the Pine Cove Mill
Scrape Trend
While the Stog’er Tight Deposit looks to become Anaconda’s next producing asset, there are many more prospective targets located in what is called the Scrape Trend.
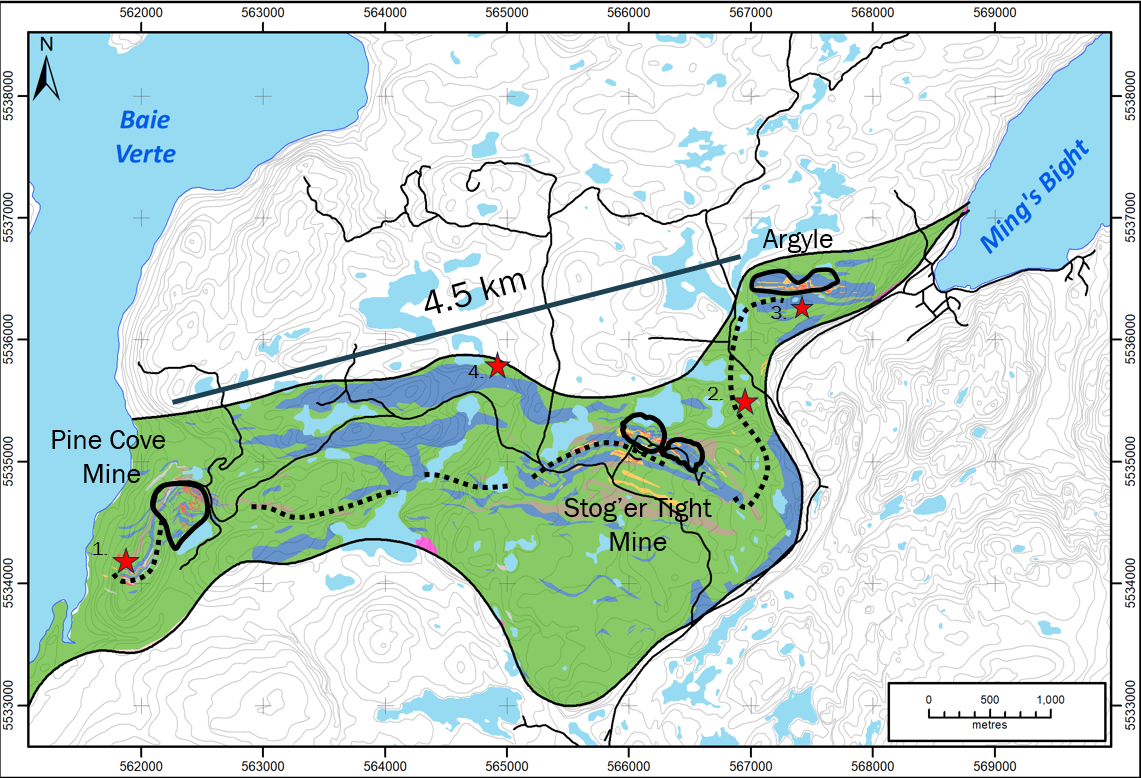 Source: Anaconda Mining
In the image above, you can see the exploration targets listed from 1 to 4. Starting on the left-hand side of the image with #1, is Anaroc, which is located in close proximity to the Pine Cove open pit mine. Next, #4 is Corkscrew Road, followed by the #2 Connector and, finally, #3 the most explored of the targets, the Argyle Zone.
Argyle Zone
Fifty-two holes have been drilled at the Argyle Zone, totalling 4,860 meters. The strike length is over 600m and 225m down dip. To date, here are some of the drill highlights at the Argyle Zone: 6.09 g/t over 8.9m (AE-16-11), 9.31 g/t over 6.0m (AE-16-39) and 3.63 g/t over 12.0m (AE-17-46).
In a recent news release, Anaconda announced a flotation recovery of 97.3% and a leach recovery of 94.5% for a combined recovery of 91.9% of a 25 kg sample of blended core samples from Argyle, with an average grade of 2.69 g/ton gold.
Additionally, Anaconda’s geologists have identified other targets to the south and along strike using geophysical data.
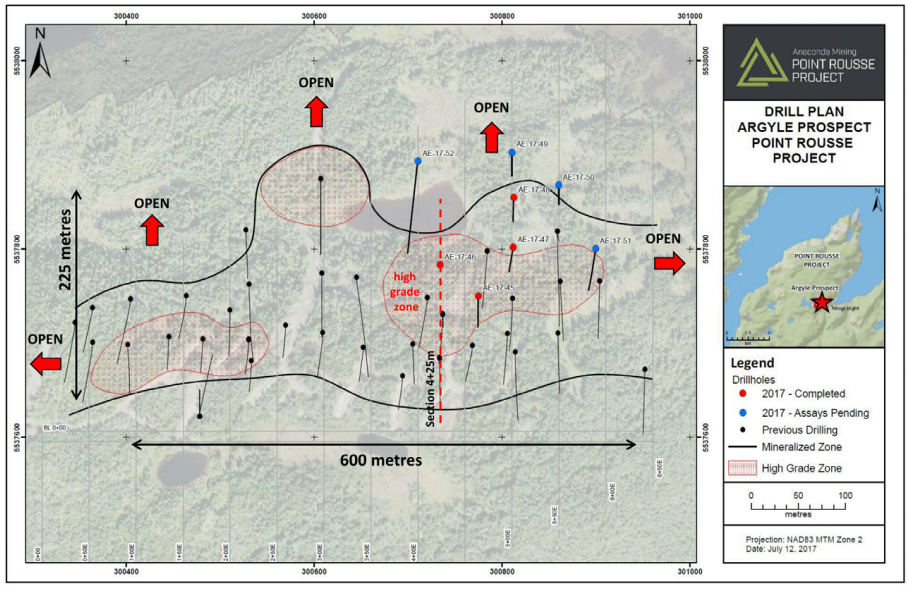
Source: Anaconda Mining
PUSH: A maiden resource estimation for the Argyle Zone is expected to be announced in December 2017. Additionally, Anaconda’s team is working on an environmental assessment application, conducting metallurgical and ARD testing and government consultations.
Aggregates Project
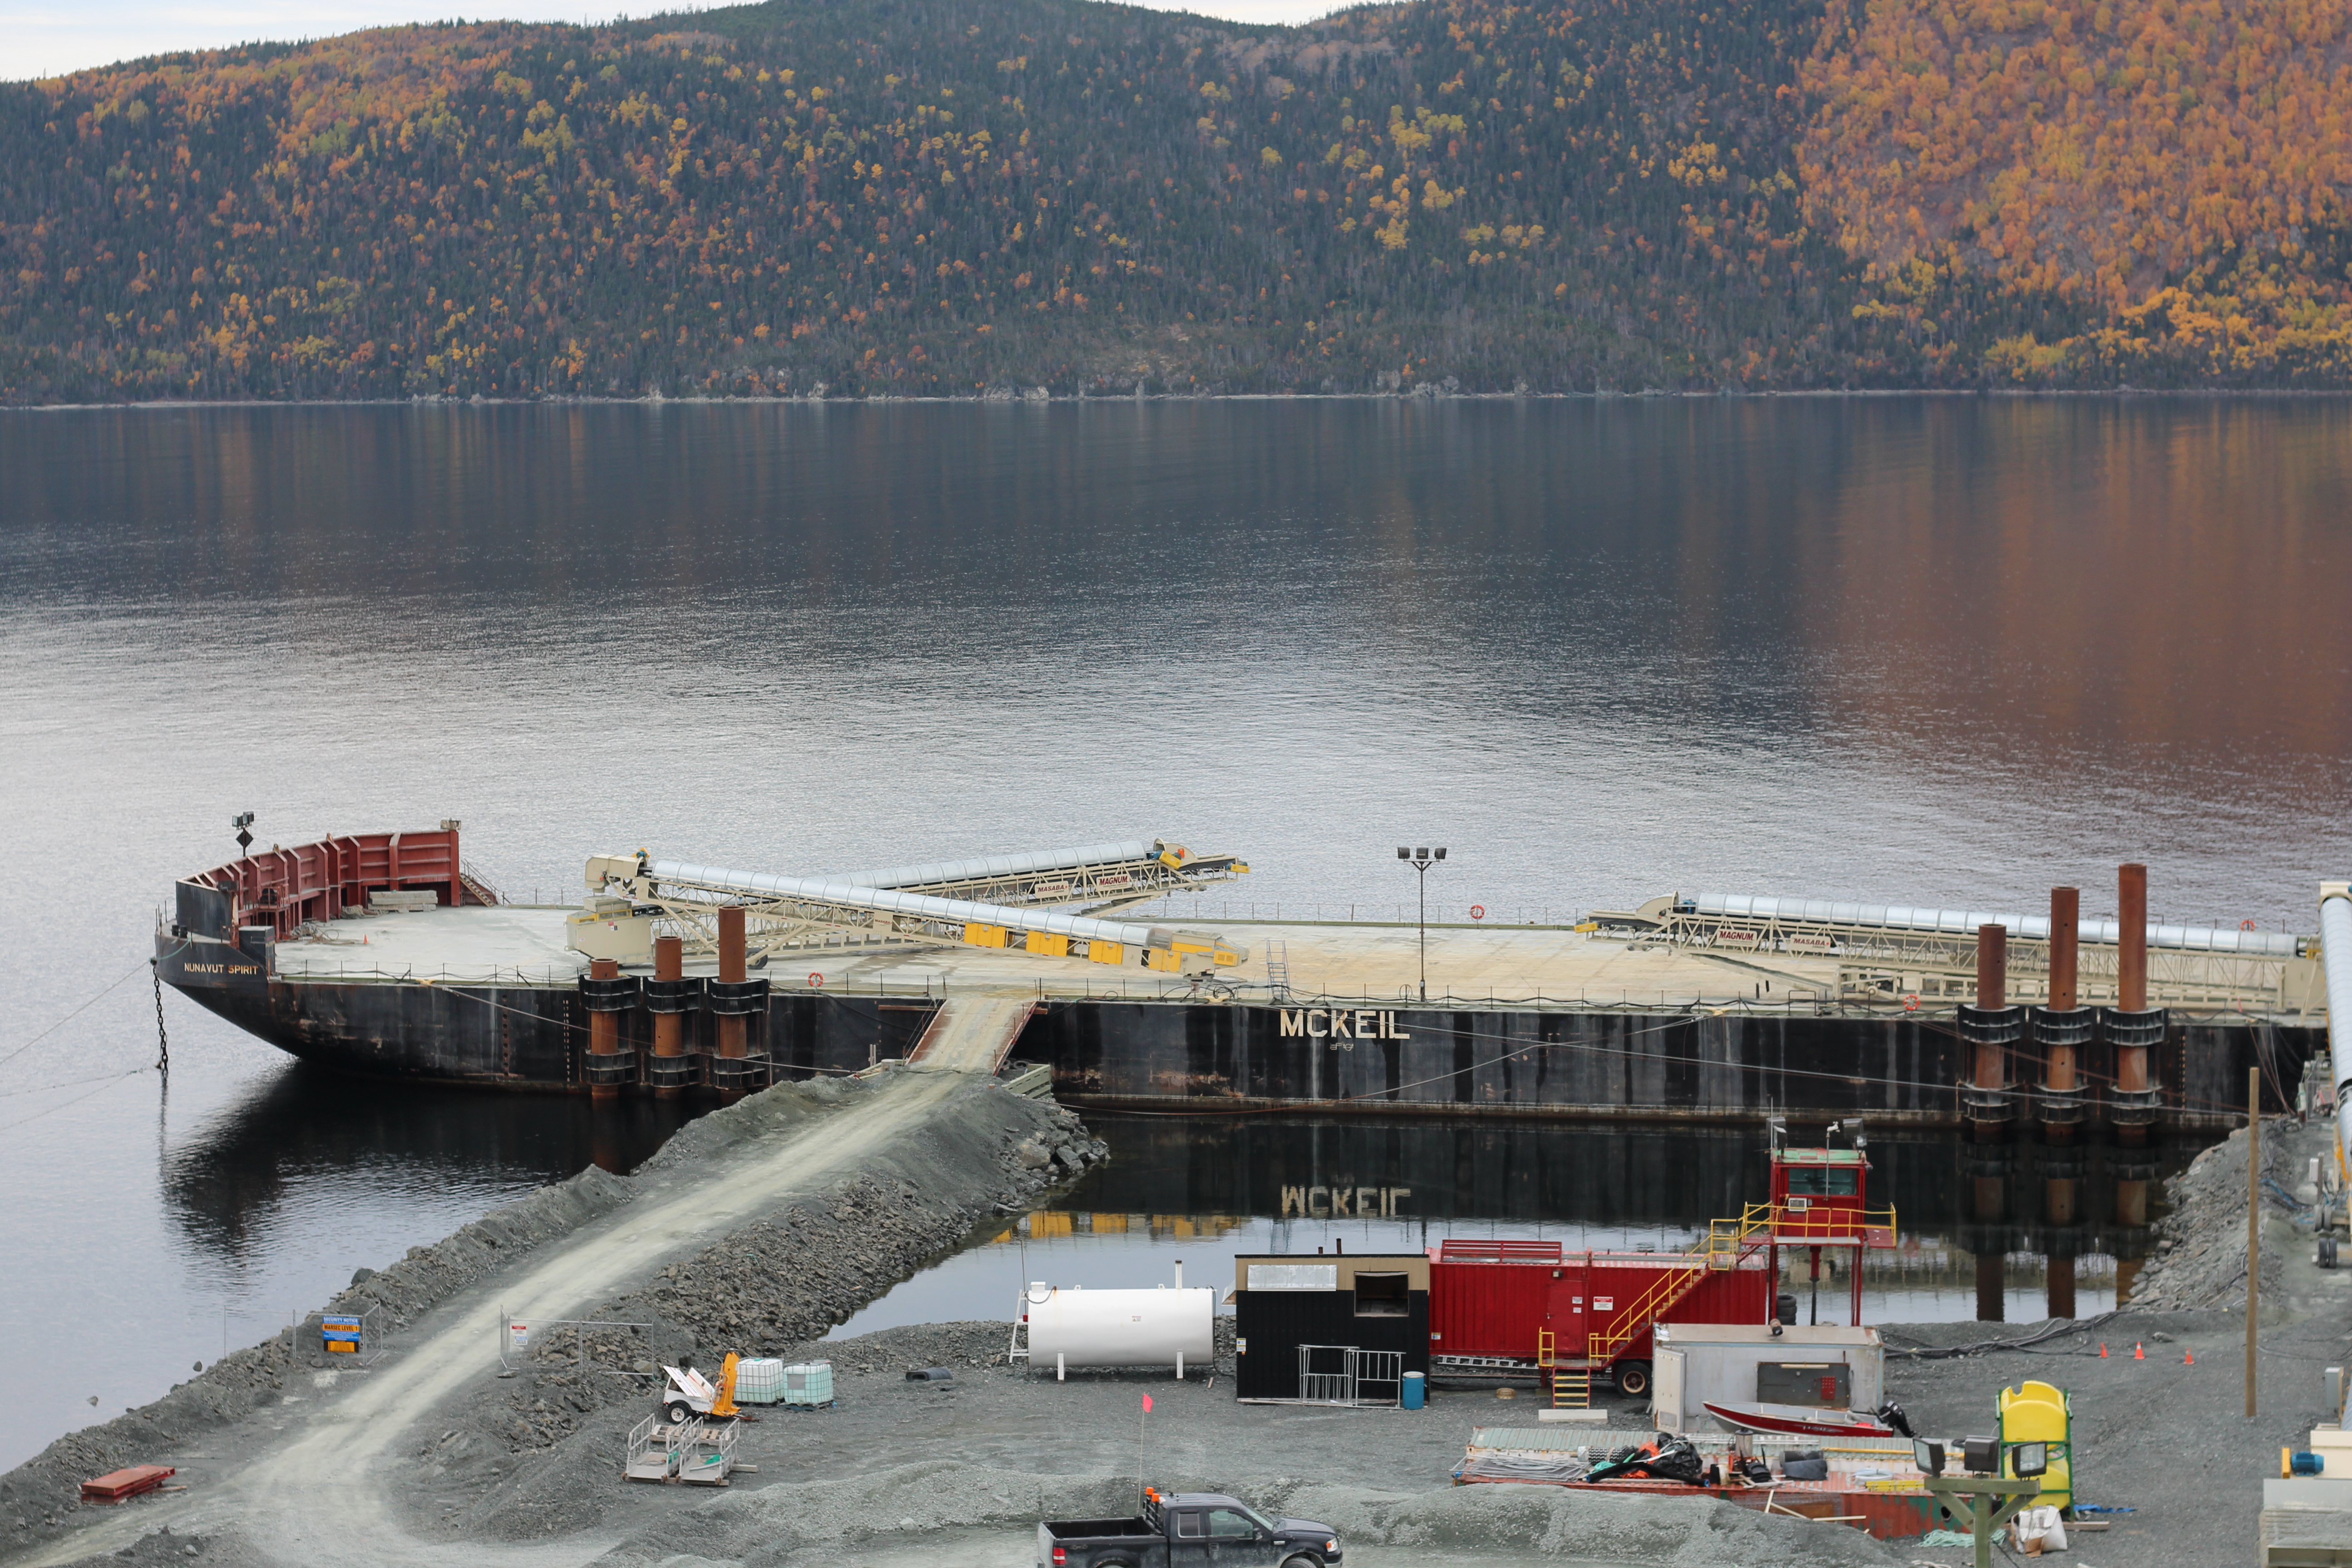
Deep Sea Port which Facilitates the Aggregate Shipments
While not a focus for Anaconda, the cash and the removal of waste rock that the Aggregates Project provides is a huge plus for the company. The Aggregates Project and the proposed use of some of the larger waste rock as armour stone is a testament to the innovation that Anaconda’s leadership has instilled in their workforce.
With the first Aggregates Project contract having just expired, Chislett mentioned that they intend to negotiate additional contracts in the future. In the last fiscal year ending on May 31 2017, the project generated $0.9 million.
The Goldboro Project
From the first time we met, Anaconda’s CEO, Dustin Angelo, has told me that Anaconda has lofty goals for expansion, as they intend on becoming a 50,000 ounce per year gold producer. To more than triple their current production rate, they will, without a doubt, lean heavily on their latest acquisition, the Goldboro Project, which is located a couple of hours northeast of Halifax, Nova Scotia.
In recent news, Anaconda was able to raise $3 million dollars in a non-brokered private placement. VP of Exploration, Paul McNeill, says roughly half will be put toward further exploration and development at Goldboro.
In a news release on November 1st, Anaconda announced a 6,000m diamond drill program, focusing on the Boston Richardson and East Goldbrook gold systems. The goal of the program is to expand the mineral resource along strike and down plunge, while also completing infill drilling in specific portions of the deposit as they look to move some of the Inferred resource up to the Measured and Indicated categories.
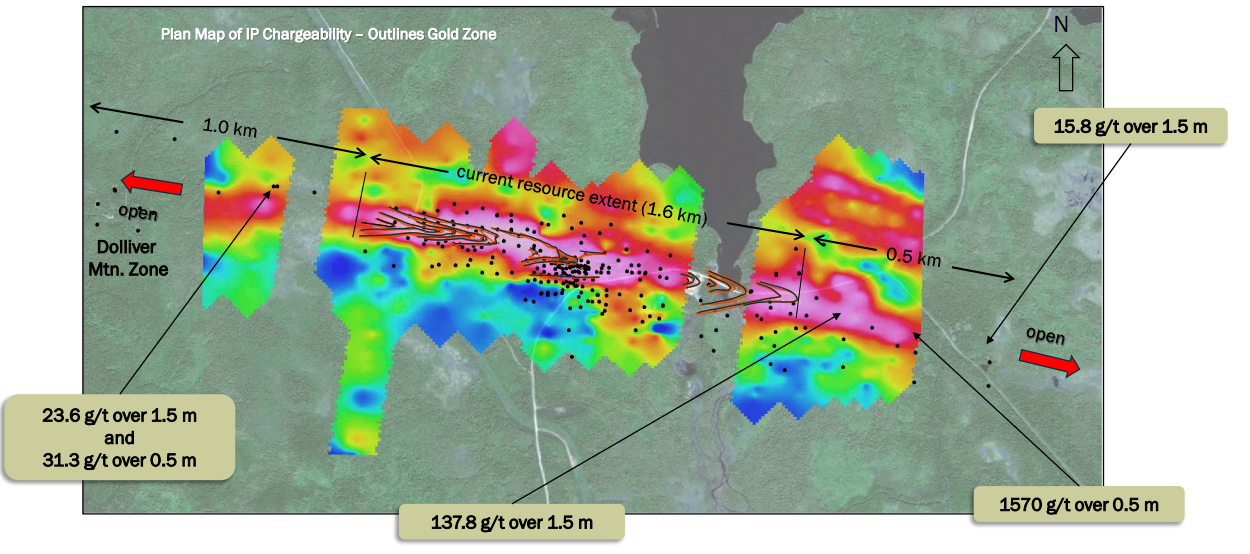
Goldboro IP Chargeability Map
In the same release, Anaconda reported that initial drill core observations support the thesis that the Goldboro Deposit continues at depth, as the first diamond drill hole (BR-17-06) intersected the geological structure hosting the Boston Richardson System between 400 to 475 meters, which is 75 meters below the current resource model.
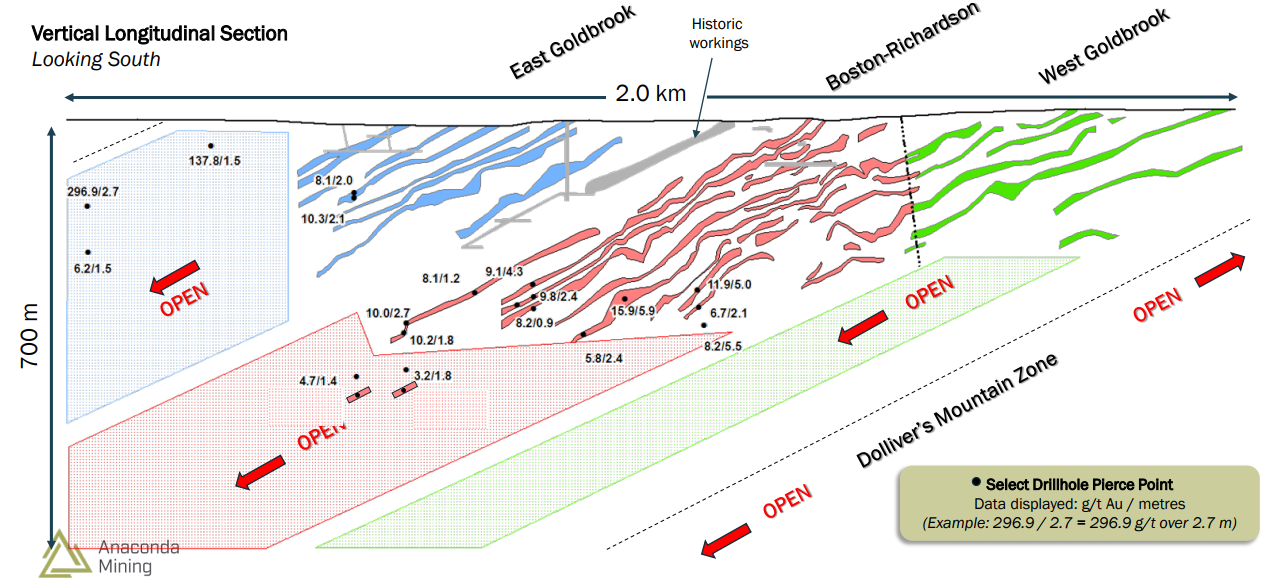
Goldboro Deposit Vertical Longitudinal Section
PUSH: Drill results from the recently commenced 6,000m diamond drill program. Expansion of the resource at depth and along strike has the potential to do great things for the economics of this project. Pay close attention to drill results coming in the weeks and months ahead.
PUSH: Additionally, a PEA is scheduled to be completed by the end of this year, the economics of which could be enhanced with further expansion of the Goldboro Deposit.
Anaconda possesses a proven team with a track record for success in mining. I believe that Goldboro will be the next feather in their cap, as they look to develop the Project into a producing mine. For a detailed look at Anaconda, check out my last article here.
Concluding Remarks
Before my visit, I felt the future was very bright for Anaconda. After seeing their Point Rousse Project in person, I’m convinced Anaconda is a company that is dedicated to empowering its people. It has not only survived the depths of the recent bear market, but has emerged in this new gold bull market as a premier gold producer, set to grow in the coming years.
I’m looking to add to my position in Anaconda in the weeks ahead, and see weakness in the share price as an opportunity. Putting it all together, there’s a lot of news flow to watch for in the coming weeks and months, which could provide some PUSH for the stock price:
- Results from the 6,000m diamond drill program at the Goldboro Project. They are looking to expand along strike and at depth.
- Completion of a PEA on the Goldboro Project by the end of 2017
- Stog’er Tight Deposit will begin production in early 2018
- Maiden Resource Estimation announcement on the Argyle Zone in December 2017
Don’t want to miss a new investment idea, interview or financial product review? Become a Junior Stock Review VIP now – it’s FREE!
Until next time,
Brian Leni P.Eng
Founder – Junior Stock Review
Disclaimer: The following is not an investment recommendation, it is an investment idea. I am not a certified investment professional, nor do I know you and your individual investment needs. Please perform your own due diligence to decide whether this is a company(s) and sector that is best suited for your personal investment criteria. Junior Stock Review does not guarantee the accuracy of any of the analytics used in this report. I do own Anaconda Mining Inc. shares. Anaconda Mining Inc. is a Sponsor of Junior Stock Review.
The junior gold miners’ stocks have spent months grinding sideways near lows, sapping confidence and breeding widespread bearishness. The entire precious-metals sector has been left for dead, eclipsed by the dazzling Trumphoria stock-market rally. But traders need to keep their eyes on the fundamental ball so herd sentiment doesn’t mislead them. The juniors recently reported Q3 earnings, and enjoyed strong results.
Four times a year publicly-traded companies release treasure troves of valuable information in the form of quarterly reports. Companies trading in the States are required to file 10-Qs with the US Securities and Exchange Commission by 45 calendar days after quarter-ends. Canadian companies have similar requirements. In other countries with half-year reporting, many companies still partially report quarterly.
The definitive list of elite junior gold stocks to analyze used to come from the world’s most-popular junior-gold-stock investment vehicle. This week the GDXJ VanEck Vectors Junior Gold Miners ETF reported $4.4b in net assets. Among all gold-stock ETFs, that was only second to GDX’s $8.1b. That is GDXJ’s big-brother ETF that includes larger major gold miners. GDXJ’s popularity testifies to the great allure of juniors.
Unfortunately this fame has recently created major problems severely hobbling the usefulness of GDXJ. This sector ETF has shifted from being beneficial for junior gold miners to outright harming them. GDXJ is literally advertised as a “Junior Gold Miners ETF”. Investors only buy GDXJ shares because they think this ETF gives them direct exposure to junior gold miners’ stocks. But unfortunately that’s no longer true!
GDXJ is quite literally the victim of its own success. This ETF grew so large in the first half of 2016 as gold stocks soared in a massive upleg that it risked running afoul of Canadian securities law. Most of the world’s junior gold miners and explorers trade in Canada. In that country once any investor including an ETF goes over 20% ownership in any stock, it is deemed a takeover offer that must be extended to all shareholders!
Understanding what happened in GDXJ is exceedingly important for junior-gold-stock investors, and I explained it in depth in my past essay on juniors’ Q1’17 results. GDXJ’s managers were forced to reduce their stakes in leading Canadian juniors. So capital that GDXJ investors intended to deploy in junior gold miners was instead diverted into much-larger gold miners. GDXJ’s effective mission stealthily changed.
Not many are more deeply immersed in the gold-stock sector than me, as I’ve spent decades studying, trading, and writing about this contrarian realm. These huge GDXJ changes weren’t advertised, and it took even me months to put the pieces together to understand what was happening. GDXJ’s managers may have had little choice, but their major direction change has been devastating to true junior gold miners.
Investors naturally pour capital into GDXJ, the “Junior Gold Miners ETF”, expecting to own junior gold miners. But instead of buying junior gold miners’ shares and bidding up their prices, GDXJ is instead shunting those critical inflows to the much-larger mid-tier and even major gold miners. That left the junior gold miners starved of capital, as their share prices they rely heavily upon for financing languished in neglect.
GDXJ’s managers should’ve lobbied Canadian regulators and lawmakers to exempt ETFs from that 20% takeover rule. Hundreds of thousands of investors buying an ETF obviously have no intention of taking over gold-mining companies! And higher junior-gold-stock prices boost the Canadian economy, helping these miners create valuable high-paying jobs. But GDXJ’s managers instead skated perilously close to fraud.
This year they rejiggered their own index underlying GDXJ, greatly demoting most of the junior gold miners! Investors buying GDXJ today are getting very-low junior-gold-miner exposure, which makes the name of this ETF a deliberate deception. I’ve championed GDXJ for years, it is a great idea. But in its current sorry state, I wouldn’t touch it with a ten-foot pole. It is no longer anything close to a junior-gold-miners ETF.
There’s no formal definition of a junior gold miner, which gives cover to GDXJ’s managers pushing the limits. Major gold miners are generally those that produce over 1m ounces of gold annually. For years juniors were considered to be sub-200k-ounce producers. So 300k ounces per year is a very-generous threshold. Anything between 300k to 1m ounces annually is in the mid-tier realm, where GDXJ now traffics.
That high 300k-ounce-per-year junior cutoff translates into 75k ounces per quarter. Following the end of the gold miners’ Q3 earnings season in mid-November, I dug into the top 34 GDXJ components. That’s just an arbitrary number that fits neatly into the tables below. While GDXJ included a staggering 73 component stocks in mid-November, the top 34 accounted for a commanding 81.1% of its total weighting.
Out of these top 34 GDXJ companies, only 5 primary gold miners met that sub-75k-ounces-per-quarter qualification to be a junior gold miner! Their quarterly production is highlighted in blue below, and they collectively accounted for just 7.1% of GDXJ’s total weighting. But even that isn’t righteous, as these include a 126-year-old silver miner and a mid-tier gold miner suffering temporary production declines.
GDXJ is inarguably now a pure mid-tier gold-miner ETF. That’s great if GDXJ is advertised as such, but terrible if capital investors explicitly intend for junior gold miners is instead being diverted into mid-tiers without their knowledge or consent. The vast majority of GDXJ shareholders have no idea how radically this ETF has changed since early 2016. It is all but unrecognizable, straying greatly from its original mission.
I’ve been doing these deep quarterly dives into GDXJ’s top components for years now. In Q3’17, fully 32 of the top 34 GDXJ components were also GDX components! These ETFs are separate, a “Gold Miners ETF” and a “Junior Gold Miners ETF”. So why on earth should they own many of the same companies? In the tables below I highlighted the rare GDXJ components not also in GDX in yellow in the weightings column.
These 32 GDX components accounted for 78.7% of GDXJ’s total weighting, not just its top 34. They also represented 31.4% of GDX’s total weighting. So almost 4/5ths of the junior gold miners’ ETF is made up of nearly a third of the major gold miners’ ETF! I’ve talked with many GDXJ investors over the years, and have never heard one wish their capital allocated specifically to junior golds would instead go to much-larger miners.
Fully 10 of GDXJ’s top 17 components weren’t even in this ETF a year ago in Q3’16. They alone now account for 34.5% of its total weighting. 16 of the top 34 are new, or 44.4% of the total. In the tables below, I highlighted the symbols of companies that weren’t in GDXJ a year ago in light blue. Today’s GDXJ is a radical departure from last year. Analyzing Q3’17 results largely devoid of real juniors is frustrating.
Nevertheless, GDXJ remains the leading “junior-gold” benchmark. So every quarter I wade through tons of data from its top components’ 10-Qs, and dump it into a big spreadsheet for analysis. The highlights made it into these tables. A blank field means a company didn’t report that data for Q3’17 as of that mid-November 10-Q deadline. Companies have wide variations in reporting styles, data presented, and report timing.
In these tables the first couple columns show each GDXJ component’s symbol and weighting within this ETF as of mid-November. While most of these gold stocks trade in the States, not all of them do. So if you can’t find one of these symbols, it’s a listing from a company’s primary foreign stock exchange. That’s followed by each company’s Q3’17 gold production in ounces, which is mostly reported in pure-gold terms.
Many gold miners also produce byproduct metals like silver and copper. These are valuable, as they are sold to offset some of the considerable costs of gold mining. Some companies report their quarterly gold production including silver, a construct called gold-equivalent ounces. I only included GEOs if no pure-gold numbers were reported. That’s followed by production’s absolute year-over-year change from Q3’16.
Next comes the most-important fundamental data for gold miners, cash costs and all-in sustaining costs per ounce mined. The latter determines their profitability and hence ultimately stock prices. Those are also followed by YoY changes. Finally the YoY changes in cash flows generated from operations, GAAP profits, revenues, and cash on balance sheets are listed. There’s one key exception to these YoY changes.
Percentage changes aren’t relevant or meaningful if data shifted from negative to positive or vice versa. Plenty of GDXJ gold miners that earned profits in Q3’16 suffered net losses in Q3’17. So in cases where data crossed that zero line, I included the raw numbers instead. This whole dataset offers a fantastic high-level fundamental read on how the mid-tier gold miners are faring today, and they’re actually doing quite well.
After spending days digesting these GDXJ gold miners’ latest quarterly reports, it’s fully apparent their vexing consolidation this year isn’t fundamentally righteous at all! Traders have abandoned this sector since the election because the allure of the levitating general stock markets has eclipsed gold. That has left gold stocks exceedingly undervalued, truly the best fundamental bargains out there in all the stock markets!
Once again the light-blue-highlighted symbols are new GDXJ components that weren’t included a year ago in Q3’16. And the meager yellow-highlighted weightings are the only stocks that were not also GDX components in mid-November! GDXJ is increasingly a GDX clone that offers little if any real exposure to true gold juniors’ epic upside potential during gold bulls. GDXJ has become a shadow of its former self.
VanEck owns and manages GDX, GDXJ, and the MVIS indexing company that decides exactly which gold stocks are included in each. With one company in total control, GDX and GDXJ should have zero overlap in underlying companies! GDX or GDXJ inclusion should be mutually-exclusive based on the size of individual miners. That would make both GDX and GDXJ much more targeted and useful for investors.
Two of GDXJ’s heaviest-weighted component choices are mystifying. Sibanye Gold and Gold Fields are major South African gold miners, way bigger than mid-tier status and about as far from junior-dom as you can get. In Q3’17 they both mined way in excess of that 250k-ounce quarterly threshold that is definitely major status. They are among the world’s largest gold miners, so it’s ludicrous to have them in a juniors ETF.
Since gold miners are in the business of wresting gold from the bowels of the Earth, production is the best place to start. These top 34 GDXJ gold miners collectively produced 4352k ounces in Q3’17. That rocketed 121% higher YoY, but that comparison is meaningless given the radical changes in this ETF’s composition since Q3’16. On the bright side, GDXJ’s miners do still remain significantly smaller than GDX’s.
GDX’s top 34 components, fully 20 of which are also top-34 GDXJ components, collectively produced 9947k ounces of gold in Q3. So GDXJ components’ average quarterly gold production of 136k ounces excluding explorers was 55% lower than GDX components’ 301k average. In spite of GDXJ’s very-misleading “Junior” name, it definitely has smaller gold miners even if they’re well above that 75k junior threshold.
Despite GDXJ’s top 34 components looking way different from a year ago, these current gold miners are faring well on the crucial production front. Fully 22 of these mid-tier gold miners enjoyed big average YoY production growth of 18%! Overall average growth excluding explorers was 8.2% YoY, which is far better than world mine production which slumped 1.3% lower YoY in Q3’17 according to the World Gold Council.
These elite GDXJ mid-tier gold miners are really thriving, with production growth way outpacing their industry. That will richly reward investors as sentiment normalizes. Smaller mid-tier gold miners able to grow production are the sweet spot for stock-price upside potential. With market capitalizations much lower than major gold miners, investment capital inflows are relatively larger which bids up stock prices faster.
With today’s set of top-34 GDXJ gold miners achieving such impressive production growth, their costs per ounce should’ve declined proportionally. Higher production yields more gold to spread mining’s big fixed costs across. And lower per-ounce costs naturally lead to higher profits. So production growth is highly sought after by gold-stock investors, with companies able to achieve it commanding premium prices.
There are two major ways to measure gold-mining costs, classic cash costs per ounce and the superior all-in sustaining costs per ounce. Both are useful metrics. Cash costs are the acid test of gold-miner survivability in lower-gold-price environments, revealing the worst-case gold levels necessary to keep the mines running. All-in sustaining costs show where gold needs to trade to maintain current mining tempos indefinitely.
Cash costs naturally encompass all cash expenses necessary to produce each ounce of gold, including all direct production costs, mine-level administration, smelting, refining, transport, regulatory, royalty, and tax expenses. In Q3’17, these top-34 GDXJ-component gold miners that reported cash costs averaged just $612 per ounce. That indeed plunged a major 6.9% YoY from Q3’16, and even 2.5% QoQ from Q2’17.
This was really quite impressive, as the mid-tier gold miners’ cash costs were only a little higher than the GDX majors’ $591. That’s despite the mid-tiers each operating fewer gold mines and thus having fewer opportunities to realize cost efficiencies. Traders must recognize these mid-sized gold miners are in zero fundamental peril as long as prevailing gold prices remain well above cash costs. And $612 gold ain’t happening!
Way more important than cash costs are the far-superior all-in sustaining costs. They were introduced by the World Gold Council in June 2013 to give investors a much-better understanding of what it really costs to maintain a gold mine as an ongoing concern. AISC include all direct cash costs, but then add on everything else that is necessary to maintain and replenish operations at current gold-production levels.
These additional expenses include exploration for new gold to mine to replace depleting deposits, mine-development and construction expenses, remediation, and mine reclamation. They also include the corporate-level administration expenses necessary to oversee gold mines. All-in sustaining costs are the most-important gold-mining cost metric by far for investors, revealing gold miners’ true operating profitability.
In Q3’17, these top 34 GDXJ components reporting AISC averaged just $877 per ounce. That’s down a sharp 3.7% YoY and 0.2% QoQ. That also compares very favorably with the GDX majors, which saw nearly-identical average AISC at $868 in Q3. The mid-tier gold miners’ low costs prove they are faring far better fundamentally today than traders think based on this year’s vexing sideways-grinding stock-price action.
All-in sustaining costs are effectively this industry’s breakeven level. As long as gold stays above $877 per ounce, it remains profitable to mine. At Q3’s average gold price of $1279, these top GDXJ gold miners were earning big average profits of $402 per ounce last quarter! That equates to hefty profit margins of 31%, levels most industries would kill for. The mid-tier gold miners aren’t getting credit for that today.
Unfortunately given its largely-junior-less composition, GDXJ remains the leading benchmark for junior gold miners. In Q3’17, GDXJ averaged $33.81 per share. That was down a serious 28.6% from Q3’16’s average of $47.38. Investors have largely abandoned gold miners because they are captivated by the extreme Trumphoria stock-market rally since the election. Yet gold-mining profits certainly didn’t justify this.
A year ago in Q3’16, the top 34 GDXJ components at that time reported average all-in sustaining costs of $911 per ounce. With gold averaging $1334 then which was 4.4% higher, that implies the mid-tier gold miners were running operating profits of $423 per ounce. Thus Q3’17’s $402 merely slumped 5.0% YoY, which definitely isn’t worthy of hammering mid-tier gold miners’ stock prices over a quarter lower over the past year.
Gold miners offer such compelling investment opportunities because of their inherent profits leverage to gold. Gold-mining costs are largely fixed during mine-planning stages, when engineers and geologists decide which ore to mine, how to dig to it, and how to process it. The actual mining generally requires the same levels of infrastructure, equipment, and employees quarter after quarter regardless of gold prices.
With gold-mining costs essentially fixed, higher or lower gold prices flow directly through to the bottom line in amplified fashion. That wasn’t really apparent in GDXJ over this past year since its composition changed so radically. Normally a 4.2% drop in average gold prices would lead to much more than a 5.0% YoY operating-profit decline. Gold-stock profits generally leverage gold price moves by several times.
Gold itself is overdue for a major new upleg driven by investment demand returning. As I discussed several weeks ago, investment demand has stalled thanks to the extreme stock-market euphoria. These bubble-valued stock markets are due to roll over imminently as the Fed and European Central Bank both start aggressively choking off liquidity. That will strangle this stock bull, reigniting big gold investment demand.
The impact of higher gold prices on mid-tier-gold-miner profitability is easy to model. Assuming flat all-in sustaining costs at Q3’17’s $877 per ounce, 10%, 20%, and 30% gold rallies from this week’s levels will lead to collective gold-mining profits surging 36%, 68%, and 100%! And another 30% gold upleg isn’t a stretch at all. In essentially the first half of 2016 alone after the last stock-market correction, gold surged 29.9%.
The major gold stocks as measured by the HUI, which closely mirrors GDX, skyrocketed 182.2% higher in roughly that same span! Gold-mining profits and thus gold-stock prices soar when gold is powering higher. So if you believe gold is heading higher in coming quarters as these crazy stock markets falter, the gold stocks are screaming buys today fundamentally. That’s especially true of the best mid-tier gold miners.
Since today’s bastardized GDXJ mostly devoid of juniors changed so radically since last year, the normal year-over-year comparisons in key financial results aren’t comparable. But here they are for reference. These top 34 GDXJ companies’ cashflows generated from operations soared 65% YoY to $1515m. That was driven by sales up 96% YoY to $4130m. That left miners’ collective cash balances $28% higher YoY at $5672m.
Yet top-34-GDXJ-component profits crumbled 38% YoY to $212m. Again don’t read too much into this since it’s an apples-to-oranges comparison. Interestingly a single company that was in GDXJ in both quarters is responsible for over 2/3rds of that drop. Endeavour Mining’s earnings plunged from +$24m a year ago to -$65m in Q3’17, largely due to a $54m impairment charge in its Nzema mine which is being sold.
GDXJ’s component list was much more consistent between Q2’17 and Q3’17. QoQ these top 34 GDXJ gold miners saw operating cash flows rise 3.9%, sales surge 7.5%, cash on hand fall 7.6%, and profits plummet 72%. Again an anomaly in a single company is responsible for nearly 9/10ths of this sequential decline. In Q2 IAMGOLD reported a gigantic $524m non-cash gain on the reversal of an impairment charge!
The massive non-cash gains and losses flushed through net income are one reason why all-in sustaining costs offer a better read on gold-miner health. If GDXJ’s component list and weightings finally stabilize after this past year’s extreme tumult, we’ll have clean comps again next year. For now these mid-tier gold miners are generally doing far better operationally than their neglected super-low stock prices imply.
So overall the mid-tier gold miners’ fundamentals looked quite impressive in Q3’17, a stark contrast to the miserable sentiment plaguing this sector. Gold stocks’ vexing consolidation this year wasn’t the result of operational struggles, but purely bearish psychology. That will soon shift as the stock markets roll over and gold surges, making the beaten-down gold stocks a coiled spring today. They are overdue to soar again!
Though this contrarian sector is widely despised now, it was the best-performing in all the stock markets last year despite that sharp post-election selloff in Q4. The HUI blasted 64.0% higher in 2016, trouncing the S&P 500’s mere 9.5% gain! Similar huge 50%+ gold-stock gains are likely again in 2018, as gold mean reverts higher on the coming stock-market selloff. The gold miners’ strong Q3 fundamentals prove this.
Given GDXJ’s serious problems, leading to diverting most of its capital inflows into larger gold miners that definitely aren’t juniors, you won’t find sufficient junior-gold exposure in this troubled ETF. Instead traders should prudently deploy capital in the better individual mid-tier and junior gold miners’ stocks with superior fundamentals. Their upside is vast, and would trounce GDXJ’s even if it was still working as advertised.
At Zeal we’ve literally spent tens of thousands of hours researching individual gold stocks and markets, so we can better decide what to trade and when. As of the end of Q3, this has resulted in 967 stock trades recommended in real-time to our newsletter subscribers since 2001. Fighting the crowd to buy low and sell high is very profitable, as all these trades averaged stellar annualized realized gains of +19.9%!
The key to this success is staying informed and being contrarian. That means buying low when others are scared, like late in this year’s vexing consolidation. An easy way to keep abreast is through our acclaimed weekly and monthly newsletters. They draw on my vast experience, knowledge, wisdom, and ongoing research to explain what’s going on in the markets, why, and how to trade them with specific stocks. Easy to read and affordable, they’ll help you learn to think, trade, and thrive like contrarians. Subscribe today, and get deployed in the great gold stocks on our trading books before they surge far higher!
The bottom line is the mid-tier gold miners now dominating GDXJ enjoyed strong fundamentals in their recently-reported Q3 results. While GDXJ’s radical composition changes since last year muddy annual comparisons, today’s components mined lots more gold at lower costs. These gold miners continued to earn hefty operating profits while generating strong cash flows. Sooner or later stock prices must reflect fundamentals.
As gold itself continues mean reverting higher, these mid-tier gold miners will see their profits soar due to their big inherent leverage to gold. GDXJ now offers excellent exposure to mid-tier gold miners, which will see gains well outpacing the majors. All it will take to ignite gold stocks’ overdue mean-reversion rally is gold investment demand returning. The resulting higher gold prices will attract investors back to gold miners.
Adam Hamilton, CPA
December 1, 2017
Copyright 2000 – 2017 Zeal LLC (www.ZealLLC.com)
If you would like to receive our free newsletter via email, simply enter your email address below & click subscribe.
 Follow us on Twitter
 Become our facebook fan
CONNECT WITH US
Tweets
Tweet with hash tag #miningfeeds or @miningfeeds and your tweets will be displayed across this site.
MOST ACTIVE MINING STOCKS
Daily Gainers
 CMC Metals Ltd. CMC Metals Ltd. |
CMB.V | +900.00% |
 Eden Energy Ltd Eden Energy Ltd |
EDE.AX | +200.00% |
| GoviEx Uranium Inc. |
GXU.V | +42.86% |
| Eagle Nickel Ltd. |
ENL.AX | +41.67% |
| Citigold Corp. Limited |
CTO.AX | +33.33% |
| Mount Burgess Mining NL |
MTB.AX | +33.33% |
| Exalt Resources Limited |
ERD.AX | +31.94% |
| Casa Minerals Inc. |
CASA.V | +30.00% |
| Cariboo Rose Resources Ltd |
CRB.V | +28.57% |
| Belmont Resources Inc. |
BEA.V | +28.57% |


