Typically, main stream banks are late to the party when it comes to coverage of early stage companies because these companies still present risk to conservative investors. However, since we are in the early innings of the new blockchain/cryptocurrency economy that is here to stay, firms are starting to look at companies that have adopted the new model early.
One such company is HIVE Technologies Ltd. (TSX-V: HIVE) which listed preceding the huge upswing in bitcoin prices that has attracted analysts’ attention and which presents a compelling opportunity to invest in the new sector.
On Monday, GMP Richardson Securities analyst Deepak Kaushal, P.Eng., CFA initiated coverage of HIVE with a “spec buy” recommendation.
Mr. Kaushal notes that HIVE offers investors a unique exposure to the emerging blockchain sector with a competitive advantage, high growth, free cash flow, attractive return on capital and exposure to diversification in the cryptocurrency space.
The investment thesis presented by Kaushal is that blockchain technology enables new decentralized economic systems that will profoundly change the nature of monetary transactions and will become critical to the global economy.
“For investors, we see a new, high-risk high-reward sector that has low correlation to other investment classes. We see miners as essential infrastructure providers for blockchain networks that can build diversified portfolios of cryptocurrencies at attractive returns on-investment. Today miners are accelerating investment to capture cryptocurrencies as early as possible, to maximize the potential for value appreciation. Over the long term, we believe miners will become utility-like in their risk-return profile, as blockchain networks mature and cryptocurrency spot price volatility stabilizes. We think miners are a good option for new investors to the sector given the potential for diversification to mitigate company and application-specific risk.”
He set a price target of $5.35.
Secondly, PI Financial analyst David Kwan also initiated coverage noting that HIVE is well positioned to outperform its peers. Mr. Kwan recommended the Vancouver-based firm with a “buy” rating.
The analyst cited Hive’s low-cost operations in stable jurisdictions and its partnership with cryptocurrency miner Genesis Mining Ltd. which brings a “key competitive advantage.”
“HIVE is leveraging Genesis’ extensive cryptocurrency mining experience and expertise as well as benefiting from cheap power costs, access to leading edge technologies, and lower operating and equipment costs amongst other things… Genesis owns over 25 percent of HIVE and has two representatives on the Board. We believe Genesis has a strong financial incentive to make HIVE a success.”
However, he warned that investing in the cryptocurrency and blockchain sector remains a risky proposition because of the volatility seen in cryptocurrencies and share prices of companies in the sector. He expects regulatory uncertainty and creep to be a problem in the near term.
However, Mr. Kwan is optimistic because Hive stands out in the space. “Some of the key attributes of a successful miner are cheap power, a cool climate…With operations in Iceland and Sweden and its partnership with Genesis, we believe HIVE checks all of these boxes and will be one of the lower cost miners, enabling them to generate stronger margins and cash flow in the good times and better weather the down times.”
The analyst set a price target of $5.25.
As of the close on Tuesday Jan. 30, 2017, shares in HIVE could be purchased for $2.60.
Technically and fundamentally, gold is poised to resume its magnificent rally that is taking investors into what I call a “bull era”.
The next FOMC meeting announcement is tomorrow. I expect the Fed to strongly signal more rate hikes and ramped up quantitative easing.There’s an outside chance that bank deregulation is addressed, but that’s likely going to happen in the next meeting.
Regardless, everything the Fed is doing is positive for inflation, negative for government bonds, and negative for the dollar.
Please click here now. Nothing is more terrifying to institutional bond market analysts than the prospect of significant inflation.
The US government is on the ropes. Rates are rising, QT is creating bond market liquidation, and wages are starting to surge. The inability of the US government to finance itself in an inflationary environment means rate hikes and QT are negative for both the bond market and the dollar.
Please click here now. Double-click to enlarge this key short term gold chart.
Even though gold has rallied more than $100 an ounce in a very short time frame, the pullback action is very positive. It’s taking the shape of a small positive wedge formation. Solid Chinese New Year demand is likely behind the positive nature of this soft pullback. Global gold investors should be buyers at $1328, $1310, and $1300, with a bigger focus on gold stocks than bullion.
During deflationary times, bullion is the leader.During the inflationary times that are beginning now, mining stocks are poised to dramatically outperform bullion.
Global growth with inflation and the end for the great global bond market should create at least a decade of gold stock outperformance against gold. These stocks are essentially poised to enter a period of growth much like Main Street America experienced in the 1950s.
While all the current news is very positive for gold market investors, the best news of all may be coming on Thursday. Please click here now. On Thursday, India’s national budget is announced and a duty cut may finally happen!
Gold’s uptrend against US government fiat ended in 2011 – 2012 as India began increasing the import duty aggressively. This essentially put millions of jewellery workers on the bread line and shuttered hundreds of thousands of small jewellery shops.
The bottom line is that Indian government duty hikes basically nuked Western gold mining stock enthusiasts and put the survivors in a horrifying gulag.
For the past several years, jewellers have begged the government to begin reducing the duty. Unfortunately, the government has shown no interest in announcing even a tiny cut.
Until now. While the commerce department has called for a duty cut for years, this is first time the all-powerful finance department has addressed the issue in a positive way. So, a cut on Thursday is not a “done deal”, but the odds of it happening are now vastly higher than at any time since the import duty peaked at 10% in 2013.
Jewellers and dealers are not buying gold in any size now, because they are anticipating the government will finally give them a cut. That’s created some gold price softness over the past week. I’ve suggested that a duty cut could be the catalyst that blasts gold over the $1370 area highs. In turn, that would usher in the start of a rally to massive resistance at $1500.
For gold, a duty cut in India has truly gargantuan ramifications. It is the equivalent of a corporate tax cut in America. It restores confidence amongst citizens and shows that the government understands not just sticks, but carrots. When citizens feel good they are more productive. GDP grows, bringing the government more tax revenues. Thursday could be a truly epic win-win day for gold and all its global stakeholders. Are investors prepared?
Please click here now.Institutional money managers are starting to see the myriad of inflationary lights flashing that I predicted were coming.
Money velocity is starting to rise. The upturn is subtle, but it’s there! As Powell takes over the Fed and ramps up QT, I expect money velocity to surge aggressively from the 60-year lows that it sits at now. As this happens, gold stocks should essentially “run rickshaw” over bullion.
Also, key Chinese gold mining stocks that I use (and own) as key lead indicators for Western miners are staging what can only be described as massive long term chart breakouts.
Please click here now. Double-click to enlarge this GDX chart.
In the summer of 2017, I outlined the $23 – $18 price zone as a key buying area for all gold stock enthusiasts. Investors who took my recommendation are looking good now.
Note the return line that I’ve highlighted on the chart. The price is almost there now. Solid rallies often begin from these technical return lines.
Chinese “Golden Week” holidays begin around Valentine’s Day. That’s still two weeks away. Gold markets close for a week, and the price usually softens. The jobs report is this Friday. Gold typically rallies in the days following the report. A duty cut, gold-positive statements from the Fed, and post jobs report market strength could see GDX reach my $25 – $26 target by Valentine’s Day.
From there a significant market correction would be expected, followed by a major surge to multi-year highs. Please click here now. Double-click to enlarge this GDX weekly chart. In 2018, GDX should surge out of the significant symmetrical triangle that I’ve highlighted. With powerful institutions buying, it should easily reach my $30 – $32 target zone. Gold stocks investors are basically sitting on an inflation-themed money train that the Fed is going to turbocharge with rate hikes, QT, and bank deregulation. All aboard!
Stewart Thomson is a retired Merrill Lynch broker. Stewart writes the Graceland Updates daily between 4am-7am. They are sent out around 8am-9am. The newsletter is attractively priced and the format is a unique numbered point form. Giving clarity of each point and saving valuable reading time.
Risks, Disclaimers, Legal
Stewart Thomson is no longer an investment advisor. The information provided by Stewart and Graceland Updates is for general information purposes only. Before taking any action on any investment, it is imperative that you consult with multiple properly licensed, experienced and qualified investment advisors and get numerous opinions before taking any action. Your minimum risk on any investment in the world is: 100% loss of all your money. You may be taking or preparing to take leveraged positions in investments and not know it, exposing yourself to unlimited risks. This is highly concerning if you are an investor in any derivatives products. There is an approx $700 trillion OTC Derivatives Iceberg with a tiny portion written off officially. The bottom line:
Are You Prepared?
If a week is a long time in politics, six months is an age in a public company. And as 2017 Full Year Production Results & 2018 Guidance is published today, ordinary shareholders at Petropavlovsk (LSE: POG) may be beginning to question if the intentions behind last year’s messy coup were entirely honest.
To recap: after an astonishing 20-year run at Petropavlovsk, in which veteran gold-bug Peter Hambro weathered the storms of a collapsing gold price and an increasingly impatient shareholder base, the City mainstay finally returned the company to its first profit in January 2017. Shortly thereafter, he was booted out of his own company by a rag-tag bunch of mining dilettantes, with distressed debt funds Sothic and M&G playing monkey, and Renova Group grinding the sorry organ.
We covered each twist and turn of the dispute here at Mining Feeds, exploring the real intentions of Renova Group, the rumours surrounding dormant assets in their portfolio and the toothless City Takeover Panel that wouldn’t know a takeover by stealth if it slapped them in the chops. Shrugging off allegations of impropriety, the repeated justification for the brazen coup, parroted by all three activist shareholders, was that ‘corporate governance’ issues had fallen short of the mark at Petropavlovsk under the leadership of Messrs Hambro and Maslovskiy. A justification made early and repeated often.
Speaking to the Financial Times, City AM, The Times and Reuters, M&G and Sothic repeatedly criticised corporate governance failings at Petropavlovsk and called for greater transparency at board level. [1], [2] Shareholders took them at their word and at the company’s AGM, the old board were fired. Not that a single one of the new Directors turned up to grab the baton, of course. So, it has now been seven months since they took over: how are shareholders being rewarded?
In short, they’re not.
The first act of the new board was to claim credit for Petropavlovsk’s best results: a 166% lead in H1 profits, a 150% increase in net cash from active operations and a 20% boost to sales. The trouble was, the ‘strong set’ of results praised by new Chairman Ian Ashby were solely due to the efforts of the outgoing board. As Alistair Osborne in The Times of London concluded at the time, perhaps the intentions of the insurgents weren’t quite as honourable as claimed. “Corporate governance? Yeah, right.” [3]
Shortly afterwards, Renova Group promptly sold up their controlling stake in Petropavlovsk to an interesting entrepreneur from Kazakhstan. So, having kicked up a shareholder storm at Petropavlovsk, stacked the board with a bunch of directors who don’t know the first thing about mining and given next-to-no indication of how they intended to grow the company they’d fought so hard to control, Renova cut and ran. Exemplary corporate governance…
Kenes Rakishev, the Kazakh businessman who bought Renova’s stake, fortunately has quite a bit of experience in mining having been a part of Central Asia Metals Plc (AIM:CAML), a copper, zinc and lead production and exploration company, for several years.[4]
But in fairness to the new board at Petropavlovsk, they are nothing if not consistent. Not content with claiming credit for the company’s first profits since 2015, they promptly pushed the company back into worrying territory with a sorry set of H2 production results. Announcing with some aplomb that the company had boosted production by as much as 10%, Ian Ashby failed to note that the company’s H2 production results were a whole 11% lower than the impressive results of the first half of 2017.[5] So, a downturn in fortunes presented as cause for celebration? The new board is fast being characterised by new standards for deceit, not transparency.
So, what good news can come of the mess? Well, in interviews given to Reuters, The Daily Telegraph and the Financial Times, new investor Kenes Rakishev has proposed bringing back some of the top team responsible for the recovery at Petropavlovsk. Ahead of a visit to London to meet shareholders earlier this month, Rakishev told reporters of his wish to reinstate former CEO, Pavel Maslovskiy.[6] And to boot, his wishes for the company have already attracted plaudits from industry influencers, with Investors Chronicle praising Rakishev’s ‘conviction bet’ for possible rebranding and M&A action.[7]
The loyalty of Petropavlovsk’s ordinary shareholders has hardly been rewarded by the activism of its majority owners in the past 12 months, and that will sting. Rakishev is an exciting new prospect for Petropavlovsk’s fortunes, and we will be watching his next steps at the company with hopeful anticipation.
Gold and gold stocks have enjoyed an excellent rebound since their December lows. Over the past six weeks Gold rebounded from a low of $1238 all the way to $1365 in recent days. The miners meanwhile rebounded nearly 18% (GDX) and 21% (GDXJ). However, these markets are approaching important resistance levels and at a time when sentiment is becoming stretched and the US Dollar has become very oversold.
Take a look at the charts of Gold, GDX and GDXJ. Gold has reached the September 2017 highs while GDX came within 2%-3%. GDXJ is lagging but came within less than 5%. Another round of buying over a few days should be enough to push the miners to resistance.
Recent strength in Gold and gold stocks is mostly due to weakness in the US Dollar which is very oversold and approaching important support. On Friday, the US Dollar Index touched 88, which marks the 2009 and 2010 peaks and is the only real support between the low 80s and the low 90s. We also plot Gold against foreign currencies (Gold/FC) which tells if Gold is rising in real terms or if its rising due to the US Dollar weakness. Gold/FC failed to break above key resistance. That signals that over the short-term, Gold would be vulnerable to a bounce in the US Dollar.
Some sentiment indicators suggest the rebound in precious metals could be in its later innings. Thursday the daily sentiment index for Gold hit 91% bulls. Friday, the daily sentiment index for the greenback hit 10% bulls. The CoT’s are not as extreme. Gold’s net speculative position (relative to open interest) is 40% bulls. The 2011, 2012 and 2016 peaks were around 55% bulls. Meanwhile, Silver’s net speculative position is at 26% bulls.
Gold and gold stocks have enjoyed a great rebound since the Fed rate hike but technicals and sentiment suggest they are due for a pause or correction. The miners and Gold are very close to the resistance levels we noted in a recent editorial. Recent strength has been driven mostly by weakness in the US Dollar which is very oversold and testing support. Meanwhile, the daily sentiment index has reached short-term extremes for Gold and the greenback. The odds appear to favor a pause in this rebound or a short-term correction. That is great news for anyone who missed the rally as it would setup a decent buying opportunity before a major breakout. We continue to seek the juniors that are trading at reasonable values but have fundamental and technical catalysts that will drive increased buying. To follow our guidance and learn our favorite juniors for 2018, consider learning more about our premium service.
Gold’s strong upleg accelerated this week, powering to major new breakout highs. Speculators rushed to buy gold futures following surprising weak-dollar comments from the US Treasury Secretary, which hit the US dollar hard. That boosted gold to critical technical levels that should really intensify the shift back to bullish psychology. This mounting gold breakout confirms gold’s bull market is very much alive and well.
While this week’s surge put gold on many more traders’ radars, it has actually been picking up steam for 6 weeks now. Gold’s latest major interim low of $1242 came a couple days before the Fed’s latest rate hike in mid-December. The gold-futures speculators who dominate this metal’s short-term price action have always had a deep and irrational fear of Fed rate hikes. Historically gold has thrived in rate-hike cycles!
Leading into that fifth rate hike of this current cycle, these hyper-leveraged traders aggressively dumped longs and ramped shorts at record levels. That battered gold lower while exhausting potential selling. So once the Fed hiked as expected, and didn’t up its 2018 rate-hike forecast from the prior quarter’s three more, these excessively-bearish traders started buying back in. This pattern was seen around past rate hikes.
So two trading days after this latest rate hike when gold was still at $1256, I published an essay outlining why that hike was so bullish for gold. It concluded, “…Fed rate hikes are bullish for gold, and this week’s is no exception… After each past December rate hike which gold-futures speculators sold aggressively into, gold dramatically surged in the subsequent months.” And that’s indeed exactly what happened since.
By the final trading day of 2017 gold had already surged 4.9% out of its pre-rate-hike interim low. Those strong gains continued in this young new year despite these extreme mania stock markets retarding gold investment demand. By this Tuesday, gold’s new upleg extended to an 8.0% gain over nearly 6 weeks. Since the Fed’s rate hike, gold had rallied on 19 out of 27 trading days. Upleg momentum was already building.
Every January the ultra-exclusive World Economic Forum is held in Davos, Switzerland. It attracts the world’s most powerful people, from CEOs to top political leaders to billionaires. The financial media flocks to the Swiss Alps to interview these leading movers and shakers. One of this year’s attendees is Steven Mnuchin, Trump’s Treasury Secretary. He gave an interview in Davos which shocked currency traders.
Mnuchin told reporters, “Obviously a weaker dollar is good for us as it relates to trade and opportunities.” That’s certainly true, as it’s easier for American companies to export around the world when their goods are less expensive due to a lower dollar. But Treasury secretaries have a long tradition of never saying anything about the dollar beyond that they “support a strong-dollar policy”. So Mnuchin’s candor was unexpected.
Mnuchin had made similar comments last year that didn’t affect markets as much. But the combination of this past year’s strong dollar downtrend and a couple more developments that day triggered big US dollar selling. The US had just slapped tariffs on imported solar panels and washing machines hours earlier. Trump’s Commerce Secretary Wilbur Ross spoke alongside Mnuchin at that Davos conference.
Ross warned more trade measures were coming. When asked about trade wars he replied, “Trade wars are fought every single day… So a trade war has been in place for quite a little while, the difference is the US troops are now coming to the rampart.” There’s no more efficient way to boost exports and execute trade wars than jawboning the local currency lower. All this together really struck home for currency traders.
So the US Dollar Index plunged 1.0% on Wednesday following those comments, hitting its worst levels in 3.1 years. Incidentally this past year’s dollar weakness shouldn’t have surprised anyone. Back in late December 2016 when dollar euphoria reigned as the USDX traded at a 14.0-year secular high, I wrote an essay on the unsustainability of those extremes. I warned of “a major topping underway” before a new bear.
With the USDX failing below 90 on those Mnuchin and Ross comments, speculators started flooding into gold futures. After closing near $1341 in US trading Tuesday, gold surged as high as $1352 in overnight action. Those gains extended in the US on Wednesday, with gold blasting up 1.3% to $1358. That was a very important level technically and psychologically, confirming gold’s forgotten bull market is alive and well.
This chart looks at this young gold bull superimposed over speculators’ collective positions in both long and short gold-futures contracts. The Fed’s five rate hikes of this tightening cycle are also highlighted, showing how bullish they’ve proven for gold. This week’s $1358 gold levels are a major upleg breakout, and right on the verge of being a major bull-market breakout. Investors will certainly take notice of this.
Gold’s bull was born in despair in December 2015 the day after the Fed’s first rate hike in 9.5 years. The gold-futures speculators had freaked out leading into that FOMC meeting, fleeing longs while rushing to add shorts. That hammered gold to a 6.1-year secular low. Just a few trading days before that hike when gold was despised, I published deep research showing how gold thrived during past Fed-rate-hike cycles.
Futures speculators were betting the other way, expecting gold to collapse once the Fed ended ZIRP. It didn’t take them long to realize the error in their ways though, as they quickly started buying to cover their excessive shorts while flooding into new longs with a vengeance. So gold soared 29.9% higher over the next 6.7 months, well exceeding the +20% new-bull threshold! That initial bull upleg peaked at $1365 in July 2016.
After such a blistering run, gold needed to take a breather and consolidated high for over a quarter. But that rolled over into a severe correction on two separate events. First gold-futures stops were run which blasted this metal back down to its 200-day moving average. After that gold bounced sharply, but that was truncated by Trump’s surprise election win in early November 2016. That unleashed epic Trumphoria.
Stock markets surged on hopes for big tax cuts soon from the newly-Republican-controlled government. That led futures speculators and investors alike to flee gold, crushing it sharply lower. By mid-December 2016 the day after the Fed’s second rate hike of this cycle, gold had plunged 17.3% to $1128. That was not a new bear though, as it fell shy of the necessary 20% loss. But psychologically it may as well have been!
That exceedingly-anomalous gold plunge in late 2016 mostly driven by the post-election stock-market surge wreaked tremendous sentiment damage. The investors who started getting excited about gold in the first half of 2016 abandoned it, assuming that sharp rally was a flash in the pan. And with the stock markets powering relentlessly higher all throughout 2017 on taxphoria, gold receded into the market shadows.
A couple weeks ago I wrote an essay delving into the selloff dynamics between stock markets and gold. Gold is a unique asset that tends to rally when stock markets sell off materially, making it the ultimate portfolio diversifier. Thus investors tend to view it as the anti-stock trade. It was actually the last stock-market correction in early 2016 that fueled gold’s powerful upleg early that year. Stocks greatly affect gold.
While gold can still rally when stock markets happen to be climbing, investors simply feel no need to diversify their stock-heavy portfolios. So they largely forget gold. Thus gold sentiment for much of 2017 remained nearly as bearish as at those deep late-2016 lows. Investors remembered gold spiraling lower after the election, and that continued to shape their opinions and outlooks on gold regardless of price action.
Gold actually fared really well in 2017 considering the extreme stock-market rally. Last year gold still powered 13.2% higher, very impressive considering the concurrent huge 19.4% S&P 500 surge! This gold bull’s second upleg enjoyed a 19.5% gain over 8.7 months leading into early September. Gold was able to peak at $1348 before that upleg failed after stock markets surged again following a new wave of taxphoria.
Even though gold never entered a bear market, that interim-high level was problematic for sentiment. While close, September 2017’s $1348 remained decisively below July 2016’s $1365. For key technical levels I consider decisive to be 1% beyond the previous extreme. So even though a 19.5% gold upleg is nothing to sneeze at, especially in extremely-euphoric stock markets, it wasn’t enough to change psychology.
Without a new bull-market high, gold stayed out of the financial-news headlines. The investors that had fled this leading alternative investment in the wake of Trump’s election win saw nothing to get gold back on their radars. The legions of gold bears could argue that the secondary lower top confirmed gold was in a downtrend. Technical analysis is something of a Rorschach test, often reflecting analysts’ own biases.
That gold bearishness really intensified heading into this latest Fed rate hike in December 2017. As that month dawned, it had been 16.8 months since gold’s initial bull-market high. Gold’s chance to break out a few months earlier had failed. So as you can see above, gold-futures speculators fled in terror from long positions while also ramping shorts. This latest gold-futures liquidation hit all-time record highs.
Gold-futures speculators’ collective positions are reported once a week in the CFTC’s Commitments of Traders reports. They are current to each Tuesday. In the CoT week ending December 12th on the eve of the Fed’s fifth rate hike of this cycle, speculators dumped an astounding 49.9k long contracts while adding 20.5k new short ones! That was the largest selling on record out of 989 CoT weeks since early 1999!
These traders’ collective bets had run to such hyper-bearish extremes that they had to mean revert after whatever the FOMC did in mid-December. And that has indeed happened. But as long as gold prices just meander within that giant trading range established in the first half of 2016, it will be difficult to shift psychology back to bullish. This week’s strong gold surge on that dollar weakness is starting to change that.
Gold’s $1358 close in US trading Wednesday was 0.7% above its early-September peak. While not quite at that 1%+ threshold for a decisive breakout yet, this is still a major higher high. Gold has been carving higher lows periodically ever since late 2016 when that post-election selloff exhausted itself. But higher lows don’t spark excitement outside of existing gold investors, higher highs are necessary for that.
Gold needs to close over $1361 to see a decisive breakout above the last upleg’s peak. It has traded above that level intraday in both Asian and American trading since Wednesday’s close. It’s only a matter of time until $1361+ sticks on a closing basis. That’s going to finally confirm higher highs to go along with the past 13.3 months’ higher lows. But the real prize remains a decisive breakout to new bull highs.
The new gold bull again peaked at $1365 in early July 2016 within a couple weeks of the UK’s Brexit vote. That unexpected outcome of the British people voting to take back their sovereignty from the unaccountable European Union bureaucrats was such a shock to the markets that major central banks rushed to declare they were ready to print money if necessary. Stocks rallied sharply on hopes for more easing.
The S&P 500 had been drifting sideways to lower without a single new bull-market high for 13.7 months before that. Gold $1365 in July 2016 happened the very trading day before the S&P 500 finally climbed to its first new record high. With stock markets apparently off to the races again, gold demand waned as investors weren’t interested in diversifying. A single close above $1365 will finally confirm gold’s bull persists!
But if gold just touches those bull-to-date highs and fades, bearish technical analysts can easily dismiss it as a double or triple top. In order for gold to garner financial-media attention and attract investors’ gazes back to it, a decisively 1%+ breakout is necessary. That happens at $1379. Gold is so close to a major upside breakout to new bull highs, which will conclusively prove to all investors its current bull market still lives.
That will really start shifting psychology away from the overwhelmingly-bearish levels it’s been stuck at since late 2016. In a normal year gold’s strong 2017 rally would’ve gone a long way to restore bullish sentiment. But again gold was overshadowed last year by the extreme stock-market surge, which stole all the limelight. The blind spot investors harbor for gold will start fading when new bull-market highs are seen.
The exact timing is unknowable and not really important. Gold could power over $1379 within days, or it might take weeks. Investment gold buying will flare again really boosting gold once these extremely-euphoric mania-blowoff stock markets finally roll over. Stock selloffs are great for gold, and even a minor one will easily catapult it to decisive new bull highs. That will dispel the fog of bearishness plaguing gold.
$1400+ gold may seem high after a multi-year bear market followed by a couple years of drifting low in this stock-market-surge-interrupted bull market, but it’s really not. Gold first climbed above $1400 in November 2010 and largely stayed there until June 2013. Over that 2.6-year span gold averaged $1595! And it went as high as $1894 in August 2011. Gold is nowhere near historical extremes, still relatively low.
At best gold’s young bull was only up 29.9% over 6.7 months by mid-2016. That’s trivial as far as gold bulls go, a rounding error. During gold’s last secular bull between April 2001 to August 2011, gold soared 638.2% higher in 10.4 years! Today’s young gold bull would still be tiny even if it saw gold doubled, taking it to $2102. That would still be well below gold’s inflation-adjusted real high from January 1980.
As I’ve been arguing continuously since late 2016, this young gold bull ain’t over yet! Major central banks around the world have conjured many trillions of dollars out of thin air which have levitated world stock markets. That really depressed gold demand. But once these QE-bloated markets inevitably roll over on this year’s new Fed and ECB tightening, a record flood of flight capital will likely seek the ultimate hedge of gold.
Investors can play gold’s ongoing mean-reversion bull in physical gold bullion or the leading GLD SPDR Gold Shares gold ETF. But the coming gold gains will be really amplified by the gold miners’ stocks. As gold rises, gold miners’ profits grow much faster. Thus major gold-stock prices usually leverage gold’s upside by 2x to 3x. Smaller gold miners can double that again. Gold stocks yield life-changing gains in gold bulls.
In essentially the same span of that last gold bull ending in late 2011, the HUI gold-stock index rocketed 1664.4% higher! Last week I wrote an essay explaining why the parallel flagship GDX VanEck Vectors Gold Miners ETF was on the verge of a major $25 upside breakout on strong earnings potential. There’s no doubt investors will flood into gold stocks as gold psychology changes, ultimately driving incredible gains.
While every investor needs to have a 5%-to-10%+ portfolio allocation to gold for diversification purposes, great gold stocks should be added on top of that. The beaten-down and left-for-dead gold miners’ stocks are deeply undervalued today with gold still out of favor. This is the only sector in all the stock markets likely to power much higher when everything else heads lower. Great gold stocks are essential to own today!
At Zeal we’ve literally spent tens of thousands of hours researching individual gold stocks and markets, so we can better decide what to trade and when. As of the end of Q4, this has resulted in 983 stock trades recommended in real-time to our newsletter subscribers since 2001. Fighting the crowd to buy low and sell high is very profitable, as all these trades averaged stellar annualized realized gains of +20.2%!
The key to this success is staying informed and being contrarian. That means buying low before others figure it out, before gold’s bull-market breakout becomes apparent. An easy way to keep abreast is through our acclaimed weekly and monthly newsletters. They draw on my vast experience, knowledge, wisdom, and ongoing research to explain what’s going on in the markets, why, and how to trade them with specific stocks. For only $12 per issue, you can learn to think, trade, and thrive like contrarians. Subscribe today, and get deployed in the great gold and silver stocks in our full trading books!
The bottom line is this gold bull’s third upleg is breaking out. This week gold closed above the peak from its second upleg, and is close to a decisive breakout. That puts gold within spitting distance of its bull-to-date high of $1365 from July 2016. Once gold powers decisively above those levels, it will confirm to all that gold’s bull is very much alive and well. That will work wonders to shift psychology back to bullish again.
Impressively gold is doing all this with stock markets still at mania-blowoff record highs. Gold investment demand explodes once stock markets roll over, which is what ignited and fueled this gold bull’s strong initial upleg in early 2016. So when the long-overdue and inevitable material stock-market selling finally arrives, gold’s advance will really accelerate. Get long before this major bull-market breakout changes everything!
The following interview of CEO Brett Heath of Metalla Royalty & Streaming (CSE: MTA) / (OTCQB: MTAFF), was conducted by phone & email over the 3-day period ended January 21st. Metalla is a well-run, rapidly growing, precious metals Royalty & Streaming company that is relatively unknown. The Company’s tried and true business model typically commands a premium market valuation, led by industry darlings like Franco-Nevada (TSX-V: FNV) / (NYSE: FNV), Royal Gold (NYSE: RGLD) and Wheaton Precious Metals (NYSE: WPM).
Management believes its valuation is meaningfully lower than its peers. According to YahooFinance; peers are trading at an average trailing 12 months EV/EBITDA ratio of 30.0x (25.2x excluding Osisko’s elevated 54.0x ratio), and an average EV/Revenue ratio of 17.3x. By contrast, Metalla’s anticipated [FY 2018 ending May 31, 2018] EV/EBITDA metric is just 8.4x — a 72% discount(8.4x vs. 30.0x) to its peer group.
CEO Brett Heath commented in the interview that EBITDA for FY 2019, (ending May 31, 2019), could be ~C$8-$10 Mbased only on existing assets in the portfolio, meaning that the 2019 EV/EBITDA ratio might be as low as ~6.5x. Pro forma for prospective new royalty/streaming acquisitions, Heath thinks EBITDA could be running at “well above”C$10 M by next year. Management expects at least 4 new deals in 2018.
At some point this year, or in my opinion by early 2019 at the latest, investors will have enough demonstrated cash flow and dividend history — and visibility towards future cash flows — to warrant a higher EV/EBITDA valuation. How much higher remains to be seen, but cutting the discount from 72% from to 40%(from and EV/EBITDA ratio of 8.4x to 18.0x) would allow for a doubling in Metalla’s share price.
Here’s my interview with Brett.
I received my first (monthly) dividend check in the mail… Thanks! What can you tell us about the dividend program moving forward this year?
We are very excited to have accomplished this important milestone early on as a company. The power of compounding dividends over time is significant when looking at total return. We expect to continue to raise the dividend this year until we reach 50% of after tax and G&A cash flow. Based on our last quarter, that has the potential to get to C$0.003/month(from C$0.001/month).
That might not sound like a lot, but it would be a 5.0%dividend yield —(all else equal, assuming no new share issuance for acquisitions) — based on the current C$0.72 share price. That would be triple the next highest yield in the precious metals royalty & streaming sector. NOTE: {Wheaton Precious Metals (NYSE: WPM) is yielding 1.62%}.
The board will meet quarterly to adjust the dividend based on silver & gold prices and the operating performance of mines that we have royalties or streams on. We started with a low dividend rate to maintain a strong balance sheet to facilitate upcoming transactions.
Please update readers on potential acquisitions of new royalty & streaming assets, are you close on anything?
Yes, we are working on some very exciting deals and hope to close at least 4 transactions this year.
Metalla’s cash flow is heavily weighted towards silver, will it remain that way, or do you expect cash flow from gold assets to even things out?
Good question. It just so happens we are overweight silver vs. gold by virtue of executing on the best available deals at the time. We do expect gold assets to fill in as we complete more transactions. That being said, we will be heavily weighted towards silver over the next couple of years. Silver often outperforms gold in bull markets, so we are very comfortable with our positioning.
Investors have been waiting months for Metalla to be up-listed to the TSX Venture exchange. Why is it taking so long?
We are very close. I can assure you that it has been as frustrating for management as it has been for shareholders and prospective investors. A lot of it has been out of our control unfortunately, but it remains a priority and we will be a tier 1 issuer. Given the growth profile of the Company, we will be evaluating a U.S. listing as early as next year.
In December, your team provided an update on its 2% on the NSR Joaquin project. Tell us about Joaquin and explain the update’s significance?
This was a great update for Metalla shareholders. Pan American Silver is allocating $40 M to develop Joaquin with production starting in 2019. What this means is Metalla will have another top tier counter-party in the producer category. The mine plan is only based on one high-grade zone of the overall deposit. This asset will most likely cash flow to Metalla for many years. Our suspicion is that if we see higher silver prices, Pan American is likely to scale up the production profile.
What is your team’s latest estimate of cash flow for the fiscal year ending May 31, 2018? How should investors think about next year’s cash flow?
We are on track to hit our goal of CAD $6 M in operating cash flow for FY 2018 (ending May 31, 2018). First quarter (FY 2018) production was lower due to the ramp up of the Endeavor mine. We haven’t given formal guidance on FY 2019 yet, but internal estimates are looking to be in the CAD $7M – $9M range. That’s not including any new deals. With the addition of new transactions, our goal is to reach an annualized rate well north of CAD $10 M within the next 12 months.
Is Metalla paying any cash taxes? Or, are you benefiting from historical operating losses to offset earnings?
Unlike more established industry leaders like Franco-Nevada, Wheaton Precious Metals and Royal Gold, we don’t expect to pay any cash taxes for several years. This will support our dividend paying ability.
A slide in your corporate presentation shows how Metalla stacks up against its peers. Can you talk about that?
Yes, we are relatively unknown to investors, which might be why our valuation appears cheap compared to peers. Our FY 2018 cash flow estimate, plus ~C$1 M in “G&A,” is ~C$ 7 M in EBITDA. Our EV (market cap + debt – cash) is roughly C$ 59 M (we have ~C$ 3 M in cash & ~C$ 8.5 M of low coupon, unsecured convertible debt owned by our largest shareholder Coeur Mining). That gives us an EV/EBITDA ratio of about 8 and a half, compared to well over 20x for our peer group.
Admittedly, part of our valuation discount is probably warranted– we are a new company with a less proven track record, and we are under-followed, for example we don’t have any sell-side research coverage. But, as we grow, we believe our valuation gap will close, perhaps by a lot.
Thanks Brett. It sounds like the story is poised to gain traction with a Tier I TSX-V listing right around the corner, new acquisitions, a rising dividend payout and a cheap valuation. I look forward to updates on Metalla Royalty & Streaming (CSE: MTA) / (OTCQB: MTAFF) in the weeks and months to come.
Disclosures: The content of this interview is for illustrative and informational purposes only. Readers fully understand and agree that nothing contained herein, written by Peter Epstein of Epstein Research, [ER] including but not limited to, commentary, opinions, views, assumptions, reported facts, estimates, calculations, etc. is to be considered implicit or explicit, investment advice. Further, nothing contained herein is a recommendation or solicitation to buy or sell any security. Mr. Epstein and [ER] are not responsible for investment actions taken by the reader. Mr. Epstein and [ER] have never been, and are not currently, a registered or licensed financial advisor or broker/dealer, investment advisor, stockbroker, trader, money manager, compliance or legal officer, and they do not perform market making activities. Mr. Epstein and [ER] are not directly employed by any company, group, organization, party or person. Shares of Metalla Royalty are speculative, not suitable for all investors. Readers understand and agree that investments in small cap stocks can result in a 100% loss of invested funds. It is assumed and agreed upon by readers that they consult with their own licensed or registered financial advisors before making investment decisions.
At the time this article was posted, Peter Epstein owned shares in Metalla Royalty and the Company was an advertiser on [ER]. By virtue of ownership of the Company’s shares and it being an advertiser on [ER], Peter Epstein is biased in his views on the Company.Readers understand and agree that they must conduct their own research, above and beyond reading this article. While the author believes he’s diligent in screening out companies that are unattractive investment opportunities, he cannot guarantee that his efforts will (or have been) successful. Mr. Epstein & [ER] are not responsible for any perceived, or actual, errors including, but not limited to, commentary, opinions, views, assumptions, reported facts & financial calculations, or for the completeness of this article. Mr. Epstein & [ER] are not expected or required to subsequently follow or cover events & news, or write about any particular company or topic. Mr. Epstein and [ER] are not experts in any company, industry sector or investment topic.
The good news for gold keeps flowing, with institutions around the world stepping up to the buy window ever-more frequently.
They are clearly embracing gold as a key portfolio holding for the long term.The bottom line: institutional respect for gold as a portfolio diversifier has never been stronger than it is right now.
On that exciting note, please click here now. Standard Chartered bank carries serious institutional weight. Their gold market analysis projects a surge to five-year highs. This kind of positive analysis that continues to emanate from major banks is bringing more institutions into gold.
Please click here now. Germans are now the most aggressive gold buyers in Europe.
While SPDR fund buying was soft in 2017, German institutions bought about 50 tons of gold… in just one physically backed gold fund! Deutsche Boerse reports that family offices and individuals are starting to join institutions on the buy. I expect record demand in Germany in 2018.
I’ve predicted that Trump would unveil inflationary tariffs in America, and that’s in play as of this morning. Please click here now. I’ve coined the term “Trumpflation” to describe what is coming, and what is coming is very positive for gold.
Trump sees a huge cash cow for the government as solar energy becomes a gargantuan industry. The citizens get hit hard… unless they own a diversified portfolio of gold stocks!
I’ve also predicted a major partnership between blockchain and gold will emerge, creating a significant rise in global demand for the world’s greatest metal.
On that note, please click here now. Rob Martin is head of market infrastructure for the World Gold Council.
In this interview he does a great job in explaining how gold backed cryptocurrency tokens will be exempted from onerous government regulation on cryptocurrencies that are not backed with gold.
Please click here now. A tidal wave of tokenized gold, silver, and industrial metal offerings is coming. Are investors prepared?
The LBMA in London is prepared. The LBMA runs the world’s largest market for physical gold. This morning they announced they are considering employing blockchain technology to strengthen gold supply chain integrity.
If it happens, I expect markets in China, Dubai, and India to quickly follow the London leaders. Any action that increases the integrity of the supply chain increases institutional respect for the asset class. As noted, the good news for gold just keeps rolling!
Bitcoin itself has been soft since the CBOE five-coin futures contract was launched. Tom Lee was head of equities for JP Morgan and wisely sold stocks in 2016 after entering at the March 2009 lows.
Tom views the US stock market not as overvalued, but as fully valued. I see it as slightly overvalued, with real risk exceeding potential reward.
The similarities between today’s market and the market of 1929 are eerily similar. I don’t know if the market is poised for a repeat of that horrific past. I do know that when power players like Tom Lee call the market fully valued, it’s usually a good time to book some profits.
Regardless, Tom eagerly embraced bitcoin in 2016 and has never looked back. He’s a very calm and rational man whose views are widely followed in the institutional investor community. Tom says his team are “aggressive bitcoin buyers” in the $9000 area, with a five-year target of $125,000 per bitcoin.
My blockchain focus now is still bitcoin, but also the “alt coins”. I highlight the most exciting action for both with my www.gublockchain.com newsletter. My long term bitcoin target is a little higher than Tom’s ($500,000), but even at $30,000 most investors should be sporting a very big smile!
I expect the bitcoin price will likely remain soft until the CBOE futures expiry onFebruary 14. The $10,000 – $8,000 price area appears to represent very good value for new bitcoin investors.
Please click here now. Gold’s technical action is glorious.
A pennant breakout was immediately followed by flag-like action, and an upside breakout is in play this morning. Also, note the decent support zones I’ve highlighted at $1328, $1320, $1300, and $1270. In a negative scenario, these are all key buy zones.
Gold looks poised to take a major battering ram to the $1370 area highs that were created by Modi’s infamous cash call-in. A move above $1370 opens the door for a charge towards $1500!
Please click here now. GDX is starting to show some impressive technical action. New investors who are stop loss enthusiasts could use $22.90 as their maximum risk price. Others can employ put options if nervous.
Regardless, GDX appears to be poising for a charge to my $25 – $26 price area. I expect 2018 will be ultimately be remembered as the year gold stocks begin a long term bull cycle against bullion. I’m predicting that over the next five years they will go nose to nose with bitcoin, in the battle to be the performing asset class in the world!
Stewart Thomson is a retired Merrill Lynch broker. Stewart writes the Graceland Updates daily between 4am-7am. They are sent out around 8am-9am. The newsletter is attractively priced and the format is a unique numbered point form. Giving clarity of each point and saving valuable reading time.
Risks, Disclaimers, Legal
Stewart Thomson is no longer an investment advisor. The information provided by Stewart and Graceland Updates is for general information purposes only. Before taking any action on any investment, it is imperative that you consult with multiple properly licensed, experienced and qualified investment advisors and get numerous opinions before taking any action. Your minimum risk on any investment in the world is: 100% loss of all your money. You may be taking or preparing to take leveraged positions in investments and not know it, exposing yourself to unlimited risks. This is highly concerning if you are an investor in any derivatives products. There is an approx $700 trillion OTC Derivatives Iceberg with a tiny portion written off officially. The bottom line:
Are You Prepared?
The world’s leading gold-stock ETF is nearing a major upside breakout from key technical levels. GDX is getting closer to challenging and powering above $25. That would accelerate the sentiment shift in this deeply-undervalued sector back to bullish, enticing investors to return. Good operating results from the major gold miners in their upcoming Q4’17 earnings season could prove the catalyst to fuel this GDX $25 breakout.
The classic way to measure gold-stock-sector price action is with the HUI NYSE Arca Gold BUGS Index. But the HUI benchmark is being increasingly usurped by the GDX VanEck Vectors Gold Miners ETF as the gold-stock metric of choice. GDX is used far more often than the HUI in gold-stock analyses these days, both online and on financial television. I haven’t seen the HUI mentioned on CNBC for years now.
GDX does have major advantages over the HUI. Most importantly it is readily tradable as an ETF and with options. GDX’s component stocks and their weightings are also regularly updated by elite gold-stock analysts, keeping it current. The HUI is rarely if ever updated to reflect company-specific changes in the ranks of the world’s top gold miners. GDX is dynamic where the HUI is effectively static and outdated.
GDX also has limitations as a gold-stock metric though. It was only born in May 2006, so that’s the limit of its price history available for analysis. And because its managers are paid 0.51% of its assets each year to maintain this ETF, GDX is not as pure of measure of gold-stock performance as a normal index. Over a decade that adds up to a substantial 5% difference. Nevertheless GDX’s popularity continues to grow.
This week GDX had $7.7b in assets under management, dwarfing its direct competitors. That was 21x larger than the next-biggest 1x-long major-gold-stock ETF! GDX’s sister GDXJ Junior Gold Miners ETF weighed in at $4.7b, but that generally includes smaller gold miners. GDX is the undisputed king of the gold-stock ETFs. As a contrarian speculator, I watch GDX’s price action in real-time all day every day.
For an entire year now, GDX has meandered in a relatively-tight trading range between $21 to $25. As gold stocks periodically fell even deeper out of favor, this ETF slumped down near $21 lower support. Then as they inevitably rallied back out of those lows, GDX climbed back up near $25 resistance. That made for a roughly-20% gold-stock price range, certainly narrow by this sector’s standards and tough to trade.
This GDX chart over the past couple years or so highlights 2017’s gold-stock consolidation. With this unloved sector neither rallying nor falling enough to get interesting, investors mostly abandoned it over the past year. So gold stocks largely drifted sideways on balance, which certainly proved vexing for the few remaining contrarian speculators and investors. A GDX $25 breakout would greatly improve psychology.
Last year’s gold-stock performance per GDX was very poor. This ETF’s price climbed 11.1% in 2017, which is better than a kick in the teeth. But gold’s impressive 13.2% gain last year well outpaced the gold stocks’ performance. Normally the major gold miners’ stocks amplify gold advances by 2x to 3x, so GDX should’ve powered 26% to 40% higher in 2017. Gold stocks are only worthwhile if they outperform gold.
That’s because gold miners face many additional operational, geological, and geopolitical risks compared to just owning gold outright. So if the gold stocks don’t outperform gold, they simply aren’t worth owning. Seeing them lag the metal which drives their profits for essentially an entire year is extremely anomalous. It’s a reflection of the entire global markets proving extremely anomalous in 2017, an exceedingly-weird year.
Gold stocks normally perform much more like 2016 than 2017. A couple years ago GDX rocketed 52.5% higher in one of the best major-sector-ETF performances in all the stock markets. That greatly amplified 2016’s underlying 8.5% gold advance by 6.2x. All those gains rapidly accrued in that year’s first half, as GDX skyrocketed 151.2% higher in 6.4 months on a parallel 29.9% gold upleg! Gold stocks can really move.
But last year as extreme record-high stock markets and the even-more-extreme bitcoin popular speculative mania stole the spotlight from gold, gold stocks were largely left for dead. Speculators and investors alike wanted nothing to do with classic alternative investments when everything else proved much more exciting. Thus GDX hasn’t been able to decisively break out above its $25 upper resistance, despite trying.
GDX did power 34.6% higher in 1.8 months early last year, peaking on a closing basis at $25.57 in early February 2017. But that rally fizzled with gold’s when stock markets started surging to new records on hopes for big tax cuts soon from the newly-Republican-controlled US government. By early March GDX had retreated back down to $21.14, right at its $21 support line. At least that held strong throughout 2017.
The gold stocks soon rebounded into another rally, but that topped at $24.57 in GDX terms in mid-April. Again gold had stalled out amidst epic general-stock euphoria. Gold is the key to gold-stock fortunes, as traders only think about the gold miners when gold itself catches their attention. GDX was repelled right at its 200-day moving average, which can prove both major support or resistance depending on market direction.
By early May GDX was right back down to $21.10 again, increasingly establishing the clear consolidation trend seen in this chart. The gold stocks couldn’t rally significantly heading into their summer-doldrums lull, and GDX was soon right back down to $21.21 in early July. That very day I published an essay on gold stocks’ summer bottom, predicting a new upleg once those usual weak summer seasonals passed.
And that indeed happened, with GDX rebounding and then accelerating to power 20.2% higher to $25.49 by early September. That was right at its early-February peak, a critical level technically to see a major upside breakout. But once again gold didn’t cooperate, selling off sharply as general stock markets yet again blasted to another series of record highs on renewed hopes for big tax cuts soon. Taxphoria was huge!
Thus the gold stocks slumped again, falling back down near GDX’s strong $21 support as this ETF hit $21.42 on close in mid-December. That was the day before the Federal Reserve’s fifth rate hike of this cycle, so gold-futures speculators were scared. They irrationally fear Fed rate hikes are bearish for gold, even though history has long proven just the opposite. Gold and gold stocks surged after that hike as I predicted.
From the day before that latest FOMC meeting to this week, GDX rallied 13.8% to $24.37. Wednesday morning when I decided to pen this essay, GDX was nearing $24.50. So the long-awaited decisive $25 breakout is in easy reach. Gold stocks are a volatile sector, with 3%+ daily swings in prices relatively common. So all it will take to propel GDX above its $25 resistance is a few solid-to-strong sector up days.
The upcoming Q4’17 earnings season for the major gold miners in the next few weeks could prove the catalyst to spark serious gold-stock buying. Because gold stocks are so deeply out of favor, the small fraction of traders that even think about them assume they are struggling operationally. Throughout all the markets, traders wrongly attribute prices stretched to anomalous levels by extreme herd sentiment to fundamentals.
A month ago bitcoin skyrocketed near $20k as many traders believed such extremes were fundamentally righteous due to the underlying blockchain technology. Yet it was a popular speculative mania, extreme greed sucking people in. In early December I warned “Once this mania bitcoin bubble bursts, and it will, the odds are very high that bitcoin will lose 50% to 75% of its value within a few months on the outside!”
This week just over a month later bitcoin has indeed been cut in half, falling to $9k intraday. Extreme prices are the result of irrational and ephemeral herd sentiment, not fundamentals. Gold stocks are now stuck on the other end of the psychology spectrum, plagued with extreme fear. Since their prices have been so weak, traders think poor fundamentals must be the reason. But that’s simply not true at all.
As a contrarian speculator and market-newsletter writer for the past couple decades, few people are more deeply immersed in the gold-stock realm than me. Every quarter just after earnings season I dive into the actual operating and financial results of the major GDX gold miners. I’m eagerly looking forward to doing that again with their new Q4’17 results, which will be reported between late January and mid-February.
So now the latest quarterly results available from the major gold miners are Q3’17’s. I explored them for the top 34 GDX gold miners, representing almost 92% of its total holdings, back in mid-November. In Q3’17 these elite gold miners reported average all-in sustaining costs of $868 per ounce. That’s what it costs them not only to produce gold, but to explore for more and build new mines to maintain production levels.
Q3’17’s average gold price was $1279, which means the major gold miners were collectively earning profits around $411 per ounce. That made for hefty 32% profit margins, revealing an industry actually thriving fundamentally instead of struggling as herd-sentiment-blinded traders wrongly assume. Gold miners make such excellent investments because their mining costs generally don’t follow gold prices.
Gold-mining costs are essentially fixed during mine-planning stages, when engineers and geologists work to decide which ore to mine, how to dig to it, and how to process it. Once mines’ necessary infrastructure is built, their actual mining costs don’t change much. Quarter after quarter generally the same levels of equipment, employees, and supplies are needed to mine gold. So all-in sustaining costs hold pretty steady.
In the four quarters leading into Q3’17, the top-34 GDX gold miners’ all-in sustaining costs averaged $855, $875, $878, and $867. That works out to an annual average of $869, virtually identical to Q3’17’s $868 per ounce. Those flat AISCs happened despite the gold price varying greatly in that five-quarter span, with this metal slumping as low as $1128 and surging as high as $1365. Gold-mining costs are static.
So as long as prevailing gold prices remain well above all-in sustaining costs, mining gold remains very profitable and spins out big positive operating cashflows. And relatively-flat mining costs generate big gold-miner profits leverage to gold. These core fundamental truths about gold-mining stocks are what could help their upcoming Q4’17 results ignite the buying necessary to propel GDX above $25 for a major breakout.
These new Q4 results aren’t going to be spectacular, as gold’s $1276 average price last quarter was just under Q3’s $1279 average. But assuming flat all-in sustaining costs as usual, $868 in Q4 would still yield fat profit margins of $408 per ounce. That too is virtually unchanged from Q3’s $411. So the major gold miners as a sector shouldn’t see collective downside surprises in earnings in Q4, avoiding damaging sentiment.
It’s not the Q4’17 results that should spark major gold-stock buying, but their implications for the current Q1’18 quarter. While Q1 is young, gold is averaging nearly $1323 so far as of the middle of this week. That is already 3.6% above Q4’s average, which is a big move higher. If these gold levels hold and the major gold miners’ all-in sustaining costs hold, they are looking at Q1’18 profits way up at $455 per ounce!
That’s a whopping 11.5% higher quarter-on-quarter! Not many if any sectors in all the stock markets can even hope for such massive earnings gains. And if gold continues powering higher in the coming months in a major new upleg, Q1’s average gold price will be pulled higher accordingly. That means even larger major-gold-miner profits growth. These super-bullish prospects ought to rekindle material gold-stock demand.
Investors usually buy stocks not because of current earnings, but because of what they expect profits to do over the coming year or so. Rising gold prices coupled with flat costs give gold-mining profits growth in 2018 some of the greatest upside potential in the entire stock markets. Institutional investors should take notice of this as Q4’17 results are released, leading to funds upping their tiny allocations to gold stocks.
On top of that January tends to be a big news month for the gold miners, as many publish their cost and production outlooks for the new year. These reports tend to be bullish on balance, with the major gold miners forecasting higher production and lower costs tending to garner the most attention. So there’s good odds of positive newsflow over the coming weeks as well, drawing investors’ focus back to gold stocks.
All this shows why the gold miners’ stocks have usually enjoyed strong seasonal rallies in January and most of February. So GDX now has its best chance in a year of decisively breaking out above $25 in the coming weeks. That would work wonders for bearish gold-stock psychology. The more gold stocks rally, the better herd sentiment, and the more traders want to buy them. And GDX’s potential upside is huge.
This last chart encompasses nearly all of GDX’s entire history going back to early 2007, a half-year after it was birthed. Gold stocks remain wildly undervalued today, so GDX $25 and even its $31.32 seen at gold stocks’ latest major interim high in early August 2016 are super-low in longer-term context. GDX is actually still down near stock-panic levels, highlighting vast upside as gold stocks inevitably mean revert higher.
The shaded area in the lower right encompasses the last couple years. Despite GDX seeing one heck of a bull-spawning upleg in early 2016, the gold stocks remain very low. GDX itself actually hit an all-time low in January 2016. The gold stocks were trading at fundamentally-absurd prices as I pointed out that very week. That extreme anomaly was the product of fleeting herd sentiment, it had nothing to do with fundamentals.
So far in young 2018, GDX is averaging $23.66 on close. That’s actually worse than Q4’08’s $25.13, which was during the most-extreme market-fear event of our lifetimes. For the first time since 1907, the general stock markets suffered a full-blown panic in late 2008. Everything else including gold and its miners’ stocks were sucked into that epic maelstrom of fear. Traders were terrified, fleeing in horror from everything.
So GDX plummeted as low as $16.37 in late-October 2008, climaxing a devastating 71.0% drop in just 7.5 months. In that panic quarter of Q4’08, gold averaged just $797. While industry costs were lower then, the major gold miners were still earning much less in both profit-margin and absolute terms than they are today. Yet the average GDX share price was much higher in Q4’08 than it’s been over the past year!
The fact GDX could trade around $25.13 during a stock-panic quarter with $797 gold highlights the sheer madness of today’s gold-stock prices. Since 2017 dawned, GDX has averaged just $22.99 with $1261 average gold levels. Seeing gold-stock prices 8.5% lower despite strong profits and average gold prices being a whopping 58.2% higher makes zero sense! The gold stocks have to mean revert far higher from here.
That’s what happened after the extreme pricing anomalies of that late-2008 stock panic too. Over the next 2.9 years, GDX more than quadrupled with a 307.0% gain! Another proportional mean-reversion bull out of early 2016’s all-time GDX low would catapult this ETF back up near $51. That’s still more than another double from today’s levels. And with gold mining so profitable, this new bull’s gains should be far larger.
While investors and speculators alike can certainly play gold stocks’ powerful coming upleg with major ETFs like GDX, the best gains by far will be won in individual gold stocks with superior fundamentals. Their upside will far exceed the ETFs, which are burdened by over-diversification and underperforming gold stocks. A carefully-handpicked portfolio of elite gold and silver miners will generate much-greater wealth creation.
At Zeal we’ve literally spent tens of thousands of hours researching individual gold stocks and markets, so we can better decide what to trade and when. As of the end of Q4, this has resulted in 983 stock trades recommended in real-time to our newsletter subscribers since 2001. Fighting the crowd to buy low and sell high is very profitable, as all these trades averaged stellar annualized realized gains of +20.2%!
The key to this success is staying informed and being contrarian. That means buying low before others figure it out, before undervalued gold stocks soar much higher. An easy way to keep abreast is through our acclaimed weekly and monthly newsletters. They draw on my vast experience, knowledge, wisdom, and ongoing research to explain what’s going on in the markets, why, and how to trade them with specific stocks. For only $12 per issue, you can learn to think, trade, and thrive like contrarians. Subscribe today, and get deployed in the great gold and silver stocks in our full trading books!
The bottom line is the leading GDX gold-stock ETF looks to be on the verge of a major breakout. The upcoming Q4’17 results from the major gold miners along with Q1’s higher prevailing gold prices ought to catch investors’ attention. The gold miners should prove very profitable in Q4, with prospects for big and fast earnings growth in Q1 and all of 2018 as gold powers higher. This should help GDX get bid well over $25.
Once gold stocks power decisively above that vexing upper resistance level of the past year, the shift in trader psychology back to bullish will really accelerate. Gold stocks should enjoy relatively-large capital inflows from institutional investors looking for undervalued sectors in an extremely-overvalued stock market. The forgotten gold miners’ stocks have a good chance to outperform everything again this year like in 2016.
Boreal Metals (TSX-V: BMX / Frankfurt: 03E) is a base & precious metals explorer in Scandinavia that is making a major push into the key green energy tech metal Cobalt (“Co“). The management team & Board have a remarkable amount of experience for a company with a market cap of $17 M plus ~$3 M in cash. [~52 M shares outstanding]
In addition to 4 projects with exploration potential in Zinc (“Zn“), Copper (“Cu“), Silver (“Ag“) & Gold (“Au“); 2 in Sweden & 2 in Norway (Boreal controls 38,266 hectares), on January 16th management announced the execution of a definitive agreement with EMX Royalty Corp. for the acquisition of the 13,115 hectare Modum Cobalt project.
The Modum project surrounds southern Norway’s historic Skuterud Mine (also known as the Modum Mine). Historic mine workings, prospects and trends of mineralization extend onto the property Boreal intends to acquire. Skuterud was Europe’s largest and highest grade producer of cobalt though the nineteenth century. CEO Karl Antonius commented,
“The Modum Project includes an impressive 12,000 hectares, that’s 12 kilometers of cobalt prospective geology, with stand-alone mining potential. We are excited about this timely acquisition of a high-grade cobalt project within an emerging battery production sector in the Nordic Region.”
Cobalt in Norway??
I was surprised to learn that Scandinavia is home to major cobalt operations. Umicore produces, refines and markets cobalt in Belgium. The world’s largest cobalt refinery (Kokkola) is in Finland. Glencore has a giant nickel refinery in Norway (Nikkelverk) that produced about 5,000 tonnes of refined cobalt in 2016.
I have to admit that at first blush, I wondered if this move into Co was the Company simply jumping on the bandwagon of a red hot sector. However, upon speaking with Mr. Antonius and Director Eric Jensen about the project and Norway’s history as a global Co supplier, I came away excited by the prospects. Norway, led by projects in the same district Modum is in, was a global leader in Co production for much of the 1800’s.
Over 80% of the world’s cobalt reportedly came from Norway’s Skuterud Mine district in the 1820s-30s. Boreal Metals’ strong in-country experience in Norway & Sweden makes it a natural fit to take this project and run with it. I should also mention that management is actively seeking additional Co properties in the region.
The historic grade of Co mined in the district was ~0.20%, equal to roughly US$156/tonne at the spot Co price of US$78k/tonne. A key risk factor is that this project depends on strong Co pricing for years to come. Importantly, Au is known to accompany the Co mineralization in the area, but the grades of a potential Au by-product was never determined.
Miners in the 1800s would not have been interested in exploiting what they would have considered to be an insignificant Au value at the time. With Au now at US$1,340/oz., up US$100/oz. in just the past month — a gold production credit could add significant value.
In the price chart above, readers can see that the Co price is up nearly 250% from January 2016. It’s at a high not seen since the 2008 price spike when the metal rose above US$110k/tonne. The outlook for both cobalt & lithium prices is quite robust.
Analysts correctly point out that the cost of both metals as a percentage of the total cost of a lithium-ion battery is low. Therefore, even though the cobalt price is up ~260%, and lithium prices are up by a similar amount over the past few years, overall battery costs continue to decline due to technology improvements and economies of scale.
Much has been written about conflict cobalt, the greater than 50% of global Co that comes from the Democratic Republic of Congo (DRC). Ongoing child labor law abuses have cast doubt on the country’s continued role as (by far) the largest producer of the metal.
There are a number of promising developments for Co production in Canada, but for the foreseeable future the DRC will dominate. Needless to say, every major user ofCo on the planet is looking to source its needs outside of this troubled country.
By contrast to the DRC, Sweden & Norway rank # 4 & 6, respectively, out of 176 countries / territories on Transparency International’s annual Corruption Perceptions Index. Both countries are also highly ranked in the Fraser Institute Mining Survey; in the top quartile, with Sweden # 8 of 104 countries / territories.
In my view, this is a primary reason to own Boreal Metals in the first place, a truly world-class mining jurisdiction.
Zinc Price Has Made a Major Move Also….
As strong as the market is for cobalt, readers should also note the strength in zinc prices, up ~140% in the past 13 months, and at a high not seen since August 2007. Zinc inventory levels (a key pricing indicator) at the LME are at nearly a 10-yr. low, down over 80% since January 2013. Global Zn supply is dominated by China, which supplies more than the next 5 largest zinc producing countries combined. Additional zinc supply from Nordic countries would be well received.
One of Boreal’s flagship projects is Gumsberg(18,300 hectares)in southern Sweden. Gumsberg is surrounded by past producers and developers of zinc, copper, lead, silver & gold. Gumsberg was mined from the 13th century through the early 1900’s. It hosts over 30 historic mines, most notably the Östrasilverberg mine, which was the largest silver mine in Europe between 1300 and 1590. Despite its long-lived production history, relatively little modern exploration has taken place on the project.
Compare these 2016 drill results at Gumsberg to the reported Zn grades at nearby past producers, this is a highly promising, near-surface, early-stage project. The Company is conducting a follow up drill program with results expected in March.
In northern Norway Boreal has the 100%-owned Burfjord Copper-Gold project. CEO Antonius recently commented,
“The IP Geophysical Survey increases our confidence in the strike and depth continuity of copper mineralization at Burfjord.Copper mineralization at Burfjord consists of high-grade copper veins within a broader mineralized envelope and the results of this survey affirm Boreal’s target size criteria.”
Mineralization occurs as both high-grade Cu-Au bodies that were historically mined at high cutoff grades (>3% Cu), but management has recognized significant volumes of bulk tonnage potential Cu-Au mineralization developed in stockwork vein arrays throughout the property. Limited historical drilling includes a 7-meter intercept of3.6% Cu.
Conclusion
Boreal Metals (TSX-V: BMX / Frankfurt: 03E) now has 5 high-quality projects, 3 in Norway and 2 in Sweden. I touched briefly on 2 projects, but I will have more to say about all of the Company’s projects next month. Chairman & Director Patricio Varas, P. GEO has over 30 years’ experience at a wide range of operating mines and exploration projects. He’s worked on world-class deposits and founded Western Potash Corp. {See bio above}
Varas & CEO Antonius are joined by a number well-seasoned mining and funding professionals, {see bios on website}including Director Eric Jensen – Chief Geo & GM of Exploration for EMX Royalty Corp. and Daniel Maceneilm MSC, P. GEO.
Combined, management, the Board & Technical Advisory team have extensive experience in geoscience, mine engineering, geology, exploration (including important discoveries), project development, feasibility studies, corporate management, venture capital, private equity and capital raising (project funding). All of this talent wrapped up in a $17 M market cap company with ~ $3 M in cash. Five projects spanning zinc, copper, silver, gold and now cobalt – in a world-class mining jurisdiction, with more cobalt property acquisitions being considered.
Disclosures: The content of this article is for illustrative and informational purposes only. Readers fully understand and agree that nothing contained herein, written by Peter Epstein of Epstein Research, [ER] including but not limited to, commentary, opinions, views, assumptions, reported facts, estimates, calculations, etc. is to be considered implicit or explicit, investment advice. Further, nothing contained herein is a recommendation or solicitation to buy or sell any security. Mr. Epstein and [ER] are not responsible for investment actions taken by the reader. Mr. Epstein and [ER] have never been, and are not currently, a registered or licensed financial advisor or broker/dealer, investment advisor, stockbroker, trader, money manager, compliance or legal officer, and they do not perform market making activities. Mr. Epstein and [ER] are not directly employed by any company, group, organization, party or person. Shares of Boreal Metals are highly speculative, not suitable for all investors. Readers understand and agree that investments in small cap stocks can result in a 100% loss of invested funds. It is assumed and agreed upon by readers that they consult with their own licensed or registered financial advisors before making investment decisions.
At the time this article was posted, Peter Epstein owned shares in Boreal Metals and the Company was an advertiser on [ER]. By virtue of ownership of the Company’s shares and it being an advertiser on [ER], Peter Epstein is biased in his views on the Company.Readers understand and agree that they must conduct their own research, above and beyond reading this article. While the author believes he’s diligent in screening out companies that are unattractive investment opportunities, he cannot guarantee that his efforts will (or have been) successful. Mr. Epstein & [ER] are not responsible for any perceived, or actual, errors including, but not limited to, commentary, opinions, views, assumptions, reported facts & financial calculations, or for the completeness of this article. Mr. Epstein & [ER] are not expected or required to subsequently follow or cover events & news, or write about any particular company or topic. Mr. Epstein and [ER] are not experts in any company, industry sector or investment topic.
Investing in high quality companies can bring you gains in any segment of the market cycle. But, when you’re buying a high quality company at the bottom of a commodity cycle, the result can be truly spectacular.
When I bought the best junior gold companies in 2014 and 2015, near the bottom of the last bear cycle, it turned out to be a fantastic contrarian decision, giving me incredible gains in 2016 as sentiment changed.
Today, I feel the same could be said for investing in the nickel market, which, up until 2016, has been decimated by over-supply. This change in the supply dynamic is just one of the reasons why I’m bullish on nickel. In August of this year (2017), I wrote a two-part series on the nickel market and why I’m bullish on its future. For those who would like a closer look at my analysis, check out my series on nickel, Part 1 and Part 2.
So, how do I look to profit from my bullish nickel thesis? For me, the key is FPX Nickel Corp. FPX is the 100% owner of its flagship Decar Nickel District, which is located in central British Columbia, just 80 km west of the Mount Milligan open-pit Cu-Au mine.
Let’s take a look.
FPX Nickel Corp (FPX: TSX-V)
MCAP – $13.4 million (at the time of writing)
As of November, 2017
Shares – 133,770,339
Fully Diluted – 141,920,339 (no warrants outstanding)
Management & Directors – 19.3%
Cash – $750K
FPX Nickel’s People
If you have invested in the resource sector long enough, you have most likely heard the adage that people are the most important part of a company. It’s absolutely true. The fact is, however, like everything else in life, most people fall within the average moniker. Besides being average, you, of course, have the bottom feeders – the people you really want to avoid – and conversely, you have the cream of the crop at the top. Without a doubt, you want to be invested with the best people, as they give you the best chance of being right in the mining sector.
Peter Bradshaw is the co-founder and Chairman of the Board of FPX Nickel and, to me, is one of those outliers at the top of the industry . Bradshaw was inducted into the Canadian Mining Hall of Fame in 2015 for his achievements in what has been, thus far, a 40+ year career.
Bradshaw is best known for his involvement with Placer Development and their discovery of the high-grade zone VII at Porgera in Papua New Guinea, as well as co-founding the Mineral Deposit Research Unit (MDRU) at the University of British Columbia. Bradshaw has also worked or contributed to a few other companies, such as Barringer Research and Orvana Minerals. Today, he is Chairman of the Board for FPX and a Director with Aquila Resources.
Here’s a list of Bradshaw’s key discoveries and projects: Porgera Gold Mine, Kidston Gold Mine, Misima Gold Mine, Big Bell Gold Mine, Omai Gold Mine and Decar Nickel Project. As you can see, Bradshaw is a minefinder, and I think Decar will be his next mine. Here’s a link to Bradshaw’s must-see Canadian Mining Hall of Fame Tribute Video.
FPX is led by President and CEO, Martin Turenne. Turenne, a Chartered Accountant by trade, has worked in the commodities industry for over 15 years. Five of those years have been spent with FPX, where he was first the CFO from 2012 to 2015.
I have spoken to Turenne on a few occasions and am always impressed by his knowledge of the nickel market and, of course, the level of detail with which he answers my questions regarding FPX. Turenne is a major reason why I’m confident in investing in FPX and believe that their future is very bright given the quality of his leadership and vision.
FPX’s team is rounded out by consulting geologist and formerly FPX’s (formerly, First Point Minerals) VP of exploration, Trevor Rabb. Rabb has been busy this summer with FPX’s step-out drill program, which tested the southeast extension of the Baptiste deposit at Decar.
Last, but not least, is FPX’s CFO, J. Christopher Mitchell, who has more than 40 years of experience in the mineral industry. Mitchell has held senior roles with Viceroy Resource Corp. and Orvana Minerals Corp.
Board of Directors
Over the last few months, FPX has added two key pieces to its Board of Directors, with the appointment of Robert Pease and Peter Marshall. For those who aren’t familiar, both Pease and Marshall have extensive experience within the mining industry, more specifically, with the development and construction of mining projects in central British Columbia.
Both Pease and Marshall were a part of Terrane Metals; Pease as the founder and Marshall as the Senior VP of Project Development. Terrane owned the Mt. Milligan copper-gold project, which they developed from the PEA stage through to final feasibility and the commencement of project construction. To note, Terrane was later acquired by Thompson Creek Metals Company Inc. for $650 million in 2010.
Clearly, both Pease and Marshall have great knowledge and experience to draw on as they move toward the development of Decar with the rest of the FPX team.
Turenne’s comments with regards to his Board of Directors and how FPX will conduct themselves, moving forward;
Turenne: “We have begun to assemble a team of world-class mine builders and operators. The recent additions of Peter Marshall and Rob Pease are very important, as they have significant experience in developing and building mines in our region in central British Columbia.
Peter and Rob were the team behind Terrane Metals, which developed the similar scale, open-pit, bulk-tonnage Mt. Milligan project from the resource stage to construction in five years before selling the company for $650 million.
One of our other board members is Bill Myckatyn, who has built and operated several large-scale base metal mines in his career, most notably as the CEO of Quadra-FNX (acquired by KGHM for $3 billion in 2011). We will continue to add new team members with deep experience in mine development, construction and operation. This is a major company-style asset; our ongoing development of Decar will continue to be performed to major-company standards.”
The Decar Nickel District
Central British Columbia
The Decar Nickel District consists of 4 main targets, Baptiste (the focus of the 2013 PEA), Van, Sid and Target B. They total 60 mineral claims and encompass a total area over 245 square kilometres. The Decar Nickel District is located in central BC within 5 km of an existing railroad and is accessible by 4WD on logging roads.Decar sits roughly 90 km northwest of the town of Fort St. James, which is well equipped with most services, including accommodation, stores, private airbase, a bank and medical services.
Decar is expected to require 106 MW of power for its production, which can be accessed via a connection to BC Hydro’s Glenannan Substation (GLN). Accessibility and power are two of the major needs for a developing mine.
BC and its NDP Provincial Government
I have written about BC’s NDP government in a previous article, so I won’t take up space repeating myself here. The long and short of it is that while I believe there is risk with any political party, I feel the most risk comes from the far left, which, in Canada’s political world, is represented by the NDP.
I had a great discussion about the BC political situation with Turenne. Here’s what he had to say;
“British Columbia has a long history as one of the most mining-friendly jurisdictions in the world. In fact, in a 2017 ranking of safest places to invest resource capital, the Mining Journal rated British Columbia as the second-most attractive jurisdiction in the world, second only to Saskatchewan. An Executive Summary of the report can be accessed on the Mining Journal website.
During this year’s election campaign and since taking office, the NDP government has expressed its support for safe and responsible mining in B.C. Mining will remain a key driver of economic growth in the province, regardless of changes in the governing party. As with most jurisdictions, there are some profound regional differences in the ability to develop mining projects in B.C.; in the case of our Decar nickel project, it’s located in north-central British Columbia, which has several active mines and projects. For example, Decar sits just 80 km from Mt. Milligan, a similar-scale operation which was permitted and put into production in the last five years, demonstrating that north-central B.C. is an attractive setting for bulk-tonnage, open-pit mining operations like Decar.“
In the end, besides the political risk, BC has one of the richest mineral endowments in the world, let alone Canada. Whether it be gold exploration in the Golden Triangle or the copper mines throughout the north and central part of the province, BC is a top tier destination for mining and exploration.
While I do see risk in the NDP, when I have the chance to invest in what I believe is a great company, like FPX Nickel Corp., I think it’s worth the associated risk and have been a buyer since the summer of 2017.
History of Decar District Ownership
In a 2009 option agreement, what was then First Point Minerals (now FPX) granted Cliffs Natural Resources Exploration Inc. the option to acquire a 75% interest in the Decar property contingent on a number of criteria being met over the coming years.
From 2010 to 2013, Cliffs went on to spend roughly $22 million USD leading up to the completion of a PEA in 2013, giving them a 60% ownership of the project. In August of 2014, however, following a proxy battle, Cliffs’ Board of Directors and management were replaced, and the new management initiated a fire sale of all of the company’s non-core assets, including Decar.
In September of 2015, FPX purchased Cliffs’ 60% ownership of Decar for $4.75 million USD, giving FPX 100% ownership of the project.
Decar Nickel-Iron Alloy Project PEA 2013
Decar’s nickel is found in a mineral called Awaruite. Awaruite is a dense and highly magnetic nickel-iron alloy, Ni₃Fe, which is commonly referred to as a ‘ naturally occurring stainless steel.’ Awaruite’s physical properties make it perfect for conventional processing and extraction techniques such as grinding, magnetic separation and gravity concentration.
Additionally, in the case of the Baptise Deposit mineralization, there are little to no sulphides present, meaning that both the host rock and tailings are non-acid generating, which is a huge plus when it comes time to permit the project.
Mineral Processing and Metallurgical Testing
In 2012, SGS Minerals Services conducted “A Bench-Scale Investigation into the Recovery of Nickel from the Decar Awaruite Deposit.” From their tests, SGS selected a process which uses a grind size of 600 µm for the magnetic concentration stage, and 70 µm for the gravity concentration stage. This process results in an 84.7% recovery of DTR nickel, resulting in a concentrate with a grade between 12% and 15% total nickel.
The concentrate produced by FPX should be highly desirable in the stainless steel market, as steel producers, particularly in China, shift toward using higher grade sources of feedstock to supply their steel making operations. For your information, lower grade concentrates or pellets have higher amounts of impurities, which, if not properly captured by a Bag House (essentially a massive vacuum), are exhausted into the atmosphere.
For those who aren’t familiar, nickel pig iron (“NPI”) is a major additive in the stainless steel making process, as it contains both nickel and iron, two of the main constituents in stainless steel. The FPX concentrate or pellet, as mentioned earlier, will have a nickel grade of around 13.5% and iron content around 50%, which compares favourably to the specs of high-grade NPI.
I had the chance to ask Turenne about the metallurgy of the Decar Project and the outlook for the concentrate. Here’s what he had to say;
Turenne: “Decar will produce a premium nickel-iron product in the form of either a concentrate or a pellet with a nickel grade in the range of 12-15% and containing 40-50% iron. The closest market analogues to the Decar pellet are high-grade Chinese nickel pig iron (which typically grades 10-12% nickel with iron making up the balance) and ferronickel (grading 30% nickel, 70% iron). The significant iron content in ferronickel and Chinese NPI makes these products highly desirable for the production of stainless steel, which requires nickel and iron as key inputs; these products, therefore, attract premium pricing in the range of 102 to 110% of the LME nickel per contained nickel unit, as compared to typical nickel sulphide concentrate, which yields 70-75% of the LME nickel price when it is sold to a smelter.
In 2014, FPX conducted market testing of Decar product samples with six of the largest ferronickel and stainless steel producers in the world. The results of this program confirmed the potential for Decar product to bypass smelting and be injected as direct feed for the production of either ferronickel or stainless steel. The commercial feedback provided by the market test participants indicated that Decar product may achieve payability up to 95% or more of the LME nickel price, which is a material improvement over the 75% payability assumed in the 2013 Decar PEA. This improvement will be a key driver underpinning potentially robust economics in an upcoming updated PEA.”
From Turenne’s comments, I think the comment about the potential difference in payability, 20%, is a big deal and should be realized in an updated PEA in the future.
Metallurgical Comparison to RNC Nickel
For a better perspective of FPX’s metallurgical advantage, I have a comparison of Process Plant Schematic’s or Flow Sheets of RNC Nickel and FPX. First, let’s take a look at RNC Nickel’s Dumont Feasibility Study Technical Report, which shows the following flowsheet for the Dumont nickel sulphide deposit:
I am not showing RNC’s flow sheet to be critical of their process, but more to point out its complexity versus FPX’s flow sheet. FPX’s process is simple and widely used in the iron ore industry, and, in my opinion, presents fewer risks for economic production in the future.
Source: FPX Nickel’s Decar PEA Technical Report – pg.13-12
You be the judge. In my mind, metallurgical processing is arguably the most important part of a mine and, therefore, for me, FPX is clearly the better place for my investment dollars.
Summer Step-Out Drill Program
On September 25th , FPX completed their step-out drill program on the Baptiste Deposit. Eight diamond drill holes were completed, totalling 1,917 metres. The drill program area was 500 metres along strike from historical drilling, and covered a width of 500 metres.
On October 18 and November 20th, the results of the 8 hole program were released. The highlights from the program are as follows:
Hole 63 had an interval containing 104 m of 0.163% Davis Tube magnetically-recovered (DTR) nickel at a vertical depth of 66 metres below surface.
Hole 65 had an interval containing 132 m of 0.147% DTR nickel at a vertical depth of 32 m below surface.
Hole 67 had an interval containing 96 m of 0.167% DTR nickel at a vertical depth of 42 m below surface.
Hole 68 had an interval containing 124 m of 0.133% DTR nickel at a vertical depth of 20m below surface.
In my opinion, these results are excellent. To understand, let’s put it into perspective; the Baptiste deposit’s indicated DTR nickel resource estimate has a grade of 0.124%, and its inferred DTR nickel resource estimate has a grade of 0.125%.
The highlighted drill results are significantly higher-grade than the existing indicated and inferred resource estimate grades, they are large intervals and they are shallow. These are very positive signs that an updated PEA on the project should have better economics.
The question is how much of an impact can the step-out drill results have on the project’s economics? Well, the historically identified strike length totals 2.5 km in length, the summer drill program stepped out a further 500 m or a roughly 25% extension of the strike length. Given that the mineralization is shallow and higher grade than the existing resource estimates, I think this is going to have a very positive effect on the PEA update.
2013 PEA Results
The Baptiste Deposit will be mined via an open pit which is estimated to contain an Indicated Resource of 1.1 billion tonnes of 0.124% DTR Ni, and an Inferred Resource of 0.87 billion tonnes of 0.125% DTR Ni. Based on this, Tetra Tech calculated the following 2013 PEA results:
Post-Tax NPV @8% – $579 million CAD
Post –Tax IRR – 12.8%
Pre-Production CAPEX Cost – $1.3 billion CAD
Total CAPEX Cost over life-of-mine –k $2.1 billion CAD
Post-Tax Payback – 6.4 years
Nickel Price – $9.39 USD/lb.
Mining Rate – 114,000 t/day or roughly 40 million t/year
Exchange Rate – $0.97 CAD/ USD
Nickel Price Assumption
As you can see, the Decar project has some robust economics, with a post-tax NPV @8% of $579 million and an IRR of 12.8%. The downside to these numbers is that they were calculated using a nickel price of $9.39 USD/lbs.
For those who have been following the nickel price, you will know that nickel currently trades at roughly $5.50 USD/lbs, with most industry experts using $7.50 USD/lbs as their long-term target price.
At face value, the nickel price assumption is a troubling aspect of the 2013 PEA. A lot, however, has changed in the last 4 years, since the PEA was conducted.
Firstly, as outlined in the previous section of the report, FPX’s 2017 step-out drill program, completed this past fall, intercepted large intervals of shallow, high-grade DTR nickel, which appears to have extended the existing deposit by another 500 metres or roughly 25%.
Secondly, as outlined in the metallurgical section of this report, the PEA considered a conservative concentrate payback of 75%. However, FPX’s latest market testing suggests that a payback of 85 to 95% is more realistic due to the product’s high quality.
Thirdly, the CAD to USD exchange rate was almost 1 for 1 back in 2013. Today, in 2017, according to the Bank of Canada website, for every Canadian dollar we would receive 0.7911 American dollars, making the difference between the two exchange rates almost 20%.
It is my contention that given the 3 outlined changes since the original PEA was conducted, that a new PEA at a lower nickel price will again show robust economics.
CAPEX Cost
With a pre-production CAPEX cost of roughly $1.3 billion CAD, you may be thinking, ‘how are they going to pay for this?’ Well, in actuality, for those who aren’t familiar with base metals project development costs, US$1.3 billion is relatively cheap.
FPX’s most current corporate presentation, on slide 23, has a great graph depicting the capital cost (USD) per tonne annual nickel production of the largest nickel mines built around the world since 2010.
As you can see, Decar has the lowest capital cost (USD) per tonne of annual nickel production of all the listed nickel mines. The key take away from this graph, in my opinion, is two-fold; First, CAPEX costs in the billions of dollars won’t be the reason why this project isn’t developed. As you can see, the average CAPEX cost of the listed comparisons is close to $4 billion, making Decar’s current US$1.3 billion look quite low. Second, if FPX were to complete an updated PEA on Decar, they could potentially lower the throughput rate, which would have an effecton the overall CAPEX value.
Here are Turenne’s comments surrounding the $1.3 billion pre-production CAPEX cost;
Turenne: “The estimated pre-production capital cost in the 2013 PEA was C$1.3 billion for a 114,000 tonne-per-day operation, or approximately US$1.1 million at today’s exchange rate. We are looking at a potential smaller-scale operation, which could potentially reduce capital costs.
We believe that Decar is the most attractive undeveloped nickel asset in the world, truly a tier-1 asset due to the size of the ore body (supporting a top-15 annual nickel producer over a 25+ year mine life) and bottom-quartile operating costs (C$3.23 on-site operating costs in the 2013 PEA).
Due largely to the somewhat depressed state of the nickel market, and due to the modest headline economics in the 2013 PEA (resulting mostly from the low assumed nickel payability and high Canadian dollar assumption), FPX’s current valuation is absurdly low. Our strategy is to continue to demonstrate the technical and economic feasibility of the project, and to commence the permitting process, so that as the nickel price continues to rise, the market will begin to value us more appropriately. As and when this occurs, this will give us a better basis on which to raise funds to advance the project on our own, or to advance the asset with a senior partner. “
FPX’s Plans for 2018
In my opinion, it’s important to have a long-term outlook when it comes to your investment within the resource sector, as it gives you the best chance for your thesis to be right and helps you manage the ebbs and flows of a volatile sector.
In saying this, I asked Turenne about 2018 and what they had planned. Here’s what he had to say;
Turenne: “We will continue to advance the Decar project, likely with the release of an updated resource estimate for the Baptiste deposit which will incorporate the results of our very successful 2017 step-out drilling program. The 2017 drilling defined the Southeast Zone, which is the highest-grading portion of Baptiste.
There are a couple of key features of the Southeast Zone: first, it’s a very large zone measuring 1,000 metres long east-west and up to 600 metres north-south; second, long, near-surface drill intercepts in the Southeast Zone have returned grades in a range between 0.14% to 0.16% Davis Tube recoverable nickel. These results compare very favourably with the undiluted head grade in the first five years of the 2013 PEA mine plan, which ranged from 0.105% to 0.116% DTR nickel. The incorporation of this near-surface, higher-grade tonnage in the early years of a new mine plan has the potential to significantly improve project economics.
Once we have completed an updated Baptiste resource estimate, the next major step is the completion of an updated PEA. Since early 2017, we have been evaluating a number of parameters to optimize project economics, including the development of an optimized mine schedule and process flowsheet, an evaluation of various alternatives for minimizingupfront capital, and incorporation of the results of market testing on payability for our nickel product.
The point on payability is particularly important to understand the upside in a new PEA. We have conducted market testing of Decar nickel product with some of the largest ferronickel and stainless steel producers in the world to confirm the technical and commercial viability of Decar product. The response received from those potential offtakers have demonstrated the potential to achieve nickel payability in the range of 85% to 95% of the LME nickel price, as compared to the 75% LME payability assumed in the 2013 PEA. This implies a significant potential for increased revenue over the life-of-mine, with obvious positive implications for overall project economics.”
Nickel Company Comparables
For perspective on the value of FPX, I have put together a comparison with another junior nickel company which has a development project in BC.
Giga Metals
MCAP – $27.4 million (at the time of writing) based on the current share price of $0.70/share, with 41.4 million shares and 26 million warrants outstanding at exercise prices ranging from $0.07 to $0.70/share
Giga Metals owns the Turnagain Nickel-Cobalt Project in northern BC. Turnagain is a large, low-grade sulphide deposit containing nickel and cobalt-bearing pentlandite and pyrrhotite. The project’s main economic value is found in its nickel, with a much smaller portion being derived from its cobalt credits.
As you will see below, many of Giga’s Turnagain Project economic valuations are very similar to FPX’s Baptiste Deposit. However, I see some areas in which, I believe, FPX is stronger than Giga – let’s take a look:
Metallurgy – Complex mineralization, which, if successfully processed into a concentrate, will not fetch a premium price in the market, meaning payability of 75% of the LME price, at best. Please read the section of the PEA regarding metallurgy.
Location – remote location in northern BC with higher hydro power access and concentrate shipment costs
Limited Upside – The 2012 PEA has a high nickel price assumption ($8.50/lb.) and GIGA has not defined a clear path to making Turnagain an economic project below $8.50 USD/lb nickel.
Share structure – while the shares outstanding is lower than FPX, this is only after a couple of recent share roll backs, and keep in mind that GIGA’s share count will almost double if all the outstanding warrants and options are exercised.
Here are a few of the highlights from the PEA:
Measured and Indicated Resource – 865 Mt @0.21% Ni and 0.013% Co and an Inferred Resource – 976 Mt @0.20% and 0.013% Co.
Giga’s Results:
Post-Tax NPV @8% – $724 million
Post-Tax IRR – 13.5%
Initial CAPEX – $1.357 billion
Year 5 Expansion CAPEX – $492 million
Total CAPEX Cost over life-of-mine – $1.849 billion
Currently, Giga Metals trades more than double the MCAP of FPX, which I don’t think is justified. Giga’s Turnagain has a lot of positive aspects, however, when it comes down to valuations, I don’t believe it’s more valuable than FPX’s Decar Nickel District, given the reasons I outlined.
Concluding Remarks
I’m very bullish on the future of nickel and am investing my money into what, I believe, are the best investments to capitalize on a rising nickel price.
Even if you agree with my bullish nickel outlook, you may have a different risk tolerance when it comes to investing. For me, I prefer the junior portion of the resource sector, as I believe it gives the investor the best risk to reward ratio.
In saying this, I will continue to buy shares in FPX Nickel Corp. because, in my opinion, their Decar Nickel District is among the best undeveloped nickel projects in the world.
As I outlined in the report, there’s some risk associated with FPX, mainly in the nickel price assumption from its 2013 PEA and the NDP political party which currently leads the BC provincial government. I do believe, however, that given the step-out drill results, the expected 85-95% payability on the concentrate and a change in the exchange rate, the Decar Nickel District will be economic at sub $8 USD/lb. nickel.
In my opinion, there’s more upside potential than downside, especially at its current MCAP. Here’s a list of the reasons I’m investing in FPX Nickel:
Great leadership from CEO, Martin Turenne, and a group of proven mine builders, beginning with Peter Bradshaw and Board members, Robert Pease, Peter Marshall and Bill Myckatyn. This team is being assembled with the successful development of Decar in mind.
A desirable concentrate or pellet which is made via a simple metallurgical process. Market research carried out by FPX suggests that the concentrate could sell for around 85-95% of the LME price, which is 20% higher than the 75% used in the 2013 PEA.
The Baptise Deposit mineralization has little to no sulphides present, meaning that both the host rock and tailings are non-acid generating, which is a huge plus when it comes time to permit the project.
Low Pre-Production CAPEX cost of $1.3 billion – World-class nickel projects come with large price tags, making Decar look very reasonable, if not cheap.
Low on-site operating costs of C$3.23/lb, which would position Decar in the lowest quartile of the nickel industry cost curve.
Given the PEA nickel production rate of 82 million lbs. per year, at today’s nickel price of US$5.75/lb, Decar would yield around US$250 million in annual pre-tax operating cash flows.
Large resource containing over 5.5 billion pounds of nickel in the combined indicated and inferred categories, making Decar one of the five-largest undeveloped nickel deposits in the world
Successful step-out drill program results from the Southeast Zone, which has increased the strike length by 500 metres or roughly 25%.
PUSH – An update to the Baptiste Deposit’s resource estimate should come in 2018, setting the stage for an updated PEA.
FPX is trading for less than half (in terms of MCAP) the value of a comparable junior nickel company which, I believe, doesn’t have as high quality an asset as FPX.
In my opinion, all of these points make a great investment proposition. One that I think will be very hard for a major mining company to ignore in the future. With the completion of an updated PEA, a rising nickel price, and the overall lack of comparably great projects in the world, I believe FPX is HIGHLY undervalued and am looking forward to its re-rating in the market.
Don’t want to miss a new investment idea, interview or financial product review? Become a Junior Stock Review VIP now – it’s FREE!
Until next time,
Brian Leni P.Eng
Founder – Junior Stock Review
Disclaimer: All statements in this report, other than statements of historical fact should be considered forward-looking statements. These statements relate to future events or future performance. Forward-looking statements are often, but not always identified by the use of words such as “seek”, “anticipate”, “plan”, “continue”, “estimate”, “expect”, “may”, “will”, “project”, “predict”, “potential”, “targeting”, “intend”, “could”, “might”, “should”, “believe” and similar expressions. Much of this report is comprised of statements of projection. These statements involve known and unknown risks, uncertainties and other factors that may cause actual results or events to differ materially from those anticipated in such forward-looking statements. Risks and uncertainties respecting mineral exploration companies are generally disclosed in the annual financial or other filing documents of those and similar companies as filed with the relevant securities commissions, and should be reviewed by any reader of this newsletter.
Brian Leni is an online financial newsletter writer. He is focused on researching and marketing resource and other public companies. Nothing in this article should be construed as a solicitation to buy or sell any securities mentioned anywhere in this newsletter. This article is intended for informational and entertainment purposes only!
Be advised, Brian Leni is not a registered broker-dealer or financial advisor. Before investing in any securities, you should consult with your financial advisor and a registered broker-dealer.
Never, ever, make an investment based solely on what you read in an online newsletter, including Junior Stock Review, especially if the investment involves a small, thinly-traded company that isn’t well known.
Brian Leni’s past performance is not indicative of future results and should not be used as a reason to purchase any stocks mentioned in his newsletters or on this website.
In many cases Brian Leni owns shares in the companies he features. For those reasons, please be aware that Brian Leni can be considered extremely biased in regards to the companies he writes about and features in his newsletters. You should conduct extensive due diligence as well as seek the advice of your financial advisor and a registered broker-dealer before investing in any securities. Brian Leni may buy or sell at any time without notice to anyone, including readers of this newsletter.
Brian Leni shall not be liable for any damages, losses, or costs of any kind or type arising out of or in any way connected with the use of this newsletter. You should independently investigate and fully understand all risks before investing. When investing in speculative stocks, it is possible to lose your entire investment.
Any decision to purchase or sell as a result of the opinions expressed in this report will be the full responsibility of the person authorizing such transaction, and should only be made after such person has consulted a registered financial advisor and conducted thorough due diligence. Information in this report has been obtained from sources considered to be reliable, but we do not guarantee that they are accurate or complete. Our views and opinions in this newsletter are our own views and are based on information that we have received, which we assumed to be reliable. We do not guarantee that any of the companies mentioned in this newsletter will perform as we expect, and any comparisons we have made to other companies may not be valid or come into effect.
Junior Stock Review does NOT have any business relationship with FPX Nickel Corp. Junior Stock Review does not undertake any obligation to publicly update or revise any statements made in this newsletter.
Brian Leni does own shares in FPX Nickel Corp.
Gold and related investments are off to a very positive start in 2018. I don’t expect any major pause in the action until China’s Golden Week holiday celebrations get underway.
2.Chinese gold dealers will be on holiday this year from about February 15 to February 21. This creates a significant vacuum in gold demand. As dealers and Chinese gold markets close, the gold price tends to soften in global markets.
3.The good news is that gold has a rough general tendency to rally strongly ahead of the Golden Week festival, and that’s happening right now.
4.Please click here now. Double-click to enlarge. Gold has reached the outer boundary of my $1340 – $1365 resistance zone.
5.A flag pattern is possibly forming. Note the nice pennant pattern that formed at the $1320 resistance zone area. I would also like investors to note that gold has burst through resistance at both $1300 and $1320 with ease.
6.Short term technical indicators are overbought and a pullback is expected. Hopefully the pullback is a flag pattern rather than something deeper.
7.Regardless, both the $1320 and $1300 price zones should now function as support on any pullback.
8.The $1365 area on this February futures chart is much more formidable resistance, because it represents the highs made when India’s Modi “trumped the Trumpster” by calling in the nation’s fiat money.
9.Modi did that on US election night, as India’s powerful gold buyers were buying enormous amounts of gold to bet on a Trump victory. Their bets were correct, but Modi ruined the payoff.
10.That horrific demonetization announcement was followed by “know your client” and GST tax policy announcements. In the short term, these policies were all negative for both gold and GDP growth.
11.Please click here now. A lot has changed since those policies were unveiled. The Indian gold jewellery market has almost finished restructuring.
12.Demand for gold in India is now very steady and rising. That trend is not just “here to stay” but here to accelerate!
13.The upcoming Indian Federal budget could feature some positive announcements for gold. The post office plan to help rural Indians buy more gold is just one of many proposals coming from India’s top jewellers. There’s also a chance for a duty cut, which is endorsed by the nation’s commerce department.
14.In America, Jerome Powell is set to become head of the central bank in just three weeks. His aggressive plans for more quantitative tightening, consistent rate hikes, and deregulation of small banks could be a game changer for the twenty-year bear market in US money velocity.
15.I’ve predicted he ends that bear market by the summer.That would be a game changer for the equally long bear market in gold stocks versus gold. I believe that bear market ended in 2014-2016, but gold stocks need a major money velocity bull cycle to stage serious outperformance against bullion.
16.I expect less useless talk from “Fed speakers” in 2018, and more boots on the ground action from Powell with deregulation.
17.In terms of money velocity, I’ve suggested that gold stocks are probably at a time that can be compared with the 1968 – 1970 period. Inflation is starting to rise, and interest rates are starting to rise. This is exactly what happened from 1968 to 1980, and over the next decade, gold stocks should perform much like they did in the 1970s.
18.Please click here now. Double-click to enlarge this dollar versus yen chart.The dollar broke below another low yesterday. Arguably, it could also be a neckline break on a head and shoulders top pattern.
19.The bottom line for the dollar: It looks like a train wreck against the yen, the yuan, the rupee, and the euro. A rally is expected now, but it should be modest. That fits with my “possible flag for gold” scenario.
20.One of Trump’s campaign promises was to lower the dollar against the fiat of other major economies. A bullish bet on the dollar is a bet against the president of the United States. I wouldn’t recommend taking that bet.
21.Please click here now. Double-click to enlarge this exciting Ripple blockchain currency chart. I tend to approach blockchain investing much like junior gold stocks; I buy a grub stake with 20% – 30% of the total fiat capital I’m willing to commit to the asset, hold 20% to buy at higher prices on pullbacks, and keep 50% to buy at much lower prices.
22.Right now, I’m a ripple buyer of all 10 cent pullbacks, with a $5 target for the next major move higher.
23.Please click here now. Double-click to enlarge. GDX looks like a technical “wonder kid” right now. Note the massive volume on the upside breakout from the rectangular drift pattern that is almost a flag! I expect India to provide the higher price gold floor foundation for a possible surge to the $1500 area for bullion.
24.In turn, Powell’s deregulation should make GDX look like bullion on steroids, and I expect it could stun most investors by making a new all-time high long before bullion does!
Stewart Thomson is a retired Merrill Lynch broker. Stewart writes the Graceland Updates daily between 4am-7am. They are sent out around 8am-9am. The newsletter is attractively priced and the format is a unique numbered point form. Giving clarity of each point and saving valuable reading time.
Risks, Disclaimers, Legal
Stewart Thomson is no longer an investment advisor. The information provided by Stewart and Graceland Updates is for general information purposes only. Before taking any action on any investment, it is imperative that you consult with multiple properly licensed, experienced and qualified investment advisors and get numerous opinions before taking any action. Your minimum risk on any investment in the world is: 100% loss of all your money. You may be taking or preparing to take leveraged positions in investments and not know it, exposing yourself to unlimited risks. This is highly concerning if you are an investor in any derivatives products. There is an approx $700 trillion OTC Derivatives Iceberg with a tiny portion written off officially.
The bottom line: Are You Prepared?
The rebound in the precious metals sector continues. Friday, Gold pushed to another new high, near $1340/oz. Gold stocks led by the HUI Gold Bugs Index and GDX also made a new high with juniors and Silver right behind. The greatest traders say the move comes first and then the reason later. When it comes to Gold we are always analyzing the reason behind the moves so we can distinguish between reactions and reflex moves and those moves that are part of a real bull market. The market may be starting to sniff out a potential big catalyst for Gold that could drive its breakout in 2018.
With respect to Gold and Bonds an important change has taken place in recent months. The two asset classes had been positively correlated. When rates declined, Gold moved higher. When rates rebounded, Gold struggled. That is what happens when inflation is low and not trending. However, now we see long-term Bonds (specifically the 10-year Bond) moving towards a breakdown while Gold is not far from a breakout. Look at the rolling 50-day and 200-day correlations at the bottom of the chart.
As we’ve written in the past, higher long-term yields are bullish when they rise faster than short-term yields. That is a steepening of the yield curve and indication of inflation.
At present, higher long-term rates could help bid Gold in a few different ways. First, for those who are seeking income they enhance the appeal of bonds relative to stocks. Second and more importantly, higher long-term rates will hurt what is an over-indebted economy and government at somepoint. Debt payments rise. Credit growth can slow. The threshold of that remains to be seen. Perhaps it could be 3.00% on the 10-year yield.
It is counterintuitive but upward pressure on long-term rates can be very bullish for Gold (in the present environment) as it necessitates the need for lower or stable long-term rates (amid an inflationary environment). It all comes back to debt. At somepoint rising rates negatively impact the economy and the government’s balance sheet. If that creates the need for central bank intervention and monetization while inflation is running then that is what can push Gold to $2000-$3000/oz in the next several years.
The stock markets have rocketed higher since Trump’s election win on hopes for big corporate tax cuts. This extreme rally has left stocks exceedingly overvalued and overbought today. A major selloff is long overdue and likely imminent. When stocks inevitably roll over and mean revert lower to rebalance away euphoric sentiment, gold is the main beneficiary. Gold investment demand soars when stocks materially slide.
Two trading days before the November 2016 presidential election, I published an essay that explored how stock-market action leading into elections really sways their results. Its conclusion based on long market history was “The stock markets overwhelmingly and conclusively predict Donald Trump will win!” That was a hardcore contrarian stance before Election Day, when such an upset seemed impossible to most.
Since Americans voted for our next president, the flagship S&P 500 broad-market stock index (SPX) has soared 28.6% higher in 14.0 months! That extraordinary rally was mostly driven by hopes for big tax cuts soon with Republicans newly controlling the US government. And they indeed delivered last month with a massive corporate tax cut. That sets up a classic buy-the-rumor-sell-the-news scenario for these record markets.
Ever since that election, Wall Street has argued that stocks are surging due to strong corporate-profits growth. But that’s not true according to hard valuation data. In late October 2016 just before Americans voted, the 500 companies of the SPX averaged trailing-twelve-month price-to-earnings ratios of 26.3x. Even before Trump won, stocks were already very expensive and nearing dangerous bubble territory.
For the past century and a quarter, average broad-market TTM P/E ratios have run 14x earnings. That’s fair value for stock markets, and twice that at 28x is formally bubble territory. Rather ironically during his campaign, Trump often warned about the stock-market bubble created by the Fed! While he loves these same stock markets now, they are a lot more expensive after this past year’s massive taxphoria-fueled rally.
2017 indeed proved a strong year for corporate profits as optimistic Americans spent money fast. Yet at the end of December a couple weeks ago, the elite SPX companies were averaging a TTM P/E way up at 30.7x! That’s well into bubble territory, and history has proven stock markets never fare well for long after valuations are bid up to such unsustainable extremes. That guarantees a major stock selloff looms.
Over roughly the same post-election span where the SPX blasted up 28.6%, SPX valuations rose 16.8%. That means about 6/10ths of the rally was driven by multiple expansion, higher valuations. Only 4/10ths can be attributable to rising corporate earnings, and even that is suspect. The economic optimism that was unleashed by the Republican sweep was huge, driving big spending. But that anomaly won’t last for long.
And the Republicans’ corporate tax cuts won’t magically rescue stocks. While good news for the US economy, they won’t do enough to work off today’s extreme bubble valuations. Wall Street estimates are generally for 10% corporate-profits growth this year due to lower taxes. That would merely push the SPX P/E back to 27.6x, near-bubble levels. Stocks are now way too expensive for corporate tax cuts to help much!
As the stock markets surged into the tax-reform bill’s actual passage in recent months, contrarian traders assumed any stock selling was being delayed. Why realize big capital gains in 2017 if tax rates might be significantly lower in 2018? But the stock markets have blasted even higher so far in January, with no meaningful selling yet materializing. That has left the SPX extremely overbought technically, a bearish omen.
In the first 4 trading days of 2018, the SPX surged another 2.6% higher. That’s truly an extreme rate of ascent by any standard. There are about 250 trading days per year, so annualize out these early-year gains and the SPX is skyrocketing at a 163% yearly rate! Obviously there’s zero chance 2018 could see such absurd gains. Ominously such a fast climb looks parabolic for a stock index as enormous as the SPX.
In late December the collective market capitalization of those 500 SPX companies was $24.4t. Such a vast number gives the stock markets great inertia. So a parabolic surge in the general stock markets will always be relatively muted. Unlike vastly-smaller assets like bitcoin, stock markets are far too large to catapult higher in the terminal phases of bull markets. The SPX’s early-2018 action has truly been extreme.
The stock markets are now dangerously overbought, implying a major selloff is probable and imminent. Overboughtness happens when stock markets surge too far too fast to be sustainable. There are many ways to measure overboughtness, but one of the best is looking at price levels relative to their own key moving averages. Well over a decade ago I developed Relativity Trading to empirically define this state.
200-day moving averages are probably the best price baselines over time, striking an excellent balance between filtering out daily noise and following long-term trends in force. A construct I call the Relative SPX looks at this dominant stock index as a multiple of its 200dma. It is simply calculated by dividing the SPX by its underlying 200dma each day. Charting the results over time yields illuminating trading insights.
In any trending market, prices tend to meander in well-defined ranges relative to their 200dmas. When they stretch too far above their 200dmas by their own historical standards, sharp selloffs soon follow to restore normalcy and rebalance sentiment. This chart superimposes the SPX itself in blue over the rSPX in red, highlighting the extreme overboughtness in the stock markets after early January’s euphoric surge.
The Relative SPX effectively flattens the SPX’s black 200dma line at 1.00x, and shows where the SPX is trading relative to that 200dma in perfectly-comparable percentage terms over time. As of this week, the rSPX soared as high as 1.103x! In other words, the mighty S&P 500 was stretched 10.3% above its key 200dma. Such extremes are very unusual and never sustainable for long, signaling major selloffs looming.
Relativity Trading looks at the past five calendar years’ trading action to define a relative range. For the SPX that now runs from 0.94x to 1.08x. When the SPX falls down near or under 94% of its 200dma, it’s very oversold so a major rally is very likely soon. But when the SPX climbs up near or over 108% of its 200dma, it’s very overbought heralding an imminent major selloff. Such fast price rises simply can’t persist.
This week’s rSPX levels hit a 4.4-year high, which might not sound too extreme. But other things need to be taken into consideration when high rSPX levels are reached. The trajectory of the 200dma is one of the most important. While 200dmas mostly rise in bull markets, that’s not always the case. Early in young bull markets 200dmas are still falling from the preceding bears. 200dmas can also drift lower in major corrections.
The last SPX corrections erupted in mid-2015 and early 2016, when the stock markets fell 12.4% in 3.2 months followed by another 13.3% in 3.3 months. A correction is technically a 10%+ SPX selloff. That pushed SPX levels low enough for long enough to drag its 200dma lower for the better part of several quarters. When stocks started rallying again, the rSPX shot to high levels before the 200dma fully turned higher.
Most rSPX extremes are seen early in bull markets or after corrections when stock prices surge higher before a declining or flat 200dma has time to catch up. But that certainly isn’t the case this year. The SPX’s 200dma has been rising sharply ever since Trump won the election in November 2016. Today’s rSPX extreme is much worse than it sounds because it’s coming from a high 200dma after a powerful rally!
Normal healthy bull markets see corrections once a year or so, when prices fall back to their 200dmas to work off greed and restore sentiment balance. Today’s SPX would have to drop more than 10% just to revisit its 200dma, a major selloff by recent standards. It’s been 1.9 years since the end of the SPX’s last correction, so the next one is long overdue. Extremely-overbought conditions like today help birth major corrections.
Considering how far and fast stock markets have rallied, how euphoric and complacent traders are today, and how extremely expensive today’s bubble-valued stock markets are, it’s hard to imagine the overdue and coming major selloff not at least testing the upper limits of corrections. That portends a selloff that nears 20%, which is probably the best-case scenario for the bulls. Anything beyond 20% is a new bear market.
And unfortunately that new-bear scenario is far more likely. As of this week this SPX bull has rocketed up an extreme 306.7% in 8.8 years, making for the third-largest and second-longest stock bull in all of US history! Much of those gains were fueled by epic central-bank easing far beyond anything ever before seen in world history. This year both the Federal Reserve and European Central Bank are slamming on the brakes.
The Fed just started its first-ever quantitative-tightening campaign in Q4’17 to unwind years and trillions of dollars of quantitative easing. QT is going to gradually ramp up in 2018 to a powerful $50b-per-month pace starting in Q4 this year. Per the Fed’s schedule, it will effectively destroy $420b of capital in 2018 by letting QE-purchased bonds roll off its balance sheet. Nothing remotely close has ever happened before!
On top of that the ECB just slashed in half its own QE campaign this month to a €30b monthly pace, with a targeted QE end date of September. That means ECB QE will collapse from €720b in 2017 to just €270b in 2018, a radical 5/8ths plunge. Between the Fed’s QT and ECB’s QE tapering, there will be the equivalent of $950b more tightening and less easing in 2018 compared to 2017! That’s going to leave a mark.
The Fed and ECB will literally strangle this stock bull by unwinding and slowing the QE that grew it. And this isn’t just a 2018 thing. In 2019 the Fed and ECB are on track to have another $1450b of tightening compared to 2017. So these stock markets are in real trouble with central-bank liquidity being pulled regardless of their extreme overvaluations and overboughtness. 2018 sure ain’t gonna look like 2017 at all!
Bear markets ultimately tend to cut stock prices in half, literal 50% losses in the SPX. The last couple bears that started in early 2000 and late 2007 saw the SPX drop 49.1% in 2.6 years and 56.8% in 1.4 years! Bear markets are exceedingly dangerous and not to be trifled with. They also tend to grow in size in proportion to their preceding bulls, so the next bear should be bigger than usual after such a massive bull.
A major stock selloff imminent, whether a serious correction or new bear, certainly sounds like bad news for investors. But like everything else in the markets, it offers huge opportunities to profit for contrarians who see it coming and prepare. A great Bible verse that applies to the inexorable stock-market cycles is Proverbs 27:12, “The prudent see danger and take refuge, but the simple keep going and pay the penalty.”
When stock markets start materially weakening, investors return to gold. Gold is the ultimate portfolio diversifier because it tends to move counter to stock markets. Gold is forgotten when stock markets are high and euphoria and complacency abound. But once major selloffs inevitably follow major rallies, gold demand explodes as investors rush to diversify their stock-heavy portfolios. Gold is effectively the anti-stock trade.
As you’d imagine with today’s taxphoria-crazed stock markets, gold investment is really low. One metric to approximate stock investors’ capital deployed in gold is the ratio between the SPX’s market cap and the value of the leading GLD SPDR Gold Shares gold ETF. At the end of December, those 500 elite SPX companies were collectively worth $24,432.5b. That dwarfs the meager capital now deployed in GLD shares.
GLD exited 2017 holding 837.5 metric tons of physical gold bullion in trust for its shareholders. That was worth just $35.1b at $1302 gold. That means only 0.14% of the stock-market capital invested in the SPX companies is invested in the world’s leading gold ETF. I’ve studied the history of this ratio, and it is usually much higher. From 2009 to 2012 for example, GLD holdings’ value averaged 0.48% of SPX market cap.
So there’s no doubt today’s stock investors are radically underinvested in gold. They couldn’t care less about it when stocks apparently do nothing but rally indefinitely. But once the next major stock selloff arrives, gold investment will quickly return to favor. This chart looks at the SPX and gold over the past few years. The last major stock-market correction was actually the catalyst that birthed today’s gold bull!
Mid-2015 was similar to late 2017 in stock-market terms. The SPX was relentlessly powering to endless new record highs while volatility was exceptionally low. Like today, stock traders were excessively bullish and hyper-complacent. It had been a near-record 3.6 years since the last correction, so people foolishly assumed stock-market cycles had vanished. Yet not even extreme central-bank easing can eliminate cycles.
That’s because they are ultimately fueled by the herd behavior of greedy and fearful humans. As long as these powerful warring emotions drive collective trading decisions, stock-market cycles will persist. Gold was despised in that record-stock-market environment, ultimately slumping to a deep 6.1-year secular low late that year. Gold-futures speculators were deeply afraid of the Fed’s coming first rate hike of this cycle.
But when the stock markets finally started falling again, triggered by sharp selloffs in the Chinese stock markets, gold rocketed higher. Stock investors watching their portfolios bleed rushed to get back some gold exposure to mitigate the stock losses. They flooded back into gold with a vengeance, catapulting it 29.9% higher in just 6.7 months in essentially the first half of 2016. That gold-bull uptrend continues today.
In Q4’15 when gold was largely forgotten and despised, GLD’s holdings fell 45.0 metric tons or 6.6%. But in Q1’16 after stock markets corrected sharply, GLD’s holdings soared 176.9t or 27.5% higher! Gold investment demand turned on a dime, and the trigger was the last stock-market correction. Stock selloffs driving surging gold buying is nothing new, so gold will certainly rally again in and after the next SPX correction.
When stock investors want gold exposure fast, they naturally turn to GLD. This gold ETF acts as conduit for the vast pools of stock-market capital to slosh into and out of gold. GLD’s mission is to track the gold price. So when stock investors buy GLD shares at faster rates than gold is rising, this ETF’s price will soon decouple to the upside and fail its mission. GLD’s managers prevent this by shunting that buying into gold.
When GLD-share demand exceeds gold’s own, GLD issues new shares to offset and absorb the excess. The capital raised from these sales is used to directly buy more physical gold bullion for GLD to hold in trust for its shareholders. Big GLD buying by American stock investors alone catapulted gold’s price far higher in Q1’16. That 176.9t surge in GLD’s holdings accounted for 95.2% of the total jump in world gold demand!
So if today’s literally-bubble-valued extremely-overbought hyper-complacent stock markets concern you, start upping your gold allocation before everyone else does. Since gold rallies when stock markets sell off, it’s the ultimate portfolio diversifier. While forgotten when stock markets are high and euphoric, gold is quickly remembered and returned to once material stock selloffs inevitably erupt. Early contrarians win big.
In roughly the first half of 2016 after the last SPX correction, gold again powered 29.9% higher. Investors could’ve easily played that in GLD shares. But when gold rallies significantly, the greatest gains are won in the gold miners’ stocks. Their profits are really leveraged to prevailing gold prices, so their stocks tend to amplify gold gains by 2x to 3x. In roughly the first half of 2016, the leading gold-stock index soared 182.2% higher!
With these taxphoria-inflated stock markets hyper-risky today, the potential upside in gold stocksis huge. This sector is often the only big winner during major stock-market selloffs, whether just bull corrections or full-on bear markets. Gold investment demand surges when stock markets materially sell off, driving gold sharply higher. The great gold miners’ stocks with superior fundamentals greatly leverage gold’s gains.
At Zeal we’ve literally spent tens of thousands of hours researching individual gold stocks and markets, so we can better decide what to trade and when. As of the end of Q3, this has resulted in 967 stock trades recommended in real-time to our newsletter subscribers since 2001. Fighting the crowd to buy low and sell high is very profitable, as all these trades averaged stellar annualized realized gains of +19.9%!
The key to this success is staying informed and being contrarian. That means buying low before others figure it out, before undervalued gold stocks soar much higher. An easy way to keep abreast is through our acclaimed weekly and monthly newsletters. They draw on my vast experience, knowledge, wisdom, and ongoing research to explain what’s going on in the markets, why, and how to trade them with specific stocks. For only $12 per issue, you can learn to think, trade, and thrive like contrarians. Subscribe today, and get deployed in the great gold and silver stocks in our full trading books!
The bottom line is stock selloffs are great for gold. This leading alternative investment is ignored when stocks are high. But since it rallies when stocks weaken, demand soars for portfolio diversification during material stock selloffs. Gold is ready to power higher again once these extreme stock markets inevitably roll over. The next major selloff is imminent given the bubble valuations and extreme overboughtness today.
Republicans’ new corporate tax cuts are good news for the economy, but they won’t boost profits anywhere near enough to work off these dangerous overvaluations. And with the Fed and ECB both engaging in unprecedented tightening campaigns this year, stock markets face fierce monetary headwinds. Gold is the best place to take refuge and grow wealth as normal stock-market cycles finally resume again.
Most people have heard of the DRC, but might not know exactly where to find it on the map of Africa, even if the DRC is the second-largest country on the continent at 2 344 858km². Algeria is the largest country in Africa, covering close to 2 381 741km² of North Africa. In stark contrast to Algeria, of which almost 90% is desert, the DRC straddles the equator, and more than 60% of its surface area is covered in lush rainforest.
In all likelihood, those who are able to pinpoint the DRC on the map will know about the rainforest. But a map does not represent the real vastness of this land. It also does not reveal the incredible geology, rich mineral endowment, fascinating politics, and brutal history that shaped the DRC.
On the heels of the rainforest, brutality and war are what most people think of when you mention the DRC. One of the most brutal men in Africa’s history, King Leopold II of Belgium, is also the man who determined the borders of the DRC. In his feverish haste to exploit the Congo’s natural resources, Leopold II left a path of murder, destruction, and devastation in the late 1800s and early 1900s.
The pillage was taken to new levels when Mobutu Sese Seko came to power in 1965 after ousting Patrice Lumumba, who was the first president after the Congo gained independence from Belgium in 1960. Sadly, the rent-seeking, patronage, and corruption continued when Laurent Kabila overthrew Mobutu. His son, Joseph Kabila, continued the plunder when he became president after his dad died a violent death at the hands of an assassin towards the end of 2001.
Predictability needed
Joseph Kabila continues to rule, although his term of office officially ended in December 2016. According to the DRC electoral commission, elections will now take in December 2018; meanwhile, Kabila has given the assurance that he will step down in 2019, but nobody really knows. That is the problem with the DRC — it is all a guessing game. And, unfortunately, most investors do not like to guess — they want predictability. Therefore, the DRC is high on the list of riskiest countries to invest in globally. “But that doesn’t mean one shouldn’t invest in the DRC. It means you should do your homework properly before you invest,” says Claude Baissac, managing director at Eunomix. Baissac is a specialist in strategy, risk management, and economic policy.
“The DRC has made an extraordinary turnaround in terms of being an attractive mining jurisdiction. The question is: how sustainable is that?” asks Baissac. Despite the DRC’s incredible mineral wealth, to sink a shaft that will take between five and 15 years to start showing a profit, is a risky strategy to follow in such an unpredictable environment. When the stakes are high, politics could become your worst enemy. Add to this a mixture of diverse cultures, ethnicities, conflict minerals, and unscrupulous business practices, and you end up with a toxic brew that has been poisoning the DRC’s economy and hampering growth ever since the Belgian departure. And the situation is not likely to change overnight, despite a number of highly successful mining projects over the past few years.
“Of course, the DRC has tremendous potential, but I think the country remains inherently problematic given the fact that it is not governed in any normal sense of the word,” says Jakkie Cilliers, chairperson of the Board of Trustees and head of African Futures and Innovation at the Institute of Security Studies (ISS).
According to Richard Robinson, managing director of Canadian-listed Alphamin Bisie Mining, politics is one of the company’s most significant non-technical risks, the other being infrastructure, community, and artisanal mining. Alphamin is developing the Bisie tin mine in the Walikale territory, in the south-east of the North Kivu Province, which has been the most volatile part of the DRC for many years. Bisie’s tin sponsored various rebel groups and insurgencies. Furthermore, it was once home to more than 15 000 artisanal miners. Today, only 400 artisanal miners remain.
Politics affect livelihoods
Politics, says Robinson, is crucial, not only for business in the DRC, but also for communities and individuals. “People benefit under a certain regime and system, and when that changes, there is a possibility that it will affect their livelihoods, and that causes anxiety,” says Robinson.
With scheduled elections delayed, the DRC is in deadlock. “There is no clarity about where the country is going, and that means people stall; they don’t make decisions. It is hard to count on much from Kinshasa (the capital of the DRC). But it doesn’t mean we cross our arms and give up. We get a lot of support from the local and provincial authorities, and that means we can move ahead,” adds Robinson.
A source in Goma, the capital city of North Kivu, told African Mining while we were on a visit to the DRC in October last year, that Joseph Kabila has created an environment in which it will be very difficult to hold elections, despite his undertakings to do so. “By fomenting violence and creating instability, Kabila can say that there is too much chaos and that elections are not possible,” said the source that did not want to be named.
There is a lot of suspicion in the eastern parts of the DRC. Rumours are that recent outbreaks of violence in the northern parts of Kivu, involving what is thought to be Islamist-linked rebels from Uganda, have direct links with Kabila. This is all hearsay of course, but it is what the populace in the eastern provinces of the DRC believe.
According to reports, which was confirmed by North Kivu Minister of Mines, Electricity, Small and Medium Enterprises, Industry, and Hydrocarbons, Professor Anselme Paluku Kitakya, the government has now registered all eligible voters and they could technically have elections within six to nine months. Kitakya was adamant that elections would definitely take place.
Weakening the opposition
The continuous postponement of the election date, now to December 2018, is a stalling tactic deployed to weaken the opposition. After the death of the stalwart DRC politician and leader of the Union for Democracy and Social Progress (the main opposing political party in the DRC), 85-year-old Etienne Tshisekedi in February 2017, the main opposition lost some of its momentum. Moreover, the man most people believe should take the reins in the DRC, 52-year-old Moise Katumbi, has been forced to leave the country and is currently in exile. Katumbi, the former governor of the Katanga Province in the south of the DRC, is a successful businessman in his own right, and his appointment as president would be the ideal injection for a faltering economy. Whether the opposition can grind it out and motivate a war-weary nation to take to the streets and put their life on the line for another politician who might forsake them, is, once again, a guessing game.
Robinson says none of these possible scenarios will stop Alphamin from building the mine at Bisie. Kinshasa is almost 2 600km from Goma, and the direct influence that the national government has in the far-flung eastern parts of the DRC, is negligible. Alphamin has worked closely with the local and provincial authorities in the area and that, says their management team, has made a significant difference. The Congolese government owns 5% of Bisie, which is an automatic carry-over from the mining code when a mining company converts its exploration permit to a production license.
Most of the meddling in business and political affairs in these parts seems to stem from the more proximate Rwandan and Ugandan governments. In the past, this interference caused much of the strife in the greater Lake Kivu area, and, according to Robinson, both Paul Kagame, the president of Rwanda, and Yoweri Museveni, president of Uganda, still have a substantial influence in the east. It is doubtful, however, that the situation will deteriorate to the same level of a few years ago, when these countries deployed troops in the Kivu, or propped up rebel groups, which caused endless problems for the local communities. The biggest headache for the government today, though, is in the central province of Kasai, where it is claimed that more than four million people have been displaced. Many of these refugees have made their way down into Angola and that might cause instability. The risk is that Angola might send troops into the DRC, as they have done before, during the second Congolese war from 1998 to 2002.
The power of Rwanda
Nevertheless, there is no doubt that Rwanda has a considerable influence in and around the massive Lake Kivu, which straddles the border of Rwanda and the DRC. Kivu contains about 60 billion cubic meters of methane and 300 billion cubic meters of carbon dioxide. The gases, which originate from nearby volcanic activity and bacteria decomposing organic material in the lake, represent both danger and economic potential. Kivu’s methane could add up to 960MW of electricity-generating capacity to Rwanda and the DRC.
When the rickety plane takes off from Goma International Airport and swings around to Walikale region (where the Bisie Tin Project is located), the gas extraction platform, initiated by Rwanda (even though it seems to be located on the DRC side of the lake), is one of the most noticeable landmarks. Up to now, the DRC government has not invested in any large endeavour to extract the natural gas, although they have been talking about it.
After speaking to many people, it does appear that Rwandan business people’s reach stretches deep into the Congolese rainforest. There have been numerous reports of the illegal smuggling of minerals — and especially those declared as conflict minerals, such as cassiterite (tin), tantalum, and tungsten, which is of course found in abundance in the east of the DRC — across the lake or the border at Goma to Rwanda.
Conversely, gold, found in significant alluvial deposits in the murky rivers of the Congo basin, finds its way through the borders of neigbouring Burundi and Uganda. Thus, despite the implementation of the Dodd Franks Act, the flow of illegal minerals into international markets continue. Dodd Franks is a US law that requires companies that use gold, tin, tungsten, and tantalum to determine if those materials came from the DRC or an adjoining country and, if so, to carry out a due diligence review of their supply. Legal mining companies ‘bag and tag’ their product to indicate that it is conflict free. The problem, however, is that a number of artisanal miners in Kivu still unearth the minerals and sell it to illegal co-operatives, who then take it into Rwanda, tag it there and sell it as legal, conflict-free Rwandan products.
High-risk opportunities
Despite all its challenges, the DRC is an unlimited treasure chest. Its rich mineral endowment includes large deposits of copper, cobalt, tungsten, tin, and gold. According to Dr Nicolaas Steenkamp, geologist and independent consultant, the copper grade is as high as 3% in some deposits. Alphamin’s Bisie Mine contains, according to Boris Kamstra, CEO of the company, up to 4% tin. Moreover, the DRC is the largest producer of cobalt and the second-largest producer of industrial diamonds in the world.
Steenkamp says that in some parts of the DRC, the low cost of mining makes it a major attraction for foreign investors and developers. Other sectors in the mining industry that are performing well include mining equipment leasing and financing. In addition, the hydroelectrical schemes in the country also aid in power generation and transmission in many areas. “The DRC offers opportunities for companies with a high-risk tolerance and familiarity with operating in complex or fragile environments,” says Steenkamp.
For Trevor Faber, chief operating officer at Alphamin’s Bisie, it is almost non-negotiable for contractors to have at least some experience of working in the DRC. It is an added advantage if they have done work in the eastern parts of the country as well. “It is difficult for contractors to do their first job in these parts of the DRC. It is an extremely complex country, legally and logistically, to operate in,” says Faber. Alphamin recently appointed Group Five as the structural, mechanical, piping, and plating (SMPP) contractor, and DRC-based Kongo River, a subsidiary of South African headquartered engineering contractor Teichmann, to do the earthworks at Bisie. “Engineering consultants DRA, who has been on site in Bisie from the start, has years of experience working in the DRC, while Kongo River recently completed an extremely successful project at Randgold Resources’ Kibali gold mine as well,” says Faber. The Kibali gold mine is 560km north-east of Kisangani in the Orientale Province, which is north-east of Bisie. The mine is a joint venture between Randgold (45%), AngloGold Ashanti (45%), and the Congolese parastatal Sokimo (10%).
Jewel of the DRC
Kibali is one of the most successful mining operations in the DRC ever. Last year it achieved the production target of 610 000 ounces, while the underground operations and the integration and automation of the vertical shaft entered the final commissioning and automation stage.
According to Mark Bristow, CEO at Randgold, the only major capital project still to be done, after the completion of the underground mine late last year, is Kibali’s third new hydropower station, currently being constructed by an all-Congolese contracting team.
“To date, over USD2-billion has been spent on acquiring and developing Kibali, of which the majority had been paid out in the form of taxes, permits, infrastructure, and payments to local contractors and suppliers,” says Bristow.
“With capital expenditure tapering off, Kibali should now be preparing to pay back the loans taken to fund its development. We are concerned, however, that its ability to do so will be impeded by the increasing amount of debt — currently standing at over USD200-million — owed to the mine by the government. TVA refunds, excess taxes, and royalties in violation of the country’s mining code, make up the bulk of this amount,” says Bristow.
Bristow adds that the major challenges of operating in the DRC include the volatile political climate and a deteriorating economy. However, he emphasises that Randgold will continue to invest in the DRC. “Our exploration teams are searching for the next big discovery in the greenstone belt of the north-eastern DRC. In line with our local supply strategy, Kibali has spent about USD 40-million with Congolese contractors,” says Bristow.
Mining code under revision
A troubling development though, warns Bristow, is talk of a re-introduction to parliament of a proposed new mining code by the Ministry of Mines. “The so-called new mining code is the same as the one government withdrew in 2015 after it was demonstrated that it would seriously damage or even destroy the Congolese mining industry,” says Bristow.
Minister Kitakya told African Mining over lunch in Goma in October that the mining code is still a long way off from being approved. “The National Minister of Mines has submitted a revised mining code. The scheduling for that to be considered has not yet been fixed,” said Kitakya. He added that the revisions generated a lot of critical input from the DRC National Business Chamber as well as mining companies, and maintained that it would not be passed without some degree of consensus.
The most controversial change to the mining code is a suggestion to increase the free carry-over of an exploration permit to a production permit from 5% to 10%. In addition, there are proposals to raise the taxes on royalties and exports, which prompted the National Business Chamber to contest the proposals. According to Kitakya, the current royalty tax is 2%, while the export tax is 1%. Under the new proposals, that will change to 2% royalty and 5% export tax.
The downside
For all its riches and opportunities, investing in the DRC does have a downside. According to Steenkamp, the sheer size of the country is a constraint. Like all large countries, its vastness presents numerous security risks, and illegal mining is difficult to control. In addition, concerns have been raised about conflict minerals, especially cobalt and the use of child labour. One of the biggest challenges of operating in the DRC, though, is the lack of good infrastructure. “Roads are almost non-existent in some parts of the country, with men and materials having to be transported to site via air charter or boat. Heavy loadbearing roads would have to be built for trucks and fuel will need to be more accessible,” says Steenkamp. He adds that corruption is also viewed by many as being endemic to the country and specifically when it comes to mining deals. An example being that about USD75-million in mining revenue was paid by companies to the Congo Tax Agency and state-owned mining company GECAMINES since 2013, which remains unaccounted for. Notwithstanding these challenges, many projects have been highly successful.
Randgold’s Kibali has exceeded all expectations and has completed a successful expansion programme. Canadian company Ivanhoe Mines, under flamboyant CEO Robert Friedland, continue to spend on exploration at its Kamoa-Kakula deposit and historic Kipushi zinc-copper-silver-germanium mine. In contrast, other companies, like First Cobalt, have withdrawn from the country. The presence of Bristow’s Randgold and Friedland’s Ivanhoe in the DRC tells it all. Both these men run tight ships, but are not scared to invest in what others would perceive as risky jurisdictions. But Bristow has said on many occasions that these are calculated risks, and that he does his homework before entering a new country. Bristow’s high-risk, high-reward approach has been successful in Africa. However, for more conservative investors, the DRC remains a guessing game.
About Leon Louw:
Leon specializes in African affairs and doing business in Africa, and has been writing about mining in Africa for 8 years. He was born in Johannesburg, South Africa, and has traveled Africa extensively, especially southern Africa. He has a BA degree with a specialization in African studies and an honours degree in Africa Politics. He also have a national diploma in Nature Conservation and an honours degree in Environmental Management. It is is passion to promote business in Africa and I can assist companies that are interested in doing business in African countries. You can see his work at African Mining and Mining Mirror and online at http://www.miningafricaonline.co.za/.
The rally in Gold and gold mining stocks easily surpassed our expectations and targets. The strength has been far more than we anticipated. The gold stocks blew past their 200-day moving averages while Gold blew past $1300/oz. Now it is time to take a technical look and focus on the key support and resistance targets.
The strength of the rebound pushed the miners well beyond their 200-day moving averages and to their June and October highs. GDX is consolidating just below $24 while GDXJ is consolidating just below $35. If this consolidation turns into a correction then GDX and GDXJ could find support at their 200-day moving averages which are at $22.71 and $33.37 respectively. As you can see, should GDX and GDXJ be able to exceed recent peaks then they could rally towards important resistance levels. Those are $25.50 for GDX and $38 for GDXJ.
The rally has been just as strong in Gold as it surpassed resistance in the $1300-$1310/oz zone. Gold closed the week at $1322/oz. Should Gold pause or correct here then the sellers could push the market down to previous resistance but now current support at $1300-$1310/oz. Trendline resistance will come into play near $1340/oz while the 2016 and 2017 peaks would provide resistance in the $1350-$1370/oz zone.
While we are at it, let us take a look at Silver which exploded past resistance in the mid $16s. Silver will face resistance first at $17.75 then at $18.50. A break above $17.75 and the red trendline is the first step for Silver. The second would be reaching $18.50, a new 52-week high. Next week Silver will face immediate resistance around $17.30 (the October and November highs) but it will have strong support in the mid to upper $16s.
The precious metals complex has made important progress in recent weeks. Markets have broken key resistance levels and have showed no signs of slipping anytime soon. Gold is holding above previous resistance at $1300-$1310/oz while not being far from multi-year resistance in the mid to upper $1300s. The gold mining stocks have reclaimed their 200-day moving averages while consolidating tightly beneath the June and October highs. If and when GDX and GDXJ break those levels then they will be only one step away from a full blown bull market. That step is breaking above the September highs.
I told subscribers to expect $1320 to function as a headwind for gold on this rally, and that’s happening right on schedule. To understand the nature of this headwind, please click here now. Double-click to enlarge this important weekly gold chart.
Note that the two biggest volume bars both occurred as key events in India occurred.It could be said that when America catches a general stock market cold, world markets get the flu.
Horrifically, when India catches the gold demand sniffles, Western gold and silver stocks can look like they have financial Ebola.
It’s clear that $1320 has functioned as a significant headwind to all the major rallies of the past four years. The good news is that technically, resistance weakens the more times it is tested. I’ve predicted that gold is nearing the day when it shoots up above $1320 and begins the climb towards the next massive resistance zone at $1500.
Will India be the catalyst that launches the price blast to the upside? Well, that’s the most likely scenario, but a big helping hand could come from new central bank chief Powell in America. He’s due to be sworn in on February 4, 2018. That’s less than a month from now.
Powell’s proposed deregulation of America’s small banking industry, combined with rate hikes and quantitative tightening (QT) should create a major money velocity bull cycle.That bull cycle is more important to gold stocks than bullion. There’s no point buying gold stocks if they can’t outperform low risk bullion.
For bullion, the most likely catalyst for significantly higher prices is a long overdue gold import duty cut in India.
The good news is that I’m predicting that both a duty cut and the US money velocity bull cycle are coming. India has national elections in 2019 and Prime Minister Modi’s promises to help jewellers and create a million jobs a month are dismal failures.
To win the election, it’s likely that Modi soon starts spending money like water and asks his finance minister Jaitley to cut the gold import duty. With both India and Powell poised to take action that is positive for gold, all precious metals market investors (both bullion and mine stocks) should feel very comfortable now.
For a closer look at gold’s price action here in the $1320 resistance zone, please click here now. Double-click to enlarge.
The $1300 and $1270 price zones both offer decent minor support. A pullback to $1270 would also increase symmetry in the big weekly chart inverse H&S bottom pattern.
I’m a buyer at both price points, if gold trades there. I never recommend cheering for lower prices, because governments generally hate gold. If the price moves lower, governments can gloat over the supposed superiority of their fiat money, so I never cheer for lower prices.
Gold doesn’t need any “healthy corrections” against government fiat money. As money, gold is always healthy, but price declines do happen, and investors need to take buy-side action at support zones like $1300 and $1270.
The Chinese central bank stopped buying gold once the IMF accepted their fiat yuan into their global fiat currency basket. I expect the same thing to happen in Russia in time. The bottom line is that governments do not like private money, and gold is the ultimate private money.
Gold competes with what are generally pathetic government fiat systems, but as long as governments can prevent gold from becoming a major medium of exchange, investors will always buy gold as an investment to make fiat dollars rather than buying fiat as an investment strategy to get more ounces of gold money.
What could resurrect gold as a medium of exchange globally? For the likely answer, please click here now. Double-click to enlarge this fabulous Ethereum chart. Blockchain (aka crypto) currencies have attained a market capitalization of about $700 billion (USD), and Ethereum is one of the hottest kids on the block!
It’s also one of my top four core blockchain holdings. I’m an eager seller of trading positions this morning in the $1200 zone. Nothing feels better than starting a new day by booking juicy profits. I’ve already placed new orders to buy fresh trading positions in the $1150, $1100, $1050, and $1000 price zones, and I urge all Ethereum fans to consider taking similar action.
My www.gublockchain.com newsletter is designed to put investors in the hottest blockchain currencies and make them richer by taking action at my key buy and sell points.
In the big picture, blockchain infrastructure experts are working to create powerful partnerships between gold and blockchain currency. On that note, please click here now. Goldguard’s fabulous “One Gram” gold backed blockchain token appears to represent just the beginning of an era that will see significant gold-blockchain business partnerships created around the world.
The very nature of bloated government fiat money limits investment returns in those traditional currency markets. In contrast, blockchain’s superior technology and limited supply is making returns that frequently exceed 10% a month the “new investor normal”.
Gold-blockchain partnerships could weaken the power of central banks, and perhaps ultimately make them obsolete. I’ve predicted that central banks don’t become obsolete, but they will be forced to buy private money like Bitcoin, Ethereum, Ripple, and Litecoin. They will start to hold them as central bank and treasury reserve assets when one or more of these key blockchain currencies becomes a widely-used medium of exchange.
The coming blockchain-gold partnerships should boost global demand for gold, and that’s good news for gold stock investors. Please click here now. Double-click to enlarge this great looking GDX chart. A possible flag pattern is in play. If it fails, that failure simply creates a beautiful high right shoulder of an inverse H&S bottom pattern.
Gold and silver stock enthusiasts need to respect the power of $1320 resistance. Investors who are nervous should buy GDX put options. I’m not nervous. I’m excited to watch Modi open the spending spigot and to see Jerome Powell unleash the money velocity hounds at thousands of small American banks, with a deregulatory bomb.
Chinese New Year buying appears to have started early in December but it’s in a lull now. Indian dealers are also in no hurry to buy gold after a $90 rally. The COT report shows commercial traders adding 40,000 short gold contracts, which likely means they respect the $1320 resistance zone. So, gold stock traders can book light profits now. Rebuy lightly if gold trades at $1300. At $1270, all investors should be eager buyers!
Special Offer For Website Readers: Please send me an Email to freereports4@gracelandupdates.com and I’ll send you my free “Rock My Golden Block!” report. I highlight two key crypto currencies for blockchain beginners, and eight junior gold stocks that are “Must Have” stocks for 2018, with key buy and sell points for each stock!
Stewart Thomson is a retired Merrill Lynch broker. Stewart writes the Graceland Updates daily between 4am-7am. They are sent out around 8am-9am. The newsletter is attractively priced and the format is a unique numbered point form. Giving clarity of each point and saving valuable reading time.
Risks, Disclaimers, Legal
Stewart Thomson is no longer an investment advisor. The information provided by Stewart and Graceland Updates is for general information purposes only. Before taking any action on any investment, it is imperative that you consult with multiple properly licensed, experienced and qualified investment advisors and get numerous opinions before taking any action. Your minimum risk on any investment in the world is: 100% loss of all your money. You may be taking or preparing to take leveraged positions in investments and not know it, exposing yourself to unlimited risks. This is highly concerning if you are an investor in any derivatives products. There is an approx $700 trillion OTC Derivatives Iceberg with a tiny portion written off officially. The bottom line:
Are You Prepared?
The gold miners’ stocks have huge upside potential in 2018, likely the best among stock-market sectors. They really lagged gold last year, so a major mean-reversion catch-up rally is coming. The gold miners are universally ignored and deeply undervalued relative to the metal which drives their profits. And gold itself is likely to power dramatically higher this year as euphoric record-high stock markets inevitably start to falter.
Gold has always been the leading contrarian investment, tending to move counter to stock markets. So not surprisingly investment demand stalled last year as the extreme taxphoria-fueled stock surge blasted relentlessly higher. When stock markets apparently do nothing but rally indefinitely, investors feel no need to prudently diversify their portfolios with the anti-stock trade gold. So they ignored the yellow metal in 2017.
That was certainly evident in the leading proxy for gold investment demand, the flagship American GLD SPDR Gold Shares gold ETF. Its physical gold bullion held in trust for shareholders merely grew 1.9% or 15.3 metric tons in 2017. That was a colossal slowdown from 2016’s massive 28.0% or 179.8t growth! Given the weak gold investment demand last year, it’s rather impressive how well gold managed to perform.
Big up-years in the stock markets sometimes drive big down-years in gold, and 2013 was a key case in point. That year extreme Fed easing catapulted the benchmark S&P 500 broad-market stock index (SPX) an amazing 29.6% higher. Exuberant investors wanted nothing to do with gold, and dumped it in droves. So the gold price plummeted 27.9% in 2013, leaving deep psychological damage that persists to this day.
In 2017 the SPX soared 19.4% on hopes for big tax cuts soon from the newly-Republican-controlled US government. Extreme complacency, greed, euphoria, and even hubris ran rampant among investors. It was a perfect scenario to see gold crushed again on a mass exodus of investor capital. Yet despite the stock markets enjoying their best year since 2013, gold was still able to achieve a strong 13.2% gain in 2017!
Nevertheless, the wildly-optimistic stock-market sentiment drowned out everything else so psychology in precious metals remained exceptionally weak. The leading indicators for gold sentiment are this metal’s peripheral leveraged plays of silver and gold miners’ stocks. Both typically amplify gold’s upside by 2x to 3x. But oddly in 2017 despite gold’s big rally, silver and the main gold-stock index only climbed 6.4% and 5.5%.
That index is of course the NYSE Arca Gold BUGS Index, better known by its symbol HUI. It is closely mirrored by the dominant gold-stock ETF, the GDX VanEck Vectors Gold Miners ETF. The composition of these gold-stock trackers is very similar by necessity, as the universe of major gold miners to pick from when building indexes is small. Without scales, it’s impossible to tell the difference between HUI and GDX charts.
In a 13.2% gold up-year like 2017, the HUI really should’ve leveraged that by 2x to 3x to enjoy solid annual gains of 26.4% to 39.7%. Yet because investors weren’t interested in either gold or its miners’ stocks, the HUI languished with that miserable 5.5% gain last year. That made for terrible 0.4x leverage to gold, which is wildly unacceptable. Gold miners must generate greater returns than gold to be viable investments.
Owning gold miners is much riskier than simply owning gold itself. On top of all the price risks that gold faces, the miners heap many additional operational, geological, and geopolitical challenges. They must compensate investors for these considerable added risks relative to owning gold outright, or there is truly no point in owning them at all. 2017 was a rare anomaly where they dramatically lagged gold’s solid rally.
That’s very unlikely to persist into 2018, as we’re already seeing. Since the Fed’s 5th rate hike of this cycle in mid-December, gold and the HUI have rallied 5.5% and 12.8% as of the middle of this week. That makes for solid 2.3x upside leverage, already a vast improvement over last year’s 0.4x. Thus investors are already returning to gold stocks in a meaningful way, and this young trend should accelerate.
The gold miners’ stocks are radically undervalued fundamentally after so horribly underperforming gold last year. Gold mining is a simple business from a profits standpoint. Miners painstakingly wrest gold from the bowels of the Earth, then sell it at prevailing market prices. So their earnings are the differences between current gold prices and mining costs. Gold-mining profitability was actually fairly strong in 2017.
Right after quarterly earnings seasons, I dig into the newest reports from the world’s top gold miners included in that leading GDX gold-stock ETF. In their latest-reported quarter of Q3’17, the top 34 GDX component gold miners averaged all-in sustaining costs of $868 per ounce. AISCs are this industry’s main profitability measure, accounting for not only mining but maintaining production by replenishing reserves.
One of the primary attributes that makes gold stocks so attractive to investors is the fact these costs don’t change much regardless of prevailing gold prices. Over the past 7 quarters ending in Q3’17, GDX’s top-34 gold miners reported average AISC of $833, $886, $855, $875, $878, $867, and $868. That makes for a tight variance, despite gold trading as low as $1074 and as high as $1365 during this same span.
These quarterly major-gold-miner average AISCs within this gold bull have their own mean of $866, so let’s assume this industry can operate at $865 all-in sustaining costs. In 2017 gold averaged $1258 per ounce, so the major gold miners were collectively earning profits of $393 per ounce. That equates to hefty 31% profit margins, levels most industries would die for. Yet gold-mining stocks certainly didn’t reflect this!
The HUI averaged just 196.0 in 2017, incredibly-low levels. This leading gold-stock index first hit 196 in September 2003 when gold was only trading near $375. Back then the major gold miners were far less profitable in both absolute and percentage terms. In 2004 the HUI averaged 212.2, considerably better than 2017 levels despite gold’s super-low average price of $409 that year. Today’s gold-stock prices are absurd!
In 2010 the gold price averaged $1228, a bit below 2017’s $1258. Yet the HUI averaged 471.5, or a whopping 141% higher than last year’s ridiculous levels. The gold miners’ stocks are now priced as if this industry was operating at massive cashflow losses with its very future viability called into question. Yet obviously that isn’t the case, as the gold miners are generating big positive cashflows and profits today.
The only explanation for this epic fundamental anomaly is extreme sentiment, which never lasts for long. Because the stock markets soared in taxphoria last year, investors shunned gold and everything related to it. Thus the gold stocks fell deeply out of favor, universally ignored if not scorned. When that weird psychology inevitably shifts, the beaten-down gold stocks are going to stage a massive catch-up upleg.
There’s plenty of precedent for that. Back in early 2016 when the general stock markets suffered their last correction, gold investment demand exploded for prudently diversifying stock-heavy portfolios. The SPX only fell 13.3% over 3.3 months, but even that minor correction was enough to rekindle big gold buying. That catapulted gold 29.9% higher in 6.7 months, birthing its first new bull market since 2011!
Like today, gold stocks were neglected and anomalously-cheap before that last stock-selloff-driven gold upleg. Then in roughly that same first-half-of-2016 span, the HUI skyrocketed 182.2% higher in just 6.5 months! That made for amazing 6.1x upside leverage to gold. When gold stocks have underperformed their metal, their catch-up rallies are huge and greatly amplify gold’s gains. 2018’s action should echo 2016’s.
Gold stocks certainly have the potential today to see similar fast gains this year to their near-triple in a half-year on gold powering less than a third higher a couple years ago! The lead-in to 2018 was very similar to that lead-in to 2016, with gold stocks deeply out of favor and thus languishing at fundamentally-absurd price levels relative to their profits. But the vast majority of traders haven’t figured this out yet.
Investment is all about buying low then selling high, and that requires buying when assets are unpopular and thus underpriced. Unfortunately most investors ultimately perform poorly because they reverse this. They instead wait to buy until assets are adored, which forces them to buy really high. Then once those assets inevitably mean revert to much-lower levels, investors succumb to popular fear and sell low for big losses.
In late 2015 just like in late 2017, the contrarian gold-stock sector was despised. Few investors were even aware of it, and most of those didn’t want to touch it with a ten-foot pole. Yet in 2016, the gold stocks were the best-performing stock-market sector. The HUI rocketed 64.0% higher that year on a mere 8.5% gold rally, trouncing the SPX’s 9.5% gain! Fighting the crowd to buy low really multiplies wealth.
There’s a high probability the gold miners’ stocks will once again prove the best-performing stock-market sector in 2018. There’s virtually nothing else deeply out of favor and radically undervalued in these entire taxphoria-inflated stock markets! Everything else has already been bid dramatically higher, and thus is susceptible to suffering sharp selloffs as the stock markets roll over. Gold stocks are the only bargains left.
Since prevailing gold prices directly drive gold-mining profitability and hence ultimately stock prices, the HUI/Gold Ratio is a great valuation proxy for this sector. It simply divides the daily HUI close by the daily gold close. When charted over time, this core fundamental relationship reveals when gold stocks are overvalued or undervalued relative to gold. And there’s no doubt the latter is true in spades heading into 2018.
Despite the gold miners’ nice post-FOMC-meeting rally in recent weeks, they left 2017 trading at an HGR of just 0.148x. In other words, the HUI was trading at just under 15% of the gold price. This ratio means nothing in isolation, but years of history shows when gold stocks are high or low compared to gold. And they almost couldn’t be lower today, or more undervalued. Essentially only 2015 saw worse gold-stock prices.
That happened to be the climaxing stretch of a major gold bear that ran 6.1 years leading into the Fed’s first rate hike of this cycle in December 2015. The HGR slumped to all-time lows near 0.09x late that year, extreme and unsustainable. And indeed the gold stocks rallied sharply out of that anomaly, again nearly tripling in a half-year. Gold-stock prices remain super-low, overdue to mean revert dramatically higher.
This long-term HGR chart encompasses a 15-year secular span that included every conceivable market condition for gold and its miners’ stocks. The HGR averaged 0.341x through all of it, or fully 2.3x higher than today’s extreme lows. That means the gold stocks as measured by the HUI ought to be trading at least 127% higher than today’s levels! And that’s assuming gold just stalls out instead of rallying further.
Instead 2018 is almost certain to see gold surge dramatically higher in its next major bull-market upleg. That leaves the gold stocks with early-2016-like potential to skyrocket again, greatly outperforming gold until their stock prices catch up or more likely overshoot to the upside. The driver will once again be these euphoric stock markets rolling over into their next correction or more likely the long-overdue bear market.
Despite the extreme stock euphoria as 2018 dawns, today’s stock markets are hyper-risky. They have powered higher for years now on extreme central-bank easing before the recent taxphoria. But that has forced them to exceedingly-dangerous bubble valuations. The SPX left 2017 with its elite component stocks sporting an average trailing-twelve-month price-to-earnings ratio of 30.7x, above the 28x bubble threshold!
The SPX has now gone 1.9 years without a 10%+ correction, and such selloffs tend to happen at least once a year in healthy bull markets. Now that the highly-anticipated Republican corporate tax cuts have indeed come to pass, 2017’s taxphoria will naturally fade. The more-optimistic Wall Street estimates are for those tax cuts to boost corporate earnings by 10% in 2018, which still won’t justify today’s lofty stock prices.
If this year sees SPX earnings indeed grow 10%, that still leaves its components’ average P/E ratio way up at a near-bubble 27.6x! Stock valuations are so extreme after an extraordinary 8.8-year 301.0% SPX bull market that the biggest US corporate tax cuts ever will barely put a dent in bubble valuations. That leaves stock markets at risk for their first correction-grade selloff since early 2016, which is great news for gold.
But the real coup de grâce to these euphoric record stock markets will be this year’s enormous central-bank tightening radically unprecedented in history. The Fed’s new quantitative-tightening campaign is ramping up in 2018, starting to unwind years of epic quantitative easing. And the European Central Bank is sharply tapering its own QE bond buying by slashing it in half. Together this will strangle this stock bull.
There is nothing more important to the global markets this year than this unparalleled tightening by both the Fed and ECB. I wrote a whole essay analyzing it in depth back in late October, which every investor needs to understand! Compared to 2017, 2018 and 2019 will respectively see $950b and $1450b more tightening and less easing from the Fed and ECB! Nothing remotely like this has ever before been witnessed.
When these central-bank-easing-inflated record stock markets face the biggest central-bank tightening in world history, while trading at bubble valuations no less, the only possible outcome is a serious selloff. At best it will be a major correction approaching 20% in the SPX, but far more likely a new bear market. Those tend to run near 50% losses over a couple years, annihilating wealth of investors who get trapped in them.
Just like in early 2016, the long-overdue next major stock-market selloff will quickly rekindle major gold investment demand. Investors will remember gold when their stock-heavy portfolios start tanking, and rush to diversify into it. The reason gold rallied 29.9% in roughly the first half of 2016 is investors flooded back into gold following the last SPX correction. That was led by American investors heavily buying GLD shares.
This dominant global gold ETF saw its holdings skyrocket 55.7% or 351.1t over that same short span! That was just after a 13.3% SPX correction. Imagine the gold investment demand if we approach 20% or go beyond into the inevitable next bear. The differential GLD-share buying forcing stock-market capital into physical gold bullion could very well be unprecedented. That’s exceedingly bullish for gold stocks!
When this gold-demand-killing stock euphoria inescapably breaks, gold could easily power another 30% higher in 2018. But let’s be conservative and look for a 20% upleg, which would leave gold near $1563. That’s still well below gold’s all-time high of $1894 in August 2011, not extreme by any measure. Gold was above $1550 almost continuously for 1.8 years between July 2011 to April 2013, we’ve seen it before.
At $1565 gold and those top-34 GDX gold miners’ average all-in sustaining costs of $865 during this gold bull, their profits would soar to $700 per ounce! That’s 78% above 2017 levels. There’s nowhere else in all the stock markets where such huge earnings growth is even possible, let alone probable. Such a big surge in profits coupled with excessively-low gold-stock prices would lead to huge fundamentally-driven gains.
At $1565 gold and that 15-year-average 0.341x HGR, that implies the HUI fair value is around 534. That is 170% above this week’s gold-stock levels. Thus much like early 2016, the gold stocks truly have the potential to nearly triple again in 2018 on higher gold prices! Even better, after being excessively low the gold stocks tend to not just mean revert but overshoot to overvaluations. So their upside potential is huge.
The gold stocks are really a coiled spring today, ready to explode higher in 2018 and trounce everything else. They are deeply out of favor, incredibly undervalued, and one of the only sectors that can rally sharply when general stock markets sell off. If you want to multiply your wealth this year by fighting the crowd to buy low then sell high, this small and forgotten contrarian sector is the place to be. Nothing else rivals it.
While investors and speculators alike can certainly play gold stocks’ coming powerful upleg with the major ETFs like GDX, the best gains by far will be won in individual gold stocks with superior fundamentals. Their upside will far exceed the ETFs, which are burdened by over-diversification and underperforming gold stocks. A carefully-handpicked portfolio of elite gold and silver miners will generate much-greater wealth creation.
At Zeal we’ve literally spent tens of thousands of hours researching individual gold stocks and markets, so we can better decide what to trade and when. As of the end of Q3, this has resulted in 967 stock trades recommended in real-time to our newsletter subscribers since 2001. Fighting the crowd to buy low and sell high is very profitable, as all these trades averaged stellar annualized realized gains of +19.9%!
The key to this success is staying informed and being contrarian. That means buying low before others figure it out, before undervalued gold stocks soar much higher. An easy way to keep abreast is through our acclaimed weekly and monthly newsletters. They draw on my vast experience, knowledge, wisdom, and ongoing research to explain what’s going on in the markets, why, and how to trade them with specific stocks. For only $12 per issue, you can learn to think, trade, and thrive like contrarians. Subscribe today, and get deployed in the great gold and silver stocks in our full trading books!
The bottom line is gold-stock upside potential is huge in 2018. The gold miners really lagged gold last year due to the extreme stock euphoria gutting gold sentiment. That left gold stocks deeply out of favor and exceedingly cheap relative to the metal which drives their profits. This extreme anomaly won’t last for long, as investors will flood back into these fundamental bargains as gold starts powering higher again.
Gold investment demand is set to surge again when these euphoric stock markets inevitably roll over into their next major selloff. The likely trigger will be massive central-bank tightening at wildly-unprecedented levels. The last time stock markets corrected, gold shot up almost a third while gold stocks nearly tripled in merely a half-year! 2018 is perfectly set up for a similar scenario, portending massive gold-stock gains.
Through mid-December 2017, rough diamond prices are up 2.7%* year-to-date, while polished prices are down 3.5%**. However, despite shrinking manufacturer margins, the midstream segment of the industry still bought $5.3B worth of diamonds from De Beers this year, including $450M at the final sight which was 7% over the comparable sight last year and 81% over 2015.
De Beers’ full-year sales were -5% relative to last year and +53% over 2015. Russian-major, ALROSA (MICEX: ALRS), is on pace to sell $4.4B of diamonds in 2017, which would be in line with 2016 and 27% over 2015.
2017 has been a year of excess inventory shifting from the upstream segment of the diamond industry to the mid-stream segment. For instance, industry leaders De Beers and ALROSA have both see their inventories decrease by an estimated 1.6M and 2.3M carats, respectively, through Q3 2017, this despite both producers also increasing production this year.
World-wide natural diamond production is estimated to rise to approximately 148M carats in 2017 which would be a 7% increase in volume over last year. The increase mostly due to the commencement of production at three new mines, the ramping-up of production at previously curtailed operations and expansion projects at legacy mines.
Chart of rough and polished diamond price spread in 2017. Source: Paul Zimnisky
Despite various operating setbacks and political challenges that have disrupted production at multiple mines this year, including an accident that has since halted production at ALROSA’s Mir mine, most major miners are still on pace to produce towards the higher end of guidance ranges.
Most industry participants would agree that the first half of 2017 was strong, however, the second half relatively disappointing. Demand for rough returned aggressively in early-2017 as manufacturers in India recovered from the late-2016 liquidity crisis caused by the government’s demonetization of high denomination bank notes.
However, by mid-year, new polished entering the market compounded an already overstocked global polished inventory and manufacturers noticeably pulled back operating activity punctuated with longer-than usual Diwali factory closures in the fall.
In recent weeks manufacturer activity has begun ramping up again, as the industry prepares to replenish Christmas and Indian wedding season stock and deliver for Chinese New Year demand.
The U.S. consumer market is currently supported by a relatively strong economy. With the stock market regularly making new all-time highs and with most employment figures at favorable levels, consumer sentiment is positive. Pending tax reform and the recent appointment of a new Fed chairman that favors continued dovish policy has supported this trend.
America’s largest jeweler, Signet Jewelers (NYSE: SIG), had a challenging 2017, however most of underperformance can be attributed side effects associated with the company restructuring, and not necessarily the appetite of the U.S. consumer. In fact, globally-diversified Tiffany & Co. (NYSE: TIF) recently noted the U.S. market as one of its strongest.
A Luk Fook storefront in Macau. Source: Luk Fook Jewellery Group Ltd.
Tiffany also noted particular strength in the company’s Mainland Chinese market. Recent results from leading Greater China jeweler, Chow Tai Fook (HK: 1929), supports this as the company has seen same-store-sales growth for four consecutive quarters in its Mainland market and three consecutive quarters in Hong Kong/Maccu.
Luk Fook (HK: 0590), which has a greater exposure to Hong Kong than Chow Tai Fook (which is more Mainland focused), had same-store-sales growth of over 11% in the six-months ending September 30, which stands out against three prior comparable years of decline.
On November 21, Chow Tai Fook described the current market as a “turning point…given the nascent jewelry market recovery” and Luk Fook has recently described the climate as “improved.”
The U.S. is still by far the largest end-consumer market for diamonds at about 50%. Greater China, which includes Mainland China, Hong Kong, Macau and Taiwan, and India represent the industry’s fastest growing large markets.
Global diamond supply is estimated to marginally decrease about 1.5% in 2018 to 146M carats and global polished diamond wholesale demand is estimated to hit $26.6B next year, which would be a 3.8% increase over 2017.
Heading into 2018, here are some possible diamond industry catalysts to watch for:
Indian billionaire Anil Agarwal who has a fond interest in diamonds and is now the largest shareholder of De Beers’ parent Anglo American (LSE: AAL) after accumulating shares throughout 2017, could make a move to gain control of the company in 2018
Next year ALROSA will decide whether to rebuild or close the Mir mine after it sustained a flooding accident in August 2017; a decision to permanently close the mine would be supportive of global supply/demand dynamics, e.g. the loss of Mir production would offset the combined new supply from Renard and Liqhobong (two of the three mines that commenced production this year)
The Mir underground mine in Russia. Source: ALROSA
In December Tiffany & Co. stock rallied to just shy of an all-time high in part due to takeover speculation, an event that could possibly play out in 2018 as favor for international luxury returns
Lucara Diamond Corp (TSX: LUC) is back to mining fresh South Lobe ore, the portion of the Karowe ore body that produced the Lesedi La Rona and Constellation diamonds; with a new advanced large-stone recovery system in place, Lucara has the potential to produce more newsworthy diamonds in 2018
Signet Jewelers could recover after a disappointing 2017 as company-wide restricting plays out, including selling its customer credit portfolio, closing underperforming mall-based stores, expanding at off-mall locations, integrating web and digital into sales strategies, and executive level change
Zimbabwe’s government-run ZMDC (private) has commenced conglomerate mining at the Marange fields with $30M of new equipment which could increase production in 2018 to an estimated 3.5M carats from just over 2.0M carats in 2017
De Beers’ Voorspoed mine in South Africa, Gem Diamond’s (LSE: GEMD) Ghaghoo mine in Botswana, and previous-Rio Tinto (LSE: RIO) diamond project, Bunder, are all up for sale and could have new owners in 2018
As production at De Beers’ and Mountain Province Diamonds’ (TSX: MPVD) Gahcho Kué mine approaches deeper depths in 2018, more production could come from center-lobe ore which is expected to be of lower grade but host higher-quality diamonds
Kennady Diamonds (TSX-V: KDI) and Peregrine Diamonds (TSX: PGD) both disclosed that they had been in discussions with potential strategic partners in 2017, an indication of possible deals in 2018
Stornoway Diamonds’ (TSX: SWY) waste sorting circuit which is being installed to alleviate diamond breakage during processing could prove effective when it goes live in Q2 2018, the likely result being a higher average diamond price achieved for Stornoway’s Renard goods
The Karowe mine in Botswana. Source: Lucara Diamond Corp
Following a disappointing 2017, mining of lower grade areas at Firestone Diamonds’ (LSE: FDI) Liqhobong mine nears completion and production is expected to move to areas of the open pit that host higher quality diamonds in 2018
A review of the proposed South African Mining Charter will take place in mid-February 2018, which could have implications on ownership and operations of diamond companies in the country including De Beers and Petra Diamonds (LSE: PDL)
Further work at Luaxe in 2018, arguably the most important undeveloped diamond project in the world, could provide further clarity on resource and production details and a production start date, which is now anticipated for some time after 2020
A continued weaker U.S. dollar in 2018 could support momentum in global consumer luxury demand, while a shift in trajectory could have an adverse effect
An updated feasibility study on Shore Gold’s (TSX: SGF) Star-Orion South project in Saskatchewan Canada, is anticipated in 2018, which could change the economics of the project by reducing an almost $2B pre-production capex
Rough diamond sample from the Star-Orion South project in Canada. Source: Shore Gold
North Arrow Minerals (TSX-V: NAR) is expected to set up an exploration camp and drill its Mel property in 2018, the site of Canada’s newest diamond discovery, which could further indicate the significance of the discovery
Lab-created diamond production expected to continue to increase in 2018, however wider-consumer appetite for the product is still unclear and production of larger gem-quality stones is still just a fraction of the natural equivalent production
Dunnedin Ventures (TSX-V: DVI) has plans to conduct the company’s first drill program in 2018 at its Kahuna project in Canada’s Nunavut territory which could result in a new discovery near Agnico Eagle’s (TSX: AEM) Meliadine gold mine currently in development
Lucapa Diamond (ASX: LOM) expects to commence production at Mothae in Lesotho in the second half of 2018, a mine with the potential to produce diamonds worth in excess of $1,000/ct on average
The Diamond Producers Association, established by the diamond industry to return generic marketing to diamonds, could impact consumer demand following the launch of a second U.S. campaign and first Indian campaign in November 2017 and first Chinese campaign in April 2018
Five Star Diamonds (TSX-V: STAR) plans to continue progressing exploration and development on over 20 kimberlite projects in Brazil in 2018, which could lead to Brazil eventually becoming a more important contributor to global diamond supply
U.S.-based lab-created diamond producer, Diamond Foundry (private), plans to build a “MegaCarat foundry” in Washington state, with first reactors expected to be deployed by Q2 2018, which would add to the company’s current annual production estimated at approximately 100k carats
—
*Rough diamond price based on the Zimnisky Global Rough Diamond Price Index. More information can be found at www.roughdiamondindex.com. **Polished diamond price based on data gathered via sampling of online retailers, specifically round, 0.5-1.5 carat, near-colorless, VS-clarity, VG-cut diamonds.
All figures in U.S. dollars unless otherwise noted.
De Beers is 85% owned by Anglo American plc and 15% owned by the Government of the Republic of Botswana.
At the time of writing the author held a long position in Lucara Diamond Corp, Stornoway Diamond Corp, Mountain Province Diamonds Inc, Kennady Diamonds Inc, Tsodilo Resources Ltd, North Arrow Minerals Inc, Signet Jewelers Ltd and Peregrine Diamonds Ltd. Please read full disclosure below.
Paul Zimnisky is an independent diamond industry analyst, author of the Zimnisky Global Rough Diamond Price Index and publisher of the subscription-based State of The Diamond Market monthly industry newsletter. In 2018, he will be speaking at Mining Indaba in Cape Town, South Africa on February 6, and Mines and Money in New York on May 9. Paul can be reached at paul@paulzimnisky.com and followed on Twitter @paulzimnisky.
by: Northern Miner Staff Writer, SEPTEMBER 27, 2017
The geological model Bonterra Resources (TSX-Venture: BTR) is applying to its Gladiator gold project in the Abitibi belt of Quebec is proving to be a reliable predictor of where extensions of the already substantial deposit will appear.
As a result, the Vancouver-based company has been able to quickly expand the known gold mineralization along strike and at depth and is finding multiple new mineralized horizons within the 105 square kilometre land package.
“We let the deposit do the talking,” says Dale Ginn, Bonterra’s Vice-President of Exploration. “It’s a classic stacked vein system that responds well to a combination of till sampling, magnetics, and LIDAR (remote sensing using lasers).”
Location map of Bonterra Resources’ gold projects in the Abitibi gold belt of Ontario and Quebec. Credit: Bonterra Resources.
An ownership map outlining Bonterra Resources’ Gladiator gold property and surrounding area in Quebec. Credit: Bonterra Resources.
The Gladiator gold deposit occurs within highly silicified, altered and sheared mafic volcanics, with local intrusions of syenite and quartz porphyry. Smoky quartz veins contain most of the mineralization including free gold, minor pyrite, chalcopyrite and sphalerite, especially in or near the vein contacts.
In 2012 Snowden Mining Industry Consultants identified an inferred resource of 905,000 tonnes grading 9.37 grams gold per tonne (273,000 contained oz.) within a relatively small deposit.
Since then, Bonterra has extended mineralization to a strike length of 1,200 metres and a depth of 1,000 metres below surface. The deposit remains open in all directions and drilling has identified at least five distinct sub-parallel zones.
A gold-rich core sample from Bonterra Resources’ Gladiator gold project in Quebec. Credit: Bonterra Resources.
The Abitibi greenstone belt straddling the mining-friendly jurisdictions of Ontario and Quebec is receiving a great deal of attention these days because of its potential to host more gold deposits such as Gladiator within an already prolific camp with excellent infrastructure. A relatively high gold price, at roughly US$1,300 per oz., is an added incentive.
The Urban-Barry sub-belt that hosts the Gladiator deposit is an underexplored section of the Abitibi. Encouraged by progress at Gladiator, Bonterra has more than doubled its land position along the northeast trending shear structure and its exploration team is consistently intersecting high-grade zones at mineable widths with step out drilling.
“Bonterra has found a new high-grade deposit that looks like it will have some size and that’s a very rare thing, especially within a jurisdiction that is open for business,” says Ginn, an experienced geologist and mine executive who has participated in several gold and base metal discoveries. “Every single drill hole is adding ounces and the mineralization is becoming predictable.”
High profile investors have taken note. In March, Kinross Gold (TSX: K; NYSE: KGC) purchased a 9.5% stake in the company for $5.2 million. Other major shareholders include Eric Sprott, Kirkland Lake Gold (TSX: KL; NYSE: KL) and New York-based Van Eck. Their confidence in the junior has had a domino affect, allowing Bonterra to raise another $35 million through two oversubscribed bought deal financings and one private placement.
As a result of the recent deals, Bonterra now has about 162 million shares outstanding and a market capitalization of $65 million. Shares have been trading in a 52-week range of 21-55 cents with recent trades closer to 40 cents.
With exploration financing secured, Bonterra will ramp up its drill program at Gladiator, adding two drills to the four already turning. Some of the work will focus on infill drilling in preparation for an updated National Instrument 43-101 resource estimation in the first half of 2018. The rest will test exploration targets identified along the company’s extensive land package.
If Bonterra continues to demonstrate continuity in the 800 metre long gap (the “Rivage Gap”) between the Rivage Zone — once thought to be a distinct, separate deposit to the west — and Gladiator, resources would increase significantly from the 273,000 ounces identified by Snowden. Recent drill results within the gap include 3.8 metres grading 16.8 gpt and three metres grading 21.5 gpt gold.
Bonterra also has a 100% stake in the Larder Lake project in the Abitibi belt, acquired in 2016 for $4 million in cash and shares, or approximately $4 per ounce of gold in historical resources. The property hosts the Bear Lake, Cheminis and Fernland deposits that occur along 10 kilometres of the Cadillac-Larder break between Kirkland Lake and Virginiatown in Ontario.
Various groups have drilled more than 100,000 metres at Bear Lake over the years and the deposit remains open at depth. It has two shafts and mine development extends to a depth of 330 metres. With access to such an extensive database for modelling, Bonterra intends to conduct a thorough geological review of the historical data and conduct further exploration based on the results.
But for now, all eyes are focused on Gladiator, where an aggressive drilling program is confirming and adding ounces to a gold deposit that drew the attention of sophisticated investors early on and continues to reward them.
— The preceding Joint Venture Article is promoted content sponsored by Bonterra Resources Inc. and written in conjunction with The Northern Miner. Visit bonterraresources.comto learn more
— Bonterra is an advertiser with MiningFeeds.com. MiningFeeds was compensated in cash for marketing services. This article was published with permission from management at Bonterra Resources.
There are very few sellers left
There were very few sellers left in January 2016 when the devastating “forever bear” was about to end. Six months later and a 150% rebound in the large caps and 200% rise in the juniors (GDXJ) provided sellers an opportunity. They drove the miners and juniors down by 40% to 45% in less than five months. However, both GDX and GDXJ have been able to hold above that low multiple times. GDX has held $21 four times! GDXJ has held $29.50 twice in solid fashion.
The bears had multiple opportunities in 2017 to push the miners lower but the miners held above their December 2016 lows and maintained the 62% retracement of the 2016 surge. The miners did not break out in 2017 but they held key support multiple times and the latest rebound suggests selling power has dried up.
The recovery pattern following a mega-bear market bodes well for gold stocks in the second half of 2018
In November we wrote about this history and the potential implication for gold stocks in 2018 and beyond. The mega bear markets that compare to gold stocks from 2011-2016 with respect to price (+80% decline) and time (+2 years) follow a distinct pattern. The initial rebound is sizeable in price but not so much in time. That gives way to a correction and consolidation that lasts a minimum of 18 months. Then the market surges higher in third-wave like fashion.
The gold stocks are nearly 17 months through their consolidation. We do not know if the consolidation is ending soon or if it will last another three, six or even nine months. We do know that history argues the correction and consolidation should end sometime in 2018.
Gold is not too far away from breaking out
Gold is much closer to breaking its 2016 high than the miners but the miners could begin to sniff that potential breakout in Gold before or as it happens. Gold recently bottomed around $1240 with sentiment indicators at encouraging levels. In the chart below we plot Gold along with its net speculative position as a percentage of open interest (CoT) and the GLD put-call ratio. The CoT recently touched 27% which, although not a bearish extreme is fairly low relative to most readings since February 2016. The GLD put-call ratio recently touched the highest level in more than two years. With current sentiment relatively muted, Gold has a chance to rally up to trendline resistance. That would put it in position to breakout sometime in 2018.
Gold Stocks are one of the few sectors that offer compelling value
As we discussed last week, the gold stocks continue to offer historic value. The value is not quite as historic as in January 2016 when it was absolutely historic but it remains exceptional. Outside of the commodity sector there is nothing in a value sense that compares with the gold stocks. Even within the commodity sector, there is little that compares to gold stocks. Heading into 2018 traders and investors have to be intrigued at the deep value opportunity in the gold stocks in nominal and especially relative terms.
Increasing inflation expectations
Commodities typically outperform at the end of an expansion and into the beginning of a recession. This is accompanied by rising inflation. Some commodity sectors have performed well but the commodities as a whole (CRB or CCI) has yet to make new highs. One thing that could trigger a sharp rise in inflation expectations would be a breakdown in long-term bond prices.
In the chart below we plot the 5-year bond price, the 10-year bond price and the 30-year bond price. The 5-year bond has already broken to a 7-year low while the 10-year bond is not far behind. The 30-year bond continues to hold above its 2015-2016 lows but does not have much wiggle room. A breakdown in the 10-year and 30-year bonds may not be immediately bullish for precious metals but a continued decline or acceleration to the downside would be.
The strength of the current rebound in the gold stocks has definitely surpassed our expectations and the December lows should hold moving forward. If that is the case then a breakout move for the gold stocks this year is more likely than not. More backing and filling may be ahead but if GDX and GDXJ can surpass their September highs it would be a very good sign for 2018. The miners have plenty of work to do before a true breakout move can begin but traders and investors would be wise to keep a close eye on the sector. We prefer companies with strong fundamentals that are trading at reasonable values and have upcoming catalysts that will drive buying. To follow our guidance and learn our favorite juniors for 2018, consider learning more about our premium service.
1. The world’s most awesome asset is taking the world gold community into the new year with grand style.Pleaseclick here now. Double-click to enlarge. Gold has stunned most analysts and roared to my $1310 target price without missing a heartbeat!
2. The bull wedge pattern is both majestic and powerful. The ultimate price target of this pattern is a minimum price of $1350 and arguably as high as $1490.
3. When “QE to Infinity” and the death of the American economy was accepted as “the new normal” in both the gold and mainstream communities, I argued vehemently against that view.
4. Instead, I laid out an intense scenario involving an imminent multi-year process that would involve a taper to zero, relentless rate hikes, quantitative tightening, and ultimately a massive reversal in US M2V money velocity.
5. I’ve predicted this reversal will create a powerful bull cycle in gold and silver stocks, making them one of the best performing assets on the planet.
6. Please click here now. I think many gold investors are underestimating just how little inflation it really takes to create an institutional panic in US stock and bond markets.
7. I’ve predicted that this inflation likely happens by mid-2018. Clearly, institutional investors view even a modest rise of inflation as a major concern, if not outright panic. Please click here now. This is the type of statement that entices institutional money managers to buy lots of gold, silver, and mining stocks.
8. They like to see consistent price appreciation with reasonable volatility, and a modest rise in inflation is exactly what the doctor has ordered to make that happen.
9. I realize that the election of President Trump has been wildly celebrated by many gold market investors. They are fed up with the endless socialism and war mongering policies that have hallmarked recent administrations, but I would caution investors that presidents don’t change the nature of business cycles.
10. The policies that presidents enact tend to slightly limit or magnify the business cycle, but most of what happens in business is not related to the actions of the president.It’s related to inflation, wages, interest rates, corporate earnings, demographics, and stock market valuations.
11. There has been a sudden focus in the gold community on US GDP growth being “set to rise” under Trump. In contrast, like myself, most institutional investors are now focused on the rise of inflation in this late stage of the business cycle.
12. This inflation tends to appear suddenly and can cause great harm to stock market investors. At the current point in the business cycle, tax cuts without government revenue cuts are inflationary. Imminent bank deregulation is also inflationary.
13. The bottom line for President Trump: From a fundamental perspective, almost everything he is doing can boost growth in the next business cycle, but it will boost inflation more than growth at this stage in this cycle.
14. Around the world, the situation is similar. The government in India is taking action that should boost growth, but boost inflation more than growth.
15. Inflation is also beginning to pick up in Japan, and the end of QE there could move enormous amounts of capital out of the deflationary hands of the central bank and into the inflationary hands of the fractional reserve commercial banking system.
16. Please click here now. Double-click to enlarge this fabulous silver chart.
17. The fact that silver acts and feels timid at the point in the rally is good news. It tends to lead gold near the end of major rallies, and I’ll suggest that this inverse head & shoulders bottom pattern indicates that a major upside inflationary scenario is just beginning. Note my medium term $21 – $22 price target.
18. Silver investors should be going into 2018 with a feeling of great confidence, because this mighty metal tends to get serious amounts of institutional respect when inflation moves higher. For all investors, silver bullion and leading silver stocks should be a key holding now.
19. Please click here now. Double-click to enlarge this ominous dollar versus yen chart. Major FOREX investors flock to gold and the yen when risk in stock and bond markets grows. I believe the head and shoulders topping action on the dollar relates to institutional concern about inflation. This price action is great news for gold investors around the world.
20. Please click here now. Double-click to enlarge. Blockchain (crypto) currencies are consolidating their recent spectacular gains against the government fiat bubble currencies. Blockchain currency is newer, fresher, and better than fiat, and the current consolidation in the sector is very healthy. I was happy to see Mr. James “Gold Is Money” Turk recently call government fiat a bubble against blockchain. He’s a highly respected man whose views carry weight in the gold communy, and it’s great to see him join the “Fiat is the bubble, not blockchain!” team.
21. I highlight the crypto currencies on the move with my www.gublockchain.com newsletter. Ripple is a key currency with major institutional backing. That makes it a solid holding for me. Note the classic bullish technical action occurring on this chart. Volume rose as ripple rallied, and declined as the price softened. Both the price and volume have been quiet over the holiday. Ripple appears poised to surge higher imminently, probably to my five dollar target price zone.
22. Please click here now. Double-click to enlarge this great GDX chart. As inflation rises modestly at first, and then enough to create a stock and bond markets crash, I expect GDX to deliver bitcoin-style performance to the upside.
23. In the short term, the GDX price action is technically powerful. In the long term, I think relentless inflation will help Chindian citizens fall in love with Western gold stocks. While it will take time, that love affair should drive GDX to at least $5000 a share, and perhaps to as high as $20,000.
24. Any right shouldering action that occurs in GDX now is likely to be at a price area well above the left shoulder lows. There’s a flag-like pattern in play as well. This is a truly awesome start to the year for gold, blockchain, and the entire anti-fiat family of assets. My warm wishes go out to all investors, as they prepare to enjoy a very special and profitable year in the gold market!
____________
Stewart Thomson is a retired Merrill Lynch broker. Stewart writes the Graceland Updates daily between 4am-7am. They are sent out around 8am-9am. The newsletter is attractively priced and the format is a unique numbered point form. Giving clarity of each point and saving valuable reading time.
Stewart Thomson is no longer an investment advisor. The information provided by Stewart and Graceland Updates is for general information purposes only. Before taking any action on any investment, it is imperative that you consult with multiple properly licensed, experienced and qualified investment advisors and get numerous opinions before taking any action. Your minimum risk on any investment in the world is: 100% loss of all your money. You may be taking or preparing to take leveraged positions in investments and not know it, exposing yourself to unlimited risks. This is highly concerning if you are an investor in any derivatives products. There is an approx $700 trillion OTC Derivatives Iceberg with a tiny portion written off officially. The bottom line:
Are You Prepared?
There is a clear point of cyclical investment plays: buy when then market is down, sell when the market is up. The downside? No one really knows when the dawn is about to break, and for investors in Sierra Leone’s mining sector, it’s only getting darker out there.
Recent weeks have brought news of mismanagement, assault, creative accounting and fleeing investors from the Marampa iron-ore project in Sierra Leone. There, Gerald Metals, a US-based commodities group, have struggled to reward investor confidence by failing to remove Marampa from care and maintenance despite the improvement in iron ore prices. Earlier in the year, Gerald’s key partners Shanghai Pengxin Investment Co Ltd. pulled out. Voting with their chequebooks, a number of Gerald’s lead creditors also jumped ship last week.
The problems for Marampa could only be getting worse. To market its product, Gerald Metals has sold investors on a promise of producing a higher grade of steel through a joint-venture with another local mine. In addition to relying on the rail network built to support the Tonkolili mine, Gerald Metals has trumpeted an agreement to blend the output from Marampa with that of Tonkolili to produce a higher quality, and higher value product. It was a very good idea.
The trouble: Tonkolili’s owners are now in almost as much trouble as Gerald.
In an email to investors at the tail end of 2017, Tonkolili’s operators, Shandong Iron & Steel Group Co, a Chinese outfit, explained that the company was going through a period of ‘financial hardship’ and would be suspending operations [1]. Shandong took ownership of Tonkolili in the wake of the collapse of its previous owner, African Minerals. The mine was placed in care and maintenance in 2014 as a result of Shandong, then owners of just 25% of Tonkolili, cutting the purse strings just as the mine required expansion. Shortly afterwards, Tonkolili’s owners went into administration and Shandong snapped up the remaining 75% at a fire-sale price [2].
But just like Gerald Metals’ at Marampa, Shandong have failed to deliver as majority owners of a previously minority share. Talk on the ground in Freetown suggests that not only is Shandong in financial difficulty, the company hasn’t actually been exporting anything out of Sierra Leone for almost four months. All the while, a half-laden ship is left anchored and rusting at Pepel Port at a demurrage cost in excess of $15,000 per day.
Of course, the issues we are seeing at Shandong and at Gerald Metals point to a much more worrying concern. What is going on with the due diligence procedures that the Government of Sierra Leone undertakes in the tendering process for mining licences? In an economy desperately in need of stable management of staple assets, the Government does not have the luxury of entrusting the state’s greatest resource pots to incompetent operators. Marampa and Tonkolili are two of the country’s biggest potential revenue earners: one is run by an accountant and his investors are leaving in droves; the other is quicker to cut and run than to stay and fight.
Oddly, spirits at these companies remain high. A punchy press release issued before Christmas by Brendan Lynch, CFO of Gerald Metals and formerly of collapsed Indian group Zamin Ferrous, thanked banks for their ongoing support of the Marampa project. But that faith, and indeed those thanks, may be short-lived.
Even with credit lines secured, if diminished, Gerald’s investors must now surely need to be reassured that the problems at Tonkolili will not affect assurances given over Marampa. It is hard to see how concrete pledges over any production targets, jobs or revenue projections can be given with the chief means of export and refinery in such dire straits. And there’s more to come. The full force of the Cape Lambert law suit is yet to be seen, and with Gerald Metals still needing to raise more than $50 million of investment to restart work at Marampa, the creditors will have reason to worry. One of those creditors, Dr. Adesola Adeduntan, the CEO of First Bank of Nigeria, recently met with President Bai Koroma [3]. If any assurances were given over the state of Government checks and balances on the private sector, examples like Marampa give plenty of reasons for that confidence to wear thin.
And as these questions begin to mount, and answers fail to convince, we cannot ignore the spectre of the authorities should their attention be drawn once again to Sierra Leone. It would be naïve to suggest that the Serious Fraud Office (SFO) and National Crime Agency (NCA) based out of the United Kingdom will not have any irregularities on their radar following the summer’s bribery drama at Sierra Rutile [4]. All foreign investors in Sierra Leone must toe a very careful line.
So as news this week tells us that Sierra Leone’s Ministry of Finance and Economic Development is planning to set up a task force to help the government ‘better manage revenue received’ from its mining sector, we may well ask where its priorities should fall. Given recent performance issues, I believe its first task should be looking at failing assets under foreign ownership. It is a scandal that is robbing the country of development, the people of jobs and the government of revenues that it badly, badly needs. Perhaps then there’ll be fewer smiles at Gerald Metals and Shandong when a little accountability comes knocking.


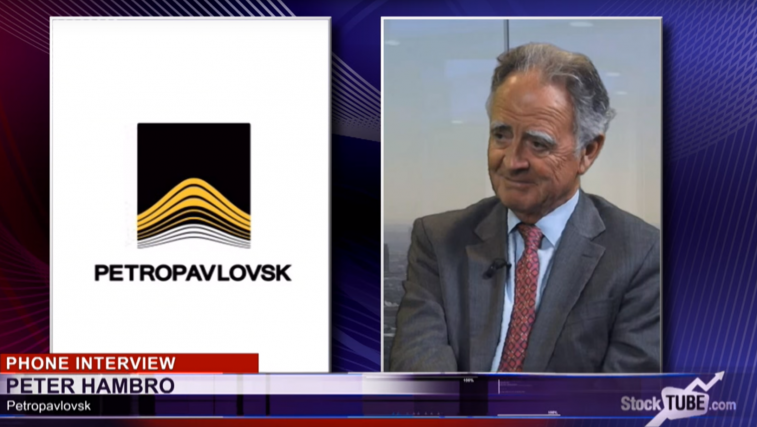

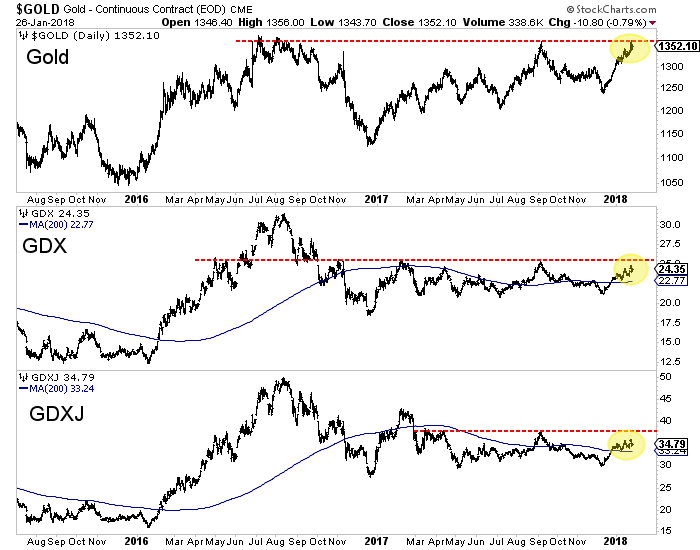
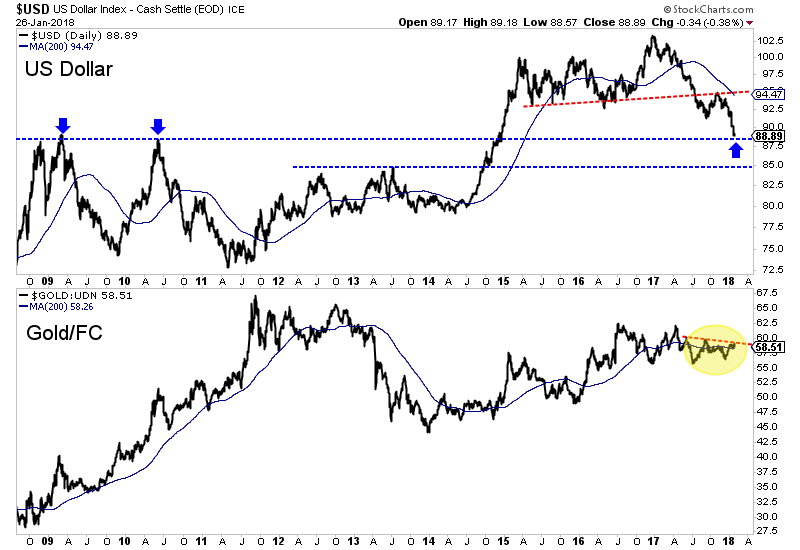
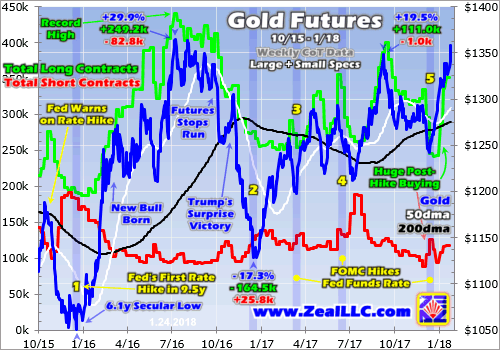
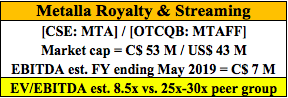
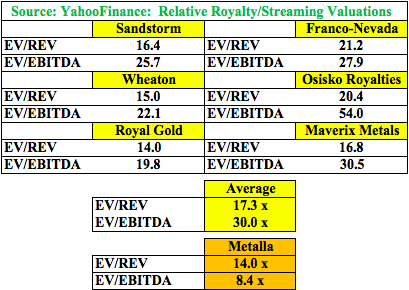

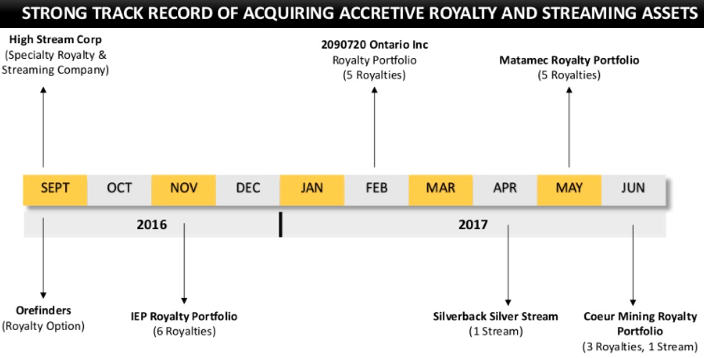
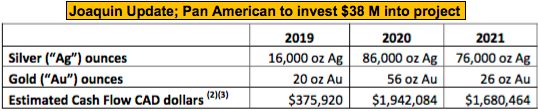

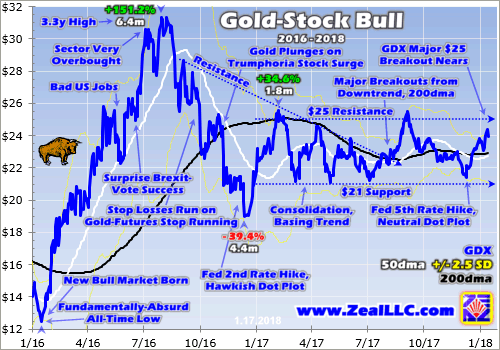
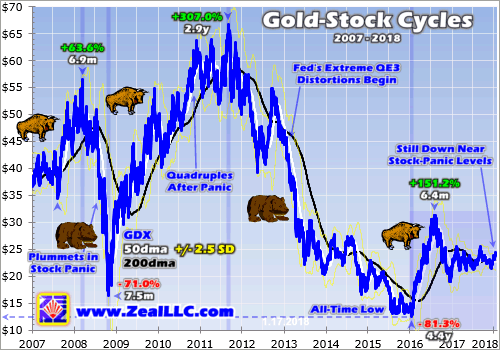
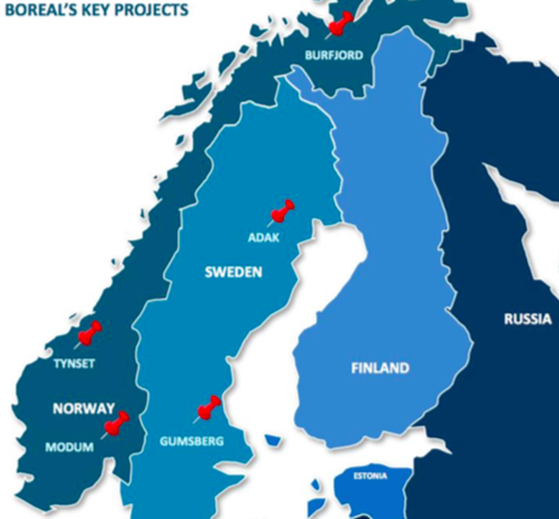
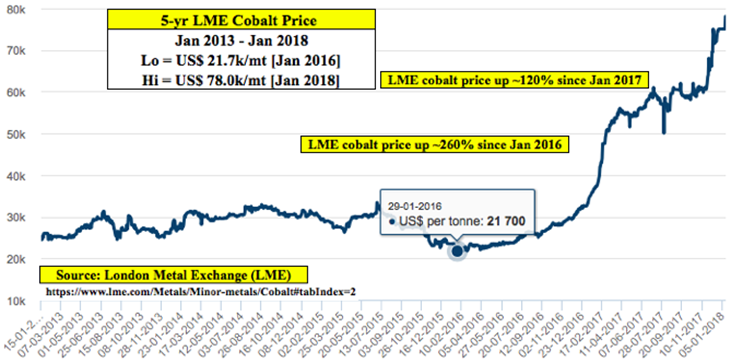
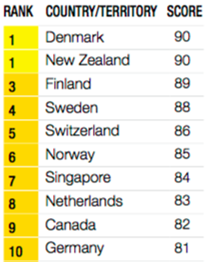
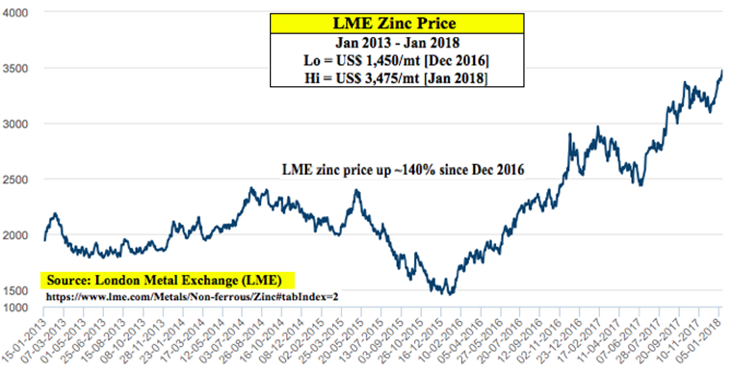
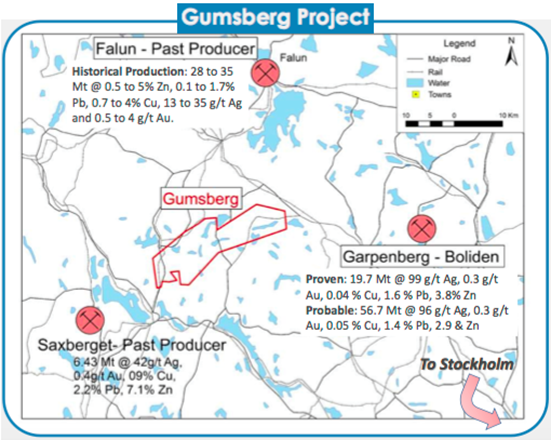
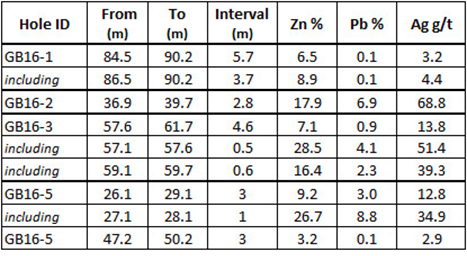

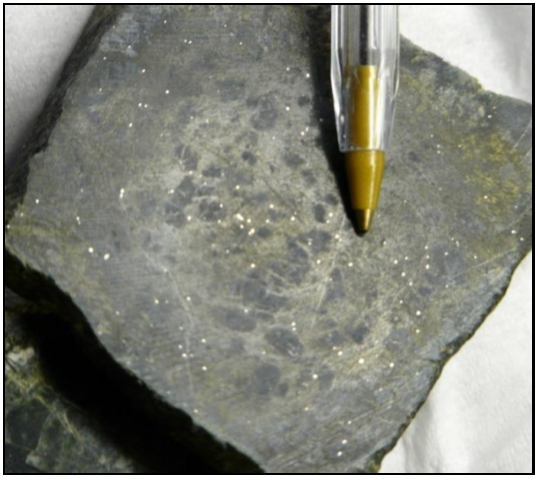
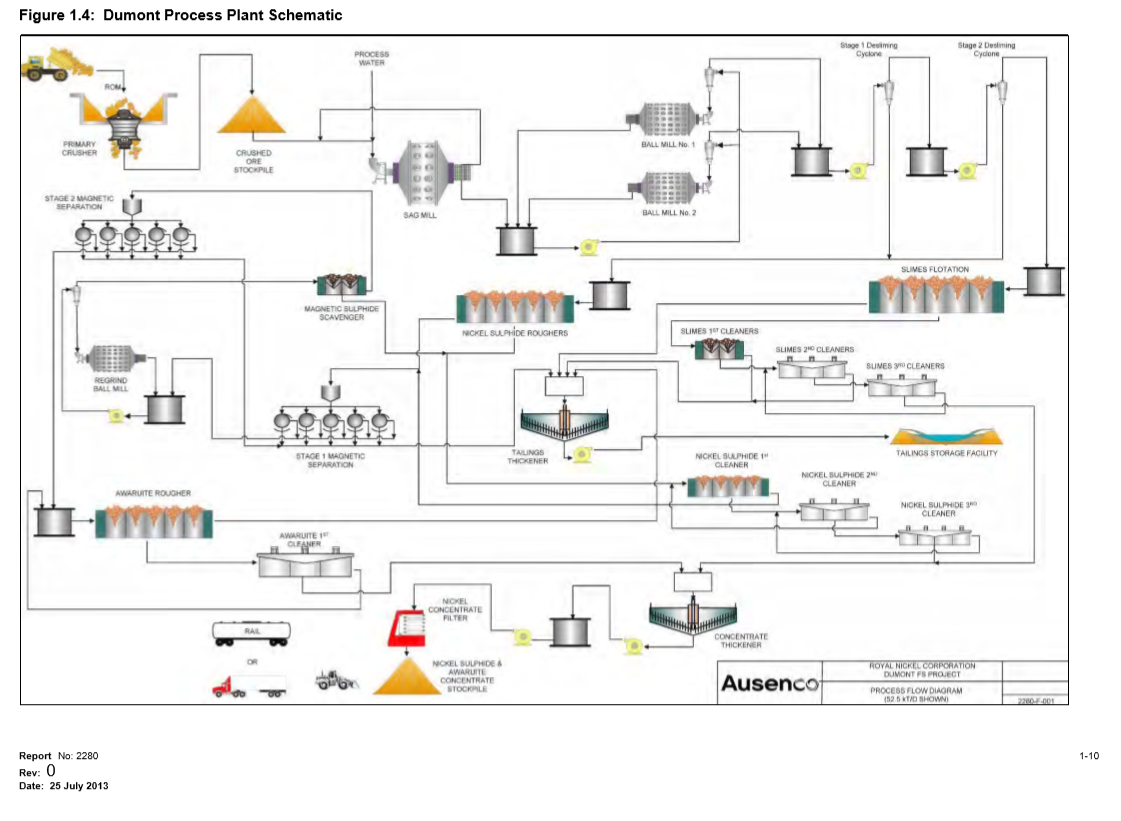
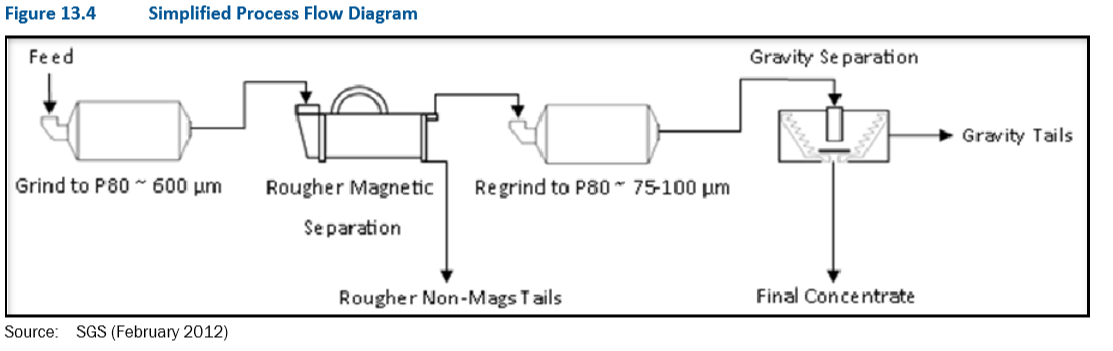
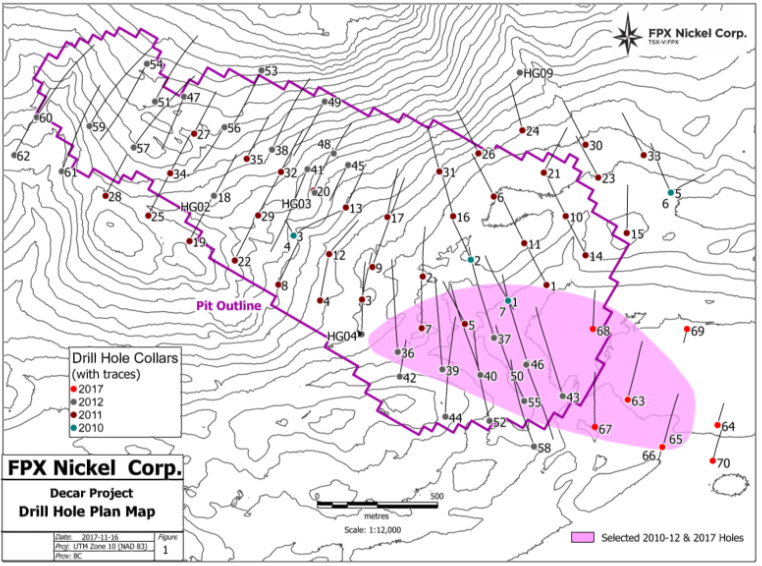
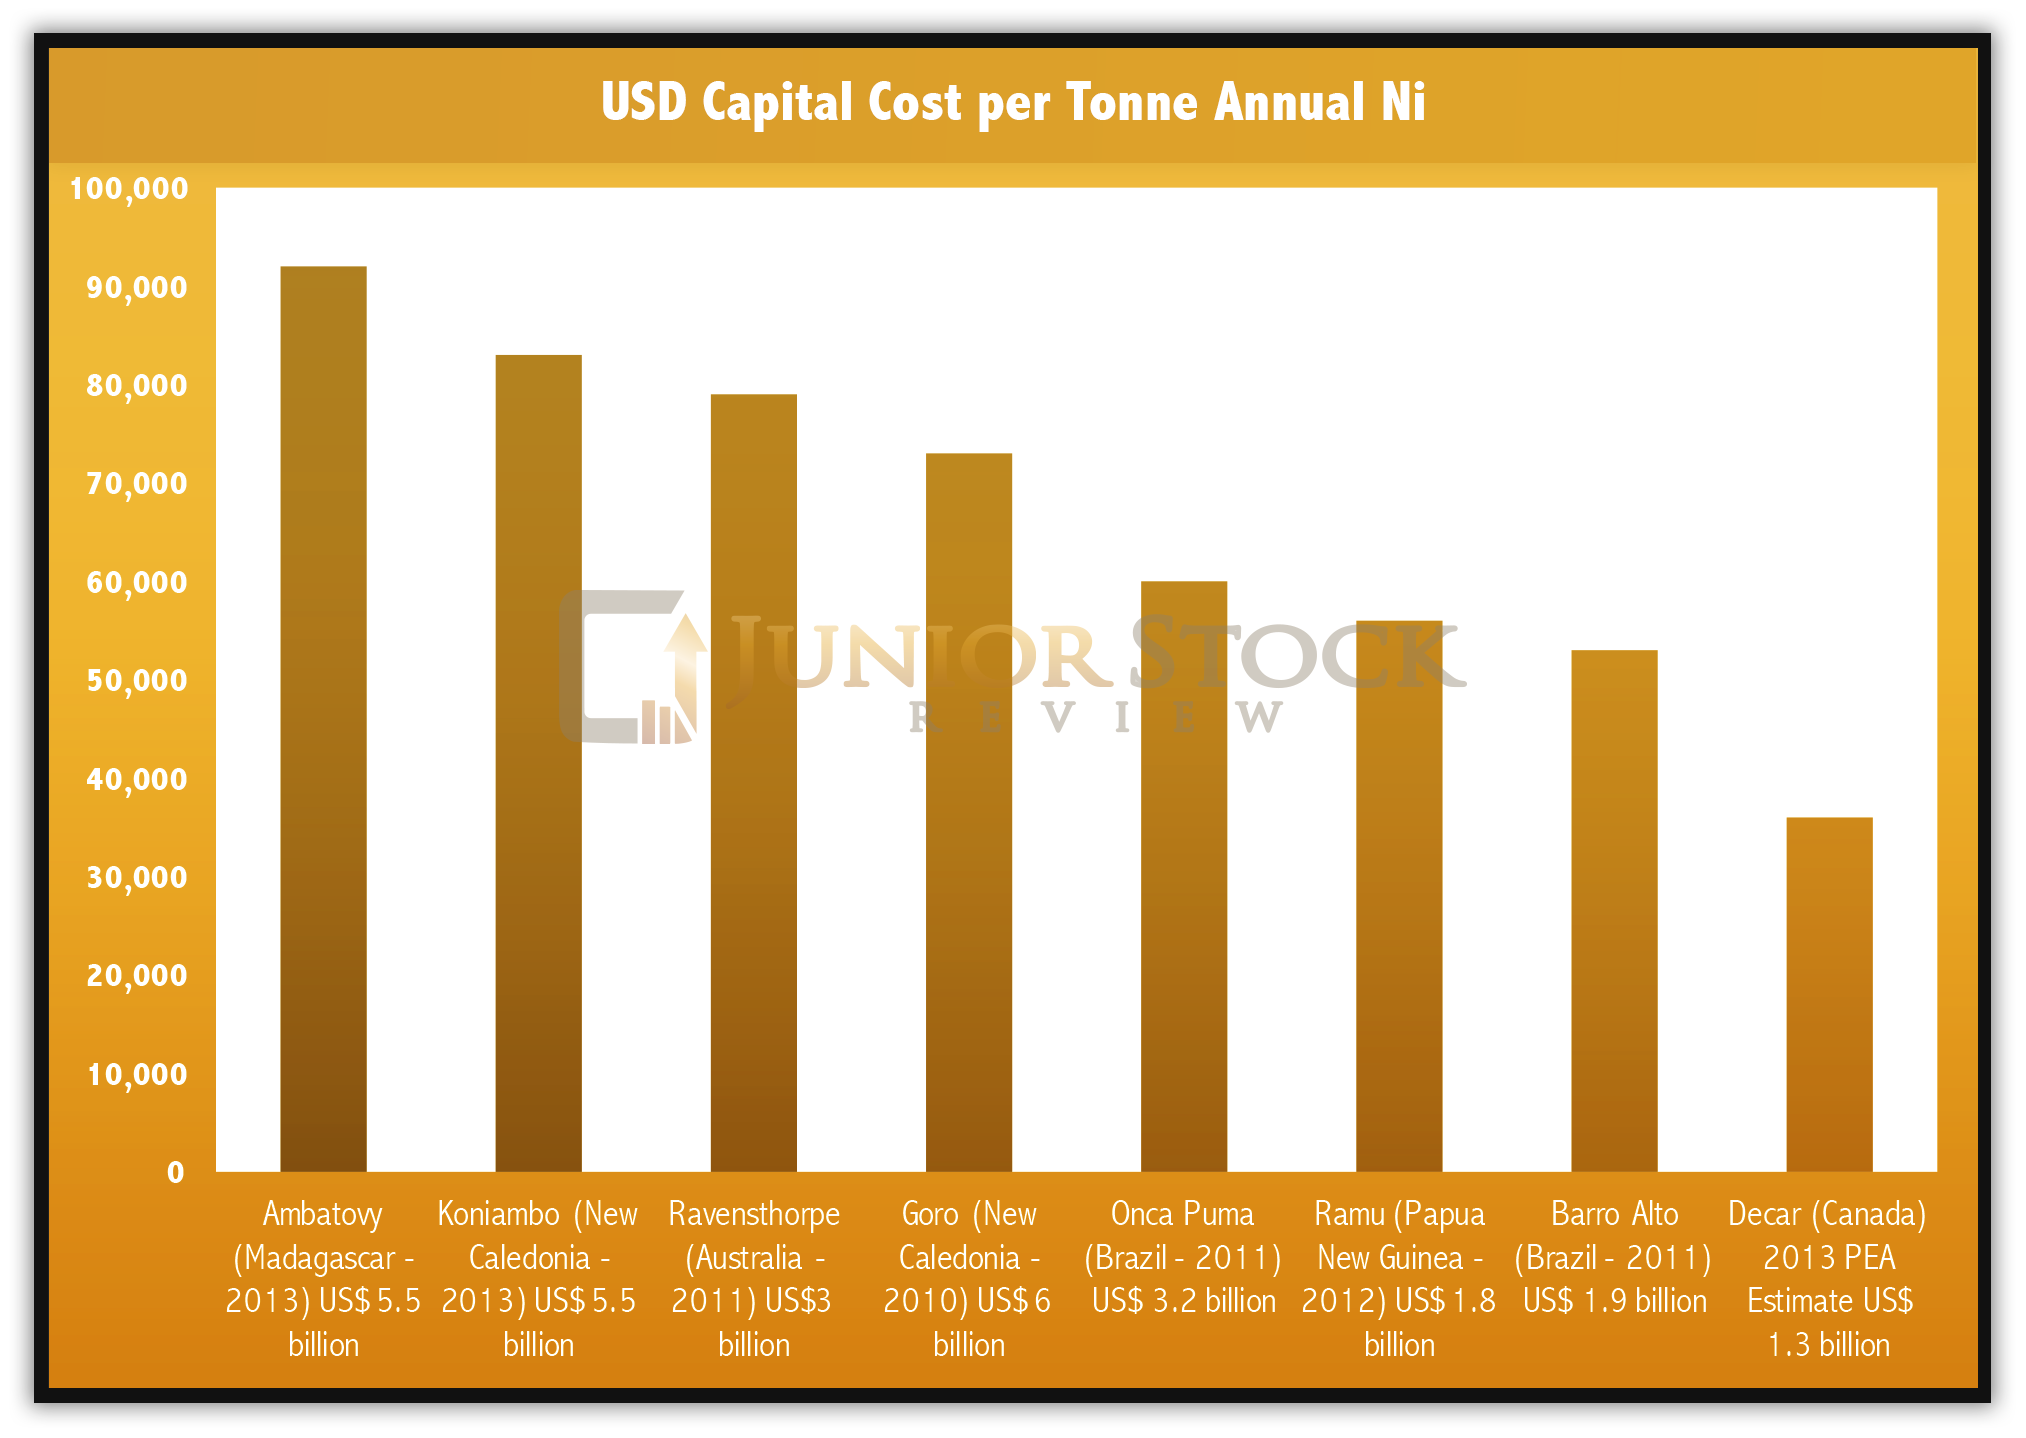
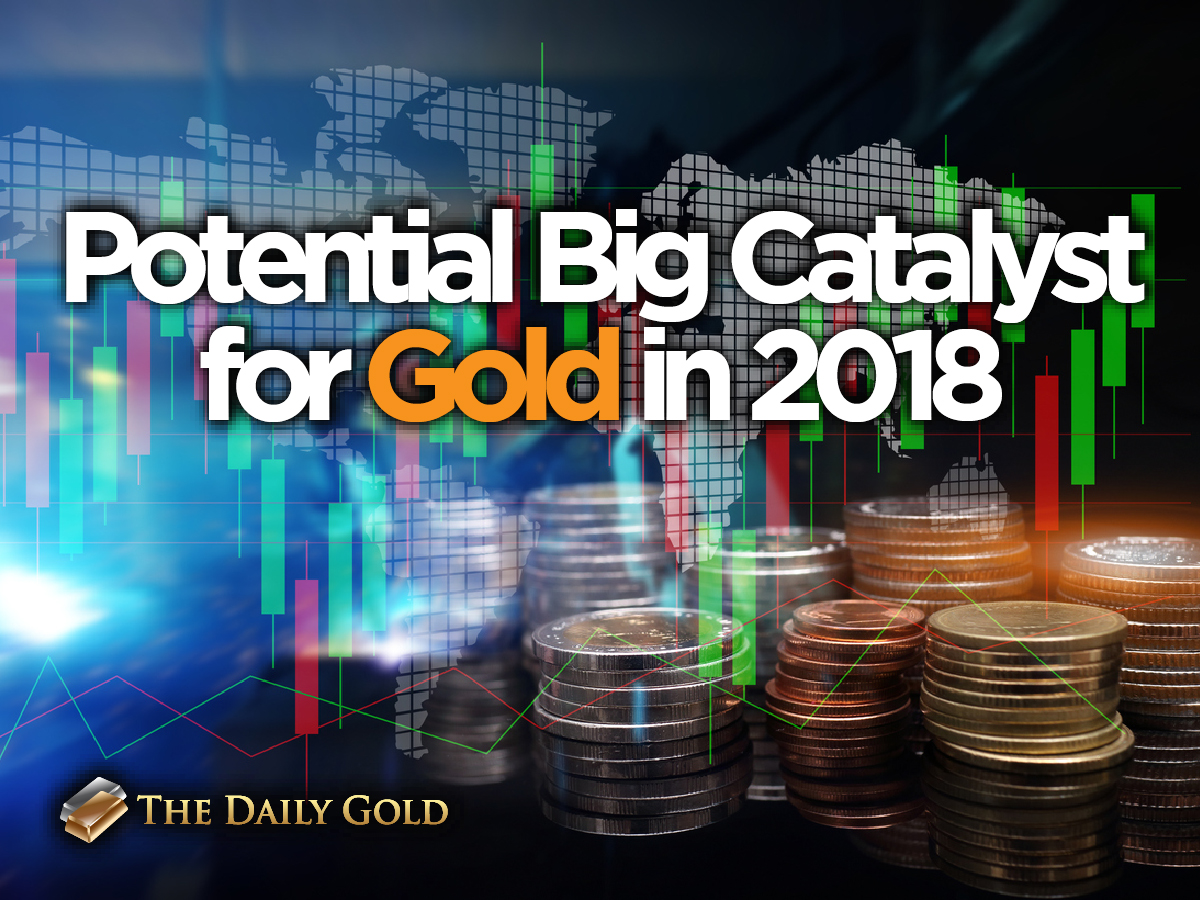
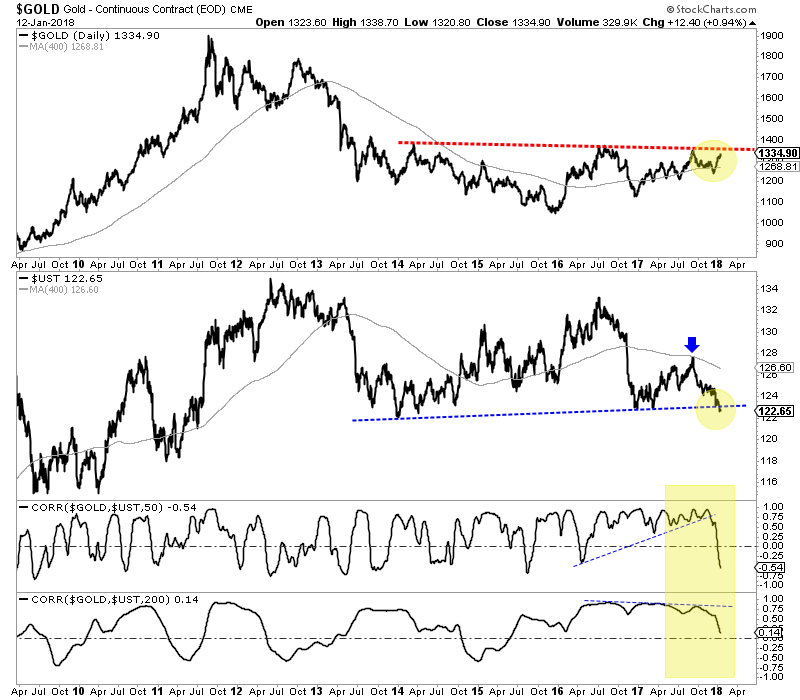
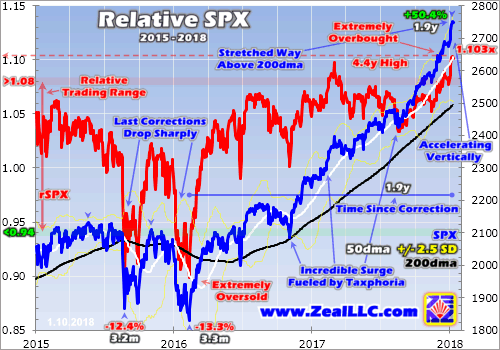
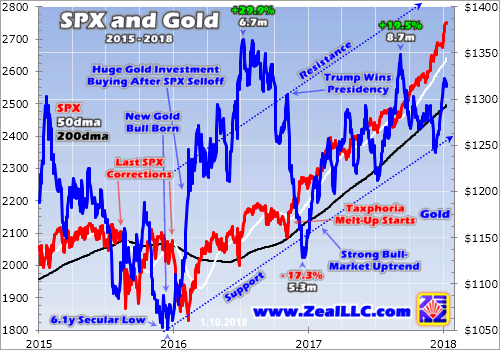


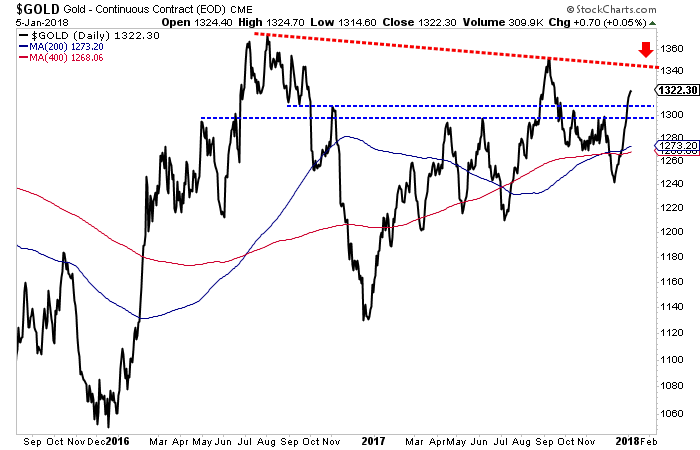
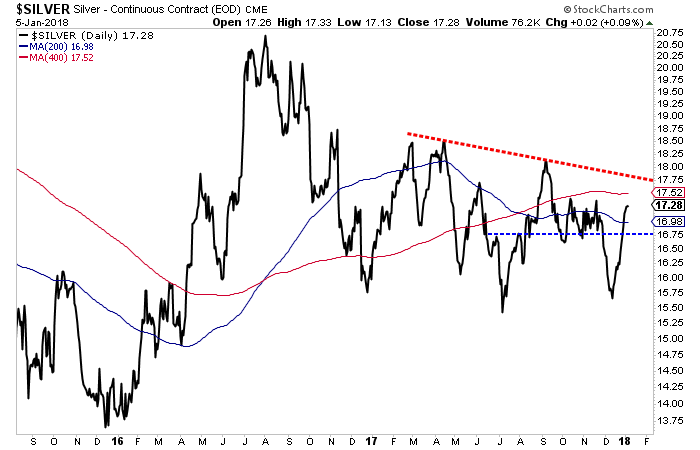
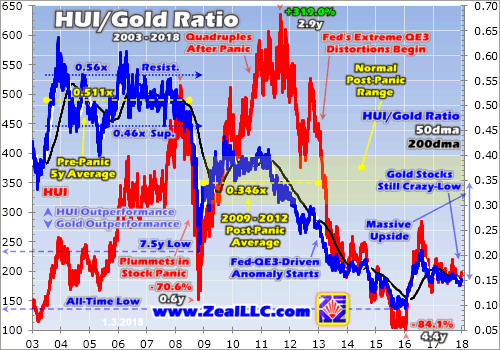
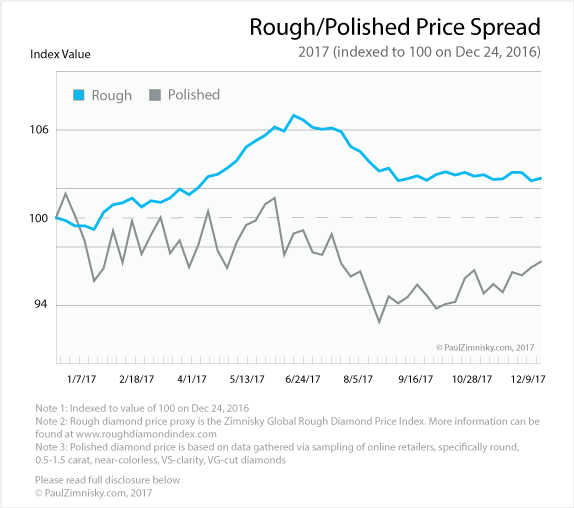

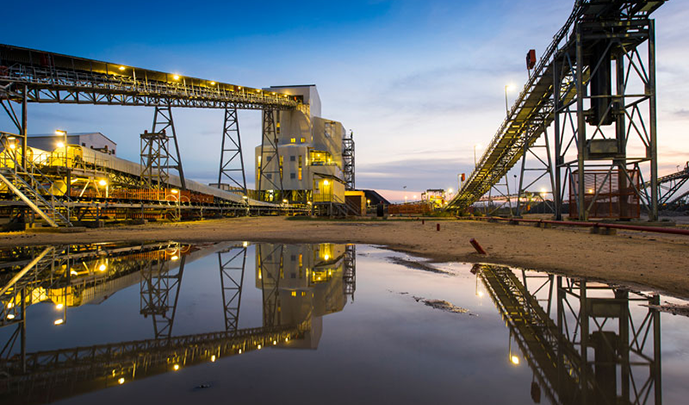
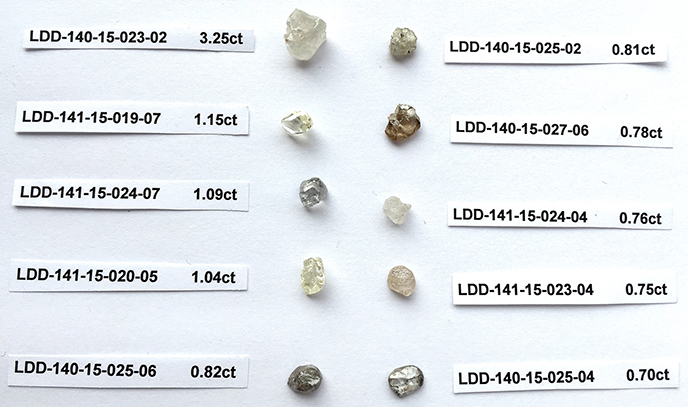
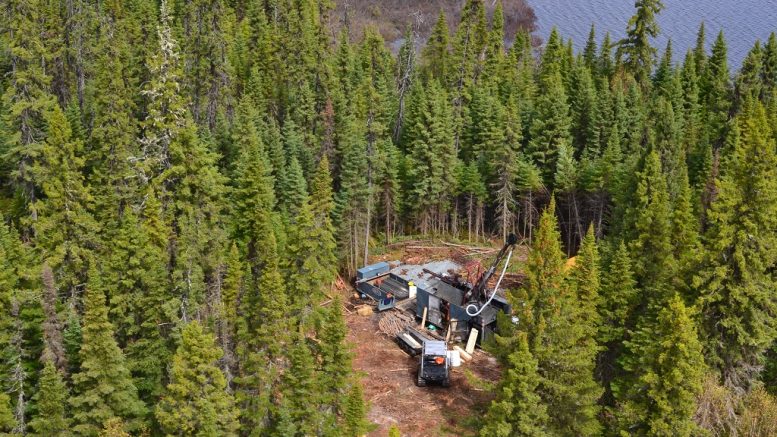


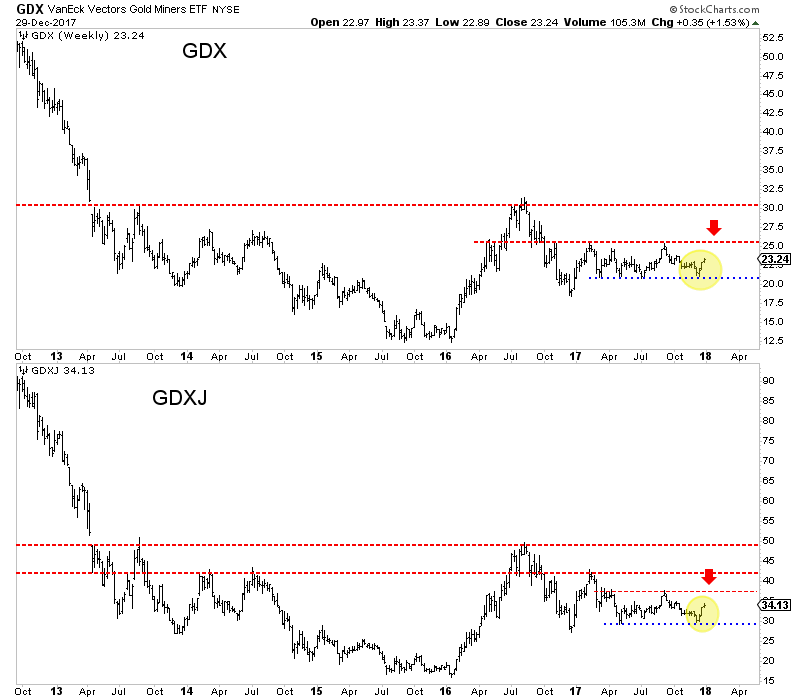
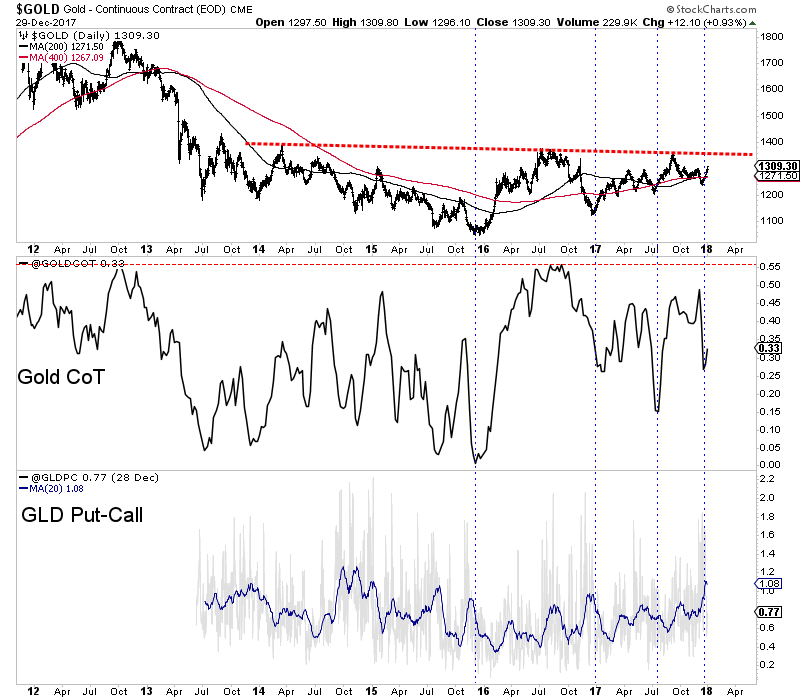
 Follow us on Twitter
 Become our facebook fan


