

After one of the worst bear markets in history, gold and the gold mining stocks began a new bull market cycle in 2016. With the first 8 months of the year filled with incredible gains, a correction in the market ensued. Of the two, the gold mining stocks were hit the hardest, sending a large portion of the company share prices down or sideways over the last 16 months.
Today, in the 1st quarter of 2018, physical gold continues to show strength, while the gold stocks continue to waiver. Personally, I think the prospects of a change in sentiment toward the gold stocks will happen in 2018, and mark the next leg up in this bull market cycle.
Why do I think this is the case? There are a few reasons:
- Lack of interest – In my opinion, the weed and blockchain sectors have captured the attention of the large majority of the speculative investors over the last year. Additionally, I have read numerous articles and headlines which allude to gold losing its luster, which I completely disagree with. I believe this is a sign of a great buying opportunity in the junior gold equities.
- 1,033 point correction on the DOW – The broader market has been on a tear for roughly 8 years, and up until this 1,033 point correction on the DOW a couple weeks ago, it didn’t appear to be slowing down. It’s my contention that we are seeing an inflection point downwards in the broader markets bull cycle. My guess is that past will be prologue, gold and gold equities will be the major beneficiaries.
- Inflation – Although, I do think a correction in the broader market becomes more likely with each passing week, I see tremendous inflation in the future. In my opinion, we are entering a major bull cycle in the base metals, which will inflate the cost of living. Real assets will be sought out to curb the destructive and silent force which is inflation. The caveat to this belief is the adoption of artificial intelligence, which will have a huge deflationary impact on the world. However, I think that is still 10 years away from having a profound impact.
- Scarcity and Cost to produce an ounce of gold – As Brent Cook has often pointed out, we are losing approximately the equivalent of the Carlin Trend each year, in terms of gold ounces, and the majority of what we do discover isn’t economic below $1250 USD/oz Au. When the cost of production is more than the price of the commodity, therefore, the price has to eventually go up. I must qualify this statement by saying that, according to regular accounting, gold isn’t scarce, given the fact that more than 95% of all gold that has ever been mined still exists today, albeit in vaults. I don’t, however, foresee gold becoming any less popular as a store of value and, therefore, believe that the scarcity reference is applicable.
Mining is a sector in which the most valuable commodity, for a junior company, is the people. The right people make the right choices no matter what portion of the market cycle they are in. Therefore, picking the right people, in my opinion, gives you a higher probability of being successful with your investments. Bottom line, if you like the metal and its prospects for price appreciation in the future, buy the metal. If you’re willing to do the due diligence, and can handle/manage the risk, there is huge potential in the junior mining stocks.
Which brings me to the company I would like to update you on today, Genesis Metals Corp.
Let’s take a look!
Genesis Metals Corporation (GIS:TSXV) & (GGISF: OTC)
NOTE: DTC eligible
MCAP – $9.4 million (at the time of writing)
Shares – 74,801,204
Fully Diluted – 104,845,092
Management Ownership – 12%
The Genesis Metals Team
A junior resource company is only as good as its people, and in the case of Genesis Metals, they’ve assembled a great team.
Genesis Metals’ CEO and Chairman, Brian Groves, is a 40-year veteran of the mining industry. Groves has explored in both Australia and Canada, working with AMAX Minerals, Noranda and Manager of Corporate Development at Placer Dome. Moving up the organizational ladder throughout his career, Groves has gained valuable experience in capital markets, project development, permitting and corporate strategy. Today, he leads a group of people who have not only worked together previously, but who have a history of success within the mining industry.
Working hand in hand with Groves is Jeff Sundar, President and Director of Genesis. Sundar has 18 years of experience in the mining industry, having held a VP and Director’s position while working with other Genesis Board members in Underworld Resources. Underworld, in particular, was a great success, as the 1.6 Moz White Gold deposit was sold to Kinross for $140 million. Sundar and the team look to replicate this success with Genesis in the years ahead.
Adrian Fleming, the former President and CEO of Underworld Resources and former VP Exploration of Placer Dome, joins the Genesis team as an Executive Director. Fleming is a Professional Geologist with over 30 years of experience in the mining industry. Some of Fleming’s most notable work experience includes the following:
- Former VP Exploration for Placer Dome based in Sydney Australia. Fleming spearheaded Placer Dome into Western Australia, where he directed the group and found the Big Bell Mine.
- Fleming co-led the team that found the high grade zone at the monster, 28 Moz gold equivalent, Porgera copper gold deposit, located in Papua New Guinea.
- Former VP Exploration for Golden Star in the early 90’s. Fleming directed the team that uncovered the Gross Rosebel Deposit, which has now grown to 17 Moz of gold.
- Fleming will be counted on to provide valuable input as Genesis moves forward with a plan to expand its Chevrier Gold Deposit resource, and explore the gold anomalies at their October gold project.
John Florek, the former Senior Geologist at Barrick Gold’s Famous Hemlo Mines, is on Genesis’ Board of Directors. Hemlo was a world-class gold deposit and is credited as being the catalyst for the 1980’s exploration boom. Florek co-led the exploration team that found an additional 2 Moz of gold, which extended the Hemlo mine life. He was also Senior District Exploration Geologist for Placer Dome in Red Lake, and in 2008, his team was awarded the Northwestern Ontario Prospectors award. Florek’s more than 20 years of experience in the mining business as a professional geologist should add great value for Genesis in the future.
Last, but certainly not least, Andre Liboiron is the Exploration Manager for Genesis’ projects, Chevrier and October. Liboiron is a Quebec native with more than 26 years of experience as a geologist in Quebec, as well as internationally.
Strategic Advisor
Robert McLeod, Genesis Co-Founder and former Chairman of Genesis’ Board, relinquished his position because of the heavy time commitment required by his primary focus as CEO of IDM Mining, a near term producer in BC’s Golden Triangle. Given the work history of the members of this management team, however, McLeod has agreed to remain with the company as a strategic advisor.
McLeod is on Casey Research’s Nexten list, which features the top young professionals in the mining industry. A quote taken from Casey Research’s profile of McLeod,
“Luck has nothing to do with it. Rob has the pedigree, the smarts, and the perseverance to have forged a stellar career in mining exploration and company development.” ~ Casey Research
Also, Genesis has added former Laurentian Bank Securities Mining Analyst and Peartree Securities Technical Advisor, Eric Lemieux. Lemieux is a geologist by trade and has 25 years in the mining industry with experience in a variety of areas, such as mineral exploration and project valuation. Lemieux’s addition to the Genesis team should prove advantageous as Genesis looks to develop their properties.
Strategic Shareholders
While the people who run junior resource companies are the core component for investment, looking at the people who choose to invest in the companies is a great gauge for potential value. In Genesis’ case, there are a few heavy hitters who have taken major positions in this junior gold exploration company.
The list of strategic shareholders is headlined by Osisko Mining, which acquired a 6.4% position in Genesis through a private placement announced in 2017. For those unfamiliar with Osisko Mining, they’re a major player in the gold sector, owning strategic positions in a lot of great companies, such as: Falco Resources, IDM Mining and Beaufield Resources. Outside of owning strategic positions in companies, Osisko is exploring their 70,000 Ha Windfall property, which is located in the Urban-Barry Greenstone Belt in Quebec. Osisko is known for their geological expertise and well timed investment in smaller junior gold companies. Their investment in Genesis speaks volumes about Genesis’ potential.
The strategic shareholders list is further headlined by Eric Sprott, who has acquired a 7.2% position in Genesis through a private placement announced in 2017. Sprott is a major player in the resource sector, with a history of successful investments throughout his career. Also, Sprott has multiple Sprott named companies offering various market related products across the sector. Over the last few years, he has taken strategic positions in a few junior gold companies such as Kirkland Lake Gold. Sprott’s investment, like Osisko’s, is a great gauge for potential value in Genesis.
For those who aren’t familiar, the Societé de development de la Baie-James (SDBJ) is a government run organization focused on the development of natural resource projects within Québec. Their mission statement is as follows;
“To promote the economic development, development and exploitation of natural resources, other than hydroelectric resources within the mandate of Hydro-Québec, of the James Bay territory, from a sustainable development perspective. In particular, it may encourage, support and participate in projects aimed at these ends.” ~SDBJ
Additionally, the SIDEX fund, which was created by the government of Québec to support mineral exploration activities within its borders, participated in the latest financing. Having both SDBJ and SIDEX as stakeholders in Genesis is a great sign of political support for Genesis’ Chevrier Gold Project. The strategic shareholders list is rounded out by Delbrook Capital, Gold 2000, US Global Investors and Medalist Capital. These organizations and people represent smart money in the sector and I’m happy to speculate along with them.
6th Best Jurisdiction for Mining Investment in the World
From a jurisdictional standpoint, it doesn’t get much better than Quebec when it comes to mining investment attractiveness. The Fraser Institute (FI) gives Quebec an index score of 85.02, ranking it 3rd in Canada and 6th in the world. FI’s mining investment attractiveness index score is reflective of both the mineral potential and the government policy perception of the region.
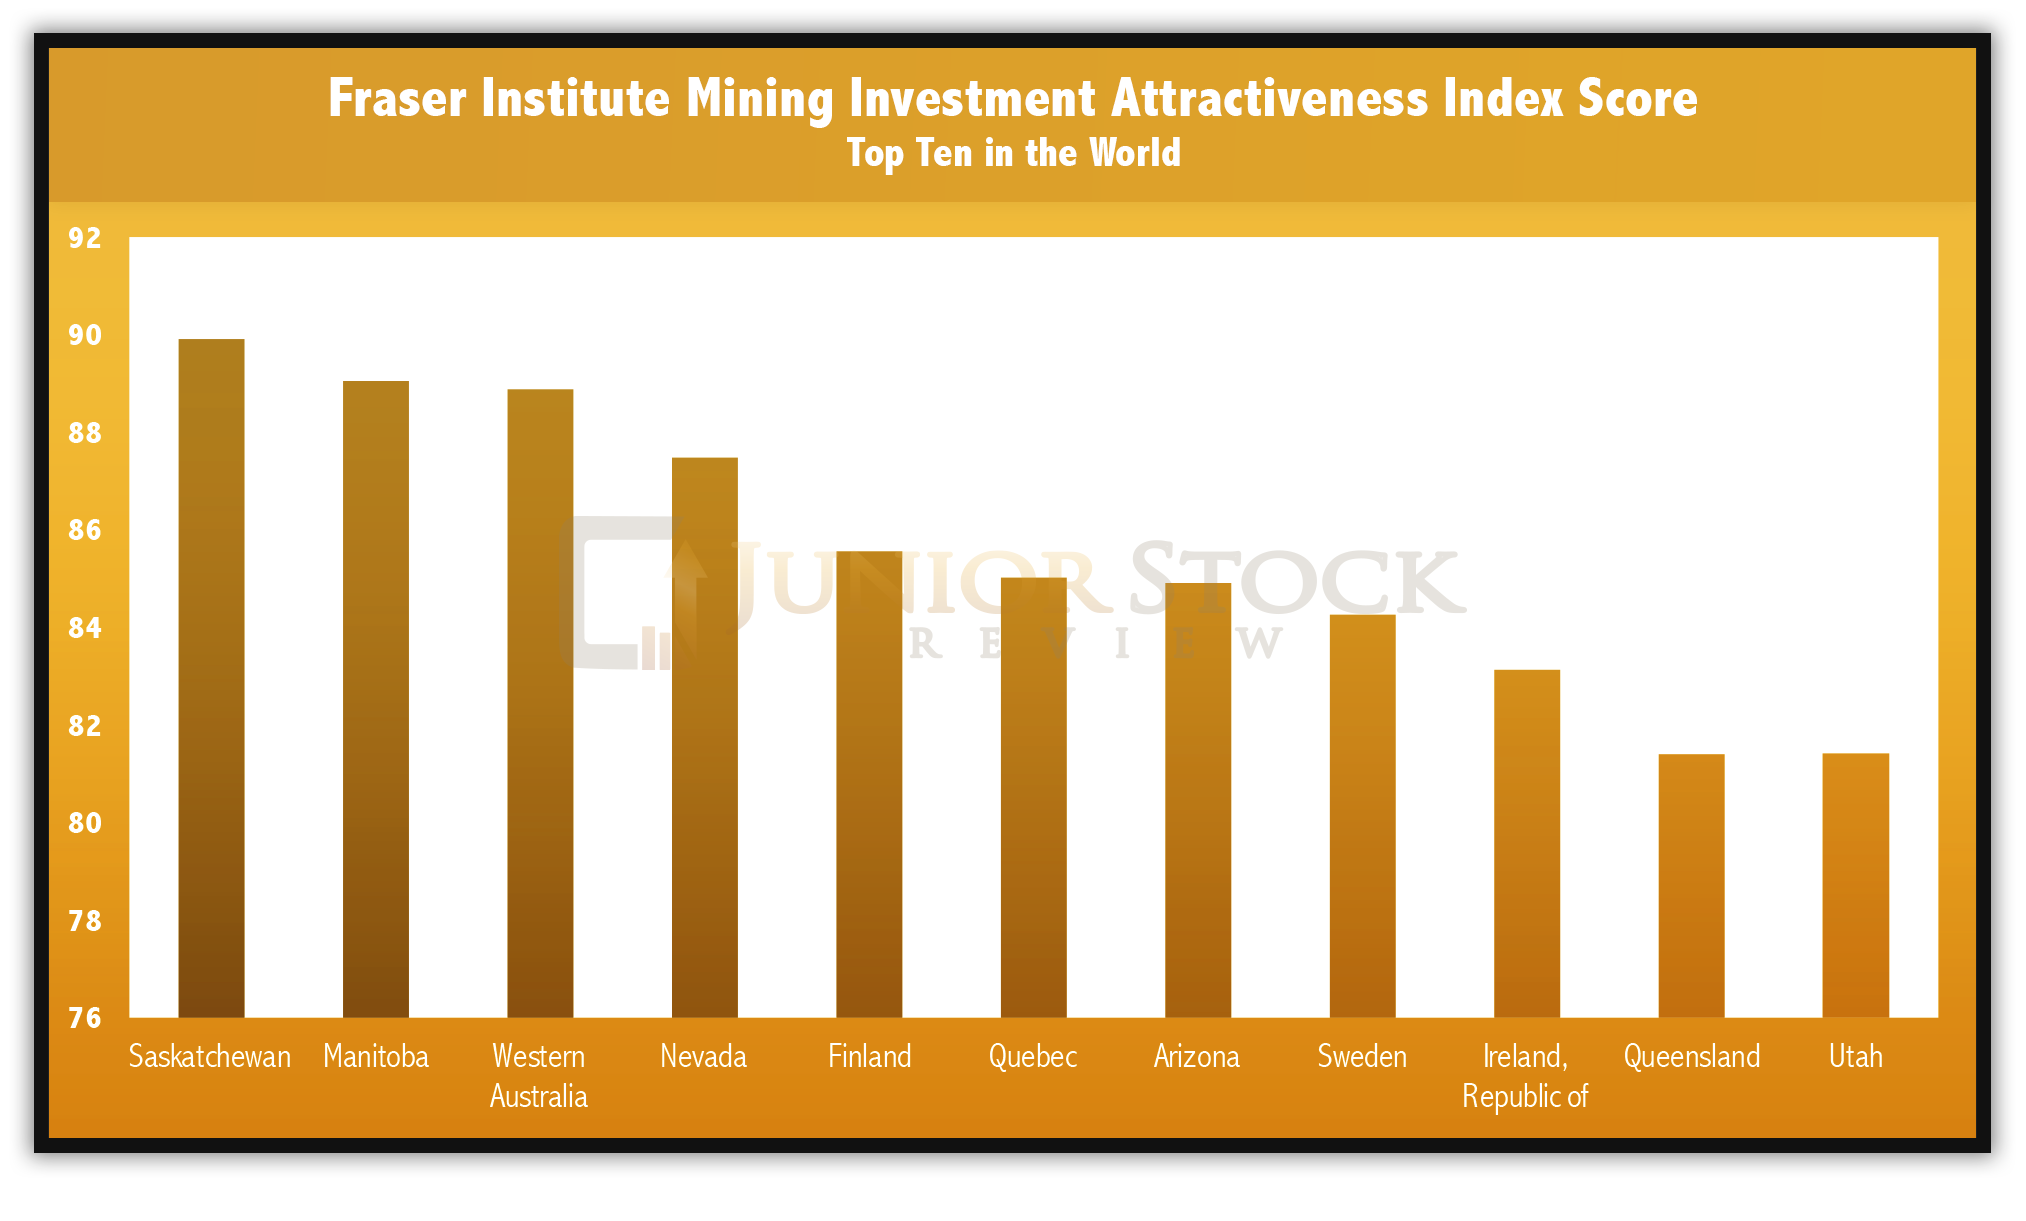
Source: Fraser Institute
Quebec’s Mineral Potential
Quebec is home to 25 producing mines and over 350 surface mineral mining operations, putting the value of Quebec’s mineral shipments at $8.7 billion in 2014 (Investissement Quebec). Quebec is Canada’s 2nd largest producer of gold, largest producer of iron and zinc, and the only North American producer of niobium. The mineral wealth is evident and is a big reason why FI ranks Quebec among the world’s top ten in mining investment attractiveness.
Highlighting Quebec’s world class mineralization is the Abitibi Greenstone Belt (AGB), which is 150 km wide and stretches 650 km from roughly Wawa, Ontario to Val d’Or, Quebec. The belt has produced millions of ounces of gold over its history, with the Cadillac Gold Camp, Virginiatown, Rouyn-Noranda Gold Camp, and Val d’Or Gold Camp being just a few of its largest contributors.
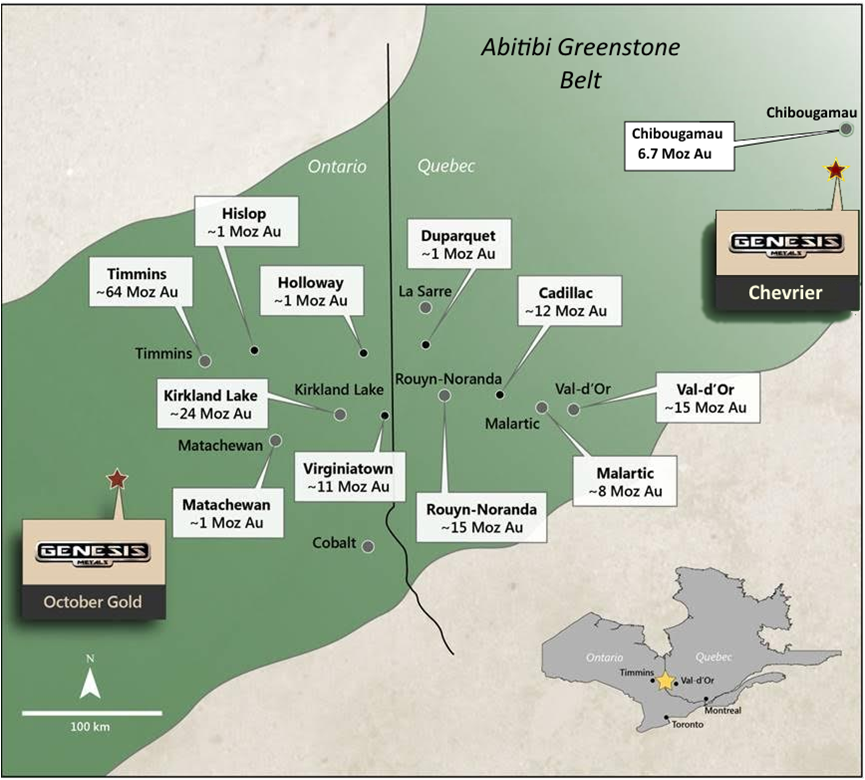
Source: Genesis Metals
Quebec Politics and Infrastructure
The government of Quebec supports mineral exploration within its borders with a tax credit system that refunds 25% of eligible exploration expenses for non-operating corporations, and 10% of eligible exploration expenses for operating corporations (Financial Incentives). So, roughly, for every $1 spent by a Quebec based mineral explorer, 25 cents will come back to the company, which can effectively be rolled right back into further exploration work. This is not only a huge plus for the company and its shareholders, but an ingenious way for the province to promote mineral exploration.
The long history of mining in the AGB means that most regions of the belt are accessible or near infrastructure such as highways, rail, power, and deep water ports along the St. Lawrence Seaway. Also, Quebec boasts some of the most competitive electricity rates in Canada, as its hydroelectric dams constitute a major portion of its electricity production.
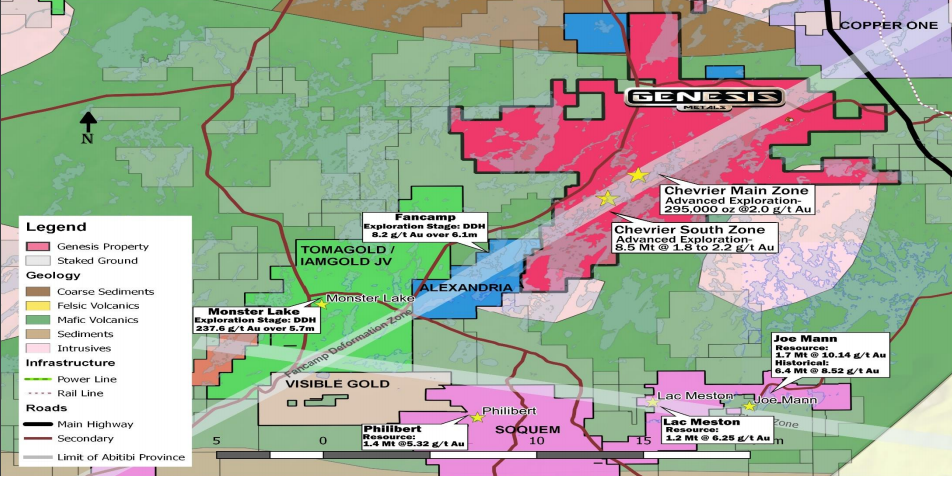
 Source: Genesis Metals
Finally, Quebec takes great pride in a transparent mining system, which is built around three key pillars:
“Open access to resources is ensured on the largest possible portion of territory, Mineral rights are granted on a first-come, first-served basis and if a discovery is made, the title holder can be reasonably sure of obtaining the right to develop the resource.” ~ Investissement Quebec
Favourable politics and world class geology – for me, it doesn’t get much better than Quebec, as far as your investment buck goes!
Gensis Metals Corp. – Chevrier Gold Project Phase 1 and 2 Drill Update
Genesis’ 100% owned Chevrier Gold Project encompasses 120 square km and is located 35 km south of Chibougamau, Quebec, in the heart of the Abitibi Greenstone Belt. Chevrier straddles 15 km of the Fancamp deformation zone, and is 15 km northeast of IAMGOLD’s high-grade Monster Lake gold discovery.
Chevrier has an existing NI 43-101 inferred resource for its Main Zone, which is 300,000 oz of gold at 1.99 g/t (1 g/t cut-off), and is open for further expansion at depth and to the north.
Phase 1 Drilling
Roughly 5,000 metres of drilling was completed in Phase 1 at Chevrier. The focus of the drilling was four fold; confirm historical Geonova drill holes by twinning, complete infill and step out drilling on the existing Main Zone Deposit, and finally, explore other IP and geological targets.
The results of the twinned and infill holes did not disappoint, as they confirm continuity of the shallow gold mineralization within Chevrier’s Main Zone. A full list of drill results can be found on SEDAR, a few of the highlights from the results are:
- Twinned hole GM17-09 returned 2.94 g/t gold (Au) over a width of 58.70 m (starting at 74.60 m down hole), which included an interval of 14.01 g/t over a width of 6.35 m.
- Hole GM17-20 returned 2.00 g/t Au over 35.20 m within a zone that graded 0.93 g/t Au over 94.90m starting at 91.5 m down hole.
- Hole GM17-21 returned 1.13 g/t Au over 38.05 m.
- Hole GM17-22 returned 1.06 g/t Au over 24.45 m.
- Hole GM17-16 returned 1.06 g/t Au over 14.22 m including: 3.50 g/t Au over 3.22 m.
Using the image below to reference the highlighted holes:
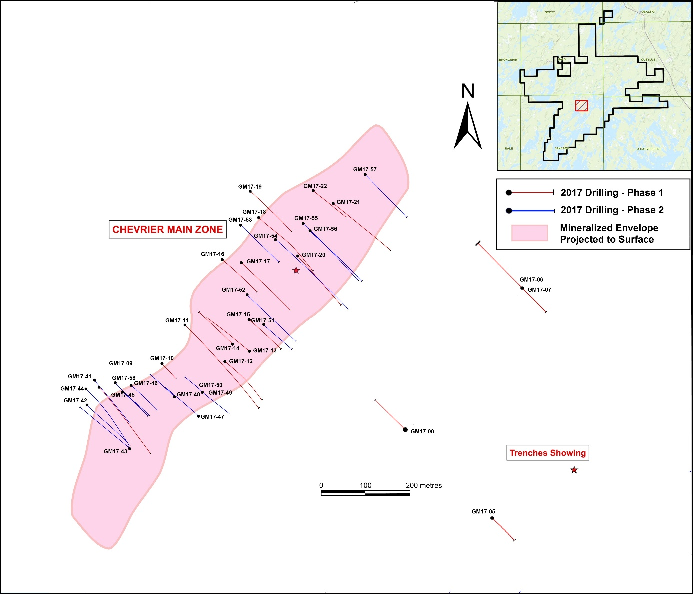
Chevrier Gold Project – 2017 Drilling
Trenching
The IP survey of the property identified a geophysical anomaly roughly 5 km northeast of the Chevrier Main Zone. During the Phase 1 drill program, Genesis completed exploration of this anomaly via trenching. In a news release on October 3rd, 2017, Genesis reported that they had identified a new area of gold mineralization in Trench 29, returning a channel sample of 2.55 g/t Au over 2.3 m. This area will be explored further in the future.
Phase 2 Drilling
On January 22, 2018 Genesis announced the results of its 5,000 metre Phase 2 drill program on the Chevrier Gold Project. The Main Zone was the focus of Phase 2, completing 18 holes of infill and step-out drilling. The results, in my opinion, look good. Check out highlights from the drill program:
- 8.73 g/t Au over 21.35 m including 37.97 g/t Au over 3.00 m in hole GM-17-42
- 3.59 g/t Au over 22.60 m in a separate zone in hole GM-17-42
- 4.26 g/t Au over 19.40 m including 8.99 g/t Au over 7.80 m in hole GM-17-48
- 4.47 g/t Au over 12.45 m within an interval of 1.08 g/t Au over 84.85 m in hole GM-17-46
- 5.06 g/t Au over 8.45 m and 1.23 g/t Au over 43.00 m in two intervals in hole GM-17-41
- 4.53 g/t Au over 13.80 m in hole GM-17-44
- 1.04 g/t Au over 50.05 m including 1.94 g/t Au over 17.10 m in hole GM-17-44
Putting the results into perspective, remember that the Main Zone’s existing inferred resource has an average grade of 1.99 g/t. The impact of these shallow, higher grade results should be realized in Genesis’ resource update for the project coming later this year.
Additionally, and of particular importance, was the step-out results which came from holes GM-17-45 and GM-17-46. These holes were drilled with the intent of testing for an extension of the mineralization from hole GM-17-09, which was drilled in Phase 1 (refer to the image above for the location).
The results from these two holes reveal a new north-east trending shallow extension of the mineralization discovered in GM-17-09. Specifically, from the drill results table in the news release , GM-17-45 returned a shallow interval (35.4 m down hole) of 63 metres at 0.5 g/t gold, while GM-17-46 returned a shallow interval (19.35 m down hole) of 84.85 metres of 1.08 g/t gold.
PUSH: Announcement of follow up drill program on the Main Zone, focusing on the high grade holes which were discovered in 2017.
PUSH: Chevrier Gold Project resource estimate update in 2018.
Chevrier South Zone
While Chevrier’s Main Zone, with its existing Inferred Resource, has garnered the bulk of drilling over the history of the Project, I believe there’s the possibility of some great results from Chevrier’s South Zone. Why? Although the South Zone doesn’t have an existing 43-101 resource, Met-Chem’s comments within the technical report state,
“the Chevrier South deposit contains a potential between 8.5 and 9.0 million tons of mineralized material grading 1.8 to 2.2 g/t Au.” ~ Met-Chem – 43-101 Technical Report on the Mineral Resource of the Chevrier Gold Project – pg.93
If you express the 8.5 million tons of mineralized material at 1.8 g/ton, you get 459,000 ounces of gold. Met-Chem’s reference to the possible resource size of the South Zone deposit is based off a small historical drill data set and its similarities in alteration and deformation like the Main Zone. The fact is, the South Zone needs further drilling before a 43-101 complaint resource can be officially estimated.
As Genesis intends to update the Chevrier Gold Project resource estimate in 2018, I believe there’s a good chance that we could see them refocus their attention on the Project’s South Zone. Given Met-Chem’s comments, I believe there’s good reason to believe drilling within the South Zone could have a tremendous impact on the updated resource estimate for the entire Project.
In my opinion, the updated resource on the Chevrier Gold Project, which will include both the Main and South Zones, will exceed 1 million ounces and should set Genesis up for a market re-rating, as its current sub $10 million MCAP doesn’t reflect the potential of what it possess.
PUSH: Watch for the announcement of a drill program on Chevrier‘s South Zone. The results from a South Zone drill program could have a major impact on Chevrier’s updated overall resource estimate.
October Gold Project
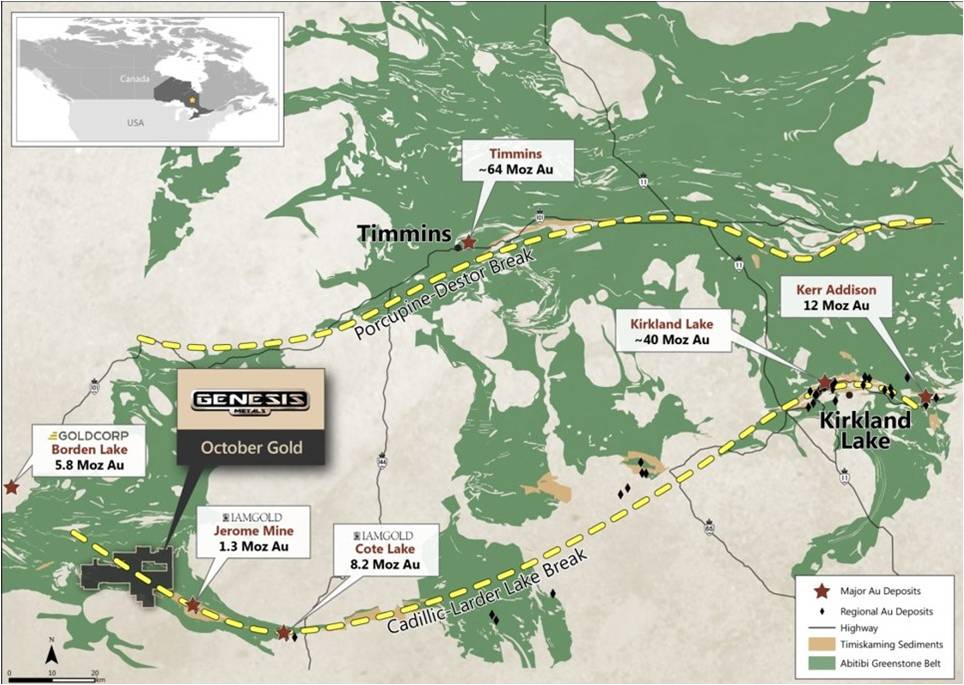
Genesis also owns 100% of the 203 square km October Gold Project, located in the southern Swayze greenstone belt in Benton Township, Ontario. This project is located 35 km northwest of IAMGOLD’s Cote Lake deposit, and 50 km southeast of Goldcorp’s Borden Gold Deposit. The Cote Lake Deposit was purchased by IAMGOLD from Trelawney Mining for $585 million, while the Borden Gold Deposit was purchased by Goldcorp from Probe Mines for $526 million. This demonstrates how coveted this Ridout Deformation Zone is, and Genesis’ October Gold Project is right in the middle, and on trend.
IAMGOLD announced in a press release on June 5, 2017 that Sumitomo Metal Mining has acquired a 30% undivided participating joint venture interest in IAMGOLD’s ownership interest in the Cote Gold Project for an aggregate $195 million. Sumitomo’s interest in this area of Northern Ontario should bring more attention to the surrounding land claim owners, one of which is Genesis’ October Gold Project.
The October Gold Project straddles what is considered the western extension of the Larder Lake-Cadillac Deformation and a portion of the Ridout Deformation zone. Historic gold deposits on these deformations, Kirkland Lake and Kerr Addison-Chesterville, have historic gold production north of 49 Moz.
The October Gold property saw surface exploration work in 2011. The program comprised of Soil Gas Hydrocarbon (SGH) sampling and reconnaissance level gravity geophysical surveys.
“A SGH survey is a deep penetrating geochemical method that involves the analysis of various hydrocarbons associated with ore bodies at depth using a forensic and comparative approach for Identification. “ ~ Genesis
The program has identified two gold anomalies, which Actlabs, the interpreting laboratory, says have a high degree of confidence. This confidence is based on comparisons with other surveys that Actlabs has completed on other gold deposits. These anomalies will see future surface work which should better define where the diamond drilling should take place.
The October Gold project property is early stage, but holds very promising gold exploration potential.
Concluding Remarks
The Genesis Metals story is not without risk, as any gold exploration company runs the risk of not finding anything or not finding mineralization which is economic. In Genesis’ case, I believe further modelling of the gold grade distribution within the Main Zone, should feed nicely into Chevrier’s updated resource estimate later this year. While on the exploration side, drilling on Chevrier’s South Zone appears to be very promising.
Outside of the risk of exploration, Genesis has some compelling facts that make their story undervalued in comparison to the paltry sub $10 million MCAP that they currently possess, including:
- A proven management team: Groves, Sundar, Fleming, Florek, Liboiron and Mcleod
- Strategic Shareholders List Headlined by: Osisko Mining, Eric Sprott, Delbrook Capital, Gold 2000, US Global Investors, SIDEX/SDBJ and Medalist Capital
- Located in the 6th best jurisdiction in the world, Quebec
- PUSH: Announcement of a follow up drill program, focused on Chevrier’s Main Zone high grade drill holes, which were discovered in 2017.
- PUSH: Announcement of a drill program focused on Chevrier’s South Zone in 2018.
- PUSH: 2018 Chevrier Gold Project Resource Estimate Update – In my opinion this estimate could exceed 1 million ounces of gold.
- Great bang for their drilling buck, as their all-in drill costs thus far have roughly averaged $220 per metre
- Large land package with exploration potential, Chevrier Gold Project and October Gold Project
The next leg of the gold bull market is upon us, fortunes will be made in the coming years by buying right and sitting tight, investing in companies that look to add value for their shareholders. Genesis Metals (GIS:TSXV) is a great example of this and is a company in which I’m investing.
Don’t want to miss a new investment idea, interview or financial product review? Become a Junior Stock Review VIP now – it’s FREE!
Until next time,
Brian Leni P.Eng
Founder – Junior Stock Review
Disclaimer: The following is not an investment recommendation, it is an investment idea. I am not a certified investment professional, nor do I know you and your individual investment needs. Please perform your own due diligence to decide whether this is a company and sector that is best suited for your personal investment criteria. I do own Genesis Metals Corporation stock. All Genesis Metals Corporation analytics were taken from their website and press release. Genesis Metals Corporation is a Sponsor of Junior Stock Review.
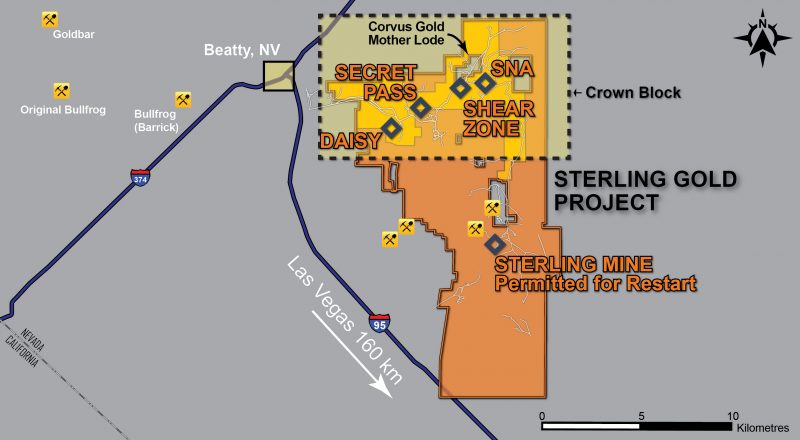
Northern Empire Resources Corp. (TSX-V: NM) released results from its Daisy Deposit as part of its 2018 15,000-metre drill program to expand resources at the Sterling Gold Project in Nevada. These results will go towards an updated resource due in the first half of 2019 and indicate the potential for an open pit, heap leach operation. The Daisy Deposit is located within the Crown Block of deposits in the north of the Company’s property.
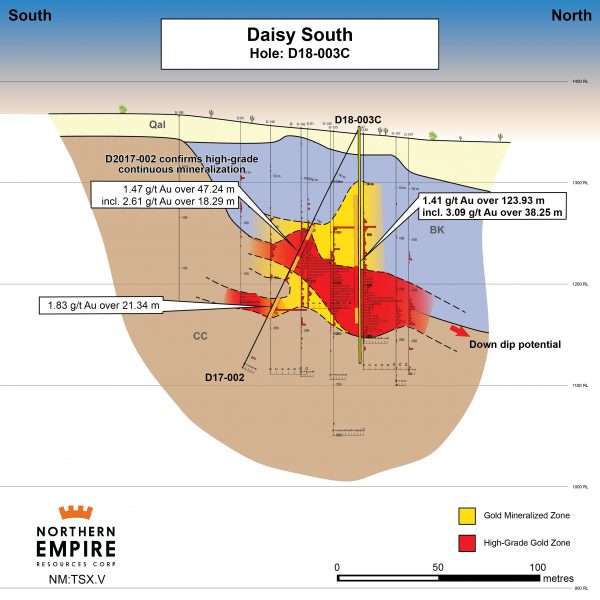
Drill hole D18-003C was a vertical core hole that returned an intercept of 123.93 meters of 1.41 grams per tonne (g/t) gold (Au). The intercept included 38.25 meters of 3.09 g/t Au and oxides in the hole extended to a depth of 173 meters.
This is the third drill hole Northern Empire has reported from the Daisy Deposit. Results from last year included 47.24 meters of 1.47 g/t Au in hole D17-001 and 21.34 meters of 1.83 g/t Au in hole D17-002. All historical drilling at Daisy occurred before the introduction of NI 43-101 reporting standards, so confirmation drilling is required to expand the resource. Historical drilling was also all reverse circulation (RC), so core holes are vital for developing a comprehensive geological model.
In comparison to historical holes near D18-003C, yesterday’s result encountered mineralization closer to surface than expected. In concert with nearby mapping and sampling which returned surface grades of up to 15g/t, these results are demonstrative of the potential this system could be larger than previously thought.
Michael G. Allen, President and CEO, commented:
“D18-003C is the first of at least 10 exploratory, resource expansion, and infill holes that we plan to drill into the Daisy Deposit as part of our 15,000-meter program. The exceptional grade of these results is very encouraging. All of the mineralization from 67.88 to 173.22 meters down the hole was oxidized, as was the final 2.87 meters of mineralization. For the high-grade core of the deposit, where we cut 38.25 meters of 3.09 g/t gold, cyanide solubility assays averaged 90% of fire assay, indicating that the Daisy deposit may be amenable to open pit mining with heap leach recovery of gold.”
The broad intervals of relatively shallow, high-grade oxide mineralization present here are key if Daisy is to ever benefit from a low cost and efficient open pit, heap leach operation. The advantage of heap leach mining is that they generally have low all-in sustaining costs and provide rapid payback to the operator. The average grade of heap leach operations in Nevada is approximately 0.7g/t gold, which would make the inferred resource at Daisy of 174,000oz of gold at 2.12g/t triple that.
The Daisy Deposit is located in the Bare Mountain district known for its legacy of past production. The trend is along an east-west structure that hosts Barrick’s Bullfrog Mine on the westernmost extension and stretches to the east where Northern Empire’s SNA deposit and Corvus Gold’s (TSX: KOR) Mother Lode deposit. Mother Lode is located completely within Northern Empire’s claim package. Along this trend, more than four million ounces of gold have been extracted or identified in situ.
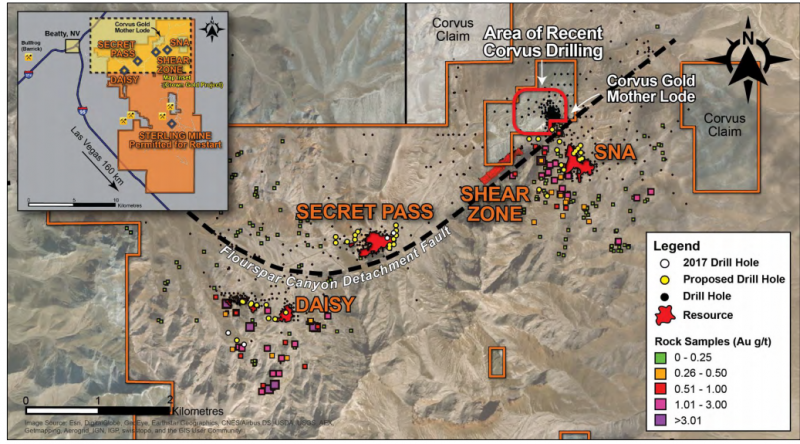
With several high-grade historical holes and showings, Northern Empire’s overall land package remains underexplored and numerous regional targets demand follow-up. For 2018, Northern Empire management put together a large exploration program with the intention to expand the resource through drilling. The company’s exploration is starting to demonstrate the potential at the Daisy Deposit.
The market has been responding positively to drill results. Since initial results released from the Daisy deposit on October, 04, 2017, shares in the company have moved from 77 cents per share to a year-high of $1.43, and at close of Feb. 23, 2018, $1.30. Upon release of the most recent results from Daisy, the stock rose 12 cents to $1.39 on 231,088 shares.
The company is also responding positively to these results with immediate plans to mobilize an additional drill rig to Daisy. Currently rigs are working on the SNA and Secret Pass deposits which are part of the Crown Block of deposits which includes the Daisy Deposit. In addition, field crews are mapping extensions of the known deposits and new drill targets.
This is just the beginning for Northern Empire in Nevada. Nevada is one of the largest gold producers in the world, renowned for open pit deposits which are amenable to heap leach mining. The early results from Daisy are indicating that the company is on the right track to adding high grade ounces to support the case for another open pit, heap leach mine in Nevada.

- For the past fifteen months or so, gold has repeatedly been turned back by immense technical resistance in the $1370 area.
- Please click here now. Double-click to enlarge this daily gold chart.
- There have been three clear attempts to push through the $1370 area since November of 2016. The first two failed miserably, but the current move looks much more positive.
- During the latest pullback from $1370, the bears have only managed to push the price modestly lower, to my key buy zone at $1310.
- The gold price promptly leaped higher as soon as it touched that area. This is very positive technical action. If the bulls fail a third time (unlikely), investors should be aggressive buyers at my $1270 and $1240 buy zones.
- Please click here now. Double-click to enlarge this gold chart for a closer look at the current price action.
- Gold is attacking the $1370 area from a symmetrical triangle pattern. Using the classic technical analysis promoted by Edwards & Magee, there is roughly a 67% chance of an upside breakout.
- That breakout would push the world’s mightiest metal through $1370… and open the door for a rush higher towards $1420, $1470, and $1520!
- Please click here now. Double-click to enlarge this exciting dollar versus yen chart.
- The dollar’s breakdown under the key 108 support area adds tremendous weight to the argument that gold is poised to surge above $1370.
- Most Trump supporters are focused on his campaign pledges regarding immigration, tariffs, defence, deregulation, and tax cuts. Their focus is on growth rather than inflation. That’s a mistake.
- Reduced immigration tightens the labour market, pushing inflation higher. Borrowing money to buy more bombs to expand an already-gargantuan military-industrial complex puts immense pressure on the bond market. Deregulation and tax cuts are also inflationary.
- While these pledges are indeed positive for gold, my main focus has always been on his more “thunderous” pledges regarding dollar devaluation and a haircut for T-bond investors.
- The dollar breaking 108 is a gamechanger, and the T-bond chart now looks like a train wreck. As bad as it looks now, this may be only the beginning of a bond market nightmare. The bottom line is that Jerome Powell could essentially drop financial nuclear bombs on that train wreck with relentless rate hikes, quantitative tightening, and small bank deregulation.
- To view the current T-bond train wreck chart, please click here now. Double-click to enlarge.
- The T-bond has arrived in the 142 target zone area of the H&S top pattern and a modest rally is expected. Having said that, fundamentals make charts.
- The negative fundamentals that Jerome Powell is set to put on the US government’s bond market table are going to put truly epic pressure on the government’s ability to finance itself.
- Trump is a brilliant businessman, but even a child operating a hot dog stand should clearly see that the US government’s debt problem has no solution other than some kind of bond market default, dollar devaluation, and gold revaluation.
- Trump is not concerned about the US debt problem, and nor should he be concerned if he’s a realist that knows there is no fix to the problem, only an end to it. An endgame that is incredibly positive for gold.
- Please click here now. Double-click to enlarge this GDX daily chart.
- Legendary mining expert David Harquail is launching a major drive to make gold an asset owned by most Western money managers. He’s bringing in heavyweight speakers like Alan Greenspan and other key central bank experts to bolster his presentations to institutional money managers.
- I’ve predicted that this would happen by the summer of 2018 as the Fed successfully transitions America from a deflationary vortex into a modest growth with significant inflation economy.
- King World News has covered the dramatic increase in free cash flow of most GDX component stocks. “Super Dave” Harquail is likely to get a US M2 money velocity bull market wind at his back (thanks to the efforts of Jerome Powell’s rate hikes and QT) as he makes his institutional presentations that highlight both bullion and the miners.
- If that happens, the Western gold community is very quickly going to be happily looking down at prices like GDX $32, $40, $55, $65, and even $100! Of course, that happiness can only happen if gold stock enthusiasts are prepared to take buy-side action right now in my key $23 to $18 GDX price range with a focus on their favourite individual miners!
Thanks and Cheers,
Stewart Thomson
Graceland Updates
https://www.gracelandupdates.com
Email:
Stewart Thomson is a retired Merrill Lynch broker. Stewart writes the Graceland Updates daily between 4am-7am. They are sent out around 8am-9am. The newsletter is attractively priced and the format is a unique numbered point form. Giving clarity of each point and saving valuable reading time.
Risks, Disclaimers, Legal
Stewart Thomson is no longer an investment advisor. The information provided by Stewart and Graceland Updates is for general information purposes only. Before taking any action on any investment, it is imperative that you consult with multiple properly licensed, experienced and qualified investment advisors and get numerous opinions before taking any action. Your minimum risk on any investment in the world is: 100% loss of all your money. You may be taking or preparing to take leveraged positions in investments and not know it, exposing yourself to unlimited risks. This is highly concerning if you are an investor in any derivatives products. There is an approx $700 trillion OTC Derivatives Iceberg with a tiny portion written off officially. The bottom line:
Are You Prepared?
![]()
Power Americas Minerals (TSX-V: PAM) / (OTCQX: PWMRF) is well positioned among roughly 18 juniors exploring for Cobalt (“Co“) (and associated gold/silver) in the world-class, past-producing Silver-Cobalt Mining Camp in northeastern Ontario, Canada. Although reports vary, something on the order of 400-750 M ounces of Silver (“Ag”) and 40-50 M pounds of Co were produced in the district.
Power Americas has assembled a moderate-sized (vs. its peers) 3,330 hectare (~8,230 acre) land package, 100%-owned, on 15 un-patented mining claims.
Others have properties in and around the district, most notably First Cobalt Corp., (TSX-V: FCC) and Cobalt Power Corp. (TSX-V: CPO) who, like Power Americas, have substantially all of their assets in Ontario. First Cobalt is the bellwether Co name in the region, but it has a C$236 M market cap., ~24 times larger than Power Americas’ ~C$10 M market cap. Cobalt Power is a ~C$28 M company. NOTE: {First Cobalt has by far the largest Co footprint in Ontario, PLUS the only permitted cobalt extraction refinery in North America}.
Importantly, none of the new players have advanced beyond early exploration stage. All of these stocks are highly speculative, and most companies probably would not exist were it not for the booming Co price– which has nearly quadrupled — (from US$21.7k/tonne in Feb 2016 to US$80.5k/tonne in Feb 2018) in the past 2 years.
Importantly, Power Americas has additional drill results to report this month and next. The Company is looking for multiple hits of 1 or more meters of greater than 1.00% Co mineralization, which would be better than most peers in the district have reported so far.
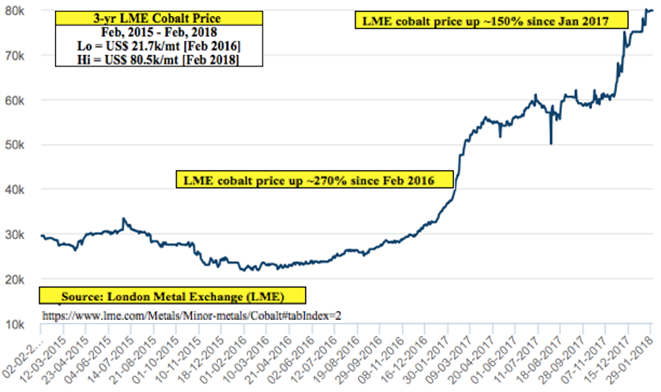
Perfect Storm for Cobalt Prices?
In the Co price chart above, notice the steepness of the curve over just the past several months. Cobalt has almost quadrupled (up ~270%) since February 2016 and is up ~150% since the beginning of last year. The move in Co prices is very similar to that of lithium prices, although lithium prices began moving 6-9 months earlier, and have not been moving up lately the way Co prices have.
Readers are likely aware that over 50% of global Co supply comes from the DRC, and that end users are very anxious to source Co elsewhere due to ongoing concerns about child labor law abuses. Making matters worse, the DRC (suddenly) raised its royalty rate on Co from 2% to 10%, and imposed a 50% “super-profits” tax — defined as income earned on sales of Co at prices > 25% above the price in a Company’s Feasibility Study.
This news comes at the same time that a number of major automakers like BMW, Tesla & Volkswagen are reportedly searching for long-term off-take agreements for cobalt & lithium. Of note, BMW is said to be close to a 10-yr agreement with an unnamed party. The DRC will remain the largest producer for years to come, but the playing field is wide open for supply from Canada and other more business-friendly countries.
Given the proverbial perfect storm for cobalt prices, the early-stage projects / properties in and around Cobalt Ontario could be among the better alternatives for Co supply next decade. Getting back to Power Americas, the management team is excited about the drill results they will be reporting shortly.
Jeffrey Cocks, President & CEO, stated,
“We believe we have assembled a sizable, 100%-owned land package [3,330 ha] that encompasses and surrounds several historical cobalt mines in the most active Cobalt Mining Camp in Canada. We’re highly encouraged by our initial 2017 Exploration Program’s results, and very excited to build off these results with our 2018 winter program that is currently underway.”
Neil Pettigrew, VP Exploration, explained an important factor that differentiates Power Americas from many nearby peers,
“Cobalt mineralization on the Kittson property occurs both in veins and fractures, this gives us a wider target zone. The mineralized zone also displays a fairly consistent strike and dip, these advantages give us a faster pathway toward defining what could be the first new NI 43-101 compliant cobalt resource in the camp.”
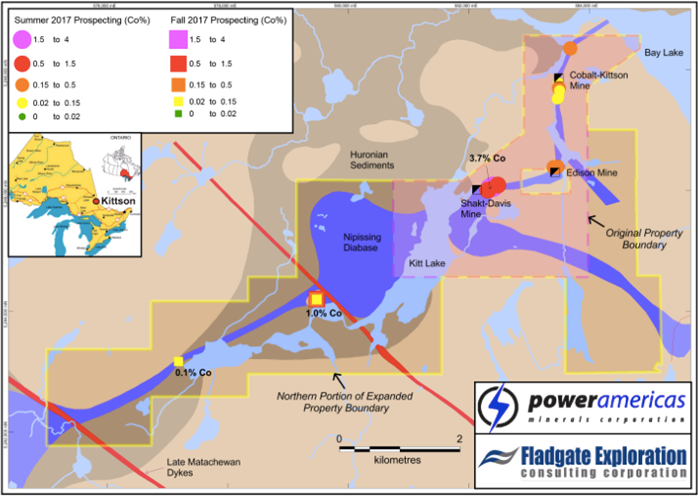
The Company’s Co contained mineralization is similar to that of the famous Silver-Cobalt Camp in Ontario, Canada, located ~15 km to the east. It contains the historic Shakt-Davis and Cobalt-Kittson mines, 4 mine shafts and numerous historic workings; the deepest extending down to 628 feet, and combined, > 2,500 feet of lateral development.
In late 2017, management acquired an additional 100% interest in 10 unpatented mining claims totaling ~2,240 hectares. Eight of the new claims are contiguous to the Kittson property and are interpreted to host the western extension of the Shakt-Davis and Edison mine structures. The other 2 are ~5 km south of the Kittson properties’ southern boundary.
Drilling is the Main Catalyst This Quarter
Management announced on January 23rd that it has commenced drilling on the 100% owned Kittson-Cobalt project. A total of 18 holes and 2,000 meters is underway as a follow up on the Fall 2017 ultra-light drill program. Sixteen holes are planned at the historic Shakt-Davis mine, and 2 on the northern extension of the historic Edison mine. Drill holes lengths of 75 to 250 m will test mineralization both near surface and below historic workings. Drill results will be released later this month and into March.
The fracture zone hosting the Shakt-Davis mine has returned grab samples up to 3.66% Co and 1.62% Co over 0.3 m in shallow drilling. The northern extension of the Edison mine hosts numerous historic trenches which have returned up to 0.49% Co in grab samples.
On January 16th, the Company announced results of their diamond drill program on the Kittson-Cobalt project. Seven shallow holes, totaling 161 meters were drilled beneath overburden-filled historic workings in the Shakt-Davis mine area. The program successfully intersected a fracture zone that hosts the Shakt-Davis mineralization over a strike length of 55 m, up to ~30 m deep. The zone is 5-13 m wide (drilled core length).
Commenting on these results, CEO Cocks said,
“These results represent the first drilling since the 1940’s at the Shakt-Davis mine and confirm the cobalt-rich nature of this extensive fracture zone. The zone which hosts the Shakt-Davis mine is related to those which also host the Kittson & Edison mines to the north and east, respectively, cumulatively representing over 3 km of strike length.“
Veins hosting the mineralization at Kittson differ from the typical Cobalt Silver Camp veins in that they are lower in Ag but richer in Co, and are associated with zones hosting meaningful amounts of Au. From assessment files in the Cobalt MNDM office,
“Assays and analyses indicated 1.5% Co and minor Ag over a width of 1.37 m, with select grab samples indicating up to 4.0% Co, and others with up to 2.72 oz/t gold. A further test of hand-picked ore indicated values of 0.87 oz/t Au, 7.92% Co & 7.72% Ni. Another sample returned 97 oz/ton Ag & 0.336% Co.” (Born and Hitch, 1990).
Conclusion
Power Americas Minerals (TSX-V: PAM) / (OTCQX: PWMRF) has as good a chance as any to find promising cobalt mineralization in Cobalt Ontario. A key takeaway from this article should be that Power Americas owns properties that have evidence of mineralization that is lower in silver but richer in cobalt, and is associated with zones hosting meaningful amounts of gold. And, the Company has a substantially lower market cap at C$ 10 M than many of its peers in the district.
Finally, near-term drill results, if they show some hits containing relatively large intervals of greater than 1.00% cobalt– could attract investor attention and drive the share price higher.
Disclosures: The content of this article is for informational purposes only. Readers fully understand and agree that nothing contained herein, written by Peter Epstein of Epstein Research, [ER] including, but not limited to, commentary, opinions, views, assumptions, reported facts, estimates, calculations, etc. is to be considered implicit or explicit, investment advice. Further, nothing contained herein is a recommendation or solicitation to buy or sell any security. Mr. Epstein and [ER] are not responsible for investment actions taken by the reader. Mr. Epstein and [ER] have never been, and are not currently, a registered or licensed financial advisor or broker/dealer, investment advisor, stockbroker, trader, money manager, compliance or legal officer, and they do not perform market making activities. Mr. Epstein and [ER] are not directly employed by any company, group, organization, party or person. Shares of Power Americas Minerals are highly speculative, not suitable for all investors. Readers understand and agree that investments in small cap stocks can result in a 100% loss of invested funds. It is assumed and agreed upon by readers that they consult with their own licensed or registered financial advisors before making investment decisions.
At the time this article was posted, Peter Epstein owned shares and/or stock options in Power Americas Minerals and the Company was an advertiser on [ER]. By virtue of ownership of the Company’s shares and it being an advertiser on [ER], Peter Epstein is biased in his views on the Company. Readers understand and agree that they must conduct their own research, above and beyond reading this article. While the author believes he’s diligent in screening out companies that are unattractive investment opportunities, he cannot guarantee that his efforts will (or have been) successful. Mr. Epstein & [ER] are not responsible for any perceived, or actual, errors including, but not limited to, commentary, opinions, views, assumptions, reported facts & financial calculations, or for the completeness of this article. Mr. Epstein & [ER] are not expected or required to subsequently follow or cover events & news, or write about any particular company or topic. Mr. Epstein and [ER] are not experts in any company, industry sector or investment topic.

Gold is faring quite well today technically, though you sure wouldn’t know it from the rampant bearish sentiment. Gold’s price is in a strong uptrend over a year old, high in both its current upleg and young bull market. Gold isn’t far from breaking out to its best levels since September 2013, a really big deal. The stock markets even finally sold off after years of unnatural calm. Yet traders are still down on gold.
Across all markets price action drives psychology. When something’s price is rising, traders get excited and bullish on it. So they increasingly buy to ride that upside momentum, amplifying it. Of course the opposite is true when a price is falling, which breeds bearishness and capital flight. Given gold’s great technical picture today, investors and speculators alike should be growing enthusiastic about its upside potential.
But they really aren’t, which is certainly curious. Gold’s current upleg was born right before the Fed’s last rate hike in mid-December. Everyone thinks Fed rate hikes are very bearish for gold, but history proves the opposite as I argued near gold’s recent interim lows. In the 2.4 months since, gold has rallied 6.6% as of the middle of this week. That trounces the leading benchmark S&P 500 stock index’s mere 1.6%.
Gold’s rate of ascent since mid-December annualizes out to a 33% pace, which is pretty darned exciting! Yet gold’s two primary sentiment proxies, silver and the stocks of gold miners, show enthusiasm for gold is nonexistent. Over that same current-gold-upleg span, silver is only up 5.0% while the HUI gold-stock index clocked in with a dismal 1.8% gain. Normally silver and the gold stocks leverage gold upside by 2x to 3x!
As I discussed about a month ago, gold is on the verge of a major breakout that would greatly shift psychology back to bullish. Gold’s bull-to-date peak was carved in early-July 2016 at a $1365 close. For a variety of reasons gold stalled at best since. Just a month ago gold surged to $1358 though, and only a week ago it hit $1353. It wouldn’t take much of a rally to boost gold to new bull-market highs to catch the limelight.
Generally upside breakouts have to be decisive to really attract traders’ attention. I define that as 1% beyond the old level, so $1379 in gold’s bull-high case. That’s only a handful of good up days away, not far at all. And that’s close to $1383, which is gold’s best level in a whopping 4.5 years. Start pushing $1400 again, and even oblivious traders who’ve long forgotten about gold will realize something big is changing.
On top of these key technical upside-breakout levels so close, the sharp stock-market selloff is fantastic news for gold investment demand. The S&P 500 plunged 10.2% in just 9 trading days! That ended an all-time-record 405-trading-day span without a mere 5% pullback, and is the first stock-market correction in 2.0 years. Stock selloffs are very bullish for gold, as investors remember the wisdom of diversifying portfolios.
So gold’s popularity should really be mounting now given its strong price action. Yet that certainly hasn’t happened yet, gold’s sentiment is really curious. The prevailing psychology remains quite bearish, which feels much more like a major bottoming. The fear, anxiety, and apathy somehow still plaguing gold is the polar opposite of the greed and excitement near major highs. Gold is still overlooked, ignored, and shunned.
This weird sentiment anomaly totally disconnected from technical realities can and will turn fast, likely as gold decisively breaks out to new bull highs. That could happen anytime in the coming weeks or maybe months, it is nearing. But for now, it’s useful to understand why gold oddly remains so out of favor. The answer lies in the psychology of gold’s two primary driving forces, futures speculators and stock investors.
Gold-futures speculators exert inordinate influence on daily gold price action. This is primarily due to the extreme leverage inherent in futures trading. This week a single gold-futures contract that controls 100 ounces of gold has a maintenance-margin requirement of just $3500. That’s all the capital traders need to buy or sell a contract. But at this Wednesday’s $1323 gold, each contract controls gold worth $132,300.
That equates to extreme maximum leverage of 37.8x, death-defyingly high! For comparison, the legal limit in stock markets for decades has been 2.0x. At 35x leverage, each dollar speculators deploy in gold futures has 35x the gold-price impact of another dollar used to invest in gold outright. Such ridiculous leverage allows futures speculators to collectively punch far above their weights, dominating gold-price action.
As if that’s not unfair enough to normal investors, gold futures’ extreme leverage necessitates an ultra-short-term focus. Again at 35x leverage, a mere 2.9% adverse price move in gold would wipe out 100% of the capital speculators risked! So these guys are forced to think in terms of minutes, hours, days, or sometimes weeks for their trading time horizons. The months and years of investors may as well be eternities.
That incredibly-myopic view on gold creates all kinds of problems because data is far too sparse to justify ultra-short-term trading. The best fundamental data available on gold is only published once each quarter by the World Gold Council. Some other localized peripheral data is released monthly. So with insane leverage compressing down speculators’ gold outlooks into days or less, they have nothing to trade on.
Instead of backing way off on their leverage and taking rational longer-term trading spans, they fabricate their own gold-trading cues. The two they’ve collectively decided on are the price action in competing US Dollar Index futures and the closely-related Fed-rate-hike outlook. Developments there motivating gold-futures speculators to act are half of the explanation surrounding gold’s curious sentiment these days.
Nearly a month ago futures speculators bid gold up to $1358. They were watching USDX futures, as that leading US dollar benchmark was grinding inexorably lower. On February’s first trading day, the USDX slumped to a major 3.1-year secular low. That weak dollar is what drove gold tantalizingly close to a major bull-market breakout. But futures speculators were perplexed if not angry this was actually happening.
These elite traders hold tight to certain core beliefs with tenacity that puts religious zealots to shame. The main one is that Fed rate hikes are bullish for the US dollar and therefore bearish for gold. The idea is simple, higher rates boost dollar yields making it relatively more attractive than other currencies. So foreign investors rush to buy, bidding the dollar higher. Futures speculators know this is how the world works.
That logic appears sound, but what if their deeply-held thesis simply isn’t true? The Fed’s current rate-hike cycle began in December 2015 after 9.5 years with no rate increases, and 7.0 continuous years of a zero-interest-rate policy. The 5 hikes since coming off a near-zero base should’ve been wildly bullish for the USDX, right? Futures speculators bet heavily long the dollar and short gold heading into that initial hike.
Yet since the day before the Fed started its current rate-hike cycle, the USDX is down 8.3% and gold is up 24.7% as of the middle of this week! Clearly Fed rate hikes aren’t as bullish for the US dollar or as bearish for gold as futures speculators thought. You’d think they’d be smart enough to form their trading strategies based on hard data instead of mere conceptual arguments. But they steadfastly refuse to budge.
Gold started to sell off on Friday February 2nd in the wake of the latest monthly jobs report. It saw wage growth climb at its fastest annual pace since June 2009, stoking inflation fears. Higher inflation implies the Fed will have to hike rates faster. So the oversold USDX surged 0.7% higher that day, making for its biggest up day since late October. Gold-futures speculators saw that and fled, hammering gold 1.4% lower.
The S&P 500 happened to plunge 2.1% that day on those same inflation fears, its own worst down day since early September 2016 before Trump won the election kicking off the extreme taxphoria rally. That sharp stock-market drop shattering the unnatural calm was the dominant news that day. That led investors to assume gold fell because the stock markets sold off, but the real reason was that big dollar bounce.
That’s happened before. Back in late 2008 during that first stock panic in a century the USDX rocketed 22.6% higher in just 4.2 months, its biggest and fastest rally ever! That was in response to safe-haven buying as the S&P 500 plummeted 38.1% in that short span. But that epic dollar strength hammered gold a proportional 23.7% lower. Investors wrongly figured weak stock markets hurt gold, but it was the hot dollar.
When stock markets fall sharply, cash suddenly becomes much more attractive than stocks. So dollar demand surges as stocks plunge. Gold-futures speculators see that and dump gold, driving it lower. This dynamic fully explains gold’s weakness in recent weeks. Every single gold down day was the direct result of a parallel USDX rally! That was true in early-February’s S&P 500 selloff and then again this week.
Since the dollar’s action and the Fed-rate-hike outlook is the extent of gold-futures speculators’ entire trading worldview, they’ve been really bearish on gold as the dollar bounced twice this month. Thus they have greatly pared their long gold-futures positions. This chart superimposes gold over the total gold-futures long and short contracts held by speculators, published weekly in the Commitments of Traders reports.
CoT data is released late each Friday afternoon current to the preceding Tuesday close. So the latest-available data on speculators’ collective gold-futures trading when this essay was published is as of February 13th. In just the 3 CoT weeks since gold hit $1358, these guys dumped a massive 59.8k long contracts! That’s equivalent to 185.9 metric tons of gold, a huge amount. No wonder gold couldn’t rally during that.
But interestingly all that frenzied gold-futures long selling on modest US-dollar strength drove specs’ total longs back down to their gold-bull support line rendered above in green. Other than a brief break below leading into the Fed’s last rate hike, strong buying has soon followed earlier support approaches. That has fueled sharp gold rallies once spec longs hit support. That will likely prove true again in coming weeks.
Despite the extreme leverage they wield, gold-futures speculators’ capital is finite. They only have so much they can deploy on both the long and way-smaller short sides of the trade. So looking at where specs’ total longs and shorts are relative to their own past-year trading ranges offers an excellent approximation of how much buying or selling firepower these guys have left. That greatly affects gold’s outlook.
As of last Tuesday the 13th, their total longs were only running 35% up into their past-year trading range. That means these elite traders still had room to do nearly 2/3rds of their likely near-term buying! That’s very bullish. The short side was far-less bullish, with speculators’ total gold-futures shorting running just 14% up into their past-year trading range. That means 6/7ths of likely short-covering buying was already done.
The gold-price impact of buying new long contracts or buying to cover existing shorts is identical. If these total long and short trading ranges are combined, speculators’ effective total upside bets on gold were at 55%. That implies 45% of probable near-term buying remains! That’s exceptionally bullish with gold still up near major breakout highs. Normally near highs 80% to 90% of buying power has already been expended.
So once the USDX inevitably turns lower again, there’s lots of room for speculators to buy gold futures and push gold higher. The dollar weakness will likely reemerge on ballooning US deficits and debt. The Republican lawmakers are keeping the extreme out-of-control government spending of the Obama era intact, while simultaneously cutting taxes. Rising rates are also catapulting US interest expenses much higher.
And more Fed rate hikes aren’t likely to ride to the dollar’s rescue. The USDX entered the last Fed-rate-hike cycle between June 2004 to June 2006 relatively low, perfect conditions for a rally. Then the FOMC hiked 17 times in a row, more than quintupling its federal-funds rate to 5.25%. Yet the USDX still slipped 3.8% over that exact span, while gold powered 49.6% higher! Fed rate hikes haven’t proven great for the dollar.
The second driving force behind gold’s curious sentiment is little investor interest. Investors control vastly more capital than futures speculators. So when investment capital is moving into or out of gold in any significant way, it overpowers and drowns out all the daily gold-futures noise. Stock selloffs greatly boost gold investment demand, but not immediately. Investors first get distracted by the dollar-driven futures action.
The S&P 500 plunged 8.5% in just 5 trading day ending February 8th, a precipitous tumble. Yet instead of surging on that stock weakness, gold dropped 2.4%. Investors assume that was in sympathy with the stock markets. But it was really the result of the USDX surging a similar 2.0% over that span on safe-haven buying. The dollar surging on heavy demand in the hearts of stock-market selloffs delays gold’s reaction.
So investors weren’t yet flocking back to gold earlier this month. The world’s dominant gold ETF publishes its physical-gold-bullion holdings held in trust for shareholders daily. The GLD SPDR Gold Shares showed no holdings builds as stock markets recently plunged, indicating stock-market capital wasn’t yet flowing into gold. There were actually sizable draws over that span as stock investors dumped GLD shares.
When stock markets fall sharply, investors freak out. Fear flares so fast that people have to act instead of think. So they sell everything they can to raise cash, including gold. Weaker gold prices driven by futures selling in response to the surging USDX exacerbate any gold selling. In the heat of the moment investors think gold gets sucked into stock-market selloffs, that it really doesn’t move counter to stocks.
But once the biggest-fear days in stock-market selloffs pass, investors come to realize they are taking on too much risk with their stock-dominated portfolios. So they start rebuilding depleted gold positions in the wake of major stock-market selloffs. We’re indeed already seeing modest GLD builds return over the past week or so. And this same dynamic was actually what birthed today’s gold bull back in early 2016.
Heading into that first Fed rate hike in 9.5 years in December 2015, gold slumped to a brutal 6.1-year secular low. Because futures speculators are totally convinced Fed rate hikes are kryptonite for gold, history be damned. The S&P 500 had gone a near-record 3.6 years without a single 10%+ correction, so complacency was extreme. Investors believed stocks did nothing but rally, so they could hold them forever.
Finally back-to-back S&P 500 corrections arrived in mid-2015 into early 2016. This benchmark stock index fell 12.4% in 3.2 months, bounced most of the way back, and then dropped another 13.3% over 3.3 months into mid-February 2016. That first SPX correction only spurred limited gold investment buying. Stock investors weren’t very worried the lofty stock markets would head much lower again, so they procrastinated.
Yet after that second correction arrived shortly after, differential GLD-share demand exploded! Investors flocked back to gold to prudently diversify their stock-heavy portfolios. That heavy investment buying catapulted gold 29.9% higher in just 6.7 months, birthing today’s bull market. Gold kept rallying rather relentlessly until the stock markets finally made new highs which totally dispelled weaker-stock worries.
The same thing happened during and after 2008’s epic stock panic. Gold was hammered by the skyrocketing USDX during that extreme stock-market selloff. But in the following months gold investment demand blasted higher as investors realized they needed counter-moving gold allocations in their portfolios. That heavy gold investment demand persisted for years after the stock panic, driving gold to record highs.
History has shown over and over that gold investment demand is weak when stock markets are high and euphoric. Why buy gold when stocks apparently do nothing but rally indefinitely? But once corrections or new bear markets emerge to rebalance sentiment and knock back overvalued, overbought stocks, gold soon returns to favor. That doesn’t happen instantly, as safe-haven dollar buying temporarily forces gold lower.
But after major selloffs when investors start to realize that stock markets can fall too, they start thinking about gold again. It’s the ultimate portfolio diversifier. That post-selloff gold-investment process is very gradual, it takes months or years to rebuild significant gold positions relative to stock portfolios. Odds are a similar outcome will play out again following this latest sharp S&P 500 selloff, which likely isn’t over yet.
Given the radical gold underinvestment following this extreme stock bull, investors will likely have to do big gold buying for years to reestablish normal portfolio allocations. That will continue to fuel this young gold bull born in late 2015 in the previous stock-market correction. At best gold was only up 29.9% so far as of mid-2016, nothing yet. The last gold bull powered 638.2% higher over 10.4 years ending August 2011!
While investors can ride gold’s ongoing bull in GLD shares, far better gains will be won in the stocks of its leading miners. They tend to amplify underlying gold gains by 2x to 3x due to their profits leverage to gold. With gold so out of favor, the gold stocks are deeply undervalued today. That gives them huge upside as gold mean reverts higher, dwarfing everything else in all the stock markets. Fortunes will be won.
At Zeal we’ve literally spent tens of thousands of hours researching individual gold stocks and markets, so we can better decide what to trade and when. As of the end of Q4, this has resulted in 983 stock trades recommended in real-time to our newsletter subscribers since 2001. Fighting the crowd to buy low and sell high is very profitable, as all these trades averaged stellar annualized realized gains of +20.2%!
The key to this success is staying informed and being contrarian. That means buying low before others figure it out, before undervalued gold stocks soar much higher. An easy way to keep abreast is through our acclaimed weekly and monthly newsletters. They draw on my vast experience, knowledge, wisdom, and ongoing research to explain what’s going on in the markets, why, and how to trade them with specific stocks. For only $12 per issue, you can learn to think, trade, and thrive like contrarians. Subscribe today, and get deployed in the great gold and silver stocks in our full trading books!
The bottom line is gold’s curious sentiment today results from an interplay of factors. Safe-haven dollar buying erupted as usual during the stock markets’ first real selloff in a couple years. That led the gold-futures speculators to sell aggressively, driving gold lower. Investors saw gold falling with stocks and wrongly assumed stock selloffs aren’t bullish for gold. And their confidence in stocks remains very high.
But as stocks head lower again after their post-correction bounce, psychology will really shift. Investors will increasingly worry that stock weakness could persist for some time. They will remember gold is the ultimate portfolio diversifier, and start shifting capital back into it. The resulting investment buying will persist for months or even years, drowning out whatever the hyper-leveraged gold-futures speculators are up to.
Adam Hamilton, CPA
February 23, 2018
Copyright 2000 – 2018 Zeal LLC (www.ZealLLC.com)
- I’ve noted that when China’s markets go quiet during the “Golden Week” holiday, the gold price tends to soften.
- Please click here now. Double-click to enlarge this key gold chart. Price softness is expected during this holiday, and the good news is that it is occurring on very light volume.
- The bears would argue there’s a small double top in play, while the bulls have an inverse head and shoulders bottom pattern on their team. A bull flag pattern may also have formed.
- I’ve told investors to expect a substantial battle between the bulls and bears in the $1370 area, and that’s exactly what is taking place.
- Please click here now. Double-click to enlarge this US dollar versus Japanese yen chart. After tumbling through key support at 108, a relief rally is now in play.
- The 108 area is now resistance. For gold, the price action of the dollar against the yen is very important. I expect the dollar’s relief rally to fail in the 108 – 110 area, and then a descent towards par (100) should get underway.
- That would be a key signal that gold is going to move above $1370 and attract significant institutional interest by doing so.
- In terms of trading volume, gold is a huge market. On a daily basis, dollar volume for gold trading in London is about as big as all the dollar volume for all the stocks traded on the New York Stock Exchange.
- Banks trade gold as a FOREX market currency. In terms of volume, it’s the fifth most active in the world. So, when the gold price weakens as Chinese buyers go on holiday, that can affect other major markets.
- For example, today the Dow is down, bonds are down, but the dollar is up against the yen. That’s because Golden Week is pushing gold down against the dollar and FOREX traders are reacting to that in the dollar-yen market.
- Please click here now. Double-click to enlarge this T-bond chart. Most bank analysts thought that gold would fall if the Fed launched quantitative tightening and rate hikes. Instead, gold has rallied since the tightening cycle began, as I predicted it would.
- Most investors underestimate the effects of love trade demand for gold (or lack of it) on the world’s major markets. Gold demand growth in China and India can put pressure on US interest rates. That’s because bank FOREX traders react to the rise in the gold price by selling the dollar.
- Credit Suisse notes that countries like China are increasing their “dedollarization”. That’s more good news for gold.
- Trump and most congressmen are aggressively increasing the US government’s debt. I’ve argued that Trump likely believes there is no solution to the government’s debt problem other than gold revaluation, dollar devaluation, and T-bond default.
- Since there is no real solution and Trump is a pragmatist, he just lets the debt rise to the T-bond default/gold revaluation point. It’s a wise move on his part, and fabulous news for gold stocks!
- Please click here now. Double-click to enlarge this GDX chart. GDX has again entered my ultra-important $23 – $18 accumulation zone. Investors need to keep their eye on the US M2 money velocity reversal prize, because that is what will produce sustained outperformance of gold stocks against gold.
- On that note, please click here now. Fred Hickey does a spectacular job of outlining the mindboggling undervaluation of gold stocks versus bullion. The same is true for the silver stocks; the miners have cut costs but are trading at generational lows against bullion.
- Fred notes that for the average GDX component stock the spread between the company’s revenues and costs is about the same as it was in 2012, there are less GDX shares outstanding now, but the GDX ETF price is now about $22 versus about $45 in 2012!
- Many gold market analysts have noted the facts that Fred notes. To repeat, what creates a sustained outperformance of gold stocks versus bullion is inflation. To get serious inflation, money velocity must rise.
- To get a rise in money velocity, fiat money must move out of the deflationary hands of the US government (T-bonds) and into the fractional reserve banking system. To get that job done, rate hikes and quantitative tightening are mandatory catalysts.
- The great news is that Jerome Powell is now sitting in the Fed’s big chair. On March 21 he is going to set the tone for the rest of the year with his statements and actions. Jerome has stated that he doesn’t really follow the stock market.
- That’s a slap in the face for mainstream analysts that literally worship the US stock market as some kind of “supreme being”. Jerome is set to do a lot of the things that Paul Volker did in the 1970s (without the cigars, fanfare, and ego).
- Ben Bernanke promoted deflation with QE and rate chops. That produced a dramatic acceleration in the gold stocks versus gold bear cycle. Janet Yellen talked a great inflationary talk, enacted the right policies to get the inflationary job done, but moved at a snail’s pace.
- Jerome has tax cut inflationary wind at his back, and I expect most market gurus (mainstream and gold) to find themselves shell shocked when Jerome shows them on March 21 just how focused he really is on reversing US money velocity. Let’s hope the entire world gold community is as focused as I am on accumulating key gold stocks in my $23 – $18 buy zone for GDX, in preparation for a major league bull market in US money velocity!
Cheers
Stewart Thomson, Graceland Updates
Note: We are privacy oriented. We accept cheques, credit card, and if needed, PayPal.
Written between 4am-7am. 5-6 issues per week. Emailed at aprox 9am daily.
https://www.gracelandupdates.com
Stewart Thomson is a retired Merrill Lynch broker. Stewart writes the Graceland Updates daily between 4am-7am. They are sent out around 8am-9am. The newsletter is attractively priced and the format is a unique numbered point form. Giving clarity of each point and saving valuable reading time.
Risks, Disclaimers, Legal
Stewart Thomson is no longer an investment advisor. The information provided by Stewart and Graceland Updates is for general information purposes only. Before taking any action on any investment, it is imperative that you consult with multiple properly licensed, experienced and qualified investment advisors and get numerous opinions before taking any action. Your minimum risk on any investment in the world is: 100% loss of all your money. You may be taking or preparing to take leveraged positions in investments and not know it, exposing yourself to unlimited risks. This is highly concerning if you are an investor in any derivatives products. There is an approx $700 trillion OTC Derivatives Iceberg with a tiny portion written off officially. The bottom line:
Are You Prepared?
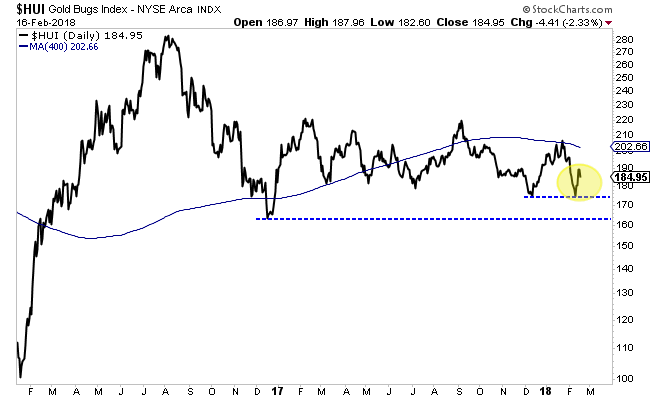
Gold has been on the cusp of a major breakout but someone forgot to tell the gold stocks. Gold is right back at resistance levels yet the various gold stock indices are off their September 2017 highs by 11% to 16%. The relative weakness in the gold stocks (and Silver) is a signal that Gold is unlikely to breakout now. In fact, if Gold were to correct here the gold stocks could threaten support and perhaps make new lows. While that sounds quite bearish, history shows that a break to new lows in gold stocks would be a massive buy signal.
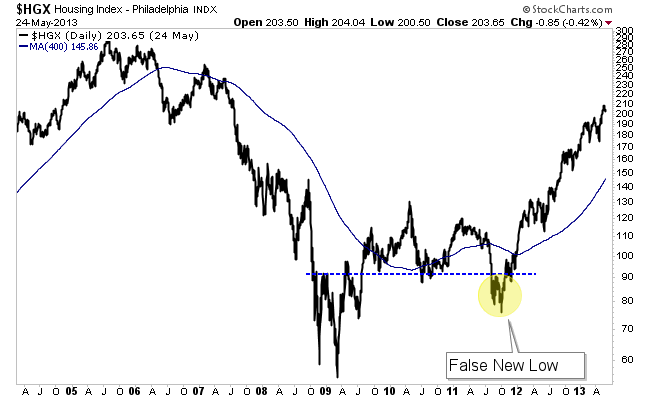
The history we refer to is the path of recovery for a market following a mega-bear, which we define as nearly 3 years and at least an 80% decline. There are three strong historical examples. Those are the S&P 500 during the Great Depression, Thailand after its bust in the mid to late 90s and the housing stocks after 2005 to the March 2009 low. The recovery in each (following the mega-bear) followed three distinct phases. There is a sharp initial rebound which is followed by a correction and lengthy consolidation which lasts at least 18 months. Eventually, the long consolidation ends and the market surges higher in an impulsive fashion.
The gold stocks are currently in the 19th month of their correction and consolidation. They bounced from support in December but retraced that entire bounce. After a second rebound from support, they could threaten a break of that support. Below we show the HUI Gold Bugs Index which does not include the royalty companies as GDX does. The HUI is not too far from its December 2016 low and could even break it if Gold were to correct.
Conventional technical analysis would imply that is a sell signal for the gold stocks.
But history argues the complete opposite.
In the 21st month of its correction and consolidation in 1935, the S&P 500 had broken down to a 2-year low. Was the market headed for a retest of the Great Depression low?

In the 19th month of its consolidation in the fall of 2011, housing stocks had broken to a 2-year low. Was the sector headed for a retest of the Global Financial Crisis low?
Thailand’s correction and consolidation phase was different than the others as it made its low only 15 months in but then consolidated and grinded slightly higher for the next 13 months before exploding to the upside. At its corrective price low 15 months in the index was at a 2-year low.
The HUI closed Friday just below 185. Its December 2016 low is 163.49. A 12% decline would put it below its December 2016 low and at a 2-year low.
The three historical examples all made 2-year lows before their correction and consolidation phase ended.
A potential failed breakout or correction in Gold could leave gold stocks vulnerable to a decline to new lows. While that sounds bearish, the historical context argues otherwise. Two of the three historical examples that show similarities to the gold stocks broke to new lows. Yet that break proved to be the best buying opportunity since bear market low. All three of the historical examples made 2-year lows before exploding higher. History shows that if the HUI Gold Bugs Index were to break to new lows it could be a false break and a massive buy signal. Quality juniors that are bought on forthcoming weakness (if Gold corrects) should deliver fantastic returns over the ensuing 12 to 18 months. To follow our guidance and learn our favorite juniors for the next 12-18 months, consider learning about our premium service.
![]()
‘In order to produce half a million cars a year…we would basically need to absorb the entire world’s lithium-ion production.’ – Elon Musk
“The skillsets that young people should learn about mining should apply to everything. We just need to do a better job of explaining to people in urban environments that the human activity of mining is absolutely fundamental to the way this planet is going to evolve. Completely and totally fundamental.” – Robert Friedland, Ivanhoe Capital
The future envisioned by industry leaders hinges heavily on the production of new materials to power and build the future. Leaders such as Elon Musk have been developing the blueprint for the future with electric cars, battery grids and renewable energy solutions. While, other leaders such as Robert Friedland are looking to supply the materials to build this future. Mr. Friedland makes the case and understands the story that is unrolling in real time. Mining is the critical component to meet the world’s demands for a sustainable future. The prerequisite for this future is mining and with every mineral discovery and development project, this future is coming closer.
Mr. Friedland is not the only miner that realizes the economy of tomorrow will require the development of new mining assets. Azincourt Energy Corp. (TSX-V: AAZ) is a Canadian junior exploration company that has been actively building their mining asset portfolio in anticipation of the future demand for minerals that will provide clean energy; from lithium to uranium to cobalt.
Azincourt Energy Chairman, Ian Stalker is an experienced mining executive that sees the writing on the wall when it comes to the materials and fuel that future technology will require. Mr. Stalker is a senior international mining executive with over 45 years of hands-on experience in resource development. Over his career Mr. Stalker has directed over twelve major mining projects, from exploration drilling to start-up, including gold, base metal, uranium and industrial minerals. He is currently CEO of LSC Lithium (TSX.V: LSC), and Chairman of Plateau Uranium (TSX.V: PLU), and is the former CEO of UraMin Inc., the London and Toronto listed public uranium company that was acquired by Areva for US$2.5 billion in August 2007. In a recent press release, Mr. Stalker outlined the current strategy for Azincourt.
“The lithium market is obviously very strong right now, and the near-term future for lithium demand remains extremely positive. Our decision to expand Azincourt’s focus to include lithium and other materials is something we feel strongly about. To get a foothold and exposure in this environment, at this time, is an important and strategic step for us.”
Azincourt recently acquired five lithiums projects in located in the Winnipeg River Pegmatite Field, Manitoba, Canada. Two of the projects, the Lithium One and Two projects, are adjacent to Quantum Minerals Corp.’s Cat Lake lithium project which includes a historical estimate from drilling in 1947 that defined 545,000 tonnes of 1.4 percent lithium oxide (Li2O). Drilling could prove up this ground.
Two other of the acquired lithium projects, the Lithman West and East projects are adjacent to the Tanco Mine lease property. These projects are part of the Winnipeg River pegmatite field which hosts numerous lithium-rich pegmatites or “hard-rock” lithium such as the Tanco pegmatite that has been mined at the Tanco mine since 1969 for spodumene, a major component for hosting lithium (Li), and other rare earth ores.
Azincourt has scheduled exploration work to begin in the spring of 2018, with a field program that includes detailed mapping of the known pegmatite outcroppings on the Lithium One and Lithium Two projects. This will be followed immediately by a comprehensive chip sampling program designed to generate targets for the drill programs anticipated at both properties during the summer of 2018.
Previous work in 2016 produced twelve samples between a range of 0.02 per cent to 3.04 per cent Li2O from the Eagle pegmatite, and up to 2.08 per cent Li2O. Select sampling will concentrate on the Eagle and FD5 pegmatites at Lithium Two, and on the Silverleaf pegmatite at Lithium One, which returned values as high as 4.33 per cent Li2O in the 2016 exploration program (see press release dated Feb. 1, 2018).
On Feb. 8, 2017, the company signed a non-binding letter of intent to acquire the BullRun erythrite project, a prospective cobalt property located six kilometres northwest of the town of Cobalt, Ont. (see press release date Feb. 8, 2018). Alex. Klenman, President and CEO of Azincourt Energy commented on the company’s strategy with this acquisition.
“We’ve been looking into adding a potential cobalt property as we grow our project portfolio, so we’re pleased to move to LOI on this. We are going to immediately begin a comprehensive due diligence process to gain as much understanding as we can on the potential of the project, and we hope to progress to the definitive stage in due course. In addition, we are actively reviewing other potential projects that will continue to strengthen the company in the growing clean energy space. We haven’t filled our want list yet, so we remain very active on the acquisition front.”
True to the company strategy, Azincourt announced a new project that is adjacent to the western edge of Plateau Uranium’s (TSX-V: PLU) Macusani Project in Peru. This project contains the high-grade Falchani discovery that includes consistent 3,000-3,500 ppm Li over 100m intercepts at depth, and U3O8 grades up to 500 ppm over 50m intercepts at surface. The plateau features areas of uranium-rich surface mineralization as well as lithium mineralization at depth.
Initial leach test results conducted by Plateau Uranium in December showed that 77-80% of contained lithium can be extracted from Falchani. Plateau’s Macusani Project is fast becoming one of the world’s largest undeveloped uranium-lithium districts. Although Macusani started life as a pure uranium story, exploration and metallurgical work has unearthed the lithium resource at depth.
The company has been developing two projects in the Athabasca basin, in Northern Saskatchewan, home to the largest and highest grade deposits in the world, the Preston Project and the Patterson North Lake Property.

The Preston project comprises a large land position (approx. 121,249 hectares) strategically located to the south of NexGen Energy’s (TSX-V: NXE) Rook 1 project hosts the high grade Arrow deposit, as well as proximal to Fission Uranium’s (TSX: FCU) Patterson Lake South project host to the high grade Triple R deposit. The company has 15 drill target areas associated with eight prospective exploration corridors that have been successfully delineated through extensive geophysics.
The second project, The Patterson Lake North property “PLN” lies next to the northern edge of the Patterson Lake South property, owned by Fission Uranium Corp. (TSX-V: FCU) where uranium mineralization has discovered over 2.24 kilometres (east-west strike length) in four separate mineralized “zones.”
To date Azincourt has spent $3 million earning into PLN. Prior to Azincourt’s involvement, Fission spent approximately $4.7 million on exploration on PLN. There are three separate target areas that are drill-ready.
Azincourt Energy Corp. recently completed a private placement for gross proceeds of $1,655,000. In addition, the company has received an additional $1,215,009.48 in gross proceeds from the exercise of warrants over the past several weeks.
“We have more than enough funds to meet existing work requirements on our lithium and uranium projects for the next year or so, and further, the additional funding means we have upward flexibility in how we approach our work programs and portfolio expansion. Simply put, we can put more dollars into the ground, and into acquisitions,” said Mr. Klenman.
With ~69 million shares outstanding, cash in the bank, the company trading at 19 cents, the company has plenty of exploration news on the way, shares in Azincourt present a current opportunity.
While inventions and ideas grab the headlines, little attention is given to the fundamentals of building a clean energy future. Azincourt Energy Corp. (TSX-V: AAZ) has put together an impressive portfolio of mineral projects from lithium, uranium to cobalt; the minerals that will fuel the future. Azincourt Energy is in the early stages and with news on the way, investors should pay attention.
Clicker Here to Visit the Company’s Web Page: http://azincourtenergy.com/
*** The mineral reserve estimate cited above as part of the Lithium Two project is presented as a historical estimate which does not conform to current National Instrument 43-101 standards. A qualified person has not done sufficient work to classify the historical estimate as current mineral resources or mineral reserves. Although the historical estimates are believed to be based on reasonable assumptions, they were calculated prior to the implementation of National Instrument 43-101 standards. These historical estimates therefore do not meet current standards as defined under sections 1.2 and 1.3 of NI 43-101; consequently, the issuer is not treating the historical estimate as current mineral resources or mineral reserves.
***MiningFeeds.com was compensated for the creation and publication of this article. This does not constitute investment advice.

The gold miners’ stocks weathered the recent stock-market plunge really well. As evident in their leading GDX ETF, they were already beaten down before stock markets started falling. The resulting explosion of fear bled into GDX, forcing it even lower. Nevertheless, no major technical damage was done. GDX remained well within its consolidation trend channel and is still within striking distance of a major $25 breakout.
Gold stocks’ behavior during stock-market selloffs can seem capricious. This small contrarian sector generally amplifies the price action in gold, which drives its collective profitability. Gold tends to surge in the wake of major stock-market selloffs, which erode investors’ confidence in stocks’ near-term outlook. That greatly boosts gold investment demand as investors soon rush to wisely diversify their stock-heavy portfolios.
This drives gold prices higher after material stock-market weakness. So naturally the gold stocks mirror and amplify gold’s gains which really improve their fundamentals. But this broader strengthening trend is interrupted by a lot of chaotic noise. The collective greed and fear generated by the stock markets’ daily action heavily influences gold-stock traders, especially when the stock markets are exceptionally volatile.
The gold miners’ stocks are just that, stocks. So it’s not uncommon for them to get sucked into serious down days in the general stock markets, which fuel widespread fear. When the flagship S&P 500 stock index (SPX) falls sharply, nearly everything else is dumped in sympathy including the gold stocks. The SPX truly is the dominant center of the global financial-market-sentiment universe, greatly affecting everything.
Unfortunately sharp SPX down days’ ability to heavily influence GDX wreaks havoc on sentiment in the gold-stock sector. Traders read historical studies proving the precious-metals realm is the best place to deploy capital in and after weakening stock markets. So they rightfully expect gold-stock prices to rally on balance. But when GDX plunges on a big SPX down day, their fear soars and they abandon gold stocks.
Human psychology always tends to overweight the importance of recent and traumatic events, with our minds wanting to extrapolate short-term turmoil out into infinity. Thus when gold stocks get sucked into a sharp general-stock selloff, traders assume they can’t thrive in weak stock markets. They lose the trend forest for the daily trees! This fearful herd sentiment scares them into panicking and selling gold stocks low.
Weakening stock markets are like springtime for gold and its miners’ stocks due to higher investment demand. Just as daily temperatures gradually warm over time during spring, gold stocks rally on balance after material stock-market weakness. But spring weather also includes periodic cold snaps that can feel winter-like. They are just temporary counter trend aberrations though, like gold-stock drops on big SPX down days.
This first chart looks at gold stocks’ recent price action through the lens of GDX, the VanEck Vectors Gold Miners ETF. Since its birth in May 2006, GDX has grown into the leading and dominant gold-stock ETF. As of this week GDX’s $7.6b in assets under management ran a whopping 22.0x larger than its next-biggest 1x-long major-gold-stock-ETF competitor! GDX actually weathered the stock plunge really well.
The sharp stock-market selloff in the past couple weeks has been extraordinary, largely unprecedented on multiple key fronts. The S&P 500 was wildly overvalued and overbought in late January, deep in its longest span ever witnessed without a mere 5% pullback. Volatility was trading near record lows, which catapulted complacency off the charts. Last week I explored all this in an essay analyzing stock selling unleashed.
The first real day of serious SPX selling was Friday February 2nd. The gold stocks certainly weren’t high leading into that, as GDX had closed the day before at $23.70. That was merely on the high-middle side of gold stocks’ consolidation trading range. Really since late 2016, GDX has largely meandered between $21 support and $25 resistance. It had neared a major $25 breakout in late January, but couldn’t punch through.
On Friday the 2nd the SPX plunged 2.1% after rising wages on the US monthly jobs report stoked fears of inflation. 10-year Treasury yields continued their sharp surge since the latest Fed rate hike in mid-December. That SPX down day was the worst since September 2016, before Trump won the election and the resulting extreme taxphoria rally. It generated some real fear which spilled over into the gold stocks.
But that stock-fear bleed-in sure wasn’t the only reason GDX fell 3.3% that day to revisit its technically-important 200-day moving average. With inflation fears mounting, futures traders figured the Fed might have to increase the tempo of this rate-hike cycle. So the US Dollar Index surged a sharp 0.7% higher, which led gold-futures speculators to hammer gold 1.4% lower. GDX’s initial stock-selloff loss was reasonable.
The major gold stocks tend to amplify gold’s underlying price action by 2x to 3x. And GDX’s downside leverage to gold that day ran 2.4x, right in line. Most of the time gold stocks still follow gold, even when stock markets are weaker. But on exceptional SPX down days when fear really flares, that overshadows gold as traders are infected by prevailing herd sentiment. That really started to happen on Monday the 5th.
The SPX selloff greatly intensified as it plunged 4.1%, its worst daily drop since way back in mid-August 2011! That was extreme, as stock markets usually don’t plummet so rapidly from record highs. Because it had been so long since the SPX plunged, fear skyrocketed as evidenced by the VIX implied-volatility index. Foolish traders who had aggressively shorted volatility near record lows scrambled to unwind their bets.
Gold caught a modest bid that day, rallying 0.6% despite the US Dollar Index climbing another 0.4% on safe-haven buying. On days when the SPX plunges yet gold climbs, traders are torn about what to follow so the gold stocks generally split the difference. Indeed that day GDX slid another 0.9%, far milder than the sharp SPX plunge but still worse than gold. That left GDX at $22.71, sliding farther under its key 200dma.
After plunging even deeper early on Tuesday the 6th, the SPX reversed sharply to a 1.7% gain on close as the extreme VIX-futures long buying abated. Gold suffered a 1.1% loss on the stronger stock markets as well as a major 1.4% draw in its leading GLD gold ETF’s holdings. Investors likely dumped GLD shares for a source of capital. Since gold is much stronger than general stocks in SPX selloffs, GLD is easy to sell.
With gold falling sharply GDX dropped another 2.6% on that third day of the SPX selloff. Once again that made for 2.4x downside leverage to gold, which is perfectly normal. Although that decisively broke GDX below its 200dma, at $22.11 it remained well within its long-established consolidation trend channel. With trend support at $21, gold stocks still had a ways to go before they threatened a major technical breakdown.
The SPX selling resumed on Wednesday the 7th with a relatively-minor 0.5% loss. Gold fell by the same amount, as once again the US Dollar Index surged 0.7% on flight-capital safe-haven buying. GDX lost another 1.4% to hit $21.80 on close. That amplified gold by 2.8x, still within that normal 2x to 3x range for the major gold stocks. The gold stocks were weathering that sharp SPX selloff really well by that point.
On Thursday the 8th the stock markets started sliding again on no news, and the SPX fell relentlessly all day long. By the time the dust settled, it had collapsed another 3.8%! Two huge 4%ish down days out of just four trading days was very serious, generating the most fear traders have experienced for at least a couple years. Gold eked out a 0.1% gain with the US dollar flat, and the gold stocks split the difference as usual.
GDX only retreated 0.6% that day the SPX formally plunged into correction territory for the first time since early 2016. That was truly an impressive show of strength given the stock markets rapidly spiraling lower. At $21.68, GDX remained well above its $21 support line that has held rock solid since late 2016. It looked like the gold stocks were nearing selling exhaustion since they fell so little on such a huge SPX down day.
In just five trading days the SPX had plummeted 8.5%! That was a big drop by any standard, let alone off record highs out of near-record-low volatility. Interestingly GDX exactly mirrored that drop, falling an identical 8.5% in that same span. Relative to gold that was excessive, 3.5x the 2.4% gold lost during that same timeframe. But with GDX remaining well within its consolidation trend channel, technical damage was minor.
Last Friday the 9th once again saw the SPX slide rapidly after open before reversing sharply to a large 1.5% daily gain. Gold stocks got sucked into that early fear-spawning selling, which was exacerbated by gold itself slumping lower before a -0.2% close. GDX tested that $21 support intraday, but bounced back to a dead-flat close. This small contrarian sector had successfully weathered an exceptional SPX selloff!
This week the SPX and gold both rebounded, each rallying Monday, Tuesday, and Wednesday. Thus it wasn’t surprising GDX followed suit, rallying 1.3%, 0.1%, and a monster 4.6% by the data cutoff for this essay. Thus over the entire 9-trading-day span of the recent volatility storm, GDX merely slipped 2.9%. That was again between the SPX’s 4.4% loss and gold’s slight gain. The gold miners’ stocks are faring fine!
This Wednesday GDX was back up to $23.01, exactly in the middle of its consolidation trading range of the past year between $21 support and $25 resistance. GDX was back over its 200dma again, and still within striking range of that critical $25 breakout I discussed a month ago. If you had totally tuned out for 9 trading days and ignored the SPX-selloff action, it would’ve looked like gold stocks were still merely basing.
One of the greatest benefits to continuing to study the markets and staying immersed in them is you will gradually become immune to herd sentiment. After you’ve seen enough selloffs, they increasingly lose their ability to scare you. And you remember that sharp selloffs are short-lived, whether in the general stock markets or gold stocks. So you come to accept them as inevitable periodically, and they don’t rile you up.
A great analogy is a beekeeper. Most people are scared of bees, freaking out if bees buzz too closely or land on them. I know I’m no fan of bees invading my personal space. But beekeepers have no fear of bees because they work with them all the time. They certainly respect bees and understand the risks of being around them. But all their experience with bees leads to enough knowledge to negate emotional responses.
Gold stocks have always been a volatile sector. That’s actually a core reason they are so alluring, as this volatility translates into big and fast gains when they are rallying. In roughly the first half of 2016, GDX rocketed 151.2% higher on a parallel 29.9% gold upleg! Volatility is a double-edged sword, sectors that can rally fast will also fall fast. So gold-stock investors must accept periodic sharp selloffs as par for this course.
The major gold stocks as represented by GDX are doing fine. Despite some choppiness as the SPX was flailing about in recent weeks, they are continuing to base in their well-established consolidation trend. They are still on track for a major GDX $25 breakout, which will work wonders to shift sector psychology back to bullish again and spur big capital inflows. The gold miners’ stocks are low technically and cheap fundamentally.
This last chart zooms out to the bigger picture, looking at GDX since 2007 which is largely its entire life. Gold stocks move in great bull-bear cycles like everything else, and they remain incredibly low today. The small highlighted square in the lower right encompasses the entire first chart. These prevailing gold-stock levels are almost as low as during 2008’s epic stock panic, which is absurd based on fundamentals.
This powerful new gold-stock bull ignited in early 2016 remains young and small. Its bull-to-date peak in early August 2016 was merely a 3.3-year GDX high, still very low in secular context. After this sector was sucked into 2008’s stock panic, the major gold stocks more than quadrupled out of those extreme lows. A quadruple from January 2016’s all-time low birthing this bull would catapult GDX back up near $50.
That means the major gold stocks easily have the potential to more than double again from here, seeing another 117% GDX gain in the next couple years! Is there any other sector in all these wildly-overvalued stock markets that can make such a claim? No way. Like gold, the gold stocks are now deeply out of favor thanks to the extreme stock-market bull that may have just peaked in late January. Sentiment is poor.
But as gold inevitably powers higher in the wake of this newest SPX correction on strengthening demand from investors, the gold stocks will follow and amplify its gains. Fundamentally the major gold stocks are still dirt-cheap. That’s readily evident in their quarterly operational and financial reports, which I closely follow and analyze for the major GDX gold miners. I can’t wait for their Q4’17 results over the coming weeks.
The primary measure of industry-wide gold-mining profitability is all-in sustaining costs, what its costs to mine and replenish an ounce of gold. In Q3’17 that averaged $868 for the GDX gold miners. And these costs are pretty stable, averaging $867, $878, $875, and $855 in the four quarters before that. So odds are the major gold miners’ collective all-in sustaining costs will hold near these levels in Q4’17 and Q1’18 too.
Gold averaged $1279 in Q3, leading to fat per-ounce profits of $411. Gold was essentially flat in Q4 with a $1276 average price. That means the GDX-component gold miners are likely to soon report profits of $408 per ounce. I’ll dig deeply into those new Q4 quarterlies as they are released, and publish an essay on the results in mid-March. Since Q4 reporting includes full-year results, regulatory deadlines are twice as long.
The SEC requires normal quarterly reports to be filed within 40 to 45 days after quarter-ends, depending on companies’ sizes. But since they have to prepare annual reports with the quarter that ends fiscal years, usually Q4, that deadline is extended to 60 to 90 days. So by mid-March most of the major gold miners’ Q4’17 results will be out. I expect average all-in sustaining costs to come in flat like usual in these reports.
And that’s super-bullish given what gold is doing. The yellow metal that drives its miners’ profits is faring much better in Q1 than it did in Q4. It’s averaging $1331 quarter-to-date, up 4.3% sequentially from Q4. So if AISCs are stable like usual, profits will surge which investors will anticipate in advance. The same $868 AISC implies Q1 GDX-major-gold-miner profitability of $463 per ounce, soaring 13.3% quarter-on-quarter!
So my month-old forecast of a GDX $25 breakout on Q4 earnings remains highly likely. When investors see how the gold miners are faring in their latest reported quarter, they are going to extrapolate mining costs into Q1. That will portend exploding profitability. GDX only needs to rally another 8.6% from its mid-week levels to hit $25. And once gold stocks break out decisively to the upside, they are off to the races.
In all the markets buying begets buying. The more a sector or asset is rallying, the more investors want to participate. And the more capital they pour in, the more those prices keep rallying. That creates and fuels a powerful virtuous circle of buying. Gold stocks have drifted sideways for so long now that they need to achieve a major upside breakout from their consolidation to catch investors’ interest. That’s not far away.
Despite the roller-coaster ride in gold stocks as the wild SPX volatility bullied them around in the past couple weeks, GDX is still within striking distance of that key $25 breakout. Once that happens, the gold stocks’ popularity will surge again. There’s still time to buy low before lots more investors start returning which will catapult this small contrarian sector sharply higher. The gold stocks look really bullish today!
While investors and speculators alike can certainly play gold stocks’ powerful coming upleg with major ETFs like GDX, the best gains by far will be won in individual gold stocks with superior fundamentals. Their upside will far exceed the ETFs, which are burdened by over-diversification and underperforming gold stocks. A carefully-handpicked portfolio of elite gold and silver miners will generate much-greater wealth creation.
At Zeal we’ve literally spent tens of thousands of hours researching individual gold stocks and markets, so we can better decide what to trade and when. As of the end of Q4, this has resulted in 983 stock trades recommended in real-time to our newsletter subscribers since 2001. Fighting the crowd to buy low and sell high is very profitable, as all these trades averaged stellar annualized realized gains of +20.2%!
The key to this success is staying informed and being contrarian. That means buying low before others figure it out, before undervalued gold stocks soar much higher. An easy way to keep abreast is through our acclaimed weekly and monthly newsletters. They draw on my vast experience, knowledge, wisdom, and ongoing research to explain what’s going on in the markets, why, and how to trade them with specific stocks. For only $12 per issue, you can learn to think, trade, and thrive like contrarians. Subscribe today, and get deployed in the great gold and silver stocks in our full trading books!
The bottom line is the gold stocks weathered the recent sharp stock-market selloff really well. The SPX plunged for the first time in a couple years, generating a big and sharp fear spike. As usual that spooked the gold-stock traders, who sold and fled. Yet despite the carnage GDX’s major consolidation support at $21 held solid. The gold miners’ stocks soon rebounded sharply back up to the middle of their basing channel.
With GDX trading near $23 this week, that critical $25 breakout to entice investors back remains within easy range. Once the collective gold-mining costs reported in the upcoming Q4 results are compared with higher Q1 prevailing gold prices, strong gold-stock buying should resume. Gold stocks have always been a volatile sector, so there’s no reason for traders to fear periodic selloffs like they suffered in recent weeks.
Adam Hamilton, CPA
February 16, 2018
Copyright 2000 – 2018 Zeal LLC (www.ZealLLC.com)

It is difficult not to write about the political developments in southern Africa at a time when South Africa is embroiled in a titanic struggle to rid itself of the Zuma factor. Over the next few months, there will be more clarity about the political direction the country will take. All indications are, however, that a government without Zuma will be more business friendly, and that a Department of Mineral Resources without Minister Mosebenzi Zwane, will do its utmost best to accommodate all the interest in the mining industry. Zwane has been under enormous pressure, and not just from investors, the Chamber of Mines and big mining companies. Despite the perceptions of the twitterati, social media users and abusers, big business and the mainstream media that their view is the only view, there are people out there who think differently, and they must be given airtime.
There is a big percentage of young black business people and junior mining companies that supports at least some of the the amendments proposed in Mining Charter III. In fact, this group has been pressurising Zwane to implement the Charter, not only that, but they are pushing for a 51% black ownership, nationalisation or more government control of the mining industry. This is a reality, and these voices must be heard. They might not be affiliated with the Chamber of Mines, but they have a big stake in the welfare of the country, and in its future. The mining industry in South Africa, and in fact, in Africa, will be driven by junior mining companies, especially in the exploration sector. Wouldn’t it be great if they are 100% African owned?
This is not to say, of course, that major’s and foreign junior mining companies do not have a role to play, in fact, they have an even bigger role to play. They are integral to the development of skills and education, and to empower young, local African’s to develop the self-confidence that will help them start their own mining companies. But in the end, the goal should be to have more homegrown African exploration and mining companies active on the continent than Australian, Canadian and UK based companies. It is the only way to prevent copious amounts of capital finding its way to global tax haven’s.
Despite the optimism, which was once again prevalent at the Mining Indaba in Cape Town in February, South African’s, Zimbabweans and Angolan’s should now be more vigilant and vocal as ever before. Besides having enormous economic potential these countries have a few other common denominators – bad governance, corruption and kleptocracy. Civil society and the general populace can never let this happen again in the future. Despite offering better governance, there are questions about all three new presidents (if Ramaphosa has been appointed as president when this is read).
Their slates are not clean. João Lourenço, president of Angola, was handpicked by, and is a close ally of José Eduardo dos Santos, one of the longest serving dictators in Africa. Zimbabwean president Emmerson Mnangagwa has been accused of having interests in the notorious Marange diamond fields just too many times for it not to be true. But the real albatross around his neck is his alleged involvement in the Gukurahundi massacre in Bulawayo in the 1980’s, and it might come back to haunt him. As the Marikana killings might haunt Cyril Ramaphosa in South Africa, who served on the Lonmin board when 34 miners were shot by the South African Police.
Ramaphosa has a long history in the mining industry and owned several mining companies during his career as a business man. He helped establish the National Union of Mineworkers (NUM) and the Congress of South African Trade Unions (COSATU) and was one of the first Black Economic Empowerment (BEE) beneficiaries. But the Ramaphosa tentacles runs more than just skin deep in the South African mining industry. He is married to Tshepo Motsepe, younger sister of mining magnate Patrice Motsepe (owner of African Rainbow Minerals). Patrice’s older sister, and thus Ramaphosa’s sister-in-law, Bridgette Radebe, is a mining mogul in her own right, and is the owner of Mmakau Mining, a company that produces platinum, gold, uranium, coal and chrome. Radebe is also the president of the South African Mining Development Association, or the Junior Mining Chamber, and has, on numerous occasions, called for a 51% black ownership in mining companies. Radebe is the wife of South Africa Minister in the Presidency Jeff Radebe. A family affair if there ever was one. The hope of Zimbabwe, Angola and South Africa rests on the shoulders of these three men, let’s hope they live up to expectations.
About Leon Louw:
Leon specializes in African affairs and doing business in Africa, and has been writing about mining in Africa for 8 years. He was born in Johannesburg, South Africa, and has traveled Africa extensively, especially southern Africa. He has a BA degree with a specialization in African studies and an honours degree in Africa Politics. He also have a national diploma in Nature Conservation and an honours degree in Environmental Management. It is is passion to promote business in Africa and I can assist companies that are interested in doing business in African countries.
You can see his work at African Mining and Mining Mirror and online at http://www.miningafricaonline.co.za/.
- Gold has staged a superb rebound from the $1310 support zone, but that was overshadowed by the truly spectacular reversals taking place in most of the Western world’s gold stocks!
- Please click here now. Double-click to enlarge this gold chart. I like the technical action being displayed right now. Here’s why:
- First, $1370 is massive resistance. It’s understandable that gold would build a modest head and shoulders top pattern after arriving at this key price zone.
- What’s especially positive is that gold has only modestly declined in the face of this resistance and top pattern. My key 14,7,7 Stochastics oscillator is also modestly oversold now, which is good news.
- For even better news, please click here now. Double-click to enlarge. This morning, the dollar broke below key support in the 108 price area against the yen.
- When investors bet against central banks, they tend to lose. When they bet against the President of the United States, they can get blown right off the financial map.
- The bottom line is that President Trump was elected on a mandate to bash the dollar lower, and it is getting beat on like a rag doll by the yen right now.
- The bear flag-like action occurred as the dollar approached this support zone. That is ominous for the dollar bugs, and fabulous news for gold.
- Investors don’t need to “back up the truck” when buying precious metal assets right now, but they should be emotionally positive and focused more on gold stocks than bullion.
- That’s because there is so much news taking place fundamentally in the gold market that favours the miners. Inflation is rising, mainly because quantitative tightening is pushing money out of government bonds and into the banking system.
- That’s raising interest rates, incentivizing banks to lend, and putting pressure on the US government’s ability to finance itself. Please click here now. Double-click to enlarge. Since breaking the neckline of a daily chart head and shoulders top pattern, the US T-bond hasn’t even staged a minor rally!
- Another of Trump’s election pledges was that US bond market creditors were going to take a haircut on what they get paid. Looking at the price action in the bond market and statements from new Fed chair Powell, it appears that a haircut is on the cusp of really happening.
- Trump is acting like he doesn’t care if the US government defaults, and I would suggest that’s the right course of action to take. Inflate, default, or die. It looks like a combination of inflation and “defaultation” is what Trump has planned to end the US government’s horrific levels of excess size, debt, and abuse of citizens around the world.
- The rising risk of a joint bond and dollar market meltdown is why gold has acted like a champ while quantitative tightening and rate hikes accelerate.
- While QT and rate hikes are the main gold fear trade theme, there are many other supporting factors.
- For example, powerful money managers are beginning to voice concerns that Trump’s spending on infrastructure and his tax cuts could cause “overheating” in the US economy.
- When institutions get into that mindset they buy… gold stocks!
- On that key note, please click here now. Double-click to enlarge this GDX chart. There may be a classic non-confirmation signal in play for the entire precious metals sector, with most gold stocks breaking their December lows, while gold bullion did not.
- The GDX break of its December low was immediately followed by a V-Bottom pattern. Note the position of my key 14,7,7 Stochastics series oscillator. It’s adding to the power of the buy signal in play.
- Please click here now. That’s another look at GDX, with an emphasis on the trading volume.
- Both Powell and Trump seem more interested in the success of Main Street than in Wall Street or the government bond market. I’ve predicted that Powell will attempt to reverse US money velocity by the summer of this year, and that he will succeed.
- That change in focus is great news for citizens who have been encased in vile government red tape for far too long, and it is spectacular news for gold, silver, and mining stocks.
- With the dollar, T-bond, and the general stock market on very shaky and inflationary ground, institutional money managers have started to take a serious look at gold stocks. By the summer, I expect them to be consistent buyers every month. It doesn’t take a lot of institutional money to blast gold stocks to significantly higher price levels.
- To profit from the imminent inflationary fun, aggressive investors should buy GDX call options. Investors who don’t own gold stock at these price levels or lower should be firmly pressing the buy button today!
Stewart Thomson
Graceland Updates
https://www.gracelandupdates.com
Email:
Stewart Thomson is a retired Merrill Lynch broker. Stewart writes the Graceland Updates daily between 4am-7am. They are sent out around 8am-9am. The newsletter is attractively priced and the format is a unique numbered point form. Giving clarity of each point and saving valuable reading time.
Risks, Disclaimers, Legal
Stewart Thomson is no longer an investment advisor. The information provided by Stewart and Graceland Updates is for general information purposes only. Before taking any action on any investment, it is imperative that you consult with multiple properly licensed, experienced and qualified investment advisors and get numerous opinions before taking any action. Your minimum risk on any investment in the world is: 100% loss of all your money. You may be taking or preparing to take leveraged positions in investments and not know it, exposing yourself to unlimited risks. This is highly concerning if you are an investor in any derivatives products. There is an approx $700 trillion OTC Derivatives Iceberg with a tiny portion written off officially. The bottom line:
Are You Prepared?
It was a rough week for investors in stocks and stocks of all kinds. The S&P 500 lost 5%. Emerging Markets also lost 5%. Gold Stocks, which had weakened before the broader equity market have been hit hard. They (GDX, GDXJ) also lost 5% last week. The HUI Gold Bugs Index (which excludes royalty companies unlike GDX) lost 7%. After a strong start to the year, gold stocks have essentially given back all their gains. Nevertheless, we remain extremely optimistic on gold stocks over the next 12-18 months as trends in the economy and stock market should begin to support Gold after the second quarter.
Historically speaking some of the best performance in Gold and gold stocks occurred during or after a bear market in stocks. The best examples can be found in the 1970s and 2000s as the charts show. Gold surged after the bottom in stocks in 1970 and continued to perform very well during the 1973-1974 bear market. After a brief but sharp bear in 1975-1976 Gold rebounded strongly as the S&P 500 began a mild bear market in 1977. Years later Gold emerged from a significant bottom in 2001 while the stock market endured its worst bear market in a quarter century. Gold continued to perform even after the market bottom in late 2002. Gold emerged from the global financial crisis before the stock market but continued to make new highs after the stock market bottomed in March 2009.
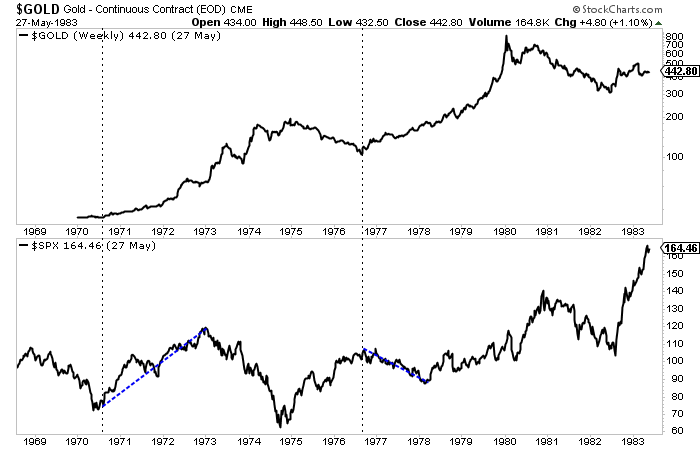
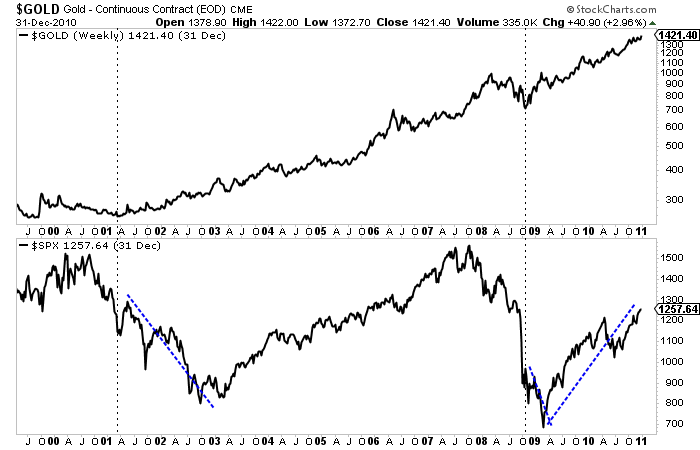
This performance is not just random. It makes quite a bit of fundamental sense. As we know, Gold is driven by falling or negative real rates. Typically policy makers in response to a recession or bear market will pursue policies that lead to falling or negative real rates. These policies are not reversed until the economy gains strength. Gold can also benefit from inflationary recessions, which we saw in the 1970s. Perhaps we are headed for that outcome at somepoint but I digress.
The best comparison to today may be the mid 1960s. Although the Gold price was fixed until 1971, we can use gold stocks to study the macro picture of the 1960s and how it may relate to today.
Gold stocks and the stock market were positively correlated during the 1960s but gold stocks dramatically outperformed and especially from 1964 to 1968. That outperformance accelerated after 1963 as inflation and bond yields began to rise to higher and higher levels in the years ahead. That would soon negatively impact the stock market in both nominal and real terms. The Dow peaked in 1966 while the S&P 500 did not peak until 1973 (as it made marginal new highs in 1969 and 1973). In real terms stocks would peak in 1966 or 1968 (depending on which index you use).

Economic fundamentals appear to be headed in a direction that is bullish for Gold and gold stocks and less positive for the stock market. While inflation has yet to be unleashed, the markets are showing that inflationary pressures are forming. This will impact corporate margins (which are extremely high) as well as profits. Higher inflation also leads to higher bond yields which means higher costs to service debt. That is a problem for the economy and equity market due to the debts that have piled up in recent years.
So the question now is where is the threshold for when inflation and bond yields start affecting the economy and stock market in a way that is favorable for precious metals?
With respect to the 1960s and 1970s, the answer would be 1964.
When precious metals begin and sustain outperformance against the stock market it will signal that the threshold or inflection point has been reached. That outperformance will also go a long way in helping Gold make its major breakout.
It is not yet time for Gold and gold stocks to shine but it is getting very close. Gold remains in a bullish consolidation pattern that should give way to a breakout later in the year. Meanwhile, gold stocks and Silver are lagging badly but that does not have us concerned. The next few months could prove to be the best buying opportunity in precious metals since the end of 2015. Quality juniors that are bought on weakness over the medium term should deliver fantastic returns over the ensuing 12 to 18 months. To follow our guidance and learn our favorite juniors for 2018, consider learning more about our premium service.
The unnaturally-tranquil stock markets suddenly plunged over this past week. Volatility skyrocketed out of the blue and shattered years of artificial calm conjured by extreme central-bank distortions. This was a huge shock to the legions of hyper-complacent traders, who are realizing stocks don’t rally forever. With stock selling unleashed again, herd psychology will start shifting back to bearish which will fuel lots more selling.
As a contrarian student of the markets, I watched stocks’ recent mania-blowoff surge in stunned disbelief. On fundamental, technical, and sentimental fronts, the stock markets were as or more extreme than their last major bull-market toppings in March 2000 and October 2007! I outlined all this in an essay on these hyper-risky stock markets on 2017’s final trading day. The ominous writing was on the wall for all willing to see.
January’s extreme surge in the US stock markets made this selloff case even more likely. Mid-month in another essay I warned, “The stock markets are now dangerously overbought, implying a major selloff is probable and imminent. … Such extremes are very unusual and never sustainable for long, signaling major selloffs looming.” So the fact these crazy stock markets finally rolled over wasn’t a surprise at all.
But I was awestruck at the sheer violence of what happened last Friday and the subsequent Monday, it was very odd. Even though the countless market extremes argued strongly for a major selloff, they tend to be much more gradual initially off bull-market peaks. So it was fascinating to watch all this unfold in real-time with my data feeds and CNBC. Students of the markets live for anomalous exceedingly-rare events!
The igniting catalysts were multilayered. The US flagship S&P 500 broad-market stock index (SPX) had blasted to a dazzling new all-time record high on Friday January 26th. It was stretched a mind-boggling 14.0% over its key 200-day moving average, which itself was high and steeply rising! The 8.9-year-old stock bull that had powered 324.6% higher felt unstoppable. Traders were universally convinced it would continue.
But just a couple trading days later on Tuesday January 30th, significant selling emerged. That morning Amazon, Berkshire Hathaway, and JP Morgan declared they were going to form a healthcare company. That unanticipated news way out of left field crushed the major healthcare stocks, hammering the SPX 1.1% lower. That was actually a significant down day by recent standards, the worst seen since mid-August.
With euphoric bullish psychology dented, Jobs Friday arrived a few trading days later on February 2nd. That official monthly US jobs report saw a modest headline beat, but the big news came on the wages front. Average hourly earnings beat expectations by climbing 2.9% year-over-year, the hottest read on wage inflation since June 2009. That triggered inflation fears with the 10-year Treasury yield already at 2.78%.
Higher prevailing interest rates are a huge problem for bubble-valued stock markets. The SPX had just left January with its 500 elite component stocks sporting a simple-average trailing-twelve-month price-to-earnings ratio way up at 31.8x! Historical fair value is 14x, twice that at 28x is formal bubble territory. In a higher-rate environment, extreme valuations are far harder to tolerate. So the stock markets sold off.
A week ago Friday the SPX slid all day long to close at a major 2.1% loss. That proved its biggest down day since way back in September 2016, before Trump won the election and the resulting extreme stock rally first on Trumphoria and later on taxphoria. Something was changing, the unnaturally-low volatility regime was crumbling. That left speculators and investors alike very nervous heading into last weekend.
It had been an all-time-record 405 trading days since the SPX’s last 5% pullback, unbelievably extreme. So that selloff really struck a nerve, I started to hear from casual acquaintances I hadn’t spoken to for years. At a friend’s Super Bowl party Sunday night, once the guests I didn’t know found out what I do for a living I felt like a celebrity. We spent the first quarter talking about the markets, people were really concerned.
Monday the 5th was extraordinary, a record day in some respects. SPX futures were down less than 1% in pre-market trading, nothing wild. But once the US stock markets opened, the selling started gradually snowballing. It greatly intensified around 3pm, with the SPX plunging from -2.3% to -4.5% on the day in literally 11 minutes! There was no news at all, it simply looked and felt like cascading stop-loss selling.
All prudent traders put trailing stop-loss orders on their stock positions. They are an essential measure to manage risk. Once a stock falls a preset percentage from its best level achieved during a trade, that position is automatically sold. In big stock-market selloffs, as stop losses are sequentially hit they feed into the ongoing selling. The more stocks fall, the more stops triggered, the more sell orders fuel the maelstrom.
The SPX bounced a bit, but still plunged a whopping 4.1% on close Monday! That was a serious down day by any standard, actually the worst since way back in mid-August 2011 which followed Standard & Poor’s downgrading US sovereign debt. Everyone takes notice when stock markets suffer their biggest daily drop in 6.5 years. That really changes collective psychology, shattering the euphoria rampant in January.
But amazingly that SPX plunge wasn’t the most-interesting thing Monday. The implied volatility on SPX options is tracked in the famous VIX fear gauge. It skyrocketed a stupendous 125.8% higher that day, its largest daily spike ever witnessed! That wreaked colossal havoc in the short-volatility market. Since Trump’s election win, more traders and capital have flocked to bet on the idea that volatility will keep falling.
Students of market history knew that was an absurd bet before Monday’s spike. Stock-market volatility has always been cyclical, just like stock prices. Exceptionally-low or -high volatility levels always mean revert back to normal. So betting that the record-low stock volatility in recent months would keep going even lower was a foolish, suicidal bet even before Monday. That epic VIX spike totally gutted these guys.
There are, or were, extraordinarily-risky inverse-VIX exchange-traded notes. These were designed to rally when volatility fell, some even with leverage which traders liked to further amplify with their own margin. One of the leading inverse-VIX ETNs was XIV, which is VIX spelled backwards. It had closed at $129.35 per share on Thursday February 1st, but by this Tuesday it had imploded 94.3% in a termination event!
All these inverse-VIX ETNs were shorting VIX futures, so they had to become massive buyers on that sharp SPX selloff to close out those devastated positions. On Monday the banks sponsoring these crazy ETNs had to buy an extreme record 282k VIX futures contracts! That catapulted the VIX itself to 50.3 on Tuesday morning, about as high as it ever gets outside of actual crashes and panics. What a wild ride!
That begs the question what happens next? This stock-market-selling and volatility shock happened at a time when stock markets were already very precarious. Such an extreme event has to start altering herd psychology. This first chart looks at the SPX superimposed over the VIX during the last few years, both on a closing basis. Once serious selling starts out of toppy stock markets, it usually portends much more coming.
This week’s stock selling unleashed emerged in some of the most-toppy stock markets ever witnessed. Again the average SPX-component TTM P/E leading into it was a bubble-valued 31.8x! Again the SPX had stretched 14.0% above its 200-day moving average, some of the most-overbought conditions seen in all of SPX history. The SPX had rocketed vertically for most of January in popular-mania-grade euphoria.
The future impact of stock selling being unleashed really depends on the market conditions that birthed that selling spike. If stock prices were near multi-year lows leading into selling spikes, with valuations lower than their historical average of 14x earnings, these events can mark selling climaxes before major reversals higher. But unfortunately the exact opposite was true leading into our current sharp SPX plunge.
Coming out of what looked and felt like a mania blowoff top, this past week’s serious selling is surely an ominous omen. Stock markets can’t rally forever, yet that’s exactly what they seemed to be doing since Trump’s surprise election victory. Between Election Day and late January’s latest record high, the SPX had soared 34.3% higher in just 1.2 years! And that span was incredibly extreme with record-low volatility.
Again as of last Friday it had been an all-time-record 405 trading days without a single 5% peak-to-trough SPX pullback. That’s 1.6 years! Nothing like that had ever happened before. Technically a pullback is a 4%-to-10% selloff in the stock markets on a closing basis. The last pullbacks were minor, a 4.8% one in late 2016 following a 5.6% one in mid-2016. Those were the last material selloffs in the SPX before this week.
Periodic selloffs to rebalance sentiment are essential to keeping stock bulls healthy. The longer markets go without significant selloffs, the more greed and complacency multiply. Traders forget that stocks fall too, and their hubris leads them to take all kinds of excessive risks. Like betting that record-low volatility will persist indefinitely. The leveraged speculation eventually gets so extreme that it threatens the entire bull.
My favorite analogy on this is forest fires. Officials love to suppress natural wildfires to protect structures. But the longer firefighters put out every little wildfire, the denser forest underbrush gets. This fuel source grows out of control, eventually leading to a conflagration far too extreme to put out. Rather than having a bunch of smaller wildfires to keep fuel in check, suppression eventually guarantees a super-destructive hell fire.
Periodic pullbacks and corrections in stock markets allow the underbrush of greed to be burned away before it gets thick enough to become a systemic risk. Traders naively believe levitating stock markets are less risky, but the opposite is true. The longer a span without a serious selloff, the higher the odds one is coming soon. Normal healthy bull markets actually suffer 10%+ corrections once a year or so to keep balance.
It’s been 2.0 years since the last actual SPX correction, which bottomed in early 2016. The lack of both smaller pullbacks and larger corrections let complacency grow unchecked into greed, euphoria, and even hubris recently. And these emotional extremes have to be mostly burned away for this bull to have any hope of eventually heading higher. The only thing that can eradicate widespread greed is major stock selloffs.
After Monday’s serious 4.1% plunge, the SPX was still only down 7.8% since its peak just 6 trading days earlier. While that is unusual speed to see such a decline, it still only ranks towards the high end of mere pullback territory. We hadn’t even hit a correction yet at 10%, and they can stretch as high as 20%. The SPX’s last corrections ran 12.4% over 3.2 months in mid-2015 and 13.3% over 3.3 months into early 2016.
Given the extreme overvalued and overbought conditions leading into this past week’s plunge, there’s no way even that was enough to rebalance away the euphoric sentiment. So it’s all but certain the SPX will grind lower in the coming months, heading down well over 10% into deep correction territory. At 10% the SPX would merely be back to early-November levels, merely erasing the recent mania-blowoff surge.
If this correction approaches 20% as it really ought to, that would drag the SPX all the way back down to 2298. Those levels were first seen just over a year ago in late January 2017. That would reverse the lion’s share of the entire past year’s taxphoria rally, wreaking tremendous sentiment damage. But don’t forget corrections tend to take a few months, not a few days. So the selling is way more gradual than Monday’s.
That extreme 50 VIX spike Tuesday morning must be considered. Again that’s about as high as the VIX ever gets in normal corrections, implying the immediate selling pressure should have abated. The only times higher VIX levels are briefly seen is after crashes and panics. A crash is a 20%+ drop in just two trading days from very-high stock-market levels. This past week’s Friday-Monday selloff wasn’t even close.
Crashes are exceedingly rare in history, and next to impossible today given the widespread use of stock-market circuit breakers. They effectively close markets for a time after intraday selling milestones are hit. Today the SPX has levels triggered at 7%, 13%, and 20% intraday declines. The trading halts depend on when these declines occur within a trading day, before or after 3:25pm. They would slow crash-grade plummets.
Panics are steep 20%+ selloffs within two weeks, extreme but much slower than crashes. They tend to cascade from lows out of late-stage bear markets to climax them. They are very rare too, with 2008’s being the first formal one since 1907. The VIX can temporarily soar above 50 in crashes and panics, but those extremes never last for long. In normal market conditions, a 50 VIX spike should mark an absolute bottom.
But the problem this week is Tuesday’s extreme VIX spike was the result of panic buying of VIX futures to liquidate those inverse-VIX ETNs. That has never happened before. Without that dynamic, the VIX likely wouldn’t have gone much above 30. That too implies this stock-market selloff still has plenty of room to run. So the stock selling unleashed is likely to persist over a few months at least, despite the VIX spike.
Given the extremes in these stock markets in late January, I still suspect the odds heavily favor a new bear market over 20% instead of a bull-market correction. I presented this compelling SPX-bear case in late December, and don’t have room to rehash it here. Normal bear markets tend to cut stocks in half over a couple years or so, 50% SPX losses. That works out to a gradual average selling pace of 0.1% per day.
The last couple SPX bears give an idea of what to expect in the inevitable next bear after such an epic stock bull. The SPX fell 49.1% over 2.6 years ending in October 2002, and 56.8% over 1.4 years that climaxed in March 2009. A 50% SPX loss, which is conservative since bears tend to be proportional to their preceding bulls’ sizes, would drag this index back to 1436. That’s September-2012 levels, a long way down!
No one knows whether this stock selling unleashed will culminate in a bull-market correction under 20% or a new bear market over 20%. But either way, speculators and investors ought to swiftly boost their anemic portfolio allocations to gold. The record-high stock markets in recent years have led to radical gold underinvestment. Gold tends to rally on balance when stocks fall, it’s the ultimate portfolio diversifier.
As this final chart shows, after the last SPX correction ending in early 2016 gold surged into a major new bull market. Hyper-complacent stock traders suddenly realized that they needed to own gold to diversify their stock-heavy portfolios. That gold bull has persisted, powering higher in a strong uptrend ever since despite this past year’s extreme taxphoria stock-market rally. A new SPX correction will work wonders for gold.
That last SPX correction into early 2016 wasn’t large at just 13.3%. Yet that was still enough to motivate complacent investors to flock back to gold. Their heavy buying catapulted gold 29.9% higher in just 6.7 months! Gold turned on a dime from deep 6.1-year secular lows because a major stock-market selloff finally convinced investors to up their meager gold allocations. Every investor should have 5% to 10%+ in gold.
Just a week ago that ratio was likely only running around 0.14% based on the values of that leading GLD gold ETF and the collective market capitalizations of the 500 SPX companies! So with gold allocations essentially zero late in an extreme stock bull, there’s vast room for massive capital inflows into gold in the coming years as investors rebalance their portfolios. Gold thrives for a long time after major stock selloffs.
The gold buying isn’t instant when the SPX falls though, as traders need time to process the drop and its likely implications. Back in early 2016 stock investors really didn’t start aggressively buying GLD shares until the SPX suffered multiple big down days. The SPX fell 1.5%, 1.3%, 2.4%, and 1.1% on separate trading days in a single week before gold buying resumed. More big SPX losses soon accelerated these inflows.
If you don’t have a significant gold allocation in your portfolio, you ought to get buying. It can be done with physical gold bullion or GLD shares. If you want to leverage gold’s bull market that will accelerate following a major stock selloff, consider the stocks of great gold miners. They tend to amplify gold upside by 2x to 3x due to their fantastic profits leverage to gold. The precious-metals sector thrives after stock selloffs!
Finally the stock selling unleashed is likely just beginning due to what the major central banks are doing this year. The Fed’s unprecedented quantitative-tightening campaign to start reversing its trillions of dollars of QE liquidity injected that levitated stocks for years is accelerating throughout 2018. At the same time the European Central Bank slashed its own QE campaign in half until September, when it may cease entirely.
Between the Fed’s QT and ECB’s QE tapering, global stock markets face central-bank tightening running $950b in 2018 and another $1450b in 2019 compared to 2017 levels! This will certainly strangle this QE-inflated monster stock bull. So on top of everything else this week’s sharp selloff portends, the euphoric stock markets were already in serious trouble from record extreme central-bank tightening. Got gold yet?
Absolutely essential in falling markets is cultivating excellent contrarian intelligence sources. That’s our specialty at Zeal. After decades studying the markets and trading, we really walk the contrarian walk. We buy low when few others will, so we can later sell high when few others can. While Wall Street will deny the coming stock-market bear all the way down, we will help you both understand it and prosper during it.
We’ve long published acclaimed weekly and monthly newsletters for speculators and investors. They draw on my vast experience, knowledge, wisdom, and ongoing research to explain what’s going on in the markets, why, and how to trade them with specific stocks. As of the end of Q4, all 983 stock trades recommended in real-time to our newsletter subscribers since 2001 averaged stellar annualized realized gains of +20.2%! For only $12 per issue, you can learn to think, trade, and thrive like contrarians. Subscribe today!
The bottom line is the stock selling unleashed this week isn’t over. Given the fundamental, technical, and sentimental extremes around January’s record highs, a sub-10% pullback isn’t enough to eradicate the euphoria. At best a major correction approaching 20% is necessary, and those tend to run a few months or so. This week’s extreme VIX spike to levels that usually mark major bottoms was artificial, not normal.
And after such an extreme bull market largely driven by record central-bank easing, the odds really favor this selloff eventually growing into a 20%+ new bear. Especially with the major central banks starting to aggressively pull their liquidity in 2018. Whether a major bull correction or major new bear market, gold tends to thrive after major stock-market weakness. That leads investors to buy gold to re-diversify their portfolios.
Adam Hamilton, CPA
February 9, 2018
Copyright 2000 – 2018 Zeal LLC (www.ZealLLC.com)
by Andrew Topf
50M+ ounce Walker Lane Trend
While most gold investors are familiar with the Carlin Trend – the largest gold-producing region in the United States – there are other, less explored parts of Nevada starting to attract a lot of attention. Specifically, the Walker Lane Gold Belt where company-making discoveries are being drilled.
Located in southern Nevada, Walker Lane has some of the most important mining districts in North America including Comstock, Tonopah, Goldfield, Bullfrog and Aurora. Estimated to host over 50 million gold ounces, the region is being actively explored by Kinross and Barrick at the producing Round Mountain Mine, Gryphon Gold at the Borealis Mine, and Newcrest Mining at the Redlich project.
Unlike the Carlin Trend, where most gold projects are mining ore less than a gram per tonne, Walker Lane is starting to stand out on its own merits with exceptional high-grade assays.
High-grade gold mine open for expansion
Northern Empire Resources (TSXV: NM; USOTC: PSPGF) is a well-financed gold exploration and development company focused on an emerging gold district in the Walker Lane Trend. The Sterling Gold Project hosts four distinct deposits, including a fully permitted, open-pit mine. The Sterling Mine is one of the highest-grade heap leach mines in the western United States.
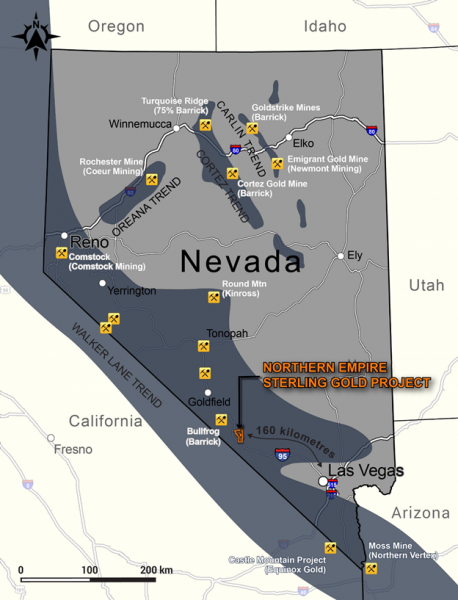
Situated 185 kilometres (two-hour drive) northwest of Las Vegas, on the eastern flank of the Bare Mountains, Sterling features five past-producing open pit and two underground gold mines. Drilling, surface mapping and sampling on the project suggests that the historic deposits are open for expansion and there is potential for new discoveries. The property still has infrastructure in place from 2015 when the Sterling Mine was last in production.
A history of success: $3B in takeout value
Along with having an outstanding property with exploration upside, Northern Empire also features a management team with an exceptional record of creating value for shareholders. Led by Executive Chairman Douglas Hurst and Michael Allen, President and CEO, the Northern Empire board has created over $3 billion in takeout value, including Newmarket Gold, acquired for $1 billion by Kirkland Lake, Kaminak Gold, acquired by Goldcorp for $520 million, International Royalty Corp, bought by Royal Gold for $700 million, Rainy River Resources, bought by Newgold for $310M, and Underworld Resources, purchased by Kinross Gold for $138 million.
Currently sitting at a $80-million market capitalization, Northern Empire has a cash balance of $18 million, having recently completed a $15 million bought deal financing that included no warrants. In fact, the company raised $35 million in 2017 with no warrants.
The gold junior is coming off a successful 2017 drill campaign and will aggressively drill known mineralized zones in 2018 to expand resources and explore for new deposits on its 125-kilometre land package.
709,000 ounces inferred, plus newly staked ground
The story of Northern Empire began in May 2017 when it acquired the Sterling Gold Project in Nye Country from Imperial Metals for $10M. The $20 million acquisition financing included an investment by global precious metals producer Coeur Mining, which earned an 11.6% stake in the company.
Northern Empire is backstopped by the low risk, permitted heap leach Sterling Mine; majors have an appetite for high margin, high grade assets. The main event, however is the blue-sky potential north of Sterling, where more ounces are ripe for exploration. In particular the focus is on the SNA deposit, which has Carlin-type mineralization adjacent to the Mother Lode deposit owned by Corvus Gold.
Between 1980 and 2000, nearly 200,000 ounces were pulled from Sterling’s three open pits and two underground mines. The run of mine ore was placed on heap leach pads, where gold recoveries averaged 88%.
Total inferred resources at the project are 709,000 ounces with an average grade of 2.23 grams per tonne gold – which is high for a deposit in Nevada where most deposits are lower-grade.
Northern Empire has all the permits required to operate the Sterling Mine. In May 2016 the mine was permitted to restart operations, with the Bureau of Land Management finding that the mine would not have significant environmental impacts.
Over the last six months the company has been aggressively expanding the property, having staked an additional 489 claims in June, thereby increasing its original land position by 50%. Another 261 claims were staked in October, which further solidified Northern Empire as the dominant landholder in the Bare Mountains, a district which includes the past-producing Sterling, 144, Daisy, Secret Pass, Gold Ace, Mother Lode deposits, and Bullfrog Mine.
Four jewels in The Crown
Exploration is focused on the Crown Block of deposits just 7 kilometres north of the Sterling Mine. For the first time the Crown Block has been consolidated in a contiguous land package under one ownership. The Crown Block hosts four primary targets: Daisy deposit, Secret Pass deposit, SNA deposit and the Shear Zone target. The mineralization follows the same East-West detachment fault structure that hosted Barrick’s Bullfrog Mine, which produced 2.3 million ounces of gold at an average grade of 3.2 grams per tonne (“g/t”).
Glamis and Rayrock previously operated the Daisy Mine, which included Daisy, Secret Pass, and Mother Lode pits, and produced 104,000 ounces of gold between 1997 and 2001. When gold dipped below $300, the mine was closed down.
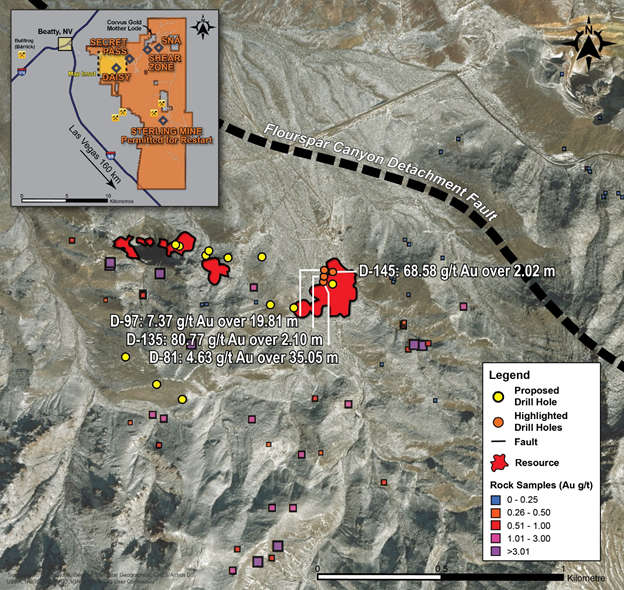
A total of 160 holes were drilled at Secret Pass which was previously mined in the 1990’s. Significant drill intercepts beyond the existing pit indicate potential resource expansion. Drill hole D-320 on the eastern edge of the historical pit intercepted 1.02 g/t gold over 77.7 metres.
SNA lies on a north-south structure that hosts Carlin-type mineralization which is open for expansion. Historically 149 holes were drilled at SNA. The Shear Zone is on the upper level of an epithermal vein and indicates potential for bonanza grades at depth. Past discoveries of mineralization were not followed up on.
2017 drilling confirms resource model, opens up new opportunities
In August 2017 Northern Empire initiated the first phase of an exploration program designed to confirm and expand the inferred resources at the Sterling Gold Project. Historic drill holes from the Daisy deposit include 68.58 g/t Au over 2.02 m, 7.37 g/t Au over 19.81 m, 80.77 g/t Au over 2.10 m, and 4.63 g/t Au over 35.05 m.
Of the planned 5,200 metres of drilling, over half was focused on the Sterling Mine, where Northern Empire outlined a pit-constrained inferred resource of 231,000 gold ounces grading 3.67 g/t. The work provided confidence in the resource, tested for extensions along strike and provided metallurgical samples prior to Northern Empire beginning economic studies.
The 52-hole drill program, 25 of which were reverse circulation holes and 27 that were diamond-drilled, started with the Daisy and Secret Pass deposits within the Crown Gold Project. The company also performed an evaluation of the entire project and flew a geophysical survey to identify new targets.
The Daisy deposit hosts an inferred mineral resource of 174,000 gold ounces at an average grade of 2.12 g/t gold, while the Secret Pass inferred resource is 188,000 ounces of gold at an average grade of 1.65 g/t.
The drills then moved to the Sterling Mine to complete infill, resource expansion, and exploration drilling.
The first 24 results of the drill program were released in November. According to Northern Empire’s CEO Michael Allen:
“This round of drill results supports our resource model of the Sterling deposit, as well as the location of the underground workings. Sterling was known to be a narrow, high grade deposit with excellent metallurgy. Of note, are the occasional broader zones of mineralization, such as 12.19 metres of 8.37 g/t gold, as well as previously unacknowledged lower grade mineralization being identified by Northern Empire’s drilling; both of which may represent real opportunities within the Sterling deposit. Also, our early exploration of the area to the west and south of the Sterling deposit has yielded interesting results.”
Assay results from another seven holes reported in early December highlighted shallow, high-grade oxide gold at the Sterling Mine, with several holes hitting significant mineralization at the edges of the resource model, indicating the deposit remains open for expansion. Notable drill intercepts included 10.0 metres of 14.59 grams per tonne, 9.05 metres of 8.66 g/t, and 7.59 metres of 8.25 g/t.
2018 drilling year-round: in progress
As the calendar turns to a new year, Northern Empire is making plans for a 15,000-metre drill program it announced mid-December; the drills have already begun turning. In this new phase, drilling will be focused on infill and expansion of the Sterling Mine, Daisy, Secret Pass and SNA deposits, as well as testing high-priority exploration targets. Drilling will be completed with both core (diamond drilling) and reverse circulation rigs.
This area of Southern Nevada is accessible 12 months a year and Northern Empire will be aggressively working all year round. In early 2018 the company will turn its attention to the Crown Block, where drilling will begin on the SNA deposit where Northern Empire has identified the potential for a large Carlin-type deposit. This work will be targeting north-south structures exiting the Mother Lode pit, adjacent to the north and owned by Corvus Gold, and where historic drill holes such as ML088, drilled on the company’s property, returned 10.67 metres grading 4.13 g/t starting at 60.96 metres, and 28.96 metres grading 1.76 g/t starting at 100.58 metres.
Indeed an exciting aspect of this round of drilling is the close proximity of Corvus Gold’s drills on that company’s Mother Lode project, just metres away from Northern Empire’s holdings. Mother Lode produced 34,000 ounces at an average grade of 1.8 g/t in the late 1980s but closed due to low gold prices. In December Corvus announced it has expanded the sediment-hosted Mother Lode gold system to at least 450 metres along strike.
Corvus Gold’s exploration program at Mother Lode has received a major response from the market, with the stock more than doubling over the past year (+126%); most of the gain has been in the last three months and can likely be attributed to its success at the Mother Lode.
Since Northern Empire is the dominant land holder, and owns all the land surrounding Mother Lode, any extension of Mother Lode beyond Corvus Gold’s tight boundaries is likely to add ounces to Northern Empire’s Sterling Gold Project.
Drilling will also be completed at the Daisy and Secret Pass deposits with the goals of upgrading and expanding the resources, collecting metallurgical samples, and testing exploration concepts. On September 18 and October 4, 2017, the company announced drill results for Daisy and Secret Pass, highlighted by 47.24 metres of 1.47 g/t gold at Daisy and 82.30 metres grading 1.25 g/t at Secret Pass.
Conclusion
Northern Empire has an impressive assemblage of both past-producing gold mines and enticing exploration targets at its Sterling Gold Project in one of Nevada’s most promising gold mining regions: The Walker Lane Trend.
With the gold price powering above $1,330 per ounce, mineral-rich gold companies are rising in valuation once again, so what better time to get in on an exciting gold play that appears to offer investors ample upside? Northern Empire has the property, the treasury and the team to make it happen.
About the Author:
With over a decade of journalistic experience working in newspapers, trade publications and as a mining reporter, Andrew Topf is a seasoned business writer. He holds degrees in journalism and political science, and earned a Masters from the London School of Economics.
- The appointment of Jerome Powell as new Fed chair is likely the catalyst that ushers in a multi-decade era of rising inflation and soaring gold stocks.
- I’ve announced a long term target for GDX of $15,000. That really isn’t very high… given the strong inflation numbers that I am projecting for America in the years ahead.
- Having said that, Powell has only been on the job for one day. Investors need to show patience. Wait to see what he actually does before taking “back up the truck” market actions.
- Powell’s first significant actions are likely to be announced at the March 21 Fed meeting. I expect a firm commitment to more rate hikes and more quantitative tightening.
- That’s inflationary because it boosts bank profit margins and they become more willing to take lending risk. That produces a rise in the velocity of money.
- As the cost of borrowing rises, companies will raise prices and workers will demand higher wages. If Powell also makes a firm commitment to deregulating America’s thousands of small banks on or before March 21, inflation would accelerate even more rapidly.
- Please click here now. It’s my contention that wage inflation of 20%+ is not just theoretically possibly, but morally justified. Here’s why:
- For many years, global governments have colluded with central banks to run socialist/fascist QE programs. These programs moved money from workers and savers to government bonds and stock markets. Additional money was simply printed and taken.
- QT, higher rates, and small bank deregulation are beginning to re-empower Main Street. This is happening while “Government Street” (the bond market and the dollar) and Wall Street risk disintegrating.
- Please click here now. Double-click to enlarge this exciting bond market chart. A head and shoulders top pattern is in play. The neckline has been crushed.
- Please click here now. Around the world, governments are announcing import duties. That’s inflationary. If India’s government had cut the gold import duty, it would have increased demand, but the duty itself is also inflationary.
- Please click here now. Institutional money managers are starting to focus on the inflationary implications of Trump’s tax cuts that I highlighted when he first proposed them. In the context of QT, rate hikes, and deregulation, these cuts can increase inflation quite significantly.
- Please click here now. Double-click to enlarge. The bond market is building what I have dubbed a “super top” pattern. The target of the super top is about 80.
- The Fed has projected that rates will take many years to reach “normal” levels. This chart suggests the normalization process will take about seven more years.
- This “normalization” sounds great in theory. In the real world, it involves a decline to 80 for the T-bond price. That would drive borrowing costs for the US government to incredibly painful levels.
- In addition, rates could rise much more quickly than this chart suggests if Trump ordered T-bond creditors to take a haircut on what they are owed. That’s one of his campaign promises.
- As inflation surges, Trump may be forced to devalue the dollar and revalue gold to prevent the US government from imploding or becoming a full dictatorship. Inflate, default, or die. In the near -immediate future, these are the only choices President Trump will have to manage the US government’s horrific size, power, and debt.
- On that note, click here now. Double-click to enlarge. The dollar could go into free fall if it breaks cleanly under 108 against the yen, and the bear flag chart action suggests that is going to happen very soon.
- A breakdown would almost certainly correlate with a gold price surge to about $1370. Please click here now. Double-click to enlarge this daily gold chart.
- There is a small head and shoulders top pattern in play that could push gold modestly lower to the $1310 – $1290 area. The good news is that a bull flag-like pattern is also forming that could negate the top pattern.
- Given the fast-growing inflationary fundamentals, gold investors should now be walking the price gridlines with maximum confidence. Fresh buying for eager gamblers and investors should be done at key levels that I’ve noted on the chart.
- Gold has been rising as the T-bond has fallen hard, and rising as the T-bond has rallied. That’s because gold price discovery for the fear trade is not about rates per se, but about risk. As stock and bond market investors get rocked hard, gold looks like the ultimate asset iron lady!
- Please click here now. A major gold stocks versus gold bull era will occur as the T-bond super top ushers in extraordinarily high inflation for the long term.
- Gold stock enthusiasts need to watch Powell’s actions, because they are the catalysts that will push GDX above $26 and officially begin that fabulous era. Gamblers can buy call options on a two-day close over $26. I’ve urged long term investors to be aggressive buyers in my $23 – $18 tactical accumulation zone. The bottom line is that it’s the cusp of a new era for gold stock investors, and Powell officially launches it on March 21!
Thanks and Cheers,
Stewart Thomson
Graceland Updates
https://www.gracelandupdates.com
Email:
Stewart Thomson is a retired Merrill Lynch broker. Stewart writes the Graceland Updates daily between 4am-7am. They are sent out around 8am-9am. The newsletter is attractively priced and the format is a unique numbered point form. Giving clarity of each point and saving valuable reading time.
Risks, Disclaimers, Legal
Stewart Thomson is no longer an investment advisor. The information provided by Stewart and Graceland Updates is for general information purposes only. Before taking any action on any investment, it is imperative that you consult with multiple properly licensed, experienced and qualified investment advisors and get numerous opinions before taking any action. Your minimum risk on any investment in the world is: 100% loss of all your money. You may be taking or preparing to take leveraged positions in investments and not know it, exposing yourself to unlimited risks. This is highly concerning if you are an investor in any derivatives products. There is an approx $700 trillion OTC Derivatives Iceberg with a tiny portion written off officially. The bottom line:
Are You Prepared?
Global investors are radically underinvested in gold today. Years of relentless stock-market rallying to endless new record highs have left this classic alternative investment deeply out of favor. But this gold-demand ebb is ending. The same central banks that fueled these extreme stock markets through epic easing are reversing to massive and unprecedented tightening. As stocks roll over, gold investment will return.
Gold is a unique asset class established over millennia that should play a critical role in every investment portfolio. Unlike virtually everything else, gold generally rallies when stock markets inevitably suffer their periodic major selloffs. That effectively makes gold the anti-stock trade. A substantial gold allocation is essential and necessary to diversify and protect stock-heavy portfolios, moderating their overall volatility.
But late in major stock bulls after years of rallying on balance, complacent investors mostly forget about gold. If stocks apparently do nothing but rally indefinitely, then why bother with counter-moving gold? Thus their collective gold allocations gradually slump to unsustainable lows as stock euphoria mounts. The lack of gold investment demand leaves it languishing at relatively-low prices, deeply out of favor like today.
Like nearly everything else in the global markets, gold prices are heavily dependent on investment capital flows. When investors are buying gold in a meaningful way, demand exceeds supply which drives gold’s price higher. When they’re materially selling, supply trumps demand thus gold’s price naturally retreats. This past year or so has been stuck in the middle, with gold investment flows generally neutral on balance.
The definitive arbiter of global gold supply and demand is the World Gold Council. It publishes quarterly Gold Demand Trends reports with the best gold fundamental data available. As these typically come out 5 to 6 weeks after quarter-ends, the Q4’17 GDT hasn’t been released as of this writing. But 2017’s world gold investment demand current to the end of Q3 still reveals the radical underinvestment in gold these days.
During the first three quarters of 2017, global gold investment demand ran 935.0 metric tons. That was down sharply year-over-year, collapsing 32.6% or 451.4t from the comparable 9 months of 2016! This plunging gold investment demand was more than responsible for the entire 388.1t drop in overall total gold demand in that span. Investment demand is further split out into traditional bars and coins and new ETFs.
Physical-bar-and-coin demand actually proved strong in the first 3/4ths of 2017, rising 13.0% or 87.1t to 755.3t. But ETF demand cratered a catastrophic 75.0% or 538.5t YoY! Due to their ease of trading and trivial commissions compared to physical gold, ETFs have become the gold vehicle of choice for stock investors. And with stock markets surging extraordinarily on taxphoria last year, gold was largely shunned.
Gold exchange-traded funds act as conduits enabling vast amounts of stock-market capital to slosh into and out of physical gold bullion. These big changes in collective buying or selling really move gold. Since the gold ETFs seek to mirror the underlying gold price, they have to shunt excess ETF-share supply or demand directly into actual gold bars. There’s no other way for gold ETFs to successfully track their metal.
The world’s leading and dominant gold ETF is the venerable American GLD SPDR Gold Shares. Every quarter the World Gold Council also ranks the world’s top-ten gold ETFs. At the end of Q3, GLD alone accounted for a whopping 36.9% of their total gold-bullion holdings! GLD was 3.8x larger than its next biggest competitor, which is the American IAU iShares Gold Trust. GLD is the behemoth of the gold-ETF world.
The supply and demand of GLD shares, and all gold ETFs, are totally independent from underlying gold’s own supply and demand. So when stock investors buy GLD shares faster than gold is being bought, the GLD share price starts decoupling from gold to the upside. That is unacceptable, as GLD would fail its mission to track gold. So GLD’s managers must vent this differential buying pressure directly into gold.
They do this by issuing sufficient new GLD shares to meet the excess demand. All the money raised by these GLD-share sales is then plowed into physical gold bars that very day. This mechanism enables stock-market capital to flow into physical gold. Of course this is a double-edged sword, as excess GLD-share selling pressure forces this ETF to sell real gold bars to raise the capital to buy back its share oversupply.
What American stock investors are doing with GLD shares is the primary driver of gold’s trends! GLD has grown massive since its launch back in November 2004, and acts as a direct pipeline into gold for the vast pools of stock-market capital. Nothing is more important for gold prices now than GLD inflows and outflows. These are very transparent, as GLD reports its physical-gold-bullion holdings daily in great detail.
I call stock-market capital inflows into GLD as evidenced by rising holdings builds, and outflows as seen by falling holdings draws. In recent years there have been plenty of quarters where GLD builds and draws alone accounted for the entire global change in gold demand! Rather incredibly, GLD has grown into the monster tail that wags the global-gold-price dog. American stock investors dominate gold’s fortunes.
Amazingly many if not most investors still don’t grasp GLD’s critical role in gold price trends. They attempt to understand today’s gold’s price action in historical pre-gold-ETF-era terms. But for better or for worse, the gold world is radically different now. GLD, and to a lesser extent the other large gold ETFs trading in foreign stock markets, changed everything. Gold investors ignoring GLD’s holdings are flying blind.
This chart drives home this critical point. It superimposes GLD’s daily physical-gold-bullion holdings in blue over the gold price in red. Carved into calendar quarters, gold’s performance in each one is noted above GLD’s quarterly holdings changes in both percentage and absolute terms. The correlation between GLD’s physical-gold-bullion holdings and gold prices is very strong. GLD capital flows explain much for gold.

Rising GLD holdings reveal stock-market capital is flowing into gold bullion via GLD, due to differential GLD-share demand. Conversely falling GLD holdings show stock-market capital coming back out of gold, thanks to differential GLD-share selling. When American stock investors are either buying or selling GLD shares at much-faster rates than gold is moving, their collective capital flows greatly impact its price.
This is readily evident in strategic and tactical terms. GLD’s holdings are highly correlated with gold price levels. American stock investors sold down GLD’s holdings in 2015, and gold fell in lockstep. But that all reversed sharply in early 2016, when stock investors flooded back into GLD which catapulted gold into a new bull. Gold kept surging as long as differential GLD-share demand persisted, then stalled when it abated.
After Trump’s surprise election win in November 2016, stock investors dumped GLD shares at dizzying rates and gold plunged. Then GLD’s holdings stabilized and largely drifted sideways on balance in 2017, so gold did too. GLD capital flows and gold prices are joined at the hip. What American stock investors are collectively doing and likely to do with GLD shares is critical for gaming where gold is likely heading next.
Thus the key question for gold investors today is what motivates stock investors to buy or sell GLD shares en masse? The answer is simple, stock-market fortunes. Gold is effectively the anti-stock trade since it tends to move counter to stock markets. So gold investment demand via GLD shares surges as stock markets suffer major selloffs, and withers when stock markets rally to lofty euphoria-generating heights.
The entire reason gold investment demand has stalled out over the past year, which left gold drifting, is the extreme euphoria in US stock markets. Wall Street constantly claims there’s no euphoria, but that’s not true. The words “euphoria” and “mania” are often confused. Mania means “an excessively intense enthusiasm, interest, or desire”. In the stock markets, manias are associated with bubbles at bull-market tops.
Euphoria is a milder term meaning “a strong feeling of happiness, confidence, or well-being”. There’s no doubt investors have been euphoric on hopes for big tax cuts soon since Trump won the election. And since those Republican corporate tax cuts actually became law in late December, stock markets have arguably entered the mania phase. This is readily evident on fundamental, technical, and sentimental fronts.
The flagship S&P 500 broad-market stock index is starting 2018 with its elite component stocks trading literally at bubble valuations. The simple-average trailing-twelve-month price-to-earnings ratio of these 500 stocks was running 31.8x at the end of January! That’s above the 28x historical bubble threshold, or double the 14x fair value over the past century and a quarter. These stock markets are dangerously expensive.
Despite that fear of missing out fueled extreme capital inflows in the opening weeks of 2018 as investors rushed to buy stocks high. In this year’s first 18 trading days, the S&P 500 rocketed 7.5% higher which annualizes to an absurd 104% pace of gains! That stretched this leading stock index as much as 14.0% above its 200-day moving average, making for some of the most-overbought conditions ever witnessed.
Sentiment indicators were universally crazy in January too, revealing the most-extreme herd bullishness, optimism, and greed seen since soon before huge past selloffs. Those included late 2007 leading into a 56.8% S&P 500 bear market, early 2000 ahead of the previous 49.1% S&P 500 bear, and even 1987 prior to October’s infamous Black Monday crash where the S&P 500 plummeted 20.5% in a single trading day!
With virtually everyone totally convinced these euphoric, bubble stock markets can keep surging forever, it’s no surprise gold has fallen out of favor. Investors are so caught up in this irrationally-exuberant late-bull psychology that they don’t perceive any meaningful downside risk. So there’s little motivation to prudently diversify stock-heavy portfolios at all, let alone with gold. That’s driven radical underinvestment in it.
This is actually measurable to some extent using GLD’s physical-gold-bullion holdings held in trust for its shareholders. Since American stock investors’ gold capital flows via GLD shares often dominate gold’s fortunes, the value of its holdings approximates overall gold investment. Looking at the ratio of that to the total market capitalization of all the S&P 500 companies reveals rough gold investment levels over time.
This ratio between the amount of capital invested in GLD and the total value of the S&P 500 is rendered below in red. That’s superimposed over GLD’s total gold holdings in metric tons in blue. Once this ETF ramped up past its initial early-adoption years, this metric revealed relative baseline gold investment levels for American stock investors. And gold investment has been very low during the recent taxphoria surge.
American stock investors’ gold portfolio allocations as measured by this GLD/SPX value ratio have been extremely low throughout the entire taxphoria rally since Trump’s victory. The amount of capital invested in GLD shares has been running around just 0.14% the amount invested in S&P 500 companies! Gold really can’t get much more out of favor than an implied portfolio allocation of a trivial 1/7th of one percent.
The last quasi-normal years in the markets came between 2009 to 2012. That was sandwiched between the first stock panic in a century and the Fed’s extreme open-ended money printing in QE3 that wildly distorted the markets ever since. During that span, gold investment was much higher. The capital invested in GLD shares averaged 0.475% of the collective market cap of the S&P 500, nearly half of one percent.
That implies American stock investors’ gold portfolio allocations are well under a third of normal levels by recent standards! They would have to soar 3.4x merely to mean revert, not even overshoot which is very likely after such anomalous lows. While getting back near a 0.5% gold allocation would require massive capital inflows into GLD for years catapulting gold prices far higher, that level of gold investment remains conservative.
For centuries most of the world’s smartest and most-successful investors have recommended portfolio gold allocations of at least 5% to 10% for every investor. One recent example came from Ray Dalio, the universally-respected founder of the world’s largest hedge fund Bridgewater Associates. With his $17b net worth, when Dalio talks Wall Street listens. Back in August he wrote an essay echoing this classic advice today.
Dalio was warning about the serious downside risks in these lofty stock markets. On gold he said, “We can also say that if the above things go badly, it would seem that gold (more than other safe haven assets like the dollar, yen and treasuries) would benefit, so if you don’t have 5-10% of your assets in gold as a hedge, we’d suggest you relook at this.” That wasn’t just idle talk, as Bridgewater’s Q3’17 investing proved.
Funds have to report their holdings to the SEC in quarterly 13F reports. Bridgewater was buying GLD shares hand over fist as Ray Dalio advised building 5%-to-10% portfolio gold allocations. In Q3 alone its GLD holdings skyrocketed a staggering 575% quarter-on-quarter to 3.9m shares! Bridgewater’s $474m in GLD shares was its fourth-largest position, making this hedge fund the eighth-largest GLD shareholder.
As these insane mania stock markets inevitably roll over into their long-overdue bear, other investors will follow Dalio’s lead. The last time the stock markets corrected, fell more than 10%, was early 2016. That followed an extraordinary 3.6-year correction-less span thanks to extreme Fed quantitative easing, one of the longest on record. So gold was languishing near a deep 6.1-year secular low before stock markets fell.
The S&P 500 merely dropped 13.3% over 3.3 months leading into early 2016, relatively minor as far as major corrections go. Yet gold investment demand turned on a dime as volatility returning awoke stock investors from their complacent slumber. As the first chart showed, in Q4’15 gold fell 4.9% on a 6.6% or 45.1t GLD draw. With stock markets very high and euphoric, investors wanted nothing to do with gold.
Yet in Q1’16 after that modest stock-market correction, gold surged 16.1% higher on a gigantic 27.5% or 176.9t GLD build! Once investors realized stock markets could fall too, they rushed to diversify a little of their capital into gold. Provocatively that GLD build alone accounted for 95.2% of the total jump in world gold demand per the latest WGC data! Gold was catapulted into a new bull market on a mere stock correction.
That big gold investment buying continued in Q2’16, where gold rallied another 7.4% on another 16.0% or 130.8t GLD build. The only reason this trend stalled in Q3’16 was the S&P 500 surged back to its first new record highs in 13.7 months. The catalyst was hopes for more central-bank easing following that UK vote where the British people decided to leave the European Union. Record stock markets kill gold demand.
It’s going to explode again like in early 2016 the next time these euphoric bubble-valued stock markets sell off materially. Given the extreme fundamentals, technicals, and sentiment rampant today, it’s hard to imagine the overdue and coming major selloff not at least testing the upper limits of corrections. That’s a selloff approaching 20%, probably the best-case scenario for the bulls. Anything beyond 20% is a new bear.
Unfortunately that new-bear scenario is far more likely. As of late January this S&P 500 bull has soared an extreme 324.6% in 8.9 years, making for the third-largest and second-longest stock bull in all of US history! Much of those gains were fueled by epic central-bank easing far beyond anything ever before seen in world history. This year both the Federal Reserve and European Central Bank are slamming on the brakes.
The Fed just started its first-ever quantitative-tightening campaign in Q4’17 to unwind years and trillions of dollars of quantitative easing. QT is going to gradually ramp up in 2018 to a powerful $50b-per-month pace starting in Q4 this year. Per the Fed’s schedule, it will effectively destroy $420b of capital in 2018 by letting QE-purchased bonds roll off its balance sheet. Nothing remotely close has ever happened before!
On top of that the ECB just slashed in half its own QE campaign in January to a €30b monthly pace, with a targeted QE end date of September. That means ECB QE will collapse from €720b in 2017 to just €270b in 2018, a radical 5/8ths plunge. Between the Fed’s QT and ECB’s QE tapering, there will be the equivalent of $950b more tightening and less easing in 2018 compared to 2017! That’s going to leave a mark.
The Fed and ECB will literally strangle this stock bull by unwinding and slowing the QE that grew it. And this isn’t just a 2018 thing. In 2019 the Fed and ECB are on track to have another $1450b of tightening compared to 2017. So these stock markets are in real trouble with central-bank liquidity being pulled regardless of their extreme overvaluations and overboughtness. 2018 sure ain’t gonna look like 2017 at all!
Bear markets ultimately tend to cut stock prices in half, literal 50% losses in the SPX. The last couple bears that started in March 2000 and October 2007 saw the SPX drop 49.1% in 2.6 years and 56.8% in 1.4 years! Bear markets are exceedingly dangerous and not to be trifled with. They also tend to grow in size in proportion to their preceding bulls, so the next bear should be bigger than usual after such a massive bull.
When stock markets start materially weakening, investors return to gold. Gold is the ultimate portfolio diversifier because it tends to move counter to stock markets. Gold is forgotten when stock markets are high and euphoria and complacency abound. But once major selloffs inevitably follow major rallies, gold demand explodes as investors rush to diversify their stock-heavy portfolios. Gold is effectively the anti-stock trade.
Given the radical gold underinvestment following this extreme stock bull, investors will likely have to do big gold buying for years to reestablish normal portfolio allocations. That will continue to fuel this young gold bull born in late 2015 in the last stock-market correction. At best gold was only up 29.9% so far as of mid-2016, nothing yet. The last gold bull powered 638.2% higher over 10.4 years ending August 2011!
While investors can ride the coming gold bull in GLD shares, far better gains will be won in the stocks of its leading miners. They tend to amplify underlying gold gains by 2x to 3x due to their profits leverage to gold. With gold so out of favor, the gold stocks are deeply undervalued today. That gives them huge upside as gold mean reverts higher, dwarfing everything else in all the stock markets. Fortunes will be won.
At Zeal we’ve literally spent tens of thousands of hours researching individual gold stocks and markets, so we can better decide what to trade and when. As of the end of Q4, this has resulted in 983 stock trades recommended in real-time to our newsletter subscribers since 2001. Fighting the crowd to buy low and sell high is very profitable, as all these trades averaged stellar annualized realized gains of +20.2%!
The key to this success is staying informed and being contrarian. That means buying low before others figure it out, before undervalued gold stocks soar much higher. An easy way to keep abreast is through our acclaimed weekly and monthly newsletters. They draw on my vast experience, knowledge, wisdom, and ongoing research to explain what’s going on in the markets, why, and how to trade them with specific stocks. For only $12 per issue, you can learn to think, trade, and thrive like contrarians. Subscribe today, and get deployed in the great gold and silver stocks in our full trading books!
The bottom line is global investors are radically underinvested in gold today. Years of relentless stock-market rallying to endless new record highs has left prudent portfolio diversification with counter-moving gold deeply out of favor. But the same central banks that fueled this extraordinary stock bull are now reversing to massive and unprecedented tightening this year, which will inevitably force stock markets to roll over.
As stocks sell off in what is almost certain to become the long-overdue next major bear, gold investment demand will make a glorious renaissance. Investors will flock back to gold to stabilize their bleeding stock-heavy portfolios, catapulting its price much higher. It will likely take years of gold investment buying to restore overall gold portfolio allocations to reasonable historic norms. That’s super-bullish for gold!
Adam Hamilton, CPA
February 2, 2018
Copyright 2000 – 2018 Zeal LLC (www.ZealLLC.com)
If you would like to receive our free newsletter via email, simply enter your email address below & click subscribe.
 Follow us on Twitter
 Become our facebook fan
CONNECT WITH US
Tweets
Tweet with hash tag #miningfeeds or @miningfeeds and your tweets will be displayed across this site.
MOST ACTIVE MINING STOCKS
Daily Gainers
 CMC Metals Ltd. CMC Metals Ltd. |
CMB.V | +900.00% |
 Eden Energy Ltd Eden Energy Ltd |
EDE.AX | +200.00% |
| GoviEx Uranium Inc. |
GXU.V | +42.86% |
| Eagle Nickel Ltd. |
ENL.AX | +41.67% |
| Citigold Corp. Limited |
CTO.AX | +33.33% |
| Mount Burgess Mining NL |
MTB.AX | +33.33% |
| Exalt Resources Limited |
ERD.AX | +31.94% |
| Casa Minerals Inc. |
CASA.V | +30.00% |
| Cariboo Rose Resources Ltd |
CRB.V | +28.57% |
| Belmont Resources Inc. |
BEA.V | +28.57% |


