Last week we noted that Gold’s quarterly close would be a key marker for Gold’s immediate breakout potential. Gold was seemingly on course for its highest quarterly close since 2012 until it reversed back below quarterly resistance at $1330/oz. Hence, an imminent break to the upside is unlikely and gold watchers will have to remain patient. It’s not yet Gold’s time. It will be soon enough.
One catalyst for the most recent strength in Gold (the correction in equities) appears to have faded as the S&P 500 has held its 200-day moving average. A sustained rebound in equities while bond yields correct would not be particularly bullish for Gold. The obvious reason is capital is flowing into equities and not Gold. A rebound in equities amid a temporary reduction in inflation expectations would equate to stable or rising real yields.
Essentially, there are two ways Gold can break to the upside. The first is Gold senses a breakout in long-term bond yields and a sustained rise in inflation expectations. Those developments would soon negatively impact the economy and stock market which would lead to easier Fed policy and ultimately falling real yields.
The other scenario is bond yields do not break to the upside, there is a slowdown, the stock market declines and the Fed has to reverse course all together. As we predicted in past editorials, long-term yields are trending lower and that could continue. In the meantime, Gold will not break to the upside unless the stock market experiences more turmoil.
Take a look at those examples and note the time between the end of the bear market and the next significant low (from which the bull resumed). In most cases the time between those lows is two years and seven to nine months. For the gold stocks it has only been two years and two months since that epic January 2016 low.
Assuming stocks rebound and long-term bond yields continue to moderate, then Gold is unlikely to breakout this spring. However, that is perfectly okay as our historical study suggests the miners (while facing little downside) may not begin a real bull move for several months. Gold Investors should not be discouraged as they could panic at the absolute worst time (I’m already seeing it anecdotally). Regardless of whether the bull move begins in a few months, five months or whenever, we continue to remain patient while accumulating the juniors we think have 500% return potential over the next 18-24 months. To follow our guidance and learn our favorite juniors for the next 12-18 months, consider learning more about our service.
The silver miners’ stocks have really languished since mid-2016, relentlessly grinding sideways to lower. With gold out of favor, silver and its miners have largely been left for dead and forgotten. This sector is deeply mired in universal apathy and bearishness. But since silver stocks can skyrocket when silver decisively rallies again, it’s important to keep an eye on silver miners’ fundamentals like their recent Q4’17 results.
Four times a year publicly-traded companies release treasure troves of valuable information in the form of quarterly reports. Required by securities regulators, these quarterly results are exceedingly important for investors and speculators. They dispel all the sentimental distortions surrounding prevailing stock-price levels, revealing the underlying hard fundamental realities. They serve to re-anchor perceptions.
Normally quarterlies are due 45 calendar days after quarter-ends, in the form of 10-Qs required by the SEC for American companies. But after the final quarter of fiscal years, which are calendar years for most silver miners, that deadline extends out up to 90 days depending on company size. The 10-K annual reports required once a year are bigger, more complex, and need fully-audited numbers unlike 10-Qs.
So it takes companies more time to prepare full-year financials and then get them audited by CPAs right in the heart of their busy season. The additional delay in releasing Q4 results is certainly frustrating, as that data is getting stale approaching the end of Q1. While most silver miners report their Q4 and/or full-year results by 7 to 9 weeks after year-ends, some disrespect their investors by pushing that 13-week limit.
And some silver miners only publish full-year results without breaking out Q4, masking what happened in the latest quarter. All this unfortunately makes Q4 results the hardest to analyze out of all quarterlies. But delving into them is still well worth the challenge. Quarterly results offer a very valuable true snapshot of what’s really going on, shattering all the misconceptions bred by the ever-shifting winds of sentiment.
Silver mining is a tough business both geologically and economically. Primary silver deposits, those with enough silver to generate over half their revenues when mined, are quite rare. Most of the world’s silver ore formed alongside base metals or gold, and their value usually well outweighs silver’s. So typically in any given year, less than a third of the global mined silver supply actually comes from primary silver mines!
The world authority on silver supply-and-demand fundamentals is the Silver Institute. Back in mid-May it released its latest annual World Silver Survey, which covered 2016. That year only 30% of silver mined came from primary silver mines, a slight increase. The remaining 70% of silver produced was simply a byproduct. 35% of the total mined supply came from lead/zinc mines, 23% from copper, and 12% from gold.
As scarce as silver-heavy deposits supporting primary silver mines are, primary silver miners are even rarer. Since silver is so much less valuable than gold, most silver miners need multiple mines in order to generate sufficient cash flows. These often include non-primary-silver ones, usually gold. More and more traditional elite silver miners are aggressively bolstering their gold production, often at silver’s expense.
So the universe of major silver miners is pretty small, and their purity is shrinking. The definitive list of these companies to analyze comes from the most-popular silver-stock investment vehicle, the SIL Global X Silver Miners ETF. This week its net assets are running 6.8x greater than its next-largest competitor’s, so SIL really dominates this space. As investors buy SIL, it in turn buys shares in the companies it holds.
Back in mid-March as the major silver miners were finishing reporting their Q4’17 results, SIL included 25 “silver miners”. This term is used loosely, as SIL holds plenty of companies which can’t be described as primary silver miners. Most generate well under half their revenues from silver, which really limits their stock prices’ leverage to silver rallies. Nevertheless, SIL is today’s leading silver-stock ETF and benchmark.
The higher the percentage of sales any miner derives from silver, naturally the greater its exposure to silver-price moves. If a company only earns 20%, 30%, or even 40% of its revenues from silver, it’s not a primary silver miner and its stock price won’t be very responsive to silver itself. But as silver miners are increasingly actively diversifying into gold, there aren’t enough big primary silver miners left to build an ETF alone.
Every quarter I dig into the latest results from the major silver miners of SIL to get a better understanding of how they and this industry are faring fundamentally. I feed a bunch of data into a big spreadsheet, some of which made it into the table below. It includes key data for the top 17 SIL component companies, an arbitrary number that fits in this table. That’s a commanding sample at 94.6% of SIL’s total weighting.
While most of these top-17 SIL components had reported on Q4’17 by late March, not all had. Some of these major silver miners trade in the UK or Mexico, where financial results are only required in half-year increments. If a field is left blank in this table, it means that data wasn’t available by the end of Q4’s earnings season. Some of SIL’s components also report in gold-centric terms, excluding silver-specific data.
In this table the first couple columns show each SIL component’s symbol and weighting within this ETF as of mid-March. While most of these silver stocks trade in the States, not all of them do. So if you can’t find one of these symbols, it’s a listing from a company’s primary foreign stock exchange. That’s followed by each company’s Q4’17 silver production in ounces, along with its absolute year-over-year change.
After that comes this same quarter’s gold production. Pretty much every major silver miner in SIL also produces significant-if-not-large amounts of gold! While gold stabilizes and augments the silver miners’ cash flows, it also retards their stocks’ sensitivity to silver itself. Naturally investors and speculators buy silver stocks and their ETFs because they want leveraged upside exposure to silver’s price, not gold’s.
So the next column reveals how pure the elite SIL silver miners are. This is mostly calculated by taking a company’s Q4 silver production, multiplying it by Q4’s average silver price, and then dividing that by the company’s total quarterly sales. If miners didn’t report Q4 revenues, I approximated them by adding the silver sales to gold sales based on their quarterly production and these metals’ average fourth-quarter prices.
Then comes the most-important fundamental data for silver miners, cash costs and all-in sustaining costs per ounce mined. The latter determines their profitability and hence ultimately stock prices. Those are also followed by YoY changes. Finally comes the YoY changes in cash flows generated from operations and GAAP profits. But there are a couple exceptions where YoY changes just wouldn’t yield useful results.
Percentage changes aren’t relevant or meaningful if data shifted from positive to negative or vice versa, or if derived from two negative numbers. So in those cases I included raw underlying results instead of weird or misleading percentage changes. This whole dataset offers a great high-level read on how the major silver miners are faring today as an industry. They’re doing pretty well in this weak-silver-price environment.
That’s reassuring given silver’s serious underperformance relative to gold. As a far-smaller market, silver usually amplifies gold’s advances by 2x to 3x. Yet in 2017, silver only rallied 6.4% despite a much-bigger 13.2% gold rally. That vexing trend has continued in 2018, with silver down 3.8% year-to-date while gold is 1.8% higher. With silver itself really sucking wind, investors sure aren’t motivated to buy silver stocks.
Production is the lifeblood of miners, and thus the best place to start fundamental analysis. In Q4’17, these top-17 SIL components collectively produced an impressive 78.6m ounces of silver. If 2016’s world-silver-mining run rate is applied to last year’s fourth quarter, that implies 221.5m ounces of silver mined. Thus these top SIL silver miners would account for nearly 36% of that total, they truly are major silver players.
Their collective silver production looks solid, climbing 3.0% YoY. But unfortunately that’s misleading, as huge growth in a couple mining conglomerates is masking sharp-to-catastrophic declines for some of the rest of these SIL-component miners struggling with low silver prices. Fresnillo and Industrias Peñoles enjoyed major 20% and 19% YoY gains in silver production off their already-gigantic world-leading bases!
Fresnillo and Industrias Peñoles have an incestuous relationship, as the former used to be wholly owned by the latter. Industrias Peñoles spun off Fresnillo back in May 2008 on the London Stock Exchange. While Fresnillo’s financial reporting is decent, Industrias Peñoles’ is murky. Neither my decades studying financial statements as a Certified Public Accountant nor my rudimentary Spanish can penetrate very deep.
So I haven’t been able to track down how much of Fresnillo that Industrias Peñoles still owns, nor whether the silver production reported by these silver-mining behemoths is actually mutually exclusive. I’m assuming it is for this analysis, but I’m skeptical. Both companies reported their huge YoY growth in silver production was the result of Fresnillo’s new San Julián silver mine coming online, which is a big one.
San Julián produced 4057k ounces of silver in Q4’17 alone, along with fairly-large gold, zinc, and lead byproducts. It’s anticipated to produce 11.6m and 63.7k ounces of silver and gold annually for 12 years. Without San Julián, which could be double-reported between Fresnillo and Industrias Peñoles, the top SIL silver miners’ production would look very different. These elite silver miners have had a challenging year.
Excluding Fresnillo and Peñoles, the rest of these top SIL components saw their collective silver production fall a sizable 6.8% YoY to 44.5m ounces! It’s been quite ugly out there in silver-land, for both industry-wide and company-specific reasons. Between Q4’16 and Q4’17, the average silver price retreated 2.5% to just $16.69. That was far worse than average gold’s 4.8% YoY gain, testing silver’s economics.
With silver prices so weak, sentiment so bearish, and silver-stock prices so darned low, silver miners are both starved of capital for expansions and reluctant to invest heavily in the silver side of their businesses. Mining gold is far more profitable at today’s precious metals’ prices, so they continue to allocate scarce resources to growing their gold production. That certainly isn’t helping the purity of the major silver miners.
A couple long-time favorites of American investors saw silver production plummet over this past year. Tahoe Resources was originally spun off by Goldcorp to develop the incredible high-grade Escobal silver mine in Guatemala. Over the past year that country’s corrupt government shut this mine down after a frivolous and baseless lawsuit by anti-mining activists. They sued the government regulator, not Tahoe itself!
That lawsuit claimed Guatemala’s Ministry of Energy and Mines did not properly consult with the Xinca indigenous people before granting Escobal’s permits! That shouldn’t even be Tahoe’s problem if the government bureaucrats didn’t hold enough meetings, yet Escobal’s mining license was still suspended. The dishonorable Guatemalan government has been dragging its feet ever since, so Escobal is frozen in stasis.
The government’s lack of respect for the rule of law shows why third-world countries stay that way. For many months it allowed violent anti-mine militants to illegally blockade the road to Escobal and physically attack trucks and their drivers! Tahoe eventually had to fire about half of the 1000+ local employees who had high-paying jobs at that mine. Tahoe’s silver production cratered 100% YoY from 4827k ounces to zero.
SSR Mining saw a similar sharp 60% YoY plummet in silver production to just 877k ounces in Q4’17. It had nothing to do with geopolitics like Tahoe’s mess, but is simply due to the forecast depletion of its old Pirquitas silver mine. SSR Mining, which used to be called Silver Standard Resources, is exploring in the area trying to extend the life of this mine. But most of its financial resources are being poured into its gold mines.
That gold focus among these top silver miners is common across SIL’s components. As the silver-percentage column above shows, most of these elite silver miners are actually primary gold miners by revenue! Only 3 of these 17 earned more than half of their Q4’17 sales from mining silver, and they are highlighted in blue. WPM, CDE, PAAS, TAHO, and HL are also top-34 components in the leading GDX gold miners’ ETF.
While they only comprised 8.3% of GDX’s total weighting in late March, this highlights how difficult it is to find primary silver miners. SIL’s managers have an impossible job these days with the major silver miners increasingly shifting to gold. They are really scraping the bottom of the barrel to find more silver miners. In Q3’17 they added Korea Zinc, and it’s now SIL’s 2nd-largest holding with a large 12.7% total weighting.
That was intriguing, as I’d never heard of this company after decades of intensely studying and actively trading silver stocks. So I looked into Korea Zinc and found it was merely a smelter, not even a miner! The latest financial data I could find in English was 2015’s. That year Korea Zinc “produced” 63.3m ounces of silver, which was largely a byproduct from its main business of smelting zinc, lead, copper, and gold.
I ran the numbers for the heck of it, and silver was implied as 32% of Korea Zinc’s 2015 revenues. The fact SIL’s managers included a company like this that doesn’t even mine silver as a top SIL component shows how rare major silver miners have become. The economics of silver mining at today’s prices are inferior to gold mining. Thus the average silver-purity percentage of revenues of these SIL miners is only 35.8%.
That’s right in line with the downtrend over this past year, with Q4’16, Q1’17, Q2’17, and Q3’17 seeing SIL’s top-component silver purity averaging 40.6%, 38.5%, 37.6%, and 40.1%. Silver mining is as capital-intensive as gold mining, requiring similar large expenses for planning, permitting, and constructing mines and mills. It needs similar heavy excavators and haul trucks to dig and move the silver-bearing ore.
But silver generates much lower cash flows due to its lower price. Consider hypothetical mid-sized silver and gold miners, which might produce 10m and 300k ounces annually. At last quarter’s average metals prices, these silver and gold mines would yield $167m and $383m of yearly sales. It’s far easier to pay the bills mining gold than silver, which is unfortunate. But until silver surges again, that’s the way things are.
While I understand this, as a long-time silver-stock investor it saddens me primary silver miners have apparently become a dying breed. When silver starts powering higher in one of its gigantic uplegs and way outperforms gold again, this industry’s silver-purity percentage will rise. But unless silver not only shoots far ahead but stays there while gold lags, it’s hard to see major-silver-mining purity significantly reversing.
Unfortunately SIL’s mid-March composition was such that there wasn’t a lot of Q4 cost data reported by its top component miners. A half-dozen of these top SIL companies trade in South Korea, the UK, Mexico, and Peru, where reporting only comes in half-year increments. There are also primary gold miners that don’t report silver costs, and a silver explorer with no production. So silver cost data remains scarce.
Nevertheless it’s always useful to look at what we have. Industry wide silver-mining costs are one of the most-critical fundamental data points for silver-stock investors. As long as the miners can produce silver for well under prevailing silver prices, they remain fundamentally sound. Cost knowledge helps traders weather this sector’s fear-driven plunges without succumbing to selling low like the rest of the herd.
There are two major ways to measure silver-mining costs, classic cash costs per ounce and the superior all-in sustaining costs. Both are useful metrics. Cash costs are the acid test of silver-miner survivability in lower-silver-price environments, revealing the worst-case silver levels necessary to keep the mines running. All-in sustaining costs show where silver needs to trade to maintain current mining tempos indefinitely.
Cash costs naturally encompass all cash expenses necessary to produce each ounce of silver, including all direct production costs, mine-level administration, smelting, refining, transport, regulatory, royalty, and tax expenses. In Q4’17, these top-17 SIL-component silver miners that reported cash costs averaged $4.66 per ounce. That plunged a whopping 11.6% YoY, making it look like silver miners are far more efficient.
But that’s misleading. This past quarter SIL’s 17th-largest component was Silvercorp Metals, which enjoys big lead and zinc byproducts at its China silver mines. These base metals are sold and used to offset the costs of silver mining. That forced SVM’s cash costs down to negative $5.92 per ounce, which dragged down SIL’s overall average. Hecla Mining also enjoyed negative cash costs due to byproduct credits.
Those super-low cash costs help offset SSR Mining’s super-high $16.36 per ounce. That’s not normal either, the result of that winding down of its lone silver mine. Excluding these extreme outliers, the remaining handful of silver miners had average cash costs of $5.69 per ounce. As long as silver prices stay above those levels, the silver miners can keep the lights on at their mines. Sub-$6 silver is inconceivable.
Way more important than cash costs are the far-superior all-in sustaining costs. They were introduced by the World Gold Council in June 2013 to give investors a much-better understanding of what it really costs to maintain a silver mine as an ongoing concern. AISC include all direct cash costs, but then add on everything else that is necessary to maintain and replenish operations at current silver-production levels.
These additional expenses include exploration for new silver to mine to replace depleting deposits, mine-development and construction expenses, remediation, and mine reclamation. They also include the corporate-level administration expenses necessary to oversee silver mines. All-in sustaining costs are the most-important silver-mining cost metric by far for investors, revealing silver miners’ true operating profitability.
In Q4’17 these top-17 SIL components reporting AISCs averaged just $10.16 per ounce. That was down 3.8% YoY, and far below last quarter’s average silver price of $16.69. Again SVM’s incredible byproduct production dragged down the average though. Ex-Silvercorp, these top SIL silver miners’ AISCs ran at an average of $11.33 in Q4. That’s still way below prevailing silver prices, generating nice operating profits.
All-in sustaining costs and production are inversely related. Lower silver production, which many of SIL’s top components suffered last quarter, leaves fewer ounces to spread the big fixed costs of mining across. Yet average AISCs still retreated, showing these top silver miners are getting more efficient at producing their metal. That will grant the silver miners more upside profits leverage to rising silver as this metal recovers.
At $10.16 AISCs, the major silver miners still earned big profits in the fourth quarter. Once again silver averaged $16.69, implying fat profit margins of $6.53 per ounce or 39%! Most industries would kill for such margins, yet silver-stock investors are always worried silver prices are too low for miners to thrive. That’s why it’s so important to study fundamentals, because technical price action fuels misleading sentiment.
Today’s silver price remains crazy-low relative to prevailing gold levels, portending huge mean-reversion upside. The long-term average Silver/Gold Ratio runs around 56, which means it takes 56 ounces of silver to equal the value of one ounce of gold. Silver is really underperforming gold so far in 2018, with the SGR averaging a stock-panic-like 79.5 YTD as of late March. So silver is overdue to catch up with gold.
At a 56 SGR and $1325 gold, silver is easily heading near $23.66. That’s 42% above its Q4 average. Assuming the major silver miners’ all-in sustaining costs hold, that implies profits per ounce soaring 107% higher! Plug in a higher gold price or the usual mean-reversion overshoot after an SGR extreme, and the silver-mining profits upside is far greater. Silver miners’ inherent profits leverage to rising silver is incredible.
While all-in sustaining costs are the single-most-important fundamental measure that investors need to keep an eye on, other metrics offer peripheral reads on the major silver miners’ fundamental health. The more important ones include cash flows generated from operations, actual accounting profits, revenues, and cash on hand. They generally corroborated AISCs in Q4’17, proving silver miners are weathering low prices fine.
The collective operating cash flows generated by these top-17 SIL silver miners grew 2.2% YoY to $590m. That’s not bad considering the 2.5% YoY drop in quarterly average silver prices and the 6.8% YoY lower silver production not including Fresnillo and Peñoles. These strong positive OCFs prove the major silver mines are generating much more cash than they cost to run even at these depressed silver prices.
But the elite silver miners’ GAAP accounting profits looked horrendous, weighing in at a huge $703m loss in Q4’17 compared to $157m earned a year earlier! The vast majority of that is due to a single colossal $547m loss from a company that newly climbed into SIL’s top 17 components over the past year. In the table above these new companies that weren’t among SIL’s leading stocks a year ago are highlighted in light blue.
Volcan Compañia Minera mines base metals, silver, and gold in the central highlands of Peru. In Q4 it reported a gargantuan net loss of $547m, driven entirely by a negative $570m “Exceptional adjustments”. This was described in the management discussion and analysis of quarterly results as necessary “to meet the corporate policies and accounting standards of Glencore”, which bought 55% of Volcan’s stock in November.
Pulling out that one-time Volcan loss to consolidate its financial results with its new parent’s, the top-17 SIL silver miners lost $156m in Q4’17. That’s still a major YoY drop, but is reasonable given the weak silver prices and their resulting ongoing non-cash writedowns of silver mines and deposits that look less economical. With lower silver prices and lower production, it wouldn’t have surprised me to see far-bigger losses.
The revenue front was interesting, with these top-17 SIL silver miners reporting overall sales of $3331m in Q4’17. That soared 26.6% YoY despite generally-lower production and prices. Peñoles was definitely a factor, but Fresnillo doesn’t break out Q4 sales so they weren’t included in Q4’17 or Q4’16. The primary driver was the UK’s Polymetal reporting $586m in sales in Q4’17 after breaking out none a year earlier.
These top SIL components’ collective cash on hand at the end of Q4 was largely flat at $3715m. That means the strong cash flows generated from operations were plowed back into exploring for more silver and gold to mine, expanding existing mines, and developing new ones. That’s still a big pile of cash for this small industry, giving silver miners flexibility to grow their production and ride out any unforeseen challenges.
Silver miners’ earnings power and thus stock-price upside potential will only grow as silver mean reverts higher. In mining, costs are largely fixed during the mine-planning stages. That’s when engineers decide which ore bodies to mine, how to dig to them, and how to process that ore. Quarter after quarter, the same numbers of employees, haul trucks, excavators, and mills are generally used regardless of silver prices.
So as silver powers higher in coming quarters, silver-mining profits will really leverage its advance. And that will fundamentally support far-higher silver-stock prices. The investors who will make out like bandits on this are the early contrarians willing to buy in low, before everyone else realizes what is coming. By the time silver surges higher with gold so silver stocks regain favor again, the big gains will have already been won.
While investors and speculators alike can certainly play the silver miners’ long-stalled mean-reversion bull with this leading SIL ETF, individual silver stocks with superior fundamentals will enjoy the best gains by far. Their upside will trounce the ETFs, which are burdened by companies that don’t generate enough of their sales from silver. A handpicked portfolio of purer elite silver miners will yield much-greater wealth creation.
At Zeal we’ve literally spent tens of thousands of hours researching individual silver stocks and markets, so we can better decide what to trade and when. As of the end of Q4, this has resulted in 983 stock trades recommended in real-time to our newsletter subscribers since 2001. Fighting the crowd to buy low and sell high is very profitable, as all these trades averaged stellar annualized realized gains of +20.2%!
The key to this success is staying informed and being contrarian. That means buying low before others figure it out, before undervalued silver stocks soar much higher. An easy way to keep abreast is through our acclaimed weekly and monthly newsletters. They draw on my vast experience, knowledge, wisdom, and ongoing research to explain what’s going on in the markets, why, and how to trade them with specific stocks. For only $12 per issue, you can learn to think, trade, and thrive like contrarians. Subscribe today, and get deployed in the great gold and silver stocks in our full trading books!
The bottom line is the major silver miners fared fine in Q4 despite some real challenges. A combination of silver continuing to seriously lag gold, along with anomalous company-specific problems, weighed on miners’ collective results. Yet they continued to produce silver at all-in sustaining costs way below Q4’s low prevailing silver prices. And their ongoing diversification into gold leaves them financially stronger.
With silver-stock sentiment remaining excessively bearish, this sector is primed to soar as silver itself resumes mean reverting higher to catch up with gold’s young bull market. The silver miners’ profits leverage to rising silver prices remains outstanding. After fleeing silver stocks so relentlessly over the past 19 months, investors will have to do big buying to reestablish silver-mining positions. That will fuel major upside.
I’ve predicted that in 2018 the US stock market would suffer a series of crashes somewhat akin to the 1987 event, but smaller in size.
Please click here now. Double-click to enlarge this interesting chart of the US stock market. Clearly, these mini-crashes are starting to happen.
Having said that, I haven’t sold any of my US bank stocks and I have no plans to do so.
To understand why I’m still “long and strong” the bank stocks in this environment, please click here now. Bank profits are soaring because of tax cuts, QT, and rate hikes.
Corporate boards are still using the bulk of the profits for stock buybacks and bonuses for the “fat cats”, while throwing crumbs to the lower-paid workers.
As disgusting as that is, it’s a good environment to own stock market indexes, and a great environment to own bank stocks.
This is the stage of the business cycle where “big growth” transitions to “decent growth with inflation”. Simply put, in this environment bank stocks do well, growth stocks stumble, and gold stocks start to get modest liquidity flows from institutions.
As the cycle moves to “inflation with low growth”, growth stocks crash, bank stocks fade, and gold stocks soar.
Please click here now. Double-click to enlarge this key T-bond chart. US interest rates are rising now and poised to rise relentlessly for the next several years.
There are “institutional thresholds” of importance in major markets. For the US stock market, institutions will generally continue to buy stocksuntil the ten-year yield reaches the 4%-5% range.
Goldman is predicting four rate hikes this year and I’m predicting a minimum of three. The yield should get close to 4% by the end of this year.
I realise that most gold bugs are “stock market crash enthusiasts”. There’s no question that the US stock market has soared mainly because the “hot air” of QE and low rates has incentivized corporate boards to focus on stock market buybacks rather than worker wages and business expansion.
Having said that, patience is required. Investors need to focus on the slow but steady cyclical transition from growth to inflation as the Fed pushes the enormous QE money ball out of government bonds and into the fractional reserve banking system.
Please click here now. Double-click to enlarge this fabulous daily gold chart. The rectangle pattern is flag-like, and suggests gold is coiling to burst above my key $1370 resistance zone.
Short term traders who took my recommendation to buy the $1310 area should be sellers in this $1340-$1355 area. That’s because there could be quite a bit more coiling action before a true breakout above $1370 occurs. The bottom line is that investors need to be patient and traders need to book profits now!
Looking at the big picture, the inflation trade is clearly becoming more positive for gold every day. The Trump decision to appoint John “The Hawk” Bolton to a key post in his administration makes the geopolitical trade for gold a positive one as well.
What about the love trade? Well, please click here now. The 2019 Indian elections are approaching and the Modi government is likely to win again.
Modi is backed with “monster money” and to ensure he wins again he’s launching a huge farm income program called MSP. This program is inflationary because it boosts crop prices. That alone is positive for the global price of gold.
The MSP program also is poised to create a massive boost in farmer income, and rural Indians always use extra income to buy more gold.Please click here now. This MSP policy launch is happening at the same time as the influential Niti Aayog panel pushes the Modi government to implement a massive gold-positive policy agenda.
I’ve been adamant that 2018 would see the absolute end of gold-negative policy from the Modi government, and the launch of positive policy. That’s clearly in play, and it’s going to exponentially accelerate relentlessly.
Please click here now. Double-click to enlarge this GDX chart. The technical action is superb, and investors should now be buyers of their favourite GDX and GDXJ component stocks on all two and three-day pullbacks.
Please click here now. Double-click to enlarge. With food inflation set to surge in India and general wage and price inflation on the move in America, it’s time for investors to take a more serious interest in silver stocks. The big upside action won’t start until there’s a volume-based breakout from the bull wedge pattern on this silver stocks ETF chart.
Call option buyers should wait for that breakout before buying, but all silver stock enthusiasts should be buyers of key SIL component stocks right now. Use two and three-day pull backs to take buy-side action, in preparation for the imminent upside rocket ride!
Stewart Thomson is no longer an investment advisor. The information provided by Stewart and Graceland Updates is for general information purposes only. Before taking any action on any investment, it is imperative that you consult with multiple properly licensed, experienced and qualified investment advisors and get numerous opinions before taking any action. Your minimum risk on any investment in the world is: 100% loss of all your money. You may be taking or preparing to take leveraged positions in investments and not know it, exposing yourself to unlimited risks. This is highly concerning if you are an investor in any derivatives products. There is an approx $700 trillion OTC Derivatives Iceberg with a tiny portion written off officially. The bottom line:
Are You Prepared?
The Oreninc Index fell in the week ending March 23rd, 2018 to 26.70 from an updated 52.33 a week ago as financings once again dried to a trickle.
The week was full of news that was generally positive for gold led by the US Federal Reserve’s latest monetary policy decision that confirmed the long-expected interest rate increase, but more importantly, the Fed indicated that it will only make three rate increases this year. Gold surged on this news, putting in one of its strongest weeks for nearly two years.
This news was compounded by action on the geopolitical front as US president Donald Trump announced a US$50-60 billion trade tariff package aimed squarely at China, causing fears that a trade would could result.
On to the money: total fund raises announced more than halved to C$33.7 million, a two-week low, which included one brokered financing for a paltry C$0.7m, an eleven-week low, and no bought-deal financings. The average offer size fell to C$1.5 million, a two-week low.
A strong week for gold saw the yellow metal close up at US$1,347/oz from US$1,314/oz a week ago. Gold is now up 3.42% this year. Meanwhile, the US dollar index closed down at 89.44 from 90.23 a week ago. The van Eck managed GDXJ alsoclosed up at US$32.78 from US$31.41 last week. The index is down 3.96% so far in 2018. The US Global Go Gold ETF also jumped to close up at US$12.74 from US$12.44 from a week ago. It is down 2.11% so far in 2018. The HUI Arca Gold BUGS Index put in growth to close up at 176.86 from 171.16 last week. The SPDR GLD ETF continued to add ounces to close at 850.54 tonnes from 840.22 tonnes a week ago.
In other commodities, the silver rebounded and closed up at US$16.56/oz from US$16.33/oz a week ago. Copper bucked the positive metals trend with a negative week to close down at US$2.99/lb from US$3.10/lb last week. Meanwhile, oil put in a strong week and closed up at US$65.88 a barrel from US$62.34 a barrel a week ago.
The Dow Jones Industrial Average took a hit from president Trump’s China tariffs announcement, shedding more than 1,000 points to close down at 23,533 from 24,946 last week. Likewise, Canada’s S&P/TSX Composite Index took a nose dive to close down at 15,223 from 15,711 the previous week. The S&P/TSX Venture Composite Index also closed down at 817.80 from 833.67 last week.
Summary:
Number of financings dropped to 23, a two-week low.
One brokered financing was announced this week for $0.7m, a eleven-week low.
No bought-deal financings were announced this week, a two-week low.
Total dollars fell to $33.7m, a two-week low.
Average offer size also fell to $1.5m, a two-week low.
Financing Highlights
IDM Mining (TSX:IDM) opened a C$4.35 million non-brokered private placement offering on a best efforts basis.
54.4 million units comprising flow-through units @ C$0.09 and non-flow-through units @ C$0.08
Each unit will consist of one share and a quarter warrant exerciseable @ C$0.12 for two years.
Net proceeds will go towards permitting, community relations, First Nation engagement, engineering and development activities of the Red Mountain gold project near Stewart, BC, Canada.
Major Financing Openings:
IDM Mining (TSX:IDM) opened a C$4.35 million offering on a best efforts basis. Each unit includes half a warrant that expires in 24 months.
Golden Harp Resources (TSXV:GHR.H) opened a C$4 million offering on a best efforts basis.
Maple Gold Mines (TSXV:MGM) opened a C$3.8 million offering on a best efforts basis. The deal is expected to close on or about March 28th.
Velocity Minerals (TSXV:VLC.H) opened a C$3.5 million offering on a best efforts basis. Each unit includes half a warrant that expires in 12 months.
Major Financing Closings:
GT Gold (TSXV:GT) closed a C$6.52 million offering on a best efforts basis.
Ascot Resources (TSXV:AOT) closed a C$6.5 million offering underwritten by a syndicate led by Sprott Capital Partners on a best efforts basis.
Sarama Resources (TSXV:SWA) closed a C$4 million offering underwritten by a syndicate led by Arlington Group Asset Management on a best efforts basis.
VR Resources (TSXV:VRR) closed a C$2 million offering on a best efforts basis.
About Oreinc.com:
Oreninc.com is North America’s leading provider of relevant financing information in the junior commodities space. Since 2011, the company has been keeping track of financings in the junior mining as well as oil and gas space. Logging all relevant deal and company information into its proprietary database, called the Oreninc Deal Log, Oreninc quickly became the go-to website in the mining financing space for investors, analysts, fund managers and company executives alike.
The Oreninc Deal Log keeps track of over 1,400 companies, bringing transparency to an otherwise impenetrable jungle of information. The goal is to increase the visibility of transactions and to show financings activity in a digestible format. Through its daily logging activities, Oreninc is in a position to pinpoint momentum changes in the markets, identify which commodities are trending and which projects are currently receiving funding.
Gold has firmed above $1300 in recent days and is holding comfortably above $1300 for now. We think the market will break to the upside sometime this year. The question is when. Here are 3 things to watch that will tell us if Gold is on the cusp of that break-out soon or later.
First, keep your eye on Gold’s close at the end of next week. It’s not only the end of the week and month but also the end of the quarter. While Gold has traded above $1350 multiple times in the past two years, it has not made a quarterly close above $1330 since 2012. Since this is a quarterly time frame, we would need to see a close above $1340 or even $1345 to mark a significant breakout. If Gold can make such a close next Friday then the odds are good that it could break above $1375 fairly soon.
Gold Quarterly Chart
Second, (and I always beat this to death) Gold needs to break its downtrends relative to foreign currencies (FC) and equities. The Gold/equities ratio appears to be breaking out but needs follow through for confirmation. The 200-day moving average in that chart appears to have stopped declining. If the ratio can hold above the 200-day moving average then it’s obviously a bullish sign. Meanwhile, Gold/FC has work to do. Over the last 10 months, it has traded in a tighter and tighter range. That trendline resistance could go hand in hand with resistance at $1365-$1375.
Gold, Gold/Foreign Currencies, Gold/Stocks
Finally, on the equity side, we want to see if GDX and GDXJ can break above their “A” resistance levels which are roughly $23 for GDX and $34 for GDXJ. The miners have been relatively oversold and with improving breadth (discussed in our premium updates) they could reach the A targets, which are slightly above the 200-day moving averages. If the market is sensing a break-out in Gold then GDX and GDXJ should trend above the A targets while the 200-day moving averages would become support. A move up to the B targets over the next four to six weeks would be very bullish.
GDX, GDXJ (Daily Line Charts)
Of course, the price action in Gold itself will answer the question but these other charts can not only give an early hint but can also inform as to the sustainability of Gold’s strength. The first test will be the quarterly close next week. Then we can monitor if the Gold/equities ratio is holding its breakout and if Gold/FC is strengthening.
The junior gold miners’ stocks have spent much of the past year grinding sideways near lows, sapping confidence and breeding widespread bearishness. The entire precious-metals sector has been left for dead, eclipsed by the dazzling taxphoria stock-market rally. But traders need to keep their eyes on the fundamental ball so herd sentiment doesn’t mislead them. The juniors’ recent Q4 results proved quite strong.
Four times a year publicly-traded companies release treasure troves of valuable information in the form of quarterly reports. Required by securities regulators, these quarterly results are exceedingly important for investors and speculators. They dispel all the sentimental distortions surrounding prevailing stock-price levels, revealing the underlying hard fundamental realities. That serves to re-anchor perceptions.
Normally quarterlies are due 45 calendar days after quarter-ends, in the form of 10-Qs required by the SEC for American companies. But after the final quarter of fiscal years, which are calendar years for most gold miners, that deadline extends out up to 90 days depending on company size. The 10-K annual reports required once a year are bigger, more complex, and need fully-audited numbers unlike 10-Qs.
So it takes companies more time to prepare full-year financials and then get them audited by CPAs right in the heart of their busy season. The additional delay in releasing Q4 results is certainly frustrating, as that data is getting stale approaching the end of Q1. Compounding the irritation, some gold miners don’t actually break out Q4 separately. Instead they only report full-year results, lumping in and obscuring Q4.
I always wonder what gold miners that don’t report full Q4 results are trying to hide. Some Q4 numbers can be inferred by comparing full-year results to the prior three quarterlies, but others aren’t knowable if not specifically disclosed. While most gold miners report their Q4 and/or full-year results by 7 to 9 weeks after year-ends, some drag their feet and push that 13-week limit. That’s very disrespectful to investors.
All this unfortunately makes Q4 results the hardest to analyze out of all quarterlies. But delving into them is still well worth the challenge. There’s no better fundamental data available to gold-stock investors and speculators than quarterly results, so they can’t be ignored. They offer a very valuable true snapshot of what’s really going on, shattering all the misconceptions bred by the ever-shifting winds of sentiment.
The definitive list of elite junior gold stocks to analyze comes from the world’s most-popular junior-gold-stock investment vehicle. This week the GDXJ VanEck Vectors Junior Gold Miners ETF reported $4.5b in net assets. Among all gold-stock ETFs, that was second only to GDX’s $7.9b. That is GDXJ’s big-brother ETF that includes larger major gold miners. GDXJ’s popularity testifies to the great allure of juniors.
Unfortunately this fame created major problems for GDXJ over the past couple years, severely hobbling its usefulness to investors. This ETF is quite literally the victim of its own success. GDXJ grew so large in the first half of 2016 as gold stocks soared in a massive upleg that it risked running afoul of Canadian securities laws. And most of the world’s smaller gold miners and explorers trade on Canadian stock exchanges.
Since Canada is the center of the junior-gold universe, any ETF seeking to own this sector will have to be heavily invested there. But once any investor including an ETF buys up a 20%+ stake in any Canadian stock, it is legally deemed to be a takeover offer that must be extended to all shareholders! As capital flooded into GDXJ in 2016 to gain junior-gold exposure, its ownership in smaller components soared near 20%.
Obviously hundreds of thousands of investors buying shares in an ETF have no intention of taking over gold-mining companies, no matter how big their collective stakes. That’s a totally-different scenario than a single corporate investor buying 20%+. GDXJ’s managers should’ve lobbied Canadian regulators and lawmakers to exempt ETFs from that 20% takeover rule. But instead they chose an inferior, easier solution.
Since GDXJ’s issuer controls the junior-gold-stock index underlying its ETF, it simply chose to unilaterally redefine what junior gold miners are. It rejiggered its index to fill GDXJ’s ranks with larger intermediate gold miners, while greatly demoting true smaller junior gold miners in terms of their ETF weightings. This controversial move defying many decades of convention was done stealthily behind the scenes to avoid outrage.
There’s no formal definition of a junior gold miner, which gives cover to GDXJ’s managers pushing the limits. Major gold miners are generally those that produce over 1m ounces of gold annually. For decades juniors were considered to be sub-200k-ounce producers. So 300k ounces per year is a very-generous threshold. Anything between 300k to 1m ounces annually is in the mid-tier realm, where GDXJ now traffics.
That high 300k-ounce-per-year junior cutoff translates into 75k ounces per quarter. Following the end of the gold miners’ Q4’17 earnings season in late March, I dug into the top 34 GDXJ components. That’s just an arbitrary number that fits neatly into the tables below. Although GDXJ included a staggering 73 component stocks in late March, the top 34 accounted for a commanding 80.5% of its total weighting.
Out of these top-34 GDXJ companies, only 4 primary gold miners met that sub-75k-ounces-per-quarter qualification to be a junior gold miner! Their quarterly production is highlighted in blue below, and they collectively accounted for just 8.1% of GDXJ’s total weighting. But even that is really overstated, as half of these are long-time traditional major silver miners that have started diversifying into gold in recent years.
GDXJ is inarguably now a pure mid-tier gold-miner ETF. That would be great if GDXJ was advertised as such. But it’s very misleading if investors still believe this dominant “Junior Gold Miners ETF” still gives exposure to junior gold miners. I suspect the vast majority of GDXJ shareholders have no idea just how radically its holdings have changed since early 2016, and how much it has strayed from its original mission.
I’ve been doing these deep quarterly dives into GDXJ’s top components for years now. In Q4’17, fully 31 of the top-34 GDXJ components were also GDX components! These ETFs are separate, a “Gold Miners ETF” and a “Junior Gold Miners ETF”. So there’s no reason for them to own many of the same companies. In the tables below I highlighted the rare GDXJ components not also in GDX in yellow in the weightings column.
These 31 GDX components accounted for 76.7% of GDXJ’s total weighting, not just its top 34. They also represented 32.2% of GDX’s total weighting. So over 3/4ths of the junior gold miners’ ETF is made up of nearly a third of the major gold miners’ ETF! These GDXJ components in GDX start at the 12th-highest weighting in that latter larger ETF and extend down to 44th. Do investors know GDXJ is mostly GDX gold stocks?
Fully 11 of GDXJ’s top 17 components weren’t even in this ETF a year ago in Q4’16. They alone now account for 36.6% of its total weighting. 16 of the top 34 are new, or 43.8% of the total. In the tables below, I highlighted the symbols of companies that weren’t in GDXJ a year ago in light blue. GDXJ has changed radically, and analyzing its top components’ Q4’17 results largely devoid of real juniors is frustrating.
Nevertheless, GDXJ remains the leading “junior-gold” benchmark. So every quarter I wade through tons of data from its top components’ 10-Qs or 10-Ks, and dump it into a big spreadsheet for analysis. The highlights made it into these tables. Blank fields mean a company did not report that data for Q4’17 as of this Wednesday. Companies have wide variations in reporting styles, data presented, and report timing.
In these tables the first couple columns show each GDXJ component’s symbol and weighting within this ETF as of this week. While many of these gold stocks trade in the States, not all of them do. So if you can’t find one of these symbols, it’s a listing from a company’s primary foreign stock exchange. That’s followed by each company’s Q4’17 gold production in ounces, which is mostly reported in pure-gold terms.
Many gold miners also produce byproduct metals like silver and copper. These are valuable, as they are sold to offset some of the considerable costs of gold mining. Some companies report their quarterly gold production including silver, a construct called gold-equivalent ounces. I only included GEOs if no pure-gold numbers were reported. That’s followed by production’s absolute year-over-year change from Q4’16.
Next comes the most-important fundamental data for gold miners, cash costs and all-in sustaining costs per ounce mined. The latter determines their profitability and hence ultimately stock prices. Those are also followed by YoY changes. Finally the YoY changes in cash flows generated from operations, GAAP profits, revenues, and cash on balance sheets are listed. There are a couple exceptions to these YoY changes.
Percentage changes aren’t relevant or meaningful if data shifted from positive to negative or vice versa, or if derived from two negative numbers. So in those cases I included raw underlying numbers instead of weird or misleading percentage changes. This whole dataset offers a fantastic high-level read on how the mid-tier gold miners are faring today as an industry. Contrary to their low stock prices, they’re doing quite well.
After spending days digesting these GDXJ gold miners’ latest quarterly reports, it’s fully apparent their vexing low consolidation over the past year isn’t fundamentally righteous at all! Traders have abandoned this sector because the allure of the levitating general stock markets has eclipsed gold. That has left gold stocks exceedingly undervalued, truly the best fundamental bargains out there in all the stock markets!
Once again the light-blue-highlighted symbols are new top-34 GDXJ components that weren’t included a year ago in Q4’16. And the meager yellow-highlighted weightings are the only stocks that were not also GDX components in late March! GDXJ is increasingly a GDX clone that offers little if any real exposure to true juniors’ epic upside potential during gold bulls. Sadly this ETF has become a shadow of its former self.
VanEck owns and manages GDX, GDXJ, and the MVIS indexing company that decides exactly which gold stocks are included in each. With one company in total control, GDX and GDXJ should have zero overlap in underlying companies! GDX or GDXJ inclusion should be mutually-exclusive based on the sizes of individual miners. That would make both GDX and GDXJ much more targeted and useful for investors.
VanEck could greatly increase the utility and thus ultimate success of both GDX and GDXJ by starting with one combined list of the world’s better gold miners. Then it could take the top 20 or 25 in terms of annual gold production and assign them to GDX. That would run down near 150k or 105k ounces of quarterly production based on Q4’17 data. Then the next-largest 30 or 40 gold miners could be assigned to GDXJ.
The worst part of GDXJ now including mid-tier gold miners instead of real juniors is the latter are being relentlessly starved of capital. As investment capital flows into ETFs, they have to buy shares in their underlying component companies. That naturally bids their stock prices higher. But in GDXJ’s case, the capital investors intend to use to buy juniors is being stealthily diverted into much-larger mid-tier gold miners.
While there are still some juniors way down the list in GDXJ’s rankings, they collectively make up about 20% of this ETF’s weighting at best. Junior gold miners rely heavily on issuing shares to finance their exploration projects and mine builds. But when their stock prices are down in the dumps because no one is buying them, that is heavily dilutive. GDXJ is effectively strangling the very industry its investors want to own!
Since gold miners are in the business of wresting gold from the bowels of the Earth, production is the best place to start. These top-34 GDXJ gold miners collectively produced 4193k ounces in Q4’17. That rocketed 87% higher YoY, but that comparison is meaningless given the radical changes in this ETF’s composition since Q4’16. On the bright side, GDXJ’s miners do still remain much smaller than GDX’s.
GDX’s top 34 components, fully 19 of which are also top-34 GDXJ components, collectively produced 10,337k ounces of gold in Q4. So GDXJ components’ average quarterly gold production of 140k ounces excluding explorers was 57% lower than GDX components’ 323k average. In spite of GDXJ’s very-misleading “Junior” name, it definitely has smaller gold miners even if they’re way above that 75k junior threshold.
Despite GDXJ’s top 34 components looking way different from a year ago, these current gold miners are generally faring well on the crucial production front. 17 of these mid-tier gold miners enjoyed big average production growth of 30% YoY! Overall average growth excluding explorers was 12.2% YoY, which is far better than world mine production which slumped 1.7% lower YoY in Q4’17 according to the World Gold Council.
These elite GDXJ mid-tier gold miners are really thriving, with production growth way outpacing their industry. That will richly reward investors as sentiment normalizes. Smaller mid-tier gold miners able to grow production are the sweet spot for stock-price upside potential. With market capitalizations much lower than major gold miners, investment capital inflows are relatively larger which bids up stock prices faster.
With today’s set of top-34 GDXJ gold miners achieving such impressive production growth, their costs per ounce should’ve declined proportionally. Higher production yields more gold to spread mining’s big fixed costs across. And lower per-ounce costs naturally lead to higher profits. So production growth is highly sought after by gold-stock investors, with companies able to achieve it commanding premium prices.
There are two major ways to measure gold-mining costs, classic cash costs per ounce and the superior all-in sustaining costs per ounce. Both are useful metrics. Cash costs are the acid test of gold-miner survivability in lower-gold-price environments, revealing the worst-case gold levels necessary to keep the mines running. All-in sustaining costs show where gold needs to trade to maintain current mining tempos indefinitely.
Cash costs naturally encompass all cash expenses necessary to produce each ounce of gold, including all direct production costs, mine-level administration, smelting, refining, transport, regulatory, royalty, and tax expenses. In Q4’17, these top-34 GDXJ-component gold miners that reported cash costs averaged just $618 per ounce. That was actually up a slight 0.5% YoY, so the higher production failed to force costs lower.
This was still quite impressive, as the mid-tier gold miners’ cash costs were only a little higher than the GDX majors’ $600. That’s despite the mid-tiers each operating fewer gold mines and thus having fewer opportunities to realize cost efficiencies. Traders must recognize these mid-sized gold miners are in zero fundamental peril as long as prevailing gold prices remain well above cash costs. And $618 gold ain’t happening!
Way more important than cash costs are the far-superior all-in sustaining costs. They were introduced by the World Gold Council in June 2013 to give investors a much-better understanding of what it really costs to maintain gold mines as ongoing concerns. AISC include all direct cash costs, but then add on everything else that is necessary to maintain and replenish operations at current gold-production levels.
These additional expenses include exploration for new gold to mine to replace depleting deposits, mine-development and construction expenses, remediation, and mine reclamation. They also include the corporate-level administration expenses necessary to oversee gold mines. All-in sustaining costs are the most-important gold-mining cost metric by far for investors, revealing gold miners’ true operating profitability.
In Q4’17, these top-34 GDXJ components reporting AISCs averaged just $855 per ounce. That only rose 0.1% YoY, effectively dead flat, despite the new mix of GDXJ components. That also compares very favorably with the GDX majors, which saw nearly-identical average AISCs at $858 in Q4. The mid-tier gold miners’ low costs prove they are faring far better fundamentally today than their low stock prices imply.
All-in sustaining costs are effectively this industry’s breakeven level. As long as gold stays above $855 per ounce, it remains profitable to mine. At Q4’s average gold price of $1276, these top GDXJ gold miners were earning big average profits of $421 per ounce last quarter! That equates to fat profit margins of 33%, levels most industries would kill for. The mid-tier gold miners aren’t getting credit for that today.
Unfortunately given its largely-junior-less composition, GDXJ remains the leading benchmark for junior gold miners. In Q4’17, this ETF averaged $32.62 per share. That was down a considerable 10.2% from Q4’16’s average of $36.34. Investors have largely abandoned gold miners because they are captivated by the extreme taxphoria stock-market rally since the election. Yet gold-mining profits certainly didn’t justify this.
A year ago in Q4’16, the top-34 GDXJ components at that time also reported average all-in sustaining costs of $855 per ounce. With gold averaging $1218 then which was 4.6% lower, that implies the mid-tier gold miners were running operating profits of $363 per ounce. Thus Q4’17’s $421 surged 16.0% YoY, a heck of a jump! Yet the mid-tier gold miners’ stock prices irrationally slumped substantially lower.
Gold miners offer such compelling investment opportunities because of their inherent profits leverage to gold. Gold-mining costs are largely fixed during mine-planning stages, when engineers and geologists decide which ore to mine, how to dig to it, and how to process it. The actual mining generally requires the same levels of infrastructure, equipment, and employees quarter after quarter regardless of gold prices.
With gold-mining costs essentially fixed, higher or lower gold prices flow directly through to the bottom line in amplified fashion. This really happened in GDXJ over the past year despite its radical changes in composition. A 4.8% gold rally in quarterly-average terms catapulted operating profits 16.0% higher, or 3.3x. That’s right in line with the typical leverage of gold-mining profits to gold prices of several times or so.
But this strong profitability sure isn’t being reflected in gold-stock prices. GDXJ shouldn’t have been lower in Q4’17 with mining profits much higher. The vast fundamental disconnect in gold-stock prices today is absurd, and can’t last forever. Sooner or later investors will rush into the left-for-dead gold stocks to bid their prices far higher. This bearish-sentiment-driven anomaly has grown more extreme in 2018.
Since gold-mining costs don’t change much quarter-to-quarter regardless of prevailing gold prices, it’s reasonable to assume the top GDXJ miners’ AISCs will largely hold steady in the current Q1’18. And it’s been a strong quarter for gold so far, with it averaging over $1328 quarter-to-date. If the mid-tier gold miners’ AISCs hold near $855, that implies their operating profits are now running way up near $473 per ounce.
That would make for a massive 12.4% QoQ jump in earnings for the mid-tier gold miners in this current quarter! Yet so far in Q1 GDXJ is languishing at an average of just $32.88, flat lined from Q4 where gold prices and mining profits were considerably lower. The mid-tier gold miners’ stocks can’t trade as if their profits don’t matter forever, so an enormous mean-reversion rally higher is inevitable sometime soon.
And that assumes gold prices merely hold steady, which is unlikely. After years of relentlessly-levitating stock markets thanks to extreme central-bank easing, radical gold underinvestment reigns today. As the wildly-overvalued stock markets inescapably sell off on unprecedented central-bank tightening this year, gold investment will really return to favor. That portends super-bullish-for-miners higher gold prices ahead.
The impact of higher gold prices on mid-tier-gold-miner profitability is easy to model. Assuming flat all-in sustaining costs at Q4’17’s $855 per ounce, 10%, 20%, and 30% gold rallies from this week’s levels would lead to collective gold-mining profits surging 45%, 77%, and 108%! And another 30% gold upleg isn’t a stretch at all. In the first half of 2016 alone after the previous stock-market correction, gold soared 29.9%.
GDXJ skyrocketed 202.5% higher in 7.0 months in largely that same span! Gold-mining profits and thus gold-stock prices surge dramatically when gold is powering higher. Years of neglect from investors have forced the gold miners to get lean and efficient, which will really amplify their fundamental upside during the next major gold upleg. The investors and speculators who buy in early and cheap could earn fortunes.
Given the radical changes in GDXJ’s composition over the past year, normal year-over-year comparisons in key financial results simply aren’t meaningful. The massive rejiggering of the index underlying GDXJ didn’t happen until Q2’17, so it will be a couple quarters yet until results finally grow comparable again. But in the meantime, here are the apples-to-oranges reads on the GDXJ components’ key financial results.
The cash flows generated from operations by these top-34 GDX components rocketed 104.5% higher YoY to $1743m. That helped boost their collective cash balances by 53.9% YoY to $6577m. Sales were up 102.6% YoY to $4282m, roughly in line with the 87.4% gold-production growth. But again GDXJ was way different a year ago, so this impressive growth merely reflects bigger mid-tier gold miners replacing true juniors.
As long as OCFs remain massively positive, the gold mines are generating much more cash than they cost to run. That gives the gold miners the capital necessary to expand existing operations and buy new deposits and mines. Given how ridiculously low gold-stock prices are today, you’d think the gold miners are hemorrhaging cash like crazy. But the opposite is true, showing how silly this bearish herd sentiment is.
Unfortunately the GAAP earnings picture looked vastly worse. These top-34 GDXJ gold miners reporting Q4 earnings collectively lost $317m, compared to a minor $2m profit in Q4’16. While that certainly looks like a disaster, it’s heavily skewed. Excluding 3 big mid-tier gold miners that reported huge losses in Q4, the other 11 of these top GDXJ gold miners reporting earnings actually earned an impressive $212m in profits.
Yamana Gold, New Gold, and Endeavour Mining suffered huge $200m, $196m, and $134m losses in Q4’17. In each case these resulted from large impairment charges. As mines are dug deeper and gold prices change, the economics of producing this metal change too. That leaves some of the mid-tier gold miners’ individual mines worth less going forward than the amount of capital invested to develop them.
So they are written off, resulting in big charges flushed through income statements that mask operating profits. But these writedowns are something of an accounting fiction, non-cash expenses not reflective of current operations. They are mostly isolated one-time events as well, not representing earnings trends. As gold continues to march higher in its young bull, impairment charges will vanish as mining economics improve.
So overall the mid-tier gold miners’ fundamentals looked quite strong in Q4’17, a stark contrast to the miserable sentiment plaguing this sector. Gold stocks’ vexing consolidation over the past year or so isn’t the result of operational struggles, but purely bearish psychology. That will soon shift as stock markets inevitably roll over and gold surges, making the beaten-down gold stocks a coiled spring overdue to soar dramatically.
Given GDXJ now diverting most of its capital inflows into larger mid-tier gold miners that definitely aren’t juniors, you won’t find sufficient junior-gold exposure in this now-mislabeled ETF. Instead traders should prudently deploy capital in the better individual mid-tier and junior gold miners’ stocks with superior fundamentals. Their upside is vast, and would trounce GDXJ’s even if it was still working as advertised.
At Zeal we’ve literally spent tens of thousands of hours researching individual gold stocks and markets, so we can better decide what to trade and when. As of the end of Q4, this has resulted in 983 stock trades recommended in real-time to our newsletter subscribers since 2001. Fighting the crowd to buy low and sell high is very profitable, as all these trades averaged stellar annualized realized gains of +20.2%!
The key to this success is staying informed and being contrarian. That means buying low before others figure it out, before undervalued gold stocks soar much higher. An easy way to keep abreast is through our acclaimed weekly and monthly newsletters. They draw on my vast experience, knowledge, wisdom, and ongoing research to explain what’s going on in the markets, why, and how to trade them with specific stocks. For only $12 per issue, you can learn to think, trade, and thrive like contrarians. Subscribe today, and get deployed in the great gold and silver stocks in our full trading books!
The bottom line is the mid-tier gold miners now dominating GDXJ enjoyed strong fundamentals in their recently-reported Q4 results. While GDXJ’s radical composition changes since last year muddy annual comparisons, today’s components mined lots more gold at dead-flat costs. These miners continued to earn fat operating profits while generating strong cash flows. Sooner or later stock prices must reflect fundamentals.
As gold itself continues mean reverting higher, these mid-tier gold miners will see their profits soar due to their big inherent leverage to gold. GDXJ now offers excellent exposure to mid-tier gold miners, which will see gains well outpacing the majors. All it will take to ignite gold stocks’ overdue mean-reversion rally is gold investment demand returning. The resulting higher gold prices will attract investors back to gold miners.
The discount of gem-quality lab-created diamonds, manufactured for use in jewelry, relative to natural diamonds has doubled from 11-20% a year ago to 28-40% today, according to a survey of prices.
For example, a white, 1-carat round diamond that is VS (very-slightly included) in clarity, F-H (near-colorless to colorless) in color, VG-ideal cut, with no-to-low florescence was selling for approximately $4,850 in March 2017 but is now $4,350 in March 2018, a 10% decline.
However, over the same period of time the price of an equivalent natural diamond went from $5,850 to $6,150, representing about a 5% increase. Thus, the discount of the lab-created diamond relative to the natural equivalent was approximately a 17% in March 2017, but is now about 29%, a 71% year-over-year increase.
See table below for more examples:
Lab-created diamonds are becoming less expensive relative to natural equivalents as investment in lab-diamond production technology has rapidly improved production economics in just the last few years. This has led to rapid relative supply growth and an environment that is more price competitive for lab-diamond manufacturers.
However, actually gauging lab-diamond supply growth is difficult. The global proliferation of lab-diamond production facilities in recent years, from China to Russia to the U.S., has made tracking production figures challenging, especially given that the companies involved are private and proprietary in nature. Further complicating the process is the range in quality and scale at which lab-diamonds are being produced.
Natural diamond production quality can be segmented as approximately 40% gem-quality, 20% near-gem-quality, and 40% industrial-grade. Gem-diamonds are used in jewelry, industrial-grade diamonds are used for abrasive and other industrial application, and near-gem diamonds are used for both jewelry and more-specialized industrial application, with the split of use dependent on market prices and demand.
Small parcels of near-gem-quality lab-created diamonds manufactured in China. Image source: Paul Zimnisky
It is important to note that natural industrial-grade diamonds are simply seen as a by-product, as the presence of gem-quality diamonds in a deposit are what drive the economics behind natural diamond production decisions.
In the case of lab-diamonds, the ability to create higher-quality gem-diamond product economically is a relatively recent development –within the last decade. Even with the recent developments in technology, current lab-created production of true gem-diamonds only represents <10% of global output, estimated at <5M carats, which compares to natural gem-quality output of ~60M carats (based on 40% of an estimated total natural production of 147M carats in 2018).
The business of manufacturing lab-created diamonds for industrial application (typically referred to as synthetic diamond) has been around for decades, and the industry currently supplies >99% of global industrial diamond supply for use as abrasives (production is in the billions-of-carats for context).
Lab-production of near-gem-quality diamonds is where supply analysis gets especially challenging. Producers of synthetic industrial-quality diamonds have been advancing their production capability through improved technology which has enabled them to increase the quality of their product from industrial to near-gem quality. Given that billions-of-carats of industrial-quality diamonds are produced each year, it becomes apparent that lab-created near-gem production could be in the hundreds-of-millions of carats; and some of this product is being passed off for use in jewelry –which is primarily used to embellish larger-stones and for use in pavé settings.
The natural diamond industry has been proactively developing affordable screening technology so that lab-created diamonds of all quality and sizes used in jewelry can be properly disclosed and sold as such.
Parcels of natural diamonds produced in Russia and Canada. Image source: Paul Zimnisky
As lab-diamond production continues to accelerate, it seems inevitable that the price spread between lab-created and natural diamonds across all sizes and qualities will continue to widen, especially in the case of generic lab-diamonds, those that are not supported by a manufacturer or retailer’s brand.
Medium-to-longer-term expect the dialog surrounding lab-created diamonds to shift from jewelry to application in high-tech developments such as processing chips, optics, laser devices, and thermal conductivity equipment. The unique properties of diamond make the application potential exciting and wide, and the scientific and tech community has just begun to scratch the surface of its potential.
The high-tech industry enthusiastically awaits economically available mass-produced high-quality diamond, the lab-diamond manufacturers know this and most are just using jewelry as a stepping stone.
It’s very important for gold, bond, and stock market investors to stay focused on the main fundamental price drivers and ignore what may feel exciting but is largely irrelevant to price discovery. Citizen demand from China/India and US central bank policy are the main price drivers for gold.
From 1960 to 1980, US recessions were generally inflationary, and the Fed raised rates during that period. Since then, recessions have carried a deflationary theme, and interest rates have fallen.
In 2013 I began suggesting that the Fed was going to end its deflationary QE and rate cutting programs. A new era of rate hikes and quantitative tightening would begin, resulting once again in inflationary US recessions.
I’ll dare to suggest that America is now poised to experience its first inflationary recession in almost three decades. Importantly, this is happening while Chinese and Indian citizen demand for gold is beginning to rise after a multi-year lull.
Ben Bernanke created enormous Main Street deflation with his QE and rate cutting policy. He incentivized corporations to engage in massive stock buyback programs while the Fed itself used printed money to buy government bonds. Small bank regulation made it unprofitable to make loans to small business. Main Street deflated, the labour force participation rate collapsed, and financial assets soared.
Please click here now. Double-click to enlarge this important labour force chart.
I’ve described Janet Yellen as the “Great Transitionist”. She tapered QE to zero as I predicted she would and began modest rate hikes. It’s clear that the US labour force participation rate bottomed during her tenure as Fed chair.
Jay “Mr. Hyde” Powell is poised to take her policy to the next level, and launch aggressive QT (quantitative tightening) and rate hikes, and the first of at least eight rate hikes should come tomorrow!
Wage inflation is poised to surge as the participation rate breaks out to the upside. Unfortunately, because Janet moved so slowly with her rate hikes, this wage inflation is going to occur as the US business cycle rolls over, creating an inflationary recession.
What does this mean for gold investors? Well, I think a celebratory drum roll is what it means! That’s because nothing is more positive for gold stocks than a long period of stagflation.
Against a background of a major resurgence in Chindian citizen demand for gold with stagnant mine supply (except for Russian and Canadian mines), a true “bull era” for gold, silver, and companies involved in all facets of the metals business is born!
Please click here now. Double-click to enlarge this Dow chart. I chart sixty major US stocks, including all thirty Dow Jones Industrials Average component stocks. What I’m seeing is a major breakdown in the health of the market. The market is being carried by fewer and fewer stocks.
QT and rate hikes are sucking the life out of the market, and I’ve wondered aloud if Jay Powell’s words to stock market investors should be,“Sell in May, or get blown away by Jay!” The bottom line is that Mr. US Stock Market will have his first meeting with Mr. Hyde tomorrow, and I doubt it goes well for Mr. Market.
The meltdown in breadth doesn’t mean the US bull market in stocks is finished right now, but with the US bond bull market already slain by QT and rate hikes, it’s just a matter of time before Jay Powell pulls the US stock market’s life support plug. I’ve repeatedly told my subscribers that when investment decisions are made, forget about Trump, and focus on the Fed. Simply put, focus on the Fed, or wind up financially dead!
Investors need to think outside the stock and bond market box to prosper in an inflationary recession. On that note, please click here now. I wasn’t the earliest bitcoin investor, but I certainly was an aggressive bitcoin accumulator in the sub $500 zone.
Bitcoin currently trades at about $8000. After establishing a core position with an average price of about $200, I’m obviously thrilled to be sitting in “forty bagger” mode today. Blockchain enthusiasts who enjoy this type of sustained wealth building fun can join me at mywww.gublockchain.com website.
It’s important for all investors to understand that at about $20,000 a coin, bitcoin threatened to steal thunder from mainstream media’s darling Dow Jones Industrial Average. An enormous regulatory drive was promptly launched in conjunction with the launch of five-coin bitcoin futures. An expected price correction was created by the regulators. These regulators don’t help investors. They just help themselves by getting salaries to perform useless tasks. Regardless, markets tend to be “here to stay” once these pencil pushers get involved. The bottom line is that regulation lets institutional investors embrace the asset class, and that’s happening now.
Of great interest to me is the major double bottom that is forming now on the daily bitcoin chart. Importantly, there’s a huge volume spike on the first decline to my $8000 – $5000 buy zone. Volume is low on the second decline to that same $8000 – $5000 area. The volume pattern and the time frame of one to two months between the bottoms is classic “Edwards & Magee” technical action!
Tom “Mr. Bitcoin” Lee (Ex head of US equities for JP Morgan) just issued a fresh bitcoin target of $90,000 by 2020. That’s possible, albeit aggressive. My intermediate term target of $34,000 is more moderate, more likely to happen, and still a superb gain from current price levels.
In a stagflationary environment like the one beginning now, bitcoin and precious metals are mostly likely to earn the title, “assets of champions”. Please click here now. It’s very important for gold investors to stay focused on the US central bank, India, and China. Hallmarking and the new spot exchange in India are just two very positive long term drivers of higher gold prices. A “Gold Board” will be launched soon. This board could ultimately have the power to determine the gold import duty rate and other key policy that affects the global gold price.
My Chinese jewellery stocks that I cover at www.gracelandjuniors.com are soaring higher as Chinese citizen gold buying is accelerating. Australian miners are also doing reasonably well. Investors in most individual GDX and GDXJ component stocks and the “raw juniors” need the patience to wait for US wage inflation and more progress in the Chindian gold markets. Then they can sink their teeth into the glory of new highs across the board for these stocks. It’s going to happen, but realism and patience are required. The seeds of inflation are being sown now. It’s not realistic to demand those seeds become jack in the beanstalk trees too quickly.
Please click here now. Double-click to enlarge this impressive daily gold chart. With “Jay Day” (FOMC decision day) tomorrow, gold is performing admirably in its post Chinese New Year trading. It’s making a beeline towards my $1300 Jay Day target zone. I expect statements from Jay Powell to set the stage for a move above the ultra-important $1370 area resistance zone. That should usher in substantial buying from Chinese citizens who have been quiet for the past few years.
Most gold investors are not focused enough on buying their favourite gold stocks in the current $21 buy zone for GDX. Instead they are trying to guess when a big parabolic price rise will occur. That type of price action starts at the end of an inflationary period, not the beginning of it. I will say that I’m particularly excited to see substantial insider buying take place now at major gold mining companies. These company directors obviously see the current time as one for major gold stock accumulation. I’ll dare to suggest gold bugs around the world need to follow that lead!
Stewart Thomson is no longer an investment advisor. The information provided by Stewart and Graceland Updates is for general information purposes only. Before taking any action on any investment, it is imperative that you consult with multiple properly licensed, experienced and qualified investment advisors and get numerous opinions before taking any action. Your minimum risk on any investment in the world is: 100% loss of all your money. You may be taking or preparing to take leveraged positions in investments and not know it, exposing yourself to unlimited risks. This is highly concerning if you are an investor in any derivatives products. There is an approx $700 trillion OTC Derivatives Iceberg with a tiny portion written off officially. The bottom line:
Are You Prepared?
ORENINC INDEX – Monday, March 19th 2018
Last week index score: 26.73
This week: 40.03
Prospero Silver (TSXV:PSL) discovered a new gold & silver-bearing epithermal vein system during a three-hole drill program at the Pachuca SE project in Hidalgo, Mexico.
Avrupa Minerals (TSXV:AVU) said its C$500,000 private placement financing is fully subscribed.
The Oreninc Index surged in the week ending March 16th, 2018, with the index increasing to 40.03 from 26.73 a week ago as financings, particularly brokered deals, began flowing again.
Despite strong fundamentals for precious and base metals, stocks continue to chart with insouciance. Certainly, cryptocurrencies and marijuana stocks have occupied some of the investor attention that would formerly have been doted on them.
A relatively quiet week on the geopolitical front, with a diplomatic spat arising between the UK and Russia over the poisoning of a former spy and his daughter in the UK. The UK has expelled Russian diplomats and Russia has returned the favour.
Gold experienced rolling punches throughout the week as rising inflation in the US could transpose into multiple interest rate rises throughout the year. The US CPI Index rose 0.2% in February following from a 0.5% increase in January, higher than expectations. Whilst a 25-basis point interest rate increase is widely expected at the Federal Reserve monetary policy meeting this week all ears will be on the tone of its comments about the potential for additional rises later this year.
On to the money: total fund raises announced increased to C$85.6 million, a two-week high, which included seven brokered financing for C$25.3m, a two-week high, and two bought-deal financings for C$15.7 million, a two-week low. The average offer size more than doubled to C$2.6 million, a two-week high.
A less volatile but deflationary week for gold saw the yellow metal close down at US$1,314/oz from US$1,323/oz a week ago. The van Eck managed GDXJ alsoclosed down slightly at US$31.41 from US$31.72 last week. The index is down 7.97% so far in 2018. The US Global Go Gold ETF fared slightly better to close up on the week at US$12.44 from US$12.43 a week ago. It is down 4.37% so far in 2018. The HUI Arca Gold BUGS Index continued to fall and closed down at 171.16 from 172.92 last week. This index features 15 companies involved in gold mining and is an indication of how well gold companies perform relating to the gold price. The SPDR GLD ETF saw gains in the week to close at 840.22 tonnes from 833.73 tonnes a week ago.
In other commodities, the silver sell-off continued as it closed down at US$16.33/oz from US$16.58/oz a week ago. Copper also had a negative week and closed slightly down at US$3.10/lb from US$3.13/lb last week. Meanwhile, oil closed slightly up at US$62.34 a barrel from US$62.04 a barrel a week ago.
The Dow Jones Industrial Average pulled back in the week to close down at 24,946 from 25,335 last week. Conversely, Canada’s S&P/TSX Composite Index closed up at 15,711 from 15,577 the previous week. The S&P/TSX Venture Composite Index also put in gains and closed at 833.67 from 828.90 last week.
Summary:
Number of financings tripled to 33, a six-week high.
Seven brokered financings were announced this week for C$25.3m, a two-week high.
Two bought-deal financings were announced this week for C$15.7m, a two-week high.
Total dollars shot up to C$85.6m, a two-week high.
Average offer size more than doubled to C$2.6m, a two-week high.
Financing Highlights
International Tower Hill Mines (TSX:ITH) opened a C$15.6 million offering on a best efforts basis.
Non-brokered private placement of 24.0 million shares @ US $0.50 per share for aggregate gross proceeds of US$12 million (C$15.6 million).
Proceeds to be used for the continuation of optimization studies in efforts to further improve and de-risk the Livengood gold project, required environmental baseline studies and general working capital purposes.
New strategic investor Electrum Strategic Opportunities Fund acquired 19.9 million shares (10.7%). Paulson & Co acquired 4.1 million shares to increase its ownership to 32.0%.
Major Financing Openings:
International Tower Hill Mines (TSX:ITH) opened a C$15.6 million offering on a best efforts basis.
Auryn Resources (TSXV:AUG) opened a C$8.76 million offering underwritten by a syndicate led by Cantor Fitzgerald Canada on a bought deal basis. The deal is expected to close on or about March 23rd.
Tinka Resources (TSXV:TK) opened a C$7.01 million offering underwritten by a syndicate led by GMP Securities on a bought deal basis. Each unit includes half a warrant that expires in 12 months. The deal is expected to close on or about April 4th.
Tinka Resources (TSXV:TK) opened a C$6 million offering on a best efforts basis.
Major Financing Closings:
Millennial Lithium (TSXV:ML) closed a C$24.15 million offering underwritten by a syndicate led by Canaccord Genuity on a bought deal basis. Each unit included half a warrant that expires in 24 months.
International Tower Hill Mines (TSX:ITH) closed a C$15.6 million offering on a best efforts basis.
Millennial Lithium (TSXV:ML) closed a C$6.38 million offering on a strategic deal basis. Each unit included half a warrant that expires in 24 months.
Stina Resources (TSXV:SQA) closed a C$3 million offering on a best efforts basis.
Company News
Prospero Silver (TSXV:PSL) discovered a new gold & silver-bearing epithermal vein system during a three-hole drill program at the Pachuca SE project in Hidalgo, Mexico.
An 1,800m drill program tested three targets with deep, angled holes with intercepts including 1.35m @ 227Ag demonstrating that the negligible Ag and Au anomalies we noted in the surface alteration are related to a potentially significant epithermal vein system at depth.
The Pachuca drilling completes proof of concept drilling of three initial targets funded by Fortuna Silver (TSX:FVI).
Analysis
Prospero cut new vein systems within 25km of one of the world’s great silver-gold districts that produced over 1.2Boz of silver. Hitting multi-ounce and multi-gram silver and gold grades during scout drilling bodes well for future follow-up drilling on the 6-7km of linear, structurally-controlled alteration at surface on its concession. Following completion of the proof-of-concept drilling, Fortuna now has the option to enter into a JV on one of the targets tested.
Avrupa Minerals (TSXV:AVU) said its C$500,000 private placement financing is fully subscribed.
6.25 million units @ C0.08. Each unit is comprised of one share and a warrant exercisable @ C$0.12 for two years.
Proceeds will be used for working capital and exploration in Portugal and Kosovo.
About Oreinc.com:
Oreninc.com is North America’s leading provider of relevant financing information in the junior commodities space. Since 2011, the company has been keeping track of financings in the junior mining as well as oil and gas space. Logging all relevant deal and company information into its proprietary database, called the Oreninc Deal Log, Oreninc quickly became the go-to website in the mining financing space for investors, analysts, fund managers and company executives alike.
The Oreninc Deal Log keeps track of over 1,400 companies, bringing transparency to an otherwise impenetrable jungle of information. The goal is to increase the visibility of transactions and to show financings activity in a digestible format. Through its daily logging activities, Oreninc is in a position to pinpoint momentum changes in the markets, identify which commodities are trending and which projects are currently receiving funding.
The gold miners’ stocks remain deeply out of favor, trading at prices seen when gold was half or even a quarter of current levels. So many traders assume this small contrarian sector must be really struggling fundamentally. But nothing could be farther from the truth! The major gold miners’ recently-released Q4’17 results prove they are thriving. Their languishing stock prices are the result of irrational herd sentiment.
Four times a year publicly-traded companies release treasure troves of valuable information in the form of quarterly reports. Required by securities regulators, these quarterly results are exceedingly important for investors and speculators. They dispel all the sentimental distortions surrounding prevailing stock-price levels, revealing the underlying hard fundamental realities. They serve to re-anchor perceptions.
Normally quarterlies are due 45 calendar days after quarter-ends, in the form of 10-Qs required by the SEC for American companies. But after the final quarter of fiscal years, which are calendar years for most gold miners, that deadline extends out up to 90 days depending on company size. The 10-K annual reports required once a year are bigger, more complex, and need fully-audited numbers unlike 10-Qs.
So it takes companies more time to prepare full-year financials and then get them audited by CPAs right in the heart of their busy season. The additional delay in releasing Q4 results is certainly frustrating, as that data is getting stale approaching the end of Q1. Compounding the irritation, some gold miners don’t actually break out Q4 separately. Instead they only report full-year results, lumping in and obscuring Q4.
I always wonder what gold miners that don’t report full Q4 results are trying to hide. Some Q4 numbers can be inferred by comparing full-year results to the prior three quarterlies, but others aren’t knowable if not specifically disclosed. While most gold miners report their Q4 and/or full-year results by 7 to 9 weeks after year-ends, some drag their feet and push that 13-week limit. That’s very disrespectful to investors.
All this unfortunately makes Q4 results the hardest to analyze out of all quarterlies. But delving into them is still well worth the challenge. There’s no better fundamental data available to gold-stock investors and speculators than quarterly results, so they can’t be ignored. They offer a very valuable true snapshot of what’s really going on, shattering all the misconceptions bred by the ever-shifting winds of sentiment.
The definitive list of major gold-mining stocks to analyze comes from the world’s most-popular gold-stock investment vehicle, the GDX VanEck Vectors Gold Miners ETF. Its composition and performance are similar to the benchmark HUI gold-stock index. GDX utterly dominates this sector, with no meaningful competition. This week GDX’s net assets are 24.4x larger than the next-biggest 1x-long major-gold-miners ETF!
Being included in GDX is the gold standard for gold miners, requiring deep analysis and vetting by elite analysts. And due to ETF investing eclipsing individual-stock investing, major-ETF inclusion is one of the most-important considerations for picking great gold stocks. As the vast pools of fund capital flow into leading ETFs, these ETFs in turn buy shares in their underlying companies bidding their stock prices higher.
This week GDX included a whopping 51 component “Gold Miners”. That term is used somewhat loosely, as this ETF also contains major silver miners, a silver streamer, and gold royalty companies. Still, all the world’s major gold miners are GDX components. Due to time constraints I limited my deep individual-company research to this ETF’s top 34 stocks, an arbitrary number that fits neatly into the tables below.
Collectively GDX’s 34 largest components now account for 90.5% of its total weighting, a commanding sample. GDX’s stocks include major foreign gold miners trading in Australia, Canada, and the UK. Some countries’ regulations require financial reporting in half-year increments instead of quarterly, which limits local gold miners’ Q4 data. But some foreign companies still choose to publish limited quarterly results.
The importance of these top-GDX-component gold miners can’t be overstated. In Q4’17 they collectively produced over 10.3m ounces of gold, or 321.5 metric tons. The World Gold Council’s recently-released Q4 Gold Demand Trends report, the definitive source on worldwide supply-and-demand fundamentals, pegged total global mine production at 833.1t in Q4. GDX’s top 34 miners alone accounted for nearly 4/10ths!
Every quarter I wade through a ton of data from these elite gold miners’ 10-Qs or 10-Ks, and dump it into a big spreadsheet for analysis. The highlights made it into these tables. Blank fields mean a company did not report that data for Q4’17 as of this Wednesday. Naturally companies always try to present their quarterly results in the best-possible light, which leads to wide variations in reporting styles and data offered.
In these tables the first couple columns show each GDX component’s symbol and weighting within this ETF as of this week. While most of these gold stocks trade in the States, not all of them do. So if you can’t find one of these symbols, it’s a listing from a company’s primary foreign stock exchange. That’s followed by each company’s Q4’17 gold production in ounces, which is mostly reported in pure-gold terms.
Many gold miners also produce byproduct metals like silver and copper. These are valuable, as they are sold to offset some of the considerable costs of gold mining. Some companies report their quarterly gold production including silver, a construct called gold-equivalent ounces. I only included GEOs if no pure-gold numbers were reported. That’s followed by production’s absolute year-over-year change from Q4’16.
Next comes the most-important fundamental data for gold miners, cash costs and all-in sustaining costs per ounce mined. The latter determines their profitability and hence ultimately stock prices. Those are also followed by YoY changes. Finally the YoY changes in cash flows generated from operations, GAAP profits, revenues, and cash on balance sheets are listed. There are a couple exceptions to these YoY changes.
Percentage changes aren’t relevant or meaningful if data shifted from positive to negative or vice versa, or if derived from two negative numbers. So in those cases I included raw underlying numbers instead of weird or misleading percentage changes. This whole dataset offers a fantastic high-level read on how the major gold miners are faring today as an industry. And contrary to their low stock prices, they are thriving!
After spending days digesting these elite gold miners’ latest quarterly reports, it’s fully apparent their vexing consolidation over the past year or so isn’t fundamentally-righteous at all! Traders have mostly abandoned this sector because the allure of the levitating general stock markets has eclipsed gold. That has left gold stocks exceedingly undervalued, truly the best fundamental bargains out there in all the stock markets!
Since gold miners are in the business of wresting gold from the bowels of the Earth, production is the best place to start. The 10,337k ounces of gold collectively produced last quarter by these elite major gold miners actually fell a sizable 1.7% YoY! Interestingly that’s right in line with industry trends per the World Gold Council, as overall world gold mine production also retreated that same 1.7% YoY in Q4’17.
These biggest and best gold miners on the planet certainly had every incentive to grow their gold production. The quarterly average gold price surged 4.8% YoY in Q4’17, really boosting profitability. Of course the more gold any miner can produce, the more opportunities it has to expand thanks to higher cash flows. Investors often punish flagging production too, so the major gold miners really hate reporting it.
Most investors won’t bother studying long and detailed 10-Qs, 10-Ks, or the accompanying management discussions and analyses. So gold miners often issue short press releases summarizing some of their quarterly results. These sometimes intentionally mask production declines by excluding year-ago production, looking at quarter-on-quarter performance instead of year-over-year, or only comparing results to guidance.
As a professional speculator, investor, and newsletter writer for nearly two decades now, I spend a huge amount of time analyzing quarterly results. And I remain a CPA after my previous late-1990s gig auditing mining companies for a Big Six firm. Yet even with this exceptional experience and knowledge, I’m still surprised how deeply I have to dig for some key results miners bury and hide in hundred-plus-page-long SEC filings.
So believe me, major gold miners don’t shout out shrinking gold production from the rooftops. Yet of the 32 of these top-34 GDX gold miners reporting Q4 production as of the middle of this week, fully half saw declines. That was even with four different gold miners climbing into GDX’s top 34 components over the past year, which are highlighted in blue above. The average production decline was a serious 9.5% YoY!
Gold deposits economically viable to mine are very rare in the natural world, and the low-hanging fruit has largely been harvested. It is growing ever more expensive to explore for gold, in far-less-hospitable places. Then even after new deposits are discovered, it takes up to a decade to jump through all the Draconian regulatory hoops necessary to secure permitting. And only then can mine construction finally start.
That takes additional years and hundreds of millions if not billions of dollars per gold mine. But because gold-mining stocks have been deeply out of favor most of the time since 2013, capital has been heavily constrained. When banks are bearish on gold prices, they aren’t willing to lend to gold miners except with onerous terms. And when investors aren’t buying gold stocks, issuing new shares low is heavily dilutive.
The large gold miners used to rely heavily on the smaller junior gold miners to explore and replenish the gold-production pipeline. But juniors have been devastated since 2013, starved of capital. Not only are investors completely uninterested with general stock markets levitating, but the rise of ETFs has funneled most investment inflows into a handful of larger-market-cap juniors while the rest see little meaningful buying.
So even the world’s biggest and best gold miners are struggling to grow production. While that isn’t great for those individual miners, it’s super-bullish for gold. The less gold mined, the more gold supply will fail to keep pace with demand. That will result in higher gold prices, making gold mining more profitable in the future. Some analysts even think peak gold has been reached, that mine production will decline indefinitely.
There are strong fundamental arguments in favor of peak-gold theories. But regardless of where overall global gold production heads in coming years, the major gold miners able to grow their own production will fare the best. They’ll attract in relatively-more investor capital, bidding their stocks to premium prices compared to peers who can’t grow production. Stock picking is more important than ever in this ETF world!
But despite slowing gold production, these top-34 GDX-component gold miners remained quite strong fundamentally in Q4! Their viability and profitability are measured by the differences between prevailing gold prices and what it costs to produce that gold. Despite traders’ erroneous perception gold stocks are doomed, rising gold prices and falling mining costs are making the major gold miners much more profitable.
There are two major ways to measure gold-mining costs, classic cash costs per ounce and the superior all-in sustaining costs per ounce. Both are useful metrics. Cash costs are the acid test of gold-miner survivability in lower-gold-price environments, revealing the worst-case gold levels necessary to keep the mines running. All-in sustaining costs show where gold needs to trade to maintain current mining tempos indefinitely.
Cash costs naturally encompass all cash expenses necessary to produce each ounce of gold, including all direct production costs, mine-level administration, smelting, refining, transport, regulatory, royalty, and tax expenses. In Q4’17, these top-34 GDX-component gold miners that reported cash costs averaged just $600 per ounce. That dropped a sizable 4.4% YoY, showing serious gold-miner discipline controlling costs.
Today the gold miners’ stocks are trading at crazy-low prices implying their survivability is in jeopardy. This week the flagship HUI gold-stock index was languishing near 174, despite $1325 gold. The first time the HUI hit 175 in August 2003, gold was only in the $350s! Gold stocks are radically undervalued today by every metric. And they collectively face zero threat of bankruptcies unless gold plummets under $600.
Way more important than cash costs are the far-superior all-in sustaining costs. They were introduced by the World Gold Council in June 2013 to give investors a much-better understanding of what it really costs to maintain gold mines as ongoing concerns. AISC include all direct cash costs, but then add on everything else that is necessary to maintain and replenish operations at current gold-production levels.
These additional expenses include exploration for new gold to mine to replace depleting deposits, mine-development and construction expenses, remediation, and mine reclamation. They also include the corporate-level administration expenses necessary to oversee gold mines. All-in sustaining costs are the most-important gold-mining cost metric by far for investors, revealing gold miners’ true operating profitability.
In Q4’17, these top-34 GDX-component gold miners reporting AISC averaged just $858 per ounce. That was down a significant 2.0% YoY, extending a welcome declining trend. In 2017’s four quarters, these major gold miners’ average AISCs ran $878, $867, $868, and $858. The elite gold miners are getting more efficient at producing their metal, which is definitely impressive considering their collective lower production.
Gold-mining costs are largely fixed during mine-planning stages, when engineers and geologists decide which ore to mine, how to dig to it, and how to process it. The actual mining generally requires the same levels of infrastructure, equipment, and employees quarter after quarter. So the more gold mined, the more ounces to spread those big fixed costs across. Thus production and AISCs are usually negatively correlated.
The major gold miners have to manage costs exceptionally well to drive AISCs lower while production is also slowing. This argues against the popular complaint that gold miners’ managements are doing poor jobs. Because gold-stock prices are so darned low, traders again assume the miners must be plagued with serious fundamental problems. But it’s relentlessly-bearish herd sentiment suppressing gold-stock prices.
These top-34 GDX gold miners are actually earning strong operating profits today. Q4’17’s average gold price ran near $1276, again up 4.8% YoY. That remains far above last quarter’s low average all-in sustaining costs among these major gold miners of $858 per ounce. Thus industry profit margins are way up at $418 per ounce. Most other industries would sell their souls to earn fat profit margins at this 33% level!
A year earlier in Q4’16, the top-34 GDX gold miners reported average AISCs of $875 in a quarter where gold averaged under $1218. That made for $343 per ounce in operating profits. So in Q4’17, the major gold miners’ earnings soared 22.1% YoY to $418 on that mere 4.8% gold rally! Gold miners make such compelling investment opportunities because of their inherent profits leverage to gold, multiplying its gains.
But this strong profitability sure isn’t being reflected in gold-stock prices. In Q4’17 the HUI averaged just 189.4, actually 1.5% lower than Q4’16’s 192.3! The vast fundamental disconnect in gold-stock prices today is absurd, and can’t last forever. Sooner or later investors will rush into the left-for-dead gold stocks to bid their prices far higher. This bearish-sentiment-driven anomaly has grown more extreme in 2018.
Since gold-mining costs don’t change much quarter-to-quarter regardless of prevailing gold prices, it’s reasonable to assume the top GDX miners’ AISCs will largely hold steady in the current Q1’18. And it’s been a strong quarter for gold so far, with it averaging over $1329 quarter-to-date. If the major gold miners’ AISCs hold near $858, that implies their operating profits are now running way up near $471 per ounce.
That would make for a massive 12.7% QoQ jump in earnings for the major gold miners in this current quarter! Yet so far in Q1 the HUI is averaging just 187.1, worse than both Q4’17 and Q4’16 when gold prices were considerably lower and mining costs were higher. The gold miners’ stocks can’t trade as if their profits don’t matter forever, so an enormous mean-reversion rally higher is inevitable sometime soon.
And that assumes gold prices merely hold steady, which is unlikely. After years of relentlessly-levitating stock markets thanks to extreme central-bank easing, radical gold underinvestment reigns today. As the wildly-overvalued stock markets inescapably sell off on unprecedented central-bank tightening this year, gold investment will really return to favor. That portends super-bullish-for-miners higher gold prices ahead.
The impact of higher gold prices on major-gold-miner profitability is easy to model. Assuming flat all-in sustaining costs at Q4’17’s $858 per ounce, 10%, 20%, and 30% gold rallies from this week’s levels would lead to collective gold-mining profits surging 43%, 75%, and 107%! And another 30% gold upleg isn’t a stretch at all. In the first half of 2016 alone after the previous stock-market correction, gold soared 29.9%.
GDX skyrocketed 151.2% higher in 6.4 months in essentially that same span! Gold-mining profits and thus gold-stock prices surge dramatically when gold is powering higher. Years of neglect from investors have forced the gold miners to get lean and efficient, which will amplify their fundamental upside during the next major gold upleg. The investors and speculators who buy in early and cheap could earn fortunes.
While all-in sustaining costs are the single-most-important fundamental measure that investors need to keep an eye on, other metrics offer peripheral reads on the major gold miners’ fundamental health. The more important ones include cash flows generated from operations, actual accounting profits, revenues, and cash on hand. They generally corroborated AISCs in Q4’17, proving the gold miners are faring really well.
These top-34 GDX-component gold miners collectively reported strong operating cash flows of $4529m in Q4, surging a huge 21.6% YoY! Running gold mines is very profitable for the major miners, they have this down to a science. Of the 26 of these major gold miners reporting Q4 OCFs, every single one was positive. Most also proved relatively large compared to individual company sizes, looking really strong.
As long as OCFs remain massively positive, the gold mines are generating much more cash than they cost to run. That gives the gold miners the capital necessary to expand existing operations and buy new deposits and mines. Given how ridiculously low gold-stock prices are today, you’d think the gold miners are hemorrhaging cash like crazy. But the opposite is true, showing how silly this bearish herd sentiment is.
The top GDX gold miners’ actual GAAP accounting profits didn’t look as good, coming in at a $266m loss in Q4’17. While a big improvement over Q4’16’s $588m loss, that still seems incongruent with those great all-in sustaining costs and operating cash flows. Of the 23 of these top-34 GDX components reporting earnings in Q4, 10 had losses. Half of those were big, over $50m. I looked into the reasons behind each one.
These handful of big gold-mining losses that dragged down overall top-GDX-component earnings were mostly the result of asset-impairment charges. Some of the world’s largest gold miners led by Newmont and Barrick with $527m and $314m Q4 losses continued to write down the carrying value of some gold mines. As mines are dug deeper and gold prices change, the economics of producing the metal change too.
That leaves some of the major gold miners’ individual mines worth less going forward than the amount of capital invested to develop them. So they are written off, resulting in big charges flushed through income statements that mask operating profits. But these writedowns are something of an accounting fiction, non-cash expenses not reflective of current operations. They are mostly isolated one-time events as well.
In addition to writedowns totally irrelevant to current and future cash flows, there were also big losses recognized in Q4’17 due to the new US corporate-tax law. With tax rates slashed, deferred tax assets that were created by overpaying taxes in past years were suddenly worth a lot less. These too were non-cash charges, another accounting fiction. Finally some companies realized losses on selling gold mines.
The major gold miners all run portfolios of multiple individual gold mines, each with different AISC levels. They’ve been gradually pruning out their higher-cost operations by selling those mines to smaller gold miners, usually at losses. While this hits income statements in mine-sale quarters, it is one reason the major gold miners have been able to drive down their costs. That will lead to greater future profitability.
In price-to-earnings-ratio terms, the major gold stocks are definitely getting cheaper. Of the 23 of these top-GDX-component stocks with profits to create P/E ratios, 7 had P/Es in the single or low-double digits! There are some really-cheap gold miners out there today, even adjusted for any dilution from past share issuances. Of course P/E ratios automatically do that since stock prices are divided by earnings per share.
On the sales front these top-34 GDX gold miners’ revenues soared 13.9% YoY to $12,236m in Q4. That looks suspect given that 1.7% YoY drop in production and the 4.8% YoY rally in the average gold price. 26 of these gold miners reported Q4 sales, compared to 27 a year earlier in Q4’16. The apparent growth came from some large gold miners that didn’t disclose Q4’16 sales deciding to make that data available in Q4’17.
Cash on balance sheets is also an interesting metric to watch, because it is primarily fed by operating profitability. Nearly all the gold miners report their quarter-ending cash balances as well, whether they report quarterly like in the US and Canada or in half-year increments like in Australia and the UK. The total cash on hand reported by these top GDX gold miners surged 7.0% YoY to a hefty $13,974m in Q4’17!
That’s a big number for this small contrarian sector, and it’s conservative. I just included the bank cash reported, excluding short-term investments and gold bullion. The more cash gold miners have on hand, the more flexibility they have in growing operations and the more resilience they have to weather any unforeseen challenges. Material drops in cash at individual miners were usually spent to grow their production.
So overall the major gold miners’ fundamentals looked quite strong in Q4’17, a stark contrast to the miserable sentiment plaguing this sector. Gold stocks’ vexing consolidation over the past year or so isn’t the result of operational struggles, but purely bearish psychology. That will soon shift as stock markets inevitably roll over and gold surges, making the beaten-down gold stocks a coiled spring overdue to soar dramatically.
While investors and speculators alike can certainly play gold stocks’ coming powerful uplegs with the major ETFs like GDX, the best gains by far will be won in individual gold stocks with superior fundamentals. Their upside will far exceed the ETFs, which are burdened by over-diversification and underperforming stocks. A carefully-handpicked portfolio of elite gold and silver miners will generate much-greater wealth creation.
At Zeal we’ve literally spent tens of thousands of hours researching individual gold stocks and markets, so we can better decide what to trade and when. As of the end of Q4, this has resulted in 983 stock trades recommended in real-time to our newsletter subscribers since 2001. Fighting the crowd to buy low and sell high is very profitable, as all these trades averaged stellar annualized realized gains of +20.2%!
The key to this success is staying informed and being contrarian. That means buying low before others figure it out, before undervalued gold stocks soar much higher. An easy way to keep abreast is through our acclaimed weekly and monthly newsletters. They draw on my vast experience, knowledge, wisdom, and ongoing research to explain what’s going on in the markets, why, and how to trade them with specific stocks. For only $12 per issue, you can learn to think, trade, and thrive like contrarians. Subscribe today, and get deployed in the great gold and silver stocks in our full trading books!
The bottom line is the major gold miners’ fundamentals are quite strong based on their recently-reported Q4’17 results. While production declined, mining costs were still driven lower. That coupled with higher gold prices generated fat operating profits and strong cash flows. The resulting full coffers will help the gold miners expand operations this year, which will lead to even stronger earnings growth in the future.
Yet gold stocks are now priced as if gold was half or less of current levels, which is truly fundamentally absurd! They are the last dirt-cheap sector in these euphoric, overvalued stock markets. Once gold resumes rallying on gold investment demand returning, capital will flood back into forgotten gold stocks. That will catapult them higher, continuing their overdue mean reversion back up to fundamentally-righteous levels.
February 2018 saw 84 deals close in the Canadian financial markets for an aggregate C$367.0 million at an average of $4.5 million, down 15.2% over January 2018 when 105 deals closed for an aggregate C$432.8 million at an average of $4.32 million.
February saw 14 brokered deals close for an aggregate $250.0 million at an average of $17.9 million. This was up 54.3% from the nine brokered deals in January that closed for an aggregate $162.0 million at an average of $18.0 million.
Within the brokered deals, six bought deals closed in February for an aggregate of $136.7 million deal at an average $22.8 million, an increase of 29.1% over the five bought deals that closed in January for an aggregate of $105.9 million deal at an average $21.2 million.
95 deals opened in February
The top ten deals by size closed in February totaled $230.1 million with gold leading the field taking three spots of the top four spots and five of the top ten. Battery metals cobalt and lithium took three spots.
The top ten deals by size closed in January totalled $241.3 million with graphite, copper and tin leading the field. Gold took three spots of the top ten with cobalt also figuring.
February saw 56 gold deals close for $229.2 million at an average of $3.4 million, up 119.1% in total value terms from the $104.6 million raised in 44 gold deals in January at an average of $2.3 million. The top ten gold deals in February totalled $184.7 million, some 76.5% of the total.
Base metals accounted for $73.6 million of the funds raised in February, some 30.5% of the total, with the top ten deals accounting for $36.7 million with zinc and copper featuring heavily.
Battery metals accounted for $74.8 million of the funds raised in January, some 31.0% of the total and where the top ten battery raises brought in $73.6 million with three cobalt, five lithium one copper and one graphite raises.
#1 Torex Gold$61.7 million
Torex Gold Resources (TSX:TXG) closed a C$61.7 million offering underwritten by a syndicate led by BMO Capital Markets on a best efforts basis.
#2 Orla Mining$30.8 million
Orla Mining (TSXV: OLA) closed a C$30.8 million offering underwritten by a syndicate led by GMP Securities on a bought deal basis. Each unit included half a warrant that expires in 36 months.
#3 eCobalt Solutions$29.9 million
eCobalt Solutions (TSX: ECS) closed a C$29.9 million offering underwritten by a syndicate led by TD Securities on a bought deal basis. Each unit included half a warrant that expires in 18 months.
About Oreinc.com:
Oreninc.com is North America’s leading provider of relevant financing information in the junior commodities space. Since 2011, the company has been keeping track of financings in the junior mining as well as oil and gas space. Logging all relevant deal and company information into its proprietary database, called the Oreninc Deal Log, Oreninc quickly became the go-to website in the mining financing space for investors, analysts, fund managers and company executives alike.
The Oreninc Deal Log keeps track of over 1,400 companies, bringing transparency to an otherwise impenetrable jungle of information. The goal is to increase the visibility of transactions and to show financings activity in a digestible format. Through its daily logging activities, Oreninc is in a position to pinpoint momentum changes in the markets, identify which commodities are trending and which projects are currently receiving funding.
I recently returned from a hectic trip to Toronto for an annual mining industry investment conference known as PDAC. I met with 28 companies and spoke to dozens of investors. I expected to talk a lot about Lithium & Cobalt— how the sell-off in those sectors could be close to over, how demand forecasts keep rising in the face of uncertain long-term supply, etc.
Although there were plenty of discussions on the, “battery metals,” I was surprised by the universal excitement over a metal that’s old school, but also indispensable to the future of electric vehicles & renewable energies…. A metal that needs no further introduction…. #Copper.
One of the best stories I heard at PDAC was an update from Keith Henderson M.Sc., CEO & Director of Centenera Mining Corp. [TSX-V: CT / OTC: CTMIF], an Argentina-focused company with attractive Copper (“Cu”) & Gold (“Au”) exploration projects. Upon a positive change in Argentina’s government in 2015, Centenera was quick to move more actively into the country.
Drilling is underway at the Company’s flagship project, and management believes that it’s going quite well. The first assay is expected around the end of March.
The crown jewel asset and primary focus of Centenera this year is the 100% controlled, near-surface Esperanza copper-gold project — (formerly known as the Huachi project) — an outcropping Cu–Au porphyry system with a blockbuster discovery that included a drill hole intersection of 353 meters grading 0.49% Cu Eq., (incl. 243 m at 0.57% Cu Eq. & 88 m at 0.69% Cu Eq.). Mineralization outlined at surface and found in shallow drilling is open in all directions and at depth. {see Corporate Presentation}
Assays from the discovery drill campaign included:
Esperanza is in San Juan province in northwestern Argentina, sitting at an elevation of between 2,800 and 3,250 meters. That’s relatively low compared to work being done in the high Andes. The project is 35 km from existing power lines. Proximity to key infrastructure is absolutely critical for mining bulk tonnage porphyry deposits.
Exploration can be performed year-round in San Juan, ranked in the 2017 Fraser Institute of Mining Survey as the #1 province in Argentina, and 3rd best mining jurisdiction in all of South America. Despite well-known players like Barrick (Veladero mine in San Juan)& Yamana Gold (Gualcamayo mine in San Juan) being active in the Province, the Esperanza project remains remarkably under-explored. Only 7 drill holes (2,011 m) have tested this extensive, outcropping copper-gold porphyry system.
After several weeks of delay due to unseasonal storms and flash flooding across multiple northern provinces, drilling is well underway at Esperanza. Interestingly, while repairing road access to site, new mineralization was exposed at surface in an area thought to be barren. Mineralization is now interpreted to extend significantly further to the southeast than previously known. Some of the best mineralization to date has been intersected in this area.
The Phase I drill program is investigating the potential for a bulk-tonnage copper-gold porphyry-style deposit. Management is currently drilling 4 step-out holes, ~2,000 m in total, of at least 100 m away from historical holes, aiming to reach deeper, (500 – 600 m), than prior efforts. Deeper drilling was called for because several assays from 2006-7 showed grade increasing at depth.
Some drill core from the first hole is about to be sent out for assay. I’m told that upon visual inspection, the technical team felt that the core looked really good, but readers will have to wait along with management until the end of March for lab results.
Upon success in Phase I, a Phase II program would include 4 additional step-outs of 100 – 150 m, plus 2 IP targets 500 m to the east, for a total of 6 holes.
Based on exploration to date, the significant grade, and thickness of reported intervals, management believes there could be hundred(s) of millions of metric tonnes of mineralization. The area of interest is already 1,400 m by 850 m. If strong grade and wide intervals continue to be found, the deposit could host billion(s) of Copper Equivalent (“Cu Eq.“) pounds. Make no mistake, it’s still early days, but there’s a real possibility for substantial scale to be unearthed here.
It’s worth reminding readers that McEwen Mining’s (NYSE: MUX) Los Azules project is also in San Juan province. McEwen’s website describes Los Azules as follows; 962 million tonnes containing 10.2 billion pounds Cu in the Indicated category, plus 2.666 billion tonnes containing 19.3 billion pounds Cu Inferred, with (Cu only) grades of 0.48% & 0.33%, respectively. That’s a combined 3.6 billion tonnes of mineralization, containing 29.6 billion pounds Indicated & Inferred Cu, at an average grade of 0.37%.
Delineating hundred(s) of millions of tonnes is not a sure thing, and it won’t necessarily come in the maiden mineral resource estimate. However, historical exploration, combined with the current drill program, could provide further evidence of grade, scale & continuity that attracts considerable attention.
Centenera has a tremendous management, Board & technical team for a company its size {72.4 M shares outstanding x C$0.165 = C$12.0 M = US$9.3 M market cap}.
Centenera Mining Corp. [TSX-V: CT / OTC: CTMIF] is sitting on what could be a major copper-gold asset in San Juan, with important drill results coming out soon. It also holds a portfolio of promising projects, also in Argentina, including a high sulphidation epithermal gold mineralization project and a hard rock lithium play, both in Salta province.
Here’s a very good 4-minute video clip of CEO Henderson from PDAC in early March.
Readers would benefit from reading the March 2017 EsperanzaTechnical Report
Disclosures: The content of this article is for information purposes only. Readers fully understand and agree that nothing contained herein, written by Peter Epstein, about Centenera Mining, including but not limited to, commentary, opinions, views, assumptions, reported facts, calculations, etc. is to be considered, in any way whatsoever, implicit or explicit investment advice. Further, nothing contained herein is a recommendation or solicitation to buy, hold or sell any security. The content contained herein is not directed at any individual or group. Peter Epstein and Epstein Research [ER] are not responsible, under any circumstances whatsoever, for investment actions taken by the reader. Peter Epstein and [ER] have never been, and are not currently, a registered or licensed financial advisor or broker/dealer, investment advisor, stockbroker, trader, money manager, compliance or legal officer, and they do not perform market making activities. Peter Epstein and [ER] are not directly employed by any company, group, organization, party or person. The shares of Centenera Mining are highly speculative, not suitable for all investors. Readers understand and agree that investments in small cap stocks can result in a 100% loss of invested funds. It is assumed and agreed upon by readers that they will consult with their own licensed or registered financial advisors before making any investment decisions.
At the time this article was posted, Peter Epstein owned shares and stock options of Centenera Mining and the Company was a sponsor ofEpstein Research. Readers understand and agree that they must conduct their own due diligence above and beyond reading this article. While the author believes he’s diligent in screening out companies that, for any reasons whatsoever, are unattractive investment opportunities, he cannot guarantee that his efforts will (or have been) successful. Mr. Epstein & [ER] are not responsible for any perceived, or actual, errors including, but not limited to, commentary, opinions, views, assumptions, reported facts & financial calculations, or for the completeness of this article or future content. Mr. Epstein & [ER] are not expected or required to subsequently follow or cover events & news, or write about any particular company or topic. Mr. Epstein and [ER] are not experts in any company, industry sector or investment topic.
Whether it be financial, political or social, there’s the potential for any decision we make to be fueled by emotion. In particular, when participating in a high risk, high reward area of the market, like the junior resource sector, it can be lethal to your odds of success.
In my experience, those who can use arithmetic as their primary “truth” are the best at eliminating bias and reducing the amount of emotion contained in an investment. Today, I have for you an interview with a man who uses arithmetic to construct, what I believe, is the most compelling argument for gold that I have ever heard.
This man is Trey Reik, a Senior Portfolio Manager with Sprott USA. Reik is a commentator on gold markets and monetary policy, including policies and actions of global central banks, global conditions for money and credit, and factors affecting supply/demand conditions for gold bullion.
I first heard Reik speak at the 2015 Sprott Natural Resources Symposium in Vancouver, British Columbia. From then on, I’ve always paid attention when I’ve heard or seen the name, ‘Trey Reik;’ there’s a lot you can learn from him, especially when it comes to his commentary on gold.
Without further ado, a conversation with Trey Reik.
Enjoy!
Brian: In my view, we live in a society of paradigms or bias that lock us into thought patterns that keep many of us blind to other alternatives – alternatives that may be more efficient or beneficial.
In reference to financial markets and in particular gold, in your opinion, how does one keep an open mind and see through paradigms and their own inherent bias?
Trey Reik: I think that a lot of what’s been going on, at least in markets since the turn of the millennium, so the 2000s, is that we’ve hit a period in which central banking has become probably the most important variable on the investment landscape, and I would add much more important than it should be. This has really cast a prism or a rose-coloured glasses view of what’s really going on in the world. It has, I think, relieved people and investors from reality, to a great degree.
Let me just back up a teeny bit, and talk about it from the perspective of gold. Number one, I’ve given probably 1,000 presentations about gold over the 15 years in which I have been covering it, and I’ve never once convinced anybody to buy gold. I don’t expect to change people’s views today any more than I did yesterday or last month. Number two, gold’s a funny topic because almost everybody has an opinion, generally unburdened by a real strong command of any relevant underlying fundamentals or facts. Third, gold has more investment queues than any other asset with which I’ve been involved over my career.
Some people think it’s an inflation hedge, some people think it’s a deflation hedge. Some people think gold is a risk-on trade, other people would look at it as a risk-off investment. When we have stress in the financial system, some people would view gold as a safe harbour. Other people would still favour the US dollar, although far fewer than would have made that determination say, in 2008. Given the negative reflexive relationship between the dollar and the US gold price, you could actually have a situation where stress in the financial system has a reflexively negative impact on gold.
Now, I went through all of that because my gold thesis is a little different than most. I don’t really think gold has much to do with CPI-type inflation. The way I would pose this is that if the price of hedonically adjusted hot dogs in Houston goes up, why would you buy gold? I don’t really see a strong connection there. Another way to look at inflation is if the prices of goods and services go up for healthy reasons, like a strengthening economy, I’m not really sure the price of gold should go up any faster than say, thumbtacks. If the inflation is of the monetary sort or variety, then I think gold should logically do a lot better.
Now, over the last 17 years, gold is up in 14 of those 17 years and has amassed a compound annual return since year end 2000 through year end 2017 of just about 9.5%. Actually, 9.65%. Over the same 17 years, the compound annual return of the S&P 500, including reinvestment of dividends was 6.32%. Gold has significantly outperformed the S&P with reinvestment of dividends for 17 years and is up in 14 of the 17. Now, if gold is up in 14 of the 17 years, it proves my point that it’s not related to some of these knee-jerk reactions that get ascribed in the press all the time to gold investors. In other words, we’ve had periods of inflation and periods of deflation over that timeframe. We’ve had round trips in equities and commodities. We’ve had yields on both the short end and the long end, largely falling over the timeframe, but we even had periods like June of ’04 to June of ’06 where the Fed raised rates at 17 consecutive FOMC meetings and quintupled the Fed funds rates from one-percent to five-and-a-quarter-percent, and gold went up during that timeframe by as much as 86%.
My point is, for gold to do as well as it has for so long, posting the best performance of any global asset, there’s obviously something more going on. I think what that is, is that at the margin, we have about $280 trillion now in global financial assets, and each year, in my opinion, my thought experiment, if you will, is that a very small portion of that global wealth seeks a home in hard assets, things that can’t be debased or defaulted upon, things that can’t be printed. That’s why fine art, in my opinion, has done so well over a period that has not exactly been exhibiting breakneck growth, but nonetheless, the art market’s been on fire. Things like Honus Wagner baseball cards, fine Bordeaux wines, all that kind of stuff has done really, really well.
Gold has benefited, I think from that migration. Each year, we have a different rate of migration from the financial asset pile to things like gold, and in certain years, that migration may have even reversed, like 2013, for example. The whole gold thesis is about that rate of migration going from say 1/10th of 1% to say, 1/2 of 1% ’cause 1/2 of 1% of $290 trillion is $1.45 trillion. The available gold stock is about $2.8 trillion. $1.5 trillion isn’t going to get into $2.8 trillion without a serious price dislocation.
When you talk about paradigms or things being misleading or that type of thing, although that’s a leading, almost political kind of question, I think the biggest misdirection, I think, of markets is the degree to which certainly over the past three years especially, but over the last 17 years, how big a part of financial asset valuations has become central bank policy.
Now, to back this up to two weeks ago, I think most of the market still believes that this disturbance that we had is–just as when we had the crisis of 2007, ’08, and ’09—the first words out of people’s mouths are always, “It’s contained.” Just as we thought in 2007 that the disturbance was limited to subprime mortgages, we are currently, I think, a large percentage of folks would say that the current disturbance is limited to a very small group of perhaps leverage, but certainly a short bet on the VIX. I look at it very differently. I would suggest that after nine years of ZIRP and QE, but 17 years of egregious central policy and interventions really starting with Mr. Greenspan, the entire financial system has been imbued with this short-volatility way of looking at the world. I’m sure given your situation, that you’ve read Chris Cole’s stuff from Artemis, but he’s the Michael Burry of this trade. You remember Burry was the guy that figured out the subprime-short trade for Scion Capital in the movie The Big Short. Coles is, I think, the Michael Barry of this trade. If you’ve read his stuff, he estimates that there’s about $2 trillion-worth of short-volatility exposures.
He’s got it all broken out in the stuff that he’s written. If you have about $2 trillion of exposures left, we haven’t even really started to scratch the surface of re-pricing things back to reality. I would say that in an environment of 0% interest rates and QE, we’ve lost the ability to assess the demand for anything.
People who laugh or criticize gold, like Warren Buffett–here’s a guy, he’s got more financial assets, paper assets than any other human being on the planet, or I guess Jeff Bezos might be up there with him now.Warren Buffett, who has more to lose from gold doing well than any other person on the planet, and ask him what he thinks about gold? But yet we do. When we do, he says, “Well, if you take all the gold in the world and you fit it on a tennis court, you got this big lump of gold and then in the other, box B, you could have five General Motors or GEs, and all the farmland in America, and you’d still have a trillion dollars leftover. Who wouldn’t pick box B?” The answer is anybody who thinks box A, which is all the gold in the world, is going to go up faster than box B.
We have a system where people think they have these franchises and these moats and all the stuff that Buffett writes about, and impenetrable franchises, but in fact, the denominator of all of these things, the unit of account, even if you’re talking about cash flow, is dollars. The one thing that is not stable as a unit of account is dollars, so no one really has any idea what the value of any of these franchises are.
If we normalized rates, and we took say, Fed funds to, well what’s normal anymore? We took them from 1% to 5.25% as recently as 2006, but if we took them to 4-5%, and we took the 10-year Treasury yield to eight percent, would the financial systems still be intact? I think the answer is no.
Until we can normalize rates, we don’t know what the list of Buffett’s companies–the Nebraska Furniture Mart and Wells Fargo and he just sold his IBMno one knows what the demand for anything is at these companies with this much monetary debasement.
Brian: Since 2008, I have personally suffered from being too pessimistic on paper currencies, mainly the U.S. dollar and risk in the broader market. Depending on perspective, this view both made me and cost me money.
Now, 10 years later, I have taken time to reflect on my investment choices and believe that bias or the so called “gold bug” in me prevented me from having a clearer picture of what was actually happening in the world.
However, I still believe that there is a price to pay for the massive amounts of money printing and low interest rates we have seen over the last 10 years. To me it is a “when” not “if” question.
My question for you is, has the “when” already occurred in the gold market? Meaning, realistically, should investors view the current gold price around $1300 USD/oz as the payback for the QE and low interest rates, or is the “when” still to come?
Trey Reik: I do believe there is no empirical equation that could generate a gold price that really means anything. The gold price is the reciprocal of your comfort with the financial system, the dollar, and central-bank stewardship. If you’re of the opinion as an investor that those three are fine, gold really serves no purpose. If you are like me, of the opinion that all three of those are deeply in doubt, meaning the value of the US dollar, debt levels, central bank stewardship, etc., then gold is a mandatory investment.
It doesn’t really matter if the price is $1,200 or $2,300, if those three issues are still a problem, you need to have gold in your portfolio. That’s what I was saying earlier; I have three litmus tests for when gold is a mandatory portfolio investment. I was sharing the first with you, which is whether you could normalize rates and then you have to decide what normalizing means. Let’s even call it 3% on Fed funds. I don’t think we can get there without a financial calamity or 6-8% on the 10-year Treasury. If you could normalize rates without big impact, gold’s role may have diminished.
The second litmus test would be if we take the ratio of debt-to-GDP, for the last 100 years the ratio of debt-to-GDP in this country has averaged 140-170%, except for two events. The depression and the Alan Greenspan/Bernanke/Yellen era. In the first example, we had GDP fall 50%, the debt remained constant, so the ratio got up to like 260%. FDR had to devalue the dollar and confiscate gold in the US and make it illegal, for what turned out to be 41 years. In the current environment, which is a numerator event, we’re just piling all this debt on top of relatively stable GDP. If we don’t get that debt-to-GDP ratio back to say, 200% from its current level of about 370%, goldwill remain a mandatory investment.
The reason is, that in order to get that ratio back into balance, the only two options are default or debasement. Each time the markets try to choose default, the Fed steps with QE1, QE2, QE3, Operation Twist, etc., and they will again. We’re either going to have 20 trillion or so of credit in the United States go away, or the other way to look at this is household net worth.
In March of 2009, household net worth, which is the Fed’s measure from Z1; basically it’s stocks, bonds, real estate, minus debt. Household net worth in March of 2009 was $54.79 trillion, GDP was $14.09 trillion. Today, household net worth is $96.94 trillion and GDP is $19.5 trillion. GDP has gone up $5.4 trillion from $14.09 trillion to $19.5 trillion, and household net worth over the same time period has gone up $42 trillion from $54 trillion to $96.94 trillion.
This means that over the past—let’s see, March of ’09, and now we’re in March of ’18, so the past nine years, household net worth has grown 7.77 times, or call it eight times faster than GDP growth. Now, the one thing I know for certain is you can’t grow wealth eight times faster than output forever. Once again, is gold necessary? Have we had the ‘when’ yet? Absolutely not. In the household net worth type of multiple to GDP, if you look at the 40’s, the 50’s, the 60’s, the 70’s, everything really through the 80’s, we used to have about a 3.5 times multiple to GDP and savings, is what household net worth should be.
Probably 30, 35, 40 trillion dollars worth of household net worth has to go away to get the system back in balance. This is like litmus test number two. We either need $20 trillion in credit, or $30-35 trillion in the combination of real estate, stocks, and bonds, (minus debt) to go away to bring the system back in balance. Until that happens, I think gold is a mandatory portfolio component because, once again, the only two options are default or debasement.
Then the third litmus test would be if we could get back to some sort of normalized GDP growth, and once again, we’re debating these days what “normal” is. Trends, capability, normal, say 3%, used to be 3.5%. We used to accomplish 3.5% growth with a savings rate, very importantly, in the 8-10% area. That would be healthy growth. It wouldn’t require the non-financial credit expansion that is now necessary to keep the debt pyramid from toppling, which is on the order of $2 trillion a year. Again, to review the three litmus tests would be normalizing rates without crashing the financial system, rationalizing the excess paper claims in the economy, whether it’s debt or the household net worth, and the third would be normalize GDP supported by savings as opposed to non-financial credit creation.
Unless you have basically all of those, or even two out of three, gold is still a mandatory portfolio investment, in my opinion. Which is, by the way, why even though it never gets any accolades, it is the best performing asset and is up in 14 of the past 17 years. That’s going to continue until we get the system in better balance between claims on future output and the future output itself.
Brian: Is there an event or series of events that would have to occur for you to change your mind about the long-term fundamentals of gold?
Trey Reik: One of the reasons that I’m as confident as I am is I’ve spent more time thinking about the underlying fundamentals than most human beings. There’s a lot of people that invest in gold for lots of different reasons, as we already discussed, but I’m not in that group. I’m investing in gold for a very specific tenant, which has to do with monetary variables and the claim on future output. There’s just too much paper claim out there. Until those imbalances are solved, one way or another, and I’m suggesting the only two solutions are default or debasement, there isn’t any other solution.
Well, the third solution would be we grow into it, but in order to grow into it, even if we had GDP at 10% for each of the next eight quarters, it would take GDP from $19.5 trillion to maybe $22 or $23 trillion, and that can’t support $66 trillion of debt any more than $19.5 trillion. Further, if the variables that I just gave you in the last 17 years hold anywhere remotely true, when we get GDP up to $22 or $24 trillion, the debt won’t have remained constant. It would probably be up seven times faster than the GDP growth. You can’t grow out of it, you’ve got to have default or debasement. These imbalances are so profound that I’m not swayed to change my mind at all, even by periods like September 2011 to December 2015, when the high tick for gold was 1911 down to 1050 because these imbalances are still there.
Over the past 17 years, by the way, people always ask when’s gold gonna do its thing? Or why isn’t it doing better?… My response is always, It’s the best performing asset on the planet for 17 friggin’ years. I’ll be fine if gold keeps performing just like this, you know what I mean?
Brian: Yes, absolutely.
Trey Reik: Now, you mentioned the currency thing. I believe all fiat currencies have become an extension of the US dollar. Currency people have to pick one of the seven or five, or however many you want to say there are. That’s a shell game, and that’s all fine. It has gone on much longer than I would have thought possible. It is amazing that 2008 was 10 years ago, and here we are, but things are starting to change.
People talk a lot about the dollar and this is just an interesting thing, if you take the 10 worst market days in each year and you look at those 10 worst market days, you’d have 50 if you looked at five years. From 2008 to 2012, the 50 days when the DOW dropped at least 100 points, the dollar tended to rally on those days. During those days, dollar index rallied 80% of the time and an average 0.6% on these bad days.
Now, if you look at the next five years, from ’13 to ’17, and we look at the 10 worst days for the DOW, the dollar fell on those 50 days an average of .3 and it only rose 26% of the time. What I’m saying here is we are and, by the way, what happened on those 2,000 point days, I think fiat currencies are starting to fail. That’s a bench-clearing statement, but I think it’s true. We are in the early stages of a potential currency collapse, and so we may be getting “there.”
Brian: In your opinion, is the investment thesis for only gold the same as the thesis for only gold mining companies?
Trey Reik: The thesis is the same, but the deployment or the execution is obviously tricky. Gold is the best performing asset on the planet, as I mentioned, since 2000. Gold equities have had three big runs. The three big runs in gold equities were November 2000 to December 2003, , May 2005 to March 2008 and then November 2008 to September 2011.
Now, ironically, each one of the three was within a month or two of exactly three years. I believe that gold equities provide unparalelled alpha when the faith in US financial assets is being recalibrated. We never want to say stocks could go down, so I’ve come up with that phrase.
If we look at November 17th, 2000, through December 2, ’03, the GDX was up 342%, the S&P was down 22%. The next three year period, the GDX was up 185% and the S&P was up 10%. Then, in the third, it was 309% versus 39.70%. Now, if we compound the advance of the GDX in those three periods, which by the way, is nine years out of the past 16 years, it’s a little over 55% of the time you get a compound performance of 5,081.61%. The coincident performance of the S&P, to the day, was 20.39%, which means that gold equities outperformed the S&P by a factor of 249-to-one in nine of the past 16.5 years.
Now, the problem is the corrections between those advances measured negative 36%, negative 76%, and then after the last advance, negative 86%. If you compound those declines, you get basically 98%. That’s why gold equities in December of 2015 were trading below where they were at the end of the first of those three advances, where they were in December of 2003. The GDM in December of 2003 was at 799 and we got down below, I can’t remember the number, but it was much lower than by the end of ’15. Are they motivated by the same investment thesis? Loosely, but the key with gold equities is, as I think you learned after 2016, neither gold nor gold equities are a permanent investment. They serve different roles.
With what we call the jaws-of- life of the inverse correlation between the S&Ps, since October of 2012 through to today, never having been wider. The last time it was this inversely correlated, gold stocks was like 1996 to 2000, and we all know what was happening then. When people get dumb about US financial assets, gold stocks have a tendency to get left for dead. Then, when the inevitable correction comes, and there were two since 2000. The first was 50.5%, second was 57%. As I’ve proved in the prior example, gold stocks have a tendency to provide among the best alpha available in any asset class.
While I think it’s been necessary to have a good bullion allocation consistently in the last several years, I think that now would be an example of the time period where it’s also incumbent to have a representation in the equities themselves. It’s because of the alpha provided if we have one of these recalibrations of faith in US financial assets, and secondly, simply because of the inverse correlation, which has opened to such an egregious degree between the S&P and gold equities.
Brian: It has been a pleasure Trey, thank you very much for taking the time to answer my questions!
Concluding Remarks
The world’s politicians and a good portion of the mainstream media would have you believe that the actions carried out by the world’s central banks, mainly QE and low interest rates, saved us from the depths of what could have been a much worse situation in 2008. In my opinion, this couldn’t be further from the truth. While, it has taken longer than I have expected, there will be a price to pay for this poor monetary policy and, unfortunately, for those who are blissfully unaware, they will be rudely awakened, one day, when the market re-adjusts.
In my discussion with Reik, he cited three Litmus tests which can be used to gauge whether gold is currently a mandatory investment within your portfolio. Ask yourself:
First, is it possible to normalize interest rates?
Second, can the debt to GDP ratio be reduced back to historical norms?
Third, is it possible to get back to normalized GDP growth?
If you can honestly answer even one of these questions with a ‘yes,’ first, I’m surprised and, second, maybe gold isn’t a good investment choice for you. In my mind, Reik presents a compelling thesis for the investment in gold and gold equities, making it a “when” not “if” investment choice for your portfolio.
For those interested in purchasing the physical metal, yet would prefer the convenience of purchasing it through the stock market, I highly suggest checking out the Sprott Physical Gold Trust, which is traded on the NYSE under the ticker PHYS, or the Sprott Physical Gold and Silver Trust on the TSX under the ticker CEF.
The Sprott Trusts offer a few advantages. First, they differ from bullion funds, in that all of the bullion owned by the trusts is held in the trusts’ allocated accounts in physical form. Second, all of the Trusts’ bullion is stored at the Royal Canadian Mint, a Federal Crown Corporation of the Government of Canada. Thirdly, for U.S. non-corporate investors who hold units for more than one year and make a timely Qualified Election Form submission, gains realized on the sale of the Trust’s units are currently taxed at the long-term capital gains rate versus the maximum applied to most precious metals ETFs and physical gold coins.
Additionally, I highly suggest following Reik’s market commentary by subscribing to Sprott’s Thoughts, one of the best sources of financial commentary in the resource sector. Also, I highly suggest attending the Sprott Natural Resource Symposium in July, where you will be able to see and listen to Reik in person, along with a fantastic group of speakers which includes Rick Rule, Doug Casey, and James Grant, to just name a few. I hope to see you there!
Don’t want to miss a new investment idea, interview or financial product review? Become a Junior Stock Review VIP now – it’s FREE!
Until next time,
Brian Leni P.Eng
Founder – Junior Stock Review
Disclaimer: The following is not an investment recommendation, it is an investment idea. I am not a certified investment professional, nor do I know you and your individual investment needs. Please perform your own due diligence to decide whether this is a company(s) and sector that is best suited for your personal investment criteria. Junior Stock Review does not guarantee the accuracy of any of the analytics used in this report.
As the world transitions from deflation to inflation, investors need to engage in serious sector rotation or they risk being left behind.
Income growth in China/India, US government tax cuts, central bank rate hikes, and quantitative tightening are the main fundamental forces of this transition.
Please click here now. The paint is barely dry on Trump’s first tranche of tax cuts, and he’s already talking about round two!
Trump is a businessman and a realist, and that means he knows the US government has no hope of paying off its debt. None. Nada. Zilch. Tax cuts are bad news for government, and good news for corporations and citizens, with the caveat that the cuts are inflationary. That’s win-win for gold!
Please click here now. While Janet Yellen did hike rates, she did so at a snail’s pace. Rates are still very low and quantitative tightening has barely started.
That means corporate buybacks continue at a breakneck pace.
Some of the corporate piggy bank money created by the tax cuts has definitely gone to workers and business expansion, but most appears to have been used for stock buyback programs.
That’s kept financial ratios like earnings per share at reasonable levels while stock prices have advanced. It can be persuasively argued that most of the US bull market in stocks since March 2009 has been created by these buybacks.
More alarmingly, corporations are not just using operational cash for the buybacks, but borrowing money to leverage the action! Technically, it makes financial sense to borrow at 2% if you can buy stock that pays a 3% dividend. With this scheme, the use of leverage can create substantial profits (and equally substantial bonuses for directors who issue themselves reward with no risk).
The “endgame” of these buybacks is good for gold. Here’s why: If Jay Powell is aggressive enough with rate hikes and QT to halt the buybacks, the US stock market might crash.
With “safe haven” bonds pressured lower and the stock market crashing in an inflationary environment, institutional money managers will turn to gold stocks. On the other hand, if there is no stock market crash, higher rates and QT are going to incentivize banks to make more loans.
Corporations will continue buybacks, but at a slower pace. As they allocate funds to business investment, the tightening labour market is going to lead to workers demanding higher wages. This is only the very beginning of that trend.
Simply put, the last catalyst to push a lot of institutions into gold stocks in a meaningful way is wage inflation, and that tends to follow a rise in interest rates and higher bank profits.
On that note, please click here now. Double-click to enlarge. Bank stocks around the world are surging.
It’s unknown how many more rates hikes and how much QT will be required to usher in serious wage inflation and a reversal in money velocity. What is known is that the time is near.
The bottom line: Investors who want significant wage inflation that pushes gold stocks to new highs will get what they want, but patience is required. Nothing good happens before its time.
Regardless, my strongest recommendation is for all investors to own a serious position in both bank stocks and gold stocks to get maximum benefit from the transition to an “inflationary era”.
Please click here now. Double-click to enlarge. I’ve predicted that gold will go nowhere until the next Fed meeting.
That meeting is now just eight days away. With Chindian demand decent but not huge, the gold price is likely to continue in the drifting rectangle pattern that I’ve annotated on that daily gold chart until the Fed meeting ends.
Gold previously had a tendency to sell off quite dramatically ahead of past rate hikes, probably because “Fed speakers” made a lot of dollar-positive statements ahead of the hikes. Institutional money managers are becoming less concerned with the fact that gold doesn’t pay interest while the dollar does, and much more concerned that higher rates could cause tremendous damage to the US government bond market.
Powell may have suggested to his “speakers” that less talk about the supposed benefit of higher rates for the dollar is the wiser plan of action for now. Regardless, with Powell at the helm, there’s no question that the Fed has been a lot quieter, and the gold price action has been very solid ahead of this Fed meeting.
What I’m looking for after the meeting ends is not a “free money to the sky” gold price super surge, but more stability, more institutional money manager concern about the US bond market, and more talk about the potential for a reversal in US money velocity.
Please click here now. Double-click to enlarge. The big buy zones for gold stock enthusiasts are $21 and $18 on this GDX chart. Most individual gold stocks (with a few exceptions) track GDX, so when GDX reaches a key buy zone, investors can buy their favourite individual gold stocks at that point in time.
Investors who want to fully participate in the “Inflation Era” should have a portfolio of bank stocks (or ETFs for the sector) in one hand, with a focus on small banks. Those stocks are surging higher now, and should accelerate their advance with more rate hikes and QT. In the other hand should be a nice portfolio of gold and silver mining stocks. The surging bank stocks bring immediate satisfaction and the surge to come in the miners will bring maximum satisfaction!
Stewart Thomson is a retired Merrill Lynch broker. Stewart writes the Graceland Updates daily between 4am-7am. They are sent out around 8am-9am.The newsletter is attractively priced and the format is a unique numbered point form. Giving clarity of each point and saving valuable reading time.
Risks, Disclaimers, Legal
Stewart Thomson is no longer an investment advisor. The information provided by Stewart and Graceland Updates is for general information purposes only. Before taking any action on any investment, it is imperative that you consult with multiple properly licensed, experienced and qualified investment advisors and get numerous opinions before taking any action. Your minimum risk on any investment in the world is: 100% loss of all your money. You may be taking or preparing to take leveraged positions in investments and not know it, exposing yourself to unlimited risks. This is highly concerning if you are an investor in any derivatives products. There is an approx $700 trillion OTC Derivatives Iceberg with a tiny portion written off officially. The bottom line:
Are You Prepared?
The past 18 months have been difficult for precious metals investors. If you had known Donald Trump would be elected and the US Dollar would soon begin a nearly 15% decline, you would have expected Gold to blow past its 2016 high. You would have been shocked to see the gold miners and junior gold stocks trading lower. Gold has fared okay but the gold stocks and Silver have lagged. As US equities have continued to power higher, precious metals have struggled to perform while volatility in the space has dwindled. Precious metals volatility has reached extremely low levels and this is a sign that a major move, while not necessarily imminent is surely on the horizon.
We plot a weekly bar chart of Gold that includes a handful of volatility indicators such as the Gold Vix (GVZ), Average True Range (ATR) and several bollinger band widths (BBw). These indicators have touched major lows in recent months. The Gold Vix which began trading in 2010 recently touched its lowest level ever at 9. ATR recently touched its lowest level since 2007. The 40-week and 80-week BBw’s recently hit their lowest levels since 2005 while the 160-week BBw recently touched its lowest level since 2002.
Like Gold, Silver is showing significantly low levels of long-term volatility. Its ATR recently touched its lowest point since 2006. The BBw for three time frames (40 week, 80-week and 160-week) recently touched 14 year lows.
Although the gold stocks are one of the most naturally volatile markets, they too are showing significantly low long-term volatility. Below we plot the NYSE Gold Miners Index, which is the parent index of GDX along with similar volatility indicators. The ATR indicator recently touched a 15 year low. Interestingly, both the 40-week and 80-week BBw’s recently hit some of the lowest points of the past 25 years. The 40-week BBw recently tied 2007 for the lowest point in the past 25 years while the 80-week BBw recently touched a 6-year low and its 3rd lowest point of the past 25 years.
The major markets within the precious metals sector are showing extremely low levels of long-term volatility. At somepoint this will change but we cannot know exactly when. Given our long-term bullish bias, our thinking is volatility could increase as Gold approaches resistance and then accelerate upon a break-out in Gold. Note that low volatility can last for a while and will not suddenly change overnight. It may slowly start to increase at first. While we cannot know when, we do know that extremely low volatility is present and can facilitate a major move over the next 12 to 24 months. With more time ahead before an increase in volatility and a potential break-out we continue to remain patient and accumulate the juniors we think have 500% return potential over the next 18-24 months. To follow our guidance and learn our favorite juniors for the next 12-18 months, consider learning more about our service.
The small contrarian gold-mining sector remains deeply out of favor, universally ignored. Thus the gold stocks are largely drifting listlessly, totally devoid of excitement. But that’s the best time to buy low, when few others care. The gold stocks continue to form strong technical bases, paving the way for massive mean-reversion uplegs. And they remain exceedingly cheap relative to gold prices, which drive their profits.
Being a gold-stock investor feels pretty miserable and hopeless these days. The gold stocks have been consolidating low for 14.2 months now, stuck in a seemingly-endless sideways grind. There are still gains to be won, but they are mostly within that low-trading-range context. We haven’t seen one of the huge uplegs gold stocks are famous for since the first half of 2016. So most traders have given up and moved on.
That’s understandable psychologically, but unfortunate for multiplying wealth. Sometimes it takes a while for gold stocks to catch a bid, but once they get moving they often soar. This sector is so small relative to broader stock markets that even minor shifts in capital flows can drive enormous gains. While it’s hard waiting for gold stocks to return to favor, the vast upside when they do is well worth the buying-low pain.
The leading gold-stock measure and trading vehicle is the GDX VanEck Vectors Gold Miners ETF. It was the original gold-stock ETF launched in May 2006, and still maintains a commanding advantage in popularity. This week, GDX’s net assets of $7.7b were 24.0x larger than its next-biggest 1x-long major-gold-stock-ETF competitor! GDX is as big as all the other gold-stock ETFs trading in the US combined.
GDX’s price action shows why gold stocks are such compelling investments when everyone hates them. After gold stocks were universally despised in mid-January 2016, GDX soared 151.2% higher in just 6.4 months! After the previous time sentiment turned so overwhelmingly against gold stocks in October 2008, GDX rocketed 307.0% higher over the next 2.9 years. Buying gold stocks low has proven very lucrative.
That quadrupling of GDX after 2008’s first-in-a-century stock panic was actually the tail end of a vastly-larger secular gold-stock bull. Many years before GDX was even a twinkle in its creators’ eyes, that gold-stock bull started stealthily marching higher out of total despair. It can’t be measured by GDX since that ETF started too late, but the classic HUI NYSE Arca Gold BUGS Index reveals the magnitude of that bull run.
Over 10.8 years between November 2000 and September 2011, the gold stocks as measured by the HUI skyrocketed an astounding 1664.4% higher! And that was during a long bear-market span in the general stock markets, where the flagship S&P 500 drifted 14.2% lower. The gains in gold miners’ stocks as they mean revert from out of favor to popular are so epically enormous that they far outweigh any time lost waiting.
Gold stocks are even more attractive today given the exceedingly-overvalued and dangerous US stock markets, which are on the verge of a long-overdue major bear. Market valuations remain deep in literal bubble territory despite early-February’s correction. The simple-average trailing-twelve-month price-to-earnings ratio of the elite S&P 500 stocks was still 31.5x at the end of last month, above the 28x bubble threshold!
The market-darling stocks investors love today are crazy-expensive, portending huge downside in the next bear. The most-popular stock among professional and individual investors alike is Amazon.com, a great company. Yet AMZN stock is now trading at a ludicrous 252.5x earnings! That means if profits held steady it would take new investors today a quarter millennium just to recoup their stock purchase price.
Meanwhile the world’s largest gold miner in 2017-production terms, Barrick Gold, is now trading at a TTM P/E of 9.5x. That’s dirt-cheap by any standards! And ABX’s profits-growth potential is greater than AMZN’s. Last year Barrick mined 5.32m ounces of gold at all-in sustaining costs of $750 per ounce. That was $508 under gold’s average price of $1258 last year, fueling fat full-year profits over $1.5b on $8.4b in sales.
Every 10% increase in prevailing gold prices boosts Barrick’s earnings by 25%. And the average gold price so far in 2018 is already up 5.7%, so gold miners’ profits are growing fast. I’m not a Barrick Gold investor, and am just using this leading major gold miner as an example. There are plenty of smaller mid-tier gold miners with far more upside profits leverage to gold prices. Gold stocks are darned attractive!
They are one of the last bargain sectors remaining in these overheated stock markets. They are one of the only sectors that can rally in major bear markets, because they follow gold which drives their profits. Gold investment demand surges in weak stock markets, which brings investors back to gold stocks. At some point, investors are going to figure out how compelling gold stocks are today and stampede back in.
Despite the apathetic sentiment plaguing them, the gold stocks are still looking fine technically and even better fundamentally. This first chart looks at gold-stock technicals as rendered by their dominant GDX ETF. Given how bearish traders have waxed on gold miners, you’d think they are spiraling relentlessly lower. But they are actually consolidating nicely, establishing a strong base from which to launch their next upleg.
After plunging to fundamentally-absurd all-time lows in mid-January 2016, GDX soared into a major new bull market. While its 151.2% surge in just 6.4 months was undoubtedly extreme, that emerged out of even-more-extreme lows. And it merely catapulted GDX to a 3.3-year high in early-August 2016, nowhere close to secular topping levels. But the gold stocks were very overbought then, and soon corrected hard.
GDX’s enormous 39.4% correction in 4.4 months after that initial bull peak was also extreme, the result of a couple major anomalies. First gold-futures stops were run on major gold support failing, which ignited parallel cascading stop-loss selling in the gold miners’ stocks. Then investors fled gold in the wake of Trump’s surprise election victory, which led stock markets to soar on widespread hopes for big tax cuts soon.
Gold-stock selling finally exhausted itself in mid-December 2016, the day after the Fed’s 2nd rate hike of this cycle. Just a couple weeks later, GDX entered its now-14.2-month-old trading range that persists to this day. It is a basing consolidation trend running from $21 support to $25 resistance, which makes for a 19.0% trading range. This has held rock solid ever since, which has made gold-stock trading fairly easy.
My strategy has been simple. Given the extreme undervaluations in gold stocks that I’ll discuss shortly, a massive new upleg is likely to ignite anytime. So I want a full trading book to reap those enormous gains when they inevitably arrive. Thus every time GDX slumped down into the lower quarter of its consolidation range, between $21 to $22, I’ve been adding positions in great mid-tier gold miners with superior fundamentals.
All this is shared in real-time with our newsletter subscribers, who graciously support our research work. Buying low in the context of this vexing gold-stock consolidation has driven some great trades despite lackluster overall action. One example is Kirkland Lake Gold, an elite mid-tier miner. I added a new position in our popular weekly newsletter in December 2016. A year later I sold it for a hefty 184% realized gain!
So while this gold-stock trading range has sure felt dull, it has still created plenty of trading opportunities. And over the past month or so since that sharp stock-market correction, GDX has largely meandered in that lower quarter of its range near support again. That means it’s an excellent time to deploy capital in the unloved and cheap gold miners’ stocks today. Another surge higher is due, and it could be a big one.
While GDX $21 support has proven strong since the end of 2016, so has GDX $25 resistance. The gold stocks have tried and failed to break out above $25 four separate times since early 2017. A couple of the attempts were close, but weren’t sustainable as gold retreated. Once that $25 breakout finally comes to pass, investors will realize something different is happening and rush to chase gold stocks’ upside momentum.
Before early February’s sharp stock-market plunge that changed everything, I was looking to the release of gold miners’ Q4’17 operating and financial results as a potential catalyst to fuel that $25 breakout. That didn’t happen though, as gold and especially gold stocks were sucked into the fear surrounding the unprecedented stock-market volatility shock a month ago. That dragged GDX back down near support, which held.
This recent support approach is probably a blessing in disguise, offering another chance for investors to deploy capital in cheap gold stocks before they really start moving again. The great and sad paradox of the markets is investors are least willing to buy when stocks are low and out of favor, which is the exact time they should be buying before later selling high. Gold-stock prices can’t and won’t stay this low forever.
With stock-market volatility back, the highly-likely catalyst to ignite that GDX $25 breakout is gold rallying on resurgent investment demand. Gold is largely ignored when stock markets are high and investors are euphoric, as they feel no need to prudently diversify their portfolios. But once stock markets sell off for long enough to spook investors, they start shifting capital back into gold which often moves counter to stocks.
With the US stock markets still trading deep into bubble territory in late February, and euphoria remaining rampant as evidenced by the blistering bounce rally following that early-month plunge, there’s no way the stock-market selling is over yet. It will have to resume sooner or later with a vengeance to actually start rebalancing away greedy sentiment. When that happens, gold and gold stocks will soon catch major bids.
The fact gold stocks have held strong in their consolidation trading range for well over a year now is a glass-half-full kind of thing. It testifies to relatively-strong investment demand given the terribly-bearish sentiment pervasive in this sector. The longer prices base during bull markets, the greater the upside potential in their next upleg. It likely won’t take much of a gold rally to blast GDX back up through $25 again.
This strong technical picture and an inevitable sentiment mean reversion are reason enough for gold stocks to surge dramatically higher. But supercharging that is the dirt-cheap state of gold stocks today in fundamental terms. That includes current gold-mining profits compared to prevailing gold-stock prices, as well as near-future earnings-growth potential as gold itself continues mean reverting much higher ahead.
I’m well into my quarterly research work analyzing the Q4’17 results from the major gold miners of GDX. Unfortunately due to the complexities of preparing annual reports, the Q4 reporting season up to 90 days after quarter-ends is double the 45-day deadlines for Q1s through Q3s. So all the data isn’t quite in yet, but I expect to have enough to delve deeply into the major gold miners’ Q4’17 results in next Friday’s essay.
In the meantime, a great fundamental proxy for gold-stock valuations is the HUI/Gold Ratio. This is as simple as it sounds, dividing the daily close of that classic gold-stock index by the daily gold close and charting the resulting ratio over time. This reveals when gold stocks are expensive or cheap relative to the metal which drives their profits. And this sector has rarely been more undervalued than it is today!
This week the HGR was way down at 0.131x, meaning the HUI index’s close was running just over 13% of gold’s close. That’s incredibly low historically, showing that the gold miners’ stocks have been wildly underperforming gold. The gold stocks are trading at levels today implying gold and their profits were radically lower. This is a colossal fundamentally-absurd disconnect that can’t last forever, it has to unwind.
GDX and the HUI were way down at $21.57 and 173.4 in the middle of this week. The first time the HUI ever hit this level was way back in August 2003, years before GDX was even born. Back then gold was only running $357, and had yet to trade above $380 in its entire young secular bull. Let that sink in for a second. Gold stocks are trading at prices today first seen when gold was in the $350s fully 14.6 years ago!
This week gold was trading near $1325, an enormous 3.7x higher. That should certainly be reflected in gold miners’ stocks. Today’s super-low gold-stock levels aren’t much above the HUI’s stock-panic lows back in October 2008. There was only a week where the HUI traded lower than today at peak fear in the stock markets, and gold averaged $732 during that extreme span. This week it was trading 81% higher!
This is incredibly illogical, only explainable by irrational sentiment. If any other stock-market sector was trading at levels from a decade or more earlier despite the selling prices of its products doubling to quadrupling, investors would be beating down the doors to buy. That would rightfully be seen as a huge and unsustainable anomaly, a rare chance to buy deeply-undervalued stocks at decade-plus-old prices.
And it’s not just gold that’s far higher, so are the profit margins for mining it. With the new Q4’17 results from GDX’s major gold miners not all out yet, the latest data we have this week is Q3’17’s. During that previous quarter, the top GDX miners averaged all-in sustaining costs of just $868 per ounce. The costs of mining gold industrywide don’t change much, which is what creates profits’ big upside leverage to gold prices.
My still-incomplete Q4’17 analysis shows AISCs very similar to last quarter’s. That makes sense, as the past year’s quarters ending in Q3’17 had collective GDX AISCs of $875, $878, $867, and $868. Mining gold costs similar amounts regardless of prevailing gold prices, at least over medium-term multi-year spans too short for new gold mines to be built. So Q4’17 AISCs are likely to remain around these levels.
Assuming $868 carries forward into Q4’17 and Q1’18, gold-mining profits are really growing. Average gold prices surged from $1276 in Q4 to $1330 quarter-to-date in Q1. That’s up 4.2% sequentially, really strong. This implies major gold miners’ earnings are surging 13.2% QoQ in our current Q1’18 from $408 to $462 per ounce! That would make for strong 3.1x upside profits leverage to gold, which is impressive.
And whether the major gold miners are collectively earning $400, or $450, or even $500 per ounce today, such profits alone are much greater than the $350s prevailing gold price the first time the HUI traded at today’s levels. With fat profits like this heading much higher as this gold bull continues, it’s ridiculous for gold stocks to be priced as if gold was still in the $350s like mid-2003 or the $730s like in 2008’s stock panic.
This extreme anomaly can’t and won’t last. The gold stocks should be priced for today’s prevailing gold prices around $1325. The first time gold hit $1325 in October 2010, the HUI was trading at 522. That is triple today’s ludicrous levels! The gold stocks more than quadrupled in the years following 2008’s stock panic, another irrational situation where sentiment had battered gold stocks to fundamentally-absurd levels.
Between that first-in-a-century stock panic and extreme central-bank easing that really hit full steam in 2013, the last quasi-normal years in the markets were 2009 to 2012. During that post-panic span the HGR averaged 0.346x. If the HUI would merely mean revert back up to those levels relative to gold, it would have to soar to 458. That’s 164% higher than this week’s levels, upside unparalleled in any other sector.
For 5 years before the stock panic, the HGR averaged 0.511x. While gold stocks might not be able to sustain levels so high anymore, they could certainly blast up there in a temporary mean-reversion overshoot. After extremes, prices don’t simply migrate back to the average. Instead they overshoot proportionally to the opposing extreme as sentiment is equalized. That implies a HUI level of 677, 290% higher from here.
No one knows how high gold stocks can go, but there is zero doubt they are radically undervalued given today’s gold prices and the gold-mining profits they generate. Whether you expect this battered sector to quadruple again like after the stock panic, or merely double, that dwarfs the potential of the rest of the stock markets. Especially with the S&P 500 trading at bubble valuations after a long central-bank-goosed bull.
The gold stocks are truly a coiled spring today, ready to explode higher soon and trounce everything else. They are deeply out of favor, incredibly undervalued, and one of the only sectors that can rally sharply when general stock markets sell off. If you want to multiply your wealth this year by fighting the crowd to buy low then sell high, this small and forgotten contrarian sector is the place to be. Nothing else rivals it.
While investors and speculators alike can certainly play gold stocks’ coming powerful upleg with the major ETFs like GDX, the best gains by far will be won in individual gold stocks with superior fundamentals. Their upside will far exceed the ETFs, which are burdened by over-diversification and underperforming gold stocks. A carefully-handpicked portfolio of elite gold and silver miners will generate much-greater wealth creation.
At Zeal we’ve literally spent tens of thousands of hours researching individual gold stocks and markets, so we can better decide what to trade and when. As of the end of Q4, this has resulted in 983 stock trades recommended in real-time to our newsletter subscribers since 2001. Fighting the crowd to buy low and sell high is very profitable, as all these trades averaged stellar annualized realized gains of +20.2%!
The key to this success is staying informed and being contrarian. That means buying low before others figure it out, before undervalued gold stocks soar much higher. An easy way to keep abreast is through our acclaimed weekly and monthly newsletters. They draw on my vast experience, knowledge, wisdom, and ongoing research to explain what’s going on in the markets, why, and how to trade them with specific stocks. For only $12 per issue, you can learn to think, trade, and thrive like contrarians. Subscribe today, and get deployed in the great gold and silver stocks in our full trading books!
The bottom line is gold stocks are basing technically and cheap fundamentally today. While this small contrarian sector has largely been forgotten, its past year’s consolidation trading range continues to hold solid. The longer the basing, the greater the potential upleg when investors return. And despite trading at levels implying vastly-lower gold prices, the major gold miners are actually earning fat profits today.
Those earnings will surge dramatically as gold continues powering higher in its own bull market. It’s only a matter of time until investors see the extreme market-leading value inherent in the gold miners’ stocks. And with stock-market volatility roaring back after long years of central-bank suppression, diversifying portfolios with gold will soon return to favor. The gold stocks will soar as investment buying drives gold higher.
The precious metals sector continues to correct and consolidate. Gold remains in a bullish consolidation. It recently reached resistance again and even though it has failed to breakout, it remains above long-term moving averages which are sloping upward. However, the gold stocks and Silver remain in correction mode. They are trading below the long-term moving averages and at the lower end of their ranges over the past 12 months. That certainly provides an opportunity but these markets may not truly perform until Gold is ready to breakout.
Bullish Silver commentaries (because of its CoT) have been making the rounds and I don’t disagree. In the chart below we plot the net speculative position as a percentage of open interest. It is at 7.4%, which is the lowest reading in nearly three years. Interestingly, the daily sentiment index for Silver is not at an extreme. Its at 40% bulls. Technically, Silver is wedged in between support and resistance. A break does not appear imminent.
Like Silver, the gold stocks are oversold but we do not see an indication of an extreme oversold condition. In the chart below we plot GDX along with the difference between new highs and new lows. We also plot GDXJ along with the percentage of stocks (from a group of 50 we follow) that are trading above the 50-dma and 200-dma. GDX recently held above $21 again (even with over 20% of the index making new 52-week lows) while GDXJ is starting to show a bit more strength relative to GDX. At the low last Wednesday, 19% of those 50 juniors were trading above the 50-dma while 27% were trading above the 200-dma.
Gold, unlike Silver and the gold stocks, has not corrected much and remains much closer to resistance than support. Also, sentiment in Gold is much more optimistic than in Silver. The net speculative position in Gold is 37%, which dwarfs the 7.4% reading in Silver. Gold’s daily sentiment index is 56% bulls which is comfortably above Silver’s. During bull markets, corrections in Gold tend to push the net speculative position below 30%. Gold continues to maintain support at $1300 but we wonder if it needs to break that level and flush out some speculators before breaking out of its larger consolidation.
The precious metals sector is at an interesting juncture and it remains to be seen how the current disparity will resolve. One scenario is Gold breaks $1300 and this causes a mini-washout in the gold stocks and Silver. The other scenario is Gold continues to consolidate above $1300 and the gold stocks and Silver firm in anticipation of a major breakout in Gold. This is something that could take weeks to answer. In any event, we continue to remain patient and continue to accumulate the juniors we think have 5-fold potential over the next 18 months. To follow our guidance and learn our favorite juniors for the next 12-18 months, consider learning more about our service.
Gold is showing solid rallies from my $1310 area buy zone (basis April futures). From both a love trade and fear trade perspective, the fundamental picture is becoming more positive.
Please click here now. I’ve repeatedly highlighted the fact that while America has the world’s richest economy, China’s economy is vastly bigger.
Courtesy of the Visual Capitalist, this snapshot of Chinese commodity demand should provide a significant confidence booster shot for investors.
The huge demand puts a floor of support under commodities like gold… even on minor price declines.
On that note, please click here now. Double-click to enlarge this daily gold chart.
Gold is rallying for a second time from my $1310 buy zone, and there is a positive non-confirmation in play with the Stochastics oscillator.
Since hitting the $1370 resistance zone in late January, gold has consolidated in a drifting rectangular pattern. The odds of an upside breakout from this pattern are about 67%.
Importantly, that breakout implies that the price would move above the huge resistance zone at $1370!
Please click here now. While the gold trading volume on the Dubai Gold & Commodities Exchange (DGCX) is nowhere near the size of COMEX volume, it’s growing relentlessly while COMEX volume appears to have peaked.
The SGE (Shanghai Gold Exchange) is helping the DGCX. The Sharia-compliant spot gold contract launch is quite important because it should bring more stability to the overall gold price discovery process.
A rise above $1370 against the background of rising institutional money manager concern about inflation in the West would be another huge confidence boost for investors, both in America and in China.
Please click here now. Double-click to enlarge. The current price action of the dollar against the safe haven yen is truly horrific.
It’s another stronger indicator that gold is poised to move above $1370.
Please click here now. Double-click to enlarge. The oil market price action is becoming concerning.
Some of the decline can be attributed to rising US supply, but the price action is eerily similar to the US stock market. That synergy suggests that oil traders are concerned that the US economic numbers may be peaking, leading to a drop of demand for oil.
Please click here now. Double-click to enlarge. The US dollar is moving strongly higher in USD-CAD trading.
I refer to the Canadian dollar as the “Cbone”, because it is the backbone of the Canadian banking system and government. Oil exports play a big role in the Canadian economy.
The Cbone appears to be getting pummelled by inflationary tariff concerns and a potential collapse in US oil demand.
Gold often rises when commodity currencies like the Cbone rise, but in the current situation, the big FOREX traders appear to be mainly focused on what inflation and collapsing economic demand in America would mean for the US government’s ability to finance itself.
The bottom line is that twenty years of declining money velocity are coming to an end. A new inflationary era is being born in the West, albeit at a snail’s pace. That is a source of frustration for some gold stock enthusiasts.
The good news is that current time frame is probably best compared to 1968 – 1970, when interest rates and inflation began to rise.
Gold stocks perform like champions in this type of environment once the concept of growing stagflation gains widespread institutional acceptance. That time is approaching quickly now.
Please click here now. Double-click to enlarge this GDX daily chart. Range traders should take note of the buy zone at $21 and the sell zone at $25. This trading range has been in play for about a year.
If gold bursts above $1370 with rising inflation in the West and the new Dubai spot gold contract serving as wind at its back, GDX should explode upwards above $25. This would in turn see many more institutional investors come to embrace gold stocks as offering generational value with the best potential for price appreciation!
Stewart Thomson is a retired Merrill Lynch broker. Stewart writes the Graceland Updates daily between 4am-7am. They are sent out around 8am-9am. The newsletter is attractively priced and the format is a unique numbered point form. Giving clarity of each point and saving valuable reading time.
Risks, Disclaimers, Legal
Stewart Thomson is no longer an investment advisor. The information provided by Stewart and Graceland Updates is for general information purposes only. Before taking any action on any investment, it is imperative that you consult with multiple properly licensed, experienced and qualified investment advisors and get numerous opinions before taking any action. Your minimum risk on any investment in the world is: 100% loss of all your money. You may be taking or preparing to take leveraged positions in investments and not know it, exposing yourself to unlimited risks. This is highly concerning if you are an investor in any derivatives products. There is an approx $700 trillion OTC Derivatives Iceberg with a tiny portion written off officially. The bottom line:
Are You Prepared?
Today, Canadian Orebodies Inc. (TSX-V: CORE) released results from its fall 2017 Black Raven prospecting program which is indicating a significant discovery of multiple high grade gold bearing vein structures. The results are validating the company’s strategy of consolidating its land position at Black Raven as it is starting to uncover a new trend in the historic Hemlo mining camp.
Prospecting and sampling at the Black Raven Project uncovered new gold bearing veins either in outcrop or sub-cropping that are associated with a northeast trending corridor bounded by two regional shear zones: the Beggs Lake and Fallen Lake Faults, which cut through Canadian Orebodies Black Raven claims in the Hemlo greenstone belt.
“After two months of systematic prospecting and grab sampling throughout the Black Raven Property, our crew was successful in identifying a brand new two-kilometre long zone of alteration that yielded gold values up to 109.0 gpt, (the company is calling this the ABC Occurrence) in grab samples. Late in the season, we took an eight-kilometre step-out along strike to the southeast and incredibly, similar quartz veining in outcrop was located in mafic rocks which returned gold grades up to 11.9 gpt,” said Gordon McKinnon, President and Chief Executive Officer of Canadian Orebodies.
The company recently purchased the Goodchild Lake mining property which sits in the middle of the company’s 100-per-cent-owned Black Raven project. The property comprises 25 claims totalling approximately 400 hectares, increasing the company’s landholding at Black Raven to over 20,000 hectares. It lies along an eight-kilometre trend the company’s prospectors have been exploring over the past nine months.
The company purchased the claims from a company in financial hardship, Century Mining Corp., for a cash payment of $40,000 and the assumption of Century’s 3-per-cent net smelter returns royalty obligations. Orebodies also negotiated with Teck Resources Ltd. to terminate certain rights Teck had on the property in exchange for the granting to Teck of a one-half of 1-per-cent net smelter returns royalty on the property. All this helps to clean up the rights and ownership of the property and brings it under the scope of the Black Raven project.
“The Goodchild Lake acquisition covers a highly prospective property that hosts numerous high-grade historical showings. Due to the bankruptcy proceedings these claims have not seen any follow-up exploration in over a decade and a half,” said McKinnon. “With this acquisition the company has solidified its land position in the area, which will allow for an aggressive and systematic 2018 exploration program of this gold bearing system.”
Mr. McKinnon has led the Canadian Orebodies since its inception in 2008, serving as President, CEO and a Director. Mr. McKinnon was a co-founder of Mineral Streams Inc., a private mineral royalty company that was sold to AuRico Metals Inc. in 2015.
Mr. McKinnon had some spare time this morning to sit down and explain the significance of these results and what it means for the Hemlo mining camp.
What led to this acquisition?
After a couple of months of prospecting and grab sampling throughout the Black Raven Property, the crew was successful in identifying a brand new two-kilometre long zone of alteration that yielded gold values up to 109.0 gpt in grab samples – we are calling this the ABC Occurrence.
Previous sampling was showing a trend, so our prospectors just put a line on the map and said let’s do an 8-kilometre step out to test near the eastern geological contact. It produced a significant amount of notable showings such as 109.0 gpt Au, 46.8 gpt Au, 15.0 gpt Au, 14.7 gpt Au, 11.9 gpt, Au, 11.6 gpt Au, 9.7 gpt Au and 7.8 gpt Au over an 8 kilometre strike length. It was at this point that we realized we had discovered a potentially significant structure that was capable of producing high grade gold values over a large scale.
The company that owned the property was in bankruptcy, it fills a hole right in the middle of our Black Raven property that has shown several high grade gold values. The trend of the structure goes right through this system. Structure is very important to what we are exploring here. This could be the first new discovery since Hemlo, we are talking size and under-explored ground that has not been systematically tested before.
What are your plans now that you have consolidated a position in the Hemlo camp?
Our plan is to be thorough and systematic in testing our hypotheses. We’re currently in the midst of planning the detailed exploration program for 2018 which will include two airborne surveys commencing as soon as weather permits. That will be followed up by having four or five crews continue to map and prospect the property. We plan on sampling throughout the summer and conducting a drill program in late summer or early fall. Further details regarding the 2018 program will be made available in the near term.
Barrick is currently conducting a study at its William mine in the Hemlo camp to extend the life of the mine. The object of the study is to evaluate the potential of converting Hemlo back in to a core asset for the company. The camp is heating up with the potential to discover new deposits in underexplored parts of a known district that has a storied history.
We are confident with our team who know the Hemlo area well. Bruce Mackie has more than 40 years of mining industry experience. He has a proven exploration record, having managed several successful projects in gold, base metals and uranium in senior positions with Noranda, Hemlo Gold and North American Palladium.
On the board we have John Harvey, who served as President and CEO of Hemlo Gold Mines Inc. from 1989 to 1991. He also was President of Noranda Exploration from 1982 to 1994 and was most recently the Chief Operating Officer of Noront Resources until 2009.
Serving as an advisor to the company is Robert Middleton, who led the Rosario Resources team that discovered the Bell Creek Mine in Timmins, Ontario and, in 1982, he played a role in drilling the discovery hole at the Goliath Mine in Hemlo, Ontario. He is also credited with discovering the Cross Lake zinc deposit near Timmins, Ontario in 1997 and conducted exploration in the Nipigon Plate that led to the discovery of the Seagull PGE deposits.
In short, we have much of the original team from the days of Hemlo’s discovery.
What is your financial position?
The company is fully funded for our exploration plans; the company is not looking for money right now. Currently we have approximately $2.5 million, which is enough for us to conduct our exploration work this summer. Also with Northfield Capital, Osisko Mining, Rick Rule and management holding the majority of stock, the shares are in committed hands and well supported for the foreseeable future.
What are your plans with Wire Lake?
The new gold zone discovered on surface approximately 600-metre to the south is definitely something that we want to follow up on. To date we’ve found a significant amount of gold on the Wire Lake property – including wide and near surface intersections, but no orebody yet. We plan to do some follow up exploration work over the course of the year.
The company has been relatively quiet in the market?
We received some criticism for being quiet, but it takes time to put all the results together given the frequent backlog at assay labs this past year. We were the only ones working with Century Mining on its claims, and it still took nine months of negotiations to secure the transaction. Going forward there will be regular news flow as we advance exploration.
Bruce MacLachlan, a prospector working for the company, said that in his 30+ year career which included 18 years in the Hemlo camp, he had never had a summer like that in terms of the prospecting results he was seeing.
I truly think that Canadian Orebodies could be onto the next major discovery.
Gold was well bid during the equity correction but it could not breakout then and has retreated as equities have roared back. As a result, the Gold to stocks ratio has retraced most of its recent surge. Meanwhile, the US Dollar has rebounded and the oversold and overhated bond market could be starting a rally. The recent rise in long-term bond yields which has benefitted Gold appears due for a pause or correction. Meanwhile, Gold could also correct and consolidate as it waits for a breakout in long-term bond yields which should in turn benefit Gold.
As we noted in One Big, Potential Catalyst for Gold in 2018, Gold is no longer trading with bonds and therefore could benefit from a big breakdown in bonds. As the chart below shows, the bond market has experienced a major breakdown. In recent days, the 5-year, 10-year and 30-year bonds all touched multi-year lows.
The breakdown in the bond market has helped Gold rally but why hasn’t Gold reached the corresponding multi-year highs?
First, we should remember that the correlation between Gold and bonds was positive until November 2017. The market has begun to sense inflation only recently.
Second, while bond prices have broken down to multi-year lows, bond yields (and specifically long-term yields) have yet to breakout to multi-year highs.
The chart below shows long-term yields are testing multi-year resistance. For the 10-year yield, a strong push above 3.00% would mark more than a 6-year and almost 7-year high. A break above 3.25% in the 30-year yield would mark a 4-year high.
We have argued that Gold was unlikely to breakout immediately due to its lack of relative strength as well as the lack of strength from Silver and the gold shares.
If that remains the case then we would also expect bond yields to correct and digest their recent advance rather than breakout. We should also note that the daily sentiment index for bonds hit an 18-day average of 15% bulls. That is a bearish extreme and suggests the probability that bonds will rebound and yields will decline.
Gold could be waiting for a major breakout in bond yields, which would be a reflection of increasing inflation and inflation expectations. It would also result in more pressure on the economy and therefore the stock market. That would benefit Gold in both nominal and real terms. We expect a counter-trend move in Gold and bond yields before a breakout. This will allow us a bit more time to position in the juniors that should deliver fantastic returns. To follow our guidance and learn our favorite juniors for the next 12-18 months, consider learning more about our service.

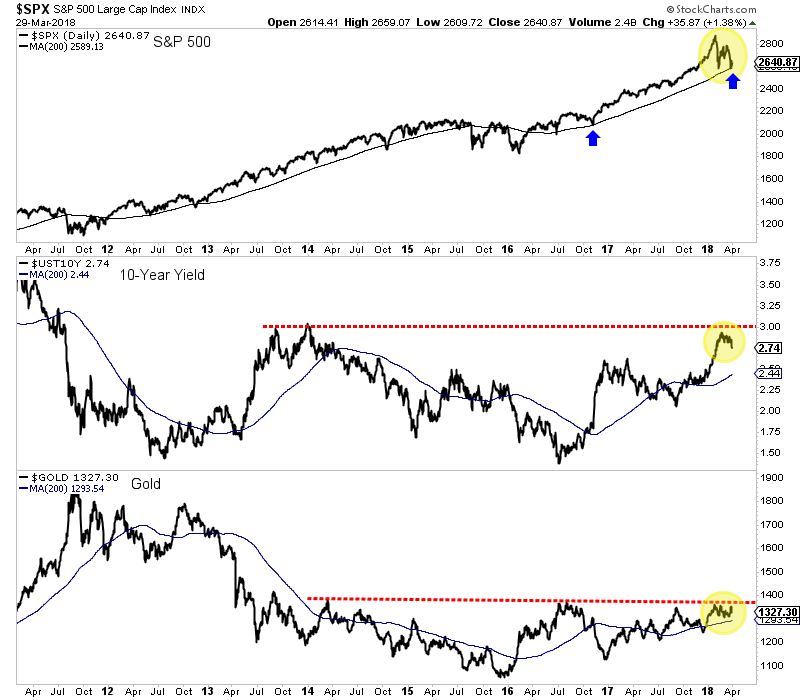

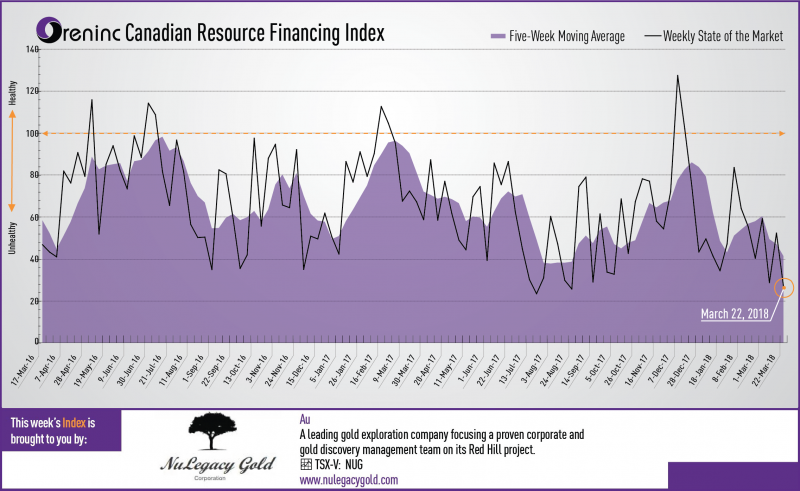
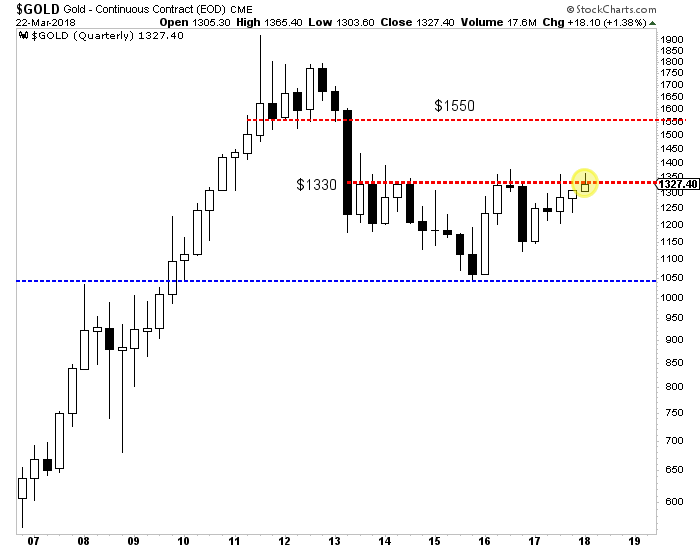
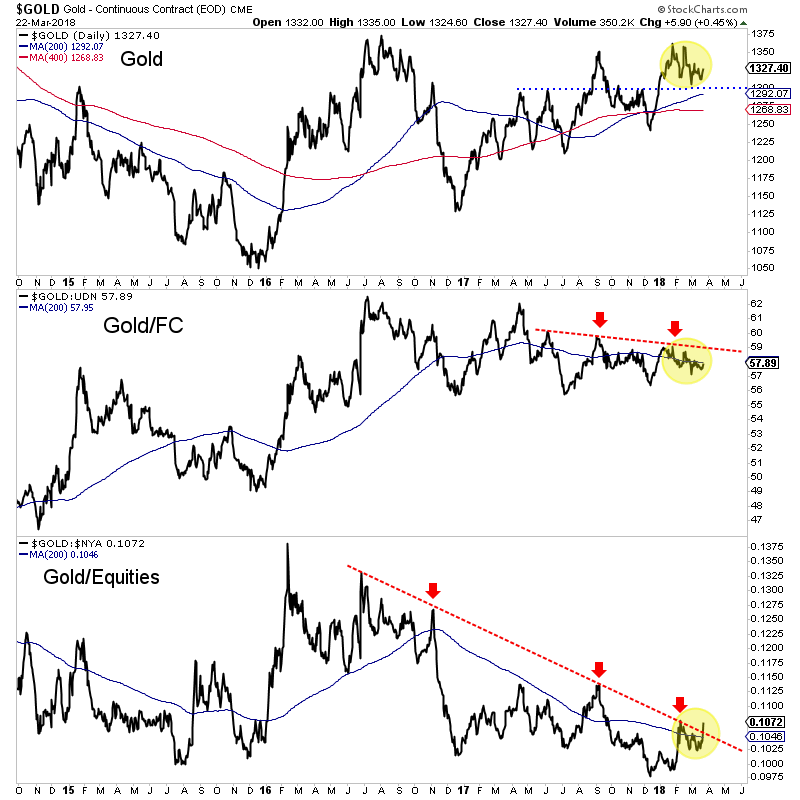


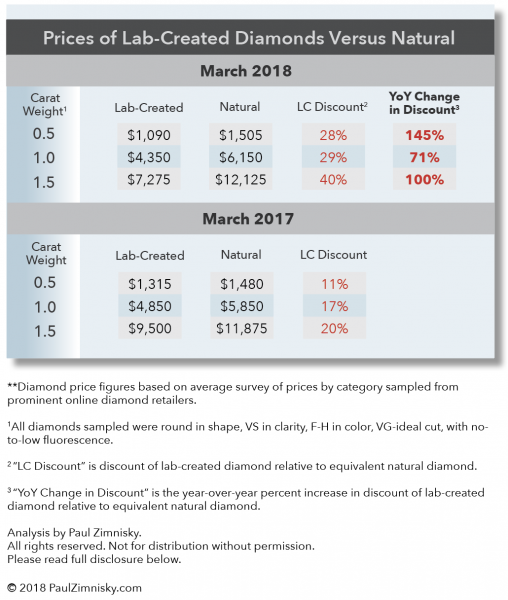
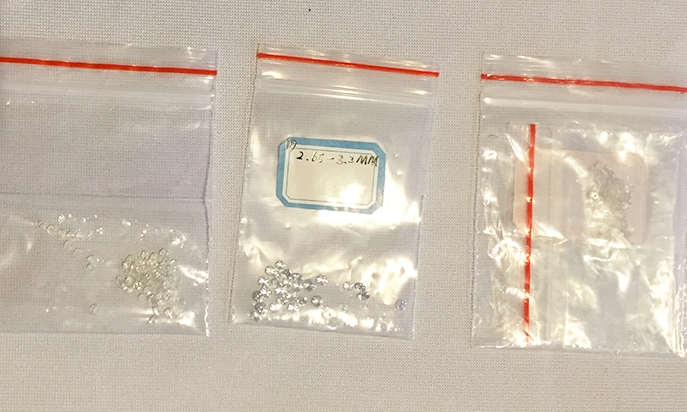
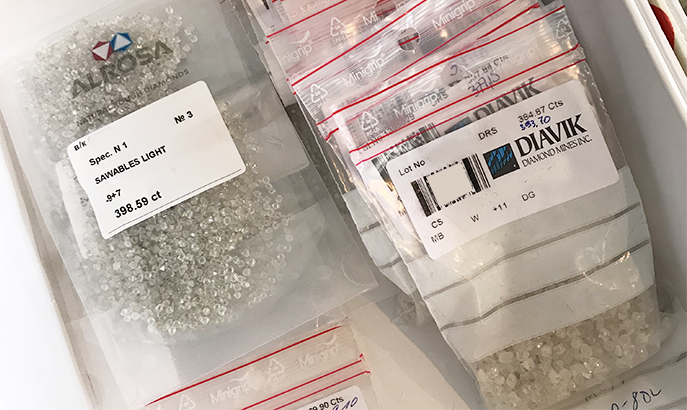
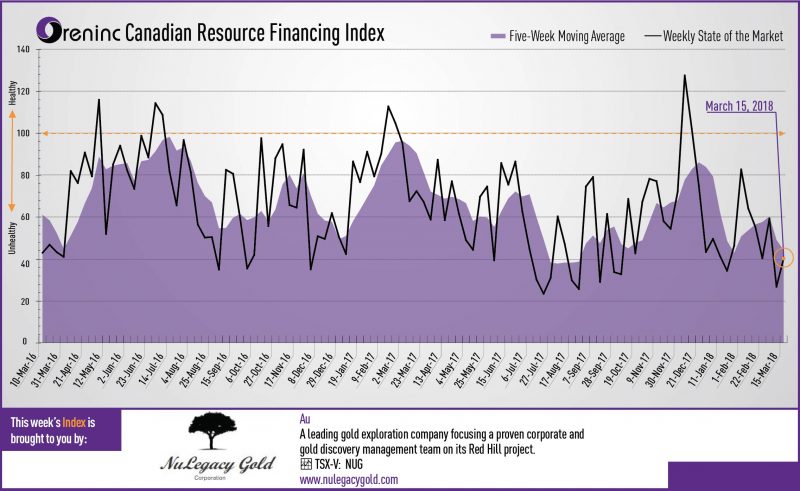

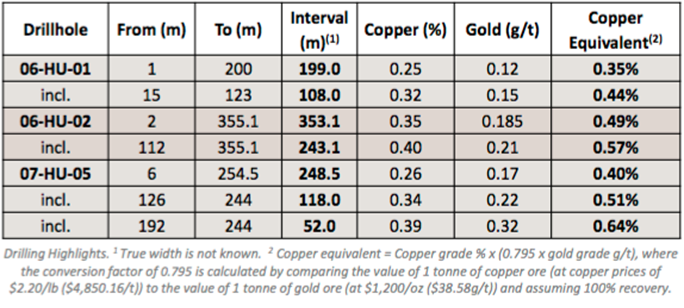

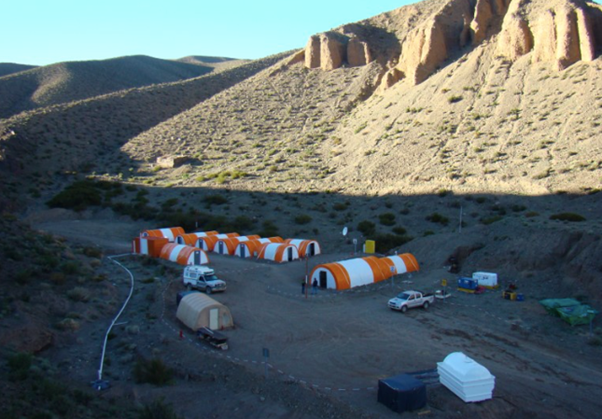
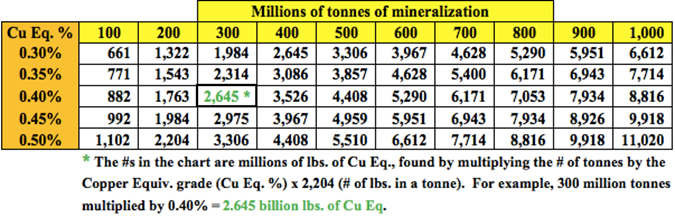
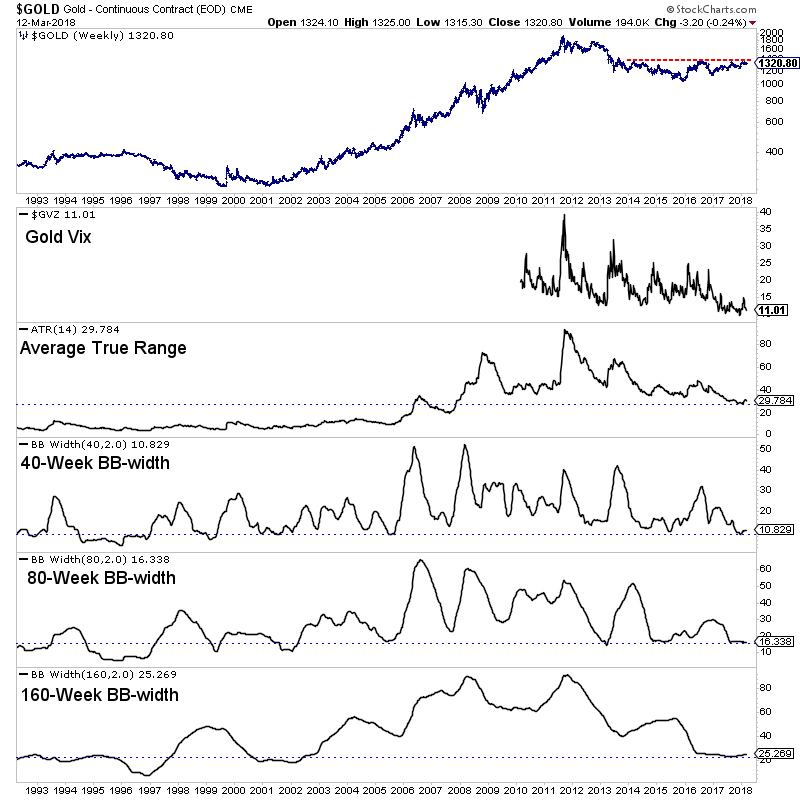
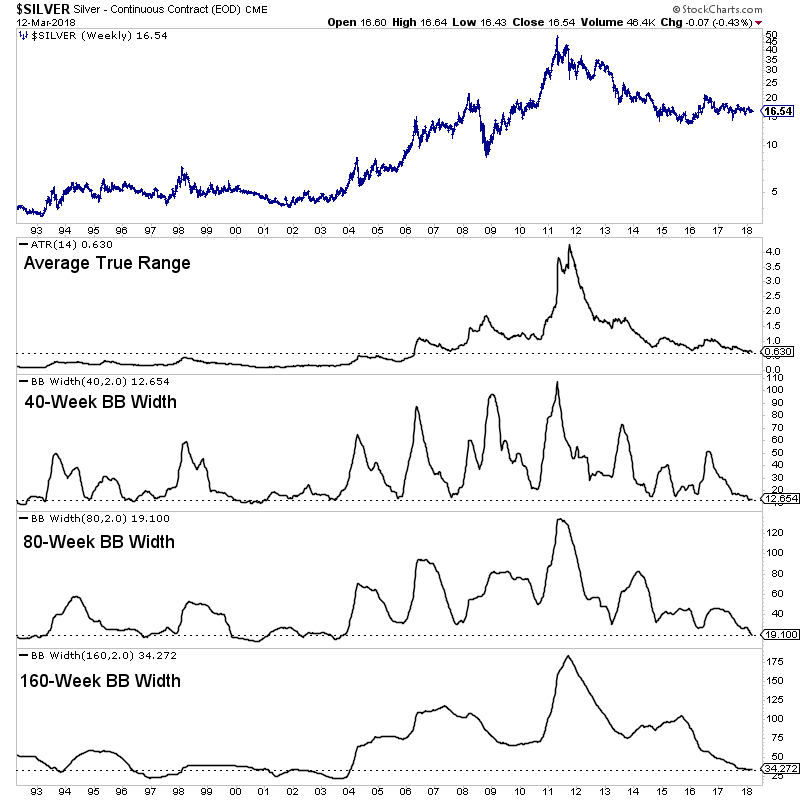

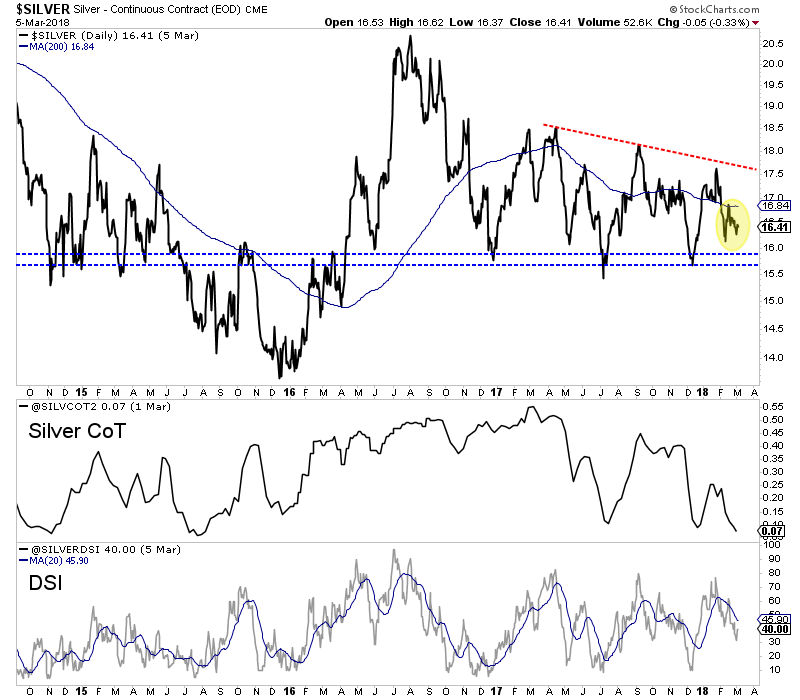

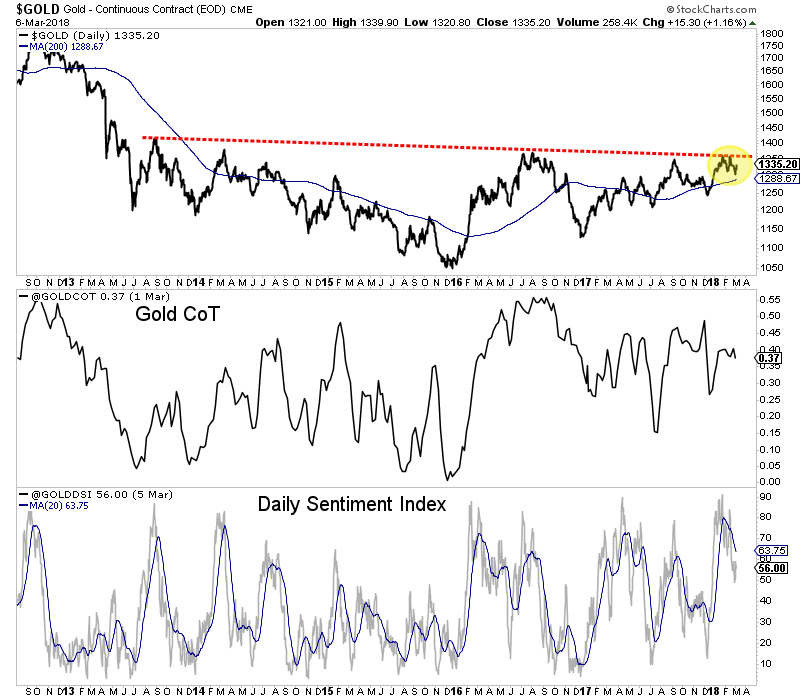

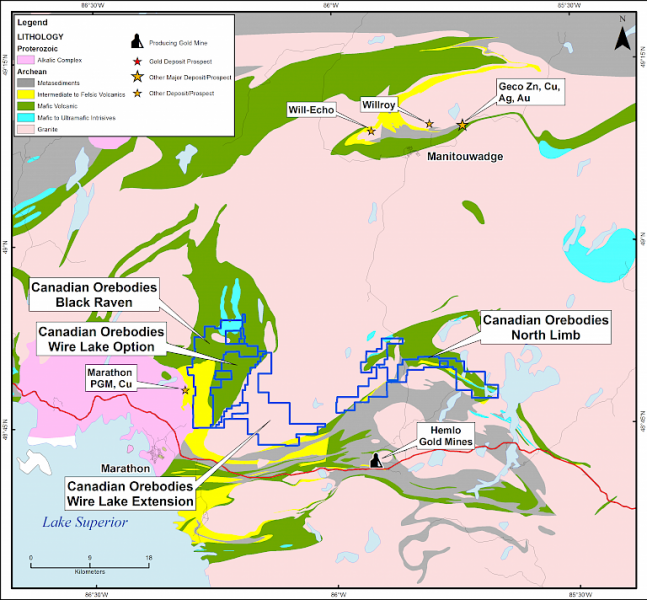
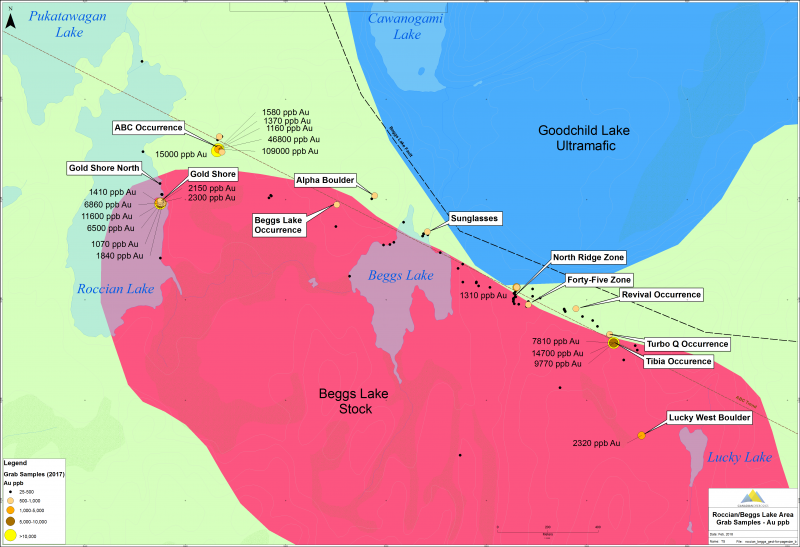
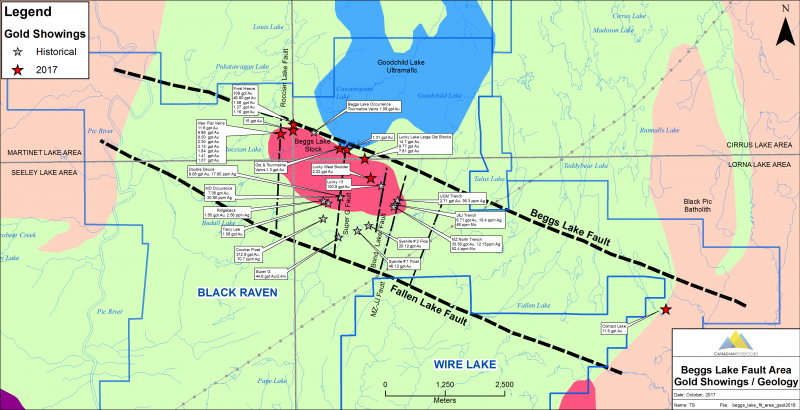

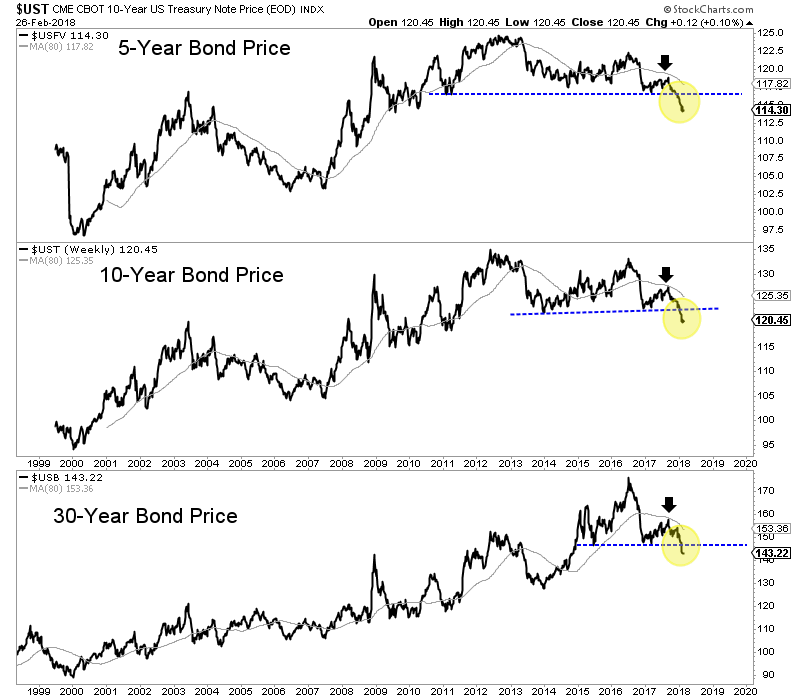
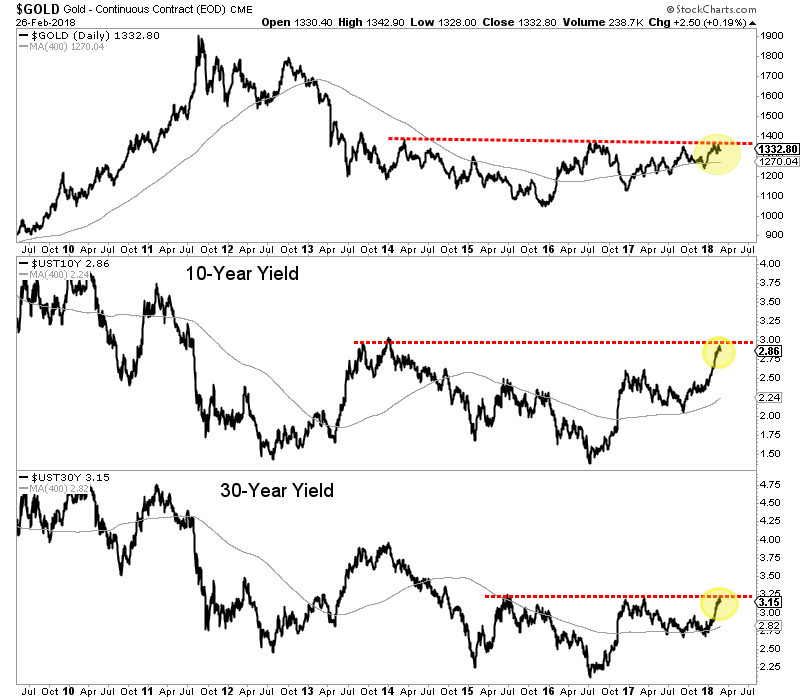
 Follow us on Twitter
 Become our facebook fan


