Argentinian lithium producer Orocobre (TSX: ORL) recently reported lower than expected lithium production in its third fiscal quarter because weather interfered with its evaporation rates of its lithium brines. This reveals two problems with lithium brine production: reliability and geography. Another source of lithium is rising to met these problems, hard rock lithium mining.
One analyst pointed out that Orocobre’s production problems “clearly demonstrate” that production is not a straightforward process. “Weather events are beyond the control of Orocobre, but this reaffirms that there is still room to improve on the robustness of operations and reduce production variability from we ather impacts,” the analyst stated.
The company reported a 25-per-cent lower evaporation rate compared with the same quarter in 2017 which caused production problems and lithium output to fall 29 percent to 2,802 tonnes of Lithium Carbonate equivalent, from 3,937 tonnes in the December quarter. Its February rates were the lowest since 2011.
Weather has clear impacts on the production at lithium brine operations and with global demand for lithium on the rise, more reliable and consistent methods of production will be required. Lithium brine operations are limited to select climates and regions that can support sufficient weather to ensure economic processing.
Demand for the metal is set to grow by 600,000-800,000 tonnes of lithium carbonate equivalent over the next 10 years, Daniel Jimenez, senior commercial vice president at SQM, said.
The global lithium industry will need $10 billion to $12 billion of investment over the next decade to meet surging demand amid the electric vehicle boom, Daniel Jimenez of Chilean miner SQM said.
Not all lithium is equal and not all lithium is mined the same way. There are two significant sources of lithium, Lithium Brines and Lithium-Cesium Tantalum Pegmatites (hard rock).
According the United States Geological Survey’s 2018 Mineral Commodity Summaries, Australia was the largest producer of lithium. It produced 18,700 MT of lithium last year, up 3,300 MT from the previous year. The 34-percent increase has been attributed to two new spodumene operations that ramped up production to meet strong demand.
Australia hosts the Greenbushes lithium asset, which is operated by Talison Lithium, a subsidiary jointly owned by Tianqi Lithium (SZSE:002466) and Albemarle (NYSE:ALB). Greenbushes is the longest continuously operating mining area in Western Australia, having been in operation for over 25 years.
These production figures helped to push Australia as the top lithium producing country and it shows how hard rock lithium mines have the potential to disrupt traditional sources of lithium from older operators of lithium evaporation ponds.
Hard rock lithium deposits are not limited to select climates and regions and are going to help fill the demand as they are more evenly geographically distributed across the globe and are less dependant on a changing climate for production.
It was music to gold bug ears.
We’ve all heard the seemingly shocking or outrageous price targets for Gold. So it’s not new.
But this time from a non gold pusher. Someone with credibility in the larger financial world and a track record to boot.
Gundlach’s comment was included in every piece of Gold literature that recently crossed my desk. No doubt, if Gold starts breaking to the upside, Gundlach’s quote will be used by aggressive marketers and publishers. But I digress.
According to ZeroHedge, Gundlach said that based on classic chart reading, there is an “explosive, potential energy” of a huge “head and shoulders bottom” base, signaling a move of $1000/oz.
But there’s one problem.
I like Jeff Gundlach. He’s way smarter and way more successful than me.
But there’s no technical basis for $1000/oz upside in Gold.
The measured upside target from the recent years of consolidation projects to $1700/oz. Upon a break above $1375/oz, the target becomes $1700/oz, with a pit stop likely around $1550/oz.
The next strong technical targets, following $1700 are $1800 and $1900, the all-time high.
The biggest moves (in nominal terms) in most markets occur after breakouts to new all time highs.
As you can see, Gold is one of the best examples of this. Look at how Gold surged after 1971, 1978 and 2009.
Gold Weekly Line Chart
The potential breakout through $1375/oz would be the most significant one since 2005 when Gold took out +20 year resistance to make a new multi-decade high. Sure, the breakouts in 2008 and 2009 were quite significant but Gold’s bull market was already well established.
Circling back to Gundlach’s target, I don’t see anything technically that points to $2,375 being a strong target. The strongest targets are $1700, $1800 and $1900. The most significant upside move would likely be a retest of the all time high. That is roughly $525/oz of upside.
But upside of $1000/oz sounds better and makes for better headlines than $525/oz of upside. In other words, it will get picked up by media outlets. (Think of Jim Rickards $10,000 target which has been given quite a bit of coverage on mainstream outlets).
My guess is Gundlach thinks Gold is going to break to the upside and his $1000/oz upside call is a way for him to get credit for calling the breakout while remaining front and center in the media.
At present, Gold is trying to recover after failing to make a weekly close above $1350/oz for five consecutive weeks. The good news is the gold stocks have held up quite well and so too has Gold priced against foreign currencies. If these conditions persist during weakness in Gold then it suggests Gold would have another chance to breakout sooner rather than later. In anticipation of that breakout, we have been accumulating the juniors with 300% to 500% upside potential over the next 18-24 months. To follow our guidance and learn our favorite juniors, consider learning more about our premium service.
The gold miners’ stocks have mostly been consolidating low this year, exacerbating bearish sentiment. Even with gold grinding higher in a solid uptrend and nearing a major upside breakout, the gold stocks just can’t get any love. But that may be about to change, with gold and its miners’ stocks in the midst of their spring rally. Strong seasonal tailwinds make May one of the best months of the year in gold-stock bulls.
Gold-stock performance is highly seasonal, which certainly sounds odd. The gold miners produce and sell their metal at relatively-constant rates year-round, so the temporal journey through calendar months should be irrelevant. Based on these miners’ revenues, there’s little reason investors should favor them more at certain times of the year than others. Yet history proves that’s exactly what happens in this sector.
Seasonality is the tendency for prices to exhibit recurring patterns at certain times during the calendar year. While seasonality doesn’t drive price action, it quantifies annually-repeating behavior driven by sentiment, technicals, and fundamentals. We humans are creatures of habit and herd, which naturally colors our trading decisions. The calendar year’s passage affects the timing and intensity of buying and selling.
Gold stocks exhibit strong seasonality because their price action mirrors that of their dominant primary driver, gold. Gold’s seasonality generally isn’t driven by supply fluctuations like grown commodities experience, as its mined supply remains fairly steady all year long. Instead gold’s major seasonality is demand-driven, with global investment demand varying dramatically depending on the time within the calendar year.
This gold-demand seasonality is well-known and heavily studied. The seasonal gold year starts in late July as Asian farmers begin reaping their harvests. They plow some of their surplus income into gold. That’s followed by the famous Indian wedding season in autumn, with its heavy gold buying for brides’ dowries. That culture believes festival-season weddings have greater odds of yielding long, successful marriages.
After that comes the Western holiday season, where gold jewelry demand surges for Christmas gifts for wives, girlfriends, daughters, and mothers. Following year-end, Western investment demand balloons after bonuses and tax calculations as investors figure out how much surplus income the prior year generated for investment. Then Chinese New Year gold buying flares up after that heading into February.
These understandable cultural factors drive surges of outsized gold demand between summer and late winter. But interestingly there is one more gold-demand spike in spring. Over the years I’ve seen a variety of theses explaining this April-and-May seasonal gold rally, but nothing definitive like for the rest of the year’s gold seasonality. As silly as it sounds, I suspect spring itself is the reason for this demand surge.
Sentiment exceedingly influences investing, which requires optimism for the future. Investors won’t risk deploying their scarce capital unless they believe it will grow. And the glorious expanding sunshine and warming temperatures of spring naturally breed optimism. The vast majority of the world’s investors are far enough into the northern hemisphere that spring has a major impact. This seasonality extends to stocks too.
Since it’s gold’s own demand-driven seasonality that fuels the gold stocks’ seasonality, that’s logically the best place to start to understand what’s likely coming. Price action is very different between bull and bear years, and gold is absolutely in a young bull market. After being crushed to a 6.1-year secular low in mid-December 2015 on the Fed’s first rate hike of this cycle, gold powered 29.9% higher over the next 6.7 months.
Crossing the +20% threshold in early March 2016 confirmed a new bull market was underway. Gold corrected after that sharp initial upleg, but normal healthy selling was greatly exacerbated following Trump’s surprise election win. Investors fled gold to chase the taxphoria stock-market surge. Gold’s correction cascaded to monstrous proportions, hitting -17.3% in mid-December. But that was shy of a new bear’s -20%.
Gold’s last mighty bull market ran from April 2001 to August 2011, where it soared 638.2% higher! And while gold consolidated high in 2012, that was technically a bull year too since gold just slid 18.8% at worst from its bull-market peak. Gold didn’t enter formal bear-market territory at -20% until April 2013, thanks to the crazy stock-market levitation driven by extreme distortions from the Fed’s QE3 bond monetizations.
So the bull-market years for gold in modern history ran from 2001 to 2012, skipped the intervening bear-market years of 2013 to 2015, and resumed in 2016 to 2017. Thus these are the years most relevant to understanding gold’s typical seasonal performance throughout the calendar year. We’re interested in bull-market seasonality, because gold remains in its young bull today and bear-market action is quite dissimilar.
This chart averages the individually-indexed full-year gold performances in those bull-market years from 2001 to 2012 and 2016 to 2017. 2018 isn’t included yet since it remains a work in progress. This chart distills out gold’s bull-market seasonal tendencies in like percentage terms. Quantifying gold’s bull-market seasonal tendencies requires all relevant years’ price action to be recast to be perfectly comparable.
That’s accomplished by individually indexing each calendar year’s gold price action to its final close of the preceding year, which is recast at 100. Then all gold price action of the following year is calculated off that common indexed baseline, normalizing all years regardless of price levels. So gold trading at an indexed level of 105 simply means it has rallied 5% from the prior year’s close, while 95 shows it’s down 5%.
This methodology renders all bull-market-year gold performances in like percentage terms. That’s critical since gold’s price range has been so vast, from $257 in April 2001 to $1894 in August 2011. Finally each calendar year’s individually-indexed gold prices are averaged together to arrive at this illuminating gold-bull seasonality. Gold has always tended to enjoy strong rallies in the spring months of April and May.
During these modern bull-market years from 2001 to 2012 and 2016 to 2017, gold’s spring rally tended to start in mid-March on average. From that major seasonal low following the winter rally, gold often starts grinding higher before its gains accelerate through April and most of May. This spring rally has generally run its course by late May. Across the 14 bull years in this study, gold averaged nice spring rallies of 3.7%.
This spring rally unfolds rapidly, with an average duration of just 2.2 months. That makes it the smallest and shortest of gold’s three major seasonal rallies, falling way behind the champion 9.5% winter rally that precedes it and strong 6.6% autumn rally that follows the summer doldrums. Nevertheless, it is still well worth trading. 3.7% gains still really make a difference, and naturally about half of years exceed this average.
This year gold’s spring-rally bottoming came on March 20th, when gold closed at $1310 the day before the Fed was universally expected to hike for the 6th time in this cycle. That was March’s 14th trading day this year, right in line with gold’s average seasonal low on March’s 10th trading day. And so far gold has largely followed the spring-rally seasonal pattern since, gradually grinding higher from late March to mid-April.
Climbing the typical 3.7% from that spring low into May’s spring-rally topping would propel gold to $1358. That’s right on the verge of being a major decisive breakout from the horizontal $1350 resistance line that gold-futures speculators watch like hawks. And it isn’t far from new bull-market highs above July 2016’s $1365 bull-to-date peak. As I wrote last week, this spring rally really ups the odds gold is nearing a bull breakout!
And given its performance in April, gold ought to see a bigger May rally than usual this year. On average in these 14 modern bull-market years, gold climbed 1.8% in Aprils then another 1.3% into its late-May spring-rally toppings. But as of the middle of this week, gold was actually down 0.1% month-to-date in April. That’s poor performance by April standards, setting up this May for a strong mean-reversion rally.
Historically this spring-rally April-May span is often self-equalizing. If gold materially underperforms or outperforms its seasonal averages in April, its May performances tend to mean revert and overshoot in the opposite direction. Back in 2009 for example, gold fell 3.4% in April but then blasted 10.0% higher in May! In 2016 gold surged 5.1% in April before dropping 6.1% in May. Weak Aprils often lead to strong Mays.
If gold is bid too aggressively in April, the resulting excitement entices in and exhausts all available near-term buying before the summer doldrums. That certainly hasn’t happened this year. Gold rallied into mid-April, but reversed sharply on a strong short-covering rally in US Dollar Index futures. Thus gold has largely drifted sideways on balance this month. So the usual spring buying likely hasn’t even started yet!
That leaves traders with full capital firepower to flood back in in May, likely as the sharp USDX rally runs out of steam. The delayed spring-rally gold buying this year can all be compressed into May, which really increases the odds of outsized gains. While nothing is guaranteed in seasonals since they merely use multi-year averages to reveal trend tendencies, strong Mays are definitely more likely following weak Aprils.
And as goes gold, so go gold stocks. Gold stocks also exhibit strong seasonality, which is of course the direct result of gold’s own seasonality. Since gold-mining costs are largely fixed when mines are being planned, fluctuations in gold’s price flow directly into amplified moves in gold-mining profits. Higher gold prices drive much-higher earnings for the gold miners, which attract in more investors to bid up stock prices.
The ironclad historical relationship between the price of gold, gold-mining profitability, and therefore the gold-stock price levels is exceedingly important to understand. If you need to get up to speed, I wrote an essay looking at gold-stock price levels relative to gold early last month. Fundamentally gold stocks are leveraged plays on gold. Thus they really outperform in the spring due to gold’s strong seasonal rally.
This next chart applies this same bull-market-seasonality methodology used on gold directly to the gold stocks. It looks at the average annual indexed performance in the flagship HUI NYSE Arca Gold BUGS Index in these same bull-market years of 2001 to 2012 and 2016 to 2017. Because of gold’s dominant influence over gold-mining earnings, gold-stock seasonality naturally mirrors and amplifies gold’s own seasonality.
Gold stocks’ seasonal spring rally is much stronger than gold’s, buttressing that spring-optimism-drives-stock-buying thesis. Between mid-March and early June, the gold stocks have averaged hefty 12.8% rallies in these 14 modern bull-market years. That makes for exceptional 3.5x upside leverage to gold’s 3.7% seasonal spring rally! Interestingly this is gold stocks’ best seasonal leverage to gold’s gains by far.
While the HUI averaged 15.5% surges during gold’s winter rally, that only made for 1.6x upside leverage to gold’s big 9.5% gain. And the HUI’s 10.5% average gain during gold’s autumn rally also only amplified gold’s 6.6% gain by 1.6x. So while the gold-stock spring rally’s 12.8% average gains rank second out of these three seasonal rallies, it offers the most bang for the buck in gold-stock upside compared to gold!
This year the gold stocks’ spring-rally bottoming happened on March 20th, the same day as gold’s. The HUI slumped to 169.2 that day. Since then this leading gold-stock index has recovered 6.9% as of the middle of this week, trouncing gold’s 1.0% spring-rally gains so far. A merely-average spring rally would take the HUI to 190.9 by late May or early June, which is another 5.6% higher from here. That’s worth riding.
But if gold’s seasonal spring rally is compressed into May, and strong buying forces it over $1350 or even better its $1365 bull-to-date high, the gold miners’ stocks have far more near-term upside potential. For the most part gold stocks remain deeply out of favor, forgotten or ignored. But they will explode back on to speculators’ and investors’ radars if major new gold highs attract the financial media’s interest and attention.
Again as I discussed last week, gold’s nearing bull breakout will work wonders for not only psychology but hard gold-mining profits. The gold stocks are radically undervalued today compared to their actual underlying fundamentals. In Q4’17 gold averaged about $1276 per ounce, but the major gold miners of the leading GDX VanEck Vectors Gold Miners ETF reported average all-in sustaining costs of just $858 per ounce!
So they were already collectively earning fat operating profits of $418 per ounce. And these are going to soar in Q1’18, because the average gold price surged 4.1% quarter-on-quarter to $1329. Since mining costs are largely fixed, all-in sustaining costs will likely stay flat from Q4. That means major gold miners’ operating profits are likely to rocket 12.7% QoQ to $471 per ounce! That will delight contrarian investors.
The gold miners will be releasing these latest Q1 results between now and mid-May, right when gold is powering higher in its seasonal spring rally. So the gold stocks are certainly set up for an outsized spring rally this year! The potent combination of absurdly-cheap gold-stock prices, surging earnings forcing their valuations even lower, and higher gold prices attracting financial-media attention should really stoke traders’ interest.
This last chart breaks down gold-stock seasonality into even-more-granular monthly form. Each calendar month between 2001 to 2012 and 2016 to 2017 is individually indexed to 100 as of the previous month’s final close, then all like calendar months’ indexes are averaged together. Slicing up seasonal tendencies this way shows May has averaged the second-strongest monthly gold-stock gains in modern bull-market years.
During these 14 Aprils in modern gold bull-market years, the gold stocks as measured by the HUI saw average gains of 1.6%. But the lion’s share of the spring-rally gains came in May, where average gains more than tripled to 5.0%! For decades if not longer, May has been one of the best and most-important months to be heavily long gold miners’ stocks. Only February proved better seasonally at a +5.4% average.
The key to gold stocks’ spring rally is to get your capital deployed in mid-March, when gold stocks swoon to their spring-rally bottoming. In intra-month terms the initial gains are often fast in late March as gold stocks rebound out of oversold lows. But then the spring rally tends to slow down in April, discouraging impatient and short-sighted traders. The real gains come in May, and next month’s setup is exceptionally bullish.
Of course the standard seasonality caveat applies that these are mere tendencies, not primary drivers of gold or gold stocks. Seasonal tailwinds can be easily drowned out by bearish sentiment, technicals, and fundamentals. Seasonality doesn’t always work, especially when it doesn’t align with the primary drivers of sentiment, technicals, and fundamentals in that order. Thankfully that certainly isn’t the case this year.
The gold miners’ stocks aren’t entering their second-strongest month of the year overbought after a big rally. Quite the contrary, they have really underperformed year-to-date on excessive bearishness. This week the HUI was actually still down 6.0% so far in 2018, far behind gold’s modest 1.6% gain! Since gold-mining profits amplify gold price moves, gold-stock prices tend to leverage gold by 2x to 3x much of the time.
Thus spring rally aside the HUI should already be up 3.1% to 4.7% year-to-date, or trading between 198.3 to 201.4 compared to this week’s anomalously-low 180.8. That’s another 9.6% to 11.3% higher from here even if gold merely stays near $1325. The gold stocks are overdue to mean revert higher no matter what gold does! Gold’s spring rally will simply hasten and enlarge gold stocks’ long-delayed next upleg.
The farther gold rallies in May in one of its strongest spans of the year seasonally, the closer it will get to major breakouts and new highs. The higher gold climbs, the more attention it will get from the financial media, investors, and speculators. As their sentiment turns bullish again, capital will flood back into the beaten-down gold stocks. The gold miners’ coming surging earnings in their Q1 results are icing on the cake.
While investors and speculators alike can certainly play gold stocks’ coming spring rally with the major ETFs like GDX, the best gains by far will be won in individual gold stocks with superior fundamentals. Their upside will trounce the ETFs’, which are burdened by over-diversification and underperforming gold stocks. A carefully-handpicked portfolio of elite gold and silver miners will generate much-greater wealth creation.
At Zeal we’ve literally spent tens of thousands of hours researching individual gold stocks and markets, so we can better decide what to trade and when. As of the end of Q4, this has resulted in 983 stock trades recommended in real-time to our newsletter subscribers since 2001. Fighting the crowd to buy low and sell high is very profitable, as all these trades averaged stellar annualized realized gains of +20.2%!
The key to this success is staying informed and being contrarian. That means buying low before others figure it out, before undervalued gold stocks soar much higher. An easy way to keep abreast is through our acclaimed weekly and monthly newsletters. They draw on my vast experience, knowledge, wisdom, and ongoing research to explain what’s going on in the markets, why, and how to trade them with specific stocks. For only $12 per issue, you can learn to think, trade, and thrive like contrarians. Subscribe today, and get deployed in the great gold and silver stocks in our full trading books!
The bottom line is gold stocks experience a strong spring rally seasonally. This is driven by gold’s own seasonality, where outsized investment demand arises at certain times during the calendar year. Gold usually enjoys a strong spring rally likely driven by the universal optimism this season brings. And since gold drives gold miners’ profitability, their stock prices naturally follow it higher while amplifying its gains.
And gold stocks’ already-strong spring rally is likely to prove exceptional this year. Gold stocks have really lagged gold so far in 2018, despite fat earnings rapidly growing with higher gold prices. Once gold nears breakouts, traders are going to remember the gold miners and be amazed by their dirt-cheap stock prices wildly disconnected from fundamentals. They will flood back into this small sector catapulting it higher.
Adam Hamilton, CPA
April 27, 2018
Copyright 2000 – 2018 Zeal LLC (www.ZealLLC.com)
The Critical Investor profiles a miner that is ramping up its gold mine in Nevada on time and on budget.
Pan Mine, Nevada
1. Introduction
Fiore Gold Ltd. (F:TSX.V; FIOGF:OTCQB) has progressed its Pan Mine in Nevada, U.S. in a very steady fashion, on time and on budget. Exploration for additional resources (and hopefully years of mine life as well) has been successful so far, and a new COO has been hired. Recently, the latest financials regarding the first quarter of the new year were released, which are always an interesting reference of the state of a company, especially with producers. Therefore, it was time to have a closer look at Fiore Gold, Frank Giustra’s baby. Besides an update on proceedings, the other purpose of this article will be the outlining of future cash flow and valuation potential, as I view Fiore Gold as misunderstood by the markets at the moment.
All presented tables are my own material, unless stated otherwise.
All pictures are company material, unless stated otherwise.
All currencies are in US Dollars, unless stated otherwise.
2. Pan Mine
The ramping up of the Pan Mine is progressing according to plan, and the company is actually ahead of schedule, as the production rate increased from the planned 10,000 tpd capacity to 14,000 tpd, which was supposed to happen much later. The highlights of the first quarter of fiscal year 2018 are according to the news release:
Revenues of $8.26 million from the sale of 6,467 gold ounces with a gross margin of $2.54 million or 31%.
Inventory of 11,335 estimated recoverable ounces placed on the leach pad at Pan as of December 31, 2017.
Working capital of $13.51 million as of December 31, 2017.
The first full quarter of steady-state production at the Pan Mine in Nevada.
Operating costs ($/ore ton) 6.2% below budget for the quarter.
Successful construction of the Phase II heap leach pad at the Pan Mine, adding an additional 2.2 million square feet of leach pad space. Approximately $5.3 million of capital expenditures for the Phase II expansion was treated as sustaining capital costs for the quarter, resulting in significantly higher All-In Sustaining Costs (AISC) for the current period.
Let’s dig a little deeper into the financials here. In the first quarter of the current financial year, Fiore was surprisingly able to report a comprehensive income of $3.05M, or roughly 3 cents per share. However, this strong net profit was predominantly caused by an unrealized benefit from the fair value of the warrants (in green) and the lack of any tax payments (in red):
The tax holiday is into effect as the company has substantial carry forward losses (in red):
The operating income in the first quarter was $780,000. Fiore Gold is debt-free though, as the long-term liabilities (in green) aren’t long-term debt obligations.
The cash flow statements indicate a ramping up producer as well. The operating cash flow (or OCF, before changes in Fiore’s working capital position, which is the most reliable figure for small producers, especially when ramping up, as OCF after changes can vary a lot in this case) was approximately $1.5M (OCF in orange, without changes in working capital in red, for an operating cash flow of approximately 225 dollar per ounce), and this wasn’t sufficient to cover the $4.4M in capital expenditures (in green):
However, there are two important remarks to make here.
First of all, Fiore Gold plans to produce 35,000-40,000 oz Au this year. Even if the lower end of this guidance is used, Fiore Gold will still have to produce about 35,000 – 6,467 = 28,500 oz Au in the next three quarters of its financial year. This equates to an average of 9,500 oz Au per quarter, or an increase of almost 50% compared to the Q1 production rate.
This means that if production increases, the economies of scale will start to have an effect and the operating margins will improve. Keep in mind that the quoted margin of $225/oz in the first quarter includes $1.267M in G&A expenses. The G&A cost per ounce was $195 in Q1, when this fixed cost could be spread out over 9,500 oz, it drops to $133/oz, which is a pretty substantial improvement. On top of that, the other relatively fixed expenses will also be divided over more ounces. So, the margins will increase as more gold is being produced.
Second, Fiore Gold has guided for a full year capex of $5.5M (red):
On a side note but an important one: comparing the 2018 forecast for gold ounces mined vs gold ounces produced shows a global recovery target of about 50%. However, the Feasibility Study provides a recovery of 72% for an operation with crushers and an agglomerator, and 60% for a run-of-mine operation. As Pan is a heap-leach operation ramping up production, it is never easy to start up heap leach mines, and recoveries often seem a matter of trial and error it seems before all issues are ironed out. The option to add a $14M crusher and agglomerator is a likely one but still uncertain, depending on the outcomes of ongoing test work. A decision on the C&A circuit will likely be made mid-2018, and a realistic timeline on eventual completion of this will be Q1 2019 according to management. At the last PDAC I met with CEO Tim Warman, and he had this to add:
“The idea was always there to use the crusher and the belt agglomerator, but it was such a close call that we decided this could be best tested in a production environment using available space on our newly constructed Phase II leach pad.”
As current working capital stands at $13.5M and the Pan mine is about to become free cash flow positive, the timing is perfect. Let’s continue with the budgeted $5.5M. A big part of this was spent in Q1 alone which means the earlier planned capital expenditures in the next few quarters will be substantially lower as well. Fiore Gold has started a drill program but the combination of higher operating cash flows (due to production increases and margin expansions) and a lower capex should ensure Fiore Gold reaches positive free cash flow.
The interesting thing is that Fiore’s operating costs are pretty much fixed which means the additional ounces will be high-margin ounces. Assuming a production increase of 3,000 ounces per quarter, the operating cash flow will very likely increase by $2.75-3.25M per quarter (assuming $1,300/oz Au, and no taxes will be due for the first few years as mentioned earlier) towards $4.25-4.75M per quarter. Besides this, keep in mind that gold stands at $1353/oz at the time of writing, which could add a further $0.5M per quarter. Furthermore, I’m also assuming the sustaining capex will reach an average of $1.5M per quarter; this should result in Fiore Gold generating approximately $2.75-3.25M per quarter in free cash flow until the taxes start to kick in. And on top of that, U.S. corporate taxes enjoyed a big haircut recently thanks to Trump, so this is beneficial for Fiore in the future. Production will probably improve according to guidance, resulting in an annualized $17-19M operating cash flow in H2, 2018. Using a $1350/oz gold price would result in an annualized $19-21M operating cash flow, which is huge for a small producer in Nevada with just a C$65M market cap. More on this later; let’s have a look at ongoing exploration.
3. Exploration
Besides production, Fiore Gold is also busy with exploration on every asset at this time. I will focus on the infill- and stepout drilling on Pan, as management is looking to extend the mine life substantially. The results of the first six holes were released a month ago, and delivered good intercepts, the best ones highlighted in green:
As a matter of fact, all holes returned economic mineralization as the mine cut-off grade is 0.14-0.21g/t Au, according to CEO Tim Warman:
“These first six holes show excellent potential to increase the resource and reserve base both at depth and laterally beyond the current mine plan boundaries. We’re extremely pleased with the success rate so far, with each of the first six holes encountering mineable widths of gold mineralization above the mine cut-off grade. This is a very good start to a program that we’re confident will allow us to extend operations at Pan well beyond the current mine life.”
In order to get an idea of locations of drill collars here is a map representing them:
To get a good impression about the significance of these intercepts, let’s have a look at this section:
It will be clear that if Fiore manages to prove up sufficient mineralized tonnage below/west of the current pit outline between PND18-06 and PND18-01, a new and much deeper pit outline could be based on these intercepts and significantly expand mineable reserves/resources. In case ongoing drilling would generate the same kind of results for the entire southern part of the North pit, I wouldn’t rule out an increase of 100-150koz Au, which in turn would extend the life of mine (LOM) to eight to nine years from the current six years.
As the company returned some good intercepts on Pan recently, I felt it was time to ask CEO Tim Warman for some color on proceedings:
TCI: 13 holes were completed, and 6 assays reported so far. When can we expect the remaining 7 assays?
TW: We expect to have those in early April. Through the end of March, we have drilled about 10,000 feet (about 3,000 m), and we expect to do 15,000-20,000 ft RC and DD combined.
TCI: Hole 5 and 6 seem to have resulted in economic mineralization, but hole 3 as an extension at depth at relatively low grade seems unlikely to be economic considering the increased strip ratio?
TW: We think the mineralization of hole 3 isn’t too deep but this area needs more drilling for sure to define new resources.
TCI: Where exactly is further drilling targeted?
TW: Drilling in this first phase is targeting areas close to the North Pit, as well as some smaller future satellite pits in the central part of the deposit.
TCI: I see that RC drilling is used a lot in this round of drilling; don’t you have the risk of contamination with this method in this environment? I recall the same thing happening when Gustavson was working out the resource estimate for Pan in the not-too-distant past.
TW: There is always a bit of smearing with RC, but we understand the deposit a lot better now than in the Midway days. For this type of resource expansion, doing only DD is too expensive now, although we will be doing about 5,000 ft of diamond drilling in key areas.
TCI: Is the Gold Rock resource update planned for late 2018?
TW: We are still planning the program for Gold Rock; we like to fund this from incoming Pan cash flow and use the rig from Pan when drilling is finished there. This will probably be April or May after the snow is cleared.
TCI: Do you have new plans for the Chile asset and the Washington asset?
TW: We are still reviewing plans for the Chilean assets, although we just announced some good exploration results from Rio Loa. As for the Washington asset, we’re talking to a few people about it but it’s still in the early stages.
TCI: The Gold Rock FEIS (= EIA) has been submitted for review, and the Federal Record of Decision should be received before mid-year. What is the status nowadays?
TW: The Record of Decision wraps up the Federal permit, which is the one that takes the longest. The various state permits typically take six to eight months, but we won’t start applying for those until we’ve done a lot more engineering work, since they require fairly specific information.
TCI: Last question: what can you tell us about met work for Gold Rock so far?
TW: The recovery appears to be pretty good, actually a little better than at Pan, Gold Rock has a recovery of about 65-75%. And as you know we are looking at improving Pan recoveries by adding a crusher and an agglomerator.
This concludes the short interview with Tim Warman, which provided a solid update on exploration and related subjects. Now it’s time to take a look at ways how to value Fiore Gold.
4. Valuation
When Fiore Gold is compared to a few other junior gold producers (some data coming from Haywood’s weekly update the Weekly Dig) it can be seen that Fiore Gold is pro forma (as a ramping up producer) valued on EV/CF ratios comparable to the more adventurous jurisdictions like Turkey or Mexico:
And part II:
For the best jurisdictions in this list, Ontario/Quebec and Nevada, the EV/CF metric is substantially higher, and I don’t even consider the corresponding companies top notch although Rye Patch got acquired by Alio Gold very recently.
At a current market cap of about C$61M, it seems that Fiore Gold is valued only on the Pan NPV, when using my estimate from another article on the company:
the current exploration assets, of which I estimate El Peñon at C$1M and Cerro Tostado at C$4M
about C$7M in cash, zero debt
the Pan Mine with a C$65M NPV and ramping up production
the Gold Rock historical deposit and the exploration potential of both Pan and Gold Rock combined at C$20M
Golden Eagle at C$5M, bringing the total NAV at C$102M.
Obviously, Pan is discounted by investors, as it is still ramping up production and is looking at adding the crusher and agglomerator for better recoveries, and the market doesn’t appear to assign much value to the other assets. Especially Gold Rock could be capable to add a $80-100M NPV in a few years as it is a bigger and higher grade mineralized project in my view. Nevertheless, the valuation of a producer is usually much better represented by the market cap to operational cash flow ratio (which varies from about 8 to 12 (even 16 for very profitable mines) in good jurisdictions at current gold prices/sentiment), which can be narrowed down further to EV/CF.
When looking at this metric and using the operating cash flow estimates mentioned earlier in this article, the re-rating potential becomes clear. With a potential estimated OCF of $17-19M (= C$22-25M), the company would be valued at 2.0/2.8 times cash flow which is very cheap on EV/CF and P/CF metrics for a profitable Nevada gold play. When Fiore Gold starts generating quarterly cash flows as estimated, and coverage picks up, I am happy to stick with my forecast for a potential double. Increased resources should be able to add LOM years for Pan, and a solid resource on Gold Rock could likely further support a higher valuation.
5. Conclusion
Ramping up to 14,000 tpd steady state went almost flawless for Fiore Gold, as the company did save on operational costs, but didn’t reach its desired 60% run of mine recovery, as it expects to get to 50% for the full year 2018. Therefore, the option to add a crusher and an agglomerator is being evaluated at the moment, increasing recovery, hopefully in line with FS levels. When this staged development would be completed, Fiore Gold will likely boast an annualized cash flow of about C$22-25M, which in turn deserves a much higher share price based on producer average multiples. It is a stock that demands more patience than others, but in the current positive gold environment investors could very well be nicely rewarded in the not-too-distant future.
Pan Mine; scenery
I hope you will find this article interesting and useful, and will have further interest in my upcoming articles on mining. To never miss a thing, please subscribe to my free newsletter on my website criticalinvestor.eu, in order to get an email notice of my new articles soon after they are published.
Disclaimer:
The author is not a registered investment advisor. The author holds a long position in this stock. Fiore Gold is a sponsoring company. All facts are to be checked by the reader. For more information go to fioregold.com and read the company’s profile and official documents on www.sedar.com, also for important risk disclosures. This article is provided for information purposes only, and is not intended to be investment advice of any kind, and all readers are encouraged to do their own due diligence, and talk to their own licensed investment advisors prior to making any investment decisions.
The Critical Investor is a newsletter and comprehensive junior mining platform, providing analysis, blog and newsfeed and all sorts of information about junior mining. The editor is an avid and critical junior mining stock investor from The Netherlands, with an MSc background in construction/project management. Number cruncher at project economics, looking for high quality companies, mostly growth/turnaround/catalyst-driven to avoid too much dependence/influence of long term commodity pricing/market sentiments, and often looking for long term deep value. Getting burned in the past himself at junior mining investments by following overly positive sources that more often than not avoided to mention (hidden) risks or critical flaws, The Critical Investor learned his lesson well, and goes a few steps further ever since, providing a fresh, more in-depth, and critical vision on things, hence the name.
Heap leaching has become a popular method of extracting gold, writes mining consultant Nicolaas C. Steenkamp and Leon Louw, writer, editor and specialist in African affairs and mining.
Heap leaching is used to extract gold, copper, silver, uranium, and iodine. This method was first employed to extract copper at the Bluebird mine in the US in the early 1960s, and then by several gold mines in the western parts of the US a few years later. Since then, heap leaching has been adopted successfully by many mines across the world.
Heap leaching occurs after the mining and crushing of low-grade ores, usually in an opencast mine. High-grade ores and ores not amenable to cyanide leaching at coarse particle sizes require further processing to recover the gold values. These processing methods can include further grinding, concentration, pressure oxidation, and roasting, which is used to treat these ores to expose the gold particles prior to cyanidation.
The crushed ore undergoes an agglomeration stage, after which the agglomerated ore is deposited onto the heap leach pad. The heaped ore is irrigated with a lixiviant (a liquid medium) to dissolve the metals and generate the leachate. The lixiviant will depend on the target metal being extracted.
The pad is compacted and then lined with a high-density polyethylene membrane, which prevents toxic compounds and elements (such as cyanide and the leachate solution) from entering the groundwater system.
The leachate is collected in a pond or tank, and it is referred to as a pregnant or value-bearing solution. The solution is then processed to recover the metals. In gold operations, recovery is affected through carbon adsorption or the Merrill-Crowe process. The barren solution, together with additional lixiviant, is recycled back to the heap.
Heap leaching can take anything from a couple of months to several years. In the case of gold recovery, heap leaching generally requires 60 to 90 days to leach the ore, compared to the 24 hours required by a conventional agitated leach process. Gold recovery is also usually only 70% compared with 90% recovery in an agitated leach plant. Other metals, such as copper, use solvent extraction and electrowinning to extract the target metal from the solution.
According to Phil Bundo, process engineering director at Senet, mines need large reserves, a large resource, and significant real estate if they want to employ the heap leach method. “To build a big heap and accommodate all the associated equipment, a large space is required; and to fill that space, a mine needs to produce enough ore,” says Bundo. Bundo adds that climatic conditions like rain can negatively affect a heap leach operation, although this would not ordinarily be enough cause to discard heap leaching as a processing method. Resources and reserves play a much bigger role in determining whether heap leaching will be viable.
Heap leaching is not that popular in South Africa because it is more applicable to shallow opencast mining, and South African gold mines are mostly underground operations. The method is, however, being used on a large scale in the copper mines of South America and, according to Bundo, it will be used more and more on the African continent in future.
Weighing up the alternatives
According to Bundo, there are other recovery methods, besides heap leaching, to consider when mining gold. These include gravity concentration, carbon in pulp (CIP), and carbon in leach (CIL). “The methodology selected is a function of the mineralogy of the ore. If the gold is associated with oxides, for example, it can be amenable to heap leaching. The grade also plays a key role. Heap leaching is used for low-grade oxides, while high-grade ore (with or without oxides) is better suited to CIP or CIL methods,” says Bundo.
Bundo explains that while heap leaching is not as costly as CIL or CIP, the recovery achieved is also not as efficient. “CIP and CIL are costlier in terms of initial capital and operational costs, but they provide the benefit of high recovery,” says Bundo. In cases where the oxides are amenable to heap leaching and cannot economically justify the construction of a CIL or CIP plant, then the operations start off with heap leaching to generate sufficient capital to finance the CIP or CIL circuits when mining more refractory ore.
“It is also important to remember that if the gold is associated with sulphides or other minerals, heap leaching cannot be effectively employed as recoveries are generally low. In such cases, it is advisable to install a CIP or CIL system from the beginning,” says Bundo.
The higher capital and operational investment in methods such as CIP and CIL are due to the more aggressive techniques used to recover the gold. A CIP process will, for example, involve crushing, milling, and agitator tanks. Heap leaching requires less aggressive techniques: a chemical solution is simply sprayed on heap ore. As the solution percolates through the heaped ore, it dissolves the gold. The solution is then collected and treated further by adsorption.
The heap leach stack must be porous enough to allow the solution to drip or to drain through the stack. There are potential recovery failures due to the inability to obtain the optimal flow solution. High clay content is achieved by agglomeration prior to stacking the piles.
Further research is underway to both increase the recovery of metals and reduce the risks of the solutions used and generated during the process. Heap leaching has the potential of extending the life of mine or bringing mines under care-and-maintenance back into production by reprocessing the tailing or fine-residue dumps.
Agglomerating the ore
Part of the preparation stage is known as agglomeration, in which an agglomeration drum is used. Although heap leaching is efficient on its own, its efficiency is greatly improved by adding an agglomeration drum. Agglomeration drums are also called ore drums, agglomerators, and heap leaching drums. Agglomeration is based on a rotary drum design that tumbles ore fines, in the presence of the leachate, through its interior to promote uniformity and to mix the leachate and fines. The agglomeration step happens after the ore is crushed, but before it is heaped.
Using an agglomeration drum to agglomerate the ore fines will ensure that the crushed ore particles are more uniform, making it easier for the leaching solution to travel through the channels between the particles to help maximise recovery (increased percolation). In addition, adding the agglomeration drum allows the leaching solution to mix with the ore fines. As the ore fines are agglomerated, the solution is sprayed throughout the drum and mixed thoroughly with the ore fines, which ultimately makes the process more efficient.
“The agglomeration drum is the start of the heap leach stacking process, which ends at the leaching pad,” says Theo Winterbach, mechanical and materials handling manager at Senet. From the agglomeration drum, the material is transferred via an intricate conveyor system to the heap leach pad. “The heap leach pad covers a large area and the product has to reach the entire pad. The system thus requires multiple conveyors to transfer the material to the furthest point of the pad,” says Winterbach. The agglomerate should be transferred as smoothly as possible, as it is important to keep it intact. One benefit of having multiple and mobile equipment is that a company will not have to lay out all the capital in the beginning. Once the team has decided where the pad will be located, they can acquire only the necessary equipment until production starts ramping up. “The added advantage is that the mobile equipment allows for a certain amount of flexibility; therefore, the entire system can be moved to ensure that the conveyors feed the stacker at the end of the chain,” says Winterbach. A typical heap is between eight and 10 metres high. The normal flow of material is from the agglomeration drum to the grasshoppers and then to the linear index conveyor, which delivers it to the stacker machine.
Stacking the heap
The linear index and stacker machine need to move backwards as the stockpile is stacked in preparation for the leaching. At times (depending on the size of the heap leach pad), the entire set of machines has to be fully retracted and repositioned to a new position on the heap leach pad before the process is repeated. When the entire system needs to be adjusted, front-end loaders or other applicable equipment can be used to move the equipment, as most of the equipment, including the stacker, is wheel or track driven. A combination of wheels and tracks is used to minimise the bearing pressure on the pad.
The stacker can slew and move backwards and forwards in a linear fashion. Heap leach pads require special preparation in construction. According to Bundo, a pad should slope by one or two degrees so that the solution can gravitate to the pond, and there should be sufficient aggregates underlying the surface. Moreover, the high-density polyurethane (HDPE) liners that cover the surface are critical to prevent the chemical solution from seeping into the groundwater. Special collection pipes are installed underneath the pad to direct the solution to the relevant ponds.
Pros and cons
For Breton Scott, managing director of Bowline Professional Services, the most important advantage of heap leaching is that it lowers the capital and operating expenses relative to other traditional methods like flotation, agitation, and vat leaching, especially where low-grade ores and tailings are present. It also has a potentially rapid payback period.
“Heap leaching further eliminates some environmental concerns and restraints. The main benefit, in terms of the environmental impact, is that it requires less energy and water,” says Scott. Moreover, the method has uncomplicated design and equipment requirements, and the construction phase is a lot faster than other treatment methods.
Although Scott says that the heap leach method is not seriously affected by climate, he mentions that a lower efficiency has been noted at low temperatures. “High rainfall areas may also dilute the solution, requiring additional monitoring,” he says.
The risks associated with heap leaching are mainly related to environmental concerns, should the pad construction process not be done correctly from the design stage. Potential issues with the regional water balance are highlighted as a risk, along with the possible exposure of the solutions used to the surrounding areas. Heap leaching does, however, have a much lower potential of acid mine drainage. The costs associated with pollution control and closure efforts are one of the main continual expenses in such operations.
“The drilling of water-monitoring boreholes and regular testing of the groundwater by an accredited water-quality laboratory would be required if the heap leach method is used,” says water laboratory analyst, Ben Steyn. “Tests would generally include pH, dissolved solids, and heavy metals.”
“The biggest question a mine needs to ask itself is whether it has an ore body that is amenable to heap leaching. Senet prefers to get involved in a project from the test work phase, which enables us to prove that heap leaching, as a processing method, will work for the project. We not only consider heap leaching, but also all the other options available. It is always a trade-off between the capital investment and recovery,” Bundo concludes.
About Leon Louw:
Leon specializes in African affairs and doing business in Africa, and has been writing about mining in Africa for 8 years. He was born in Johannesburg, South Africa, and has traveled Africa extensively, especially southern Africa. He has a BA degree with a specialization in African studies and an honours degree in Africa Politics. He also have a national diploma in Nature Conservation and an honours degree in Environmental Management. It is is passion to promote business in Africa and I can assist companies that are interested in doing business in African countries.
The thrill of victory and the agony of defeat. Gold investors focused on the Western markets and government debt fear trade tend to feel the same kinds of thrills and agony that professional athletes regularly experience.
Here’s a good example: For a few days, silver soars higher on what appears to be the guaranteed start of a long-term uptrend. Within days or just hours, the gains are suddenly gone, and the price appears to be going much lower with absolute certainty.
Please click here now. Double-click to enlarge this positive-looking gold chart.
Bullion banks around the world arguably have the most effect on gold price discovery and they focus on physical supply versus demand.
Given that India’s gold-focused Akha Teej festival ended April 18, and Chinese jewellery demand is slightly soft (with dealer interest at $1320 – $1300), it’s clear that gold is not quite ready to surge above $1370 and begin a new era of sustained trading above $1400.
Also, some Fed speakers have hinted that the pace of Fed rate hikes could be slower than expected. At first glance, that would seem to be positive for gold, but fear trade price discovery is about how rates affect risk.
In the current environment, modest rate hikes support a “risk-on” theme. For a closer look at what I mean, please click here now. Double-click to enlarge this US dollar versus yen chart.
Bank FOREX traders view the dollar as risk-on and the yen and gold as risk-off, and rightly so. Given the beyond-insane financial state of the government, aggressive rate hikes from the Fed put the government at serious risk of being able to finance itself.In that situation, the dollar falls against the yen and gold.
In the immediate time frame, money managers believe that Powell will hike rates very gradually. That incentivizes money managers to take risk and invest in the dollar, because it will pay a higher rate of interest without putting too much pressure on the government’s ability to make its principal and interest payments on its debt.
Gold peaked in February as Chinese New Year buying peaked. Now it’s made another modest peak as Akha Teej buying peaks, with Western money managers believing that the Fed cares about the US government’s debt problems. These money managers also believe the Fed cares about the stock market.
Under Greenspan, Bernanke, and Yellen, the Fed cared. I don’t believe Powell cares what the ramifications of his actions are for the “spendaholic” government or for the Wall Street vampires that require low rate policy for their stock market buyback programs.
Please click here now. Double-click to enlarge this key bond market chart.
This chart tells me that the Fed is going to become vastly more aggressive with rate hikes and inflation is going much higher. The current price and time zone is the calm before that storm.
I expected Trump to launch tariffs, and he’s done that. Most investors are focused on whether the tariffs are good or bad for growth, rather than on the fact that they are inflationary.
Please click here now. I didn’t predict the sanctions that have been applied to Russia by the US government, although I’m not really surprised.
That’s because most of what all governments do involves the insane use of sticks much more than the sane use of carrots. Regardless, sanctions are here and they are inflationary. I view sanctions as nothing more than aggressive tariffs.
More are coming as governments (especially the US government) seek new sources of revenue to pay their debts as inflation and rates rise.
Please click here now. Double-click to enlarge this GDX chart.
While many fear traders involved with gold stocks are nervous today, I don’t see anything to be concerned about. I suggested GDX would make a short-term peak at about $23.25 as Akha Teej demand peaked with the Fed in between rate hikes.
It’s done that and investors who have insured their “bull era ride” with GDX put options in that $23 area are now looking very good indeed. Some of these options rose 15% just in yesterday’s trading. The bottom line: Insurance works, whether it is home, auto, or price insurance for gold stocks.
Please click here now. I have two short term scenarios for GDX. The first involves the current pullback ending in the $22 area, and the second one shown here has the pullback end at around $21. Put options enthusiasts and those carrying a short position in GDX against their portfolio of individual miners could cover off half the puts at around $22 and the rest near $21.
As with gold and silver bullion, I have no concerns at all about the current price action in gold stocks. Most have staged huge rallies recently and many are above their February highs. A pullback is normal and expected as major Chindian festival demand peaks at a time when the Fed is in between major policy action.
Chindian income growth versus limited mine supply is the main driver of higher gold prices for the long term. There are no “upside breakouts” in that process. It’s ongoing and relentless. The inflationary policies of the debt-plagued US government and the Fed’s increasingly aggressive QT and rate hikes in response to that will generate significant institutional interest in gold stocks as gold trades above $1400.
All the fundamentals are in place to create significant inflation and debt financing problems for the West. They are also in place to create significant income growth in the East for a long period of time. The only thing that astute investors need to build sustained and significant wealth in the coming gold bull era is a very modest amount of patience and rational thought. It’s the greatest time in history to be invested in the precious metals asset class, and getting greater by the day!
Stewart Thomson is a retired Merrill Lynch broker. Stewart writes the Graceland Updates daily between 4am-7am. Stewart Thomson is no longer an investment advisor. The information provided by Stewart and Graceland Updates is for general information purposes only. Before taking any action on any investment, it is imperative that you consult with multiple properly licensed, experienced and qualified investment advisors and get numerous opinions before taking any action. Your minimum risk on any investment in the world is: 100% loss of all your money. You may be taking or preparing to take leveraged positions in investments and not know it, exposing yourself to unlimited risks. This is highly concerning if you are an investor in any derivatives products. There is an approx $700 trillion OTC Derivatives Iceberg with a tiny portion written off officially. The bottom line:
Are You Prepared?
Last week index score: 44.24 (updated)
This week: 21.62
Prospero Silver (TSX-V: PSL) announced a non-brokered private placement to raise up to C$1.0 million through the issuance of up to 11.1 million units @ C$0.09.
The Oreninc Mining Deal Club sent out its sixth financing alert to its subscribers. Sign up today to get the details and an opportunity to participate: www.miningdealclub.com
The Oreninc Index halved in the week ending April 20th, 2018 to 21.62 from an updated 44.24 a week ago as broker action evaporated (again).
US tariffs and sanctions against steel and aluminium imports, particularly from Russia, are ripping through various metal markets with aluminium and nickel prices spiking. Aluminium prices have spiked 30% since the start of April to a seven-year high due to sanctions against Rusal. Fears that supplies of steel-additive nickel could come into Trump’s crosshairs if more sanctions against Russian businesses and businessmen are rolled out has seen its price spike on the London Metals Exchange, recording its highest one-day move since 2008 and hitting three-year highs.
On to the money: total fund raises announced tumbled to a paltry C$22.6 million, a six-week low, which included no brokered financings and no bought deal financings. The average offer size dropped to a barely visible C$1.1 million, a six-week low. The few financings announced and bringing with them a general return to the full warrant to attract interest.
Another week of failed expectations for gold as strong performance throughout the week fell at the end as the US dollar index strengthened following news that US initial weekly jobless claims dropped to 232,000, its lowest level in three weeks according to the Labor Department.
Gold closed down at US$1,336/oz from US$1,346/oz a week with a mid-week high of US$1,349/oz. Gold is now up 2.58% this year. Meanwhile, the US dollar index had a stronger week and closed up at 90.31 from 89.80 a week ago. The van Eck managed GDXJ saw early week gains dissipate at the close to finish the week exactly where it started at US$33.49 despite a mid-week high of US$34.06 last week. The index is down 1.88% so far in 2018. The US Global Go Gold ETF also saw strong growth but gave up less as the week ended to close up at US$13.04 from US$12.81 a week ago with a mid-week high of US$13.11. It is up 0.23% so far in 2018. The HUI Arca Gold BUGS Index closed down at 184.18 from 184.43 last week. The SPDR GLD ETF saw a week of consolidation as its inventory remains at 865.89 tonnes.
In other commodities, silver put in a growth spurt and despite losing some shine at the end of the week closed up at US$17.11/oz from US$16.65/oz a week ago wit ha mid-week high of US$17.24/oz. Coppers price growth continues and closed up at US$3.15/lb from US$3.07/lb from US$3.05/lb last week. Oil continues to post gains to close up at US$68.40 a barrel from US$67.39 a barrel a week ago. This puts its price back to levels levels last seen in December 2014. Despite US president Donald Trump saying the oil price is getting too high, it looks set to go higher as OPEC and Russia look to maintain supply restraint, even though surplus oil has largely been worked out of the system.
The Dow Jones Industrial Average closed up at 24,462 from 24,360 last week with a mid-week high of 24,786. Likewise, Canada’s S&P/TSX Composite Index grew to 15,484 from 15,273 the previous week. The S&P/TSX Venture Composite Index also closed up at 804.96 from 795.94 last week.
Summary:
Number of financings decreased to 20, a two-week low.
No brokered financings were announced this week, a two-week low.
No bought-deal financing was announced this week, a two-week low.
Total dollars tumbled to C$22.6m, a six-week low.
Average offer size also fell to C$1.1m, a six-week low.
Financing Highlights
EnGold Mines (TSX-V: EGM) opened a C$3.5 million offering on best efforts basis.
10.0 million flow-through units @ C$0.30 and 2.0 million non-flow-through units @ C$0.26 with Canaccord Genuity as agent.
Each flow-through unit consists of one share and one warrant exercisable @ C$0.40 for two years. Each common unit consists of one share and one warrant exercisable @ C$0.35 for two years.
Over-allotment option of up 1.5 million flow-through units and 300k common units on the same terms.
Gross proceeds will be used to continue exploration at the Lac La Hache copper, gold & silver property in the Cariboo region of BC, Canada.
Major Financing Openings:
Engold Mines (TSX-V: EGM) opened a C$7.04 million offering on a best efforts basis. Each unit includes a warrant that expires in 24 months. The deal is expected to close on or about May 14th.
Vela Minerals (TSX-V: VLA) opened a C$2.5 million offering on a best efforts basis.
Renaissance Gold (TSX-V: REN) opened a C$2.5 million offering on a best efforts basis. Each unit includes a warrant that expires in 60 months.
Coronet Metals (TSX-V: CRF) opened a C$2.02 million offering on a best efforts basis. Each unit includes a warrant that expires in 24 months.
Major Financing Closings:
North American Nickel (TSX-V: NAN) closed a C$15 million offering on a best efforts basis. Each unit included half a warrant that expires in 24 months.
Sama Resources (TSX-V: SME) closed a C$5.25 million offering on a strategic deal basis. Each unit included a warrant that expires in 24 months.
Rise Gold (CSE: RISE) closed a C$3.52 million offering on a best efforts basis. Each unit included a warrant that expires in 36 months.
Toachi Mining (TSX-V: TIM) closed a C$3 million offering on a best efforts basis.
Company News
Prospero Silver (TSX-V: PSL) announced a non-brokered private placement to raise up to C$1.0 million through the issuance of up to 11.1 million units @ C$0.09.
Each unit will consist of one share and half of a warrant exercisable @ C$0.16 for two years.
The net proceeds will be used for general working capital purposes, its generative exploration programs and exploration expenditures on its property portfolio in Mexico.
Looking to drill 6,000m in 2018.
Analysis
With the initial phase of its strategic arrangement with Fortuna Silver drawing to a close, and 2018 exploration planning underway, Prospero is raising cash to be able to contribute to funding ongoing and future exploration work under the arrangement. However, given the current low stock price, it is evident that the company is also looking to minimize shareholder dilution by undertaking a minimum raise. 2018 work will look to continue to validate Prospero’s exploration strategy to discover blind epithermal systems.
About Oreinc.com:
Oreninc.com is North America’s leading provider of relevant financing information in the junior commodities space. Since 2011, the company has been keeping track of financings in the junior mining as well as oil and gas space. Logging all relevant deal and company information into its proprietary database, called the Oreninc Deal Log, Oreninc quickly became the go-to website in the mining financing space for investors, analysts, fund managers and company executives alike.
The Oreninc Deal Log keeps track of over 1,400 companies, bringing transparency to an otherwise impenetrable jungle of information. The goal is to increase the visibility of transactions and to show financings activity in a digestible format. Through its daily logging activities, Oreninc is in a position to pinpoint momentum changes in the markets, identify which commodities are trending and which projects are currently receiving funding.
It was an interesting week in the precious metals complex. There appeared to be the start of a short squeeze in Silver (hedge funds were heavily short) but it ceased at an important resistance. Meanwhile, Gold closed the week on a weak note, losing $1340-$1350. The gold stocks, like silver closed the week below technical resistance. The price action in the complex continues to suggest that a breakout in Gold is the key to unleashing strong outperformance from Silver and the gold stocks.
While Silver has very supportive sentiment, it has not broken out from its downtrend yet. The net speculative position was at 1.1% a few weeks ago, an all time low. That won’t spring Silver by itself unless Silver can surpass critical resistance in the mid $18s. And that may not happen until Gold breaks $1360-$1370. Silver has strong support in the low to mid $16s.
Silver & Silver Net Speculative Position
Moving to Gold, the daily chart below shows Gold losing $1340-$1350 after rejection again at $1360. Immediate support for Gold lies at $1325 which if broken would lead to a test of $1300-$1310 and the 200-day moving average.
Gold Daily Candles
We have a few observations to share with respect to the gold stocks. First, GDXJ has pulled back from trendline resistance around $34. Second, breadth indicators for GDX such as the advance decline line (A/D) and the bullish percentage index (BPI) are showing a positive divergence. The BPI has reached a 52-week high while the A/D line is not far from its January peak when GDX nearly hit $25. So while GDX has been relatively weak, its internals are showing more strength.
Silver and the gold stocks have yet to break important resistance as Gold once again was turned back at major resistance. If the US Dollar, which closed at 90.07, rallies up to its 200-day moving average at 92, Gold would likely test $1300-$1310. Should Silver and the gold stocks hold up well in that scenario (which could be suggested by current breadth) then it would imply a good rebound from the sector back to resistance points. Lower prices in the juniors would be a welcome sign and another opportunity to accumulate ahead of a major breakout in the not too distant future. In anticipation of that breakout, we have been accumulating the juniors with 300% to 500% upside potential over the next 18-24 months. To follow our guidance and learn our favorite juniors, consider learning more about our premium service.
Gold remains largely forgotten, off the radars of most investors. But that’s likely to change soon as this leading alternative investment is nearing a major bull breakout. Once gold climbs to decisive new bull-market highs, sentiment will turn and investors’ interest will surge. Their resulting buying will rapidly drive gold higher, attracting in more capital inflows. Gold is only a couple modest up days away from that key breakout.
Universally in all markets, traders’ psychology is completely dependent on price action and levels. When prices are high and rising, speculators and investors alike eagerly buy in. They love chasing winners, so buying begets buying. This creates powerful self-reinforcing virtuous circles, with rising prices helping to entice in ever-more traders. In recent years this dynamic catapulted the market-darling FANG stocks higher.
With capital inflows following performance, investments that aren’t high and rallying naturally see waning popularity. That’s the story of gold over the past couple years or so. Gold’s last new bull-market high came way back in early July 2016, when it hit $1365. That was 21.3 months ago, which may as well be an eternity in terms of sentiment. In most traders’ minds, gold has effectively been dead and buried ever since.
While contrarian investors always follow gold, most mainstream investors don’t. They only get interested when gold is powering up to major new highs. This psychology holds true everywhere in the markets, it’s certainly not unique to gold. A handful of mega-cap tech stocks have soared since Trump’s election win in November 2016, but other mega-cap tech stocks have lagged far behind. Traders always pursue performance.
This first chart looks at gold’s technical price action over the past couple years or so. A mighty new bull market erupted out of deep despair, blasting higher with steep gains. But the gold-investment-driving force behind it soon reversed, so this young bull stalled out. Gold hasn’t been able to best those initial bull highs ever since. So with no new highs to spark excitement, gold has slipped off investors’ radars.
Gold prices are heavily influenced by gold-futures speculators. The extreme leverage inherent in futures trading enables these traders to punch way above their weight in bullying the gold price around. There is nothing these guys fear more than Fed rate hikes, even though history proves that’s absolutely irrational. So heading into the Fed’s first hike of this cycle in December 2015, gold slumped to ugly 6.1-year secular lows.
But such extreme bearishness made no sense, as gold has thrived in past Fed-rate-hike cycles. So once that initial rate hike came and gold didn’t plunge, speculators rushed to buy back in to gold futures after that $1051 low. They were soon joined by investors with their huge pools of capital. They were spooked by the first stock-market corrections in 3.6 years, which boost gold demand to diversify stock-heavy portfolios.
Thus gold soared 29.9% higher in just 6.7 months in essentially the first half of 2016, easily crossing that classic +20% new-bull-market threshold. Gold’s $1365 bull peak in early July 2016 was closely tied to stock-market fortunes, coming the very day before the flagship US S&P 500 stock index achieved its first new record close in 13.7 months. With stock markets off to the races again, gold investment demand waned.
Gold had been very overbought after such a blistering rally, and speculators had record long positions in gold futures which is a contrarian indicator. But gold still consolidated high in the summer of 2016 until it was hit by two anomalous events. First gold-futures stops were run as gold fell below $1300, driving a sharp drop to its 200-day moving average. Gold recovered quickly from that until Trump’s surprise win.
Very few traders expected Trump to stage a colossal underdog upset and win the presidential election in early November 2016. It was an extreme contrarian position, seen as madness. Interestingly as I wrote the very weekend before that voting, a powerful stock-market indicator predicted Trump would indeed win! That soon came to pass, shocking speculators and investors into greatly reevaluating their outlooks.
With Republicans soon to control the presidency and both chambers of Congress, traders’ euphoria flared to eye-searing brilliance. They were captivated by hopes for big tax cuts soon, and rushed to buy stocks with reckless abandon. As the stock markets surged first on Trumphoria and later taxphoria, gold fell deeply out of favor. Investors abandoned it since they felt no need to prudently diversify their soaring portfolios.
Thus a normal healthy gold correction after a strong upleg cascaded into a 17.3% plunge over 5.3 months ending in December 2016. Such sharp losses naturally devastated gold psychology among traders. The bull market was still alive and well technically, as gold didn’t cross that -20% new-bear trigger. But gold was still left for dead as the levitating stock markets sucked in most capital. Traders had largely moved on.
But gold still looked really bullish in mid-December 2016, as I explained within days of that correction low. Investors were radically underinvested in gold after fleeing in the election’s wake. And the truly incredible psychology unleashed by the Republican sweep wasn’t sustainable or repeatable. It’s pretty rare where nearly everyone gets presidential and congressional elections so wrong! So gold was overdue for some buying.
Ever since that post-election anomaly it has indeed powered higher on balance in the solid uptrend you can see in this chart above. Gold has been relentlessly carving a series of higher lows and higher highs, which made for a 20.4% upleg over the next 13.3 months. That’s actually big enough to qualify as a new bull market, but again gold never entered a bear. Such strong price action should’ve improved sentiment.
But it really didn’t. The extreme taxphoria last year made 2017 one of the most-extraordinary years on record for the US stock markets. The S&P 500 ceaselessly levitated to a massive 19.4% gain in the first year of the Trump Administration, accompanied by record-low volatility. With big US stocks powering higher so dramatically and painlessly, who needed gold? It tends to rally when stock markets are selling off.
While contrarians were rightfully impressed with gold’s strong bull-market uptrend since those anomalous post-election lows, mainstream investors didn’t know or care. Everything was rainbows and unicorns for them, despite dangerous bubble valuations in the stock markets. While gold’s 13.2% rally in 2017 would command attention normally, the 35% to 57% gains in the FANG stocks overshadowed it and stole the limelight.
There’s no doubt over a year of gold seeing higher lows and higher highs is very-bullish price action. All students of the markets would recognize this viewing gold charts. But climbing support and resistance lines are lost on the financial media and mainstream investors. Investments only start garnering talk and mindshare when major new highs are hit. Popular psychology is totally dependent on that one technical aspect.
Futures speculators view the horizontal $1350 line as key technical resistance. Gold has tried and failed to break out above it from several to nearly a dozen times since the summer of 2016 depending on how you slice such attempts. These guys need to see a decisive $1350 breakout to really motivate them to buy again. I define decisive as 1%+ beyond an old technical extreme, or about $1364 in gold’s case today.
That’s just a stone’s throw away, very close. Last week gold closed near $1352, and this week it was still up at $1349. All gold needs to see is a couple modest up days of 0.6% to push it back over $1365 for the first time in 21.3 months! That would work wonders for sentiment, rapidly turning it to bullish which would fuel much gold-futures buying. And the speculators currently have lots of room to buy gold futures.
As of the latest Commitments of Traders report before this essay was published, total spec gold-futures longs are only running 25% up into their past year’s trading range. That means 3/4ths of these traders’ likely capital firepower remains available to buy back in. Believe me, if they think gold is going to break out above $1350 resistance they will flood in with a vengeance. These elite traders follow charts by necessity.
Every gold-futures contract controls 100 troy ounces of gold, worth $134,900 this week. Yet these only require traders to keep $3,100 of cash per contract in their accounts. That works out to absurdly-extreme 43.5x maximum leverage! The legal limit in the stock markets has been 2x for decades. Traders running at that crazy limit would lose 100% of their capital risked if gold merely moves 2.3% against their futures bets.
At 20x leverage that risk is still suffocating, with a 5% adverse move necessary to wipe out capital risked. So when gold looks to be breaking out above $1350, these traders will rush to buy to cover shorts and add new longs. They are well aware gold has formed a giant ascending-triangle chart pattern over the past couple years or so. That’s defined as rising lower support compressing a price into horizontal upper resistance.
When ascending triangles resolve, it’s usually with a sharp-to-explosive upside breakout. Once that long-vexing overhead resistance fails, traders rush back in catapulting the price higher. When gold breaks out of such a massive ascending triangle, technically-oriented traders are going to get the heck out of the way if they are short and rush to ride the breakout on the long side. Futures speculators live and breathe technicals.
Their coming buying will fuel a far-more-important breakout. To the financial media and investors, new bull highs are the only thing that will draw their interest. Before July 2016’s $1365 bull-to-date peak, the last time gold closed over $1365 was way back in March 2014. So a $1365+ close right now would be a major new 4.1-year high. You better believe that will catch investors’ attention, getting gold back on radars!
A 1% decisive breakout above $1365 requires $1379 on close. That sounds lofty since it’s been so long since gold challenged $1400, but it is merely 2.2% above this week’s levels! When investors start getting excited about gold again, it takes months or even years to reestablish meaningful portfolio positions. The vastly-larger pools of capital they control overpower and dwarf whatever the futures speculators are doing.
As I explored a couple months ago, investors are radically underinvested in gold today. They will have to shift capital into gold for a long time to come to reverse this major anomaly. New gold bull-market highs all alone will prove a powerful motivator for them. But that will likely be amplified greatly by the ongoing stock-market correction. Stock selloffs ignite big investment demand for counter-moving gold to diversify portfolios.
If either speculators buy gold futures or investors buy gold and its major ETFs led by GLD SPDR Gold Shares in any significant quantities, gold will absolutely see these major breakouts. And there’s actually a good probability of that coming to pass in the next month or so. Gold tends to enjoy a major seasonal rally from late March to late May. That ought to be plenty big to drive gold decisively over $1350 and $1365.
This should really excite contrarian speculators and investors. While the gains in gold will be nice, they will be trounced by the accompanying surge in the gold miners’ stocks. This sector’s leading benchmark is the GDX VanEck Vectors Gold Miners ETF. Its technical price action over this same gold-bull span is shown in this second chart. While gold is nearing new bull highs, the gold stocks are lagging far behind.
With little interest in gold since Trump’s election victory, the gold miners’ stocks have been abandoned and left for dead. They’ve been drifting sideways in a vexing consolidation between $21 to $25 in GDX terms since late 2016. That’s despite their very-strong fundamentals. In their latest-reported quarter of Q4’17, these leading gold miners reported collective all-in sustaining costs averaging just $858 per ounce!
That’s far below prevailing gold prices, showing this industry is earning fat operating profits. In Q4’17 gold averaged about $1276 per ounce. In the latest Q1’18 which the gold miners will soon report on, that surged 4.1% quarter-on-quarter to a $1329 average. That implies profits of $471 per ounce, which is up 12.7% QoQ from Q4’17’s results! The gold miners are thriving which stock prices haven’t recognized yet.
In Q1’18 GDX’s average price of $22.57 was actually 0.8% lower than Q4’17’s $22.76! This highlights how deeply out of favor the gold miners are. But that psychology will reverse dramatically on that coming major gold breakout. Once gold starts hitting new highs again, traders will flock back to gold stocks since their mining profits leverage and amplify gold’s gains. That will drive a parallel big breakout in major gold stocks.
This week GDX was languishing near $23, dead-center in its 15.6-month-old consolidation between $21 support and $25 resistance. It would have to surge to $25.25 for a decisive breakout that would attract in a deluge of new capital. That’s 9.9% higher from this week’s levels, which actually isn’t much at all for this small volatile sector. Once gold stocks start rallying, they tend to move fast making for huge gains.
Since gold’s bull market began in mid-December 2015, GDX has actually seen 55 trading days with 3%+ gains! That’s nearly 1 out of every 10 trading days over that entire 2.3-year span. The gold stocks are truly less than a week of decent rallying away from a decisive breakout of their own. And once they start moving, traders will rush to buy back in to ride their explosive upside. When gold is in favor, this sector soars.
In roughly the same span of this gold bull’s first upleg in the first half of 2016, GDX skyrocketed 151.2% higher in 6.4 months on the parallel 29.9% gold upleg. That made for awesome wealth-multiplying 5.1x upside leverage to gold! While gold stocks are abandoned and forgotten when gold isn’t on traders’ radars, once they get interested again the gold stocks stage massive catch-up rallies. The next one is nearing.
The major gold miners’ early-2016 upleg wasn’t extreme at all considering the fundamentally-absurd prices gold stocks were trading at back then. GDX actually slumped to an all-time low, while the major gold stocks as measured by their HUI index were at a 13.5-year low. They were trading at levels last seen in July 2002 when gold was near $305. So they needed to soar to mean revert out of that crazy anomaly.
Another massive mean reversion higher is certainly needed today. Gold first hit this week’s $1350 levels in mid-October 2010. Since this metal was carving new all-time highs, investors were eager to buy in for the ride. Back then GDX was trading over $57, or 150% higher than today’s levels with these same prevailing gold prices! GDX’s bull-to-date peak in early August 2016 was $31.32, or just 36% higher from here.
So there’s a high chance the gold-stock upleg driven by the coming gold breakout will easily catapult the gold stocks to new bull highs too. During the last secular bull in gold stocks between November 2000 to September 2011, the HUI skyrocketed 1664% higher. There were 11 major uplegs during that span that averaged 81% gains over 7.9 months each! So seeing gold stocks rally 40% or 50% from here is nothing.
The gold stocks are truly a coiled spring today, ready to explode higher soon and trounce everything else. They are deeply out of favor, incredibly undervalued, and one of the only sectors that can rally sharply when general stock markets sell off. If you want to multiply your wealth this year by fighting the crowd to buy low then sell high, this small and forgotten contrarian sector is the place to be. Nothing else rivals it.
While investors and speculators alike can certainly play gold stocks’ coming powerful upleg with the major ETFs like GDX, the best gains by far will be won in individual gold stocks with superior fundamentals. Their upside will far exceed the ETFs, which are burdened by over-diversification and under-performing gold stocks. A carefully-handpicked portfolio of elite gold and silver miners will generate much-greater wealth creation.
At Zeal we’ve literally spent tens of thousands of hours researching individual gold stocks and markets, so we can better decide what to trade and when. As of the end of Q4, this has resulted in 983 stock trades recommended in real-time to our newsletter subscribers since 2001. Fighting the crowd to buy low and sell high is very profitable, as all these trades averaged stellar annualized realized gains of +20.2%!
The key to this success is staying informed and being contrarian. That means buying low before others figure it out, before undervalued gold stocks soar much higher. An easy way to keep abreast is through our acclaimed weekly and monthly newsletters. They draw on my vast experience, knowledge, wisdom, and ongoing research to explain what’s going on in the markets, why, and how to trade them with specific stocks. For only $12 per issue, you can learn to think, trade, and thrive like contrarians. Subscribe today, and get deployed in the great gold and silver stocks in our full trading books!
The bottom line is gold is nearing a major bull breakout above $1365. That will turn psychology bullish and bring traders back in droves. Gold is rallying ever closer to new bull-market highs as evidenced by its massive multi-year ascending-triangle chart pattern now nearing a bullish climax. Today gold is only a couple percent below that decisive breakout, which will finally blast it back onto the radars of investors.
That’s likely coming soon, with gold in the midst of its major spring seasonal rally. Speculators have lots of room to add gold-futures longs, while investors remain radically underinvested. And once gold comes back into favor, the abandoned gold miners’ stocks are going to soar. Their prices are far below where they ought to be based on their fundamentals and prevailing gold levels. Their upside from here is enormous.
MiningFeeds previously wrote about Bonterra Resources (TSX-V: BTR) and its Gladiator Gold Project in Quebec. The company has steadily advanced through an extensive resource development program expand and define its geological resource model for an updated 43-101 Mineral Resource technical report that will likely prove to be significantly larger than its dated 2012 resource estimate.
In 2012, using a 4 g/t Au cut-off grade and comprised of approximately 15,600 meters of drilling, the Gladiator Gold Deposit contained an inferred resource of 905,000 tonnes, grading 9.37 g/t Au for 273,000 ounces of gold. On average, 90% of operating mines have a grade of less than 8 g/t gold. This ranks Gladiator in the top 10% of the world, when discussing the grade nature of the mineralization. The company has invested significantly since 2015 to expand this resource in the Abitibi Gold Belt, known as one of the world’s most prolific gold belts.
Bonterra has continued to drive shareholder value over the past three years by focusing on putting shareholder dollars in the ground and completing over 100,000 meters since 2016, most recently by continuing drilling through an infill/definition winter camp drill program. Bonterra’s share performance has beat Gold, TSX Venture Index, TSX Index and even the GDXJ Index, which tracks all miners:
This work is part of the company’s 70,000-metre drill program planned for 2018 and has consistently intersected gold mineralization in every hole, and is clearly proving up the company’s deposit in Quebec. There will be more results for an updated resource
Dale Ginn, VP Exploration for Bonterra Resources, stated:
“Initial results from the winter drilling campaign continue to highlight the predictability of the mineralized zones and the validity of the geological model. The positive results from the large diameter drilling will contribute to the success of the preliminary metallurgical work at the deposit. Bonterra continues to successfully execute its aggressive resource development program with seven active drills on site, and five drills at work on the Gladiator Gold Deposit.”
The company is clearly improving its confidence in the resource, and highlighting to the market how predictable the zones have become for targeting drilling to intersect gold mineralization. Another important milestone was to demonstrate that the resource they are drilling has the potential to be economic, which they have done with a recent press release that states the mineralization found at Gladiator is 99% recoverable. By industry standards, their rock is as clean as it gets, and indicates the quality of the deposit in regards to extraction of the gold, and how they stand well above their peers in regards to metallurgical extraction.
Peter Ball, the vice president of operations for Bonterra recently gave an interview to outline these results.
The market is slowly realizing the robust nature of the project, and potential economic nature of the rock when highlighting the high grade resource and metallurgical recovery.
Bonterra is likely pushing towards to a significant re-rate upwards to align with other more advanced peers, and thus the current valuation of the share price represents an opportunity for investors.
——–
Bonterra Resources Inc. (TSX-V: BTR, OTCQX: BONXF, FSE: 9BR1)
Gold and silver mining stocks face increased risks and uncertainty in 2018, not seen by investors and mining management teams for quite some time. Many of the top risks to gold stocks are related to geopolitical and financial, which will only compound the already high operational risks. Many of these top risks to gold stocks can be applied to silver stocks and any commodity stocks as well. What was most interesting, many of these risks are not seen as a concern to the management teams of Newmont Mining or Barrick Gold when going through their 10-Ks, versus the elevated risks the investment community sees in the macro landscape. Is the investment community concerned with many risks or is management thinking many of the risks won’t happen to them? These risks can heighten mining risk because of the elevated geopolitical and financial risks, potentially disrupting supply, and driving up gold prices even further without gold demand increasing.Are these the catalysts that will push up higher gold prices?
HISTORY REPEATS
Over a long-term enough time horizon, the sixteen biggest risk events repeat, but with a slight twist. The risks are the same, but the characters in the play are different. Capital controls, nationalization of assets, labor disputes, increased regulation on assets, and royalty changes. They all have occurred during different time periods, at some point or another. Most are tied to miners generating an incredible amount of profits, and individual countries wanting to get a bigger share of those revenues. It’s hard to move a mine, putting the mine at increased operational and political risk to earn more on those assets.
GEOPOLITICAL RISKS
Geopolitical Escalations Disrupting the Supply-chain
Government Election Uncertainty
Tariffs (on Mine Supplies)
Export Restrictions of Commodities
Supply disruptions from geopolitical are at heightened levels of risk not seen since the 1930’s and 1940’s, because of increased geopolitical risks. All of this political uncertainty increased demand for all private assets (not just gold).There is a shift from public assets to private assets.
Geopolitical risks are always the hardest for management and investors to get a firm grip on. It requires so many “ifs or if that”, to really pinpoint which will do harm to the mine operations. The geopolitical risks can impact other items that impact funding of the operations like capital controls or the mine operations supplies. A simple solution for investors to mitigate geopolitical risk is to see if the miner has its operations across more than one country, to limit any country-specific risk. There are also several general elections in 2018 and 2019 in commodity-specific countries. Mexico is a significant gold and silver mining producer, and it is having elections in 2018. Brazil also has its general election in 2018, its second largest export commodity in dollar value is gold. Brazil also produces more than 90% of the worlds Niobium, third largest producer of iron ore, and sixth largest producer of aluminum [1]. Heightened political matters will only increase throughout 2018 and continue into 2019, adding to already heightened geopolitical issues.
FINANCIAL RISKS
Economic Slowdown
ETF margin requirements reducing liquidity in mining ETF impacting financing
Financial Taxation Changes by Governments
Bail-in Risk to cash balance
Rising Interest Rates
Cash held Government Bonds – Debt Jubilee
The world continues to work through the debt issues, that have not been resolved since 2008 financial crisis. The risks at banks continue to remain elevated, particularly the European banks. We expect there will be a debt jubilee in some form, with shorter duration government bonds being converted into longer-dated bonds. Companies that are holding shorter-term term government paper as “safe” allocation for their cash, will be caught off guard if their government paper is re-adjusted to a longer duration.Corporate bonds are a better alternative. For Canadian and Australian miners they also face the added bail-in risk of deposits. Federal governments have explicitly stated that they will consider bail-in options, issuing depositors a clear warning. However, “This will never happen to us” management teams always say. Well, they have before, and they will again. If governments are already warning you what they will do in the next crash, and you fail to heed their warning. The list of repeat offenders is quite long.
Even Goldman Sachs CEO, Lloyd Blankfein is warning about the sovereign crisis coming next.
“What is kind of a little bit off. A lot of the bank issues in the United States and around the world have been solved. But migrating the problem to the sovereign balance sheets. So the banks look pretty good,but the Fed has $4 trillion of debton its balance sheet. And it’s even more, we are not in a European audience. In Europe they would really know what they meant because all the European banking system is fixed but Europeans are all also buying up all the debt. The budget deficits haven’t contracted, they’ve widened. The banks buy the debt, then walk over to the European Central bank, finance it. Get new money, so they can buy the next round of debt.
So, you have countries with way bigger deficits, as a percentage of GDP than the U.S., that are borrowing money for ten years, at 3.0% or 2.5%. Really? And the banks look ok.
It is the sovereigns that look risky, like Greece. You wonder is the next crisis going to be a sovereign crisis? And if it is, it will just be a continuation. People will look back and say.. what we really did, we didn’t fix the outcome of the financial crisis. We left that open and as a result, its really been a thirty-year workout.”Lloyd Blankfein [Source: CNBC]
THIS COULD NEVER HAPPEN?
LATE IN THE CYCLE COMMODITY ISSUES
Labor price issues
Government Expropriation Risks
Royalty Regime increases on mining assets
Investors, who say that any of the above risks can never happen, fail to learn the lessons of history to see that, yes, these events have happened and they impacted miners at one point or another. They have impacted many miners over the past 30 years. My experience has taught me, that most investors only really look back far enough to the last crash as to what could happen. Every one of these late in the cycles issues (labor price pressures, government expropriation, royalty regime increases) have always all occurred during the last mining boom. We don’t see these late in the cycle commodity risks evident in gold and silver stocks at this time. Look at cobalt and the skyrocketing price increases. This resulted in governments stepping in and raising cobalt taxes. Investors and management should not be surprised that this occurred, but human beings rarely learn from the past lessons.
For the longer cycle-related events, the time period is much longer than the typical business cycle. By taking into account the business cycle and debt cycles in conjunction with the commodity cycle, you can see where the events will take place. One of my leading long-term bearish indicators in any industry is the regulation card because it has historically highlighted the top in the industry. The mining sector is not there yet.
RISK ALWAYS ON OPERATIONS
OPERATIONAL RISKS
Mine start-up
Cyber Espionage on Mines
Regulatory changes on permitting
The risk to miners will always have the operational risks, particularly when the mine is starting up. Even the best construction engineers and site managers do their best to mitigate the mine risks. The financial and geopolitical poses an added layer of risk that could disrupt the supply chain.
MANAGEMENT TEAMS WILL RESPOND ONLY AFTER
History has shown that management teams from all industries will respond only to a situation or negative event after it has happened. “It couldn’t happen to me” or “That happened 30 years ago”. For the investor, it is better to assume that management will respond only after the event has happened. I am always concerned when the majority of new MBA’s choose a hot and trending industry to build a career in because the top is almost always nearby. We don’t see MBA’s flocking to the gold sector at issue at this time, which continues to make an unloved and unwanted, but excellent for the long-term investor.
FAILURE TO LEARN FROM PAST CYCLES
As this new commodity cycle takes fold, new management teams have entered the mining sector. Old management teams have either sold out, been fired or decided to call it quits after a number of mining cycles. Gone are the lessons from past cycles putting out fires, dealing with governments, capital raising, and operating expertise. This is why it is important to seek those management teams that have succeeded in the past and are still around. It will only increase the odds of success.For the new management teams, they have to earn investor’s trust. If investing in them, watch about putting all your money in from the start, because they will slip. That is certain.
OPPORTUNITIES FOR INVESTORS
Risk events can present opportunities for investors on assets because when investors indiscriminately sell stocks, they sell out the good ones. By thinking through risk events now, it allows investors and management CEO’s to better capitalize on opportunities that can present themselves because your weaker and ill-prepared peers won’t. The risks can also reduce overall gold supply and even with the heightened demand due to geopolitical and financial risks. The gold and silver sectors remain under-owned in relation to other sectors. Technology remains over owned particularly given it is at the beginning of incoming regulation.
“By failing to prepare, you are preparing to fail.” ― Benjamin Franklin
TAKE AWAY FOR THE PORTFOLIO MANAGER & GOLD STOCK ANALYST
Warren Buffett said it best, in managing risk in the investments one makes:
“The less prudence with which others conduct their affairs, the greater the prudence with which we should conduct our own affairs.”
Better to focus on risk control
Country Diversification- Reduce risks in the portfolio by diversifying across multiple countries.
Financial Strength – Balance sheet counts at the end of the day. How management diversifies its cash will be critical reducing bank deposit risk and debt jubilee exposure.
Margin of Safety – The greater the difference between commodity price and the mine’s All-In-Sustaining-Cost (AISC) reduces the chances of going bust should commodity prices fall.
Investors can seek out less financially leveraged companies, and while ensuring the company is growth focused.
Seeking companies with high management ownership with a significant portion of their wealth in the company.
We have outlined the key geopolitical, financial, and operational risks that investors should be aware of and at least think through in their own portfolios and CEO’s in operating their businesses. 2018 is a period of elevated geopolitical and financial markets related risks to gold stocks. This elevated risk may be the catalysts that wake up the investment community and shift from public assets to private assets, benefiting commodities like gold and silver. While risk is always present when investing, there are risks that one can control, and there are risks that one cannot control.
“If you are not worried, you should be. If you are worried, probably less to be worried about” – Paul Farrugia
Paul Farrugia, BCom. Paul is the President & CEO of First Macro Capital. He helps his readers identify mining stocks to hold for the long-term. He provides a checklist to find winning gold and silver mining producer stocks, including battery metals.
Cypress Development Corp. (TSX-V: CYP) / (OTCQB: CYDVF) / (Frankfurt: C1Z1) is weeks away from publishing a NI 43-101 compliant maiden mineral (lithium) resource estimate. Over the past 14 months, 23 holes (21 of which bottomed in mineralization) were drilled on the Company’s 100% owned Dean & Glory claim blocks in Clayton Valley, Nevada. Results demonstrated good continuity across a large area. The upcoming maiden resource will likely be in the millions of metric tonnes of Lithium Carbonate Equiv. (“LCE“).
How can I say there will be millions of tonnes of LCE? Given the dimensions of the mineralized zones, average zone thickness and lithium grade — an educated guess gets one to at least 4 million tonnes LCE. I could play around with the math, but suffice it to say that whether the figure is 4 or 5 or 6 million tonnes, it would be a very large resource by global standards, {see chart below}. NOTE: {LAC’s Nevada clay project is shown in chart at 25% of LAC’s market cap…. its flagship asset is a JV with SQM in Argentina}
Make no mistake, Cypress is earlier-stage than the others, and its deposit is hosted in clay, meaning it’s unconventional (not a brine or hard rock pegmatite deposit). So, a discount to peers is warranted. But, is the current discount, as shown by [EV/tonne], too large?
News from Lithium Americas to Draw Attention to Nevada in June
Lithium Americas (TSX: LAC) has a clay-hosted lithium project, also in Nevada, with a recently updated Measured, Indicated & Inferred (“MI&I“) resource of 8.3 million tonnes LCE. An entirely new (will replace the prior) Preliminary Feasibility Study (“PFS“) on LAC’s clay project is expected in June. This report will contain valuable information directly applicable to Cypress’ Preliminary Economic Assessment (“PEA“), expected in September/October.
I believe that if LAC’s PFS is strong, they will spinout their Nevada clay project to try to attract market valuations like those of Bacanora Minerals (London: BCN) and Australian-listed Global Geoscience (ASX: GSC), which have an average market cap of ~C$400 M.
LAC has a ~C$600 M market cap, but the majority of that valuation is attributable to the company’s Argentinian JV brine project with SQM. Therefore, a direct valuation comparison with Cypress is difficult to do.
To be clear, there’s no meaningful commercial-scale production anywhere in the world from clay-hosted, or other unconventional lithium deposits. But, Lithium Americas and Bacanora have done a tremendous amount of work over the past decade, including pilot plants, on their Nevada & Sonora Mexico clay projects, respectively. Standing on the shoulders of LAC & BCN, Cypress is benefiting greatly from this prior and ongoing body of work.
It’s worth noting that the Cypress’ Li grades are significantly lower than those of Bacanora’s & Lithium Americas’ clay projects. However, what if, due to favorable geology, Cypress is sitting on a lithium resource that’s easier to extract & process? That may actually be the case, but it’s still too soon to know.
Suffice it to say that management is looking into various scenarios, and they’re excited about early findings. For one, management notes that its deposit does not contain significant amounts of hectorite or smectite, clay minerals that require high temperature calcining to extract lithium, and have made Lithium Americas’ and Bacanora’s projects challenging to advance into production. NOTE: {Bacanora appears to be over the hump, production is expected in 2020}
Cypress believes its deposit contains clay minerals in which the lithium is soluble by conventional acid leaching. If true, it would eliminate significant steps in its process flow sheet.
Bottom line, there’s a decent chance that due to unique mineralogy, Cypress will be able to avoid certain steps in Bacanora’s process flow sheet. That could mean not having to do a pilot plant, potentially saving ten(s) of millions in cap-ex and 1-2 years of development time. Again, LAC & BCN led the path, having done an incredible amount of leg work on metallurgy. Therefore, Cypress could potentially reach BFS-stage faster and considerably cheaper than LAC & BCN.
Cypress has a strong management team and Board. If the maiden mineral resource report delineates millions of tonnes of LCE, the Company should be able to attract additional high-quality execs and advisers as needed.
Cypress is fully-funded through PEA. Additional funding through delivery of a BFS (assuming no pilot plant is necessary) would probably amount to less than C$10 M. Conceivably, Cypress could publish a BFS in 2h 2019. I recognize that I’m getting ahead of myself with talk of a BFS next year, but it’s not a long shot, it’s a perfectly reasonable possibility.
Bacanora Minerals has Blazed a Path for Cypress
In reading Bacanora’s Sonora project (December, 2017) BFS, I noticed that the life-of-mine strip ratio is expected to be 3.4:1. That compares to virtually no waste removal for Cypress’ deposit, call it a strip ratio of 0.1:1. Offsetting this strip ratio advantage, Bacanora has a much higher lithium grade, but the combination of virtually no waste removal, favorable mineralogy, and project location represent substantial advantages for Cypress.
What if Cypress could develop a flow sheet with operating costs in the same ballpark as Bacanora’s? In my opinion, that would mean an after-tax NPV well into the hundreds of millions of CAD$. Alas, we will have to wait for Cypress’ PEA this Fall.
Cypress at C$0.30 per share is trading at an Enterprise Value (“EV“) (market cap + debt – cash) of between C$3.5 – C$5.2 per tonne of LCE (assuming a maiden resource of 4 to 6 million tonnes). Cypress’ fully-diluted EV is ~C$21 M, with zero debt and ~C$3 M in cash (assumes all warrants & options are exercised). The best comp is clearly Bacanora, trading at an EV/t ratio of ~C$28. It has a MI&I resource of 7.3 million tonnes and a strong BFS (after-tax NPV(8%) of ~C$1 billion).
Bacanora’s BFS incorporated an US$11,000/t price. Also in the BFS, a corporate tax rate of 30% (vs. 21% in the U.S.), a mining royalty of 7.5% (no Federal or State royalties for Cypress), anda 3% gross revenue royalty to an investor in BCN (no private royalties payable by Cypress). Conducting business in Nevada, (USA) has its advantages….
There are several near-term industry catalysts for unconventional lithium juniors. Bacanora expects to be in production by 2020. Lithium Americas is publishing a new PFS, in June (replacing the old). In my opinion, LAC might spinout its clay project in 2h 2018. If it does, there would be 3 main publicly-listed, unconventional junior peers, each with market caps over C$100 million.
Good news from LAC, BCN or GSC.ax is good news for Cypress. This lithium industry segment de-risking would arguably have the greatest impact on Cypress because it has a dramatically lower valuation to begin with.
Global Geoscience & Lithium X Corp. Suggest Possible Upside in Cypress
Global Geoscience is publishing a PFS on its unconventional asset, a lithium/boron project with economics of something like 55%/45% lithium/boron. That PFS will be big news because the company did not first generate a PEA, as is typically done. GSC.ax believes that there will be no need for roasting or calcining, which may also be the case with Cypress. As the market has come to understand that GSC.ax will reach production in 2 years, it now trades at an EV/t ratio of C$114.
Notice on the chart above that Lithium X Corp(PFS stage) was taken out by a Chinese group at an EV/t ratio of C$120. Think about that for a moment, GSC.ax is trading at C$114/t, Lithium X was acquired for C$120/t, Bacanora is trading atC$28/t…. should Cypress be valued at C$3.5 – $5.2/t?While clearly not an apples to apples comparison, the dramatic difference in valuations might be excessive. I leave it for readers to decide.
In any event, by the time the PEA comes out in Sept./Oct., readers will know considerably more about Cypress’ metallurgy and process flow sheet. There need not be additional equity raises before delivery of a PEA, especially as in-the-money-warrants get exercised. The stars seem to be aligned for Cypress Development Corp. (TSX-V: CYP) / (OTCQB: CYDVF) / (Frankfurt: C1Z1). Readers should consider taking a closer look, here are links to additional information:
Disclosures: The content of this article is for information only. Readers fully understand and agree that nothing contained herein, written by Peter Epstein of Epstein Research[ER], (together, [ER]) about Cypress Development Corp., including but not limited to, commentary, opinions, views, assumptions, reported facts, calculations, etc. is to be considered implicit or explicit investment advice. Nothing contained herein is a recommendation or solicitation to buy or sell any security. [ER] is not responsible under any circumstances for investment actions taken by the reader. [ER] has never been, and is not currently, a registered or licensed financial advisor or broker/dealer, investment advisor, stockbroker, trader, money manager, compliance or legal officer, and does not perform market making activities. [ER] is not directly employed by any company, group, organization, party or person. The shares of Cypress Development Corp. are highly speculative, not suitable for all investors. Readers understand and agree that investments in small cap stocks can result in a 100% loss of invested funds. It is assumed and agreed upon by readers that they will consult with their own licensed / registered financial advisors before making investment decisions.
At the time this interview was posted, Peter Epstein owned shares and/or stock options in Cypress Development Corp.and the Company was an advertiser on [ER].Readers understand and agree that they must conduct their own due diligence above and beyond reading this article. While the author believes he’s diligent in screening out companies that, for any reasons whatsoever, are unattractive investment opportunities, he cannot guarantee that his efforts will (or have been) successful. [ER] is not responsible for any perceived, or actual, errors including, but not limited to, commentary, opinions, views, assumptions, reported facts & financial calculations, or for the completeness of this article or future content. [ER] is not expected or required to subsequently follow or cover events & news, or write about any particular company or topic. [ER] is not an expert in any company, industry sector or investment topic.
Sales and profits growth for key Asian gold jewelers continues to set the stage for an imminent and massive mining stocks rally.
Please click here now. Double-click to enlarge this fabulous Chow Tai Fook chart.
A major breakout to the upside is in play, and where Chinese jewellers go on the price grid, Western miners are likely to follow.
Some of the GDX component stocks are beginning to join what I term the “bull era upside fun” even though bullion has yet to prove itself with a three-day close over $1370.
Please click here now. Double-click to enlarge this daily gold chart. Gold is coiled beautifully inside a drifting rectangle formation, and there’s already been one attempt to break out to the upside.
Most component stocks of the US stock market indexes look technically horrific. A move for gold up to the “promised land” of $1450+ is likely to be fueled by both love and fear trade factors.
That’s because the next rate hike and quantitative tightening ramp-up is likely to occur against a background of ever-stronger jewelry demand coming from both China and India.
Gold cycle expert Erik Hadik notes that many American wars and disasters have occurred around the date of April 19. It’s unknown if there will be any “blowback” from the latest US military adventurism in Syria, but from a cyclical perspective, it could happen.
Please click here now. The Indian gold market has largely recovered from the ludicrous government policy attacks, and demand is strengthening in what appears to be a permanent trend.
With both Chinese and Indian demand looking very solid, all gold needs now to move it towards $1450 is a tiny boost of investment demand from Western fear traders.
On that note, please click here now. I don’t think most analysts and media people are listening carefully enough to Bill Dudley and other key players at the Fed.
They are starting to talk about what could make the Fed go from quarterly to monthly decision making for rate hikes. Bill casually mentions that stronger than expected inflation could push the Fed to do five or six rates hikes this year. That inflation hasn’t happened yet, but the labour market is still tightening and inflationary tariffs from Trump are likely on the horizon.
It’s important for investors to understand that most of the US stock market’s gains have been fuelled by corporate stock buyback programs. Those programs were made possible by QE and ultra-low interest rates. Just two or three more hikes this year could be enough to end those buybacks.
That would essentially create a “lights out” moment for stock market investors. Many of them bought their stocks late in the business cycle. They ignored the cycle because they hoped Trump would somehow recreate the 1950s US economy for them, even though America’s demographics are now almost the exact opposite of what they were in the 1950s.
In India, the population is gargantuan and the demographics of that population are similar to that of 1950s America… with the added bonus being that these citizens are obsessed with gold.
A recession in India now is essentially defined as 6% real GDP growth and 8% interest rates. In America, 8% interest rates would probably create minus 10% GDP and send the Dow Jones Industrial Average crashing down to under 1000. The bottom line: There are 3 billion new sheriffs in town, and they are all living in China and India, eager to buy more gold!
Globally, there are literally trillions of dollars invested in government bonds that still have negative interest rates. A few more hikes and accelerated QT from the Fed could crush investors in these bonds and create a much bigger panic in the stock market than the one that has already occurred this year.
Inflationary tariffs from Trump, an end to corporate buybacks, and the tightest labour market in America since the 1970s are poised to end the Fed’s interest rate policy of gradualism.
I’m now predicting that within six months the Fed will begin re-evaluating its quarterly hiking policy and will almost certainly replace it with a month by month evaluation policy for 2019.
I’m also predicting the Fed will begin “hawk talk” about a fifty basis point hike then, and that Powell will stay the course on QT. These events and processes should combine to create a series of major stock and bond market declines in America.
The world’s only true safe havens are gold and silver bullion, and they will see their lustre restored. I’m also predicting that millions of Chinese and Indian gold market gamblers will begin betting on the demise of American markets and government as the Fed tightens ever-more aggressively. These gamblers will place their main bets by buying vast amounts of gold.
Bond market “supremo” and GDX ETF enthusiast Jeff Gundlach has talked about gold being poised for a “thousand-dollar rally”. I fully expect Chindian gamblers and an imminent hawkish ramp-up in Fed policy to make his predicted rally happen.
Please click here now. Double-click to enlarge. We can all dream of what a thousand-dollar rally to $2400 would do for GDX, and for its component stocks that most gold bugs own. For now, investors need to satisfy themselves with the solid staircase-style rally that is in play.
Gold is more vulnerable than GDX in the short term, and I’ve been an eager gold stocks buyer in the entire $23 to $18 GDX price area. I have enough stock and my focus now is call options. That’s because a three-day close above $1370 for gold now appears imminent. Holding 70% calls and 30% puts on gold stocks is probably an ideal way for gold market gamblers to get positioned. I don’t gamble a lot, but I do gamble, and this gamble appears to be a very good one! The puts can be covered if gold trades at $1320 – $1280 and more calls can be added there. Whether gold bugs are conservative, moderate, or aggressive, a major opportunity appears to be at hand in the precious metals markets, and it’s time for action!
Special Offer For Website Readers: Please send me an Email to freereports4@gracelandupdates.com and I’ll send you my free “Golden Home Runs” report. I highlight key stocks gold and silver stocks poised to stage “home run” rallies of 100% and more, as gold surges towards $1450! I also include a special update on Novo Resources, which has started a fresh surge higher!
Stewart Thomson is a retired Merrill Lynch broker. Stewart writes the Graceland Updates daily between 4am-7am. They are sent out around 8am-9am.The newsletter is attractively priced and the format is a unique numbered point form. Giving clarity of each point and saving valuable reading time.
Risks, Disclaimers, Legal
Stewart Thomson is no longer an investment advisor. The information provided by Stewart and Graceland Updates is for general information purposes only. Before taking any action on any investment, it is imperative that you consult with multiple properly licensed, experienced and qualified investment advisors and get numerous opinions before taking any action. Your minimum risk on any investment in the world is: 100% loss of all your money. You may be taking or preparing to take leveraged positions in investments and not know it, exposing yourself to unlimited risks. This is highly concerning if you are an investor in any derivatives products. There is an approx $700 trillion OTC Derivatives Iceberg with a tiny portion written off officially. The bottom line:
Are You Prepared?
What’s going to be the catalyst for the junior gold stocks to escape this sideways to downward movement? To me, the key to a momentum change is discovery. Although the market on a whole seems to be stuck in neutral, money has been injected into the best junior gold exploration teams, and because of this, I think it’s only a matter of time before we get a stellar drill hole, which will bring eyes and cash back to the sector.
Supply and demand fundamentals control the direction of markets over the long term, and when looking ahead at almost any metal’s supply fundamentals, I think it’s clear that we’re in for a metal supply crunch in the years ahead. Bull markets driven by supply destruction are very strong, mainly because it requires not only the discovery of new deposits, but those discoveries also have to be permitted developed, and that takes time.
It’s my contention that the next bull market in metals will be discovery driven, as the world’s major mining companies look to fill the supply gaps that are developing in most of their reserve and resource inventories.
In my opinion, buying the highest quality companies gives you the best possible odds of being right when the market turns. The company I’m going to share with you today, Northern Empire Resources Corporation, is, in my opinion, one of those high-quality companies, and they’re poised to discover and expand their resources at the Sterling Gold Project in Nevada.
DTC Eligibility for its common shares listed on the OTC market in the United States
MCAP: $86.4 million (at the time of writing)
Shares: 66,586,700
Fully Diluted: 77,139,302
CASH: $16 million
Management/Insiders: 7.9%
Institutional Ownership: 32.7%
Coeur Mining: 11.6%
Imperial Metals: 3.7%
Northern Empire’s People
Northern Empire is led by President and CEO, Michael Allen, who is a professional geologist by trade and has 20 years of experience in the mining industry. Allen has worked in various senior roles over the course of his career with Redcorp Ventures, Silver Standard Resources and, most recently, West Kirkland Mining. For those who are not familiar, West Kirkland Mining’s gold project is located in Nevada, giving Allen 8 years of jurisdictional experience, and should prove to be an X-Factor when it comes to developing and exploring for gold on Northern Empire’s Sterling Gold Project.
Additionally, Northern Empire has a strong Board of Directors, made up of individuals with extensive experience in the mining industry. The Board is led by Executive Chairman, Douglas Hurst. Hurst, a geologist by trade, has a great track record for developing mining companies into premier takeover candidates. Hurst was a founding executive of both International Royalty Corporation and Newmarket Gold Inc. Both companies were taken over, first International Royalty Corporation by Royal Gold for $700 million, and most recently, Newmarket Gold by Kirkland Lake Gold for $1 billion.
The Board is rounded out by people whose careers share a common characteristic – successful company building. Each member has been involved in at least one development success in their career, and to me, it’s clear that this is the main goal for Northern Empire; to develop their Sterling Gold Project into a premier takeover candidate.
The other Board members are as follows:
Raymond Threlkeld has more than 32 years of experience within the mining industry. Threlkeld was Chairman of Newmarket Gold which, as previously stated, was purchased by Kirkland Lake Gold. He was also involved with Western Goldfields which was purchased by New Gold in 2009.
John Robins, a professional geologist by trade with 30 years of mining experience. He was a founder and Chairman of Kaminak Gold, which was purchased by Goldcorp for $520 million in 2016.
Adrian Fleming, a geologist by trade with over 30 years of experience in the mining industry. Fleming was President and Director of Underworld Resource Inc which was acquired by Kinross in 2010. Fleming was an early mentor in Michael Allen’s career when they both worked on the Hope Bay Gold Project.
Jim Paterson with 20 years of experience on the financial side of the mining business, and the founder, CEO and Director of Corsa Capital Ltd.
Darryl Cardey and Jeff Sundar both have several years of experience within the mining industry and were a part of the successful development and sale of Underworld Resources.
Nevada, United States
Northern Empire’s 100% owned Sterling Gold Project is situated roughly 160 km northwest of Las Vegas, Nevada and encompasses a total of 14,109 acres over 4 contiguous claim blocks. Nevada is situated in the western United States and has a long history of mining dating back to the 1840s. Although mining began over a 150 years ago, Nevada’s real fame in the gold mining industry didn’t come until the 1960s when ‘Carlin Style’ or sediment-hosted disseminated gold deposits started being mined.
Why did Carlin Style gold deposits take so long to be mined? Simply, nobody saw them. Unlike the outcropping gold bearing epithermal veins that were discovered by early prospectors, Carlin Style gold is very fine grained and not visible to the naked eye. Since the 1960s, Nevada has produced around 20 million ounces of gold, making it truly a world-class destination for gold mining.
Given this, it comes as no surprise to me that the Fraser Institute issued a mining investment attractiveness score of 85.45, ranking Nevada 3rd in the world. The Fraser Institute’s score is based on a mixture of criteria, which includes, but is not limited to, the jurisdiction’s legal system, taxation regime, quality of infrastructure, political stability, and arguably most importantly, the jurisdiction’s geological potential. In my opinion, in terms of mining investment, it doesn’t get much better than Nevada.
Sterling Gold Project
The Sterling Gold Project has a Global Resource of 23,811,800 tonnes at 1.29 g/t for 985,000 ounces of gold and can be broken down into two key areas; the Sterling Mine, which is in the southern portion of the property, and the Crown Block, which resides in the north.
Sterling Mine
The Sterling Mine is a past gold producer with the surrounding area having historical ties that extend back to 1906, with the Panama Mine operating until 1940. The region then saw limited exploration until 1980 when the Sterling Mine began production. The Sterling Mine consists of 3 separate open pits and 2 underground mines, which produced 194,996 troy ounces from 853,984 tonnes of ore for an average grade of 7.44 g/t, over its 20 years in operation.
The Sterling Mine’s deposit mineralization is Carlin Style and is amenable to heap leaching. In the past, the open pit and underground mined ore was placed onto heap leach pads and, without crushing, gold recoveries averaged 88%.
The Sterling Mine does have an existing pit constrained inferred resource of 3,081,000 tonnes at 2.57 g/t for 254,000 ounces of gold. The ‘pit constrained inferred resource’ refers to the estimated economic surface resources found within a 45-degree constant slope pit shell.
Additionally, there’s a non-pit constrained inferred resource of 350,000 tonnes at 3.38 g/t (1.7 g/t cut-off) for a total of 38,000 ounces of gold. The non-pit inferred resource represents mineralization that could potentially be of economic interest, if selective underground mining of the mineralized zone, below the projected pit shell limits, was carried out.
NOTE: The Sterling Mine pit constrained inferred resource grade of 2.57 g/t is fantastic, especially if you consider that it’s amenable to heap leaching for the extraction of its gold. This is a great example of the upside potential at the Sterling Gold Project, as Carlin Style gold mineralization that’s mined in an open pit and has good grades can be very profitable!
Gold Production at the Sterling Mine
A major advantage to the past producing Sterling Mine is that its infrastructure is in place and ready for operation. In the photo below, you can see the layout of the processing areas: The active leach pad, the permitted leach pad, processing ponds and processing facility.
Additionally, from the satellite photo below, you can see the layout of the permitted open pits, Burro, Sterling and Ambrose. In the top right of the image is the processing area, as shown above. Finally, the 144 Zone portal, in the bottom right, gives access to the historical underground workings.
With the necessary permits in hand, Northern Empire has greater control over their production start date, which is an enviable position for most gold exploration and development companies. Moreover, as an investor, the fact that Northern Empire has the necessary production permits in hand is a huge plus, because it reduces the overall risk associated with the Project.
Sterling Mine Exploration Potential
While having the production permits and an inferred resource are the basis for what looks to be a promising future for Northern Empire, the most exciting part of their story, in my opinion, is the exploration potential of the property.
Exploration and infill drilling on the Sterling Mine will focus on the 2017 high grade drill holes that sit on the pit shell edge, as can be seen in the satellite photo below.
As well, in the computer-generated Sterling Mine model image, you can gain a better perspective on the 3 dimensional open pit shell and the location and orientation of the Burro Fault, which is thought to be one of the most important structures for the deposit. Other minor faults in the area trend north to north-northeast and are important in terms of the future exploration of the Sterling Mine area. As the Technical Report states,
“they are significant because they are intimately associated with mineralization, and were almost certainly conduits for hydrothermal fluids.” ~ Technical Report – pg.7-8
PUSH: Watch for drill results from the Sterling Mine. Further proof of continuity in the existing inferred resource and successful step out drilling will be major gains for the company.
The Crown of Northern Empire
The Sterling Gold Project’s north end is occupied by the Crown Block, which is further broken down into 4 main targets: Daisy Deposit, Secret Pass Deposit, SNA Deposit and Shear Zone. The target mineralization which is found in the Crown Block is concentrated around the same detachment fault structure that hosted Barrick Gold’s past producing, roughly 2.3 million ounce Bullfrog gold mine.
The gold within the Daisy and SNA Deposits are carbonate-hosted and classified as Carlin-Style, while the Secret Pass is volcanic-hosted and classified as epithermal.
Daisy
The Crown Block’s Daisy Deposit is a past producing open pit gold mine (Glamis/Rayrock), having produced 104,000 ounces of gold between 1997 and 2001. As listed in the Sterling Gold Project’s inferred resource table, Daisy has an inferred resource of 5,362,000 tonnes at 1.34 g/t for 222,000 ounces of gold.
High grade surface samples, up to 15 g/t gold, and 2017 drilling suggest there is potential for expansion of the Daisy Deposit resource. Examining the satellite photo below, you can see the highlighted 2017 drill intercepts – holes D17-002, D17-001 and the 2018 drill intercept from hole D18-003C – and the location of high-grade surface samples which are represented by the purple squares.PUSH: 10 holes are planned for Daisy Deposit in the 2018 drill program. As mentioned above, one stellar drill intercept has already been released, assaying 1.41 g/t over 123.93m, a great result. Watch for more drill results from Daisy in the weeks ahead, as Northern Empire looks to expand the Daisy Resource down dip.
Daisy Deposit Cross-Section – Open Down Dip to the north
Secret Pass
The Secret Pass deposit, like Mother Lode, is volcanic-hosted with disseminated gold mineralization and has a current inferred resource of 11,143,000 tonnes at 0.93 g/t for 335,000 ounces of gold. 2017 drilling on the Secret Pass Deposit was highlighted by SP17-001: 82m @1.26 g/t Au and SP17-002: 30.48m @0.55 g/t Au. Additionally released on March 20th 2018 – SP18-003C: 70.0m @1.79 g/t.
All three drill holes can be found on the satellite photo of Secret Pass below, including the location of pending and proposed drill holes for 2018. With the purchase of additional claims south of the deposit, Northern Empire will be able to pursue hole D-164, which returned a huge intercept of 56.39m at 3.13 g/t.
PUSH: 15 holes are planned for the Secret Pass deposit in 2018. Watch for drill results in the weeks ahead, as Northern Empire looks to expand the resource both laterally and at depth.
SNA Deposit
The SNA Deposit is a past producing mine and was formerly referred to as Sunday Night Anomaly from 1991 to 1995. The SNA Deposit hosts Carlin Style gold mineralization and has an inferred resource of 3,875,000 tonnes at 1.03 g/t for 126,000 ounces of gold.
Interestingly, the SNA Deposit lies in close proximity to Corvus Gold’s Claim boundary, and more importantly, their Mother Lode open pit. In the satellite image below, you can see Corvus Gold’s claim boundary outlined in orange, along with Northern Empire’s SNA Deposit toward the bottom right.
In Corvus Gold’s 2017 drill program, they hit 51.8m of 1.86 g/t gold which included an interval of 19.8m of 3.43 g/t. The reason I mention this is because the hole was located roughly 8 meters from the claim boundary with Northern Empire. As you can see in the satellite image, Northern Empire’s property completely surrounds Corvus Gold’s Mother Lode deposit and needless to say, makes this is a very intriguing target area with a lot of potential for Northern Empire!
PUSH: +16 holes are planned for the SNA Deposit in the 2018 drill program. Watch for drill results as Northern Empire attempts to expand upon the SNA deposit resource.
Concluding Remarks
As I mentioned in my introduction, I believe that placing yourself in quality companies is the way to succeed in a business where the odds of success are typically stacked against you. That said, quality doesn’t mean they’re free of risk.
In terms of Northern Empire, I believe the biggest risk is an unsuccessful drill program in 2018, which would result in minimal to no improvement in their existing inferred resource. In this worst case scenario, I don’t see much upside from today’s current market cap.
While there’s always a chance of coming up empty handed when exploring, I think there’s a far better chance that their resource will increase, and with permits in-hand, Northern Empire’s Sterling Mine is ready to go.
Recapping Northern Empire’s strengths:
Good management team with extensive experience exploring and developing gold projects in Nevada.
The Fraser Institute ranks Nevada 3rd in the world for Mining Investment Attractiveness.
Northern Empire is in possession of all the necessary production permits to restart the Sterling Mine.
The Sterling Mine potential production scenario should be low cost, as the Carlin Style gold mineralization will be mined from an open pit and is amenable to heap-leaching.
Great exploration potential within the Sterling Mine and the Crown Block’s 4 main target areas: Daisy Deposit, Secret Pass Deposit, SNA Deposit and Shear Zone. 15,000m of drilling planned for 2018.
Existing inferred global resource of 985,000 ounces of gold at 1.29 g/t.
CASH – $16 million!!
I am invested in Northern Empire and am looking forward to news flow over the coming months.
Don’t want to miss a new investment idea, interview or financial product review? Become a Junior Stock Review VIP now – it’s FREE!
Until next time,
Brian Leni P.Eng
Founder – Junior Stock Review
Disclaimer: The following is not an investment recommendation, it is an investment idea. I am not a certified investment professional, nor do I know you and your individual investment needs. Please perform your own due diligence to decide whether this is a company and sector that is best suited for your personal investment criteria. I do own shares in Northern Empire Resources. All Northern Empire Resources’ analytics were taken from their website and press release. Northern Empire Resources is a Sponsor of Junior Stock Review.
SPDR Gold Shares is an ETF that tracks the performance of gold in the financial markets. It is denominated by the ticker GLD and is one of the most widely watched gold indicators. The gold price is influenced by a unique set of factors. These include interest rates, the strength of the USD, supply and demand, etc. For casual traders, it’s important to know that gold is the go-to investment when equities markets sour.
When geopolitical uncertainty rocks the financial markets, investors typically flock to gold as a safe-haven asset. It tends to perform strongly when stock prices are volatile, and when the USD is weak. A strong dollar is a disincentive to gold investors, since gold is a dollar-denominated asset that appreciates when the precious metal is more affordable to foreign buyers.
GLD provides one access point to investments in gold (there are many options available), and it is priced at a fraction of the gold price. For example, GLD was trading around $127.62 per share (April 16, 2018), above both the 50-day moving average of $126.15, and the 200-day moving average of $123.13. This clearly illustrates that gold is bullish. Corroborating evidence is available from the anaemic performance of US stock markets.
The S&P 500 Index has a year to date return of 0.22%
The NASDAQ Composite Index has a year to date return of 3.72%
Poor Stock Market Performance Feeds Gold Price
The 2018 performance of stock markets is precisely the cannon fodder that commodities like gold need to appreciate. When traders and investors are pulling their money from the stock market, they are either investing it in fixed-interest-bearing securities or shifting resources to gold stocks and physical gold.
The current price of gold (April 16, 2018) is $1,349.10 per ounce on the Comex. Gold was priced at around $1,316.10 on 2 January 2018, and it has consistently appreciated ever since. In percentage terms, gold is up 2.5% for the year to date. This represents the opposite of what we are seeing in equities markets, and it holds true from a theoretical perspective.
Commodities trading options include a wide range of choices These include physical assets, futures contracts, options, exchange traded funds, CFDs, stocks, and even binary options. Gold ranks as one of the most commonly traded commodities and has been a store of value for millennia. Its price is determined by supply & demand considerations, and it is heavily influenced by monetary policy (interest rate hikes), political considerations, and the strength of the USD. A useful barometer of USD strength or weakness is the US dollar index, DXY. This indicator tracks the performance of the greenback against a trade-weighted basket of currencies including the SEK, CAD, GBP, EUR, CHF, and JPY.
Trump and Oil Boosted Gold Prices in 2017
US stock markets have floundered in 2018, and gold is in the black. If we extrapolate back to 2017, gold traded at around $1,151 per ounce in January 2017 and by the end of the year it closed at over $1,309 per ounce. That represents a 13.8% appreciation in the gold price. Equities markets also defied gravity in 2017, with double digit gains for major bourses. It appears that confidence in gold was boosted by uncertainty with oil prices and additional uncertainty related to Trump’s election as president. We have seen a tempering of these concerns as time progressed, and gold has stabilized while equities markets have retreated.
Last week index score: 33.86
This week: 41.32
Zinc One Resources (TSXV:Z) announces the final drill results from the Bongarita mineralized zone at its Bongará zinc mine project in north-central Peru.
We recently uploaded 43 CEO Elevator pitches to our Youtube channel! We also uploaded two videos of Brent Cook of Exploration Insights walking the floor of PDAC talking rocks with Morgan Poliquin of Almadex Minerals and Kevin Heather of Regulus Resources – go check them out!
The Oreninc Index rose in the week ending April 13th, 2018 to 41.32 from 33.86 a week ago as brokered action returned to the market.
Market volatility experienced another twist as tensions in Syria notched up, this time due to an alleged chemical weapons attack by the ruling regime of Bashar al Assad on the rebel-held town of Douma and the promise of pending punitive action by US president Donald Trump who warned that “missiles will be coming” (that subsequently occurred in the early hours of Saturday morning).
As a result, there was safe haven precious metals buying.
On to the money: total fund raises announced almost fell by half to C$166.0 million, a three-week low, which included three brokered financings for C$12.2 million, a two-week high, and one bought deal financing for C$5.0 million, a four-week high. The average offer size dropped to C$2.4 million, a three-week low.
Another volatile week for gold which saw the yellow metal close up at US$1,346/oz from US$1,333/oz a week ago with a mid-week high of US$1,353/oz. Gold is now up 3.33% this year. Meanwhile, the US dollar index closed down at 89.80 from 90.10 a week ago. The van Eck managed GDXJ gained more than a dollar to close up at US$33.49 from US$32.39 last week. The index is down 1.88% so far in 2018. The US Global Go Gold ETF also saw strong growth to close up at US$12.81 from US$12.51 a week ago. It is down 1.54% so far in 2018. The HUI Arca Gold BUGS Index closed up at 184.32 from 177.59 last week. The SPDR GLD ETF continued to see buying action and closed up at 865.89 tonnes from 859.99 tonnes a week ago.
In other commodities, silver closed up at US$16.65/oz from US$16.38/oz a week ago. Copper showed a slight increase to close at US$3.07/lb from US$3.05/lb last week, a week that saw the CRU World Copper Conference in Santiago, Chile and various presenters talk about the shortage of new copper mine projects coming through. Oil saw strong gains to close up at US$67.39 a barrel from US$62.06 a barrel a week ago.
The Dow Jones Industrial Average closed up at 24,360 from 23,932 last week. Likewise, Canada’s S&P/TSX Composite Index grew to 15,273 from 15,207 the previous week. The S&P/TSX Venture Composite Index closed up at 795.94 from 769.15 last week.
Summary:
Number of financings increased to 28, a four-week high.
Three brokered financings were announced this week for C$12.2m, a two-week high.
One bought-deal financing was announced this week for C$5.0m, a four-week high.
Total dollars dropped to C$66.0m, a three-week low.
Average offer size also dropped to C$2.4m, a three-week low.
Financing Highlights
Maya Gold & Silver (TSXV: MYA) announced a non-brokered private placement of C$25.0 million through the issuance of 7.6 million shares @ C$3.30.
No warrants will be issued.
The net proceeds will be used to continue the development and expansion of the Zgounder silver mine in Morocco. Maya plans to begin building a second mine at Zgounder that will increase production capacity to 2,000 tpd by 2021.
Major Financing Openings:
Maya Gold & Silver (TSX-V: MYA) opened a C$25-million offering on a best efforts basis. The deal is expected to close on or about April 13th.
Critical Elements (TSX-V: CRE) opened a C$5-million offering underwritten by a syndicate led by Canaccord Genuity on a bought deal basis. Each unit includes half a warrant that expires in 24 months. The deal is expected to close on or about May 1st.
Avino Silver & Gold Mines (TSX: ASM) opened a C$5-million offering underwritten by a syndicate led by Fitzgerald Canada on a best efforts basis. The deal is expected to close on or about April 27th.
Noront Resources (TSX-V: NOT) opened a C$4.2-million offering on a best efforts basis.
Major Financing Closings:
Orezone Gold (TSX: ORE) closed a C$44.92-million offering on a best efforts basis.
Amarillo Gold (TSX-V: AGC) closed a C$5.16-million offering on a best efforts basis. Each unit included half a warrant that expires in 24 months.
Aguia Resources (TSX-V: AGRL) closed a C$5-million offering underwritten by a syndicate led by Echelon Wealth Partners on a bought deal basis. Each unit included half a warrant that expires in 36 months.
Noront Resources (TSX-V: NOT) closed a C$4.2-million offering on a best efforts basis.
Company News
Zinc One Resources (TSX-V: Z) announces the final drill results from the Bongarita mineralized zone at its Bongará zinc mine project in north-central Peru.
36 holes for 583m were drilled at Bongarita. Very fine-grained zinc mineralization, mostly as silicates exclusively hosted by soils, has been delineated over about 7,500m2.
Two portable rigs continue to drill at Mina Chica and Mina Grande Sur.
Highlights included 2.4m @ 42.8% Zn
Zinc One also announced its first ever drill results that confirmed a high-grade zinc mineralized zone at Mina Chica, about 200m east of Bongarita.
Highlights included 16.5m @ 35.6% Zn.
Analysis
The drilling at Bongarita has confirmed that the amount of mineralized soils should be similar in size and grade to the historical resource. The company believes that drill data along with the previous pit and channel sampling data, will provide enough data to delineate a resource. Combined with the positive first results from Mina Chica, the Bongarita project is shaping up to have significant zinc potential from surface, which bodes well for the possibility of a mine being developed in the future.
A few weeks ago we wrote that it may not be Gold’s time yet but a few recent developments suggest its time could be sooner than we anticipated. Although Gold failed to breakout last week, we should note the positive action in the miners. Over the past seven trading days the miners have strongly outperformed Gold. That includes the juniors, which appear very close to breaking out of the downtrend that has been in effect for over 12 months.
In the chart below we plot the three major junior ETFs: GDXJ, GOEX (explorers) and SILJ (silver juniors). The juniors have trended lower since February 2017 but are now threatening to break trendline resistance. Since December 2017 the juniors have traded in an increasingly tighter and tighter range which indicates a break is coming very soon. Also, note how the 200-day moving averages are flat and no longer sloping lower. That reflects a mature correction and the potential for a new uptrend if the juniors break above resistance in a strong fashion.
GDXJ, GOEX, SILJ Daily Bar Charts
There are a few other things worth mentioning.
First, as we alluded to, GDXJ has strongly outperformed Gold over the past seven trading days. The GDXJ to Gold ratio has reached its highest mark since the start of February. That sudden relative strength is significant considering Gold is within spitting distance of a major breakout.
Second, one custom breadth indicator we track is the percentage of juniors (a basket of 50 stocks) trading above the 200-day moving average. This figure (currently 42%) has not exceeded 51% since February 2017. A strong push above 51% could confirm a renewed uptrend in the juniors.
If juniors are going to break out of their downtrends, it could mark the start of potentially a very large move. Gold, upon a breakout through $1375, will have a measured upside target of roughly $1700/oz. Although the juniors aren’t very close to breaking their 2016 high, they, upon a breakout would have similar upside potential. GDXJ, upon a breakout through $50 would have a measured upside target of $83.
GDXJ & Gold Necklines
That potential measured upside target for GDXJ may seem extreme but for juniors its par for the course. Below we show an updated chart of our Junior Gold Stocks Bull Analog. By my data, juniors are well below where they were during the 2001-2007 and 2008-2011 bull markets. So if Gold breaks higher and is going to reach $1700/oz then juniors are likely to catch up to historical performance.
TDG Junior Gold Stocks Bull Analog
Although Gold failed to breakout (again) last week, the performance in the gold stocks did not confirm that failure. The newfound relative strength, if sustained over the next few weeks could signal that a sector breakout is much closer than previously anticipated. The juniors are very close to breaking their downtrend and that break could only be the start of a potentially massive move. In anticipation of that potential move, we have been accumulating the juniors that have 300% to 500% upside potential over the next 18-24 months. To follow our guidance and learn our favorite juniors, consider learning more about our premium service.
The mega-cap stocks that dominate the US markets have enjoyed an amazing bull run. But February’s first correction in years proved things are changing. With that unnatural low-volatility melt-up behind us, it’s more important than ever to keep leading stocks’ underlying fundamentals in focus. They help investors understand which major American companies are the best buys and when to deploy capital in them.
For some years now, I’ve been doing deep dives into the quarterly financial and operational results in the small contrarian sector of gold and silver miners. While hard and tedious work, this exercise has proven incredibly valuable. With each passing quarter my knowledge of individual companies grows, helping to ferret out miners with superior fundamentals and the greatest upside potential. Traders love the resulting essays.
This successful fundamental-research methodology can be applied to other sectors, and even the stock markets as a whole. And no “sector” is more important to the overall stock markets than the biggest and best American companies. So I’m starting this new essay series to analyze their quarterly results on an ongoing basis. Today’s initial foray starts with their latest results from Q4’17, a critical baseline quarter.
With the new Q1’18 earnings season getting underway, Q4’17’s data is getting stale. Optimally this research would’ve been done 6 weeks or so ago. But it wasn’t until long-lost stock-market volatility finally roared back in February and March that it became abundantly clear big changes are afoot. After that it took time to build our necessary underlying spreadsheets and dive into the big US stocks’ Q4 results.
Going forward it will be easier to analyze and publish new quarters’ results much sooner after those quarters end. But getting Q4’17 baseline data was absolutely essential. That may very well prove the final quarter in one of the most-extraordinary bull markets on record. The flagship S&P 500 stock index had powered 324.6% higher over 8.9 years, making for the third-largest and second-longest US bull on record!
That was also just a hair under the second-largest ranking. 2017 was truly the best of times for the stock markets too. Record-low volatility along with extreme euphoria in anticipation of Republicans’ coming massive corporate tax cuts drove the S&P 500 (SPX) 19.4% higher with nary even a trivial 4%+ pullback. Nearly everyone was convinced this idyllic rally could continue indefinitely, traders were utterly enchanted.
A key real-world side effect of last year’s epic stock-market exuberance was sharply-higher spending by households and corporations alike. Late in major bull markets when everyone is complacent and greedy the wealth effect is very strong. People extrapolate their fat stock gains out into infinity, and ramp their spending accordingly. That drives strong growth in corporate sales and profits, greatly reinforcing the elation.
As a contrarian student of the markets and trader, I wasn’t drinking that Kool-Aid. On 2017’s final trading day I published an essay on the hyper-risky stock markets, explaining why a new bear was long overdue. The valuations of the elite SPX stocks were deep into formal bubble territory, running at average trailing-twelve-month price-to-earnings ratios of 30.7x at the time. That would further balloon to 31.8x by late January!
More importantly, the world’s major central banks were pulling away the punch bowls that had directly fueled that vast orgy of stock-market excess. The Fed was starting to ramp its first-ever quantitative-tightening campaign to begin unwinding long years and trillions of dollars of quantitative-easing money printing. And the European Central Bank was drastically tapering its own QE bond-buying campaign.
This unprecedented tightening following radically-unprecedented QE would literally strangle the stock markets, as I explained in late October. The extreme euphoria drowned out those warnings then, but traders are more receptive now after the SPX’s first 10%+ correction in 2.0 years in early February. All this suggests high odds that Q4’17 will prove the final pre-peaking quarter of that central-bank-goosed bull.
Thus I couldn’t wait for Q1’18 data to start this new essay series, I had to get Q4’17’s baseline data no matter what. The world’s most-important stock index by far is the US S&P 500, which weights America’s biggest and best companies by market capitalization. So not surprisingly the world’s largest and most-important ETF is the SPY SPDR S&P 500 ETF which tracks the SPX. This week it had net assets of $252.4b!
That’s a staggering sum, reflecting the universal popularity of index investing late in major bull markets. Two of the next three largest ETFs also track the S&P 500, the IVV iShares Core S&P 500 ETF at $140.4b and the VOO Vanguard S&P 500 ETF at $87.1b. These dwarf the entire rest of the ETF sector. For comparison, the dominant and popular GLD SPDR Gold Shares gold ETF has net assets of just $37.3b.
Unfortunately my small financial-research company lacks the manpower to analyze all 500 SPX stocks in SPY each quarter. Support our business with enough newsletter subscriptions, and I would gladly hire the people necessary to do it! But for now we’re starting with the top-34 SPY components ranked by market capitalization. That’s an arbitrary number that fits neatly into the tables below, but a commanding sample.
As of the end of Q4’17 on December 29th, these 34 companies accounted for a staggering 41.8% of the total weighting in SPY and the SPX itself! They are the biggest and best American companies that are largely-if-not-totally driving US stock-market fortunes. Whether the SPX rolls over into a new bear market or not will depend on how these elite stocks fare. They are the widely-held mega-cap stocks everyone loves.
Every quarter I’m going to wade through a ton of core fundamental data on each top-34 SPX company and dump it into a spreadsheet for analysis. The highlights make it into these tables. They start with each company’s symbol, weighting in the SPX and SPY, and market cap as of the final trading day of Q4’17. That’s followed by the year-over-year change in each company’s market capitalization, a critical metric.
Major US corporations have been engaged in a wildly-unprecedented stock-buyback binge ever since the Fed forced interest rates to deep artificial lows during 2008’s stock panic. Thus their share-price appreciation also reflects shrinking shares outstanding. Looking at market-cap changes instead of just underlying share-price changes effectively normalizes stock buybacks. It’s a purer view of company value.
The next data set is quarterly sales along with their YoY changes. Revenues are one of the best indicators of businesses’ health. While profits can be manipulated quarter-to-quarter by playing with accounting estimates, sales are mostly set in stone. Ultimately sales growth is necessary for companies to expand, as earnings boosts driven by cost-cutting are inherently limited. Sales declines are bear-market harbingers.
Operating cash flows are also very important, showing how much capital companies’ businesses are actually generating. Unfortunately most of these elite big US stocks didn’t break out Q4’17 OCF, instead lumping it in with full-year financial statements. While that can still be calculated by subtracting the Q1 to Q3 OCFs from the annual one, that’s tedious and time-consuming. Not reporting full Q4 results disrespects investors.
Next are the real quarterly earnings that must be reported to the Securities and Exchange Commission under Generally Accepted Accounting Principles. Late in bull markets, companies tend to use fake pro-forma earnings to downplay GAAP results. These are derided as EBS earnings, Everything but the Bad Stuff! Companies arbitrarily ignore certain expenses to artificially inflate their profits, which is very misleading.
While we’re also collecting earnings-per-share data, it’s more important to consider total profits. Stock buybacks are executed to drive EPS higher, because the shares-outstanding denominator shrinks as shares are repurchased. Raw profits are a cleaner measure, normalizing out stock buybacks’ impacts. When the inevitable bear market arrives, companies will attempt to mask falling earnings by emphasizing EPS.
Finally the trailing-twelve-month price-to-earnings ratio is noted. TTM P/Es look at the last four reported quarters of actual GAAP results compared to prevailing stock prices. They are the gold-standard metric for valuations. Wall Street often intentionally obscures these hard P/Es by using forward P/Es instead, which are literally mere guesses about future profits! They have usually proven far too optimistic in the past.
As expected given last year’s spending-driving stock-market euphoria, the top SPY/SPX components’ Q4’17 results were generally quite impressive. Their sales grew strongly, but were still far-outpaced by their stock-price gains driving valuations sharply higher. Earnings were heavily distorted due to the impact of Republicans’ big corporate tax cuts passing that quarter, which was fascinating to analyze.
Not surprisingly the S&P 500’s top-constituent list was little changed in 2017. Most of these elite American companies only grew larger. Three stocks did claw their way into the top 34 since Q4’16, their symbols are highlighted in blue above. Boeing is a high-priced Dow 30 stock, which has skyrocketed on better business prospects driving the Dow higher. Its market cap soared an astounding 85% higher last year!
Any company with YoY market-cap gains over 19% beat the overall SPX last year, while any company below that lagged it. These top-34 US stocks saw average market-cap gains of 29%, well ahead of that average. One of the telltale characteristics of bull-market tops is gains concentrate in fewer and fewer stocks. The well-known shrinking-business problems of GE and IBM forced them just out of the top 34 last year.
With 500 stocks in the S&P 500, it’s still amazing and damning that 41.8% of this entire index’s market cap is concentrated in just 34 big US stocks! At the end of Q4’17, investors had $10.2t of wealth tied up in these elite companies. That extreme concentration is a double-edged sword, because bear markets often inflict downside damage on individual stocks in proportion to their upsides seen in the preceding bulls.
Ominously the universally-adored and -owned mega-cap tech stocks were dominating the SPX at the end of 2017. Apple, Alphabet, Microsoft, Amazon, and Facebook all had staggering market caps in excess of a half-trillion dollars each. These 1% of SPX stocks weighed in at a colossal 13.8% of index weight! Their average TTM P/E was 61.7x, more than double the 28x classical bubble threshold. That’s super risky!
One reason investors have been willing to pay such high premiums for the tech market darlings is their astounding sales growth. While the top-34 SPX companies together averaged still-impressive 11% sales growth from Q4’16 to Q4’17, the top 5 tech stocks trounced that at 28%! The rest of these top-34 SPY components reporting Q4 sales averaged about a quarter of that at 7.7%. So these tech stocks look invincible.
But such fast sales growth is unsustainable given their massive sizes, and likely to reverse with the stock markets. Everyone loves Apple’s products, but they are expensive. iPhones and iPads last years with no need to upgrade, and major upgrades are few and far between anyway with those technologies maturing. So the upgrade cycles Apple desperately needs to drive its massive sales are lengthening considerably.
As the stock markets’ wealth effect reverses to negative in the next bear market, odds are Americans will keep their iPhones longer before buying new ones. These are sizable expenses relative to median US household incomes. Amazon might be able to better weather a stock-market storm, depending on how much of the stuff Americans order from it is necessary versus discretionary. Its bear sales trends will be interesting.
Alphabet, Microsoft, and Facebook rely heavily on business spending. The coming huge tax cuts made 2017 a banner year for business confidence, leading to giant leaps in spending on online advertising as well as back-office data services. When the next recession comes accompanying the stock bear, much of that euphoric business spending will wither and reverse. So mega-cap-tech sales growth ahead isn’t so rosy.
I was very dismayed to find only 13 of these biggest-and-best American companies bothered reporting their Q4 operating cash flows to their investors. These companies have effectively infinite accounting resources, yet their Q4 breakouts from full-year results were terrible. Even the gold miners with their wildly-varying accounting and home countries did way better. So there’s not enough Q4 OCFs to bother analyzing.
Thankfully that won’t be the case in Q1s to Q3s, where every one of these elite stocks will dutifully report their quarterly operating cash flows. In the gold-mining space, sometimes companies choosing to obscure their OCFs want to hide poor performance. I don’t think that’s the case in these top SPX/SPY companies given their strong sales growth. But I’m shocked they don’t consider shareholders worthy of this key data.
The biggest surprises for me in this first foray into big US stocks’ quarterly results came on the earnings front. As expected given all the spending-inducing stock euphoria last year, overall profits of these top-34 SPY components grew to $112.2b in Q4. That made for average YoY gains of 137%, certainly sounding phenomenal. But that was just one quarter, not the entire year. So valuations didn’t decline on that.
The dominant reason the stock markets soared in 2017 was the coming massive corporate tax cuts. All year long there was great anticipation of them becoming law. The actual Tax Cuts and Jobs Act of 2017 bill was introduced in early November, passed the House in mid-November, passed the Senate in early December, and then was passed again in its reconciled version in both Congress chambers in mid-December.
Trump signed it into law and made it official on December 22nd, 2017. This whole process surrounding the actual bill began and ended in Q4. Its flagship provision was slashing the US corporate tax rate from 35% to 21%. This was a huge cut despite many offsetting business deductions and credits also being eliminated. It was probably the biggest change in US corporate taxation in history, a huge shift to adjust to.
For large publicly-traded companies, the SEC requires formal 10-K annual reports after fiscal year-ends to be filed by 60 days after quarter-ends. So American companies only had about 9 weeks to analyze the impact of the TCJA on their businesses before reporting Q4’17. Fully 33 of these top 34 companies in the SPX reported TCJA adjustments to their Q4’17 profits. Apple was the only company not breaking it out.
These adjustments’ profits impacts had an enormous range, from a colossal $29.1b boost to Berkshire Hathaway’s Q4 profits to a gargantuan $22.0b hit on Citigroup’s! So nearly all these Q4 GAAP profits are somewhat-to-heavily distorted by one-time impacts of those corporate tax cuts. Most of the really-big profits and really-big losses above are the result of these TCJA adjustments and not business operations.
In reading through all these 10-Ks and 10-Qs, there were generally two major tax-cut drivers impacting profits. The first was deferred tax assets and liabilities. These are very complicated, but basically US companies either overpaid or underpaid their taxes in individual years due to various accounting rules. The differences become DTAs or DTLs, which reduce or increase future years’ tax burdens for these companies.
But when the corporate tax rate was drastically slashed from 35% to 21%, all of a sudden both DTAs and DTLs were worth much less going forward. DTAs shielded less future profits at lower tax rates, while DTLs would have lower future tax payments. Different industries and businesses had wildly-different deferred taxes on their books. The second provision driving the adjustments was a one-time repatriation tax.
Because the US corporate tax rate had been so obnoxiously high relative to the rest of the world for so long, major companies played accounting games recognizing earnings in other countries. This stacked up to trillions of dollars held overseas. The TCJA imposed a one-time repatriation tax assuming that this cash was being sent back to the US whether that was true or not, which was a big cost for some companies.
So these Q4’17 profits numbers are very distorted by these one-time TCJA adjustments flushed through income statements. I gathered all these with the rest of the data, and expected a big overall impact on their collective profits. The absolute value of all of them together for these top-34 US stocks was a truly-staggering $209.2b in Q4’17! That dwarfed the actual reported GAAP profits running $112.2b that quarter.
Thus I watched the running total with great interest as I waded through the quarterlies. I expected to see corporate profits greatly overstated by the TCJA adjustments. But much to my surprise, the net of all of these positive and negative profits impacts was merely +$2.7b. That’s just 2.4% of the total earnings of these top-34 big US stocks, essentially a wash. Will the corporate tax cuts be less valuable than expected?
While the old statutory corporate rate was 35%, many companies are using schemes and loopholes to pay far less. Many of those were closed to get to 21%. If the positive impact of lower corporate taxes is smaller going forward than Wall Street joyously expects, it will have a big adverse psychological impact. If profits don’t balloon dramatically as forecast, valuations are going to get even more dangerously extreme.
While individual top SPX companies’ profits won’t be comparable with those big TCJA adjustments, they will be collectively with the overall flat impact. If the $112.2b of Q4’17 GAAP profits earned by these top 34 US companies is annualized, it implies $448.9b of earnings on a $10.2t collective market cap. That equates to a 22.7x overall P/E for these big US stocks at the end of one of the best corporate-profits years ever.
That’s not in bubble territory, but still very expensive after such a big and long bull. But not aggregated these top stocks look way more overvalued. Their average TTM P/Es, which didn’t yet include Q4’17 earnings at the end of December, ran way up at 30.6x. That’s still above that 28x bubble threshold. But Amazon is an insane outlier at 190.2x earnings. Ex-Amazon, that top-SPY-stocks average drops to 25.8x.
That’s still frighteningly high. The whole purpose of bear markets following long bull markets is to drag stock prices down and sideways long enough for earnings to catch up with lofty stock prices. Bears don’t end until overall stock-market P/E ratios collapse back down to 7x to 10x earnings! That implies the US stock markets face getting at least cut in half, which is typical in major bear markets. That’s serious downside.
Ominously most of this past year’s incredible stock-price appreciation in these elite companies wasn’t driven by earnings growth. The average jump in their market capitalizations from the end of Q4’16 to the end of Q4’17 was 29%. In this same span their TTM P/E ratios climbed an average of 25%. Thus these top SPY companies’ earnings barely grew during all of last year despite all the record-high-stocks euphoria!
The hard data proves that’s true. In Q4’16, these same 34 big US stocks collectively earned $110.4b. That only rose 1.7% YoY to $112.2b in Q4’17. Yet their total market caps still blasted 26.9% higher! This proves one of the greatest stock-market years on record didn’t drive any meaningful earnings growth in Q4, which tends to be the best quarter of the year on holiday spending. Fundamentals didn’t improve.
Last year’s extreme stock-market melt-up to dazzling new all-time highs was purely a sentiment thing, not at all fueled by GAAP earnings growth. 2017’s big gains were built on sand. Psychology is a fleeting capricious thing that will absolutely mean revert back to neutral and overshoot to bearish. And when that happens, the profits won’t be there to keep these elite market-darling stocks from getting mauled by the bear.
Despite the recent mild correction, these stock markets remain exceedingly overvalued and dangerous. The big US stocks’ Q4’17 fundamentals prove corporate earnings remain far too low to justify such high stock prices. That’s terrifying in 2018 where the Fed and ECB will collectively remove $950b of liquidity compared to last year! Regardless of valuations, this alone would plunge these stock markets into a new bear.
Investors really need to lighten up on their stock-heavy portfolios, or put stop losses in place, to protect themselves from the coming central-bank-tightening-triggered valuation mean reversion in the form of a major new stock bear. Cash is king in bear markets, as its buying power grows. Investors who hold cash during a 50% bear market can double their stock holdings at the bottom by buying back their stocks at half-price!
SPY put options can also be used to hedge downside risks. They are still relatively cheap now with complacency rampant, but their prices will surge quickly when stocks start selling off materially again. Even better than cash and SPY puts is gold, the anti-stock trade. Gold is a rare asset that tends to move counter to stock markets, leading to soaring investment demand for portfolio diversification when stocks fall.
Gold surged nearly 30% higher in the first half of 2016 in a new bull run that was initially sparked by the last major correction in stock markets early that year. If the stock markets indeed roll over into a new bear in 2018, gold’s coming gains should be much greater. And they will be dwarfed by those of the best gold miners’ stocks, whose profits leverage gold’s gains. Gold stocks skyrocketed 182% higher in 2016’s first half!
Absolutely essential in bear markets is cultivating excellent contrarian intelligence sources. That’s our specialty at Zeal. After decades studying the markets and trading, we really walk the contrarian walk. We buy low when few others will, so we can later sell high when few others can. While Wall Street will deny the coming stock-market bear all the way down, we will help you both understand it and prosper during it.
We’ve long published acclaimed weekly and monthly newsletters for speculators and investors. They draw on my vast experience, knowledge, wisdom, and ongoing research to explain what’s going on in the markets, why, and how to trade them with specific stocks. As of the end of Q4, all 983 stock trades recommended in real-time to our newsletter subscribers since 2001 averaged stellar annualized realized gains of +20.2%! For only $12 per issue, you can learn to think, trade, and thrive like contrarians. Subscribe today!
The bottom line is the big US stocks’ latest quarterly results are concerning. Despite a perfect year for the stock markets, and boundless optimism fueled by hopes for big tax cuts soon, corporate profits were largely flat in Q4. If the biggest and best American companies can’t grow earnings substantially even in that ideal environment, how will they fare when these stock markets inevitably roll over into a long-overdue bear?
And the initial massive-corporate-tax-cut impact on corporate profits was effectively a wash. What if the slashed corporate tax rate doesn’t yield the expected earnings windfall in 2018? This risk coupled with slowing sales as stock markets weaken is incredibly bearish. Especially with the biggest and best US stocks everyone loves and owns still trading near or above bubble valuations as central banks greatly tighten.
Applying modern mineral exploration and mining methods in historic mining districts has been a recipe for success for many mining companies. Vast volumes of material which could never have been found, accessed or economically mined with small scale mining operations are now mined as high-grade ore throughout the country. This is the plan that one Canadian junior gold explorer is hoping to capitalize on in Mexico.
Mexican Gold Corp. (TSX-V: MEX) controls the entire core of the once-famous Las Minas historic mining district. The Las Minas project presently has two gold-copper deposits in advanced-stage exploration, and multiple high-quality, exploration targets. The project area features complete infrastructure, a highly prospective package of regional geology to allow for years of expansion opportunities. The project is fully permitted for drilling and up to date for federal and state environmental requirements.
On August 1, 2017, Mexican Gold Corp. tabled an initial Mineral Resource Estimate for the El Dorado/Juan Bran and Santa Cruz zones, two of the eight known mineralized zones at the Las Minas property. The total Inferred Resource is 719,000 gold equivalent ounces contained within 10,304,000 tonnes grading 2.17 g/t Au Eq. The total Measured and Indicated Resource is 304,000 Au Eq ozs contained within 4,970,000 tonnes grading 1.90 g/t Au Eq. The resource is largely pit constrained, with 13,868,000 tonnes contained within a pit shell. The weighted average grade of the open pit resource is 2.00 g/t Au Eq. The underground total measured and indicated resource is 1,183,000 tonnes grading 3.00 g/t Au Eq.
The company has been drilling to extend and expand the resource at other Las Minas zones with a 3,000-metre drill program that just completed which will go a long way of increasing the amount of known mineralization.
Highlights from the 2017 and 2018 drilling campaign include:
Hole 40 cut a cumulative 94.35 meters of high-grade mineralization over three zones. The main zone graded 9.24 g/t Au Eq over 38.0 metres contained within 54.0 metres grading 6.91 g/t Au Eq.
Hole 49 in the Eldorado zone intersected 38.0 metres grading 10.19 g/t Au Eq (4.51 g/t Au, 16.17 g/t Ag, 3.33 % Cu) contained within 46.0 metres grading 8.81 g/t Au Eq (3.87 g/t Au, 13.81 g/t Ag, 2.90 % Cu)
These results have created some strong market activity and has pushed the shares in Mexican Gold from its year low of 19.5 cents to a year high of 44 cents. These results demonstrate that there is more than in the ground and the potential to significantly improve the size and confidence of the resource. The Neuvo Pueblo zone will be the new target for drilling once the ground work is complete.
MiningFeeds.com had a chance to sit down with CEO Of Mexican Gold, Brian Robertson, B. Sc. P.Eng, to discuss the company’s plan going forward and his thoughts on the markets and gold.
MiningFeeds “MF”: How do you come into Las Minas?
Brian Robertson “BR”: It is an interesting story. I was working on a silver property that I had under option in Zacatecas and while talking to the owner he introduced me to the Las Minas property. I read the geological report on Las Minas he provided and was very impressed. When I did a site visit, the extent of the skarn mineralization, favourable geology, and large number of historical small scale high-grade mines in the area really impressed me. I immediately made the arrangements to option the property as well as the adjoining Neuvo Pueblo property.
MF: What is the work that has been done to date?
BR: We have drilled approximately 26,000 metres to date, including 16,764 metres of resource drilling at the El Dorado/ Juan Bran zone for the initial resource estimate. We have just completed 6,000 metres of drilling to expand the resource. We have also done some exploration drilling on numerous zones. None of the additional drilling is included in the resource estimate.
It is not a lot of metres for a one million ounce deposit, but it is close to surface and consistent in the mineralization. With a small number of metres you can drill off a significant resource, which was done.
MF: What are some unique characteristics of mining in Veracruz?
BR: This part of Mexico is underexplored but it is showing great potential, which is starting to be recognized because of the work we are doing at Las Minas.
We have very good relations with the people at the small nearby village of Las Minas. We operate with the underlying principle that we are a guest in their community. We employ a number of people from Las Minas, and our Mexico office is in the village, which creates a lot of daily contact. We also employ a number of people from Las Minas, and have worked with our drilling contractor to train local people as diamond drillers. We make donations to the schools, sports organizations and the community. We work very hard and building and maintaining good community relations.
The Las Minas area is very safe. We have not had any safety related issues working there over the last eight years. In fact, contract diamond drillers working at Las Minas regard it as one of the safest areas in Mexico or Latin America. The surface land rights are largely privately owned, and we own the surface rights for the Santa Cruz deposit. This simplifies the land ownership and surface access arrangements.
Las Minas is a historical mining town, so the people living there view mining positively and see it as an opportunity for employment and bring prosperity to the community.
MF: What are the upcoming plans?
BR: The plan going forward is to expand the resource and carry out field exploration of other under explores areas. The results will go towards an updated resource. There is considerable potential with resource expansion as our grades are well above the average of other open pit mines in Mexico, which are typically around 1 grams per tonne or less . We are coming in around 2 grams, which is a very high grade for an open pit mine .
MF: What do you think Gold needs to get going?
BR: Smart money is quietly coming into the gold sector but the retail investor is still hesitant about investing. What is required to bring investor interest back into the gold sector is another strong upward push of the gold price . We need to see a significant devaluation in the US dollar in order to get gold equities going again.
________________
MiningFeeds would like to thank Brian Robertson for his time and insights into Mexican Gold (TSX-V: MEX).
Mexican Gold trades under the symbol MEX on the TSX Venture. The company has ~38 million shares outstanding and at time of publication shares in the company trade at 31.5 cents. Institutional Investor Palisade Global Investments w/ ~$40 M AUM increased their position to 18.79% The company just recently closed a financing of ~$1 million dollars and is well financed to do further exploration and follow up on the strong results it has already produced in 2018; there will be more.
As Russian/British foreign relations continue to plummet, here at Mining Feeds we feel it’s high time to pursue our monitoring of the continuing internal machinations at our favourite London-listed Russian gold miner, Petropavlovsk (LSE: POG)[1].
Within the past couple of months, the attempted murder of a former Russian spy in a sleepy British town[2], coupled with Britain’s vocal condemnation of Russia’s annexation of Crimea and intervention in Ukraine and Syria[3], along with Britain’s support of the US sanctions against prominent Russians, have plunged London-Moscow relations to an all-time low.
But while diplomatic relations freeze over, shenanigans at Petropavlovsk are heating up.
The dormant current board – who ousted POG co-founders Peter Hambro and Pavel Maslovskiy in a much publicized coup last June, the twists and turns of which were followed here at Mining Feeds[4] – continue to fail on delivering on their transparency pledge[5].
Shareholders will be particularly delighted by the serendipitous exit by Viktor Vekselberg in December of his 22% stake, as the Russian and his Renova Group got shamed this month by stringent US sanctions. Never has a Kazakh been more welcome in London as businessman Kenes Rakishev with his investment in the gold miner.
One of a new breed of Kazakh investor, Rakishev has in many ways been POG’s knight in shining armour, buying up Vekselberg’s old stake. Still little known in the UK, in his home country Rakishev is a recognised and respected entrepreneur, still best known for his investment in Kazakhstan’s Kazkommertsbank and co-ownership of Kazakhstan-focused base metals producer Central Asia Metals Plc (AIM:CAML).
He has a strong history in natural resources in Kazakhstan and, according to the few interviews he has done so far, Petropavlovsk is his first premium listing in London on which he intends to focus a great deal of time going forward. Well, that sure is reassuring after the company’s sorry experience with the still-bewildering “Renova board shake-up then cut-and-run” chapter.
Central Asia Metals is a copper, zinc and lead production and exploration company, with operations in Kazakhstan and Macedonia. Under the direction of Rakishev, its valuation has grown from $100 million to $800 million. Now that’s got to be a track record to thrill any corporate board. So, it is pretty puzzling that POG’s chief appear not to be drawing on their new Kazakh investor’s counsel.
Rakishev has been open about his desire to give Petropavlovsk a fresh start and to bring the sluggish company to a position of growth with a robust M&A strategy to acquire undervalued gold assets across Russia and Central Asia[6], and to bring back the erstwhile Pavel Maslovskiy as CEO, for him to complete his pressure oxidation processing plant at the company’s Malomir mine[7].
Talk to anyone in-country and they will tell you that POG continues to boast an excellent operations team and, along with its underground mining and POX Hub implementation, has the potential to be performing much better than current results suggest.
Worryingly, the board has stayed quiet on its reception of Rakishev’s vision, while offering no vision of its own. Instead, after no action for nine months to strength the company’s leadership team, they’ve announced the appointment of a different CEO with arguably little mining experience: Roman Deniskin, who is due to take the reins next week.
Will shareholders have to wait until the next AGM in June to hear a proper strategy from the board? Or will the new CEO be the breath of fresh air that is so needed? So far, the silence is deafening.
Exploration is at the heart of mining. Nobody can build a mining company without exploration. The greatest mining companies in Africa today invested in top geologists and exploration projects many years ago. The geologists’ brief was simple: hunt down and find the next best deposit. These geologists had flair, a spirit of adventure and a great appetite for taking risks, as had the companies that employed them. Mark Bristow, CEO of Randgold, perhaps epitomises this pioneering spirit best of all. Through continuously investing in exploration, Bristow has been able to find exceptional ore bodies which enabled him to develop extremely profitable mining operations in regions of Africa most were hesitant to enter at the time that he did. Bristow was lightyears ahead of his compatriots. He realised that Africa not only presents huge opportunities, but that exploration is the bedrock on which the African mining industry will be built.
With commodity prices on an upward curve, and a business friendly philosophy taking root in Africa, now is the time to get the hands and boots dirty. Countries like Sierra Leone, Liberia, Zimbabwe, South Africa, Angola and Senegal presents prodigious opportunities for geologists and exploration entrepreneurs. The recent Zimbabwean, Nigerian and Angolan offensives to lure investors has paid off, and more and more junior exploration companies are enquiring about opportunities in these countries. Towards the end of last year (before the regime change), the Zimbabwean government had only awarded three new exploration licenses. Today, a mere five moths later, more than 100 permits have been issued. New Zimbabwean Minster of Mines Winston Chitando, recently assured a room full of investors and exploration companies at the inaugural Harare Indaba in Johannesburg, which I attended, that they would be welcomed back into the country with open arms. More alluring though is Angola, which hosts prolific copper, iron ore, gold and diamond deposits.
Up until now Angola has been a bit of an enigma in terms of mining. But the countries’ new Minister of Mineral Resources and Petroleum, Dr. Diamantino Pedro Azevedo (a mining engineer) presented some enticing information acquired through solid geological surveys at a recent presentation, to which I was invited. What’s more, the Angolan government is now pursuing private investors, in a bid to broaden its mining base.
Barely a month after Azevedo promised that there are great opportunities for exploration, a few Canadian juniors announced that they are wetting their toes in Angolan waters. Moreover, the Nigerian drive to diversify has tempted several explorers to take on that massive unchartered territory. The big constraint though, especially for African exploration companies, remains financing. At the moment their only option is to raise money on the London, Canadian or Australian Stock Exchanges. For now, it seems that African investors just don’t want to walk that extra mile to fund high-risk exploration projects on their own continent, and it’s a shame. Until they do that, it is highly unlikely that we will see homegrown African mining companies dominating the African mining scene.
About Leon Louw:
Leon specializes in African affairs and doing business in Africa, and has been writing about mining in Africa for 8 years. He was born in Johannesburg, South Africa, and has traveled Africa extensively, especially southern Africa. He has a BA degree with a specialization in African studies and an honours degree in Africa Politics. He also have a national diploma in Nature Conservation and an honours degree in Environmental Management. It is is passion to promote business in Africa and I can assist companies that are interested in doing business in African countries.
The main drivers of global stock, bond, and gold markets are interest rates and demographics. Unfortunately, most investors focus on items that get a lot of media attention but are almost irrelevant to price discovery in the markets.
Please click here now. I’ve predicted that there will be no trade war, but governments around the world will roll out a modest amount of mildly inflationary tariff taxes.
Clearly, top economists at both Fitch and Goldman have the same outlook that I do.Moderate tariffs are getting a lot of flashy media coverage, but what really matters to the major markets is Fed policy, US citizen demographics, and Chindian citizen demographics.
Some tax cuts have now been passed in America. Yellen and most democrats call them “ill-timed stimulus”. Most republicans appear to believe the tax cuts are well-timed stimulus that combined with deregulation could create tremendous GDP growth, using ridiculous demographics to do it. Throughout world history, this type of thinking has been typical in the late stages of ruling empires.
Libertarians believe there is no bad time to do a tax cut because tax cuts are about the restoration of citizen freedom and morality rather than economic stimulus. They believe these tax cuts must be accelerated until the income and capital gains taxes are eliminated regardless of the consequences for the debt-obsessed government.
The libertarians believe the US government resembles a mafia extortionist operation more than a government. Are they correct?
Well, probably. I don’t think most republicans or democrats really want to face the reality of what governments around the world have become, and nor do the governments themselves.
Regardless, with the Fed engaging in significant QT and a rate hiking cycle, the ability of the US government to finance itself is about to come under stress that is unprecedented in America’s history. Sanctions and tariffs are irrelevant to this stress. QT, rate hikes, and demographics are of epic relevance.
Please click here now. Double-click to enlarge. I don’t think it’s wise to try to pick an exact top in the US bull market for stocks, but it’s very wise to understand that QT and rate hikes are creating the “beginning of the end” for this market.
In 1980 the Fed began a 35-year rate cutting cycle with the baby boomers entering their prime working and investing years. Tax cuts from Reagan increased the government debt, but the demographics of the baby boomers and the Fed’s massive rate cuts made the government’s debt problem a minor issue.
Today, the Fed is engaging in a tightening cycle and the baby boomers are pensioners. The millennials don’t trust banks or government. Elderly savers are destroyed and generally soaked in debt. Tax cuts are morally correct, but they are turning the US government’s debt problem into an epic nightmare. Trump has more cuts planned, and rightly so. These cuts are going to ramp up the government’s debt nightmare, and from a libertarian gold enthusiast’s “end the extortionist insanity” perspective, that’s fantastic.
The bottom line: More stimulus is coming from the US government, and more tightening is coming from the Fed. This is what is known as “gold market nirvana”. Trump will soon announce infrastructure spending stimulus, and do so as Powell announces more rate hikes and accelerated QT. This will crush the bond market and unleash the inflation genie from her bottle.
Western stock and bond markets are going to enter a period of massive volatility and then collapse. Gold is going to continue to rise steadily and then go ballistic as that happens.
Millions of Chinese gold market gamblers that bought physical bullion at $1450 – $1320 in 2013 are being “made whole” as gold moves steadily higher now. The world’s largest gold gambler class is poised to begin a new phase of aggressive buying once gold trades at $1450.
India’s “Gold Board” will soon be launched, which will likely have the power to decide the import duty. In Dubai, talks are underway between gold jewellers and the government to streamline the VAT.
On the supply front, mine supply is poised to decline overall and in most countries except Canada and Russia. I’ve described the emergence of a “gold bull era” based on events in both the West and the East, and any gold market investor reading even a portion of what I’ve written here today can only come to the same conclusion.
Please click here now. Double-click to enlarge this key daily gold chart. Gold is poised in what I call a “golden coil” formation, and there’s a miniature bull wedge in play as well. It’s unknown whether gold drifts down one more time within the coil or just blasts above $1370 now. What is known is that the upside blast is coming. Fed tightening, Chindian buying, and US government stimulus are going to make it happen.
Please click here now. Double-click to enlarge this T-bond chart. The next big theme that US institutional money managers are going to face is the end of the bull market in bonds.
For 35 years, investors’ stock market meltdowns have been buffered by bond market rallies. In early 2018, that changed. The bond market barely rallied on stock market crash days, and fell on some of them. It has not reached the panic stage for money managers, but they are getting concerned.
Not since Paul Volker ruled the Fed has a Fed chair been as forceful about tightening as Powell. Last week, with the Dow down 700 points, he gave a speech to the media stating that more rate hikes were coming. A lot of money managers think he is bluffing. They don’t believe he will hike relentlessly or keep ramping up QT if the stock market falls.
These money managers are greatly mistaken, and as more rate hikes, QT, and fiscal stimulus turn their supposed safe haven of T-bonds into flaming rice paper, they will turn to gold. It’s already starting. GLD-NYSE has seen tonnage rise to 859 tons during the latest stock market gyrations. The bond bull market is dead, and fiscal stimulus and Fed tightening are going to pressure the dollar as well as the stock and bond markets, leaving gold as the only safe haven for investors.
Please click here now. One of my largest gold stock holdings is of course Chow Tai Fook, China’s biggest gold jewellery retailer. I cover the action at my www.gracelandjuniors.com website. This chart tells the story of Chindian demand for gold. Chinese gamblers don’t gamble much on paper gold markets. They buy gold bullion and jewellery to get in on the upside price action.
This stock is a key leading indicator for Western gold miners. On that note, please click here now. Double-click to enlarge this interesting GDX chart. I’ve coined the term “Safehavenization of Gold Stocks” to describe the rise of institutional money manager interest in gold stocks as an actual safe haven from the coming implosion of US government, debt, and stock markets.
The volume pattern is positive for GDX and most gold stocks, but what’s most interesting is that a price rally of just a few dollars a share represents almost a ten percent gain. For institutional money managers facing the hurricane winds created by fiscal stimulus and Fed tightening in stock and bond markets, gold stocks are becoming an ever-more enticing opportunity for both shelter and gain. Gold investors around the world should be totally comfortable buying various gold stocks on all two and three-day pullbacks. Sell a portion of what is bought on rallies, and hold the rest to enjoy the biggest rewards offered in the glory of the gold bull era!
Stewart Thomson is a retired Merrill Lynch broker. Stewart writes the Graceland Updates daily between 4am-7am. They are sent out around 8am-9am. The newsletter is attractively priced and the format is a unique numbered point form. Giving clarity of each point and saving valuable reading time.
Risks, Disclaimers, Legal
Stewart Thomson is no longer an investment advisor. The information provided by Stewart and Graceland Updates is for general information purposes only. Before taking any action on any investment, it is imperative that you consult with multiple properly licensed, experienced and qualified investment advisors and get numerous opinions before taking any action. Your minimum risk on any investment in the world is: 100% loss of all your money. You may be taking or preparing to take leveraged positions in investments and not know it, exposing yourself to unlimited risks. This is highly concerning if you are an investor in any derivatives products. There is an approx $700 trillion OTC Derivatives Iceberg with a tiny portion written off officially. The bottom line:
Are You Prepared?
Last week index score: 45.10 (updated)
This week: 33.86
NuLegacy Gold (TSX-V: NUG) appointed John Budreski to its board.
The Oreninc Index fell in the week ending April 6th, 2018 to 33.86 from an updated 45.10 a week ago as the lack of brokered action outweighed the increase in dollars announced.
Market volatility continues with the stock markets and metals commodities alternately getting dinged and recovering as US president Donald Trump and China stand off over trade, or more specifically, their bilateral trade balance.
China responded to Trump’s previous discourse about implementing tariffs on some US$50 billion of trade on the grounds that China steals US intellectual property with its own tariffs on $50 billion worth of US goods in a move that sees it ready to wage a trade war “to the end.” Not to be outdone, Trump responded at the end of the week with the threat of another US$100 billion of tariffs against Chinese products. Given the trade imbalance between the two nations – China exported US$505 billion to the US in 2017 and imported just US$130 billion – it has fewer exports with tariffs than Trump. However, beyond physical products China could look at trade in services such as tourism and education or make life difficult for US companies operating in its territory such as Apple and Starbucks. Then again, China is the biggest foreign holder of US Treasury debt, owning about US$1.17 trillion and it could cut the amount of US debt it buys.
So, in another choppy week, gold actually ended on a positive note after a weaker-than-expected US employment report for March from the Labor Department showed the key non-farm payrolls number up 103,000, which was a big miss to the downside.
On to the money: total fund raises announced increased to C$120.7 million, a five-week high, but which included no brokered financings and no bought-deal financings. The average offer size nearly doubled to C$7.1 million, a 64-week high.
Another volatile week for gold during saw the yellow metal close up at US$1,32/oz from US$1,325/oz a week ago despite hitting a mid-week high of US$1,341/oz. Gold is now up 2.32% this year. Meanwhile, the US dollar index closed up at 90.20 from 89.97 a week ago. The van Eck managed GDXJ closed up at US$32.39 from US$32.15 last week. The index is down 5.10% so far in 2018. The US Global Go Gold ETF closed down at US$12.51 from US$12.71 a week ago. It is down 3.84% so far in 2018. The HUI Arca Gold BUGS Index closed up at 177.59 from 175.41 last week. The SPDR GLD ETF saw buying return to close up at 859.99 tonnes from 846.12 tonnes a week ago.
In other commodities, the silver slightly up at US$16.40/oz from US$16.36/oz a week ago. Copper showed a slight increase to close at US$3.04/lb from US$3.02/lb last week. Oil put in another losing week and closed down at US$62.17 a barrel from US$64.94 a barrel a week ago.
The Dow Jones Industrial Average closed down at 23,932 from 24,103 last week. Likewise, Canada’s S&P/TSX Composite Index fell to 15,207 from 15,367 the previous week. The S&P/TSX Venture Composite Index closed down at 769.15 from 796.67 last week.
Summary:
Number of financings dropped to 17, a four-week low.
No brokered financings were announced this week, a 13-week low.
No bought-deal financings were announced this week, a two-week low.
Total dollars increased to C$120.7m, a five-week high.
Average offer size nearly doubled to C$7.1m, a 64-week high
Financing Highlights
Nemaska Lithium (TSX: NMX) entered into an investment agreement with SoftBank Group for a C$99.1 million private placement @ C$1.12.
SoftBank to acquire up to 9.9% of Nemaska.
Nemaska needs to raise US$775-825 million to fund the construction and commissioning of its Whabouchi mine and Shawinigan lithium plant.
As long as SoftBank holds at least 5% of Nemaska’s shares, it has a right of first offer to purchase up to 20% of the lithium hydroxide and lithium carbonate produced at Shawinigan from spodumene concentrate from Whabouchi at pre-agreed discounts applicable to a pre-determined market price-based formula.
SoftBank can also nominate a director.
Major Financing Openings:
Nemaska Lithium (TSX-V: NMX) opened a C$99.08 million offering on a best efforts basis.
Euromax Resources (TSX-V: EOX) opened a C$5.22 million offering on a best efforts basis. Each unit includes a warrant that expires in two years.
Loncor Resources (TSX-V: LN) opened a C$2.6 million offering on a strategic deal basis.
Commander Resources (TSX-V: CMD) opened a C$2.5 million offering on a best efforts basis. Each unit includes a warrant that expires in two years.
Major Financing Closings:
Asanko Gold (TSX: AKG) closed a C$22.47 million offering on a strategic deal basis.
Kennady Diamonds (TSX-V: KDI) closed a C$10 million offering on a strategic deal basis.
Tinka Resources (TSX-V: TK) closed an C$8.06 million offering underwritten by a syndicate led by GMP Securities on a bought deal basis. Each unit included half a warrant that expires in a year.
Company News
NuLegacy Gold (TSX-V: NUG) appointed John Budreski to its board. Budreski, MBA/BEng has over 35 years of capital markets and executive management experience and is the CEO of Morien Resources.
About Oreinc.com:
Oreninc.com is North America’s leading provider of relevant financing information in the junior commodities space. Since 2011, the company has been keeping track of financings in the junior mining as well as oil and gas space. Logging all relevant deal and company information into its proprietary database, called the Oreninc Deal Log, Oreninc quickly became the go-to website in the mining financing space for investors, analysts, fund managers and company executives alike.
The Oreninc Deal Log keeps track of over 1,400 companies, bringing transparency to an otherwise impenetrable jungle of information. The goal is to increase the visibility of transactions and to show financings activity in a digestible format. Through its daily logging activities, Oreninc is in a position to pinpoint momentum changes in the markets, identify which commodities are trending and which projects are currently receiving funding.
Silver has been dead money over the past year or so, relentlessly grinding sideways to lower. That weak price action has naturally left this classic alternative investment deeply out of favor. Silver is extremely undervalued relative to gold, while speculators’ silver-futures positions are extraordinarily bearish. All this has created the perfect breeding ground to birth a major new silver bull market, which could erupt anytime.
Silver’s price behavior is unusual, making it a challenging investment psychologically. Most of the time silver is maddeningly boring, drifting listlessly for months or sometimes years on end. So the vast majority of investors abandon it and move on, which is exactly what’s happened since late 2016. There’s so little interest in silver these days that even traditional primary silver miners are actively diversifying into gold!
But just when silver is universally left for dead, one of its massive uplegs or bull markets suddenly ignites. Some catalyst, typically a major gold rally, convinces investors to return to silver. Their big capital inflows easily overwhelm the tiny global silver market, catapulting this metal sharply higher. Silver skyrockets to amazing wealth-multiplying gains, dwarfing nearly everything else. This reinvigorates silver’s cult-like following.
Silver’s dominant primary driver has long been gold, which controls all precious-metals sentiment. When gold isn’t doing anything exciting, silver languishes neglected. But once gold rallies high enough for long enough to convince investors a major upleg is underway, capital starts returning to silver. Thus silver is effectively a leveraged play on gold, amplifying its price action. Silver never soars unless gold is strong.
This psychological relationship is so ironclad it may as well be fundamental. The global silver and gold supply-and-demand profiles are technically independent, with little direct linkage physically. But when investment demand flares to drive gold higher, parallel silver investment demand soon materializes. So silver and gold often move in lockstep, especially when gold’s price action is interesting enough to catch attention.
All this makes the Silver/Gold Ratio the most-important fundamental measure for silver prices. The lower silver prices happen to be compared to prevailing gold ones, the greater the odds a major silver mean-reversion rally is imminent. And today silver is almost as low relative to gold as it’s ever been in the past century! This first chart looks at the SGR, or more precisely the inverted GSR, over the past 13 years or so.
The SGR calculation results in tiny hard-to-parse decimals, like this week’s 0.012x. So I prefer to use the gold/silver ratio instead, which yielded a cleaner 81.9x as of this Wednesday. Charting this GSR with its axis scaled upside down produces the same SGR line, but with far-more-brain-friendly numbers. This shows that silver is extremely undervalued relative to gold today, which is super-bullish for this neglected asset.
Again this week the SGR was running at just 81.9x, meaning it took almost 82 ounces of silver to equal the value of a single ounce of gold. So far in 2018, the SGR has averaged 79.6x. As you can see in this chart, that’s extremely low. There have only been two other times in modern history where silver looked worse relative to gold, late 2008’s first-in-a-century stock panic and early 2016’s secular-bear-market lows.
Because of silver’s tiny market size, it’s an incredibly-speculative asset. When investment capital flows really shift, silver can soar or plunge with shocking violence. Silver’s speculative nature makes it far more susceptible to general market psychology than gold. Silver acts like a small fishing boat battered around in the choppy waves of sentiment, while gold is more like a supertanker punching through them.
That 2008 stock panic was the first since 1907, one of the most-extreme fear events of our lifetimes. Technically a stock panic is a 20%+ plummet in the major stock-market indexes in less than two weeks. The flagship S&P 500 stock index indeed collapsed 25.9% in exactly two weeks in early October 2008, which terrified everyone. If felt like the world was ending, so investors and speculators sold everything to flee to cash.
Gold weathered that storm well, only sliding 3.3% in that wild stock-panic span. But the overpowering fear scared traders into hammering silver 23.7% lower. On exceptional stock-market down days, silver tends to split the difference between the S&P 500 and gold. We’ve seen that recently as well, during this new stock-market correction since early February. Silver is particularly sensitive to prevailing herd sentiment.
Between September and December 2008 straddling that stock panic, the SGR averaged just 75.8x. Silver was radically undervalued relative to gold, an anomalous state that has never been sustainable for long. The resulting mean reversion and overshoot higher was enormous, yielding stupendous gains for silver investors. Silver ultimately bottomed at $8.92 per ounce in late-November 2008, at a super-low 83.5x SGR.
Over the next 12.4 months silver rocketed 115.4% higher out of those extreme stock-panic lows, which restored the SGR to 63.2x. But that was still low. In the years leading into that stock panic, the SGR averaged 54.9x. For decades a mid-50s SGR has been normal, with silver generally oscillating around those levels compared to gold. Miners had long used 55x as a proxy for calculating silver-equivalent ounces.
Once silver falls to extreme lows relative to its primary driver gold, the inevitable resulting mean reversion rarely stops near the average. Instead it tends to overshoot proportionally to the upside, fueling massive gains. Silver started returning to favor in late 2010 and early 2011 as gold powered to major new highs. That ultimately climaxed with silver enjoying popular-mania-like popularity in late April 2011, at $48.43 per ounce.
That made for a total bull market out of those extreme stock-panic lows of 442.9% over 2.4 years! At its peak, the SGR had soared to 31.7x. Silver can’t sustain anomalously-high prices relative to gold either, so that bull soon rolled over as I warned the month before that peak. The key takeaway today is silver’s extreme stock-panic lows birthed a major new bull market. Silver can’t stay crazy-low relative to gold for long.
Unbelievably silver in 2018 is even more extremely undervalued than during those 4 months surrounding that stock panic! Again the SGR is averaging just 79.6x year-to-date. That’s considerably worse than during the stock panic which saw 75.8x over a similar time span. Such incredibly-low silver prices are no more sustainable now than they were then. That’s why a major new silver bull is likely coming very soon.
Interestingly the SGR popped right back up to its traditional mid-50s average after 2008’s stock panic as well. Between 2009 and 2012, the SGR averaged 56.9x. Those were the last quasi-normal years for the markets before the Fed’s unprecedented open-ended third quantitative-easing campaign started to wildly distort everything in 2013. Everything since then is literally a central-bank-conjured illusion that will shatter.
If silver merely mean reverts out of today’s worse-than-stock-panic extreme lows, regaining a 55x SGR would catapult it near $24.25 at this week’s $1333 gold levels. That’s almost 50% higher than today’s deep lows! From this week’s wild 81.9x SGR low, a proportional overshoot back up to a 28.1x SGR would blast silver back near $47.50. That’s 191% higher from here, nearly a triple, making for big gains.
All it will take to get silver mean reverting is a convincing gold upleg. Investors will return to silver once gold rallies high enough for long enough for them to believe its climb is sustainable. Then silver will take off and amplify gold’s gains. Gold powered 106.2% higher during that post-stock-panic silver bull where it soared 442.9%, making for 4.2x leverage. Gold also fueled silver’s last reversion rally out of extreme lows.
From 2013 to 2015, the stock markets surged relentlessly as the Fed’s vast QE money creation directly levitated them. Gold is an alternative investment thriving when stock markets weaken, so it was largely abandoned in those weird years. Gold ultimately slumped to a 6.1-year secular low in December 2015 leading into the Fed’s first rate hike of this cycle. That pummeled silver to its own parallel 6.4-year secular low.
In late 2015 silver felt a lot like it does today. No one wanted anything to do with it, everyone believed it was dead. Investors and speculators alike wouldn’t touch silver with a ten-foot pole near those lows, convinced it was doomed to spiral lower indefinitely. Yet out of that very despair a new silver bull was born. Over the next 7.6 months into August 2016, silver powered 50.2% higher on gold’s new 28.2% upleg.
Unfortunately that new mean-reversion silver bull ended prematurely as gold’s own young bull suffered a temporary truncation. The extreme stock-market rally erupting after Trump’s surprise election victory on euphoric hopes for big tax cuts soon sapped the wind from gold’s sails. So it dragged silver lower during much of the time since. But the new stock-market correction proves that stocks-strong-gold-weak trend is ending.
That’s super-bullish for silver, especially with it trading at stock-panic-like extreme lows compared to where gold is today. As these wildly-overvalued stock markets continue sliding lower on balance, gold will return to favor. The resulting capital inflows driving it higher will get investors and speculators alike interested in silver again. And just like after past extreme lows, their buying will catapult silver sharply higher.
Today’s extreme undervaluation in silver relative to gold is reason enough to expect a major new silver bull to ignite soon and start powering higher. But silver’s bullish outlook gets even better. The silver-futures situation today is nearly as extreme, with speculators making exceedingly-bearish bets on silver. These will have to be reversed as gold rallies, unleashing massive silver buying that will quickly drive it higher.
Short-term silver-price action is dominated by speculators’ silver-futures trading. The extreme leverage inherent in silver futures lets these guys punch way above their weight in terms of silver-price impact. Each silver-futures contract controls 5000 troy ounces of silver, worth $81,400 even at this week’s very-depressed prices. Yet the maintenance margin required to hold a contract was only $3,600 this week!
That means silver-futures speculators can run extreme leverage up to 22.6x, which is outrageous. Most investors run no leverage at all of course, and the legal limit in the stock markets has been pegged at 2x for decades now. Compared to an investor owning silver outright, each dollar silver-futures speculators are trading can have over 20x the price impact on silver! This gives futures traders wildly-outsized influence.
Every week their collective silver-futures positions are detailed in the CFTC’s famous Commitments of Traders reports. The recent reads are every bit as bullish for silver over the coming months as the SGR is over the coming years! All it will take to get silver surging higher again is for these universally-bearish traders to start buying again. And with the extreme leverage they run, the markets will force them to buy.
This chart shows speculators’ collective long and short positions in silver futures in green and red. They are now barely long silver while heavily short, making for exceedingly-bearish collective bets. Those will have to be unwound relatively rapidly once gold’s stock-market-selloff-fueled rally inevitably starts pulling silver higher again. This is the most-bullish silver-futures situation seen since just before silver’s last bull was born!
Let’s start on the short side, since that’s where speculators’ big silver-futures buying will begin. In the latest CoT week before this essay was published, current to Tuesday March 27th, speculators had total silver-futures shorts of 87.6k contracts. That’s truly extreme. Out of the 1004 CoT weeks since back in early 1999, that’s the 5th-highest spec shorting levels ever seen! Past extremes were never sustainable.
Note above that every single time the red spec-shorts line surged to highs, silver was bottoming ahead of a major rally ignited by short covering. That was true in late 2015 when silver’s latest bull was born, in mid-2017 during gold’s and silver’s summer-doldrums lows, and in late 2017 which saw extreme silver-futures short selling leading into another Fed rate hike. Silver rallied sharply after each shorting spike.
Silver-futures speculators are always wrong at extremes, because their very collective trading is what spawns those extremes in the first place. Once these guys have expended all their capital firepower to throw heavily short silver, there’s no one left to short sell it. Soon some get nervous and start to buy to cover their existing shorts. The only way to exit futures shorts is to buy offsetting long contracts to close positions.
And once short-covering buying starts on the periphery, the whole herd of speculators soon has to join in or risk truly-catastrophic losses. At today’s 22.6x max leverage available in silver futures, a mere 4.4% silver rally would wipe out 100% of the capital risked shorting it! So as soon as silver starts rallying when speculators are extremely short, they are forced to rush to buy to cover which catapults its price sharply higher.
No matter where the SGR happened to be, the 5th-highest spec shorts in silver-futures history would be wildly bullish for the near-term. But that’s not the whole silver-futures picture. It’s not just the speculators on the short side of the trade that are too bearish on silver, so are the long-side guys. In this latest CoT week, total spec silver-futures longs were only running 95.0k contracts. That’s just over a 26.2-month low!
Speculators’ collective bullish bets on silver via futures are slightly above their lowest levels since early 2016 when silver’s last bull market erupted! Unlike short-side traders who are legally obligated to buy to cover once silver starts rallying, new long-side buying is discretionary. But that very short covering drives silver higher fast enough to make the bearish long-side traders want to buy back in too, amplifying silver’s rally.
There’s nothing more bullish for silver over coming months than the rare combination of extremely-high shorts and very-low longs! This hasn’t been seen since late 2015 around silver’s 6.4-year secular low. Once silver started climbing on a parallel gold rally driven by short covering in its own futures, silver was off to the races on big futures buying. Speculators rushed to cover their excessive shorts and rebuild meager longs.
The resulting 30.0k contracts of silver-futures short-covering buying and another 55.6k of long buying catapulted silver 50.2% higher over the next 7.6 months. That adds up to 85.6k contracts of spec silver-futures buying. Today’s situation is even more bullish. If total spec shorts and longs return to their past year’s low and high, we’re looking at 54.5k contacts of short covering and another 59.5k of long buying!
That adds up to colossal silver-futures buying potential of 114.0k contracts over the next half-year or so. That’s the equivalent of a staggering 570m ounces of silver, or nearly 2/3rds of the latest read on annual world silver mine production! The potential silver upside that would be fueled by silver-futures buying of this magnitude is enormous. I suspect the resulting silver bull will dwarf the last +50.2% one in 2016’s first half.
Once silver starts rallying decisively on silver-futures buying, investors with their vastly-larger pools of capital will also start returning. Bullish analyses will explode, highlighting silver’s deep undervaluation relative to gold per the Silver/Gold Ratio. That will fuel bullish sentiment driving even more buying. Bull markets’ virtuous circle is buying begetting more buying. The more silver rallies, the more people want to buy it.
I’d be very bullish on silver with only a stock-panic-level SGR, only extreme spec silver-futures shorts, or only very-low spec silver-futures longs. But seeing all three at once, at a time when gold is rallying as the stock markets finally roll over out of their fake central-bank-spawned levitation, is truly extraordinary! This is literally the most-bullish setup for silver seen in years, so smart contrarian traders should be really long.
History proves that once silver starts moving, it will likely rally fast. As always the biggest gains will be won by the fearless contrarians who bought in early before everyone else figures this out. Investors and speculators alike can play silver’s big coming upside in physical bullion itself, the leading SLV iShares Silver Trust silver ETF, and the silver miners’ stocks. But only the latter will greatly leverage silver’s gains.
Just last week I wrote a comprehensive essay exploring the recent Q4’17 results of the world’s major silver miners included in the leading SIL Global X Silver miners ETF. They are mining silver at average all-in sustaining costs of just $10.16 per ounce, far below even today’s low silver prices. So all of silver’s new-bull-market gains will be pure profit, leading to exploding earnings driving silver miners’ stocks far higher.
During 6.9 months roughly coinciding with early 2016’s silver bull, SIL rocketed 247.8% higher! That’s about 4.9x upside leverage to silver’s own gains. And given how absurdly low silver-stock prices are today, silver miners have similar-if-not-greater potential to amplify silver’s even-larger gains in its next bull. The elite major silver miners with superior fundamentals could be the best-performing stocks in all the markets.
At Zeal we’ve literally spent tens of thousands of hours researching individual silver stocks and markets, so we can better decide what to trade and when. As of the end of Q4, this has resulted in 983 stock trades recommended in real-time to our newsletter subscribers since 2001. Fighting the crowd to buy low and sell high is very profitable, as all these trades averaged stellar annualized realized gains of +20.2%!
The key to this success is staying informed and being contrarian. That means buying low before others figure it out, before undervalued silver stocks soar much higher. An easy way to keep abreast is through our acclaimed weekly and monthly newsletters. They draw on my vast experience, knowledge, wisdom, and ongoing research to explain what’s going on in the markets, why, and how to trade them with specific stocks. For only $12 per issue, you can learn to think, trade, and thrive like contrarians. Subscribe today, and get deployed in the great gold and silver stocks in our full trading books!
The bottom line is a new silver bull is coming. Silver’s long and vexing sideways-to-lower grind has left it as undervalued relative to gold as during 2008’s stock panic. That anomaly was resolved by silver more than quintupling over the subsequent years in a mighty mean-reversion-overshoot bull. On top of that, silver-futures speculators’ short positions are at extreme highs while their opposing longs are at bull-birthing lows.
These wildly-bearish traders will be forced and motivated to aggressively buy silver futures once silver starts rallying decisively. That will be driven by gold strength like usual. Stock-market weakness ignites gold investment demand, driving both precious metals higher. Today’s silver setup is the most bullish in years. Everything is perfectly aligned for a massive new silver bull market to get underway any day now.
Readers know that I have beaten this drum all too often. Gold’s major fundamental driver is declining or negative real rates. There is a strong inverse correlation because Gold is money. That’s what JP Morgan said and he’s far more qualified to understand than quotable celebrities like Mark Cuban. But I digress.
When real rates are increasing or strongly positive (during most of the 1980s and 1990s and 2011 through 2015) Gold performs poorly because one can earn a real return on their money unlike with Gold. However, when real rates decrease and particularly when they are negative, Gold flourishes. That being said, right now there is an interesting development. Real rates have increased over the past year but Gold has held steady. Reviewing recent history can help us answer which is right.
First we look at a market-based indicator for real rates (yields). The US Treasury publishes this data daily as calculated from the TIPS market. Below we plot Gold along with the real 5-year TIPS yield, which recently touched an 8-year high. Interestingly, Gold has held up well. Note that there were two previous, similar divergences. Gold peaked in 2011 even though the real 5-year yield did not bottom until 2012. From 2005 to 2006 Gold made a significant break to the upside yet the real 5-year yield also increased during that time. Both times Gold was right.
Market-based indicators are great but in the context of real rates, the basic calculation has proven to be a better indicator for Gold. In this chart we plot Gold along with the real fed funds rate (inflation less the fed funds rate) and the real 5-year yield (inflation yess the 5-year yield). Note that both statistics peaked in 2011 at exactly the same time as Gold. Both have increased since the start of 2017 (along with Gold) but are nowhere close to the 8-year high that the real 5-year TIPS yield is. The TIPS market is exaggerating the strength of real yields.
Ultimately it remains to be seen which is right (Gold or real rates) but the past tells us to side with the market (Gold) rather than a fundamental indicator. The market is a discounting mechanism.
Gold holding steady despite an increase in real rates could be a bullish signal just as Gold declining amid falling real rates would be concerning. Perhaps Gold is discounting the likelihood that real rates have peaked and the risk of a sharp decline in real rates in 2020. In any case, those who focus too much on real rates and not the message of the market could risk missing out on a huge break to the upside. In anticipation of that move we continue to accumulate the juniors that have 300% to 500% upside potential over the next 18-24 months. To follow our guidance and learn our favorite juniors for the next 12-18 months, consider learning more about our premium service.
Lupaka Gold Inc. (TSX-V: LPK) has been completing the necessary steps to achieve commercial production at its wholly-owned Invicta Gold project in Peru, located 120 km north of Lima by road. Recently, I had the opportunity to re-visit the mine site to see how work is progressing towards production.
It is at this point in the life span of a mining company where institutional investors typically invest, and the stock price starts to move back up towards full value, which makes it a good time to invest. Lupaka Gold (TSX-V: LPK) is at this point.
Lupaka secured its necessary financing back in 2016, in order to advance the Invicta gold project through to production, marking an important inflection point for shares in Lupaka Gold (TSX-V: LPK), according to the life cycle of a junior mining share (pictured above).
With financing secured, the company has commenced construction and development work in order to commence production in the second half of 2018, resulting in potential full appreciation for its shares. The Company’s diligence and hard work is starting to bare fruit through the following recent developments:
Fully funded to complete its 6 to 12-month goals, including the start of production at Invicta
Produced a positive PEA on the project with an initial 6 year mine plan
Community agreement in place
Commencement of roadwork to mine site
Building out the in-country team with the appointment of Dan Kivari, P.Eng., as Director of Operations
Mine rehabilitation and construction
Ongoing sampling and surveying
The financing secured in 2016 was through Pandion Finance for a total of $7 million (U.S.), available to the Company in three tranches, all of which have now been drawn. This forward gold sale agreement is repayable to Pandion by delivering a total of 22,680 ounces of gold over 45 months.
Pandion plays a partnership role in development by receiving payment in gold from the actual mine rather than by way of equity or traditional debt structures. It also does not dilute shareholders as would with a financing in the market.
With money in place, now begins the real work.
On March 1, 2018, Lupaka issued a preliminary economic assessment (PEA) which outlined low capital expenditures, an initial mining scenario of 350 tonnes per day (tpd), and a very quick payback and path to cash flow. The strategy is to commence mining in an area close to existing infrastructure and focus on a small portion of the resources within the Aetnea vein. While the current Environmental Impact Assessment allows for up to 1,000 tpd, Lupaka’s approach is to start small and gradually increase production over the next few years.
The PEA boasts all-in sustaining costs of $575 per gold ounce equivalent (“AuEq oz”) over an initial six-year mine life and an average annual pre-tax operating profit of $12.3-million ($1300 gold assumption), very attractive economics at current metal prices. There is no need to state the Internal Rate of Return (“IRR”) as it produces meaningful cash flows within the first year.
The updated mineral resource (part of the PEA) outlines 3.0 million tonnes (“Mt”) of Indicated Mineral resources at 5.78 grams per tonne (“gpt”) AuEq oz using a 3.5-gram-per-tonne cut-off, and 0.6 Mt of inferred mineral resources at 5.49 gpt AuEq oz. The initial six-year mine plan is designed on only a portion of the mineral resource (~0.6Mt at an average head grade of 8.58 gpt AuEq, incorporates existing infrastructure which minimizes capital start-up costs.
The company now has over 24 years of tonnage, in terms of Indicated Mineral resources, mining at the 350 tpd, however management’s goal would be to increase production towards the EIA level of 1,000 tpd, which would increase production from 33,700 AuEq oz/yr up to closer to 100,000 AuEq oz/yr.
At the main portal, the company recently announced sample assay values over the footwall vein averaged 9.86 gpt AuEq over a strike length of 130 metres, with an average width of 6.1 metres. The average sampled grades are in-line, or higher, than grades within the mine plan, based on the PEA. With a combined average width of over 12 metres, the sub-vertical Invicta deposit extends for over 130 metres in strike length on the 3400 level and will be immediately accessible for extraction when the Invicta mine becomes operational in the second half of 2018.
The start small approach also allows the Company to reinvest into exploration in surrounding areas, in order to gain confidence to increase the mine plan, and to prove up new resources to potentially extend production for years to come.
The Invicta mine site is well situated with access to local infrastructure. There is an existing 66 kV transmission line within 29 km of the Invicta property. Additionally, S.N. Power Peru S.A. has a 220-kV electrical transmission line under construction that could provide a backup power source to the 66-kV line. The mine contractor may even choose to supply their own power.
Lupaka has been granted a water use permit from the Peruvian Ministry of Agriculture. Surface rights have been attained, a well has been constructed, and testing studies have concluded it can supply water up to 60 liters per second during the dry season, which should be sufficient supply for an onsite mill in the future.
As part of the agreement that was completed with the community of Lacsanga in July/2017, Lupaka was to undertake and complete certain improvements to the roads, including widening and creation of bypasses around the communities. The company signed a contract with local operators to expand, enhance and modify 27 kilometres of road commencing from the paved Huacho-Churin-Oyon Highway, located at approximately 1,500 metres above sea level, up to the Invicta project located at approximately 3,500 metres above sea level.
This new road will provide access to Invicta for heavy machinery and trucks that can transport large loads of material, reduce travel time, significantly increase safety and minimize the operational impact on local communities. The road will be widened from four metres up to six metres, and a safety berm will be created.
Work is ongoing to ensure that 30-tonne trucks can operate safely and efficiently using North American standards. This involves proper safety berms, passing stations, water drainage, widening hard rock areas using explosives and community by-passes routes.
There is a camp to house workers on site that was built by previous operators. It currently can house about 60 to 70 people, but it is already looking like they will have to expand the camp to accommodate a growing team.
Lupaka announced that development would begin with rehabilitation, preparation at Invicta with three crews, a new adit and 3430 level to be constructed. The Invicta project has approximately of 1.2 kilometres of existing adits, cross-cuts and underground workings.
As you can see below, the cross cut at the 3430 level is in the process of rehabilitation and construction. Over the past few months, work has been advancing to the point the cross cut has approached the main vein wall. Two 4.2-yard PLH Scoops have arrived on site along with a single boom jumbo drill in preparation of accelerated development and stope preparation.
At the lead of operations on site is recently appointed Dan Kivari, P.Eng. (picture in the centre above). He has more than 30 years of international experience in metallurgy, engineering and management of mineral projects throughout various stages of development. Most recently, Mr. Kivari held the position of chief operating officer at Stellar Mining Corp., a privately held mining company in Peru.
Mr. Kivari’s previous work experience includes several senior operating roles such as regional manager for Agnico Eagle Ltd.’s Western and Nunavut operations, where he was responsible for the development of the Meadowbank gold project, and vice-president of operations with Yamana Gold (TSX: YRI) overseeing the development of the Chapada copper-gold project. Throughout this experience, he has picked up the skills necessary to build a team for the Invicta Project.
There is still plenty of work to be done to meet the company’s goal to de-risk and evaluate the suitability of a plant by the second half of 2018. New bulk samples need to be extracted and sent to toll milling facilities to test and optimize metallurgical recoveries and concentrate quality.
A previous run-of-mine bulk test in February 2016 achieved good recoveries in concentrate streams — returning 87.5% gold, 91.2% silver, 91.5% copper, 90.03% lead and 90.1% zinc. The sample was a blend of approximately 80% run-of-mine material and 20% from a low-grade stockpile derived from development.
Looking forward, the company and the geology suggests that there is plenty more to be mined and there is the potential for the construction of a mill which would further reduce the company’s costs and improve any future valuation of the Invicta mine.
From six months ago, the Invicta Gold project is now a completely different scene. Today the roads have and continue to be widened (making them safe), staff and operating equipment is on site and the newly created 3430 Level cross cut has hit the main zone of mineralization.
From an investors perspective, mines moving to production present the greatest investment opportunity because each advancement the company makes de-risks the project and it becomes a question of the operating team to achieve goals on budget and proving the business model works. Lupaka is at this stage and its shares present an opportunity right now.
The hard work is underway at Invicta and the team is already in place to bring it into production, just in time for improving metal prices and the renewed interest in gold. The company appears to be well positioned to bring the project online during the second half of 2018 and meet its objective of becoming cash flow positive in its inaugural year.
Investors can look forward to the following positive catalysts:
Bulk sample results from prospective toll mill facilities
Toll milling agreement
Offtake agreement
Exploration plans and results
Obtaining commercial production at 350 tpd
Engineering and trade-off studies for building a plant onsite
With an all-in-sustaining cost of $575 per AuEq oz over initial six-year mine life, and plenty of resources not yet announced with permits in place to increase production, Lupaka Gold (TSX-V: LPK) is a company to watch.
It is at this stage where investors could see the greatest share price appreciation as the company is on task and working towards becoming a producing gold mine.
Will this Friday’s US jobs report be the catalyst that sends gold above the key $1370 resistance zone and ushers in a new era of institutional enthusiasm for gold stocks?
Please click here now. Double click to enlarge. The US stock market suffered yet another “cardiac arrest” moment yesterday.
Market breadth has thinned horrifically, and the low rates and QE that have incentivized corporate buybacks have been replaced with rising rates and QT. That’s akin to replacing a firetruck’s water with gasoline.
I’ve outlined the case for a possible minor rally in April from current price levels, but the market is so weak internally that it is risk of a much bigger cardiac arrest event.
I don’t think Jay Powell will announce a rate hike at the early may Fed meeting, but he might. If he does, stock market investors should be ready to trade in their “Sell in May and go away” mantra for… “Sell in May after getting blown away by Jay.”
If he wants to do four hikes in 2018 but avoid doing a hike in the September stock market “crash season” month, he is likely to seriously consider doing a hike in May. Are investors prepared for such a surprise? If they own lots of gold, the answer is yes!
Please click here now. So far in 2018 almost eighteen billion US dollars in institutional money has flowed out of the main S&P500 ETF. This market is very sick, and getting sicker.
The bottom line: US stock market rallies should be sold and the proceeds should be placed in cash, gold bullion, and gold stocks.
Please click here now. Double-click to enlarge this horrifying T-bond chart. On a day that the Dow Industrials fell more than 700 points at one point, the T-bond could barely rally at all.
Institutional money managers and sovereign wealth funds are beginning to realize that rate hikes and QT are a tremendous headwind to the US government’s ability to finance itself.
During the latest stock market mini crashes, they have clearly started to move their focus from T-bonds to gold.
As more rate hikes and QT create much bigger and more frequent crash events in the stock market, I expect this institutional interest in gold to accelerate.
Please click here now. Technically, gold’s price action is very impressive. A small head and shoulders top formation was quickly destroyed with yesterday’s safe haven rally.
Please click here now. Indian demand for the Akha Teej festival is solid. It should serve as great support for an imminent surge through upside resistance at $1370.
For an important look at that resistance zone, please click here now. Double click to enlarge. Gold is coiling in what I call a bull “super flag” pattern, and seems eager to burst higher in a rally that should carry it to $1425.
What’s particularly exciting is that in addition to bullion, the GDX ETF is beginning to act as a safe haven!
“Newbie” investors to the precious metals asset class have memories of the deflationary declines in 2008. They get nervous when they see the stock market fall, and wonder if gold stocks will also fall.
The goods news for these investors is that the current situation is more akin to the late 1960s or early 1970s than 2008.
Please click here now. While institutional money is pouring out of stock market ETFs, it’s starting to pour into the GDX gold stocks ETF.
Inflation is on the move, and savvy institutional money managers are moving their safe haven focus from bonds to gold and gold stocks.
Please click here now. Double-click to enlarge this GDX chart.I’ve urged gold stock investors to be eager buyers of all two and three-day pullbacks. Aggressive players can buy GDX call options and look for 20% gains on those options as a profit booking target.
For individual stock enthusiasts, the focus should be on the component stocks of the precious metal ETFs that show the best overall performance from 2016 to the present time.
In the 1970s the famous newsletter writer Harry Schultz was known as the “Dean of Gold”. He promoted the use of two and three-day pullbacks to purchase South African gold stocks. The current price action in GDX and many of its component stocks is beginning to display an eerie similarity to the price action of gold stocks in the early 1970s.
Gold stock enthusiasts who missed the most recent two-day pullback buying opportunity will have to wait for the next one to get in on the upside fun. Following that pullback, gold and gold stocks could be ready to surf an Akha Teej themed wave, right through $1370 and on towards my $1425 area target price!
Stewart Thomson is a retired Merrill Lynch broker. Stewart writes the Graceland Updates daily between 4am-7am. They are sent out around 8am-9am.The newsletter is attractively priced and the format is a unique numbered point form. Giving clarity of each point and saving valuable reading time.
Risks, Disclaimers, Legal
Stewart Thomson is no longer an investment advisor. The information provided by Stewart and Graceland Updates is for general information purposes only. Before taking any action on any investment, it is imperative that you consult with multiple properly licensed, experienced and qualified investment advisors and get numerous opinions before taking any action. Your minimum risk on any investment in the world is: 100% loss of all your money. You may be taking or preparing to take leveraged positions in investments and not know it, exposing yourself to unlimited risks. This is highly concerning if you are an investor in any derivatives products. There is an approx $700 trillion OTC Derivatives Iceberg with a tiny portion written off officially. The bottom line:
Are You Prepared?
Last week index score: 28.01 (updated)
This week: 42.63
Zinc One Resources (TSXV:Z) received the first results from drilling at its Bongará zinc mine project in north-central Peru.
NuLegacy Gold (TSXV: NUG) said late winter storms deposited as much as three feet of snow on parts of its Red Hill property in the Cortez gold trend of Nevada, USA.
Prospero Silver (TSXV: PSL) announced the results of the third hole of a three-hole drill program at the Pachuca SE project in Hidalgo, Mexico.
Avrupa Minerals (TSXV: AVU) closed a private placement and raised C$550,000.
The Oreninc Index increased in the week ending March 30th, 2018 to 42.63 from an updated 28.01 a week ago as brokered and bought deal financings returned, even though it was a short week due to the Easter break.
Another swinging volatile week for gold as its recent fear trade boost subsided as US president Donald Trump deflated some of his trade tariff rhetoric. However, market analysts increasingly expect a gold breakout to occur, with the latest portent being that the gold/silver price ratio has gone past 80:1. This is the fifth time in the past 23 years that this has happened and on each previous occasion gold and silver equities exploded to the upside starting between 30-60 days later.
On to the money: total fund raises announced tripled to C$96.1 million, a four-week high, which included three brokered financings for C$13.3m, a two-week high, and two bought-deal financings for C$3.0 million, also a two-week high. The average offer size almost tripled to C$3.7 million, a four-week high.
Another range-bound volatile week for gold during which the yellow metal closed down at US$1,325/oz from US$1,347/oz a week ago despite hitting a mid-week high of US$1,353/oz. Gold is now up 1.74% this year. Meanwhile, the US dollar index closed up at 89.97 from 89.44 a week ago. The van Eck managed GDXJ alsoclosed down at US$32.15 from US$32.78 last week. The index is down 5.80% so far in 2018. The US Global Go Gold ETF manged to hold its ground, dipping slightly to close down at US$12.71 from US$12.74 a week ago. It is down 2.31% so far in 2018. The HUI Arca Gold BUGS Index closed down at 175.41 from 176.86 last week. The SPDR GLD ETF saw some selling to close down at 846.12 tonnes from 850.54 tonnes a week ago.
In other commodities, the silver closed down at US$16.36/oz from US$16.56/oz a week ago. Copper recovered from its recent fall below the US$3.00/lb level to close up at US$3.02/lb from US$2.99/lb last week. Oil put in a losing week and closed down at US$64.94 a barrel from US$65.88 a barrel a week ago.
The Dow Jones Industrial Average showed signs of recovering from the trade-war potential resulting from Trump’s China tariffs announcement, to close up at 24,103 from 23,533 last week. Likewise, Canada’s S&P/TSX Composite Index got on the road to recovery to close up at 15,367 from 15,223 the previous week. The S&P/TSX Venture Composite Index closed down at 796.67 from 817.80 last week.
Summary:
Number of financings grew to 26, a two-week high.
Three brokered financings were announced this week for C$13.3m, a two-week high.
Two bought-deal financings were announced this week for C$3.0, a two-week high.
Total dollars jumped up to C$96.1m, a four-week high.
Average offer size also grew to C$3.7m, a four-week high.
Financing Highlights
Asanko Gold (TSX: AKG) opened a US$17.6 million (C$22.79 million) offering on a strategic deal basis with Gold Fields, which will purchase 22.4 million shares @ US$0.79, a 9.9% interest.
Asanko also entered into a JV with Gold Fields under which it will receive US$185 million for a 50% interest in its Asanko gold mine.
Asanko will use the proceeds to repay US$164 million of debt with Red Kite.
Serabi Gold (TSX: SBI) announced a US$15 million strategic private placement with Greenstone Resources.
297.8 million @ 0.5 pence, a 29.82% interest.
Funds will be used to undertake drilling to delineate additional resources and expand the life of mine at the Palito and Sao Chico projects, and advance the recently acquired Coringa project, all in Brazil.
Serabi also opened a private placement for a minimum of US$8.0 million @ 3.6 pence undertaken by Peel Hunt.
Major Financing Openings:
Asanko Gold (TSX:AKG) opened a C$22.79 million offering on a strategic deal basis.
Serabi Gold (TSX:SBI) opened a C$18.46 million offering on a strategic deal basis.
North American Nickel (TSXV:NAN) opened a C$15 million offering on a best efforts basis. Each unit includes half a warrant that expires in two years.
Serabi Gold (TSX:SBI) opened a C$10.32 million offering underwritten by a syndicate led by Peel Hunt on a best efforts basis.
Major Financing Closings:
Serabi Gold (TSX:SBI) closed a C$11.53 million offering underwritten by a syndicate led by Peel Hunt on a best efforts basis.
Auryn Resources (TSXV:AUG) closed a C$10.08 million offering underwritten by a syndicate led by Cantor Fitzgerald Canada on a bought deal basis.
Skeena Resources (TSXV:SKE) closed a C$8.46 million offering underwritten by a syndicate led by PI Financial on a best efforts basis. Each unit included half a warrant that expires in two years.
Chakana Copper (TSXV:PERU) closed an C$8 million offering underwritten by a syndicate led by Eventus Capital on a best efforts basis.
Company News
Zinc One Resources (TSXV: Z) received the first results from drilling at its Bongará zinc mine project in north-central Peru. Drilling commenced at the Mina Grande Sur and Bongarita zones where two portable drill rigs are currently operating. At Mina Grande Sur, 543m were completed in 33 holes with highlights including 5.5m @ 26.1% Zn in hole MGS18001. At Bongarita, 587m were completed in 36 holes with highlights including 11.5m @ 16.0% Zn in hole BO18005.
Analysis
The initial results are very optimistic and demonstrate the potential of the project by confirming its high-grade nature, particularly given that many intercepts start at or near surface. The results will contribute to the upcoming resource estimate and PEA planned for 2018.
NuLegacy Gold (TSXV: NUG) said late winter storms deposited as much as three feet of snow on parts of its Red Hill property in the Cortez gold trend of Nevada, USA making access to selected drill target areas difficult and dangerous. As a consequence, the company had to release a reverse circulation drill rig it contracted to begin drilling in late March and replaced it with a drill scheduled to arrive late April. Drilling will initially focus on following up on the 2017 success in the Serena and Avocado zones in areas with broad intervals of intense alteration, silicification and decalcification seen in several of the drill holes in this large exploration area.
Analysis
Freak weather can happen, but this event should only delay the company by a month.
Prospero Silver (TSXV: PSL) announced the results of the third hole of a three-hole drill program at the Pachuca SE project in Hidalgo, Mexico. Drilling confirmed the presence of highly anomalous silver values hosted by blind epithermal veining in three widely separated zones hosted by 7km of structures on the property. Hole 3 cut multiple zones of anomalous silver including 1.5m @ 121.3g/t Ag & 0.37g/t Au.
Analysis
Drilling of the Pachuca targets continues drilling the third of three initial projects funded by Fortuna Silver (TSX: FVI) in early stage proof of concept programs. The program successfully demonstrated that Pachua SE hosts blind epithermal veins with silver and gold mineralization. The next step will be to agree additional drilling to define the extent of mineralization in the veins.
Avrupa Minerals (TSXV: AVU) closed a private placement and raised C$550,000 and issued 6.9 million units @ C$0.08. Each unit consists of one share and one warrant exercisable @ C$0.12 for two years. The funds will be used for exploration mainly in Portugal and Kosovo.
About Oreinc.com:
Oreninc.com is North America’s leading provider of relevant financing information in the junior commodities space. Since 2011, the company has been keeping track of financings in the junior mining as well as oil and gas space. Logging all relevant deal and company information into its proprietary database, called the Oreninc Deal Log, Oreninc quickly became the go-to website in the mining financing space for investors, analysts, fund managers and company executives alike.
The Oreninc Deal Log keeps track of over 1,400 companies, bringing transparency to an otherwise impenetrable jungle of information. The goal is to increase the visibility of transactions and to show financings activity in a digestible format. Through its daily logging activities, Oreninc is in a position to pinpoint momentum changes in the markets, identify which commodities are trending and which projects are currently receiving funding.

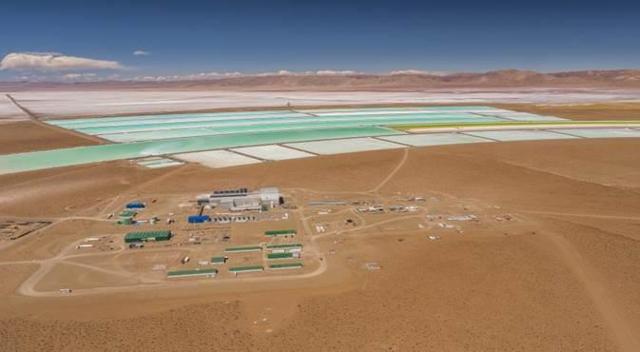
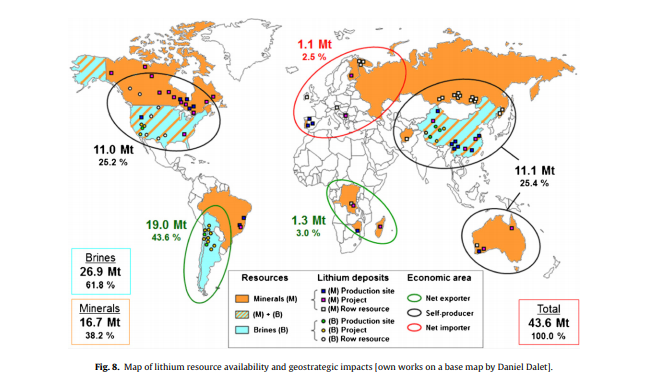


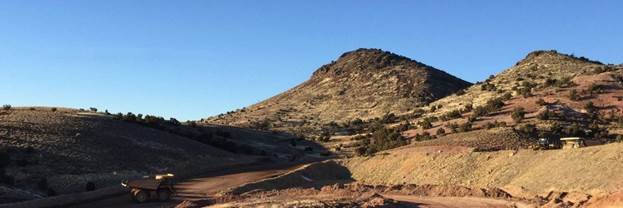
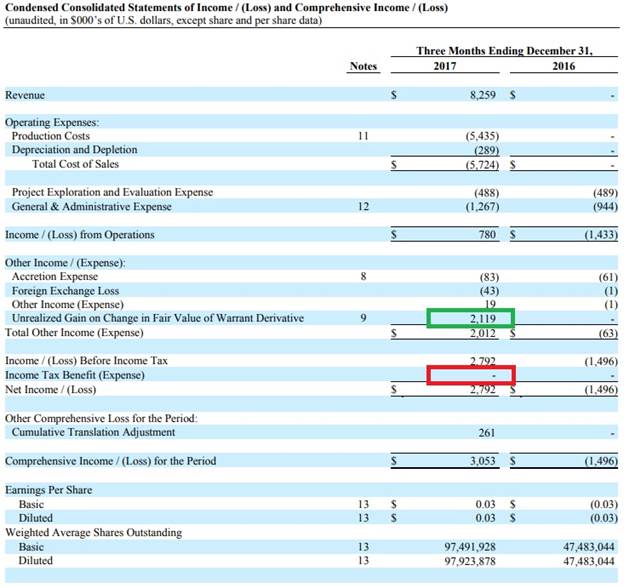
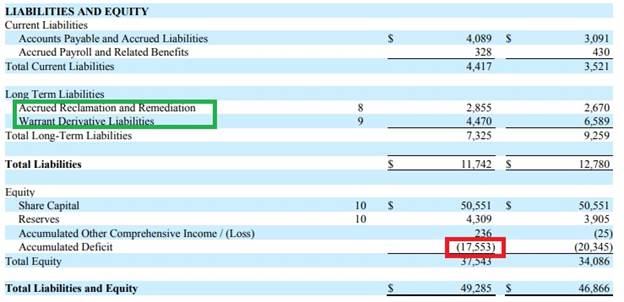
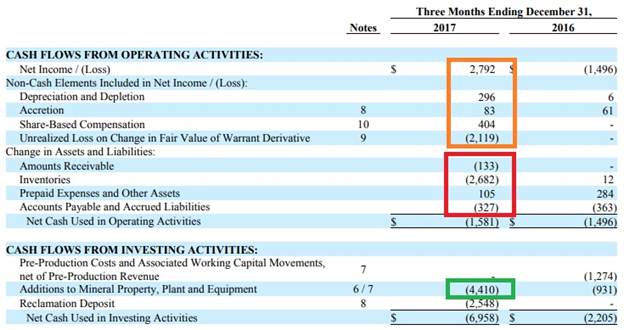
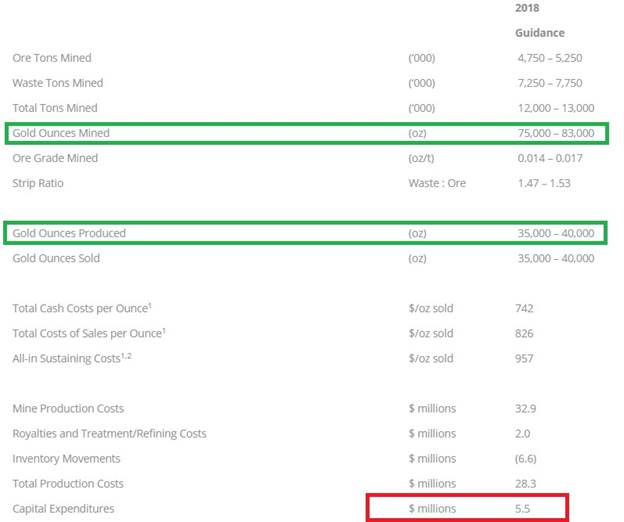
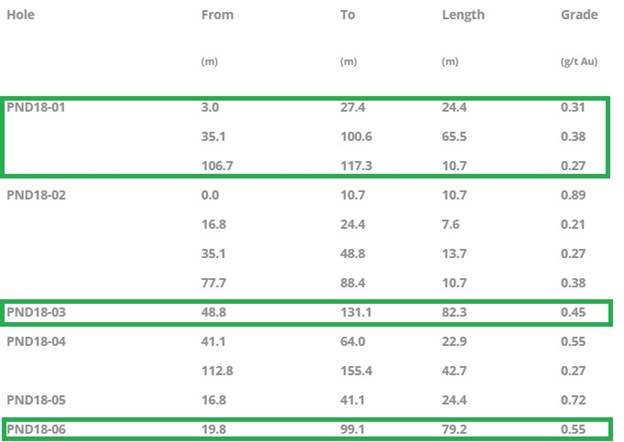
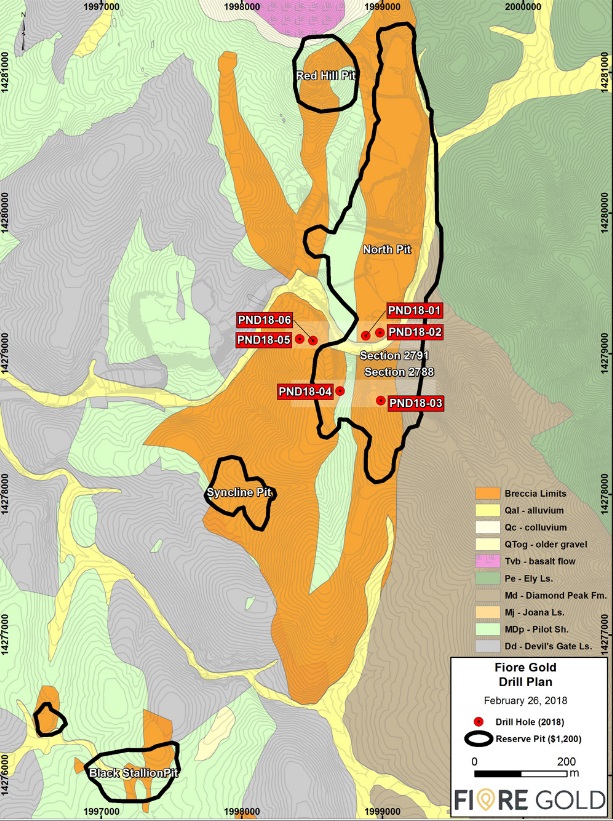
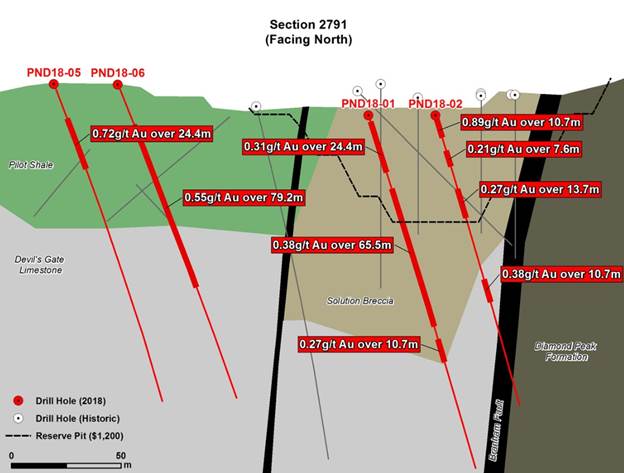
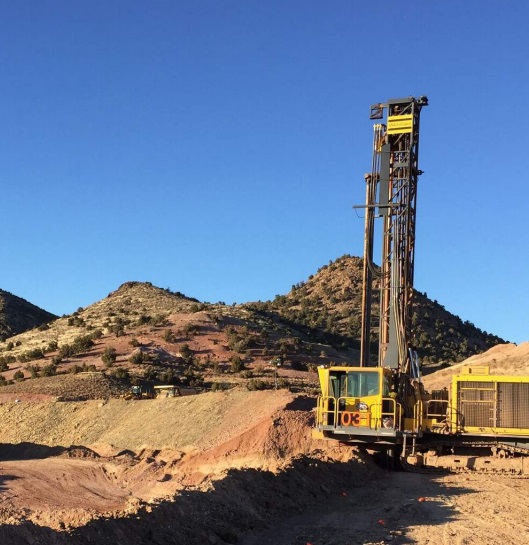
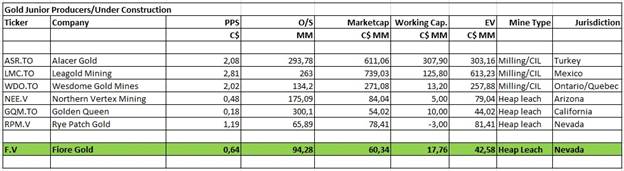
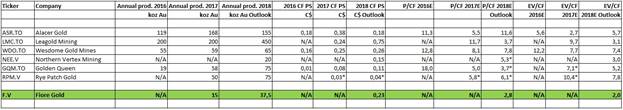

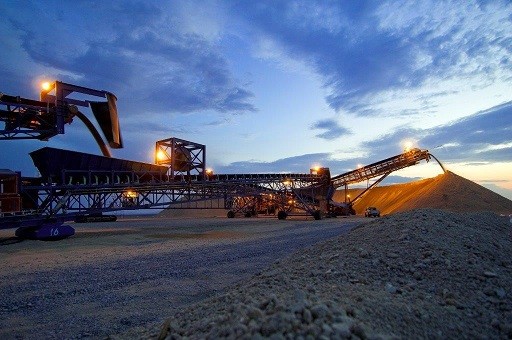
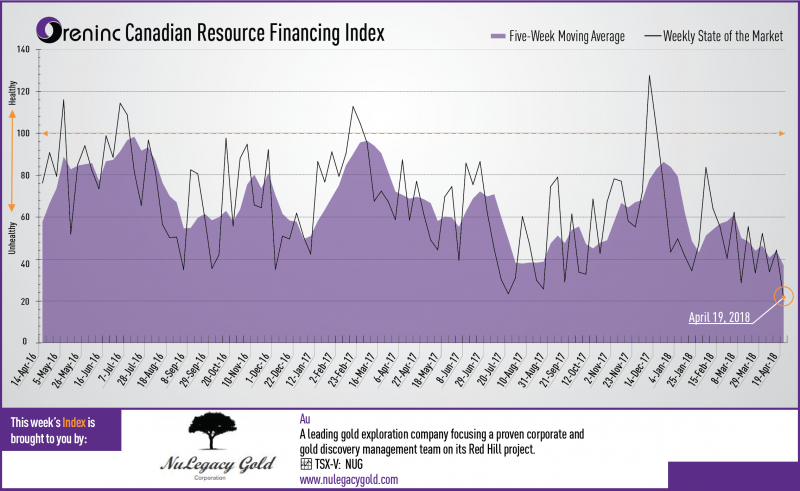

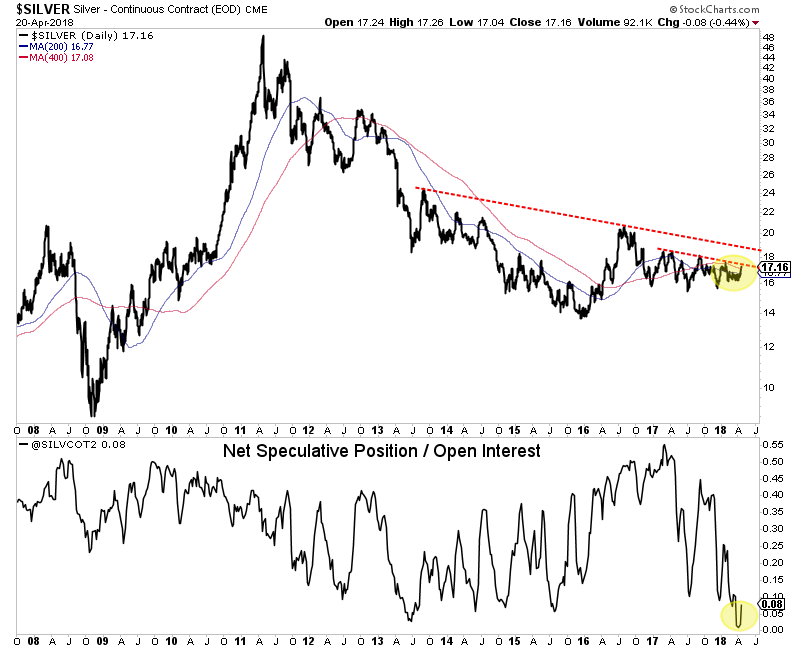
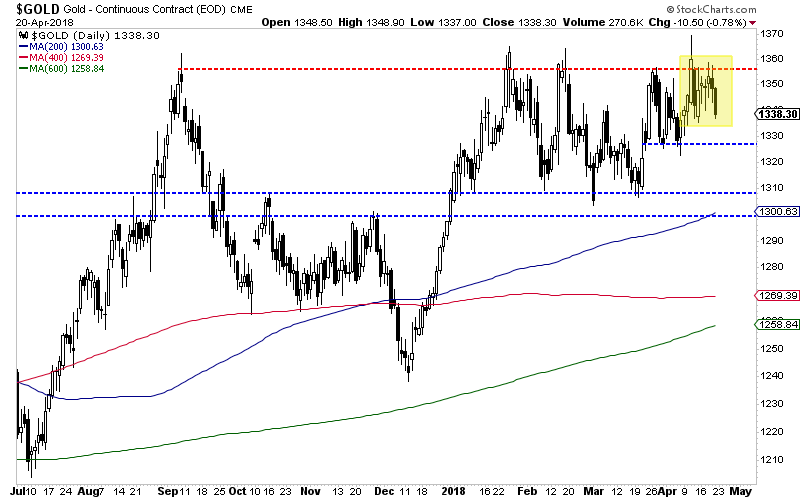
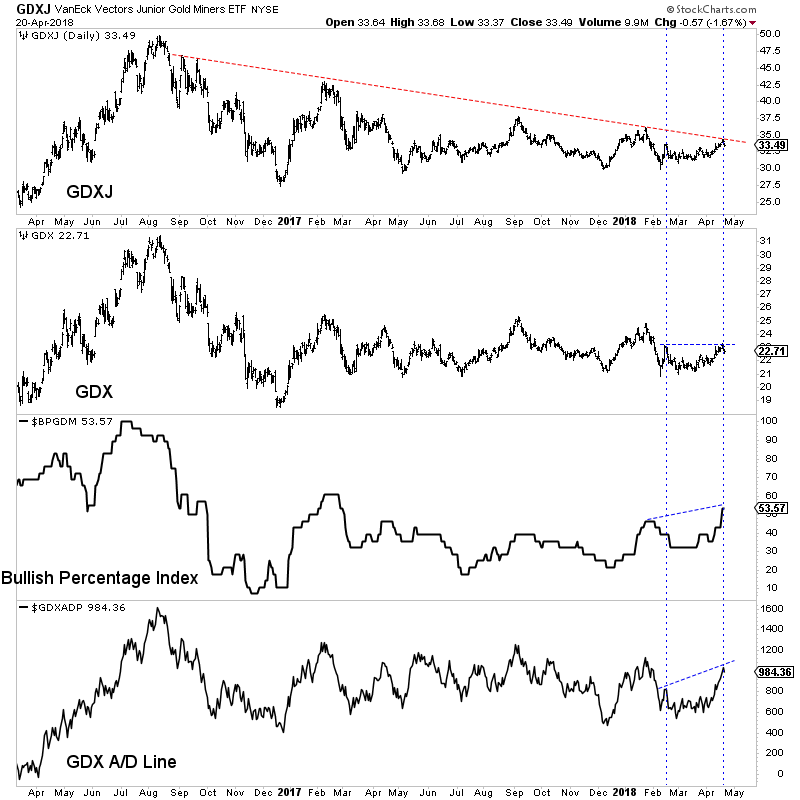

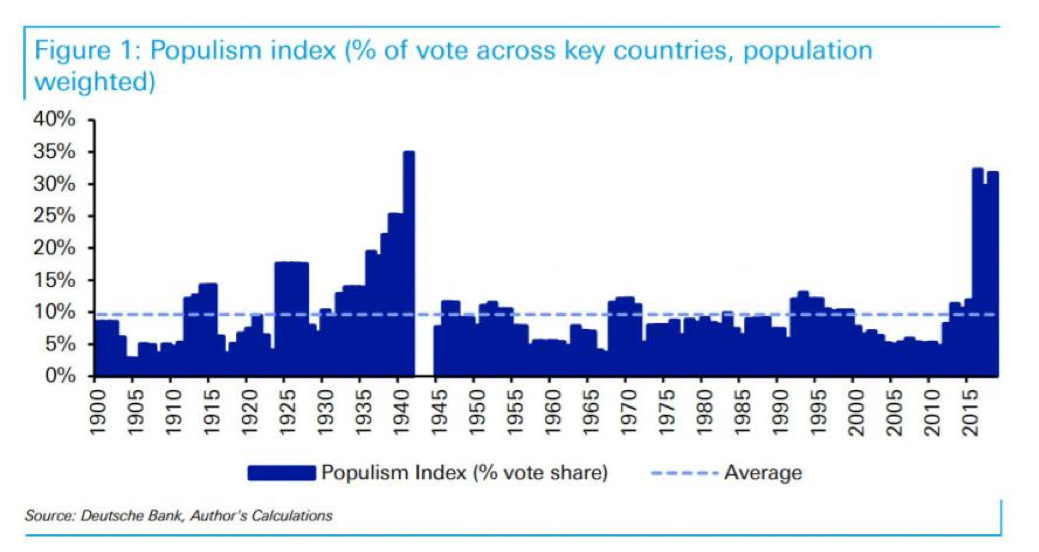
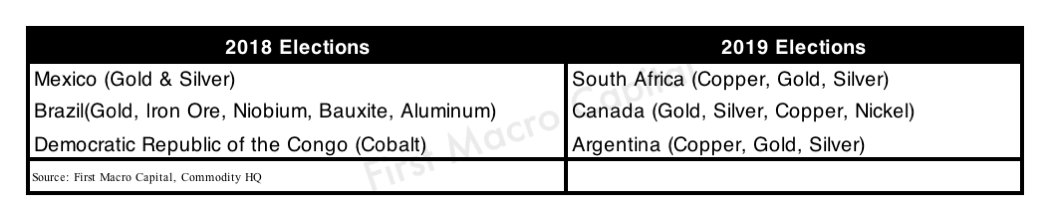
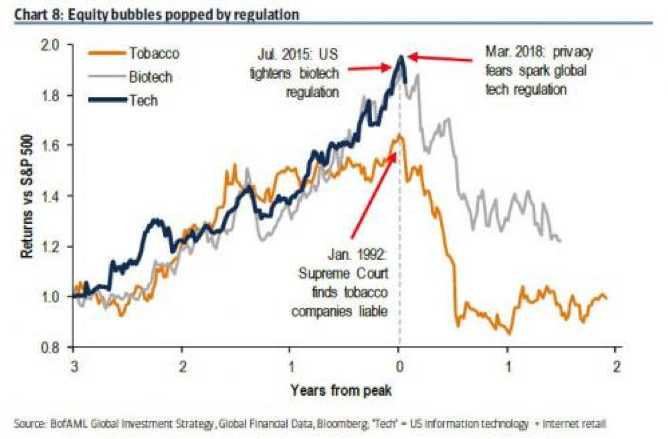
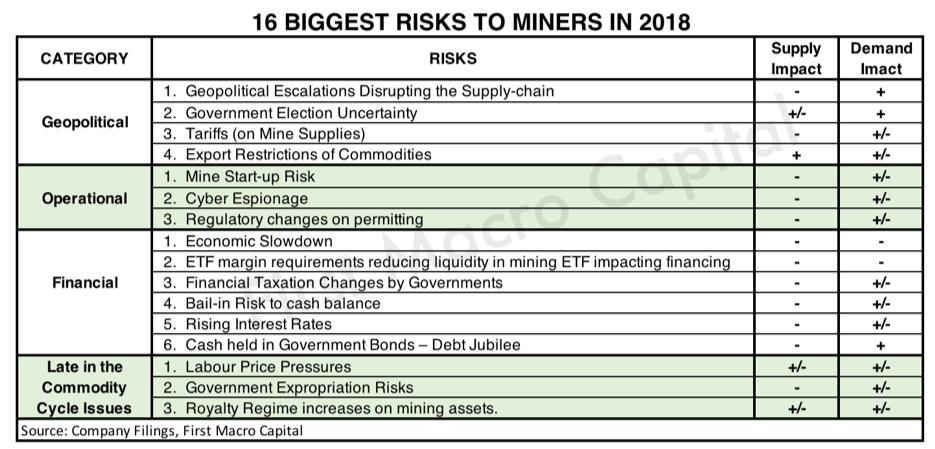
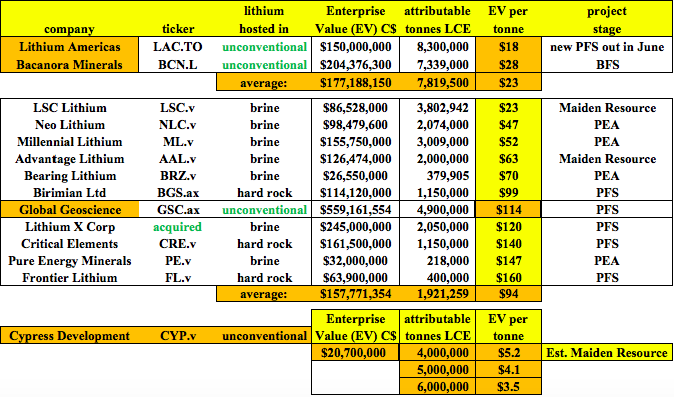
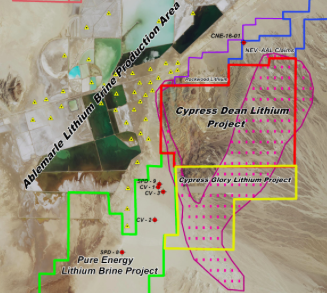
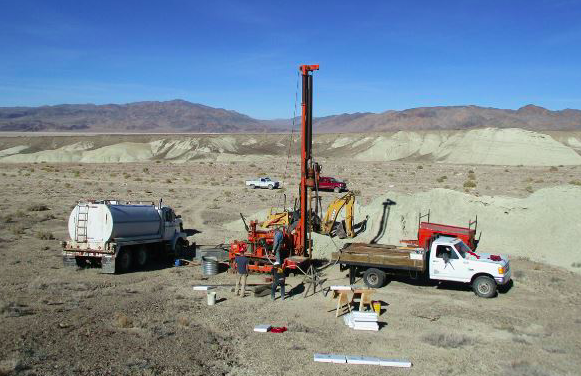
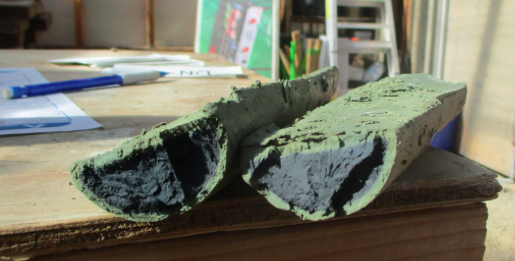


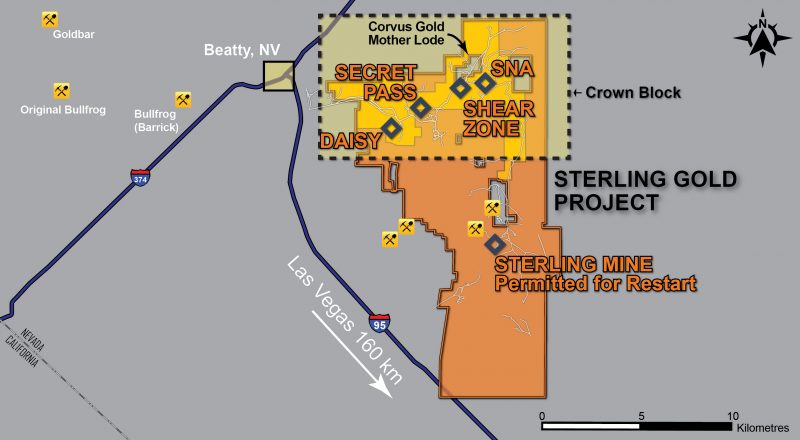
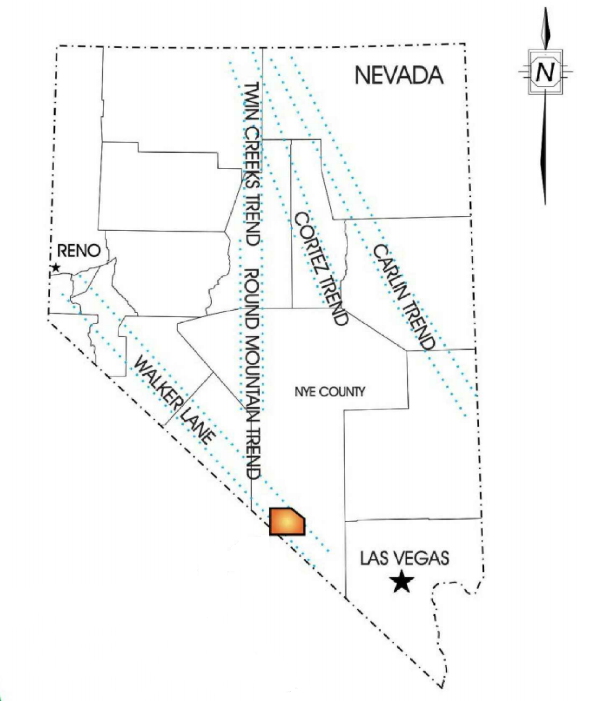
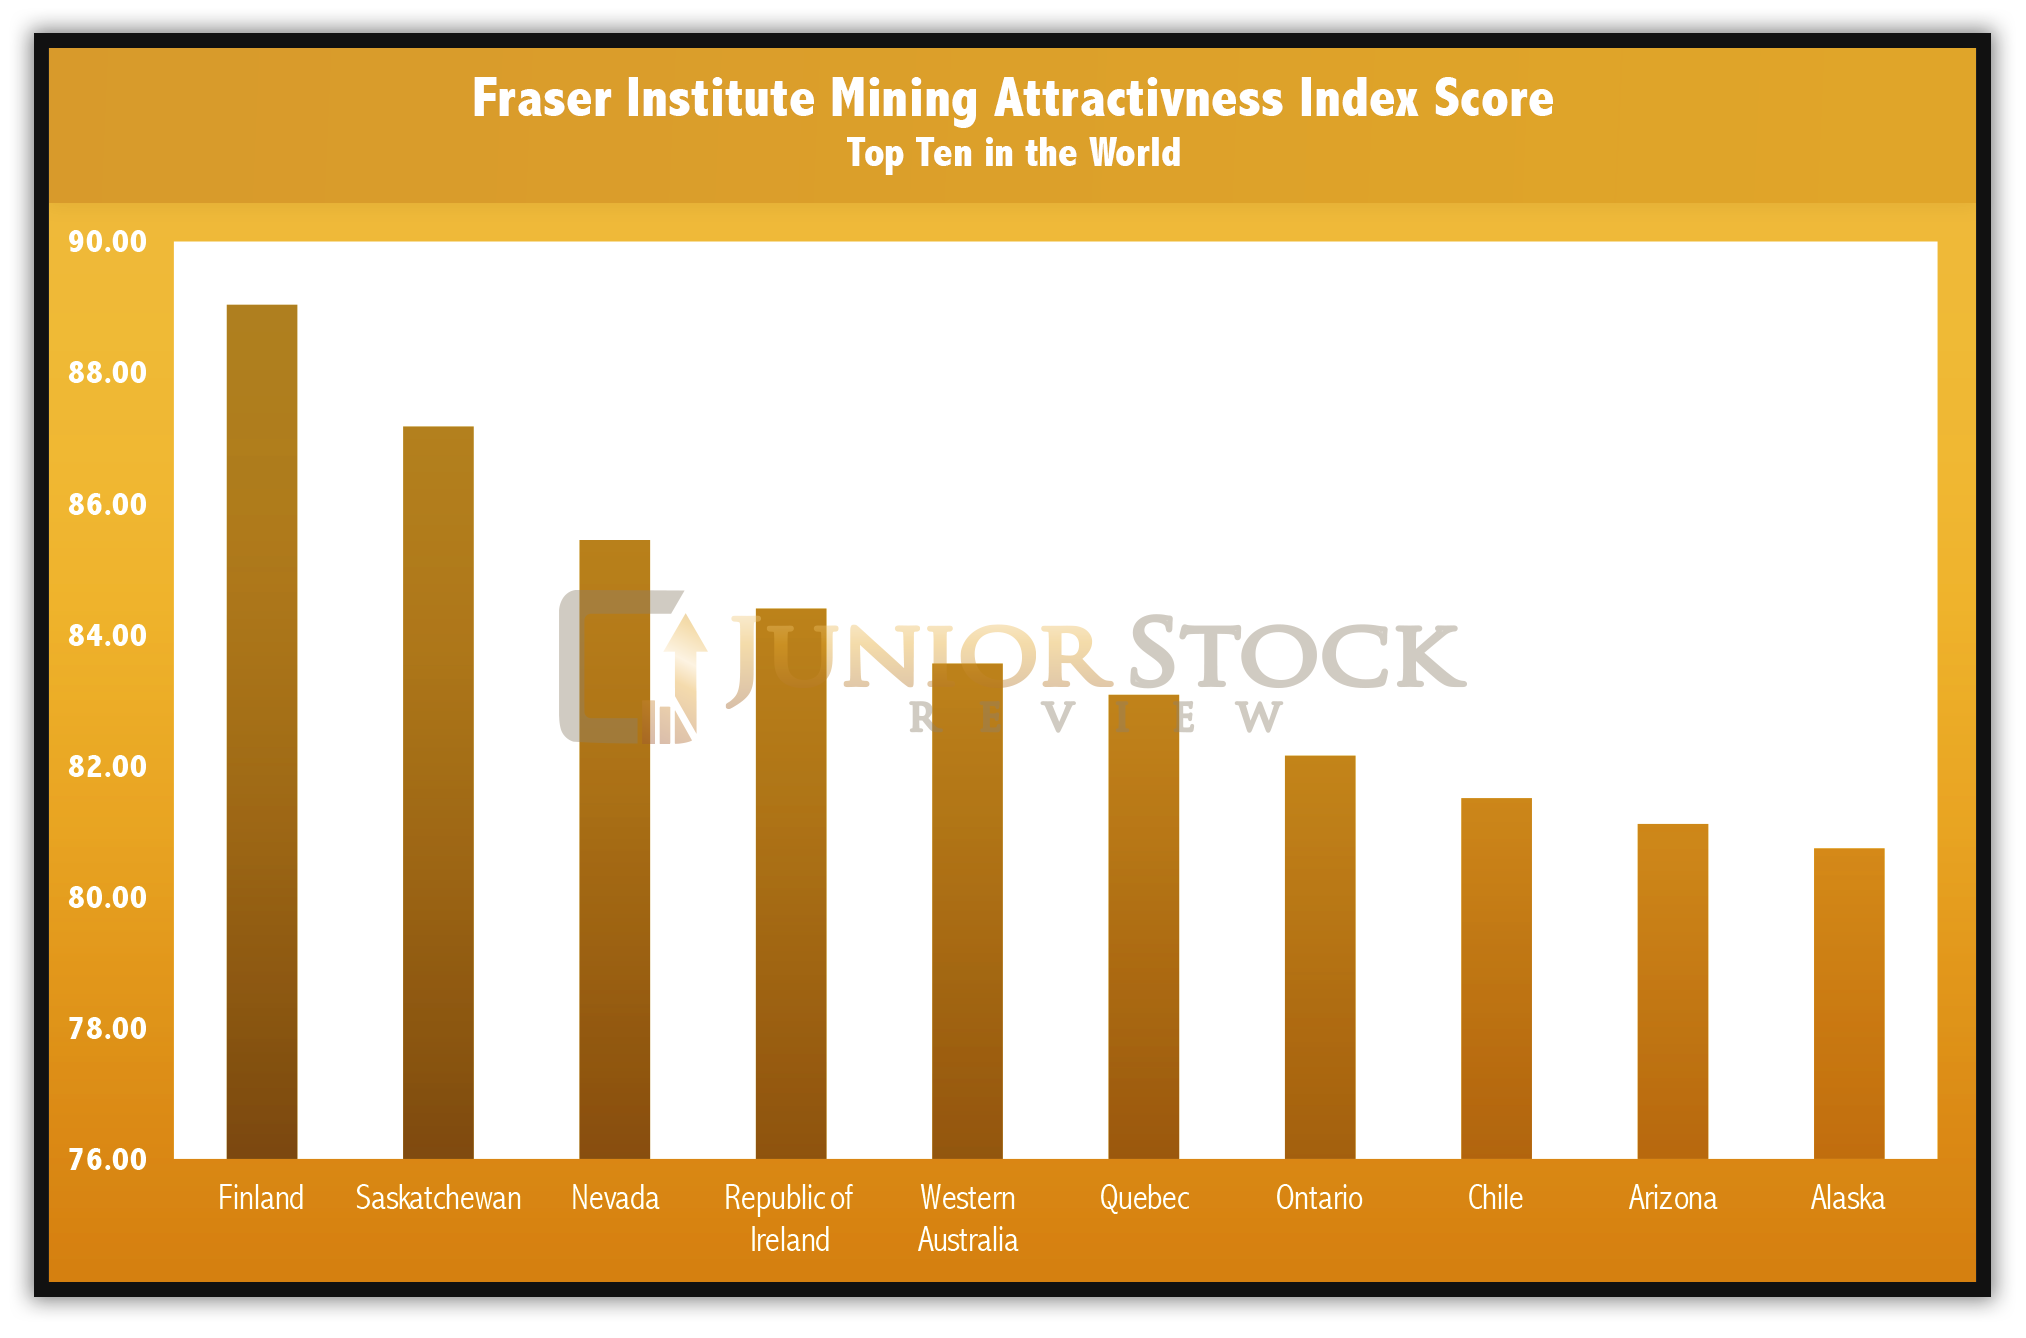

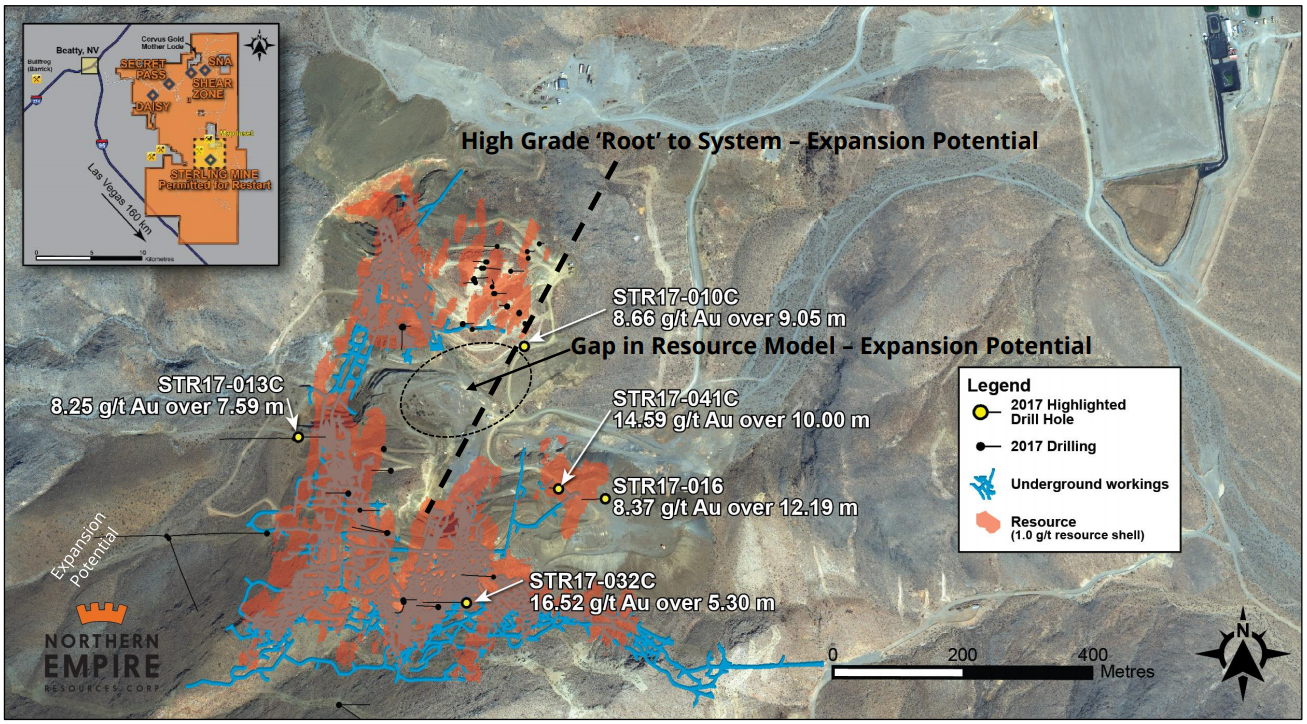
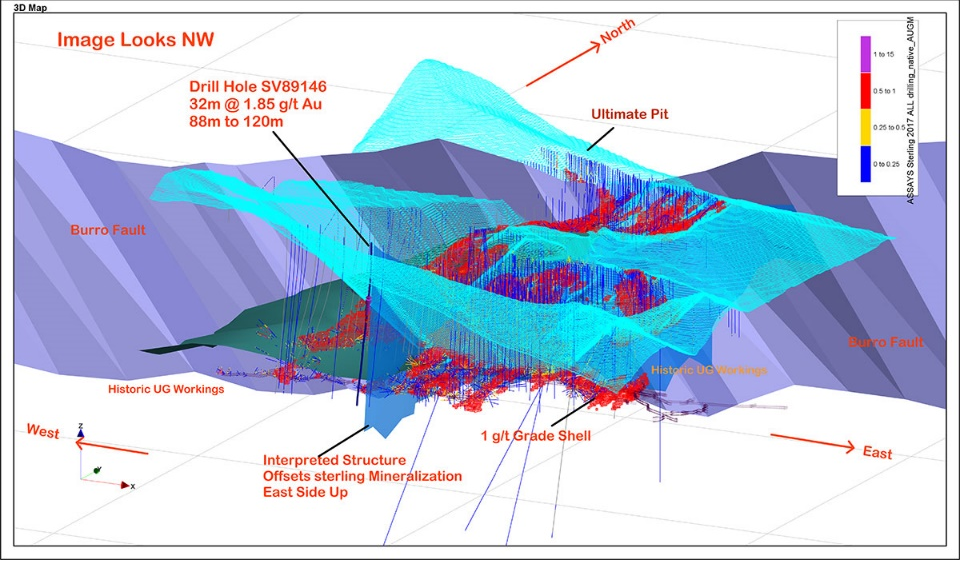
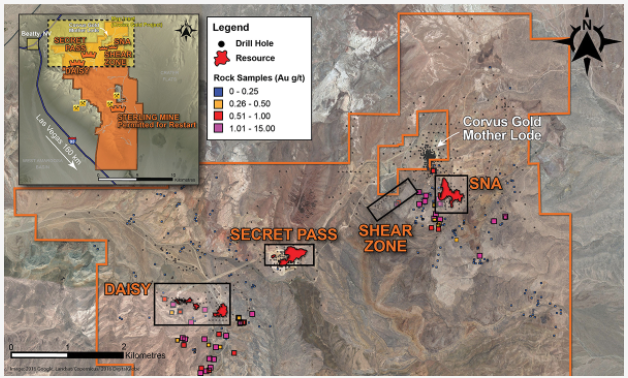
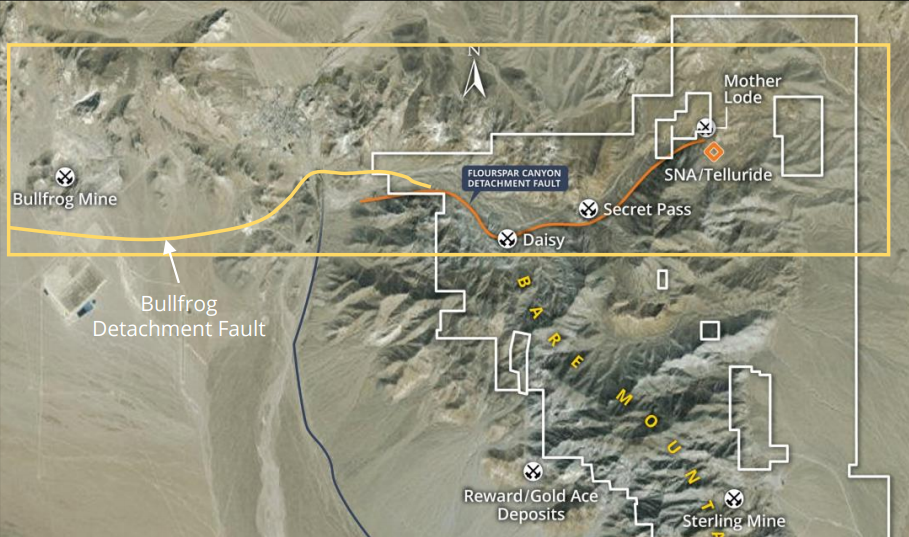
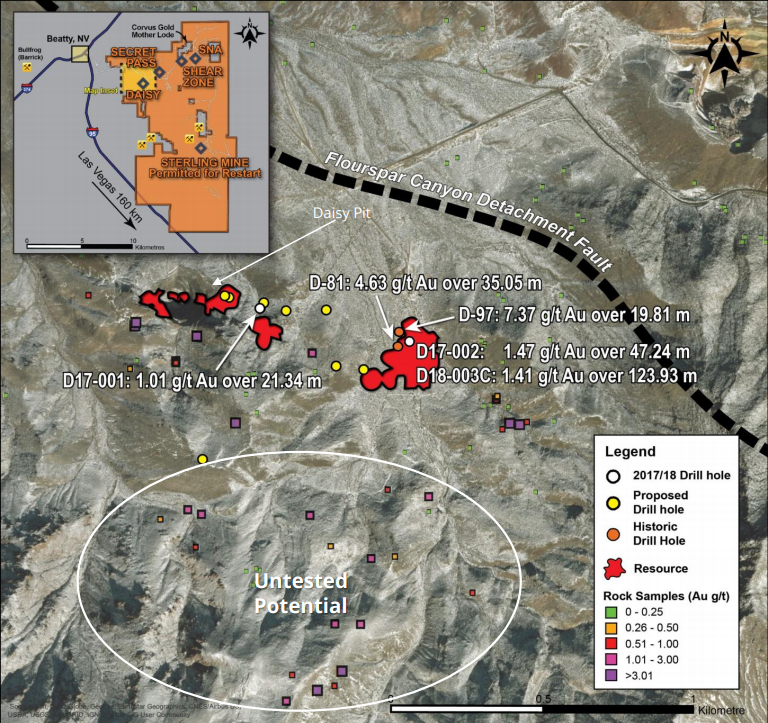
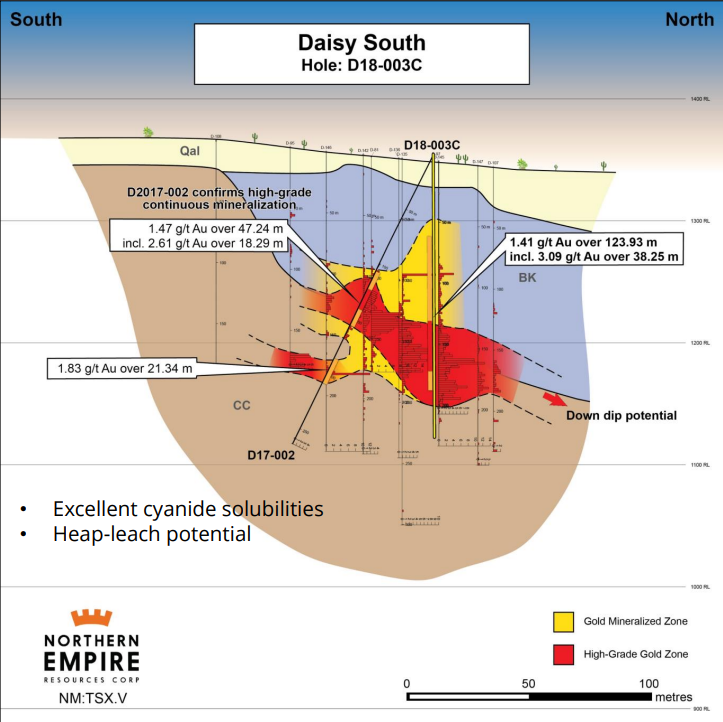
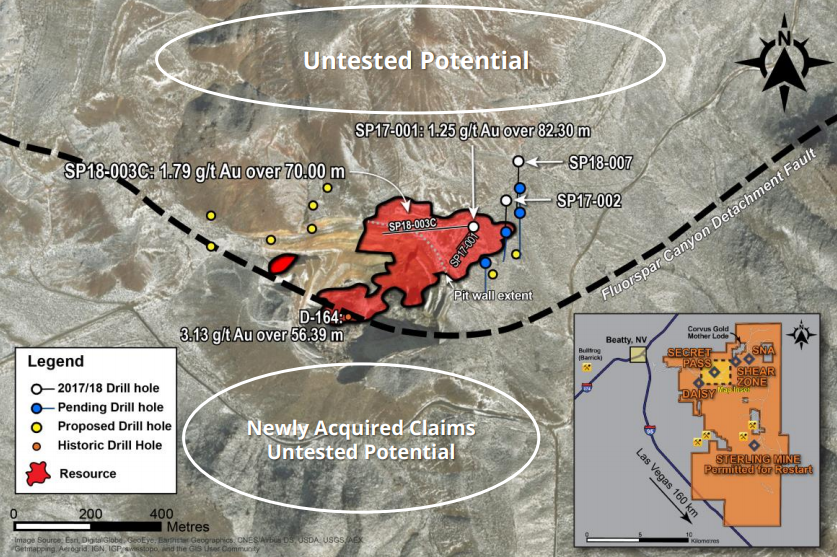
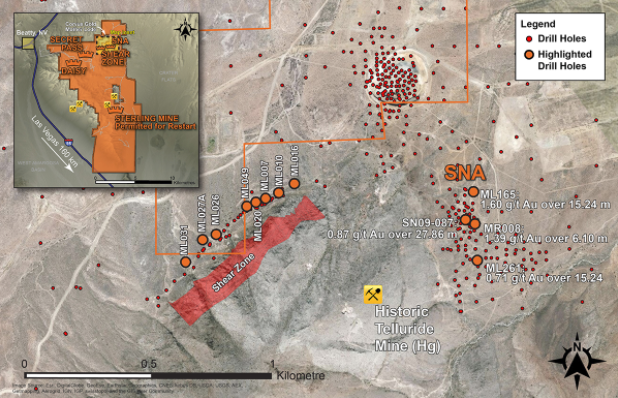
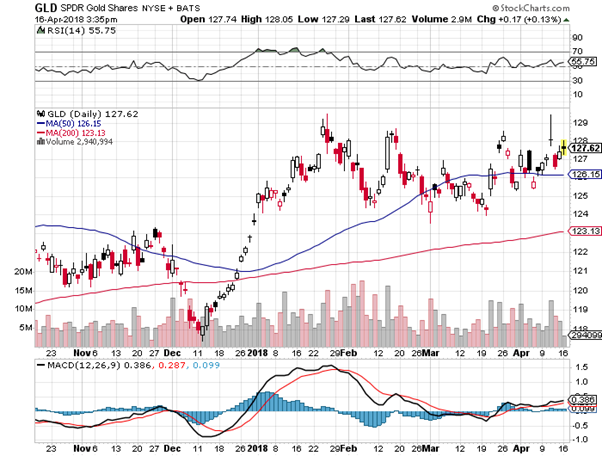
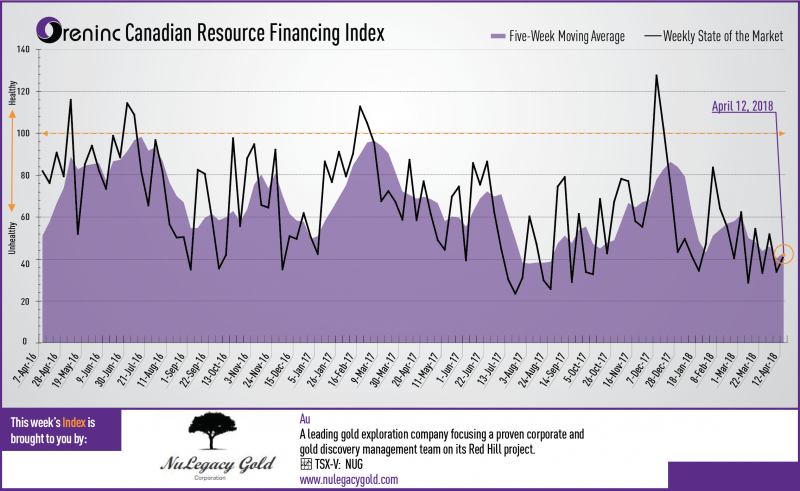

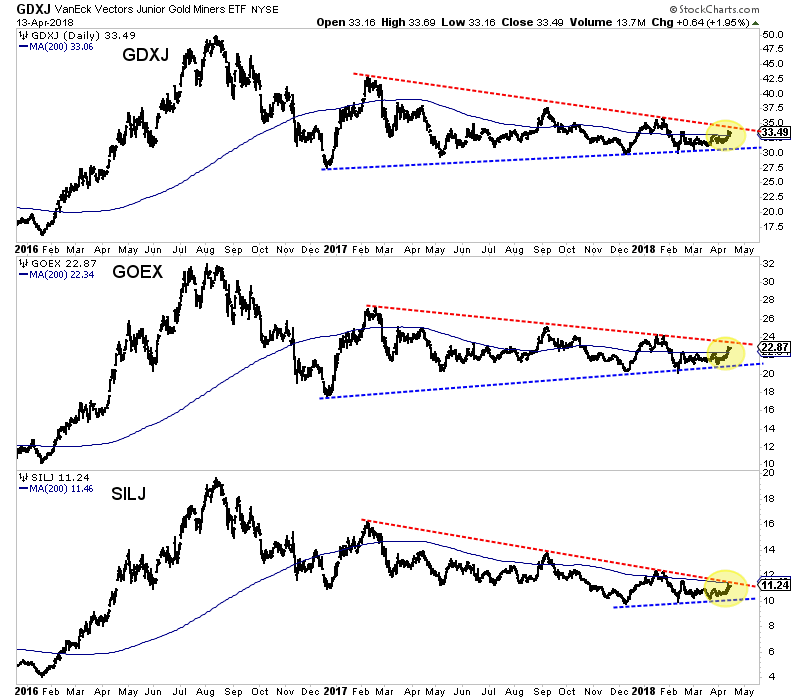
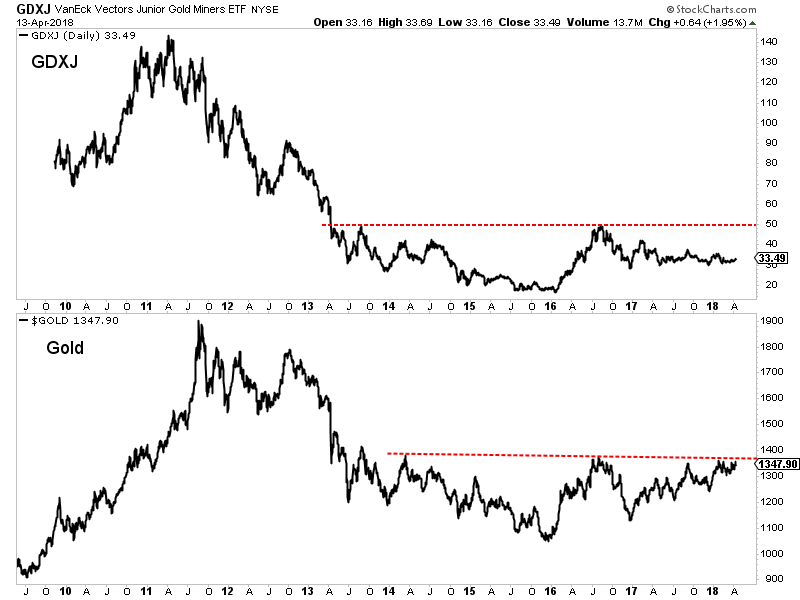
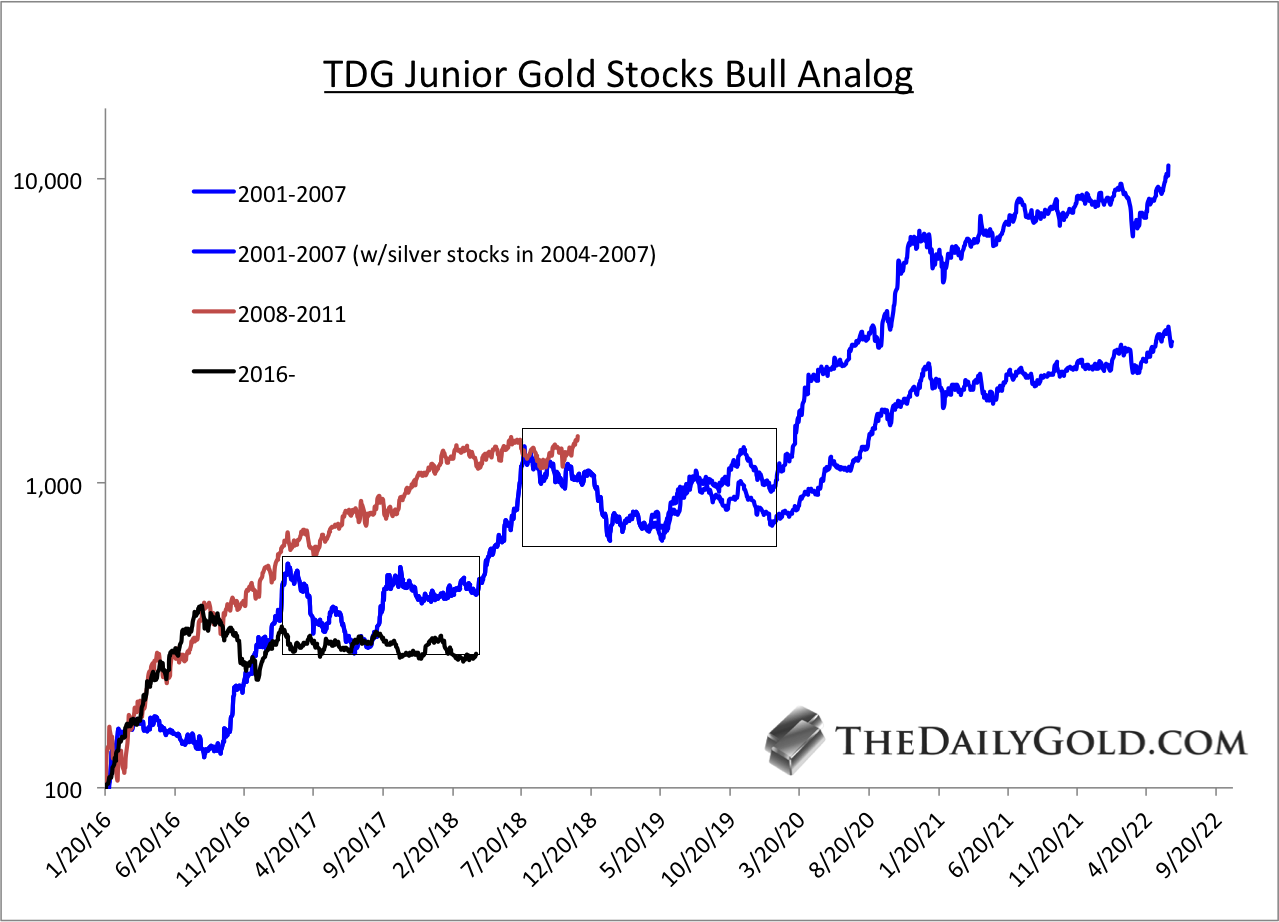

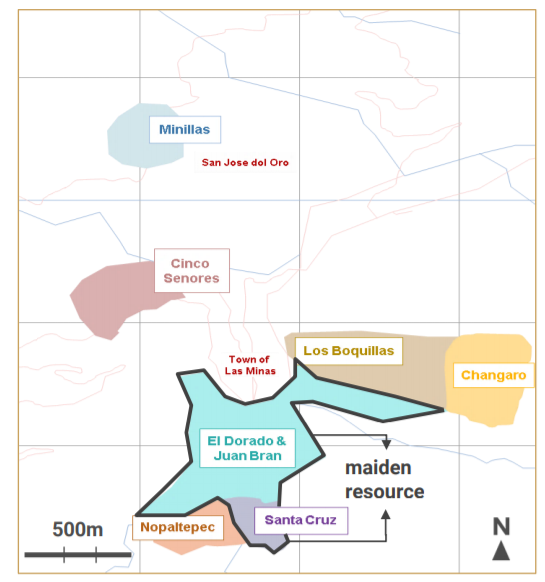
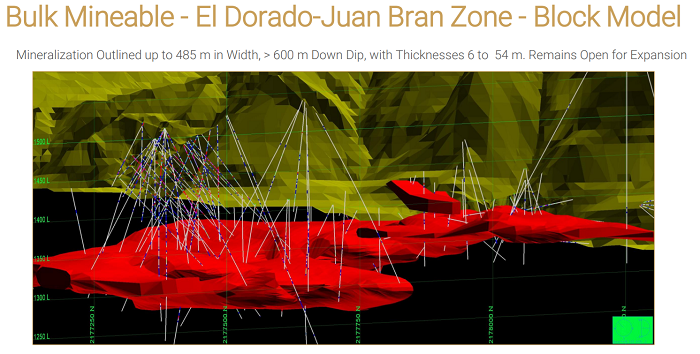

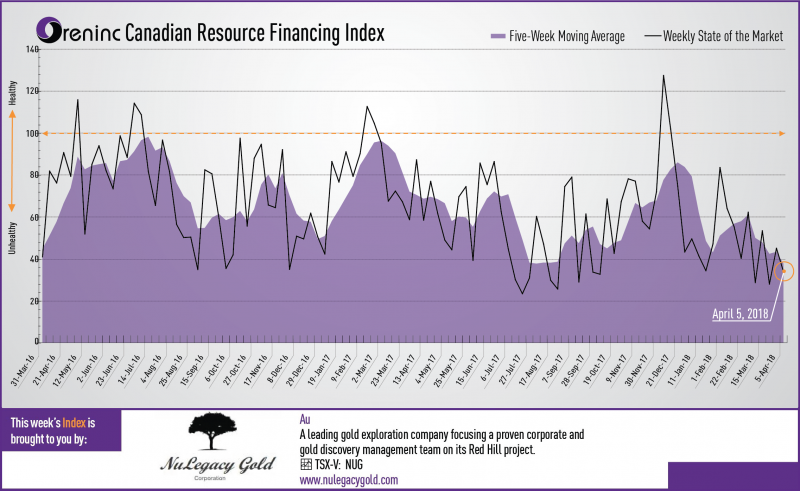


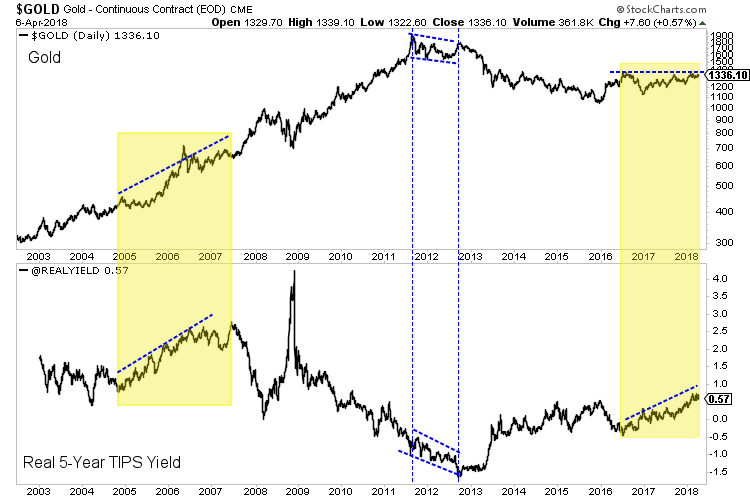
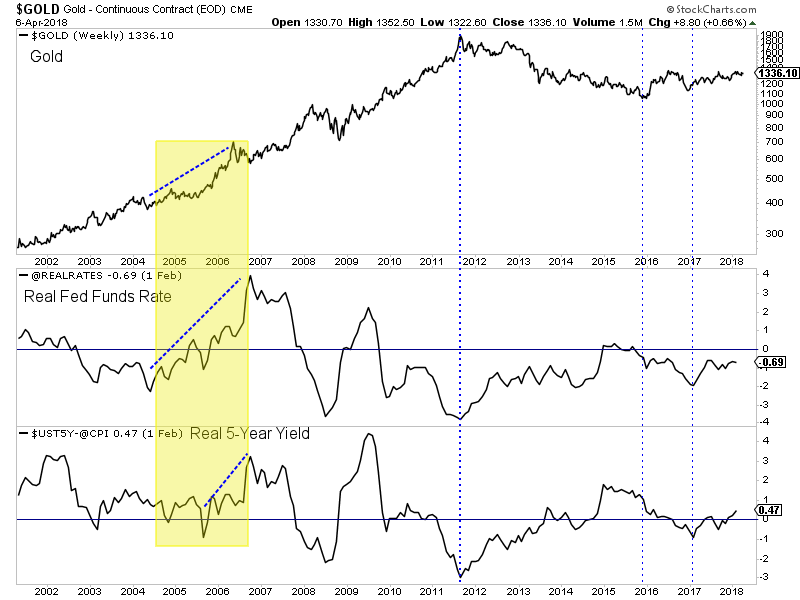
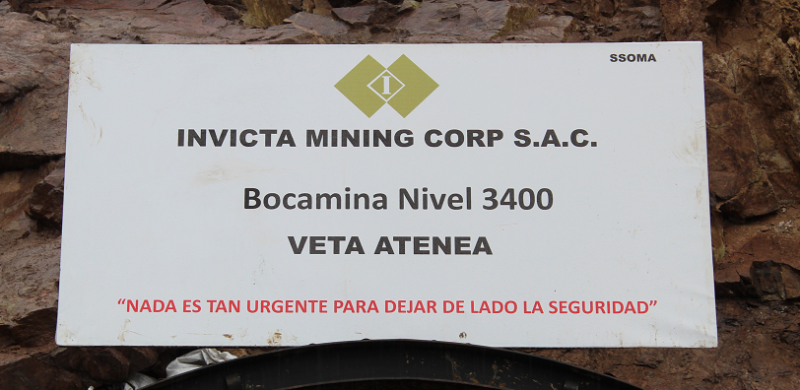

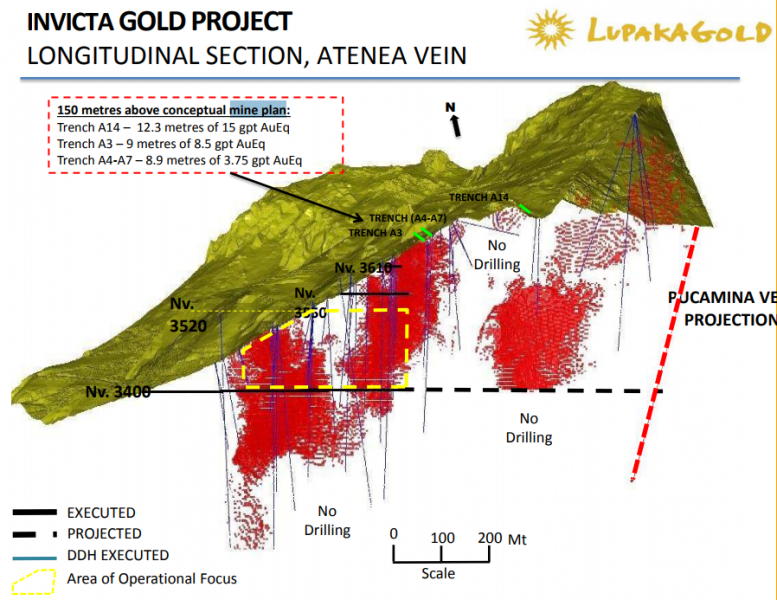
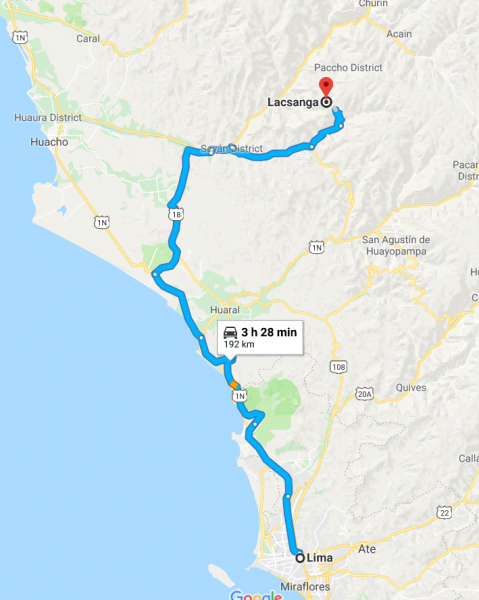


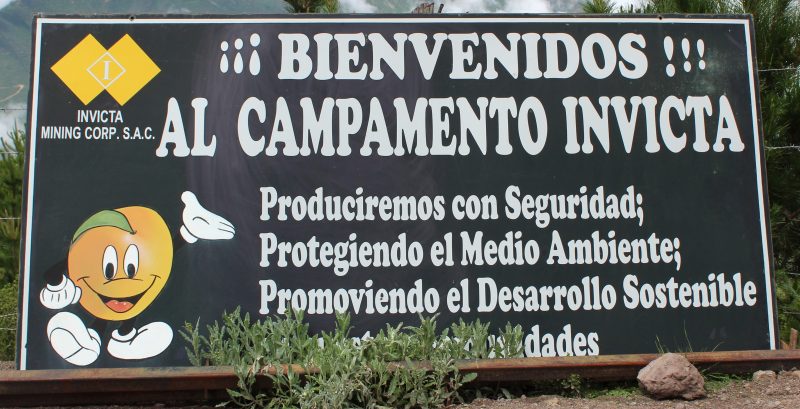
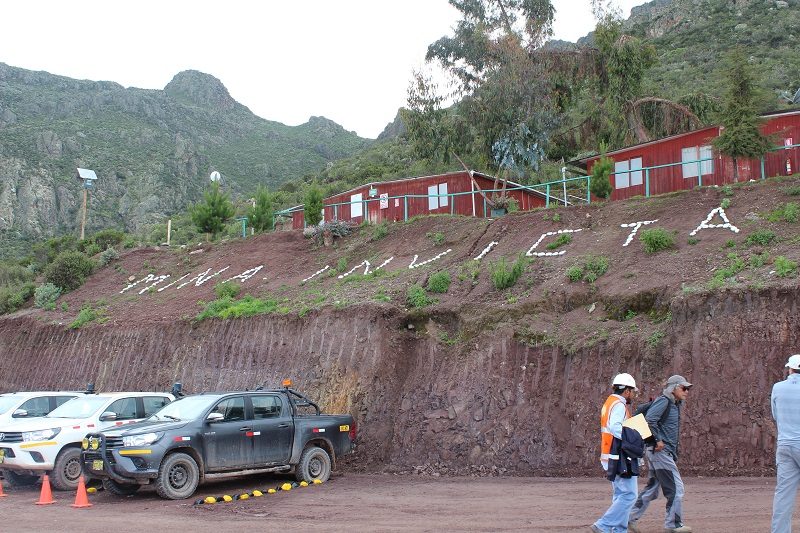
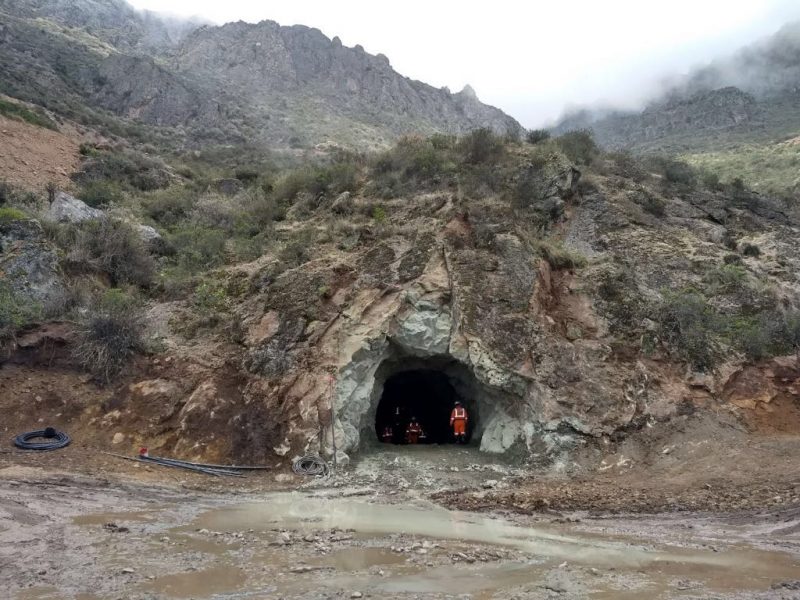
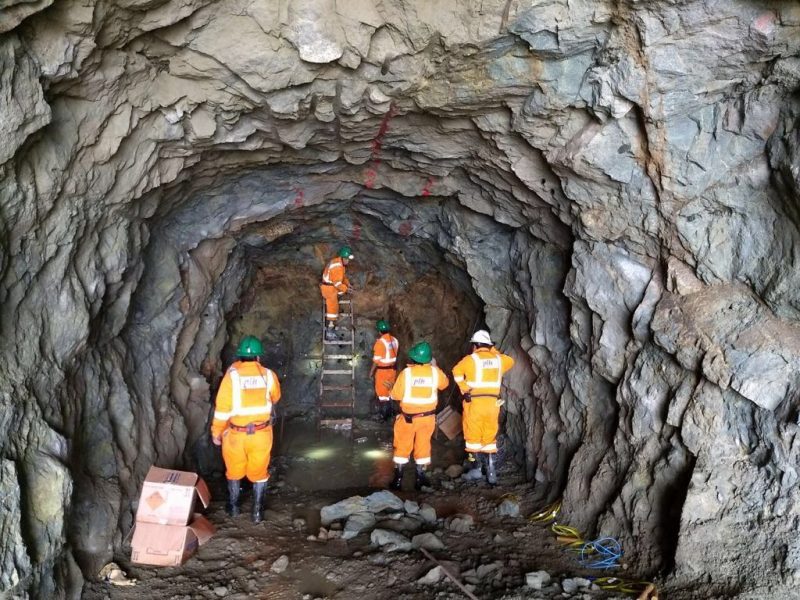
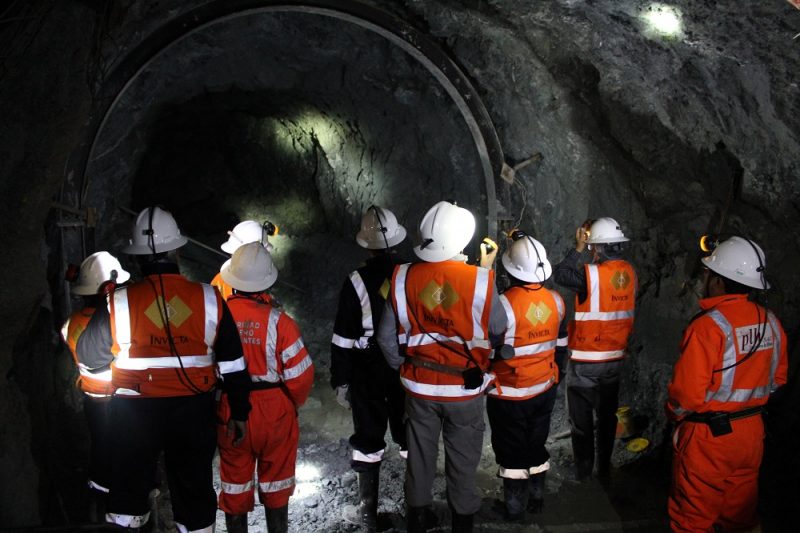
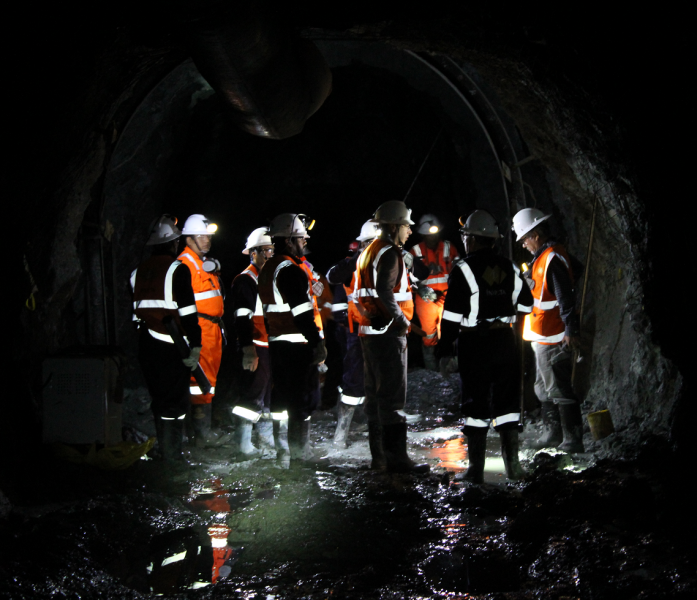
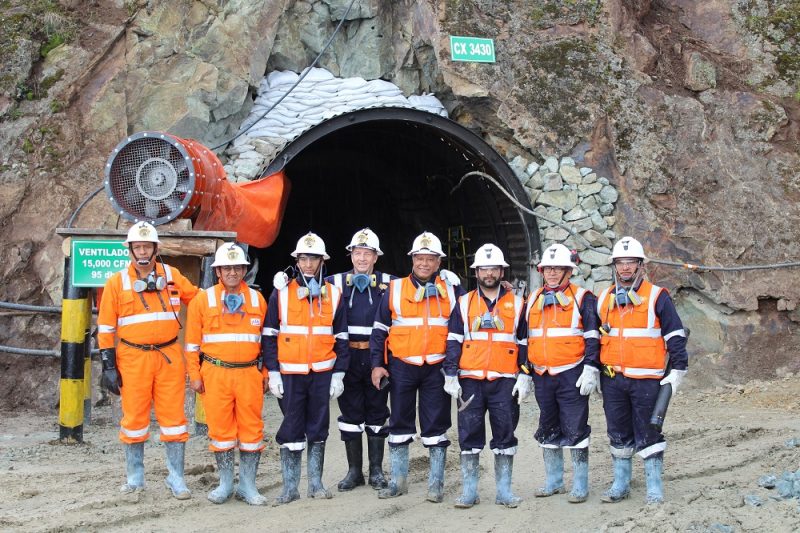

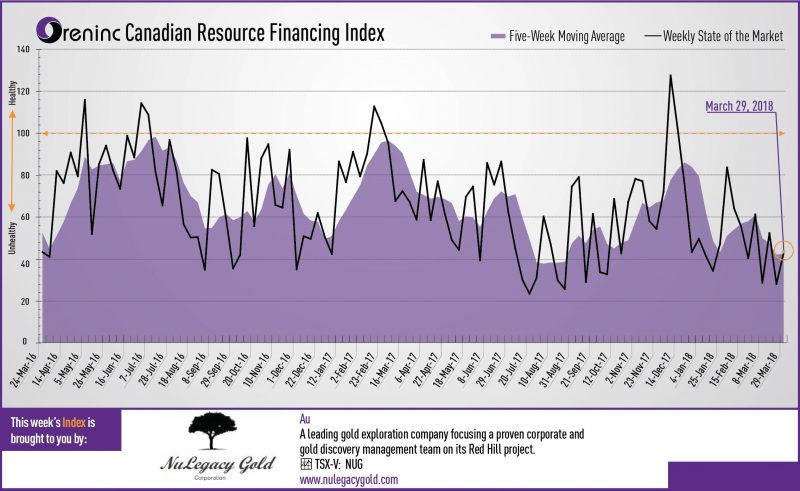
 Follow us on Twitter
 Become our facebook fan


