The Oreninc Index fell in the week ending May 25th, 2018 to 30.90 from 52.74 a week ago despite gold recovering from the prior weeks’ fall below US$1,300/oz.
Gold recovered from a brief sojourn below the US$1,300/oz level as risk returned with US president Donald Trump calling off a landmark summit with North Korean leader Kim Jong Un. The yield on the US ten-year treasury fell below 3% as suggestions from the US Federal Reserve about a temporary rise in inflation raised questions over whether there will be multiple interest rate increases this year. All good news for gold. All eyes will be on the US Federal Reserve Open Market Committee meeting on June 12-13.
On to the money: total fund raises announced fell to C$38.8 million, an eleven-week low, which included two brokered financings for C$10.8 million, a two-week low and one bought deal financing for C$7.0 million, a two-week low. The average offer size fell to C$2.9 million, a three-week low and the number of financings fell to 13, an eleven-week low.
Gold closed at US$1,309/oz from US$1,293/oz a week ago. Gold is now down 0.04% this year. The US dollar index continued to increase and closed up at 94.25 from 93.63 a week ago. The Van Eck managed GDXJ made a slight gain after a volatile week closing up at US$32.89 from US$32.84 last week. The index is down 3.63% so far in 2018. The US Global Go Gold ETF fell slightly to close at US$12.93 from US$12.98 a week ago. It is now down 0.61% so far in 2018. The HUI Arca Gold BUGS Index closed up at 180.20 from 177.75 last week. The SPDR GLD ETF continued to sell off and closed its inventory at 848.50 tonnes from 855.28 tonnes a week ago.
In other commodities, silver made a small gain on a volatile week to close up at US$16.51/oz from US$16.44/oz a week ago. Copper showed a similar pattern to close up at US$3.07/lb from US$3.06/lb last week. Oil was the main loser of the week with its price taking a dump at the end of the week to close down at US$67.88 a barrel from US$71.28 a barrel a week ago.
The Dow Jones Industrial Average returned to growth to close up at 24,753 from 24,715 last week. Canada’s S&P/TSX Composite Index showed a slight loss to close down at 16,075 from 16,162 the previous week. The S&P/TSX Venture Composite Index also closed down at 775.41 from 786.39 last week.
Summary:
Number of financings crumbled to 13, an eleven-week low.
Two brokered financings were announced this week for C$10.8m, a two-week low.
One bought-deal financing was announced this week for C$7.0m, a two-week low.
Total dollars plunged to C$38.8m, an eleven-week low.
Average offer size dropped to C$2.9m, a three-week low.
Financing Highlights
Probe Metals (TSX-V: PRB) opened a C$14 million financing.
Bought deal with Sprott Capital Partners and a syndicate of underwriters
Flow through units @ C$1.90 and non flow-through units @ C$1.15
Each unit consists of one share and half a warrant exerciseable @ C$1.45 for two years.
Underwriters option to purchase C$2.1 million in units.
Gross proceeds will fund exploration on Probe’s projects in Québec.
Closing is expected on June 19th.
Major Financing Openings:
Great Bear Resources (TSX-V: GBR) opened a C$7.83 million offering on a best efforts basis. Each unit includes half a warrant that expires in 24 months.
Probe Metals (TSX-V: PRB) opened a C$7 million offering underwritten by a syndicate led by Sprott Capital Partners on a bought deal basis. Each unit includes half a warrant that expires in 24 months. The deal is expected to close on or about June 19th.
Probe Metals (TSX-V: PRB) opened a C$7 million offering on a best efforts basis. The deal is expected to close on or about June 19th.
Para Resources (TSX-V: PBR) opened a C$6.4 million offering on a best efforts basis. Each unit includes a warrant that expires in 36 months.
Major Financing Closings:
SRG Graphite (TSX-V: SRG) closed a C$8 million offering underwritten by a syndicate led by National Bank Financial on a best efforts basis. Each unit included a warrant that expires in 12 months.
Wealth Minerals (TSX-V: WML) closed a C$6.25 million offering on a best efforts basis. Each unit included half a warrant that expires in 24 months.
Zinc One Resources (TSX-V: Z) closed a C$3.89 million offering on a best efforts basis. Each unit included half a warrant that expires in 36 months.
Alexandra Capital (TSX-V: AXC) closed a C$2.6 million offering on a best efforts basis.
About Oreinc.com:
Oreninc.com is North America’s leading provider of relevant financing information in the junior commodities space. Since 2011, the company has been keeping track of financings in the junior mining as well as oil and gas space. Logging all relevant deal and company information into its proprietary database, called the Oreninc Deal Log, Oreninc quickly became the go-to website in the mining financing space for investors, analysts, fund managers and company executives alike.
The Oreninc Deal Log keeps track of over 1,400 companies, bringing transparency to an otherwise impenetrable jungle of information. The goal is to increase the visibility of transactions and to show financings activity in a digestible format. Through its daily logging activities, Oreninc is in a position to pinpoint momentum changes in the markets, identify which commodities are trending and which projects are currently receiving funding.
Despite the insistence of some, precious metals have not been in a bull market. After a big pop at the start of 2016, the sector has trended lower. Sure, Gold has traded up towards a major breakout but Silver and the gold stocks have trended lower. When the US Dollar corrected significantly, the stock market outperformed precious metals. Does that sound like a Gold bull market to you? The moribund performance has left us wondering what could turn the tide. A quick study of Fed history with the context of current conditions is very instructive as to when Gold could begin a true bull market.
Fundamentally speaking, we know that Gold performs best when real rates are declining or will soon begin declining. That usually entails either accelerating inflation (surpassing the increase in nominal rates) or falling rates amid stable inflation. At this juncture we are leaning towards the latter as the eventual catalyst for Gold.
We were curious how Fed policy and policy changes impacted precious metals so we decided to plot the Fed Funds rate (above) along with gold stocks (middle) and Gold (bottom). We used the gold stocks (Barron’s Gold Mining Index) because they have a longer history than Gold. The vertical lines in blue mark lows in the BGMI that coincided with peaks in the Fed Funds rate (FFR) while the vertical lines in red mark lows in the BGMI that coincided with a bottom in the FFR.
Fed Funds Rate, Gold Stocks & Gold
Outside of the highly inflationary 1970s, the best bull markets in gold stocks began around the time the Fed Funds rate peaked (or in other words when the Fed ended its rate hikes). Lows in 1993, 1999 and 2016 coincided with the start of a new hiking cycle. However, unlike the lows in 1972 and 1976, inflation did not accelerate enough to drive more than a rebound.
Does that signal that gold stocks (and precious metals at large) need an end to the rate hikes?
The period from 1999 to 2001 is very instructive as there are several similarities between 1999-2000 and 2016-2017.
Like 1999, 2016 followed a nasty bear market in Gold and hard assets.
Also, the 1999 bottom in precious metals and commodities occurred around the time the Fed began a new cycle of rate hikes. Sound familiar to 2016?
As the Fed continued to hike into 2000, Gold and gold stocks trailed off but commodities were able to make higher highs until the very end of 2000. Commodities have not been quite as strong this time but they have outperformed precious metals which have trailed off since the initial rebound.
Gold and gold stocks ultimately bottomed and began spectacular rebounds around the time the Fed moved from a pause in rate hikes to rate cuts at the very start of 2001.
Unless there is an acceleration in inflation, the turning point for precious metals figures to be around the time the Fed ends its rate hikes. That would likely coincide with Gold regaining outperformance against the stock market, which we have noted as Gold’s missing link (from an intermarket perspective). Weakness in the economy and stock market would lead to an end to the rate hikes and then rate cuts. That would be the time Gold and gold stocks begin a major move higher. In the meantime we continue to focus on and accumulate the juniors that have 300% to 500% return potential. To follow our guidance and learn our favorite juniors for the balance of 2018, consider learning more about our service.
The next Fed rate hike is only about two weeks away, and another ramp-up in monthly quantitative tightening is scheduled for the end of June.
Investors are generally quite positive about the economy, but they don’t have much cash to invest. Most citizens of the Western world have meagre savings, a lot of debt, and inflation threatens to make matters worse for them. A lot worse.
Please click here now. With each passing month, more institutional money managers and influential analysts voice major concerns about inflation being the catalyst that ends the US equities bull market.
Please click here now. Double-click to enlarge. The Dow has gone nowhere since Powell became Fed chair, and I expect it to go nowhere throughout his tenure. That’s the best-case scenario. I shouldn’t mention the worst-case, because almost nobody believes that the Dow can crash in inflationary inferno. That’s not only the worst-case scenario, it’s by far the most likely one.
Investors could buy very light positions in the buy zone I’ve highlighted on this Dow chart, and sell them in my sell zone, but sand in the bull market hourglass is running out fast. It’s really a trade for gamblers. Serious investors need to be lightening up here. In my US stock market portfolios, I’m at about 30% cash, and it’s rising.
Central bank tightening is a global theme and barely out of the starting gate. It’s happening against the background of rising US government debt, corporate debt, citizen debt, and inflationary tax cuts.
Citizens and governments are generally euphoric, as they were in 2007, 1999, and 1929. The difference between now and previous peaks in euphoria is that the average citizen doesn’t have much cash to spend this time. It’s gone.
Please click here now. Double-click to enlarge. Since oil made its low in 2016, energy and tech stocks have received significant mainstream media attention.
Oil is in a danger zone now. At a bare minimum, a supposedly healthy correction is overdue. Trump wants oil lower and federal election campaigning has started in India. Indian currency and bond markets are being ravaged by high oil prices and global central bank tightening. Modi just flew to Russia and met with Putin. His meeting marked the top in oil.
I think the sell-off in oil could become more significant than most investors are prepared for, but once it’s over the arrival of significant global inflation will drive oil towards $200 a barrel.
By this time next year, gold should be challenging the $1500 area, and perhaps trading as high as $1650 – $1750. On that note, please click here now. Luis Oganes is an institutional heavyweight. He’s on the inside. When he speaks, gold bugs need to drop what they are doing and pay attention. He’s not only predicting gold will be at $1700 next year, but has the potential to surpass that juicy target price!
Few investors realize that the major mining stocks that I hold in my www.gudividends.comportfolio are up an average of 150% from that 2016 oil market low. They have blown away technology and energy stocks, and left the global stock market indexes even further behind.
Most importantly, as inflation transitions from an institutional investor concern to an outright wrecking ball, I expect this fabulous performance of the giant base metal miners to continue, with gold and silver miners shooting past all market sectors to become the ultimate market darlings.
Please click here now. Double-click to enlarge. The dollar is again in freefall against the yen, and that suggests the dollar will soon be taken to the woodshed by gold.
Investing champions like Ray Dalio are working hard to make investors understand that gold is not simply a fear trade hedge. Instead, it is the ultimate portfolio returns enhancer in good times as well as bad.
Having said that, as inflation becomes a massive theme in 2019, investors can give gold any label they want. That won’t matter. What matters is that institutional money managers will be buying it with both hands…and with three if they had an extra hand!
Please click here now. Double-click to enlarge. There’s nothing more glorious than a great gold price rally, and a big one is getting underway now.
Note the technical perfection being showcased by the “queen of assets” on this short-term chart. A symmetrical inverse head and shoulders bottom breakout was followed by a picture-perfect pullback to the neckline, and now, as I predicted, the queen of assets is following the yen and beating on the dollar like King Kong beating on a tin can.
My next target is $1327, and I think gold can now reach up and touch that price with very little effort. It’s a great place for short term profit booking and it should happen ahead of the key June 13 Fed meet. After that pause and likely right shoulder low, gold should blast through $1375, and make a medium-term beeline towards $1450.
Please click here now. China just launched an important physical metals trading platform yesterday. Attention all silver bugs: Trading begins with base metals, but will quickly expand to include… silver bullion!
I’ve referred to a future dominated by China and India being the gold and silver “bull era”. A key part of that thesis involves COMEX price discovery for gold and silver becoming vastly more related to physical demand versus physical supply.
Price discovery has been dominated in the past by Western hedge funds gambling on gold-irrelevant nonsense from “Fed speakers” and “gold doesn’t pay interest” mainstream media propaganda. Bull era price discovery is already happening with gold, and silver is next on deck. Investors can write that down and take it to the bank. The silver bullion bank!
Please click here now. Double-click to enlarge this superb GDX chart. Many of the component stocks are in roaring uptrends. GDX itself has been coiling sideways since mid-April in a bullish drift. That should be resolved with a significant rally that stuns most analysts with its intensity.
The financial system and QE-oriented gold fear trade is alive but on the back burner. There’s a new generation of gold bugs in the Western gold community who understand that inflation is coming and will be here to stay. The love trade and the inflation trade will form the backbone of the bull era. Eager investors around the world who know this is true are now aggressively accumulating portfolios of gold stocks, in preparation for decades of upside fun!
Thanks!
Cheers
St
Stewart Thomson
Graceland Updates
Stewart Thomson is a retired Merrill Lynch broker. Stewart writes the Graceland Updates daily between 4am-7am. They are sent out around 8am-9am. The newsletter is attractively priced and the format is a unique numbered point form. Giving clarity of each point and saving valuable reading time.
Risks, Disclaimers, Legal
Stewart Thomson is no longer an investment advisor. The information provided by Stewart and Graceland Updates is for general information purposes only. Before taking any action on any investment, it is imperative that you consult with multiple properly licensed, experienced and qualified investment advisors and get numerous opinions before taking any action. Your minimum risk on any investment in the world is: 100% loss of all your money. You may be taking or preparing to take leveraged positions in investments and not know it, exposing yourself to unlimited risks. This is highly concerning if you are an investor in any derivatives products. There is an approx $700 trillion OTC Derivatives Iceberg with a tiny portion written off officially. The bottom line:
Are You Prepared?
Over the last month, I’ve received numerous questions pertaining to the direction of the gold price. The fact is, I don’t have a crystal ball and, while I believe we will see higher gold prices in the future, I have no idea when, and really, I don’t care.
Why? Simply, I don’t invest in junior mining companies because I believe the price of gold is going to go up. I believe you invest in junior mining companies because you see value creation via discovery, or you see a clear path in the development of a project into a future mine.
There are many ways to make money in the junior resource sector, but for me, it’s a process which is linked to finding quality – the best people, who pick the best projects and execute well thought-out plans to achieve a specific goal.
In particular, discovery pays in any part of the market cycle and, therefore, while the risks associated with exploration are HUGE, I think it’s prudent to invest in the highest quality gold exploration companies the market has to offer.
Today, I would like to bring your attention to Klondike Gold Corp., a gold exploration company that is cashed up and ready to execute a 5000m drill program in the heart of the Yukon.
Let’s take a look!
Klondike Gold Corp. (KG: TSXV)
MCap – $24 million (at the time of writing)
Shares – 95 million
Fully Diluted – 120 million
Cash – $7 million
Ownership:
Frank Giustra – 14%
Eric Sprott – 13%
Key Investors – 10%
Insiders – 11%
NOTE: As you can see from the ownership breakdown, Klondike is tightly held by a small number of hands. Specifically, Canadian billionaires, Frank Giustra and Eric Sprott, who collectively control almost a third of the company’s outstanding shares and, I think, speaks to the upside potential that is seen in Klondike Gold and its district sized land package in the heart of the Yukon.
Klondike Gold’s Leadership
Klondike Gold Corp. is led by CEO, Peter Tallman, who is a geologist by trade and has over 35 years of experience in the mining industry.
During a conversation with Tallman, he related his start in the mining sector back to when he was in his early teens and helped build a log cabin just south of Algonquin Park, located in central Ontario. The key to this experience didn’t have anything to do with building or geology, but was important because Tallman became an avid and skilled canoeist, which would later be a key component in him attaining his first geology job outside of university.
After completing his geology degree at the University of Western Ontario, Tallman’s first job was with Selco (later BP-Selco), where he was hired to prospect for diamonds in northern Ontario. A key prerequisite for this job was proficient canoeing skills, which Tallman had in spades, and so he got his start in the mining business. Additionally, with Selco, he moved to Newfoundland where, while working in a remote corner of the province, chipped the discovery outcrop of what later became the Hope Brook gold mine.
Tallman has worked for a number of different companies in senior roles, over the course of his career, including Noranda Exploration, Prime Equities International (Murray Pezim), and Messina Minerals, just to name a few. Each of these experiences over the course of the last 35+ years has prepared Tallman well for leading Klondike Gold in their mission to discover an economic gold deposit in the Klondike.
The Klondike team is rounded out by CFO, Jessica Van Den Akker, and Board of Director members, Gordon Keep (CEO of Fiore Management & Advisory Corp.), John Pallot, Steve Brunelle and Tara Christie. The team has recently expanded the team with the addition of Ian Perry, VP Exploration who has extensive experience managing advanced exploration projects towards development stage.
Yukon
As the company name suggests, Klondike Gold is focused on gold exploration in Canada’s Yukon Territory. For those who may not be familiar with Canada’s geography, the Yukon is located north of British Columbia and it shares its western border with Alaska.
Klondike Gold Regional Claim Map
Klondike Gold owns 100% of its 2,942 contiguous claims, totaling 557 square kilometers, which sit in close proximity to Dawson City. Dawson City was built to support gold miners during the Klondike Gold Rush of the 1890s and hosts the major infrastructure needed for the exploration and development of mining projects, such as an airport, access to supplies and electrical infrastructure.
13th in the World for Mining Investment Attractiveness – Fraser Institute Ranking
The Yukon is a premier jurisdiction for mining and attained a score of 79.67, or 13th in the world, for mining investment attractiveness, according to the Fraser Institute’s 2018 rankings. The Fraser Institute uses a number of criteria in evaluating a jurisdiction, such as political stability, mining law, taxation and, arguably the most important, mineral potential.
The Yukon has well developed infrastructure, including more than 4,800km of all-weather roads, airports, power, Internet and cell phone service. Additionally, for companies that require international export of their concentrates, deep sea ocean ports are accessible across the Yukon’s western border in Alaska.
Yukon Mining Alliance
Uniquely, to my knowledge, many of the junior and major mining companies with projects in the Yukon have formed the Yukon Mining Alliance (YMA) with the Yukon Provincial Government and the Canadian Northern Economic Development Agency.
The YMA’s mandate is to,
“promote Yukon’s competitive advantages as a top mineral investment jurisdiction and its member companies and their Yukon-based project.” ~ YMA
In my opinion, this is a huge advantage of investing in companies with projects in the Yukon, as clearly, the marketing and promotion of mining within the Territory’s borders is a major priority. Bottom line, narrative plays a big role in the success of junior mining companies, and with the added help of the YMA, Yukon-based companies have a distinct advantage working together to promote the Yukon mining jurisdiction narrative.
Personally, I have seen the YMA presence at a couple of the top mining conferences in Canada, such as PDAC and Cambridge’s Vancouver Resource Investment Conference (VRIC). The YMA is putting the Yukon on the map for interested resource investors which, I believe, will pay off in spades as we move into the next leg of the bull market.
Klondike Gold Rush
The Klondike Gold Rush began in August of 1896, as three prospectors, George Carmack, Jim Mason and Dawson Charlie, discovered gold in what they referred to as “Rabbit” Creek, or what is now referred to as Bonanza Creek. With the discovery and the rush to stake their claim, word quickly spread of their discovery, and so spurred a historic gold rush in Canada’s Yukon Territory and the United States’ Alaska.
It’s estimated that the Klondike Gold Rush attracted 100,000 people from all walks of life, testing their luck against the odds to find their fortune. Many of the new American prospectors found their way north via ships boarded in Seattle. Former ports, such as Dyea, Alaska, were accessible at high tide and allowed prospectors to begin the lengthy trip north toward the center of the Gold Rush, Dawson City, which is roughly 700km north.
Unfortunately, for the vast majority of newly minted prospectors, their aspiration of discovering a fortune never happened; if it wasn’t the weather and the long trip to the prospective gold claims, it was the exorbitant costs that came with exploring and living in the north. In many of the articles I read while researching the Klondike Gold Rush, many estimated costs being 10 times higher than what many of the people would have experienced in their former lives, living in Toronto, New York or Chicago.
The Klondike Gold Rush is estimated to have produced $29 million in gold over its 3 year span. Additionally, the Yukon Geological Survey estimates that a total of 20 million ounces of gold has been extracted from the Klondike goldfields since 1896. Gold mining can be credited with spurring the development of much of Canada’s and America’s northern most territories and states. In my opinion, the Yukon holds tremendous mineral potential and will only increase its prestige within the mining community.
Tr’ondëk Hwëch’in First Nation
Klondike Gold’s claims lie within the Tr’ondëk Hwëch’in First Nation lands, which are in the Dawson City area. To note, Goldcorp’s Coffee Gold Project, which was acquired from Kaminak Gold Corp, and sits 130km south of Dawson City, is also within the Tr’ondëk Hwëch’in First Nation lands.
Tr’ondëk Hwëch’in First Nation is based in Dawson City and consists of roughly 1,100 Hän-speaking people. The First Nation is governed by an elected Chief and four councillors, who take direction from the Elder’s Council, a group of Tr’ondëk Hwëch’in people, aged 55 and over. The governing body oversees all agreements affecting the First Nation, including finance, health, social programs, housing and natural resources.
In recent news, the Tr’ondëk Hwëch’in First Nation signed a collaboration agreement with Goldcorp over the development of their Coffee Gold Project. In my opinion, the success of this negotiation was imperative to any of the mining companies exploring or developing within the Tr’ondëk Hwëch’in lands, giving each company a glimpse of what a future deal with them might look like, if they are able to discover an economic deposit or move forward with the development of what they already have.
Klondike Gold Project
As stated earlier, the Klondike has a rich history in gold mining, as 20 million ounces of placer gold have been mined there. The question that Tallman and his team at Klondike Gold are trying to answer is, where did the placer gold come from? When this question is finally answered, there’s a good possibility that the discovery of an economic gold deposit will follow soon thereafter.
Thus, since taking the helm of Klondike Gold, Tallman has set out to determine if the fault system, which he identified in his original desktop review of the company, plays a role in controlling gold mineralization. Specifically, in our discussion of the property, Tallman refers to the Rabbit Creek Thrust Fault, which stretches roughly 55 km from the Lone Star target to the Gold Run target.
Tallman believes that this is a very important fault and, ultimately, is the key driver in the gold mineralizing event. As you can see in the image above, secondary fault systems, which Tallman refers to as horse tail faults, have been identified around the outer limits of the Rabbit Creek Thrust Fault, and are the areas of focus for Klondike’s upcoming drill program.
What I found most interesting about our conversation regarding the geology of the targets is how they resemble Goldcorp’s, formerly Kaminak Gold’s, Coffee Gold Project geology. Examining a few of Klondike’s slides from their latest Corporate Presentation, they outline the similarities in geological structures.
Klondike Gold Corporation Presentation – Slide 16
In my opinion, the identification of these similarities is a HUGE plus for Tallman and his team, as they are using the knowledge and processes laid out by Kaminak to influence their plans for exploration on their Lone Star and Gold Run targets. Not only does this make the exploration more efficient, but also speaks to the potential of what Klondike may have in terms of gold mineralization.
While it’s important to understand downside risk before investing in a junior mining company, it’s also very important to understand the upside potential. Therefore, I think it’s safe to say that the upside potential for Klondike can be found in a comparison to the Coffee Gold Project, which has 2.16 million ounces of gold reserves (Proven and Probable) and an additional 2 million ounces of gold resources (Indicated and Inferred). To note, Goldcorp paid Kaminak roughly $100/oz in ground for Coffee. Given Klondike’s current MCAP, the upside potential looks very good.
2018 Exploration
Klondike’s plan for its 2018 exploration program has three main components:
Airborne Mapping – Complete 2500 to 3000 line kilometers of airborne surveys across the entire 557 square kilometer property. In my discussion with Tallman, he stated a few times how inadequate the old government geological maps of the property are. Accurate maps of the property are integral for efficient drill target gathering.
Soil Sampling – Groundtruth Exploration has been hired to complete 5000 soil samples and complete the ortho-photographic modelling footage via drone. Airborne mapping overlain with soil sampling data will help the Klondike team narrow down their focus for the diamond drill program.
Drill Program – 50 to 70 holes will be drilled for an estimated total of 5000 meters. This is a preliminary drilling budget, which Tallman suggests could be expanded, depending on results. Drilling on Klondike’s Lone Star target should begin very soon, with drilling on the Nugget and Gold Run targets to follow.
PUSH: Watch for drill results in the weeks ahead, as Klondike should have steady news flow of drill results over the next couple of months.
Metallurgical Work
Additionally, Tallman mentioned that they will be drilling a few holes of HQ core, which has a diameter of 96mm, which is almost 20mm larger than that standard NQ or CHD 76 core which is typically used in exploration drilling. Why the larger core size? Klondike will be using the larger core sample for the beginnings of a metallurgical study, which should shed some light onto economic viability of the Klondike mineralization.
Concluding Remarks
In my opinion, Klondike Gold has the basis for success when it comes to gold exploration:
Experienced management team which is supported by smart money, via billionaire investors, Frank Giustra and Eric Sprott.
District scale land package of 557 square kilometers with the premier mining jurisdiction that is the Yukon. NOTE: The Yukon ranks 13th in the world in mining investment attractiveness as per the Fraser Institute’s 2018 Survey.
The Klondike Goldfields have produced 20 million ounces of placer gold over their history.
Extensive 2018 exploration program, which includes airborne mapping, soil samplings and a 5000m drill program. High news flow throughout the summer.
Exploration program is supported by a robust plan which is rooted in the geological similarities between Klondike’s target geology and Goldcorp’s 4 Moz Coffee Gold Project, which is just south of Dawson City.
CASH – $7 million
Gold exploration is a risky endeavour, one that is fraught with more failure than success. In Klondike Gold’s case, failure is a very real possibility, however, I believe with the strengths outlined above, Klondike has positioned themselves to have the best possible probability of success in discovering economic gold as we as investors could hope. Therefore, I’m a buyer of Klondike Gold and am looking forward to a summer of what I think will be good news flow and share price appreciation!
Don’t want to miss a new investment idea, interview or financial product review? Become a Junior Stock Review VIP now – it’s FREE!
Until next time,
Brian Leni P.Eng
Founder – Junior Stock Review
Disclaimer: The following is not an investment recommendation, it is an investment idea. I am not a certified investment professional, nor do I know you and your individual investment needs. Please perform your own due diligence to decide whether this is a company and sector that is best suited for your personal investment criteria. I do own shares in Klondike Gold Corp. All Klondike Gold Corp. analytics were taken from their website and press release. Klondike Gold Corp. is a Sponsor of Junior Stock Review.
Northern Empire – The Sterling Gold Project Site Visit
On April 6th, I had the opportunity to visit Northern Empire’s Sterling Gold Project, located north-west of Las Vegas, Nevada. My visit was great and really gave me a good perspective of the Sterling Gold Project’s scale and its potential for further resource expansion.
In particular, the Crown Block stood out as having great exploration potential, as not only is this area a focus for Northern Empire, but also has drawn a lot of attention from Corvus Gold, whose Mother Lode Open Pit is completely surrounded by Northern Empire.
In all, I left the site visit very optimistic that Northern Empire’s 2018 drill program should shed a lot of light onto the Sterling Gold Project’s potential and am eagerly awaiting news flow!
Las Vegas
After landing in Vegas, I hopped in an Uber to get to my hotel. As this was my first visit to the area, I was mesmerized by the bright lights, massive celebrity advertisements and sheer size of the Las Vegas Strip.
View from the bridge connecting the Bellagio and Ballys
Las Vegas truly is the center of the universe when it comes to marketing, because the corporations that reside here clearly understand human behaviour and how to manipulate it. Everything about the strip is designed to put a smile on your face while simultaneously extracting the maximum amount of money from your wallet.
Along the strip, a Starbuck’s tall Americano is $5.50 USD, a tall can (493ml) of domestic beer $10.00 USD, and a ‘big gulp’ slushy with rum or tequila will run you $30 USD. These prices remind me of those typically reserved for sporting events or concerts, which may be a good comparison for the confines of the Vegas Strip.
A view of New York New York from my hotel parking lot
While my comments here may seem negative to some, they aren’t meant to be. I have a high regard for the marketing expertise that has created this ‘wonderland.’
View of the Bellagio
Bottom-line, even if you aren’t a gambler, Las Vegas is a place that everyone should visit at some point in their lives. It truly is unique in terms of what it has to offer.
Sterling Gold Project
The day of the site visit started early, as we met in the lobby of the hotel at about 6:30 am. I, however, hadn’t adjusted to the 3 hour time change and was up some time before. One thing about starting your day at 4 am in Vegas is that you aren’t alone. That said, I’m sure most of the people I encountered at that time of the morning had yet to go to bed!
From our hotel, it was about a 2 hour drive up the I95 to the Sterling Gold Project. Given the size of our group, we split up into 3 vehicles. In the SUV with me was Executive Chairman, Doug Hurst, and The National Investor newsletter Editor/Publisher, Chris Temple. Both men are very experienced in the mining and investment worlds and shared several, great anecdotal stories about their experiences and lessons they’ve learned from the sector.
Drones and Area 51
Roughly half way to our destination, we drove past a U.S. Air Force base which, famously or infamously, is the site of at least a portion of the U.S. drone fleet.
A drone flying in the Sterling Gold Project Vicinity
One of the most intriguing, yet mysterious, sites along the way was Area 51. Of course, you can’t actually see Area 51, but many of the businesses along the highway have names inspired by this mysterious U.S. Air Force base. I’m by no means an expert on the lore surrounding Area 51, but after spending the day at the Sterling Gold Project, you very quickly become aware of a U.S. military presence.
2 (small) Helicopters in the distance
Walker Lane Trend
The Walker Lane Trend extends north-west from Las Vegas to Reno, running parallel to the Nevada and California state borders. While not as famous as the Carlin or Battle Mountain-Eureka Trends in the northern portion of the state, the Walker Lane Trend has a very rich gold mining history.
It’s estimated that 50 million ounces of gold have been discovered within the Walker Lane Trend, with the Comstock Lode Mine located near Reno being, arguably, the most famous. Additionally, the Round Mountain and Bullfrog Mines are other examples of gold producing mines within the trend.
Interestingly, Barrick’s past producing 2.3 million ounce Bullfrog Open Pit Gold Mine can be seen from Northern Empire’s Crown Block. I was able to snap a photo, while standing at the top of the Secret Pass Open Pit – see below.
View from the Secret Pass Open Pit – Barrick’s Bullfrog Mine
Satellite Image of the Crown Block
As you can see in the satellite image above, the Bullfrog Detachment Fault and the Fluorspar Canyon Detachment Fault run in a similar east-west fashion, and lay host to the past producing open pit mines. Also, the Faults divide the tertiary volcanic rocks in the north and the sedimentary rocks in the south.
Sterling Mine
The site visit began at Northern Empire’s permitted Sterling Mine, which is in the southern region of the property. After completing our site safety orientation and collecting our PPE, we hit the road, making our first stop at the heap leach pads.
Sterling’s Main Entrance Road, Looking away from the Sterling Mine
Sterling’s Main Entrance Road, Looking at the Sterling Mine
Currently, there’s one active leach pad; at the time of our visit, it was being turned over by the bulldozer featured in the photo below. The ore is mixed on the pad to help oxygenate the pile and break up any fluid channels that formed over the last cycle. Ultimately, this leads to higher recoveries in the processing plant. These are simple smart things that the Company does to improve efficiency show the respect that they treat shareholder capital. Also to note, the existing facilities and processing plant appear to be in great shape, which is a real plus when it comes time to begin production.
Active Leach Pad
We then moved into the Sterling Mine open pit area, more specifically up onto the Water Tank Hill, which gives a great vantage point for viewing all three open pits.
Northern Empire CEO, Mike Allen, on Top of Water Tank Hill
While standing on Water Tank Hill, CEO, Mike Allen, took the opportunity to explain how they will attempt to expand the Sterling Mine resource. As explained in my introductory article, the company will follow up on recent high-grade drill holes that sit on the pit shell edge, as seen in the satellite photo below.
Sterling Gold Project Mineralization – Core Shack
Next, we headed back to the main offices for lunch and a look at the core shack. As with all Carlin-Style gold, the core doesn’t possess any eye-catching visible flakes or nuggets, but instead it is the orange oxidized material (the more broken up the better) which should catch your eye, as it is gold bearing. The samples, however, were still very interesting as the fluorite and calcite mineralization found on the property can be seen in the core samples. In the photo below, for instance, the purple mineral is fluorite.
Core Sample with Purple Mineral Fluorite
In fact, the Sterling property boundaries not only surround Corvus Gold’s Mother Lode Project, but also historic fluorite and mercury mines, which can be seen in the property map below. Interestingly, it was mentioned during the visit that the fluorite mine was hampered by gold contamination, what a wonderful issue to have!
Sterling Gold Project
Sterling Mine Site Manager Chuck Stevens , who worked previously in the Sterling underground mine, showed me a few excellent calcite samples in his office and, additionally, pointed out the massive calcite sample sitting outside the geologist’s office trailer. Also, Executive Chairman, Doug Hurst, pointed out a couple of cinder cones which lie just east of the property; another example of the geological diversity of the property and its surrounding area. The immediate area around Northern Empire’s Sterling Project features fluorite, decorative rock, precious metals and marble mines demonstrating both the endowment of the area, the impact of mining on the local economy, and the ability to permit both large and small mines effectively.
NOTE: A Cinder Cone is formed by volcanic eruptions of mafic / intermediate lavas, which collect to build a cone around a volcanic vent. On the east side of I95, on your way up to the Sterling Gold Project from Las Vegas, a cinder cone is currently being mined for decorative stone used in landscaping.
The Crown Block
Yours truly with the Secret Pass Open Pit in the background
Heading back out onto the I95, we then headed north toward the town of Beatty, to the Crown Block. As you will remember from my introductory article, the Crown Block is made up of 4 main targets: Daisy, Secret Pass, Shear Zone and SNA, all of which are located along the Fluorspar Canyon Detachment Fault.
Our first two stops were at Daisy and Secret Pass deposits, where Senior Geologist, Ron Kieckbusch, and Exploration Manager, Rich Histed, discussed the geology of the area, the work they completed in 2017, and where they were headed in 2018.
Geology of Crown Block
South of the fluorspar detachment fault, mapping has defined an asymmetric fold-thrust belt in the sediment package, with a northwest vergence and northeast plunge likely of Mississippian age (327-290 Ma).
It’s my understanding that the folding of the sediment package generated perpendicular faults, which were later made larger during a caldera collapse. For those who aren’t familiar, a caldera is a large volcanic crater, which can be formed by either an explosive volcanic eruption or the collapse of surface rock into an empty magma chamber. The now larger faults become easier conduits for fluid flow, thus explaining the mineralizing event.
Geological Mapping and Geochemical Sampling
Currently, 30% of the 141 square-kilometer property package has been geologically mapped and geochemically sampled, with the Crown Block being the primary focus. Mapping and sampling is a very efficient and cheap way of acquiring drill targets. In total, 580 rock chip samples have been taken, returning grades within a range of undetectable to a high of 13.85 g/t gold, and 34 samples returned greater than a 1.0 g/t gold.
As stated, the mapping and sampling within the Crown Block has identified new exploration targets, which were noted in the April 25th news release and can be found in the image above.
Road Zone – located north of the Daisy Deposit and features several up-dip surface samples of greater than 1.0 g/t gold, which indicates potential for shallow mineralization.
Gold Ace Fault – located south and up-dip of the Daisy Deposit and features a large undrilled area of high-grade surface samples, including a high of 13.85 g/t gold.
Crowell Extension – located east of the Daisy Deposit and features reported gold grades of up to 7.0 g/t from the historic Crowell fluorite mine. The Crowell Extension target has a strike length of roughly 800 meters.
Radio Tower – Anomalous surface geochemistry to the south of the Secret Pass pit indicate a possible target at depth.
Secret Pass East – As the name suggests, this target lays on the under-explored eastern portion of the large Secret Pass Deposit. Surface sampling has returned up to 5.0 g/t gold and represents a potential strike length of roughly 1200 meters.
Ronko Jasperoids – Located south of the SNA, undrilled Jasperoids returned sample values of up to 2.0 g/t at surface. Jasperoids are excellent host rocks for mineralization and represent a strike length of roughly 500 meters.
Range Front Fault Zone – Range front fault systems have, historically, laid host to many of the largest Carlin-Style gold deposits in Nevada. The range front fault, which runs along the eastern portion of the land package, is sizeable and untested, which has the potential to host a large deposit. Historic sampling returned values upwards of 5.0 g/t gold at surface on secondary structures. It should be noted that range front structures host 3 deposits on the eastern side of the Bare Mountain Range; Motherlode, SNA and the 144 Zone.
In my opinion, there is a TON of potential here, as Northern Empire begins to expand and fill the gaps between these historic deposits. As seen in the image above, it looks like one big shallow gold system, with good grade. In the gold mining world, it doesn’t get much better!
With the identification of these high prospective targets, Northern Empire is expanding their current drill program to 18,000 meters and have already begun the permitting process for a larger 50,000 meter program, which will focus on expanding the Crown Block resource and testing these new regional targets.
Exploration Drill Results – Daisy and Secret Pass
Step-out drill results from the Daisy and Secret Pass, released May 2nd, not only returned good grades and widths, but confirm that both deposits are open for expansion. The results are highlighted by,
The highlighted D18-001 step-out hole encountered mineralization 53.35 meters down the hole, which was shallower than expected. Additionally, mineralization was encountered at the base of the Cararra formation, which suggests that there is a possibility for further mineralization to be discovered lower in the stratigraphic sequence. In all, the drill results confirm that the Daisy Deposit remains open up-dip for further expansion. Please see the news release for complete details.
Secret Pass Drilling
The highlighted SP18-017 drill hole stepped out 200m west from the known Secret Pass Deposit and 196.9 meters deep encountered mineralization grading 0.95 g/t gold over 38.1 meters. To note, this hole was terminated before losing mineralization. Northern Empire states within the news release that they intend on re-drilling the hole to better understand the full extent of what has been discovered. This step-out is a great result as it confirms that the Secret Pass Deposit mineralization is open to the west.
Corvus Gold
The last stop of the day was at the SNA Deposit, in the north-east corner of the property. As we approached the SNA Deposit, we first drove past Corvus Gold’s Mother Lode Open Pit, which is completely encompassed by Northern Empire’s Crown Block.
Corvus Gold’s Mother Lode Open Pit
For those who are not familiar, the Mother Lode Deposit has been a major focus for Corvus over the last year, with 10,000m of drilling in 2017 and another 13,000m of drilling planned for the first half of 2018. For those that may not be familiar, Corvus has a MCAP around $300 million, which is largely based on the drilling success at Mother Lode. I find this interesting as a Northern Empire shareholder, because I’m intrigued by the amount of drilling that’s occurring around the existing open pit and, specifically, how that mineralization may extend out toward, or connecting to, the SNA Deposit.
Examining the satellite image below, you can see the concentration of Corvus drill holes not only in the vicinity of the open pit but, more importantly, along the claim boundary.
This is a fairly obvious observation, one that didn’t get past Northern Empire management; while viewing the SNA Deposit during our visit, drilling was taking place along the Corvus claim boundary. In news released April 17th, Northern Empire confirmed that the Mother Lode mineralization does extend south towards the SNA deposit and have drilled significant gold grades from structures which cut favourable host rock for Carlin-type gold mineralization beneath the historic Telluride Mercury Mine.
Northern Empire Drilling beside Mother Lode Open Pit
Concluding Remarks
As I’ve said in the past, site visits are an excellent way for you to bring your due diligence to the next level, and nothing beats seeing the property and interacting with the people in person. My visit to the Sterling Gold Project was no different, as it gave me a better view of the upside potential of the property and the type of people managing the company.
Just to recap, here’s a list of what I see as the strengths for Northern Empire:
Good management team with extensive experience exploring and developing gold projects in Nevada.
The Fraser Institute ranks Nevada 3rd in the world for Mining Investment Attractiveness.
Northern Empire is in possession of all the necessary production permits to restart the Sterling Mine.
The Sterling Mine potential production scenario should be low-cost, as the Carlin Style gold mineralization will be mined from an open pit and is amenable to heap-leaching.
Exploration Potential – The Crown Block, especially, holds a lot of resource expansion potential as it appears all of the existing deposits have the potential to be larger; potentially, one large, shallow and good grade gold system.
18,000 meter drill program underway and a larger 50,000 meter drill program on the horizon as it is currently being permitted!
Existing inferred global resource of 985,000 ounces of gold at 1.29 g/t.
CASH – $16 million!!
I believe there’s a lot of upside potential for Northern Empire if they’re able to execute their plan of expanding the resource at both the Sterling Mine and the Crown Block. I look forward to good news flow over the coming months as this story really begins to come together on the back of their 18,000m drill program.
Don’t want to miss a new investment idea, interview or financial product review? Become a Junior Stock Review VIP now – it’s FREE!
Until next time,
Brian Leni P.Eng
Founder – Junior Stock Review
Disclaimer: The following is not an investment recommendation, it is an investment idea. I am not a certified investment professional, nor do I know you and your individual investment needs. Please perform your own due diligence to decide whether this is a company and sector that is best suited for your personal investment criteria. I do own shares in Northern Empire Resources. All Northern Empire Resources’ analytics were taken from their website and press release. Northern Empire Resources is a Sponsor of Junior Stock Review.
Mr. Wonderful, Kevin O’Leary, and Frank Holmes recently took different side the gold (bullion) vs. gold stocks. Gold and gold stocks are two different asset classes and saying which one is better. One is a commodity (Gold) and the other is equity (Gold Stocks). It’s like comparing multiple championships winning athletes, Sydney Crosby (NHL), Lebron James (NBA), and Tom Brady (Football) and saying one of these players is the best athlete of all-time. Gold and gold stocks offer two different purposes for an investor’s portfolio.
WHY OWN GOLD BULLION?
You own gold in bullion form and keep it in storage as an insurance policyfor your other financial assets. It acts as a counterbalance against other assets in your portfolio. Investors flock to gold as a “safe-haven” asset, just like cash because they aren’t willing to take on risk. Gold is like a cash position in your portfolio, you don’t get paid to own it. Think of Gold as another currency (cash position) that you have exposure too, and you can use it as a counterbalance against your riskier assets. If gold isn’t important, then why do Central Banks own it on their balance sheet? For investors, it’s a way of being your own Central Bank.
“I have a 5% weighting in gold. The GLD and physical bullion. Which I store and pay for the storage. The value of the commodity is whatever it is every day. Kevin O’Leary (Kitco)
Kevin O’Leary isn’t the only one who has gold as a counterbalance in their portfolio. Here is what Ray Dalio of Bridgewater thinks about gold:
“We can also say that if… things go badly, it would seem that gold (more than other safe haven assets like the dollar, yen, and treasuries) would benefit, so if you don’t have 5% – 10% of your assets in gold as a hedge, we’d suggest that you relook at this.” – Ray Dalio
Egyptian billionaire Naguib Sawiris investing half his net worth in gold
“And people also tend to go to gold during crises and we are full of crises right now. Look at the Middle East and the rest of the world and Mr. Trump doesn’t help.” (Marketwatch)
JP Morgan
“Underweight equities, long duration, long gold, and long the yen as Fed policy slows the economy and real rates collapse.” JP Morgan via ZH
GOLD TRADING LIKE A COMMODITY
After the dollar-gold window was broken in the 1970’s gold trades more like a commodity because it isn’t pegged to the US dollar. That is why gold, has better matched the cycle of the commodity booms since that time. Will it be treated again likebefore? We think that “Yes, gold will more than likely be pegged in some form to a currency at some point in the future”. Will it be more like past gold standards? Maybe, history repeats, just not exactly the same as before. It could be in a digital format because that is the way the world is going. We aren’t sure. But we follow the worldview that there are cycles and history repeats. We think that the mantra, “This could never happen” means it can happen again and probably will happen, just in a different twist. Everything has a time when it gets center stage. Gold standards will come, and then they will go. For now gold trades more like a commodity.
GOLD STOCKS AND CYCLE
When O’Leary says gold miners are horrible investments is a bit of hype and bluster.
O’Leary:“The history of mining has been abysmal… I don’t need to have a manager in the middle screwing up his capital cost allowance, not controlling his costs. (Kitco)
This is like saying all technology stocks are profitable like Apple.
The gold sector has one major commonality with every other sector. They are all cyclical! The question is, what cycle do they follow? Gold mining stocks and gold are part of the larger commodity cycle. If you understand the cycle, you understand that there is a time to buy and a time to sell. Gold miners generate an incredible amount of free cash flow once the sector has bottomed. Why? Management teams are forced to really look at their costs and focus on generating profits because investors demand it. Just like after the Dotcom bust, investors started to demand revenue, not just user growth. Let me say that again…Revenue! Profits were demanded as well.
Kevin O’Leary is right when he says “More and more investors are thinking the way I do. They are thinking about return of capital.”
But you are seeing it some darling tech stocks right now, focusing exclusively on growth with disregard for profits.
Look at Wayfair, an e-commerce company sells home goods online. Revenues have increased by more than 4X, yet $0 in profits over the past three years.
During the last gold peak, investors demanded growth in terms of ounces at all cost from management, and in the bottom, investors reversed course and realized profits are essential for survival. You know its approaching a top when its ounces at all costs. The technology sector has recently been like this, companies like Tesla(TSLA), Wayfair (W), where it has been growth at all costs. As the tech cycle turns, investors will demand profits from these companies, not just customer growth on Wayfair and auto deliveries from Tesla. This is a 100% guarantee because investors will get spooked when the cycle turns and expect profits. Right now, investors have been rewarding gold miners for delivering on production and showing profitability. In 2017, gold miners delivered record dividends. Gold miners are set to show strong revenues in 2018 because of the continued elevated gold price above $1,300.
“Tesla will be profitable & cash flow+ in Q3 & Q4, so obv no need to raise money,” tweeted Musk
OTHER WAYS TO INVEST THAN ROYALTY STOCKS & GOLD MINERS?
But there is more than one way to play the gold sector. I am always amazed, when I speak with portfolio managers and receive emails, they always bring up explorers, producers, and royalty stocks to invest in stocks. Seek where the profits are, and you will find the gold. Look at Apple, it generates the most profits in the cell-phone industry over the past 8 years, its revenue grew incredibly over that same time-period. So why not repeat the same process in the gold sector?
We think there is a better way to think about investing in gold & silver stocks, and commodity stocks in general. Does the company generate a percentage of their sales related to gold and silver? It opens you up to many different companies with exposure to other commodities or other industries. Seek companies that are growing revenue, but still, give you exposure to gold and silver.
We can see the day when companies that derive a percentage of their revenue from precious metals will be added to ETFs.
Mining Services
Major Drilling
KGHM
Swick Services
Financial Services
Sprott
GoldMoney
Canaccord Genuity
CME Group
Commodities Trading
Glencore
Refining & Distribution
Johnson Matthey
Umicore SA
Some of these companies are directly involved in operating mines, by providing useful services to the mining industry. While still being able to get exposure to the gold and silver. The additional value is you may be getting exposure to multiple commodities and in some case entirely different industries outside of mining that are growing.
YOU NEED REVENUE GROWTH
Frank Holmes taking a more factor-based approach, with one-factor, focused on revenue growth. This factor is important because revenue growth attracts investor money.
. “The royalty companies have done well and those stocks that basically show better revenue per share, reserves per share, production per share, they far outperform.”Holmes.
And if the company can grow revenue per share and/or cash flow per share this help share prices higher. Would you invest in a company that isn’t growing its revenue? This is why royalty stocks attract investors because they are able to grow revenue consistently over longer periods than the miners. The ability to add cash flowing royalties every year is like adding a new mine but a lot faster than a miner can.
Gold miners’ revenues are tied primarily to two items: 1. Production and 2. Gold Price. Investors are willing to pay up for anticipated growth in production because a new mine is starting up or an existing mine is ramping up for further production. Investors are not willing to pay up for growth, they will sell. The higher the expected growth potential, the higher the anticipated returns. But, watch out if the company slips up. Investors will punish the share price like we recently saw with Pretium Resources and New Gold.When the commodity price is falling faster than the production growth, this will take down all stocks in the sectors. This is why it’s important to focus on higher quality companies, with low AISC or have high operating margins. It minimizes your risks on the downside because they can maintain dividends, and their revenue is less impacted.
You can see why royalty and streaming companies like Franco-Nevada and Royal Gold are so popular because they offer fairly consistent revenue per share and cashflow per share growth relative to gold miners.
PROTECTION & GROWTH
Gold and gold stocks provide investors with two very different sets of risks and opportunities to protect and grow their wealth. You own gold primarily as an insurance policy against your portfolio and the financial system. You own gold stocks as a way to potentially increase your wealth by focusing on growth, management ownership and catalysts. Two different asset classes that are part of the overall portfolio. By understanding the cycle that they both follow, you can enjoy the ups and take money off the table when the crowd is all in.
Written by Paul Farrugia, BCom. Paul is the President & CEO of First Macro Capital. He helps his readers identify mining stocks to hold for the long-term. He provides a checklist to find winning gold and silver miner stocks and any commodity producer.
Disclaimer:
The information contained herein is obtained from sources believed to be reliable, but its accuracy cannot be guaranteed. It is not designed to meet your financial situation – we are not investment advisors, nor do we give personalized investment advice. The opinions expressed herein are those of the publisher and are subject to change without notice. It may become outdated, and there is no obligation to update any such information.
Investments recommended in our publications, blog posts, emails, online communications, or any online contents published by any party of First Macro Capital and its affiliated companies should be made only after consulting with your investment advisor and only after reviewing the prospectus or financial statements of the company in question. You should not make any decision based solely on what you read here.
First Macro Capital writers and publications do not take compensation in any form for covering those securities or commodities. First Macro Capital employees and agents of First Macro Capital and its affiliated companies own some of the stocks mentioned in this article, prior to the writing of this article.
Last week index score: 36.21 (updated)
This week: 52.74
The Oreninc Index rose in the week ending May 18th, 2018 to 52.74 from an updated 36.21 a week ago despite good falling below US$1,300/oz.
Gold finally gave way and fell below the US$1,300/oz level to hit a year-to-date low as the US dollar continued to strengthen, the US ten-year treasury hit a 3% yield and economic data continued to show positive results.
US dollar strength is overpowering geopolitical risk concerns which continue to swirl around: the past week saw the US open its new embassy in Israel in Jerusalem. The ceremony was attended by president Trump’s daughter, Ivanka and provoked mass protests by Palestinians during which Israeli security forces killed dozens.
President Trump’s blunt, hard ball approach to issues also threatened to derail the possibility of talks with North Korean leader Kim Jong-Un after the US carried out extensive war air exercises with South Korea.
On to the money: total fund raises announced increased to C$81.7 million, a two-week low, which included five brokered financings for C$50.5 million, a nine-week high and two bought deal financings for C$20.0 million, a one-week high. The average offer size grew to C$3.5 million, a two-week low and the number of financings grew to 23, a two-week high.
Gold fell to US$1,293/oz from US$1,319/oz a week ago after hitting a low of US$1,285/oz. Gold is now down 0.75% this year. The US dollar index increased again and closed up at 93.63 from 92.54 a week ago. The van Eck managed GDXJ suffered as a result closing down at US$32.84 from US$33.85 last week. The index is down 3.78% so far in 2018. The US Global Go Gold ETF also fell to US$12.98 from US$13.35 a week ago. It is now down 0.23% so far in 2018. The HUI Arca Gold BUGS Index closed down at 177.75 from 182.24 last week. The SPDR GLD ETF again saw sales to close its inventory at 855.28 tonnes from 857.64 tonnes a week ago.
In other commodities, silver also gave up ground to close down at US$16.44/oz from US$16.66/oz a week ago. Likewise, copper closed down at US$3.06/lb from US$3.11/lb last week. Oil continued to post gains to close up at US$71.28 a barrel from US$70.51 a barrel a week ago.
The Dow Jones Industrial Average again saw losses to close down at 24,715 from 24,831 last week. Canada’s S&P/TSX Composite Index continued to see growth to close up at 16,162 from 15,983 the previous week. The S&P/TSX Venture Composite Index also closed up at 786.39 from 782.92 last week.
Summary:
Number of financings grew to 23, a two-week high.
Five brokered financings were announced this week for C$50.5m, a nine-week high.
Two bought-deal financings were announced this week for C$20.0m, a one-week high.
Total dollars decreased to C$81.7m, a two-week low.
Average offer size tumbled to C$3.5m, a two-week low.
Financing Highlights
Canadian Zinc (TSX: CZN) entered into an equity financing agreement with RCF VI to purchase 100 million shares @ C$0.20 for gross proceeds of $20 million.
RCF VI will be issued 50 million warrants exercisable @ C$0.25 until December 31st 2018.
The proceeds will be used to repay a US$10 million bridge loan advanced by RCF VI and the ongoing development of the Prairie Creek Zn-Pb-Ag project in Northwest Territories, Canada.
Major Financing Openings:
Canadian Zinc (TSX: CZN) opened a C$20 million offering underwritten by a syndicate led by Resource Capital Fund VI on a best efforts basis. Each unit includes half a warrant that expires in seven months.
Troilus Gold (TSX-V: TLG) opened a C$10.01 million offering underwritten by a syndicate led by GMP Securities on a bought deal basis. The deal is expected to close on or about June 5th.
Rio2 (TSX-V: RIO) opened a C$10 million offering underwritten by a syndicate led by Clarus Securities on a bought deal basis. The deal is expected to close on or about June 7th.
Troilus Gold (TSX-V: TLG) opened a C$7.01 million offering on a best efforts basis. The deal is expected to close on or about June 5th.
Major Financing Closings:
West African Resources (TSX-V: WAF) closed a C$34.3 million offering on a best efforts basis.
Silvercrest Metals (TSX-V: SIL) closed a C$17.25 million offering underwritten by a syndicate led by PI Financial on a bought deal basis.
South Star Mining (TSX-V: STS) closed a C$4.19 million offering underwritten by a syndicate led by Echelon Wealth Partners on a best efforts basis. Each unit included a warrant that expires in 24 months.
Renaissance Gold (TSX-V: REN) closed a C$3.12 million offering on a best efforts basis.
About Oreinc.com:
Oreninc.com is North America’s leading provider of relevant financing information in the junior commodities space. Since 2011, the company has been keeping track of financings in the junior mining as well as oil and gas space. Logging all relevant deal and company information into its proprietary database, called the Oreninc Deal Log, Oreninc quickly became the go-to website in the mining financing space for investors, analysts, fund managers and company executives alike.
The Oreninc Deal Log keeps track of over 1,400 companies, bringing transparency to an otherwise impenetrable jungle of information. The goal is to increase the visibility of transactions and to show financings activity in a digestible format. Through its daily logging activities, Oreninc is in a position to pinpoint momentum changes in the markets, identify which commodities are trending and which projects are currently receiving funding.
Gold failed to breakout in the spring and recently lost weekly support at $1310. Meanwhile, the gold stocks have held up well in recent weeks (considering Gold) but still have much to prove. Silver couldn’t rally much when its net speculative position was at an all time low. The question now is where do things go from here. The price action is not bullish but with a Fed hike looming and negative sentiment, Gold could be poised to snapback after testing lower levels.
The technicals for Gold show a strong confluence of support at $1265 to $1270. It has traded as low as $1281 in recent days. Trendlines and long-term moving averages coalesce at $1265 to $1270. On the weekly chart, $1265 stands out as a key level. A little bit more selling could bring Gold down to key support.
Gold with Sentiment Indicators
The sentiment indicators (shown at the bottom of the above chart) are encouraging and would be more so with a test of that aforementioned support. The net speculative position as of last Tuesday hit 22.7% of open interest, which is one of the lowest readings of the past two years. The daily sentiment index hit only 10% bulls last week. It’s 21-day average is 32% bulls and if that fell below 30% it would mark a 9-month low.
Turning to the miners, we find a sector that continues to be wedged in between support and resistance. GDXJ has trendline and lateral support in the $31s with key resistance in the low $34s. GDX has immediate support at $22 and strong support at $21 while initial resistance is at $23. If Gold is to have another chance to breakout in the months ahead then GDX and GDXJ need to surpass their April highs.
GDXJ, GDX Daily Bar Charts
While we are concerned about Gold for the remainder of 2018, it could be setting up for a summer rally and especially if it drops to strong support around $1265. Sentiment would reach even more encouraging levels and that coupled with strong technical support could produce a rebound. In the meantime we continue to focus on and accumulate the juniors that have 300% to 500% return potential over the next 12 to 18 months. To follow our guidance and learn our favorite juniors for the balance of 2018, consider learning more about our premium service.
Gold continues to act superbly for eager buyers in this time of seasonal softness. Against a background of static mine supply, Chinese demand is strengthening slightly and Indian demand is moderately soft.
The price action reflects these key fundamentals perfectly. Please click here now. Double-click to enlarge this important daily gold chart.
Amateur investors should focus on $100 per ounce price sales for gold. From the recent $1375 area highs, that makes my $1280 support zone even more important for accumulators of the world’s mightiest metal.
Some investors are concerned that rising oil prices will increase the AISC (all-in sustaining costs) of miners significantly. That was a legitimate concern during the past two decades when deflation and collapsing money velocity ruled the gold stocks roost.
America now looks eerily similar to the late 1960s, when inflation began to emerge. The oil shock of 1973 sent fuel prices skyrocketing, but gold stocks were bought aggressively by investors who were very worried about rampant inflation.
Gold stocks soared as fuel costs soared. That was then, and I believe it is poised to be now. Here’s why:
Bullion is a major asset class. In terms of dollar volume, more bullion trades daily in London than the entire NYSE daily volume. It’s the fifth most active FOREX contract in the world. Simply put, the market for bullion products is gargantuan.
In contrast, gold stocks are a very small sector of the market. So, it only takes modest institutional buying to boost prices, and boost them quite significantly.
Please click here now. Double-click to enlarge. This hourly-bars gold chart is technically positive. Some “build-out” of the right shoulder is possible, but that won’t take long.
The next COMEX option expiry day is May 24, and it should be the catalyst that launches the next great rally for the entire precious metals asset class.
Please click here now. In 2014 I predicted that China would lead a “gold bull era” where investors buy exponentially more physical gold with their smart phones.
Key gold jewellery manufacturers and retailers in China are seeing a significant increase in sales now, and I’ve predicted this is only the very beginning of what will be a glorious multi-decade ramp-up in online demand for gold.
Please click here now. Top technicians at Goldman see the $1275 price zone as the outskirts of a key buying area, but it’s possible that the low for this “price sale” is already in!
Please click here now. The fundamental drivers of American inflation are arguably as strong or even stronger now than they were in 1968.
US demographics bear similarity to that time; in the late 1960s, the baby boomers were young and rebellious. The London Gold Pool was ending. The free-trade for gold didn’t get completely launched until about 1974, but some gold products (like certificates) were free-trading by the late 1960s and gaining popularity. Most importantly, it was happening as rates and inflation rose.
A lot of analysts draw parallels between the economic policy of the Trump administration and the Reagan administration, and the policy is similar, but the Fed policy and the business cycle are not.
Both administrations used tax cuts to promote growth, but the Reagan administration had the start of the greatest rate cutting cycle in American history as wind at its back. It also took office at the end of a major economic downturn.
The Trump administration faces a rate hiking cycle, the late stage of the business cycle, and the end of a twenty year bear market in money velocity. The business upcycle has featured huge stock market buyback programs with only modest expenditure on business expansion. That’s very inflationary.
What’s essentially happening is the US private economy is expanding but overheating, and the US government is pushing rates higher with its huge budget deficit.
An inflationary genie is poised to leap out of the bottle in a very big way. The US private economy should continue to grow in the 3% range, but inflation will soon emerge. The big loser in this situation is the US government, and rightly so.
More inflationary tax cuts are almost certainly coming. These cuts are necessary. Even after Trump’s first tax cut, US small business taxes are still about twice as high as supposedly “socialist” Canada’s rate.
Please click here now. Double-click to enlarge. The US dollar bear market rally against the yen is probably almost over. A last push towards 112 – 115 is possible, but when Powell announces his next rate hike on June 13, it’s likely the end of the rally.
Please click here now. Double-click to enlarge this GDX chart. While GDX appears sleepy, many GDX component stocks are in powerful uptrends now. This often happens ahead of a major advance for indexes and ETFs like GDX.
Investors should watch the $23.25 price zone for GDX very closely. A two-day close above that line in the sand should ignite a multi-month advance towards my $30-$35 target zone, and probably by year-end. That’s a huge percentage gain for eager accumulators who buy with gusto now!
Thanks!
Cheers
St
Stewart Thomson is a retired Merrill Lynch broker. Stewart writes the Graceland Updates daily between 4am-7am. They are sent out around 8am-9am. The newsletter is attractively priced and the format is a unique numbered point form. Giving clarity of each point and saving valuable reading time.
Risks, Disclaimers, Legal
Stewart Thomson is no longer an investment advisor. The information provided by Stewart and Graceland Updates is for general information purposes only. Before taking any action on any investment, it is imperative that you consult with multiple properly licensed, experienced and qualified investment advisors and get numerous opinions before taking any action. Your minimum risk on any investment in the world is: 100% loss of all your money. You may be taking or preparing to take leveraged positions in investments and not know it, exposing yourself to unlimited risks. This is highly concerning if you are an investor in any derivatives products. There is an approx $700 trillion OTC Derivatives Iceberg with a tiny portion written off officially. The bottom line:
Are You Prepared?
The major gold miners’ stocks are still largely grinding sideways, mired in a bearish sentiment wasteland. Traders tend to assume low stock prices must be righteous, reflecting weak fundamentals rather than poor psychology. But once a quarter earnings seasons’ bright fundamental sunlight parts the obscuring fogs of popular sentiment. The gold miners’ just-reported Q1’18 results prove they remain deeply undervalued.
Four times a year publicly-traded companies release treasure troves of valuable information in the form of quarterly reports. Companies trading in the States are required to file 10-Qs with the US Securities and Exchange Commission by 45 calendar days after quarter-ends. Canadian companies have similar requirements. In other countries with half-year reporting, many companies still partially report quarterly.
The definitive list of major gold-mining stocks to analyze comes from the world’s most-popular gold-stock investment vehicle, the GDX VanEck Vectors Gold Miners ETF. Its composition and performance are similar to the benchmark HUI gold-stock index. GDX utterly dominates this sector, with no meaningful competition. This week GDX’s net assets are 25.7x larger than the next-biggest 1x-long major-gold-miners ETF!
GDX is effectively the gold-mining industry’s blue-chip index, including the biggest and best publicly-traded gold miners from around the globe. GDX inclusion is not only prestigious, but grants gold miners better access to the vast pools of stock-market capital. As ETF investing continues to rise, capital inflows into leading sector ETFs require their managers to buy more shares in underlying component companies.
GDX’s component list this week ran 49 “Gold Miners” long. While the great majority of GDX stocks do fit that bill, it also contains gold-royalty companies and major silver miners. All the world’s big primary gold miners publicly traded in major markets are included. Every quarter I look into the latest operating and financial results of the top 34 GDX companies, which is just an arbitrary number fitting neatly into these tables.
That’s a commanding sample, as GDX’s 34 largest components now account for a whopping 92.1% of its total weighting! These elite miners dominate world gold mine production, which ran 770.0 metric tons in Q1’18 according to the World Gold Council’s recently-released Q1 Gold Demand Trends report. The top 34 GDX gold miners reported collectively mining 286.5t of gold last quarter, nearly 3/8ths of the world’s total!
Most of these top 34 GDX gold miners trade in the US and Canada where comprehensive quarterly reporting is required by regulators. But some trade in Australia and the UK, where companies just need to report in half-year increments. Fortunately those gold miners do still tend to issue production reports without financial statements each quarter. There are still wide variations in reporting styles and data offered.
Every quarter I wade through a ton of data from these elite gold miners’ latest results and dump it into a big spreadsheet for analysis. The highlights make it into these tables. Blank fields mean a company had not reported that data for Q1’18 as of this Wednesday. Looking at the major gold miners’ latest results in aggregate offers valuable insights on this industry’s current fundamental health unrivaled anywhere else.
The first couple columns of these tables show each GDX component’s symbol and weighting within this ETF as of this week. While most of these stocks trade on US exchanges, some symbols are listings from companies’ primary foreign stock exchanges. That’s followed by each gold miner’s Q1’18 production in ounces, which is mostly in pure-gold terms. That excludes byproduct metals often present in gold ore.
These are mostly silver and base metals like copper, which are valuable. They are sold to offset some of the considerable costs of gold mining, lowering per-ounce costs and thus raising overall profitability. In cases where companies didn’t separate out gold and lumped all production into gold-equivalent ounces, these GEOs are included instead. Then production’s absolute year-over-year change from Q1’17 is shown.
Next comes gold miners’ most-important fundamental data for investors, cash costs and all-in sustaining costs per ounce mined. The latter directly drives profitability which ultimately determines stock prices. These key costs are also followed by YoY changes. Last but not least the annual changes are shown in operating cash flows generated, hard GAAP earnings, sales, and cash on hand with a couple exceptions.
Percentage changes aren’t relevant or meaningful if data shifted from positive to negative or vice versa, or if derived from two negative numbers. So in those cases I included raw underlying data rather than weird or misleading percentage changes. This whole dataset together offers a fantastic high-level read on how the major gold miners are faring fundamentally as an industry. And that was really well in Q1’18!
As I waded through all these gold miners’ new 10-Qs or their foreign equivalents this week, the biggest surprise was production. The whole business of gold mining is digging up and selling gold, so naturally production is the mothers’ milk of this industry. Companies are always striving to grow their production, which boosts their cash generation and thus expansion opportunities available by finding or buying other mines.
These elite gold miners certainly had every incentive to boost their production in Q1, since its average gold price surged 8.9% YoY to $1329. Investors are always looking for rising production too, seeing it as signs of good management and strong fundamental health. Since gold stocks suffering flagging production are often punished with selling, the major gold miners really hate reporting it. Yet Q1’18 was stuffed with declines!
This wasn’t readily apparent to casual observers, as the major gold miners carefully tailor their quarterly-results press releases to accentuate the positive and intentionally mask the negative. Yet if you look at the YoY changes in gold production above, fully 21 of the 33 top GDX companies reporting it suffered steep average declines of 9.6%! This lower production was so universal and widespread it looks to be systemic.
Overall these top 34 GDX companies mined 9.2m ounces of gold in Q1’18, which was down a sharp 4.6% YoY. This was actually contrary to the industry trend too. The World Gold Council’s new read on Q1’s fundamentals showed global gold mine production actually rising 1.4% YoY! Yet the top 10 GDX stocks commanding 60.3% of this ETF’s total weighting all saw gold declines averaging a major 7.4% YoY.
Most of these top gold miners had explanations, which were often excluded from press releases. I found them deep in quarterly regulatory filings most investors will never bother looking into. Mine sequencing leading to lower ore grades, individual-mine technical challenges, and slowing production at older mines were mostly to blame. This wasn’t a one-off dip though, as Q4’17’s GDX-top-34 production also fell 2.0% YoY.
Investors choosing to buy GDX instead of individual gold stocks with superior fundamentals must realize the lion’s share of their investments are flowing into giant gold miners with slowing production. As long as this proves true, their stocks have far-less appreciation potential than their smaller peers still able to grow production. What the top major gold miners are experiencing is increasingly validating peak-gold theses.
Gold deposits economically viable to mine are very rare in the natural world, and the low-hanging fruit has largely been harvested. It is growing ever more expensive to explore for gold, in far-less-hospitable places. Then even after new deposits are discovered, it takes up to a decade to jump through all the Draconian regulatory hoops necessary to secure permitting. And only then can mine construction finally start.
That takes additional years and hundreds of millions if not billions of dollars per gold mine. But because gold-mining stocks have been deeply out of favor most of the time since 2013, capital has been heavily constrained. When banks are bearish on gold prices, they aren’t willing to lend to gold miners except with onerous terms. And when investors aren’t buying gold stocks, issuing new shares low is heavily dilutive.
The large gold miners used to rely greatly on the smaller junior gold miners to explore and replenish the gold-production pipeline. But juniors have been devastated since 2013, starved of capital. Not only were investors completely uninterested with general stock markets levitating, but the rise of ETFs has funneled most investment inflows into a handful of larger-market-cap juniors while the rest see little meaningful buying.
So even the world’s biggest and best gold miners are struggling to grow production. While that isn’t good for those individual miners, it’s super-bullish for gold. The less gold mined, the more gold supply will fail to keep pace with demand. That will result in higher gold prices, making gold mining more profitable in the future. Some analysts even think peak gold has been reached, that world mine production will decline indefinitely.
There are strong fundamental arguments in favor of peak-gold theories. But regardless of where overall global gold production heads in coming years, the major gold miners able to grow their own production will fare the best. They’ll attract in relatively-more investor capital, bidding their stocks to premium prices compared to peers that can’t grow production. Stock picking is more important than ever in this ETF world!
With major gold miners’ production sharply lower, their costs of mining should be proportionally higher. Gold-mining costs are largely fixed during mine-planning stages, when engineers and geologists decide which ore to mine, how to dig to it, and how to process it. The actual mining generally requires the same levels of infrastructure, equipment, and employees quarter after quarter. Little changes in throughput terms.
The mills processing the gold-bearing ore and inevitable accompanying waste rock have hard limits to tonnages they can chew through. When richer ore is processed, more ounces of gold are produced to spread the big fixed costs across. But when mine managers have to dig through lower-grade ore, either on the way to higher-grade stuff later or in depleting mines, fewer ounces of gold must bear the full cost burden.
But interestingly this often-ironclad inverse relationship between gold production and per-ounce costs did not really play out in Q1’18. Costs rose, but nowhere near as much as the lower gold production implied they would. The major gold miners are getting more efficient. They could’ve also chosen to sequence lower-grade ore into their mills because higher prevailing gold prices would offset some of the production declines.
There are two major ways to measure gold-mining costs, classic cash costs per ounce and the superior all-in sustaining costs per ounce. Both are useful metrics. Cash costs are the acid test of gold-miner survivability in lower-gold-price environments, revealing the worst-case gold levels necessary to keep the mines running. All-in sustaining costs show where gold needs to trade to maintain current mining tempos indefinitely.
Cash costs naturally encompass all cash expenses necessary to produce each ounce of gold, including all direct production costs, mine-level administration, smelting, refining, transport, regulatory, royalty, and tax expenses. In Q1’18, these top 34 GDX-component gold miners that reported cash costs averaged $667 per ounce. They indeed surged a sharp 7.1% YoY, the result of fixed costs spread across lower production.
These industry-wide cash costs are the gold-price pain point where miners’ viability and survivability is in jeopardy. Seeing gold anywhere near those levels again is exceedingly unlikely. The last time gold hit $667 was 10.7 years ago in August 2007, before trillions of dollars of central-bank money printing after 2008’s stock panic. Provocatively the HUI gold-stock index was near 320 then, 80% higher than today’s levels!
Way more important than cash costs are the far-superior all-in sustaining costs. They were introduced by the World Gold Council in June 2013 to give investors a much-better understanding of what it really costs to maintain gold mines as ongoing concerns. AISCs include all direct cash costs, but then add on everything else that is necessary to maintain and replenish operations at current gold-production levels.
These additional expenses include exploration for new gold to mine to replace depleting deposits, mine-development and construction expenses, remediation, and mine reclamation. They also include the corporate-level administration expenses necessary to oversee gold mines. All-in sustaining costs are the most-important gold-mining cost metric by far for investors, revealing gold miners’ true operating profitability.
With the top 34 GDX gold miners’ production down 4.6% YoY in Q1, I would’ve bet their AISCs would’ve risen a proportional 4% to 5%. Yet their cost control was outstanding, as these elite gold miners reported average AISCs up just 0.7% YoY to $884 per ounce! That’s roughly in line with the quarterly trend from 2017 seeing $878, $867, $868, and $858 averages running from Q1 to Q4. Costs are really being contained.
The major gold miners have to manage costs exceptionally well to maintain AISCs while production is also slowing. This argues against the popular complaint that gold miners’ managements are doing poor jobs. Because gold-stock prices are so darned low, traders again assume the miners must be plagued with serious fundamental problems. But it’s relentlessly-bearish herd sentiment suppressing gold-stock prices.
Flat AISCs combined with sharply-higher gold prices led to exploding operating profitability among the major gold miners last quarter! That certainly isn’t being reflected in their stock prices. In Q1’17, gold averaged just $1220 against $878 average AISCs. That yielded per-ounce profits of $342. But this past year saw gold surge 8.9% to that $1329 quarterly average in Q1’18 while AISCs only climbed 0.7% to $884.
That drove fat operating margins of $445 per ounce, exploding 30.2% higher YoY! That works out to excellent 3.4x upside profits leverage to gold! In any other stock-market sector such massive earnings growth would be crowed about from the rooftops and capital would flood in. But that wasn’t enough to blow away the darkening bearish pall over gold stocks. GDX’s average share price still fell 3.0% YoY in Q1’18!
Gold-stock profits as measured by the difference between average gold prices and average AISCs even surged 6.3% quarter-on-quarter from Q4’17. There is a vast fundamental disconnect between the left-for-dead gold-stock prices and gold miners’ strong operational performances. This bearish-sentiment-driven anomaly is very extreme and won’t last forever. Investors will rush back in when they discover the value.
The major gold miners’ fundamental health is reflected in their operating-cash-flow generation. These top 34 GDX gold miners reporting OCFs for last quarter collectively produced $3355m. That’s up 3.9% YoY despite their 4.6% lower gold production, mostly due to that sizable 8.9% average-gold-price rally. Most of these elite gold miners saw big annual growth in cash generated from operations, a very-bullish sign.
As long as OCFs remain massively positive, the gold mines are generating much more cash than they cost to run. That gives the gold miners the capital necessary to expand existing operations and buy new deposits and mines. Given how ridiculously low gold-stock prices are today, you’d think the gold miners are hemorrhaging cash like crazy. But the opposite is true, showing how silly this bearish herd sentiment is.
These top GDX gold miners’ actual GAAP profits didn’t look as good, plunging 48.5% YoY to $855m in Q1. While that was a huge improvement over Q4’17’s $266m loss, it still seems incongruent with those flat all-in sustaining costs and growing operating cash flows. Of the 25 of these top GDX components reporting earnings in Q1, just 3 had losses. The only big ones came from Royal Gold and Yamana Gold.
Royal Gold’s $154m loss was the result of a gigantic $239m impairment charge in its interests in gold royalties. That came from Barrick Gold’s big Pascua-Lama project, which straddles the border between Chile and Argentina. In Q1 Barrick decided the current economic and geopolitical environment made the Chilean side of this project not worthy of further investment. Chile’s government is harassing Barrick on it.
Yamana Gold’s $161m loss was largely from a $103m impairment of a majority investment it made in a smaller gold company. When a third company agreed to acquire all the shares of that smaller miner in Q1, Yamana had to write off its loss. These two impairments alone battered overall GDX GAAP profits $342m lower! Without them, the top 34 GDX gold miners’ earnings would’ve slid a much-smaller 27.9% YoY.
It doesn’t take many of these non-cash charges to greatly alter the collective GAAP earnings of the elite gold miners. And there’s a third huge one to consider. Back in Q1’17, Barrick Gold recorded a colossal $1125m non-cash gain reversing previous impairment charges on a gold project after Goldcorp agreed to buy a quarter of it. That really inflated overall GDX GAAP profits in the comparable quarter a year ago.
Just excluding that huge Q1’17 impairment reversal and that pair of Q1’18 impairment charges radically changes the profits picture. Again those were non-cash and had nothing to do with operations. That yields Q1’18 GAAP profits of $1197m for these top 34 GDX gold miners, a staggering $123% higher than Q1’17’s if its Barrick impairment-reversal gain hadn’t happened! The major gold miners are faring really well.
These surging accounting earnings are evident in the classic trailing-twelve-month price-to-earnings ratios of these top gold miners as well. They aren’t included in these tables, but averaged 37.3x in Q1’18 for the 24 of these companies that had net earnings over the past year. While that’s not an accurate reflection of true valuations due to non-cash things flushed through income statements, it was still 28% lower.
On the sales front these top 34 GDX gold miners’ revenues climbed 1.5% YoY to $10.6b in Q1’18. That reflects the combination of higher gold selling prices with lower gold production. Actual sales growth was probably better, as 26 top-34 GDX companies reported sales in Q1’18 compared to 28 in Q1’17. GDX saw three new companies climb into the ranks of its top 34 over this past year, highlighted in light blue above.
Two of these are the great low-cost Australian gold miners Regis Resources and St Barbara Limited. They report in half-year increments, and gave no revenues data for Q1 which was an interim quarter for both. The companies they knocked out of the top 34 had reported sales a year earlier. So the sales growth in the elite major gold miners was really good considering their sharply-lower gold production.
Finally these top 34 GDX gold miners’ cash on their balance sheets fell 4.2% YoY to $12.7b. That’s a big number for this small contrarian sector, meaning these companies have lots of capital firepower available to expand existing operations or buy gold mines from other companies. The more cash on hand the gold miners have, the more flexibility and resilience they have to grow their businesses and weather challenges.
So overall the major gold miners’ fundamentals looked really strong in Q1’18, a stark contrast to the miserable sentiment plaguing this sector. Gold stocks’ vexing consolidation since early 2017 isn’t the result of operational struggles, but purely bearish psychology. That will soon shift as stock markets inevitably roll over and gold surges, making the beaten-down gold stocks a coiled spring overdue to soar dramatically.
While investors and speculators alike can certainly play gold stocks’ coming powerful uplegs with the major ETFs like GDX, the best gains by far will be won in individual gold stocks with superior fundamentals. Their upside will far exceed the ETFs, which are burdened by over-diversification and underperforming stocks. A carefully-handpicked portfolio of elite gold and silver miners will generate much-greater wealth creation.
At Zeal we’ve literally spent tens of thousands of hours researching individual gold stocks and markets, so we can better decide what to trade and when. As of the end of Q4, this has resulted in 983 stock trades recommended in real-time to our newsletter subscribers since 2001. Fighting the crowd to buy low and sell high is very profitable, as all these trades averaged stellar annualized realized gains of +20.2%!
The key to this success is staying informed and being contrarian. That means buying low before others figure it out, before undervalued gold stocks soar much higher. An easy way to keep abreast is through our acclaimed weekly and monthly newsletters. They draw on my vast experience, knowledge, wisdom, and ongoing research to explain what’s going on in the markets, why, and how to trade them with specific stocks. For only $12 per issue, you can learn to think, trade, and thrive like contrarians. Subscribe today, and get deployed in the great gold and silver stocks in our full trading books!
The bottom line is the major gold miners’ fundamentals are really strong based on their recently-reported Q1’18 results. While production declined fairly sharply, the miners still held the line on all-in sustaining costs. That fueled fat operating profits and strong cash flows. And many of the elite gold miners have forecast improving production throughout 2018 on higher-grade ores, which will push profits even higher.
Yet gold stocks are priced today as if gold was half or less of current levels, which is truly fundamentally-absurd! They are the last super-undervalued sector in these euphoric, overvalued stock markets. When gold investment demand resumes on weakening stock markets and pushes gold higher, capital will flood back into the forgotten gold miners. That buying will catapult them back to far-higher fundamentally-righteous prices.
Prospero Silver (TSX-V: PSL) and Fortuna Silver Mines (TSX:FVI) amended their strategic financing agreement and amended the 2018 work program in Mexico.
NuLegacy Gold (TSX-V: NUG) began drilling on its Red Hill in the Cortez gold trend of Nevada.
Zinc One Resources (TSX-V: Z) announced additional drill results from the Mina Grande Sur zone at its Bongará zinc mine project in north-central Peru.
The Oreninc Index halved in the week ending May 11th, 2018 to 22.90 from an updated 45.85 a week ago as funding again dried up.
Another quiet and less volatile week that saw gold steadily build momentum throughout the week only to lose it at the end. The US and North Korea agreed to meet at a landmark presidential summit in Singapore. Meanwhile, US president Donald Trump pulled the US out of the 2015 Iran nuclear framework deal and said that the US will continue to impose sanctions on the country and any company that continues to do business with it to the ire of European countries.
On to the money…total fund raises announced fell to C$56.5 million, a seven-week low, which included no brokered financings, a five-week low, and no bought deal financings, also a five-week low. The average offer size grew to C$2.9 million, a two-week high although the number of financings fell to 19, a nine-week low. Whilst the dollars announced did not fall much from last week, the absence of broker action saw the Oreninc Index take a proportionally bigger hit.
A flat week for gold as it closed up slightly at US$1,319/oz from US$1,314/oz a week ago. Gold is now up 1.27% this year. The US dollar index, on a tear since mid-April, finally took a hit and closed down at 92.5 from 92.56 a week ago after hitting a high of 93.12. The Van Eck managed GDXJ posted growth through the week and then weakened at the close to end up at US$33.85 from US$33.55 last week. The index is down 0.82% so far in 2018. The US Global Go Gold ETF also saw growth to close up at UA$13.35 from US$13.11 a week ago. It is up 2.61% so far in 2018. The HUI Arca Gold BUGS Index closed up at 182.24 from 181.39 last week. The SPDR GLD ETF again saw sales to close its inventory at 857.64 tonnes from 864.13 tonnes a week ago.
In other commodities, silver made a gain to close up at US$16.66/oz from US$16.53/oz a week ago. Likewise, copper made gains to close up at US$3.11/lb from US$3.08/lb last week. Oil continued to post gains to close up at US$70.51 a barrel from US$69.72 a barrel a week ago, returning to levels last seen in late 2014.
The Dow Jones Industrial Average rebounded from its losses last week to close up at 24,831 from 24,262 last week. Canada’s S&P/TSX Composite Index also saw growth to close up at 15,983 from 15,729 the previous week. The S&P/TSX Venture Composite Index closed up at 782.92 from 772.24 last week.
Summary:
Number of financings declined to 19, a nine-week low.
No brokered financings were announced this week, a five-week low.
No bought-deal financings were announced this week, a five-week low.
Total dollars fell to $56.5m, a seven-week low.
Average offer size grew to $2.9m, a two-week high.
Financing Highlights
West African Resources (TSX-V: WAF) is to raise A$35 million to fund pre-development activities at its Sanbrado gold project in Burkina Faso.
West African will issue 109.4 million shares @ A$0.32.
The company anticipates completing a revised feasibility study by the end of the second quarter.
Major Financing Openings:
West African Resources (TSX-V:WAF) opened a $34.3 million offering on a best efforts basis.
Wealth Minerals (TSX-V: WML) opened a $5 million offering on a best efforts basis. Each unit includes half a warrant that expires in 24 months.
Aton Resources (TSX-V: AAN) opened a $3 million offering on a best efforts basis. Each unit includes half a warrant that expires in 60 months. The deal is expected to close on or about May 15th.
ATAC Resources (TSX-V: ATC) opened a $3 million offering on a best efforts basis.
Major Financing Closings:
Africa Energy (TSX-V: AFE) closed a $57.98 million offering underwritten by a syndicate led by Pareto Securities on a best efforts basis.
Seabridge Gold (TSX: SEA) closed a $19.73 million offering on a best efforts basis.
Garibaldi Resources (TSX-V: GGI) closed a $13.05 million offering on a best efforts basis.
Pacton Gold (TSX-V: PAC) closed a $5.55 million offering underwritten by a syndicate led by Sprott Capital Partners on a best efforts basis.
Company News
Prospero Silver (TSX-V: PSL) and Fortuna Silver Mines (TSX: FVI) amended their strategic financing agreement and amended the 2018 work program in Mexico.
Repricing and exercise of Fortuna’s 5.4 million warrants to provide C$803,571 additional funding for drilling.
6,000m drill program to test three additional targets: Buenavista, Bermudez and Trias.
November 30th deadline agreed for Fortuna to exercise its option rights to select up to two Prospero projects for option to joint venture agreements.
Analysis
The renewed commitment by Fortuna to test new targets is encouraging. The repricing and exercising of Fortuna’s warrants is a non-dilutive way for Prospero to secure more funding at a premium to market price for the planned work and removes warrant overhang from the stock.
NuLegacy Gold (TSX-V: NUG) began drilling on its Red Hill in the Cortez gold trend of Nevada.
An initial 15,000 feet of drilling or 12 holes. Results will determine the second stage of drilling.
2018 drilling and field exploration budget of C$5.0 million with emphasis on discovery of new, additional gold zones.
Analysis
With a new season of drilling commencing following an extended winter break, the company is looking to step out from and grow the size of its existing discoveries as well as continuing to find new mineralized areas to increase the overall size and scope of Red Hill. The next couple of months should see regular news flow from the company.
Zinc One Resources (TSX-V:Z) announced additional drill results from the Mina Grande Sur zone at its Bongará zinc mine project in north-central Peru.
Highlights included 8.2m @ 42.7% Zn.
81 drill holes for 1,811m drilled to date.
Analysis
This portion of the Mina Grande Sur drill program was designed to determine the extent of the mineralization so obtaining additional high-grade intersections is a bonus and attest to the robustness of Mina Grande Sur, which should be reflected in the upcoming resource calculation.
About Oreinc.com:
Oreninc.com is North America’s leading provider of relevant financing information in the junior commodities space. Since 2011, the company has been keeping track of financings in the junior mining as well as oil and gas space. Logging all relevant deal and company information into its proprietary database, called the Oreninc Deal Log, Oreninc quickly became the go-to website in the mining financing space for investors, analysts, fund managers and company executives alike.
The Oreninc Deal Log keeps track of over 1,400 companies, bringing transparency to an otherwise impenetrable jungle of information. The goal is to increase the visibility of transactions and to show financings activity in a digestible format. Through its daily logging activities, Oreninc is in a position to pinpoint momentum changes in the markets, identify which commodities are trending and which projects are currently receiving funding.
Most analysts in both the gold and mainstream investment communities seem to be in “summer doldrums” mode. They are nervous about stock markets because of rate hikes and the late stage of the business cycle. That’s understandable.
Unfortunately, they also seem to be unaware of the fabulous uptrends developing in many gold stocks.
In contrast, I’m extremely excited by the price action in a wide array of gold stocks, silver stocks, and blockchain currencies. I have predicted that the upside fun will continue and is poised to accelerate quite dramatically in the second half of this year.
Please click here now. Western governments focus on regime change in Mid-East while China takes another step forwards in what I call the gold bull era.
Morgan Stanley’s stock market indexes are a institutional benchmark, and China’s gold demand growth is strongly correlated with income growth, stock market performance, and overall GDP growth.
In terms of goods and services produced and consumed, China is by far the world’s largest economy. Soon it will become the richest as well, leaving demographically-impaired and debt-obsessed America in its wake.
Gold investors in the West can choose to live in an emotional state of doldrums and boredom, or they can feel great comfort as they watch China put a relentlessly rising floor under the gold price.
I choose to enjoy the mild excitement and great comfort generated by the gold bull era.
Please click here now. While China expands its gold-oriented influence, India is functioning like a gold-oriented starship attached to a Chinese locomotive train with a gigantic rubber band.
As the strong season for gold in India begins in the summer, inflation has suddenly started a nasty turn to the upside. Indians and Germans are the global citizens most concerned with inflation.
As inflation begins to stun most observers with the power of its surge over the next eighteen months, I expect Indian gold demand to begin a historic leg higher. Germans will join the fun, and institutional money managers around the world will commit to substantial gold stock buy programs as that happens.
Please click here now. Double-click to enlarge. There are only four to six weeks before the strong demand season for gold begins, and does so against the background of more rate hikes, QT, a fading US business cycle, and inflation that could grow like “Jack And The Bean Stalk”.
There’s not much time to get positioned in my key $1310 – $1280 buy zone before the strong season and rising inflation raise the gold price floor above $1400 and keep it there for decades.
Nervous accumulators can mitigate their nervousness with a put options strategy, but even if bullion pulls down to $1280, I expect many miners to keep rallying!
Please click here now. I’m in absolute agreement with Pete Boockvar, and I’ll take his views a step further and suggest that in the current environment QT and rate hikes are going to make inflation grow like Jack and the golden beanstalk!
Please click here now. My “line in the sand” head and shoulders top neckline for US T-bonds looks ready to break. There could be some hesitation but I think a June rate hike and accelerated QT from Powell will seal this deal.
That could create an equity market panic and more concern about real estate mortgages. Previous Fed hikes have coincided with the start of significant gold price rallies, and this one could turn into a real barnburner.
Please click here now. London’s biggest metals dealer has announced bitcoin and gold trading. There’s a growing synergy between the blockchain and gold community.
I expect that to intensify quite dramatically as miners like Agnico and Goldcorp get more involved with the technology.
Please click here now. The excitement being generated by the blockchain currency assets is incredible. ZCASH is a key currency and it has surged 40% just in the past twenty-four hours. The Gemini exchange run by the Winklevoss billionaires just received regulatory approval for institutional and retail trading of more great blockchain currencies like ZCASH!
For bitcoin itself, I have an eighteen-month target of $50,000 a coin, and an ultimate target of $500,000.
I’m a miner myself, and I’m installing a lot of solar panels to ensure I have more than enough juice to power my joyous blockchain era upside ride! Investors who want to get richer with blockchain currency action can subscribe to my maverick www.gublockchain.com newsletter.
Please click here now. Double-click to enlarge this important GDX chart. Some individual component stocks of the GDX ETF are going to keep rising in the uptrend and others will pull back a bit before blasting higher.
At this point it’s simply unknown which route GDX follows before global inflation begins to grow faster than what I’ll call Jack and his bull era bean stalk! What is known is that I want all gold community investors to be comfortably invested in key gold stocks so they build maximum wealth as the bean stalk of inflation begins to grow… and grow… and grow!
Stewart Thomson is a retired Merrill Lynch broker. Stewart writes the Graceland Updates daily between 4am-7am. They are sent out around 8am-9am.The newsletter is attractively priced and the format is a unique numbered point form. Giving clarity of each point and saving valuable reading time.
Risks, Disclaimers, Legal
Stewart Thomson is no longer an investment advisor. The information provided by Stewart and Graceland Updates is for general information purposes only. Before taking any action on any investment, it is imperative that you consult with multiple properly licensed, experienced and qualified investment advisors and get numerous opinions before taking any action. Your minimum risk on any investment in the world is: 100% loss of all your money. You may be taking or preparing to take leveraged positions in investments and not know it, exposing yourself to unlimited risks. This is highly concerning if you are an investor in any derivatives products. There is an approx $700 trillion OTC Derivatives Iceberg with a tiny portion written off officially. The bottom line:
Are You Prepared?
Last week we discussed the fundamentals of Gold, which do not appear bullish at the moment. Real rates (and yields) are rising and investment demand for Gold is flat. That in itself is a temporary but big missing link. However, we are referring to the missing link in the context of intermarket analysis. Gold is an asset that performs best when its outperforming its competitors. That’s true of any asset but especially Gold because it traditionally has been a counter-investment or an anti-investment. While Gold is firmly outperforming Bonds and showing strength against global currencies, it remains neutral to weak against global equities.
First, let’s take a look at Gold relative to foreign currencies (FC) and Bonds. At its 2016 peak, Gold/FC had already retraced the majority of its bear market. Last week Gold/FC managed to close at an 8-month high even as the US$ index rebounded. Gold has performed even better against Bonds and that includes dividends. A few months ago Gold relative to the major Bond ETFs (TLT and IEF) made a 3-year high. Those ratios remain above rising 200-day moving averages.
Gold vs. foreign currencies, TLT, IEF
It’s important for Gold to outperform foreign currencies because if Gold is only rising because of a weak US Dollar that represents a bear market in the dollar rather than a bull market in Gold.
Gold’s outperformance against Bonds is significant because Bonds represent an enormous capital market and Bonds are in some ways the antithesis of Gold.
Unfortunately, Gold has not been able to breakout in nominal terms and from an intermarket perspective, that is because of the strength in the stock market. The ratios below show that Gold relative to global equities is trading not too far above the 2015 lows. If these ratios retested their 2015 lows they’d be trading around 10-year lows!
Gold vs. global equities
Gold appears to have lost the 200-day moving average relative to global equity markets but if it can maintain its outperformance against Bonds and foreign currencies then it will be setup for a powerful move when it can break to the upside relative to equities. The negative is that change does not appear imminent but the positive is when it happens Gold should begin a major leg higher. In the meantime, we continue to focus on and accumulate the juniors that have 300% to 500% return potential over the next 12 to 18 months. To follow our guidance and learn our favorite juniors for the balance of 2018, consider learning more about our premium service.
The mega-cap stocks that dominate the US markets are just wrapping up a truly-extraordinary earnings season. Naturally this first quarter under Republicans’ new corporate tax cuts fueled surging profits. But sales were up big too, which is no mean feat for massive companies. With sustained growth at this torrid pace impossible, peak-earnings fears are mounting. And valuations stayed extremely expensive exiting Q1.
Four times a year publicly-traded companies release treasure troves of valuable information in the form of quarterly reports. Required by the US Securities and Exchange Commission, these 10-Qs contain the best fundamental data available to investors and speculators. They dispel all the sentimental distortions inevitably surrounding prevailing stock-price levels, revealing the underlying hard fundamental realities.
The deadline for filing 10-Qs for “large accelerated filers” is 40 days after fiscal quarter-ends. The SEC defines this as companies with market capitalizations over $700m. That currently includes every single stock in the flagship S&P 500 stock index, which includes the biggest and best American companies. As Q1’18 ended, the smallest SPX stock had a market cap of $2.1b which was 1/410th the size of leader Apple.
The middle of this week marked 39 days since the end of calendar Q1, so almost all of the big US stocks of the S&P 500 have reported. The exceptions are companies running fiscal quarters out of sync with calendar quarters. Walmart, Home Depot, and Cisco have fiscal quarters ending in April instead of the usual March, so their “Q1” results weren’t out yet as of this Wednesday. They’ll arrive in the coming weeks.
The S&P 500 (SPX) is the world’s most-important stock index by far, weighting the best US companies by market capitalization. So not surprisingly the world’s largest and most-important ETF is the SPY SPDR S&P 500 ETF which tracks the SPX. This week it had net assets of a staggering $256.7b! The iShares Core S&P 500 ETF and Vanguard S&P 500 ETF also track the SPX with $149.9b and $88.5b of net assets.
The vast majority of investors own the big US stocks of the SPX, as they are the top holdings of nearly all investment funds. So if you are in the US markets at all, including with retirement capital, the fortunes of the big US stocks are very important for your overall wealth. Thus once a quarter after earnings season it’s essential to check in to see how they are faring fundamentally. Their results also portend stock-price trends.
Unfortunately my small financial-research company lacks the manpower to analyze all 500 SPX stocks in SPY each quarter. Support our business with enough newsletter subscriptions, and I would gladly hire the people necessary to do it. For now we’re digging into the top 34 SPX/SPY components ranked by market capitalization. That’s an arbitrary number that fits neatly into the tables below, but a commanding sample.
As of the end of Q1’18 on March 29th, these 34 companies accounted for a staggering 41.7% of the total weighting in SPY and the SPX itself! These are the mightiest of American companies, the widely-held mega-cap stocks everyone knows and loves. For comparison, it took the bottom 426 SPX companies to match its top 34 stocks’ weighting. The entire stock markets greatly depend on how the big US stocks are doing.
Every quarter I wade through the 10-Q SEC filings of these top SPX companies for a ton of fundamental data I dump into a spreadsheet for analysis. The highlights make it into these tables below. They start with each company’s symbol, weighting in the SPX and SPY, and market cap as of the final trading day of Q1’18. That’s followed by the year-over-year change in each company’s market capitalization, a critical metric.
Major US corporations have been engaged in a wildly-unprecedented stock-buyback binge ever since the Fed forced interest rates to deep artificial lows during 2008’s stock panic. Thus the appreciation in their share prices also reflects shrinking shares outstanding. Looking at market-cap changes instead of just underlying share-price changes effectively normalizes out stock buybacks, offering purer views of value.
That’s followed by quarterly sales along with their YoY changes. Top-line revenues are one of the best indicators of businesses’ health. While profits can be easily manipulated quarter-to-quarter by playing with all kinds of accounting estimates, sales are tougher to artificially inflate. Ultimately sales growth is necessary for companies to expand, as bottom-line earnings growth driven by cost-cutting is inherently limited.
Operating cash flows are also important, showing how much capital companies’ businesses are actually generating. Using cash to make more cash is a core tenet of capitalism. While most of these elite US companies reported Q1’18 OCFs as they should, some obscured quarterly results by lumping them in with the past 6 or 9 months. So these tables only include Q1 operating cash flows if specifically reported.
Next are the actual hard quarterly earnings that must be reported to the SEC under Generally Accepted Accounting Principles. Late in bull markets, companies tend to use fake pro-forma earnings to downplay real GAAP results. These are derided as EBS earnings, Everything but the Bad Stuff! Companies often arbitrarily ignore certain expenses on a pro-forma basis to artificially boost their profits, which is very misleading.
While we’re also collecting the earnings-per-share data Wall Street loves, it’s more important to consider total profits. Stock buybacks are executed to manipulate EPS higher, because the shares-outstanding denominator of its calculation shrinks as shares are repurchased. Raw profits are a cleaner measure, again effectively neutralizing the impacts of stock buybacks. They better reflect underlying business performance.
Finally the trailing-twelve-month price-to-earnings ratio as of the end of Q1’18 is noted. TTM P/Es look at the last four reported quarters of actual GAAP profits compared to prevailing stock prices. They are the gold-standard metric for valuations. Wall Street often intentionally obscures these hard P/Es by using the fictional forward P/Es instead, which are literally mere guesses about future profits that often prove far too optimistic.
As expected given the largest corporate tax cuts in US history going live, the big US stocks generally reported spectacular Q1’18 results. Sales, OCFs, and earnings surged dramatically! But much of this tax-cut windfall was anticipated, as valuations remained dangerously high at the end of last quarter. It’s hard to imagine such blistering growth of such enormous mega-cap companies being able to persist for long.
Not surprisingly the S&P 500’s top-constituent list was little changed over the past year. Most of these elite American companies investors love only grew larger. Three stocks did claw their way into the top 34 since Q1’17, and their symbols are highlighted in light blue. Boeing, AbbVie, and DowDuPont saw their stocks soar enough to help knock out GE, IBM, and Altria from the ranks of the top 34 big US stocks.
From the ends of Q1’17 to Q1’18, the SPX itself powered 11.8% higher. This past year was one of great anticipation and euphoria for the expected big corporate tax cuts coming soon. These top 34 SPY stocks outperformed the markets considerably, with big average market-cap gains of 14.6% YoY. More capital inflows concentrating in fewer stocks highlights the increasing narrowness and riskiness of these toppy markets.
As bull markets mature, the breadth of their advances increasingly narrows. Investors flock into the best-performing stocks to chase their superior gains. Thus decreasing numbers of market-darling stocks are wielding outsized influence on overall stock-market fortunes. They shoulder more of the burden, which is a double-edged sword. When selling erupts in these leaders for any reason, it hits the broader markets hard.
Ominously the universally-adored and -owned mega-cap tech stocks still dominated the SPX at the end of Q1. That was despite the SPX suffering its first correction in 2.0 years, a sharp-yet-shallow plunge of 10.2% in just 9 trading days. That started to crack this past year’s extraordinary tech-stock euphoria, but that selloff was too short to really change psychology. So investors still love the leading technology stocks.
Apple, Alphabet, Amazon, and Microsoft tower over the rest of the top SPY stocks, alone accounting for 1/8th of the entire SPX’s weighting! Facebook wasn’t far behind at 6th after Warren Buffett’s Berkshire Hathaway. In Q1’18 these top 5 tech stocks indeed seemed to earn their keep, with average results far better than the other big US companies. They reported incredible average top-line sales growth of 29.8% YoY!
At 30% annual revenues growth, sales will double about every 2.6 years. That’s never sustainable for long even in far-smaller companies, and is economically impossible at the size and scale of the mega-cap techs. Despite their awesome and amazing success, these 5 US companies aren’t going to take over the entire US economy. This past year was an extreme outlying anomaly that inevitably has to mean revert.
Never before have stock markets relentlessly powered higher to seemingly-endless new record closes with the lowest volatility ever witnessed. Especially with the stock markets literally trading at bubble valuations all year. Never before have the entire American business and investment communities been able to spend over a year eagerly anticipating the biggest corporate tax cuts in US history. 2017 wasn’t normal!
I’ve been blessed to spend decades studying the markets full-time, all day every day. And certainly one of the most stunning revelations is how broadly and deeply stock-market fortunes affect nearly everything else in the entire economy! Record-high stock markets breed epic levels of optimism about the future and thus abnormally-high levels of spending, both from businesses and individuals. That greatly boosts sales.
These mega-cap tech stocks had the great fortune of riding that big-tax-cuts-coming-soon wave of stock-market euphoria. Americans eager to splurge flocked to buy Apple’s latest iPhones and iPads, which are great but expensive products. If the stock markets had ground lower breeding pessimism, that big Apple upgrade cycle would’ve lengthened as people made do with older devices with almost the same functionality.
Businesses rushed to capitalize on the gold rush of surging consumer spending, advertising heavily on both Alphabet and Facebook. They also rushed to expand their online operations by leasing cloud servers and services from Amazon, Microsoft, and Alphabet. What will happen to this huge business spending to market and grow as stock markets roll over and consumers and companies pull in their horns?
The sheer levels of spending over this past totally-unique year that fueled such incredible sales growth aren’t sustainable. Both consumers and businesses racked up huge new debt to fuel their euphoric buying binges. They won’t keep stacking on debt with interest rates rising and the once-in-a-lifetime extreme optimism on big tax cuts soon fading. The mega-cap tech stocks, and all big US stocks, face slowing sales.
The real shock is not that sales ballooned so dramatically in such a perfect year for bullish sentiment, but that Wall Street is arguing such growth is the new norm. These top 34 SPX companies that had reported Q1 results as of this Wednesday had $789.0b of revenues. Those would double about every 5.3 years even at Q1’s average 14.0% YoY growth rate. These 34 companies can’t gobble up the entire world economy!
These big US stocks’ operating cashflows in Q1 highlight the unsustainability of these results. The 24 top SPY components reporting Q1 OCFs saw incredible average gains of 52.5% YoY. There’s just no way giant mature companies can keep expanding their businesses’ cash generation at such blistering rates. OCFs leverage revenues both ways, so naturally sharply-rising sales are going to catapult OCFs higher.
Of course profits also amplify sales, so the corporate profits of these top 34 US companies surged even more dramatically in Q1. They averaged gargantuan growth of 45.9% YoY! While not sustainable, that’s a reasonable 3.3x the increase in sales. The total earnings of the 31 of these 34 giant companies that had reported as of the middle of this week ran a colossal $116.0b, making for profit margins of about 1/7th.
While those are big profits, surprisingly they only grew 3.4% quarter-on-quarter from Q4’17. Remember that quarter was the last under the old higher-corporate-tax regime. Given all the corporate-tax-cut hype leading into Q1’18 which was again the tax cuts’ maiden quarter, you’d think corporate profits would’ve surged far more than 3.4% QoQ. But that gain is somewhat understated given big adjustments on Q4’17 results.
In my recent essay on big US stocks’ Q4’17, I discussed how nearly all of these elite companies had to make significant-to-huge earnings adjustments to account for the new Tax Cuts and Jobs Act of 2017. With corporate tax rates being slashed, the values of existing deferred tax assets and liabilities on many corporate balance sheets changed dramatically. These differences had to be flushed through Q4 income statements.
Basically companies that had overpaid or underpaid their taxes in the past had to adjust for new lower corporate tax rates going forward. The absolute value of all these adjustments for the top 34 US stocks was a mind-boggling $209.2b in Q4’17, dwarfing actual GAAP profits of $112.2b! But interestingly it was a wash overall, with positive profits boosts and negative profits hits evening out to a net gain of just $2.7b.
Without those big one-time corporate-tax-cut earnings adjustments, overall top-34-SPY-company profits were up 6.0% QoQ in Q1’18. That’s big, not still not as hefty as stock-market euphoria seemed to imply was coming. When corporate-sales growth inevitably stalls, so will profits growth. If revenues actually start to shrink, earnings will decline at several times that rate. So the peak-earnings fears are righteous!
Since it’s hard to imagine a better year psychologically for driving big spending than 2017, odds are the corporate-sales environment will mean revert lower with stock-market fortunes and sentiment. And if that indeed proves true, corporate profits have hit or are hitting their high-water mark for a long time to come. We really may not see such crazy earnings growth again until the next secular stock bull tops years into the future.
The SPX-leading market-darling tech stocks Alphabet, Amazon, Microsoft, and Facebook rely heavily on business spending. Last year was a banner year for business confidence on the coming huge tax cuts, leading to giant leaps in spending for online advertising and back-office data services. When the next recession inevitably arrives with the overdue stock bear, much of that euphoric spending will wither and reverse.
On the valuation front, these big US stocks were frightfully expensive exiting Q1’18. They sported scary average trailing-twelve-month price-to-earnings ratios of 46.0x. That’s closing in on double the classic bubble threshold of 28x! Over the past century and a quarter or so, the average fair-value valuation for the stock markets was half that at 14x. So there’s no doubt these stock markets are exceedingly expensive.
Since these TTM P/E ratios came from the end of Q1 before its big surge in earnings, we can attempt to adjust for that. With these top 34 SPX companies’ profits up 6.0% QoQ excluding tax-cut adjustments, we can generously assume valuations fell 10%. But even if that is somehow 20%, the big US stocks’ average P/Es are still well into bubble territory at 36.8x. Traders have anticipated tax-cut profits for over a year.
Thus the big corporate tax cuts’ earnings boost has long since been more than fully priced in. But maybe offsetting these extreme overvaluations a bit is those big TCJA adjustments in Q4. One reason the P/Es of Alphabet and Microsoft are so high is they took colossal $9.9b and $13.8b hits to earnings in Q4’17 to account for lower corporate taxes going forward. These are one-time distortions not reflective of ongoing operations.
But on the other hand, other top US companies had massive profits boosts in Q4 that artificially lowered their own P/Es. Chief among them is Berkshire Hathaway, which enjoyed a gargantuan $29.1b boost to profits in Q4 due to that one-off TCJA adjustment. So its TTM P/E collapsed from 26.4x at the end of Q4 to 10.8x at the end of Q1. The unique Q4 earnings impacts of the tax cuts distorted various P/Es in both directions.
Seeing 33 of these top 34 SPX companies report big one-time profits adjustments in Q4’17 is surely unprecedented in all of history. These won’t roll off of trailing-twelve-month P/E-ratio calculations until the Q4’18 results come out early next year. So unfortunately we are going to suffer distorted P/Es through all of 2018. But since the overall TCJA adjustment was largely flat, the P/E skew should largely cancel out too.
One of the most-bullish arguments for stock markets going forward is large US companies are taking their higher profits from the corporate tax cuts and plowing them into stock buybacks. So Wall Street is salivating at that pushing stock markets to new record highs. Recent developments with mighty Apple, the king of stock buybacks, demand caution on that bullish thesis. Stock buybacks can’t overcome selloffs.
In its Q1’18 results recently reported on May 1st, Apple added a staggering $100b to its record stock-buyback campaign taking it to $310b total. Last quarter alone, Apple spent an all-time-record-for-the-entire-stock-markets $22.8b buying back its own shares! Nevertheless Apple’s stock still slipped 0.9% lower in Q1 because of the SPX correction. Even relatively-mild selling overpowered epic stock buybacks!
If Q1’18 is indeed as good as it gets or darned close, these bubble-valued stock markets are in serious trouble as sales growth mean reverts dramatically lower. That will be leveraged several times or so in earnings. Seeing the top 34 SPY companies’ sales up an average of 14.0% YoY, and the 5 mega-cap tech stocks’ sales skyrocketing 29.8% YoY, can’t be sustainable. This cycle’s peak earnings is likely really here.
That greatly ups the odds that a new bear market is awakening. Thanks to extreme central-bank easing led by the Fed’s radically-unprecedented 7-year-long zero-interest-rate-policy, the SPX’s bull ballooned to freakish proportions. As of late January’s peak, it had extended to a monster 324.6% gain over 8.9 years! That was nearly the second-largest and easily the second-longest stock bull in all of US history.
The powerful stock-market melt-up over the past year to many new all-time highs was a typical late-bull sentiment thing amplified by big-tax-cut-soon-hope euphoria. That extreme optimism greatly boosted corporate sales and profits, but nowhere near enough to rescue valuations from bubble extremes. As psychology mean reverts to neutral then overshoots to bearish, earnings won’t protect stocks from getting mauled.
Despite the recent mild correction, these stock markets remain exceedingly overvalued and dangerous. The big US stocks’ Q1’18 fundamentals prove corporate earnings still remain too low to justify such lofty stock prices. That’s terrifying in 2018 where the Fed and ECB will collectively remove $950b of liquidity compared to last year! Regardless of valuations, this alone would plunge these stock markets into a new bear.
Investors really need to lighten up on their stock-heavy portfolios, or put stop losses in place, to protect themselves from the coming central-bank-tightening-triggered valuation mean reversion in the form of a major new stock bear. Cash is king in bear markets, as its buying power grows. Investors who hold cash during a 50% bear market can double their stock holdings at the bottom by buying back their stocks at half-price!
SPY put options can also be used to hedge downside risks. They are still relatively cheap now with complacency rampant, but their prices will surge quickly when stocks start selling off materially again. Even better than cash and SPY puts is gold, the anti-stock trade. Gold is a rare asset that tends to move counter to stock markets, leading to soaring investment demand for portfolio diversification when stocks fall.
Gold surged nearly 30% higher in the first half of 2016 in a new bull run that was initially sparked by the last major correction in stock markets early that year. If the stock markets indeed roll over into a new bear in 2018, gold’s coming gains should be much greater. And they will be dwarfed by those of the best gold miners’ stocks, whose profits leverage gold’s gains. Gold stocks skyrocketed 182% higher in 2016’s first half!
Absolutely essential in bear markets is cultivating excellent contrarian intelligence sources. That’s our specialty at Zeal. After decades studying the markets and trading, we really walk the contrarian walk. We buy low when few others will, so we can later sell high when few others can. While Wall Street will deny the coming stock-market bear all the way down, we will help you both understand it and prosper during it.
We’ve long published acclaimed weekly and monthly newsletters for speculators and investors. They draw on my vast experience, knowledge, wisdom, and ongoing research to explain what’s going on in the markets, why, and how to trade them with specific stocks. As of the end of Q4, all 983 stock trades recommended in real-time to our newsletter subscribers since 2001 averaged stellar annualized realized gains of +20.2%! For only $12 per issue, you can learn to think, trade, and thrive like contrarians. Subscribe today!
The bottom line is the big US stocks’ latest quarterly results proved amazingly good. Sales and profits both rocketed higher as extreme stock-market optimism and big-corporate-tax-cut hopes fueled massive spending. But that was still nowhere near enough to justify stocks’ bubble valuations, portending way-weaker stock markets ahead. That will sap last year’s exceptional confidence and erode results going forward.
As businesses and consumers pull in their horns and stop borrowing to spend big in this new rising-rate environment, revenues and earnings growth will stall and reverse. That’s what happens after euphoric bull-market tops. That will fuel stock selling dragging the markets lower, which will further weigh on both sentiment and spending. So there’s a very-good chance we are seeing peak earnings in this bull-bear cycle.
Hard rock lithium deposits are going to fill the demand as they are more evenly geographically distributed across the globe and are less dependant on a changing climate for production than lithium brine production. They are more and more filling the supply gap.
According the United State Geological Survey’s 2018 Mineral Commodity Summaries, Australia was the largest producer of lithium. It produced 18,700 MT of lithium last year, up 3,300 MT from the previous year. The 34-percent increase has been attributed to two new spodumene operations that ramped up production to meet strong demand.
Hard rock lithium mining relies on traditional methods of drilling and processing, and presents a more reliable method of mining and opens up deposits closest to major markets within. Hard rock mining is giving countries a competitive advantage over countries dependant on lithium brines for production, as it did with Australia.
Here are five exploration companies that are currently looking for the next hard rock deposit.
Azincourt Energy (TSX-V: AAZ)
The company controls 6,368 hectares of pegmatite-rich ground in Manitoba, with historical Li20 numbers & drill-ready targets. Crews are on the ground, beginning prep work for the 2018 work program. Mapping/sampling will get underway, then min 3000m of drilling. Azincourt’s Lithium Two project is adjacent to QMC’s Cat Lake Lithium Project
The company’s properties include the Irgon Lithium Mine project, a Rare-metal (Li-Ta-Cs) deposit within the Irgon pegmatite located immediately north of Cat Lake Manitoba. The deposit contains an estimated resource of more than 1.2M tonnes of spodumene-bearing pegmatite grading 1.5% Li2O.
Far Resources, an exploration and development company, will become a leader in the energy metals sector by defining a lithium resource with their Zoro project located in the Snow Lake region of Manitoba. In 1956, the lithium deposit was considered an historic “reserve” based on the drilling of 1.8 million tonnes grading 1.4% Li2O to a depth of 305 m.
MGX Minerals Inc plans to drill the company’s Case Lake lithium project in May. Drilling will total 8,000 metres followed by an additional 7,000 metres of planned drilling in the fall. There have been 8,400 metres of drilling completed at Case Lake to date. Substantial spodumene mineralization intersections have included:
PWM-17-34: 1.81 percent lithium oxide (Li2O) over 17.0 metres;
PWM-17-33: 2.11 percent Li2O over 11.0 m;
PWM-17-10: 1.74 percent Li2O over 15.06 m;
PWM-17-08: 1.94 percent Li2O over 26.0 m.
The Case Lake property is located in Steele and Case townships, 80 kilometres east of Cochrane in Northeastern Ontario close to the Ontario-Quebec border. The Case Lake pegmatite swarm consists of five dikes. MGX currently has a paid-up 20-per-cent working interest in Case Lake and four other lithium hardrock properties in Ontario controlled by Power Metals
The Cass spodumene pegmatite swarm is located 80 km east of Cochrane and 100 km north of Kirkland Lake, NE Ontario. It is accessible year-round by road via the Translimit Road which connects Ontario and Quebec.
Major miners need to boost their reserves, and one way for them to do that is to invest in junior mining exploration corporations to find the next great deposit.
Here is a list of the companies that Barrick Gold (TSX-V: ABX) has invested in.
1) ATAC Resources (TSX-V: ATC)
ATAC is a Yukon-based exploration company focused on developing Canada’s only known Carlin-type gold district alongside Barrick at its Rackla Gold Property. ATAC and Barrick have partnered to explore the Rackla Gold Property’s Orion Project, with Barrick having the option to earn up to a 70% interest in Orion by spending $55 million in exploration.
Alicanto is an ASX-listed mineral exploration Company focused on the exploration and development of a portfolio of gold projects in the prospective geological province of the Guiana Shield in South America.
Its main project, the Arakaka Gold Project, lies in an area that has been the source of more the 1Moz of alluvial and saprolite gold production, with a 100-year mining history.
The project covers an area of over 300km2 which is 100% held by Alicanto Minerals Ltd. and fully funded by Barrick Gold Corp. earning a 65% interest in the project with a US$10m funding commitment over 4 years from 1 March 2016.
Royal Road Minerals was founded in 2010 by the original founders and shareholders of Lydian International Ltd. Whilst at Lydian, the team discovered, financed and developed the +5 million oz Amulsar Gold deposit in Armenia.
Barrick agreed to purchase 9,875,876 ordinary shares at a purchase price of 16 cents per share for for $5-million. Royal Roads Minerals is exploring for Copper and Gold deposits in Central and South America.
Midas Gold Corp., through its wholly owned subsidiaries, is focused on the exploration and, if warranted, site restoration and development of gold-antimony-silver deposits in the Stibnite-Yellow Pine district of central Idaho that are encompassed by its Stibnite Gold Project.
Midas Gold Corp. entered into an agreement with Barrick Gold Corp., whereby Barrick will purchase 46,551,731 common shares of Midas Gold for $38,065,907 (U.S.). The investment will result in Barrick owning 19.9 per cent of the issued and outstanding shares in Midas Gold.
Barrick’s investment supports Midas Gold’s continued efforts to permit the Stibnite gold project so that Midas Gold can build and operate a world-class mining operation that addresses legacy environmental impacts and generate economic benefits to the local community.
Ask some gold bugs why Gold has not broken out yet and you will probably get the usual answers. Some will say it’s due to manipulation or price suppression. Others will mention the current rally in the US Dollar (while neglecting that the previous decline in the greenback was unable to take Gold to a new high). Few would say the fundamentals are not in place. No one can know for certain but Gold’s fundamentals have not improved over the past year and are not where they need to be to support a breakout.
The vast majority of history shows us that Gold is inversely correlated to real interest rates (or real yields). It makes perfect sense because Gold has been money for thousands of years. When real rates decline, the real return on money in the bank or in a treasury bill or note decreases. Gold benefits. The corollary is also true. Rising real interest rates indicate stronger real return on money invested in the aforementioned instruments. That’s negative for Gold.
Real interest rates have actually strengthened for nearly 18 months, as the chart below shows. Gold has performed well during that period because of weakness in the US Dollar as well as some anticipation of an escalation in long-term yields.
Given the rise in real interest rates, it is not a surprise that investment demand for Gold has been weak. Gold bugs frequently trumpet strong demand from China and how tight the physical Gold market is but in reality, investment demand is what drives bull markets. Investment demand tends to respond to or follow negative and/or declining real interest rates.
One way of measuring investment demand in real time is by following the amount of Gold held in the GLD trust. As we can see below, investment demand (by this metric) confirmed the rebound in Gold in the first half of 2016. However, it has essentially been flat over the past 18 months as Gold rebounded from the low $1100s all the way to $1360.
Gold & Tons in GLD Trust
So if Gold’s fundamentals are not bullish and investment demand is flat, what conditions need to change that would benefit Gold?
Obviously, Gold needs declining real interest rates. It needs some combination of an acceleration in inflation and a pause or slowdown in short-term yields including the Fed Funds rate. Inflation has risen in recent quarters but short-term yields have risen faster as evidenced by the increase in real interest rates (shown in our first chart).
Weeks ago Gold was sniffing a breakout as long-term bond yields, such as the 10-year and 30-year yield were also threatening a breakout. An upside break in long-term yields would be significant for Gold as it would signal an increase in inflation expectations and pressure the balance sheets of both an over-indebted corporate sector as well as a government already running the largest non-recessionary, peacetime budget deficit in history. However, bond yields have yet to breakout even as the masses have positioned for such. In other words, Bonds could be ripe for a counter-trend rally which means yields would be ripe for a counter-trend decline.
An upside breakout in bond yields could also potentially lead to a new uptrend in the Gold to Stocks ratio. It could cause issues in the economy and stock market which would in turn, benefit Gold. While Gold is in a new uptrend relative to Bonds (not shown) and is currently firming against foreign currencies, it has not been able to sustain strength relative to the equity market. From an intermarket perspective this is the link that has been missing to put Gold in a real bull market.
Gold, Gold/Foreign Currencies, Gold/Equities
It would not be a surprise to see Gold correct lower as fundamentals are not currently bullish and the US Dollar (the weakness of which supported Gold throughout 2017) is rebounding with potentially more upside. Although inflation is increasing, it has not increased fast enough to counteract the rise in short-term yields. A future breakout in long-term yields could be the missing catalyst for Gold as it would cause issues in the economy and stock market and lead to softer Fed policy. Until then, traders and investors would be wise to focus on the junior miners that can add value to their projects in the meantime. To follow our guidance and learn our favorite juniors for the next six months, consider learning more about our premium service.
Please click here now. Double-click to enlarge this daily gold chart. Gold has traded in a drifting rectangle pattern for most of this year.
Please click here now. Double-click to enlarge this important weekly gold chart.
The rectangle pattern on the daily chart is part of a huge weekly chart base pattern. That has been forming for about five years.
Note the enormous increase in trading volume over the past two years. This is extremely positive technical action.
Trump appears ready to make an announcement concerning US government relations with Iran today. That could re-open the oil-for-gold trade in Turkey and other countries.
It’s unlikely that anyone in China really cares very much about what the US government announces today, tomorrow, or in the future, and rightly so.
In another five years it’s unlikely that anyone in India will care what the US government does either.
This is the beginning of what I call the China and India oriented “gold bull era”. It’s an era that is rekindling respect amongst global money managers for gold as the ultimate asset and portfolio returns enhancement tool.
I’m adamant that the correct minimum amount of gold that should be held in a stock and bond portfolio to maximize returns is 20%. The ideal portfolio may be 30% bonds, 30% stocks, 30% gold, and 10% blockchain.
Regardless, long term precious metals investors should ignore short term market noise and focus on the big weekly chart base pattern for gold. Note the price targets of $1500 and $1750.
That’s where to book some profits and/or buy put options in expectation of a significant pullback in the price.
Please click here now. Double-click to enlarge this dollar-yen chart. Another bear market rally for the dollar is nearing completion. That bodes well for a gold price surge towards my first target at $1500.
Most analysts claim the dollar is rallying because of rate hikes, but the cold truth is that the dollar has collapsed after almost every recent rate hike.
I’m projecting this trend will continue and likely accelerate. Please click here now. If investors are racing to buy US bonds to get higher rates, why does this T-bond chart look like something the cat dragged in?
Many investors are indeed buying bonds because of rate hikes, but the Fed’s QT program is countering their buying. All the mainstream media hype about higher rates and the dollar has produced nothing more than wet noodle rallies for both bonds and the dollar.
It’s just a matter of time before more rate hikes and QT from Jay Powell push the T-bond under my 142 “line in the sand” zone.
When that price zone fails, panic amongst institutional money managers could begin. That could usher in a substantial new leg down for the US stock market.
“Some investors and institutions may not be well positioned for a rise in interest rates, even one that markets broadly anticipate, and, of course, future economic conditions may surprise us, as they often do.” – Jay Powell, US Fed Chair, May 7, 2018.
I believe the surprising economic conditions that Jay alludes to in that statement are going to be surprisingly inflationary.
On that note, please click here now. Double-click to enlarge this GDX chart.
Many Western gold mining stocks are trading at 1998 prices, and a large part of the problem relates to the deflationary collapse in US money velocity that began in 1995.
A new era of inflation is beginning in the West. That is going to turn gold stocks into the kind of safe haven that bullion functioned as during the previous 1995 – 2014 deflationary era.
GDX is trading in a tight rough range between $21 and $23.25. All inflation and bull era enthusiasts should be buyers of GDX and component stocks in this range. Use put options to manage emotional jitters.
Aggressive traders can buy a two-day close above $23.25 with an initial target of $25, and this is likely the beginning of a much longer-term move that should see GDX rise to new all-time highs as gold reaches $1750.
Stewart Thomson is no longer an investment advisor. The information provided by Stewart and Graceland Updates is for general information purposes only. Before taking any action on any investment, it is imperative that you consult with multiple properly licensed, experienced and qualified investment advisors and get numerous opinions before taking any action. Your minimum risk on any investment in the world is: 100% loss of all your money. You may be taking or preparing to take leveraged positions in investments and not know it, exposing yourself to unlimited risks. This is highly concerning if you are an investor in any derivatives products. There is an approx $700 trillion OTC Derivatives Iceberg with a tiny portion written off officially. The bottom line:
Are You Prepared?
Gold was enjoying a solid spring rally until a couple weeks ago, nearing major upside breakouts. But its nice advance has crumbled since, really weighing on sentiment. Gold fell victim to a rare major short squeeze in US Dollar Index futures. The surging USDX motivated gold-futures speculators to flee rather aggressively. But this will likely prove a short-lived anomaly, after which gold’s assault on highs will recommence.
Gold’s seasonally-atypical weakness over the past couple weeks is very important for speculators and investors to understand. It had nothing at all to do with fundamentals, but was completely driven by the hyper-leveraged gold-futures traders. These guys have long been fixated on the US dollar’s fortunes, looking to its benchmark US Dollar Index for trading cues. That can slave gold’s price to the dollar at times.
Six weeks ago, gold slumped to a major seasonal low of $1310 the day before the universally-expected 6th Fed rate hike of this cycle. The gold-futures traders fervently believe Fed rate hikes are very bearish for gold, so they usually sell leading into FOMC meetings with potential hikes. This has happened before every Fed rate hike of this cycle. The theory is higher US rates boost foreign investment demand for US dollars.
The ironic thing is modern history proves the opposite! Fed-rate-hike cycles are bearish for the US dollar and bullish for gold. The last cycle ran from June 2004 to June 2006, where the Fed hiked 17 times in a row for 425 basis points. Despite those aggressive and relentless rate hikes, the USDX still slipped 3.8% lower over that exact span while gold rocketed 49.6% higher! Clearly futures specs’ theory is sorely lacking.
The Fed’s current rate-hike cycle out of extreme zero-interest-rate-policy lows got launched in December 2015. Gold was hammered to a 6.1-year secular low leading into it, as futures specs were absolutely certain higher rates were bearish for gold and bullish for the USDX. Yet again they were proven dead wrong, wrong, wrong! As of the middle of this week, gold is up 23.0% since then while the USDX fell 5.5%.
You’d think after some market thesis fails to work over and over again for decades, traders would try something else. But not futures speculators, they are a stubborn lot. So leading into every likely Fed rate hike, they bid up the USDX and dump gold. Then immediately after those rate hikes the dollar fails to surge and gold doesn’t plunge, so they reverse those excessive trades driving the dollar down and gold up.
So like clockwork after the Fed’s latest rate hike in late March, gold started rallying as gold-futures specs bought back in. Gold enjoys a strong seasonal spring rally in April and May, which I discussed in depth last week. By mid-April, that propelled gold within spitting distance of a major bull-market breakout. Gold regained its $1365 bull-to-date high from July 2016 on an intraday basis on April 11th, but failed to push through.
Ironically futures speculators’ irrational obsession with the Fed was again to blame. That day the FOMC released the minutes from its March 21st rate-hiking meeting. Traders interpreted them as hawkish, so the USDX was bought and gold was sold. For 24 trading days in row between mid-March to mid-April, gold simply did the opposite of whatever the USDX did on every single day but one. The dollar ruled gold.
Gold managed to hover near $1350 multi-year-horizontal-resistance breakout territory for another week after those Fed minutes. But that started changing on April 19th. That day the USDX rallied 0.3%, which was actually its biggest up day in a couple weeks. USDX-futures speculators were excited because the yields on benchmark US 10-year Treasury notes crested 2.9%. Higher yields are great for the dollar, right?
For decades I’ve closely followed speculators’ collective gold-futures positions every week in the famous Commitments of Traders reports published by the CFTC. I discuss them and their implications for gold’s near-term price action in every weekly newsletter. But I haven’t had the time to dig deeply into USDX futures. The analysts who traffic in that realm said USDX short positions were the largest seen in several years.
The leverage inherent in currency speculation is extreme beyond belief. Since major currencies tend to move slowly, the margin requirements equate to maximum leverage of 50x, 100x, or even 200x! That compares to the decades-old legal limit in the stock markets of 2x. At 50x, 100x, or 200x, mere 2.0%, 1.0%, or 0.5% currency moves against traders’ positions would wipe out 100% of their capital risked. It’s crazy!
So when currency speculators are wrong, they have to exit positions fast or risk getting obliterated. The traders short USDX futures had no choice but to buy. The more long USDX futures they bought to offset and close their shorts, the faster the dollar rallied. That forced still more traders to buy to cover even if they were running more-conservative leverage. This self-reinforcing dynamic feeds on itself, fueling short squeezes.
As the USDX buying mounted, the dollar’s rally accelerated in subsequent days. Traders continued to use 10-year Treasury yields as a fundamental excuse for their purely technical trading, as within a week they crossed the psychologically-heavy 3% threshold to 3.03%. That was the highest seen since the very end of 2013! The USDX rallied 0.3%, 0.5%, and 0.7% in the initial few trading days of that buying to cover.
It had already become the biggest dollar short squeeze since soon after Trump won the election in late 2016. That heavy futures buying forced the USDX to surge 1.5% in those first 3 trading days. Although that sounds trivial, at 50x, 100x, or 200x leverage it hammers speculators to catastrophic 75%, 150%, or 300% losses! I wonder how these guys can sleep at night bearing such ridiculous and unforgiving levels of risk.
Gold-futures speculators run extreme leverage too, but much less than currency traders. This week a single gold-futures contract controlling 100 troy ounces of gold worth $130,500 only required speculators to keep $3100 cash margins in their accounts. That equates to 42.1x maximum leverage! For traders running at the edge, every 1% adverse move in gold would wipe out an insane 42% of their capital risked.
So these guys nervously watch gold on a minute-by-minute basis. And in a fascinating confirmation that gold is indeed a currency, they look to the US dollar for their trading cues. They started selling their gold-futures positions as the dollar started rallying. That drove gold 0.2%, 0.7%, and 0.9% lower in the first 3 trading days of that USDX short squeeze that ignited on April 19th, forcing gold down 1.9% overall to $1324.
Our lone chart this week looks at gold during this current Fed-rate-hike cycle superimposed on the long and short positions large and small speculators hold in gold futures. Again these are published once a week in those Commitments of Traders reports. All 6 Fed rate hikes of this cycle are also highlighted, to show how gold is bludgeoned lower leading into them which spawns strong rebound buying in their wakes.
While the weekly CoTs are current to each Tuesday, they are released late Friday afternoons. Thus the newest-available CoT when this essay was published covers the week ending April 24th. That includes those initial few trading days of that USDX-futures short squeeze. And it’s very illuminating, showing why gold was pummeled back down from major-breakout levels and its strong spring rally was short-circuited.
For pre-dollar-rally baselines, on Tuesday April 17th speculators held 284.2k long and 98.9k short gold-futures contracts. These were running 27% and 15% up into their own past-year trading ranges. Thus these traders had the capital firepower and room to still do about 3/4ths and 6/7ths of their near-term long buying and short selling. Of course buying gold-futures longs is bullish for gold, while shorting is bearish.
When gold-futures shorts are low, there’s always the risk speculators will aggressively sell on the right catalyst coming along. That forces gold’s price lower. And this unlikely dollar short squeeze erupting out of the blue proved that triggering event. On seeing the USDX surge, the gold-futures specs were quick to start jettisoning longs and ramping shorts. Thus gold fell 1.2% on the 1.4% USDX rally over that CoT week.
The magnitude of this initial gold-futures selling became evident in the next CoT report current to April 24th. During that CoT week, specs sold 7.9k gold-futures long contracts while adding another 15.6k on the short side. That made for big total CoT-week selling equivalent to 73.0 metric tons of gold. That is simply far too much for normal buying to absorb. Thus the only possible outcome was a lower gold price.
Just this week, the World Gold Council released its latest Gold Demand Trends report for Q1’18. That’s the definitive source for world gold fundamental supply-and-demand data. In Q1, global gold investment demand averaged 22.1t per week. So heavy gold-futures selling easily overwhelms that. Gold always falls when the futures specs get on a selling kick. They flood the market with too much short-term supply.
That dollar-short-squeeze reaction left specs’ collective long and short gold-futures positions running up 22% and 30% into their past-year trading ranges. So these traders still had room to do about 4/5ths of their likely near-term long buying, but expended a significant chunk of their shorting firepower. That left total spec shorts at a 12-CoT-week high of 114.5k contracts. The higher spec shorts, the more bullish gold gets.
Short positions in futures are bullish because they necessitate proportional near-term buying. In selling short, speculators essentially borrow futures from other traders to sell. The specs are legally obligated to buy back those contracts relatively soon to close out those trades and repay those effective debts. So futures shorts are guaranteed near-future buying, whether they are in the USDX, gold, or anything else.
This essay was penned and proofed Thursday, and then published Friday morning. The newest CoT data current to this Tuesday May 1st won’t come out until late Friday afternoon about 4 hours after this essay went live. So while I can’t wait to see the latest CoT, I can only speculate about it at this point. During this latest CoT week, the USDX-futures short squeeze continued which drove more spec gold-futures selling.
The dollar rally actually accelerated in this newest CoT week ending Tuesday, as shown by the sharp 1.9% rally in the USDX. Thus gold’s CoT-week selloff also grew to 2.0%. That was 2/3rds larger than the prior CoT week’s 1.2%. So odds are the gold-futures selling ballooned significantly in this latest CoT week. That implies another 35k to 40k gold-futures contracts were dumped, with the majority likely on the short side.
Assuming the prior week’s spec gold-futures-selling mix of 1/3rd long and 2/3rds short holds, total spec longs could’ve dropped another 12.9k contracts while shorts could’ve soared 25.8k. If that proves true, total spec longs and shorts could have been running near 14% and 54% up into their past-year trading ranges as of this Tuesday. That would mean the majority of the likely gold-futures shorting is already done!
While I don’t have the USDX-futures data and background to analyze in depth, odds are the USDX is in a similar opposite place. I suspect the majority of the dollar short covering has already run its course. That paves the way for this sharp dollar rally to at least peter out and probably reverse. Trade-war fears are going to flare again soon as the distraction of stocks’ Q1 earnings season passes, which is bearish for the dollar.
If you look at the chart above, the green line shows specs’ total gold-futures long contracts. Note even a CoT week ago that was trading below bull-market support. There is big room for these traders to flood into gold on the long side when the USDX inevitably stalls or reverses. They likely now have the capital firepower to do about 6/7ths of their potential near-term buying! That portends big gold upside in coming weeks.
While gold’s strong seasonal spring rally was interrupted by this surprise USDX-futures short squeeze, I doubt it was killed. Gold was driven to a new seasonal low of $1304 this week, under its previous $1310 of mid-March. Thus all the usual spring-rally buying in April and May will likely be compressed into this month alone! That means gold could enjoy a major mean-reversion bounce rally in the coming weeks.
During the 10 trading days as of the middle of this week since the dollar’s sharp rally started, gold has moved inversely proportionally to the USDX on every trading day but one. 8 of these trading days of the past couple weeks saw the dollar rally, and gold’s biggest losses of 0.9% both occurred on the dollar’s best up days of 0.7%. Gold’s down days were all about the same size as the dollar’s up days, mirror images.
But in the 2 trading days of the past couple weeks when the USDX retreated modestly, gold surged way out of proportion to the dollar’s weakness. These trivial 0.2% and 0.1% USDX slides allowed gold to rally a relatively-outsized 0.6% and 0.5%! Gold wants to rally, and will likely quickly surge back up near major-breakout levels soon after this dollar-rally pressure abates. And that’s likely going to prove very soon.
The mounting US/China trade war has been pushed out of the financial-media spotlight by Q1 corporate earnings, which have soared on the big corporate tax cut. But earnings season is winding down just as major trade-war deadlines are looming for the US to implement recent tariff announcements. The dollar looks far less attractive to foreign investors if tariff threats become reality, their capital will seek refuge elsewhere.
And though the extreme leverage inherent in gold futures enables their speculators to wield outsized influence on short-term price action, investors’ capital massively dwarfs the speculators’. So when investors’ vast funds start bidding on gold again, likely on the next major stock-market selloff driving demand for prudent portfolio diversification, gold-futures specs’ influence will be overwhelmed and drowned out.
Add in strong spring seasonals to all this, and gold has a fantastic foundation for a strong rebound rally. Speculators’ low gold-futures longs are very bullish, as they will rush to buy back in to ride any upside momentum in gold. Speculators’ mounting gold-futures shorts are increasingly bullish, as these will have to be covered and closed by buying offsetting longs. And investors’ super-low gold allocations are wildly-bullish.
So odds are gold’s atypical counter-seasonal drop in the last couple weeks driven by the surprise USDX short squeeze will soon reverse hard. It won’t take much buying to drive gold back up near those major bull breakout levels around $1365. And gold powering higher again will quickly turn sentiment around, with buying begetting more buying. The dollar depressing gold prices leaves this metal more bullish, not less so.
While investors can ride gold’s coming mean-reversion rebound in physical bullion itself or shares in the leading GLD SPDR Gold Shares gold ETF, far-better gains will be won in the stocks of its leading miners. They are already radically undervalued at today’s prevailing gold prices, and their profits tend to amplify underlying gold gains by 2x to 3x. This small contrarian sector’s upside is vast, dwarfing everything else.
With gold still so near a major bull-market breakout, it’s ironic gold stocks remain so deeply out of favor. Between our weekly and monthly newsletters, we have 30 open gold-stock and silver-stock trades added in the past year. As of this week near gold’s lows, fully 25 had average unrealized gains of 18%. One gold miner added in late November is already up 95%! The 5 other trades had average unrealized losses of just 5%.
When gold inevitably rebounds, these unrealized gains are going to explode higher. Buying low first is necessary before selling high later to multiply wealth. That means adding gold stocks when you least want to, when they’re hated. That’s what we do at Zeal. We spend all our time relentlessly studying the markets so you don’t have to, and share our acclaimed research through our popular financial newsletters.
They draw on my vast experience, knowledge, wisdom, and ongoing research to explain what’s going on in the markets, why, and how to trade them with specific stocks. As of the end of Q4, we’ve recommended 983 stock trades in real-time to our newsletter subscribers since 2001. They’ve averaged big annualized realized gains of +20.2%, well over double stock markets’ long-term average! For only $12 per issue, you can learn to think, trade, and thrive like contrarians. Subscribe today and get deployed!
The bottom line is gold’s recent weakness is the result of a rare major short squeeze in US Dollar Index futures. The resulting dollar rally spooked gold-futures speculators, who rushed to sell to avoid getting slaughtered by their extreme leverage. While that short-circuited gold’s spring rally, this anomaly won’t last. Gold-futures speculators and gold investors are far too bearish and under-allocated, with big room to buy.
The USDX short covering is likely running out of steam, which will clear the way for gold’s big seasonal spring rally to resume. All that delayed buying will likely be compressed into May, and drive gold back up near recent major-bull-breakout levels. Any dollar/gold reversals will force gold-futures specs to quickly buy to cover their ballooning shorts. The resulting rally will entice in long-side traders, then gold is off to the races.
Cypress Development Corp. (TSX-v: CYP) / (OTCQB: CYDVF) / (Frankfurt: C1Z1) killed it with their maiden NI 43-101 compliant lithium resource estimate yesterday! The whisper number was 4 to 6 million Inferred tonnes of Lithium Carbonate Equiv. (“LCE“), (which would have been a tremendous result), but Global Resource Engineering Ltd. determined there’s an estimated6.54 million metric tonnes LCE.
Perhaps even more exciting than the size of the resource, (we knew it would be large), was something I never even considered, 44% (2.857 M tonnes) of the resource is in the “Indicated” category…. I thought it would 100% Inferred. That just goes to show how strong the continuity of the lithium zones are in this giant, thick, tabular formation — where 21 of 23 drill holes ended in mineralization.
In the boxed paragraphs above, notice the added level of evidence or “confidence” (highlighted in green) needed to be designated an Indicated resource vs. Inferred. The sizable Indicated portion will make it easier and less costly to reach PEA stage (expected in Sept/Oct). Importantly, Cypress is funded through PEA, especially as a wave of options & warrants will likely be exercised on the back of this news.
Putting this into perspective, consider that Lithium Americas’(formerly Western Lithium) (TSX: LAC) / (NYSE: LAC) clay-hosted Li project (then called Kings Valley) also in Nevada, had the following maiden mineral resource estimate:
It had an impressive 53% of its total resource classified asIndicated, but the absolute size of the resource was 24% & 16%, respectively, the # of tonnes of LCE in Cypress Development’s maiden Indicated & Inferred resource.
Bacanora Minerals’ clay project in Sonora Mexico had the following maiden resource:
Bacanora Minerals’ (London: BCN) maiden resource was 25% the size of Cypress Development’s Inferred resource. However, Bacanora had no tonnage at all in the Indicatedcategory.
Fast forward to today, Lithium Americas’ project now hosts a combined Measured & Indicated resource just shy of 6 million tonnes LCE, plus an Inferred inventory of about 2.3 million tonnes. Recall that LAC has a clay-hosted lithium project, also in Nevada. An entirely new (will replace the prior) Preliminary Feasibility Study (“PFS“) on LAC’s clay project is expected in June.
Likewise, Bacanora’s net attributable resource has soared to 4.1 million tonnes LCE (Measured & Indicated), and 3.2 million tonnes (Inferred). Bacanora’s BFS-stage clay project is in Sonora Mexico.
Near-term Catalysts to Keep Market on its Toes
Readers should know that there are important near-term catalysts leading up to a PEA as soon as August, (I’ve been saying in September/October). First and foremost, ongoing metallurgy test results will be released. The full maiden mineral resource technical report will be filed on sedar this month. And, assays from up to 30 new drill holes are coming this Spring & Summer. Management expects to be in talks with prospective strategic partners, but there’s no rush because, as mentioned, Cypress is funded through PEA.
Cypress should be able to substantially upgrade its NI 43-101 compliant Indicated & Inferred resource to the Measured& Indicated categories, potentially ending up with a resource around the same size and level of confidence (albeit lower grade) as Lithium Americas’ & Bacanora’s. In fact, in today’s press release management stated that it believes 30 additional drill holes would be sufficient to upgrade the Inferred portion to Indicated.
Cypress’ Indicated-only portion at nearly 3 M tonnes LCE is larger than most hard rock, and many brine projects around the world. Cypress is trading at and Enterprise Value (“EV“) to tonne LCE ratio of just C$3.5, (share price C$0.33 intra-day May 1st) and that’s on a fully-diluted share count. Compare that to C$18/t for Lithium Americas (I assume 25% of LAC’s EV is attributable to its Nevada clay project), C$27/tfor Bacanora, and an average of C$92/t for several other global hard rock and brine projects (most peers in the chart below are more advanced than Cypress).
The graph below, from a recent Lithium Americas’ corporate presentation, shows where clay-hosted lithium projects fit into the conventional world of hard rock (mostly in western Australia) and brine (mostly in Chile & Argentina). Generically speaking, clay is right in the middle on both operating costs and lithium grade. What the chart doesn’t show is that the most significant clay projects (BCN’s, LAC’s and now CYP’s) are quite sizable – much larger than the average conventional lithium project.
To recap, this is a major advancement for Cypress. It puts them on the map, not just U.S. & North American maps, but global maps. A KEY TAKEAWAY is that the amount of TIME & CASH needed to drill out the entire resource for a Bank Feasibility Study (“BFS“) next year should be relatively low, especially compared to the time & capital deployed by Lithium Americas & Bacanora to get to PFS & BFS, respectively. Cypress is now (in my opinion only) in a position to deliver a BFS in mid-to-late 2019 at a total cost (including company overhead) of < C$10 million.
Also of major importance in today’s press release,
Preliminary test work conducted at SGS Canada Inc (Lakefield) and Continental Metallurgical Services, LLC has shown the material exhibits high lithium extractions with short leach times. Lithium extractions of greater than 80% can be achieved in 4 to 8 hours using conventional dilute sulfuric acid leaching. Currently, Hazen Research Inc is conducting additional leach tests and preliminary results confirm high lithium extractions for new mineral zones.
The presence of acid leachable lithium presents a significant cost savings by avoiding calcine and regrind of material during processing. Preliminary results also show the consumption of sulfuric acid and other reagents are relatively low.
The production of high-purity lithium carbonate was demonstrated in the laboratory using conventional recovery methods.
The large tonnage of the deposit lends potential to target higher-grade lithium mineralization for the PEA…. {since the scale is so large, there’s a chance the Company can capture higher-grade lithium values (in a subset of the overall resource) for the upcoming PEA}
Improvements in metallurgy to, “greater than 80% extraction” (I’m assuming in the low 80%’s) was reported in the press release. The last news on that front had stated, “up to 80%.” Also noteworthy was that management produced a small amount of high-purity lithium carbonate using conventional recovery methods.
Bottom line, there’s an increasing chance that due to favorable mineralogy, Cypress Development Corp. (TSX-v:CYP) / (OTCQB: CYDVF) / (Frankfurt: C1Z1) will be able to avoid certain significant steps in Bacanora’s process flow sheet. That could meanNOT having to do a pilot plant, potentially saving ten(s) of millions in cap-ex and 1-2 years of project development / construction time.
Cypress’ resource is at or near surface, down to over 120 meters (and is mostly open at depth), the anticipated strip ratio is essentially zero (call it 0.1 to 1). By contrast, Bacanora’s strip ratio is expected to be 3.9 to 1. That represents a huge difference in mining costs. As a reminder, the biggest advantage the Company has over both Lithium Americas & Bacanora is that over 75% of its resource is hosted in non-refractory clay. That’s why management believes it might not need to operate a pilot plant (avoiding calcine & regrind of material during processing would make the flow sheet a conventional leach process).
Management has delivered a blockbuster maiden resource, > 6 million tonnes of LCE(combined Indicated & Inferred). Therefore, Cypress need never worry again about resource size, they already have huge scale and could potentially reach BFS-stage much faster and considerably cheaper than LAC & BCN did.
Disclosures: The content of this article is for information only. Readers fully understand and agree that nothing contained herein, written by Peter Epstein of Epstein Research[ER], (together, [ER]) about Cypress Development Corp., including but not limited to, commentary, opinions, views, assumptions, reported facts, calculations, etc. is to be considered implicit or explicit investment advice. Nothing contained herein is a recommendation or solicitation to buy or sell any security. [ER] is not responsible under any circumstances for investment actions taken by the reader. [ER] has never been, and is not currently, a registered or licensed financial advisor or broker/dealer, investment advisor, stockbroker, trader, money manager, compliance or legal officer, and does not perform market making activities. [ER] is not directly employed by any company, group, organization, party or person. The shares of Cypress Development Corp. are highly speculative, not suitable for all investors. Readers understand and agree that investments in small cap stocks can result in a 100% loss of invested funds. It is assumed and agreed upon by readers that they will consult with their own licensed / registered financial advisors before making investment decisions.
At the time this interview was posted, Peter Epstein owned shares and/or stock options in Cypress Development Corp.and the Company was an advertiser on [ER].Readers understand and agree that they must conduct their own due diligence above and beyond reading this article. While the author believes he’s diligent in screening out companies that, for any reasons whatsoever, are unattractive investment opportunities, he cannot guarantee that his efforts will (or have been) successful. [ER] is not responsible for any perceived, or actual, errors including, but not limited to, commentary, opinions, views, assumptions, reported facts & financial calculations, or for the completeness of this article or future content. [ER] is not expected or required to subsequently follow or cover events & news, or write about any particular company or topic. [ER] is not an expert in any company, industry sector or investment topic.
The Oreninc Index fell in the week ending April 27th, 2018 to 37.75 from an updated 45.59 a week ago as the number of deals fell despite some broker action returning.
A calmer and less volatile week all round with the presidents of North and South Korea meeting for the first time in decades, thawing tensions over the north’s nuclear ambitions, whilst in the US, president Donald Trump eased his position on sanctions against Russian aluminium producer Rusal. Maybe spring is in the air and the world is feeling more positive.
Another range-bound week for gold, this time ending in negative territory as the US dollar strengthened, although there are signs that gold stocks are starting to strengthen.
On to the money: total fund raises announced more than quadrupled to C$96.3 million, a four-week high, which included one brokered financing, a four-week low, and one bought deal financing, also a four-week low. The average offer size also more than quadrupled to C$4.8 million, a four-week high. However, the number of financings decreased to 20, a four-week low.
Gold closed down at US$1,324/oz from US$1,336/oz a week ago. Gold is now up 1.63% this year. Meanwhile, the US dollar index continued to strengthen and closed up at 91.54 from 90.31 a week ago. The van Eck managed GDXJ gave up ground and closed down at US$33.03 from US$33.49 last week. The index is down 3.22% so far in 2018. The US Global Go Gold ETF also fell to close down at US$12.99 from US$13.04 a week ago. It is down 0.12% so far in 2018. The HUI Arca Gold BUGS Index closed down at 182.04 from 184.18 last week. The SPDR GLD ETF saw a growth week as its inventory grew to 871.20 from 865.89 tonnes where it had been for nine-days straight.
In other commodities, silver’s recent growth spurt deflated and closed down at US$16.51/oz from US$17.11/oz a week ago. Copper also gave up a lot of ground as it closed down at US$3.06/lb from US$3.15/lb last week. Oil consolidated despite a slight loss on the week to close down at US$68.10 a barrel from US$68.40 a barrel a week ago.
The Dow Jones Industrial Average lost some ground and closed down at 24,311 from 24,462 last week. Canada’s S&P/TSX Composite Index put in a strong growth week as mining stocks showed growth to close at 15,668 from 15,484 the previous week. The S&P/TSX Venture Composite Index closed down at 783.76 from 804.96 last week.
Summary:
Number of financings decreased to 20, a three-week low.
One brokered financing was announced this week for C$15m a three-week low.
One bought-deal financing was announced this week for C$15m, a three-week low.
Total dollars nearly doubled to C$96.3m, a three-week high.
Average offer size grew to C$4.8m, a three-week high.
Financing Highlights
SilverCrest Metals (TSX-V: SIL) announced a C$15 million bought deal financing
Syndicate of underwriters led by PI Financial and Cormark Securities for 7.1 million shares @ C$2.10.
15% over-allotment Option.
Net proceeds will be used to continue exploration and drilling to deliver an updated resource estimate and maiden Preliminary Economic Assessment for the Las Chispas project in Sonora. Mexico.
Major Financing Openings:
Africa Energy (TSX-V: AFE) opened a C$57.98 million offering on a best efforts basis. The deal is expected to close on or about May 4, 2018.
Silvercrest Metals (TSX-V: SIL) opened a C$15 million offering underwritten by a syndicate led by PI Financial on a bought deal basis. The deal is expected to close on or about May 18, 2018.
Pacton Gold (TSX-V: PAC) opened a C$4 million offering on a best efforts basis. Each unit includes a warrant that expires in 36 months. The deal is expected to close on or about May 22, 2018.
Max Resource (TSX-V: MXR) opened a C$3.75 million offering on a best efforts basis. Each unit includes half a warrant that expires in 24 months.
Major Financing Closings:
Nemaska Lithium (TSX-V: NMX) closed a C$99.08 million offering on a best efforts basis.
Trilogy Metals (TSX-V: TMQ) closed a C$31.48 million offering underwritten by a syndicate led by Cantor Fitzgerald Canada on a bought deal basis.
Stina Resources (TSX-V: SQA) closed a C$12.5 million offering on a best efforts basis. Each unit included half a warrant that expires in 36 months.
Ashanti Gold (TSX-V: AGZ) closed a C$2.64 million offering on a best efforts basis.
Company News
Prospero Silver (TSX-V: PSL) provide an update on planned exploration work on its Mexican projects for 2018.
The key objective is to complete first-pass, proof-of-concept drill testing of three projects in the Altiplano belt of northern Mexico: Bermudez, Buenavista and Trias. Neither Trias or Bermudez have been drilled before.
About 6,000m of diamond drilling is planned.
A 4th hole for Pachuca SE project may be drilled once drilling is complete at the projects above.
Analysis
Having recently announced a fund raise, the work plan shows that Prospero will continue to drill test the targets it has identified via its geological hypothesis for discovering large, blind silver deposits. Whilst the news release did not explicitly state that its strategic partner Fortuna Silver (TSX:FVI) would co-fund this exploration program, that seems likely given the technical success of the 2017 exploration program and that Fortuna has yet to select a project to joint-venture under its strategic agreement with Prospero.
ORENINC MINING DEAL CLUB Access to high-quality, pre-vetted financing opportunities www.miningdealclub.com
MEET US AT THE INTERNATIONAL MINING INVESTMENT CONFERENCE MAY 15-16, 2018, VANCOUVER, CANADA Oreninc Presentation: Tuesday, May 15th, 1:00 – 1:20pm
A time-tested mantra for the US stock market is, “Sell in May and go away.”
The depth of a stock market sell-off that begins in May depends on where the United States economy sits in the business cycle. In the early stages of the cycle, sell-offs that begin in May are great buying opportunities.
As the business cycle peaks, the US stock market has a nasty habit of not just losing upside momentum in May, but suffering a horrific crash in September or October.
Tomorrow is the next FOMC meeting and there’s clearly a new sheriff in central bank town.
I refer to Ben Bernanke as Dr. Jeckyll and Jay Powell as Mr. Hyde. The bottom line is that Powell is proceeding with aggressive rate hikes and quantitative tightening (QT).
With the Fed now deploying a major hiking cycle while the business cycle is in a late stage, the more appropriate mantra for 2018 could be, “Sell in May or get blown away!”
Please click here now. Double-click to enlarge. Note the price zone on this Dow chart that I’ve defined as a key line in the sand for the US stock market.
Some Fed speakers have talked about the potential for the central bank to become more aggressive, given the inflationary implication of tax cuts coming at this late stage of the business cycle. If Powell himself makes any such statement this week it could create an institutional investor panic. That would likely send the Dow tumbling under my line in the sand zone.
Please click here now. Stock market investors who bought only in recent years should give serious consideration to the use of put options as a strategy to mitigate the fast-growing risks that the US central bank is putting on their table.
My personal stock market focus is China and India, and to a lesser degree South Korea and Japan. These markets can crash along with the US market, but they are poised to recover more quickly and offer vastly more long-term upside potential than US markets.
Most neocons think that North Korea’s Kim responded to Trump threatening him. I don’t believe Kim or most North Koreans are threatened by Trump at all. Trump did show Kim that if North Korea wants to spew endless war mongering propaganda about America, he can do so too. He simply showed Kim how silly and outdated this propaganda is for the modern era.
Peace on the Korean peninsula is coming not because of silly “hawk talk” from Trump but because North Korea’s government is ready to make economic deals and move away from pure communism. Trump has likely offered significant economic carrots to Kim in return for dialing back its nuclear weapons programs.
“Some big investors see warning signs ahead for markets but are holding their positions. Egyptian billionaire Naguib Sawiris is taking action: He’s put half of his $5.7 billion net worth into gold.” – Bloomberg News, May 1, 2018.
Please click here now. Sawiris is arguably one of the world’s biggest gold stock investors. He’s a master investor with a target of $1700 to $1800 for bullion.
Sawiris wants to see more hardcore business owners on the boards of gold mining companies. His opinion is that there are too many miners and bankers on these boards, and to really succeed in what I call the “gold bull era”, more businessmen are needed. I agree!
Please click here now. Double-click to enlarge. Sawiris is one of the largest shareholders in Australia’s Evolution Mining stock, and it’s pretty clear he’s riding a winning horse. Evolution is the number two gold producer in Australia now and it’s magnificently poised to prosper in the China and India oriented gold bull era.
I have a long-term target of $100 a share for Evolution. Investors can be comfortable paying as much as $10 for this fabulous company. In the $5 to $3 area, I’m an eager buyer on every 25cents dip and an eager seller of a third of what I buy on rallies that carry the stock 50cents higher than my buy price.
I cover Evolution (and other key Aussie miners) on my junior miners site at www.gracelandjuniors.com It’s a key component of my extensive “Thunder Down Under” portfolio.
Please click here now. Double-click to enlarge. Gold bullion is performing exactly as I’ve projected it would over the past couple of weeks. Excitingly, it’s now entering my key $1310 to $1280 buy zone.
Investors who took my recommendation to buy put options in the $1370 area should begin booking juicy profits on those options now. Book more profits on more options on any deeper weakness under $1300 ahead of this Friday’s jobs report release.
I don’t expect any serious upside gold price fireworks to occur until the Fed’s June meeting is complete. That will almost certainly see Powell oversee another rate hike and a ramp-up of QT. That should shock US stock and bond markets and blast gold higher. Having said that, gold is oversold now. In the days following the jobs report, a decent move higher is likely in the cards for gold price enthusiasts.
Please click here now. Double-click to enlarge. For the past few years, key Chinese gold jewellery stocks and Aussie miners have soared higher while GDX and most Western miners have languished. I think that’s about to change, with GDX set to join the upside fun, regardless of what happens to bullion in the medium term.
Yesterday’s high-volume day should be noted. Days where volume spikes tend to suggest a minor trend rally or decline is almost finished. Some GDX components (like Barrick) have soared higher while bullion has swooned. That hasn’t happened in a meaningful way since the heady inflationary days of the 1960s and 1970s. The inflation that will be created by launching tax cuts in the late stage of the business cycle is only beginning, and investors need to get positioned in gold stocks now to benefit.
Investors should focus any buying of protective put options more on bullion than gold stocks. Regardless, gold bullion is poised for good second half of the year performance, and gold stocks are poised for a great one!
Recent activity in exploration and acquisitions in North America for the next supply of platinum reveals a troubling situation for South African platinum mining, which presents opportunities for platinum companies in safer jurisdictions.
If you conduct a brief survey of headlines about platinum mining in South Africa, a stark picture is revealed.
JP Morgan Cazenove recently reviewed the SA platinum sector. South Africa accounts for 70 per cent of global mine supply and, at current prices, JP Morgan estimated about 60 per cent (2.6 million ounces) of South African mines are cash negative. The report commented “the outlook for the platinum price in 2018 to 19 is bleak.”
Part of this problem is that South Africa’s platinum miners resemble a “dysfunctional oligopoly” and are currently increasing supply despite depressed platinum prices with no significant improvement in the situation expected until 2020.
The report from JP Morgan Cazenove showed just how dire the situation is for SA miners and predicted that the year of change would be in 2020 as efforts to keep unprofitable mines going at enormous expense failed.
South African Mineral Resources Minister Gwede Mantashe said at a platinum conference there was no crisis in the sector. This comment nearly choked Northam Platinum CEO Paul Dunne with a breakfast sausage when hearing this willfully ignorant assessment at the conference.
The eastern limb of South Africa’s platinum belt has been hit by over 400 incidents of social unrest impacting mining operations since the start of 2016, according to data compiled by Anglo American Platinum and provided to Reuters.
The data does not provide estimates on production or revenue losses and does not compare with earlier periods. But it provides an alarming snapshot of a region in a perpetual state of unrest that has undermined the viability of some operations.
In response to this deteriorated operating environment, South African miners have been looking abroad and one acquisition has renewed Platinum exploration interest in North America.
South African miner, Sibanye Gold Ltd. announced the $2.2-billion takeover of Stillwater back in 2017. The company has since changed its name to Sibanye-Stillwater to reflect this change of focus for the company.
One Canadian firm has agreed to buy 282 mining claims just west of the Stillwater Mining complex with the hope of expanding mining. Stillwater West PGE-Ni-Cu project, consists of 44-square kilometres adjacent to, and contiguous with, Sibanye-Stillwater’s high-grade Platinum PGE mining operations, in Montana, USA.
Group Ten’s (TSX-V: PGE) acquisition of the highly-prospective Stillwater West project positions the company as the second-largest landholder in the Stillwater ultramafic complex.
The company’s claims cover two groups in Custer National Forest on the East Boulder plateau in the Beartooth Mountain Range. It’s along the Johns-Manville, or J-M reef, which boasts some of the world’s richest deposits of platinum and palladium.
The high-grade J-M Reef deposit and other PGE-enriched Reef-type sulphide horizons in the Stillwater complex share many similarities with the highly prolific Merensky and UG2 Reefs in the Bushveld complex, while the lower part of the Stillwater complex shows the potential for much-larger-scale disseminated and high-sulphide PGE-nickel-copper-type deposits, such as the Platreef, Waterberg and Mogalakwena mines, that occur in the northern limb of the lower Bushveld complex.
Before any major new development occurs, Group Ten Metals must do additional geological work to determine the true extent and nature of the PGE mineralization as their ground is not directly analogous with the ultra high-grade reef style deposit of their neighbor, President and CEO Michael Rowley state in a telephone interview.
“There’s no question there is polymetallic mineralization there. It’s a question of how much, and, is it minable? It is a great time to answer these questions as it appears the market is in the process of a turnaround. Money has begun to come back in to the sector, and commodities are starting to get a lot of attention again.”
The company recently identified 12 major geophysical conductive anomalies from a 1,914 line kilometer magnetic survey of the property Michael Rowley stated:
“We are extremely encouraged by the size, strength and number of conductive targets identified at Stillwater West…our new insights into the geology of the Ultramafic and Basal Series of the complex. We see potential for multiple deposit types and indications of a much larger mineralized system than has been previously recognized in this under-explored part of the Stillwater Complex. We are especially excited about the similarities in the setting and style of mineralization at the Stillwater West Project to those seen in the world-class Platreef deposits of the lower Bushveld Complex.”
Rowley founded Group Ten in 2006. He said the company struggled to hold on during the commodity collapse but emerged in a good position on the other end.
Along with bringing on technical expertise with former employees of Sibanye-Stillwater, the company has acquired an extensive database on the property, including a significant drilling assays and core library which could yield important new information. This gives the company an in depth understanding of the property.
If conditions deteriorate as predicted by JP Morgan’s platinum report, Platinum miners are going to need to find news sources to mine. Group Ten Metals Stillwater property presents potential new source for platinum and palladium as well as a suite of other in demand metals..

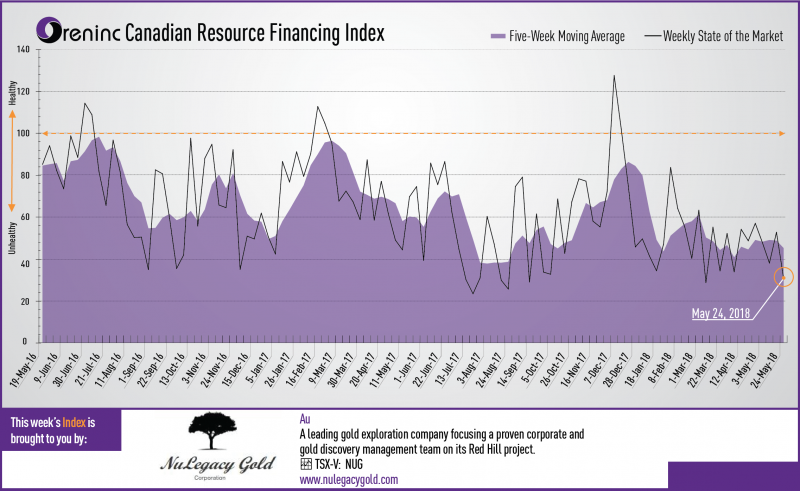


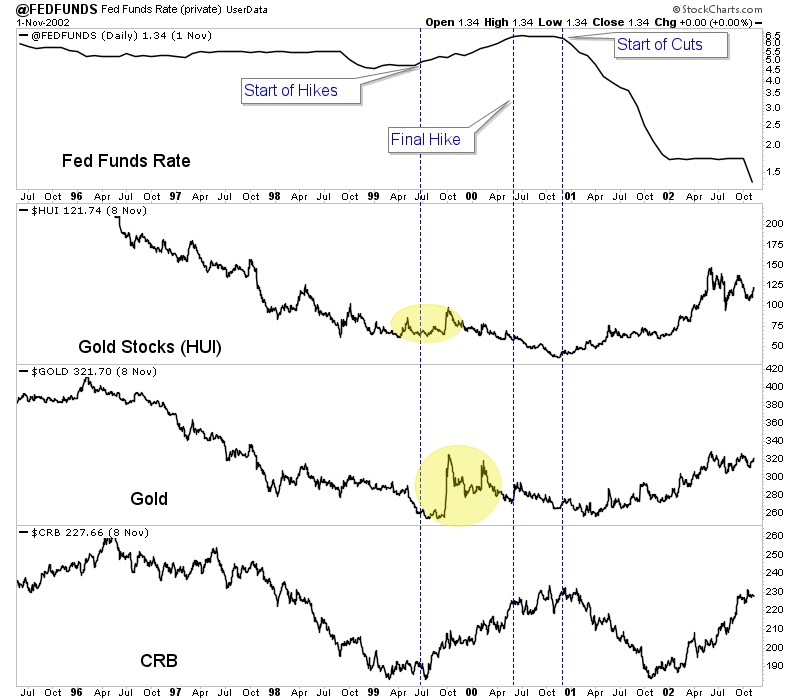

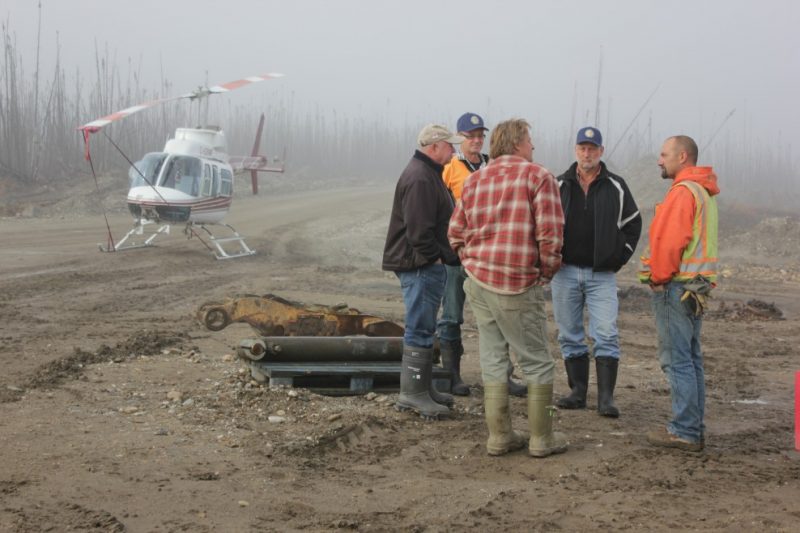
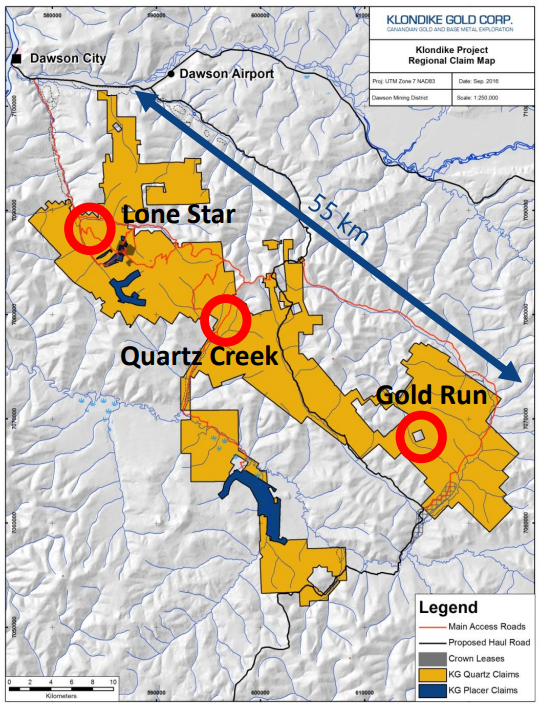


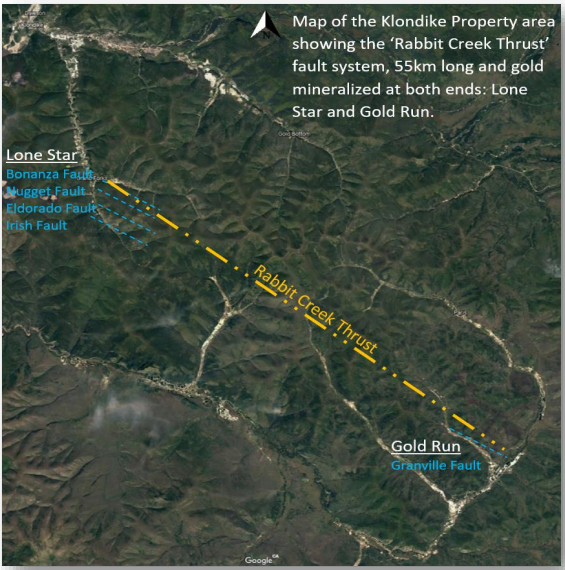
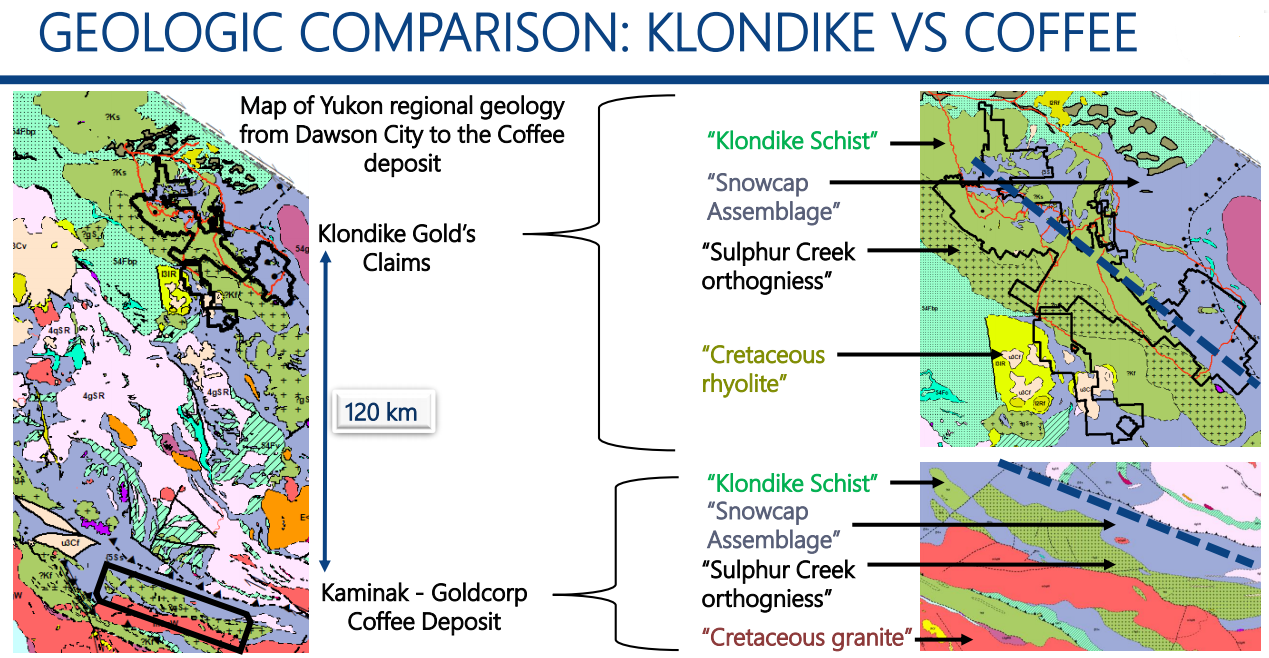
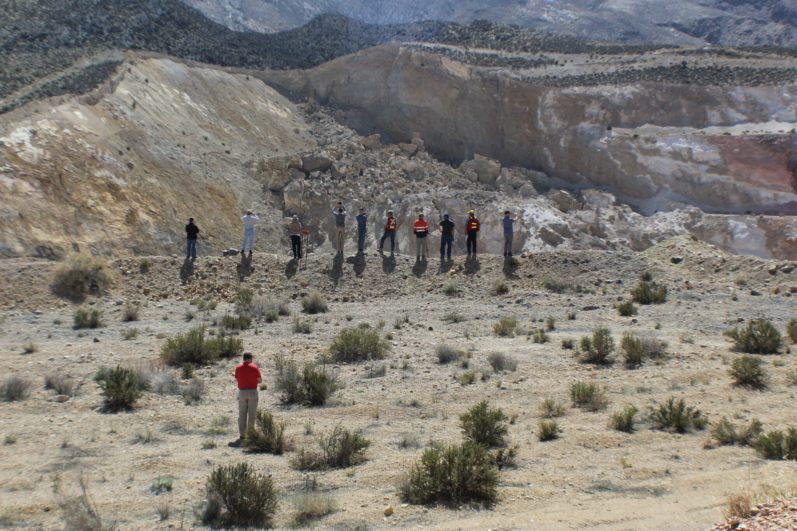


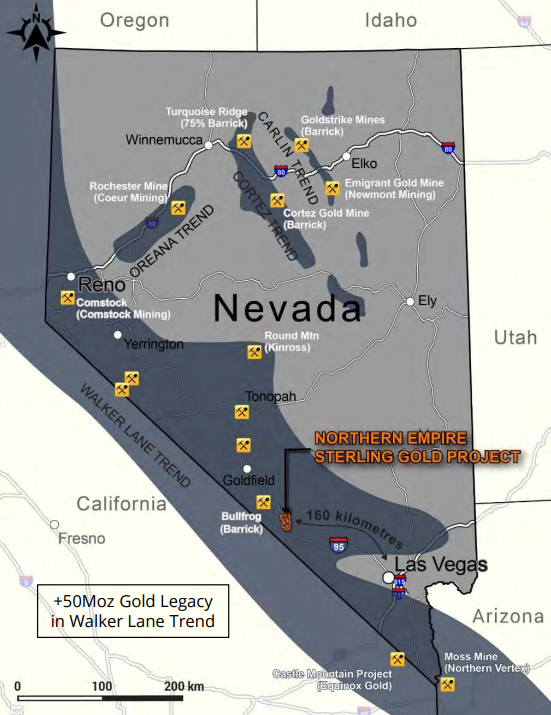

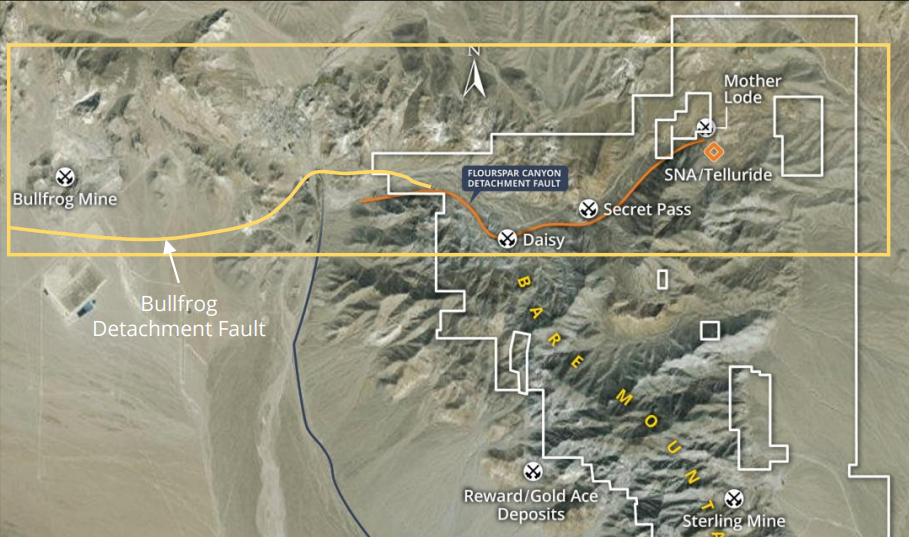
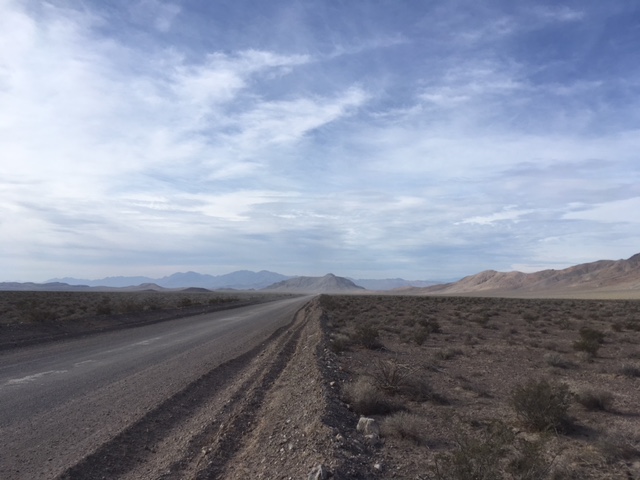

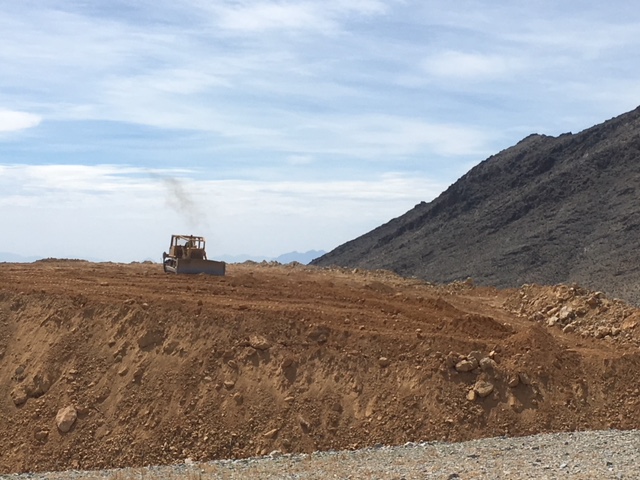
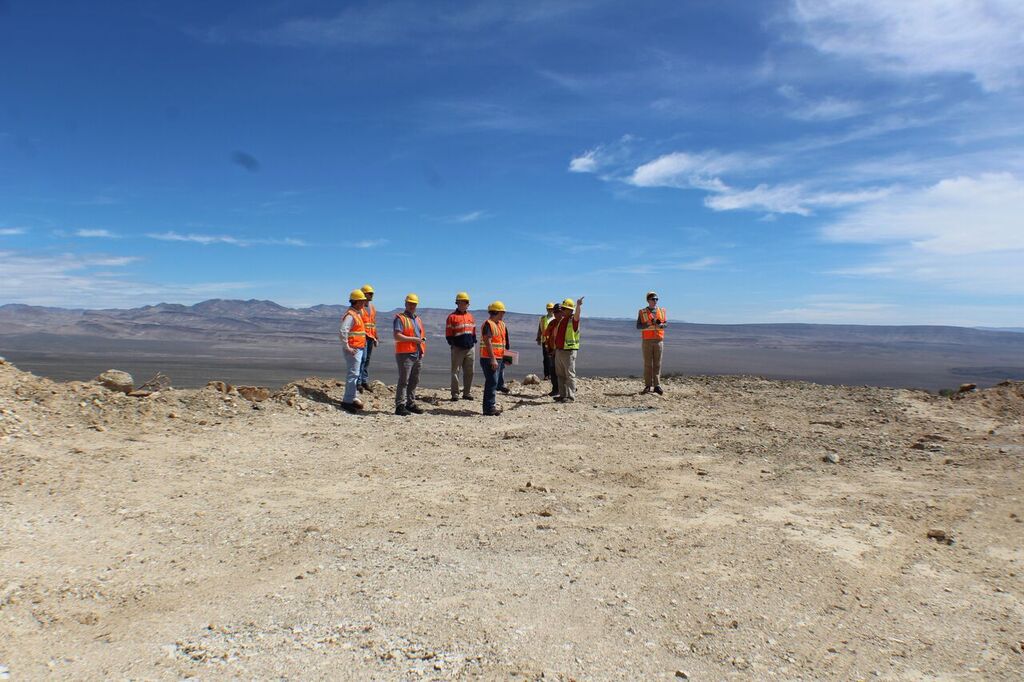
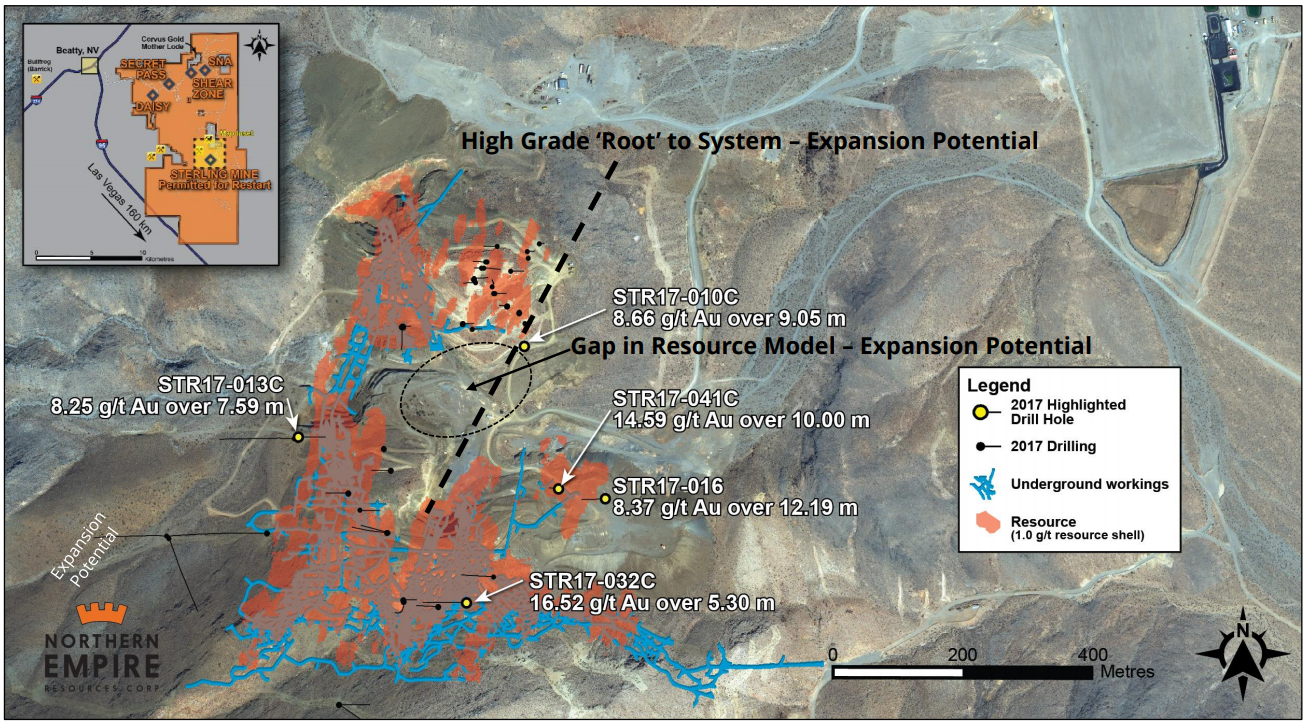 Sterling Gold Project Mineralization – Core Shack
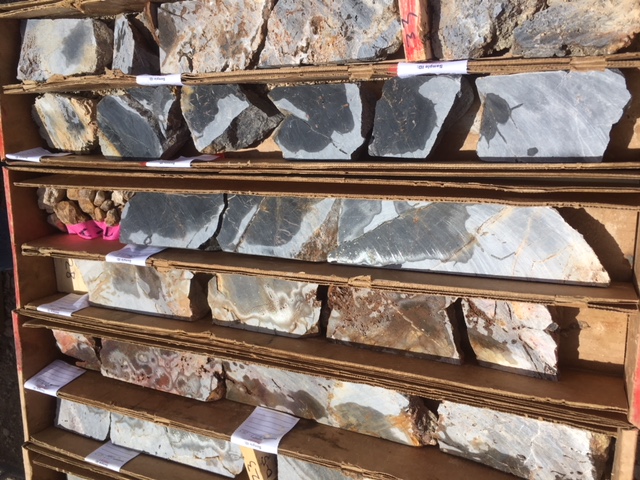
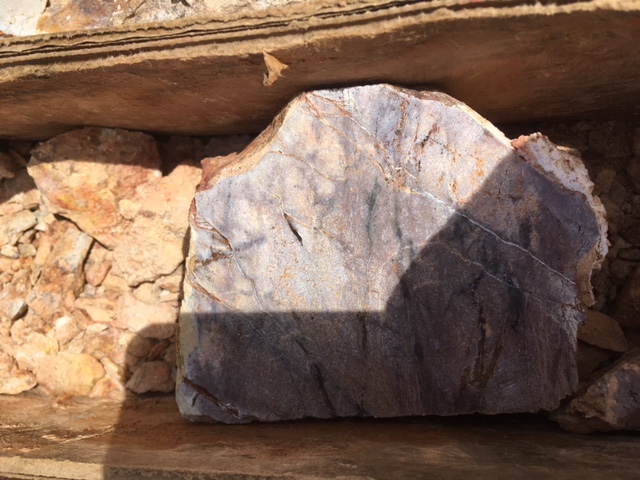
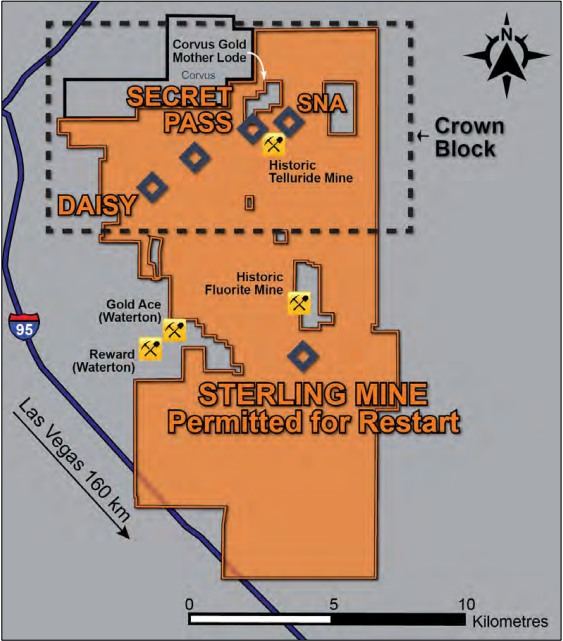
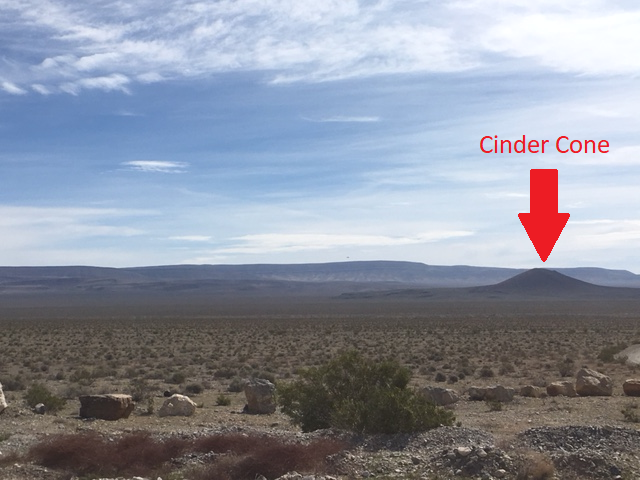
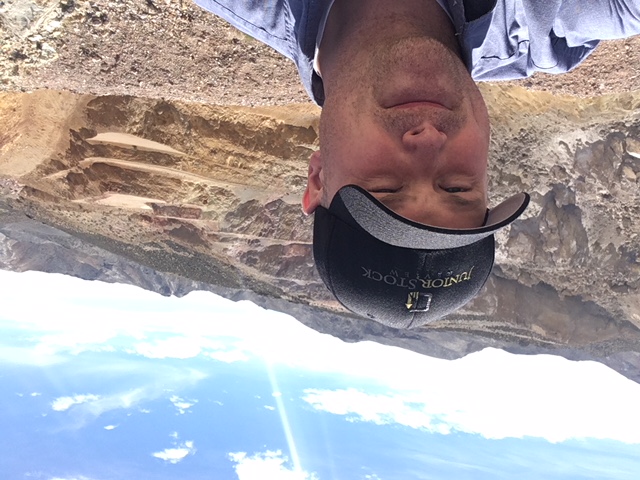
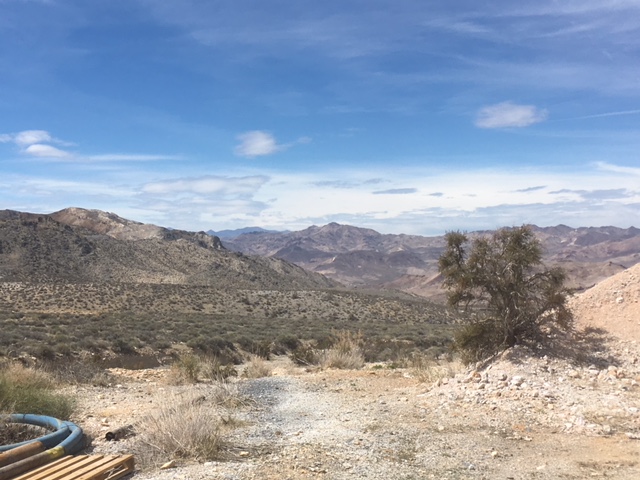
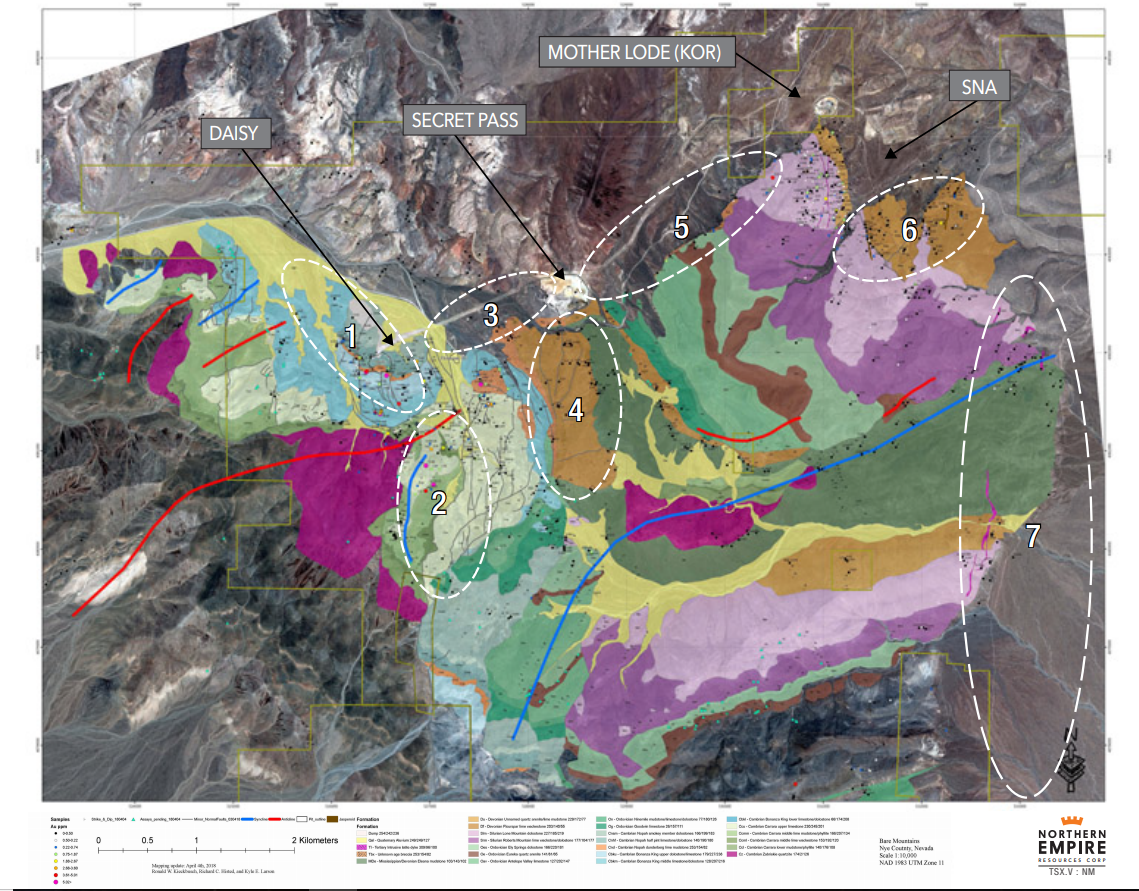
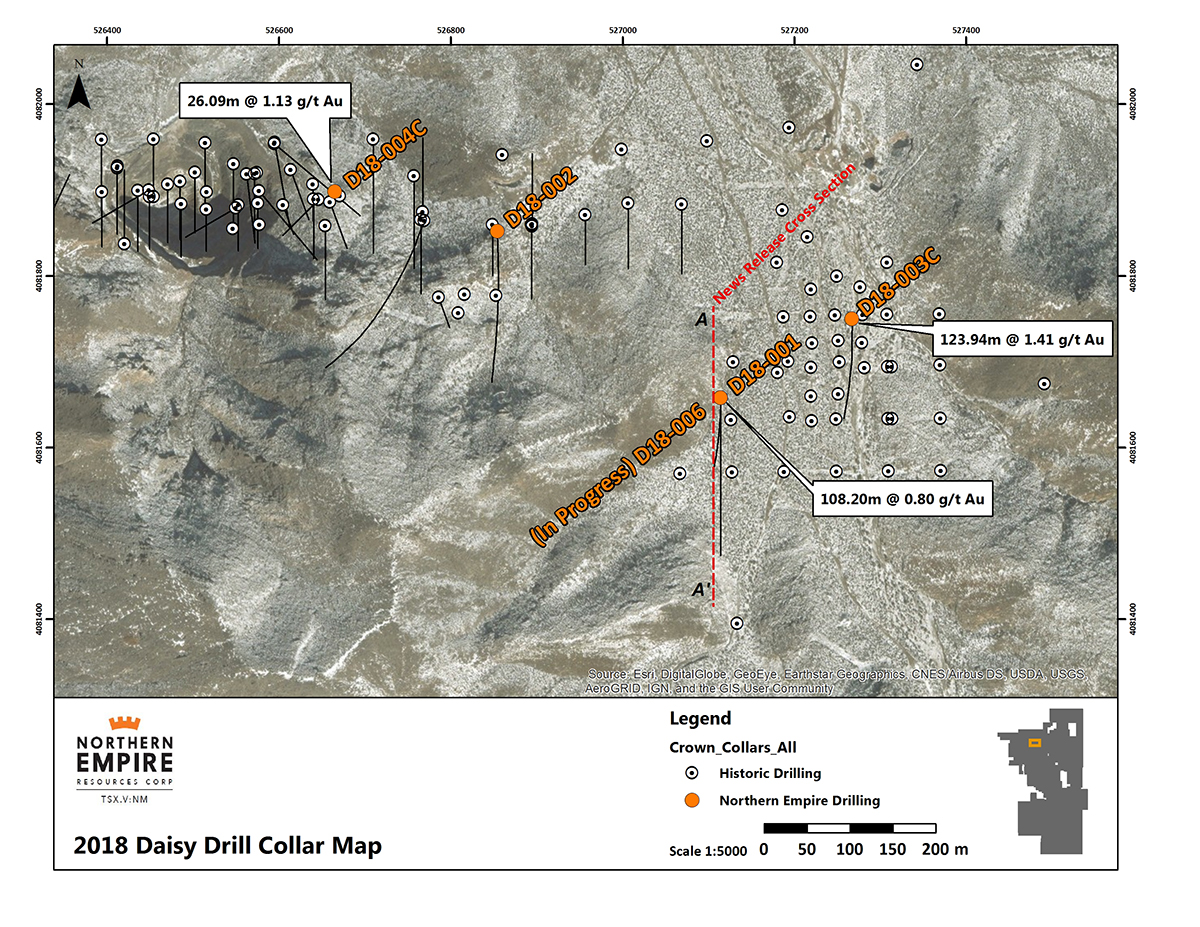
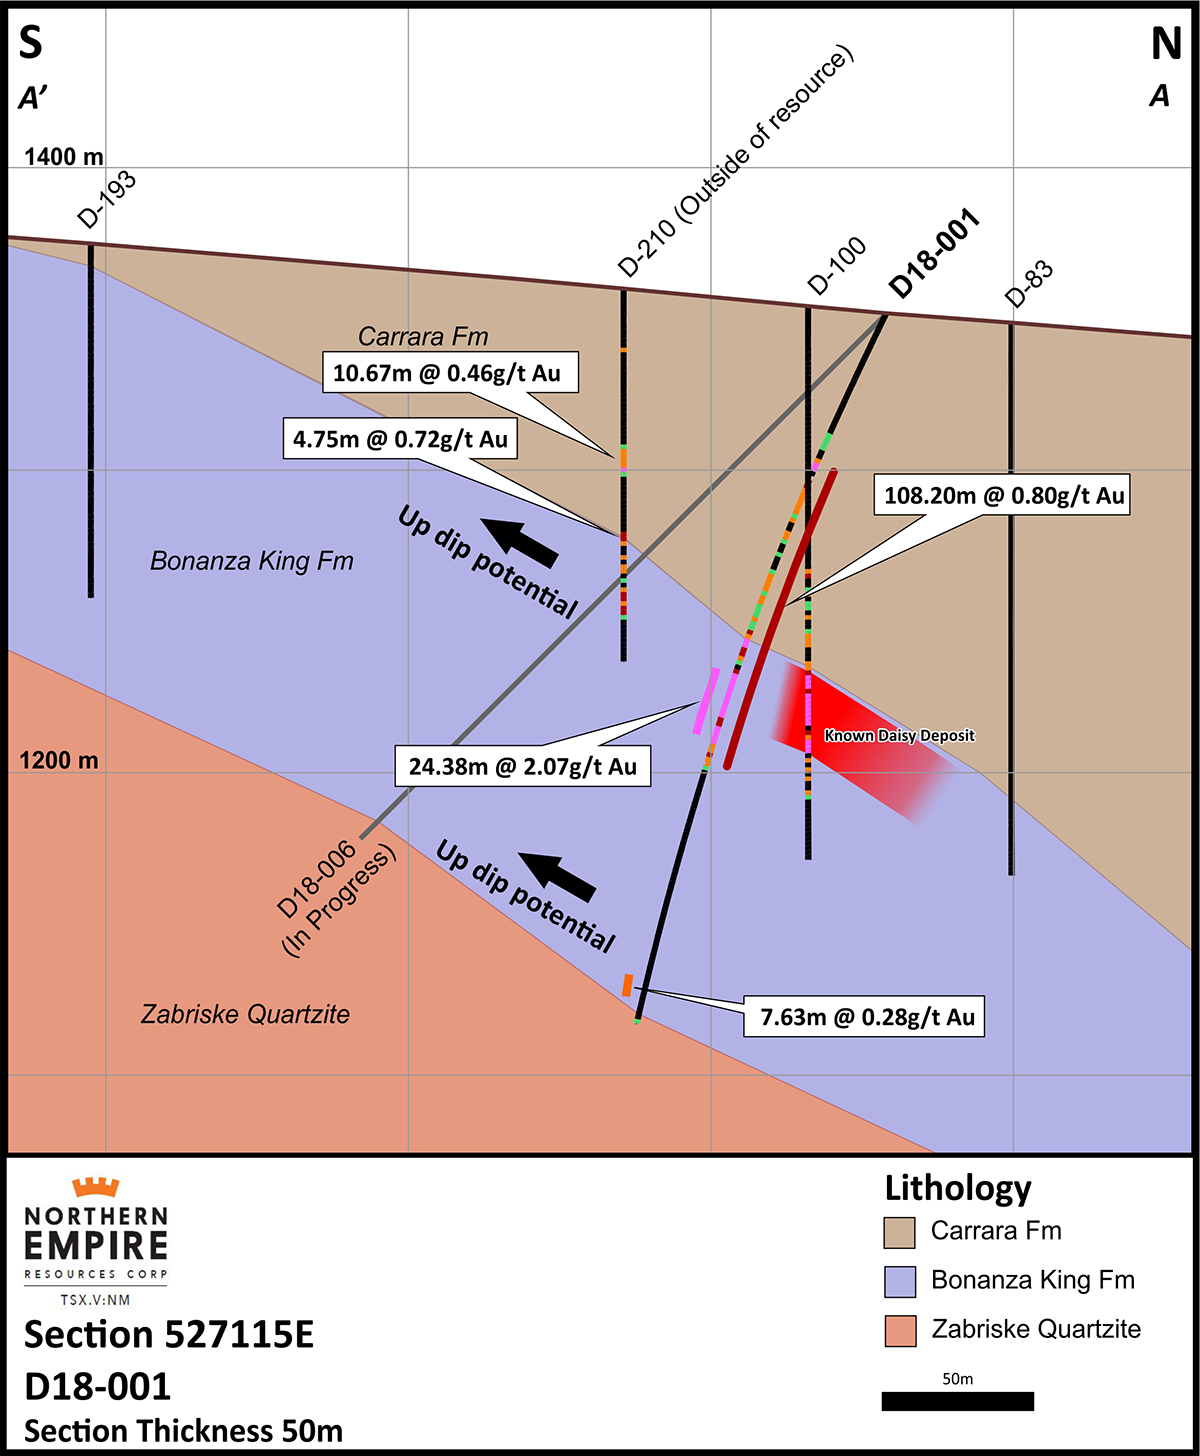
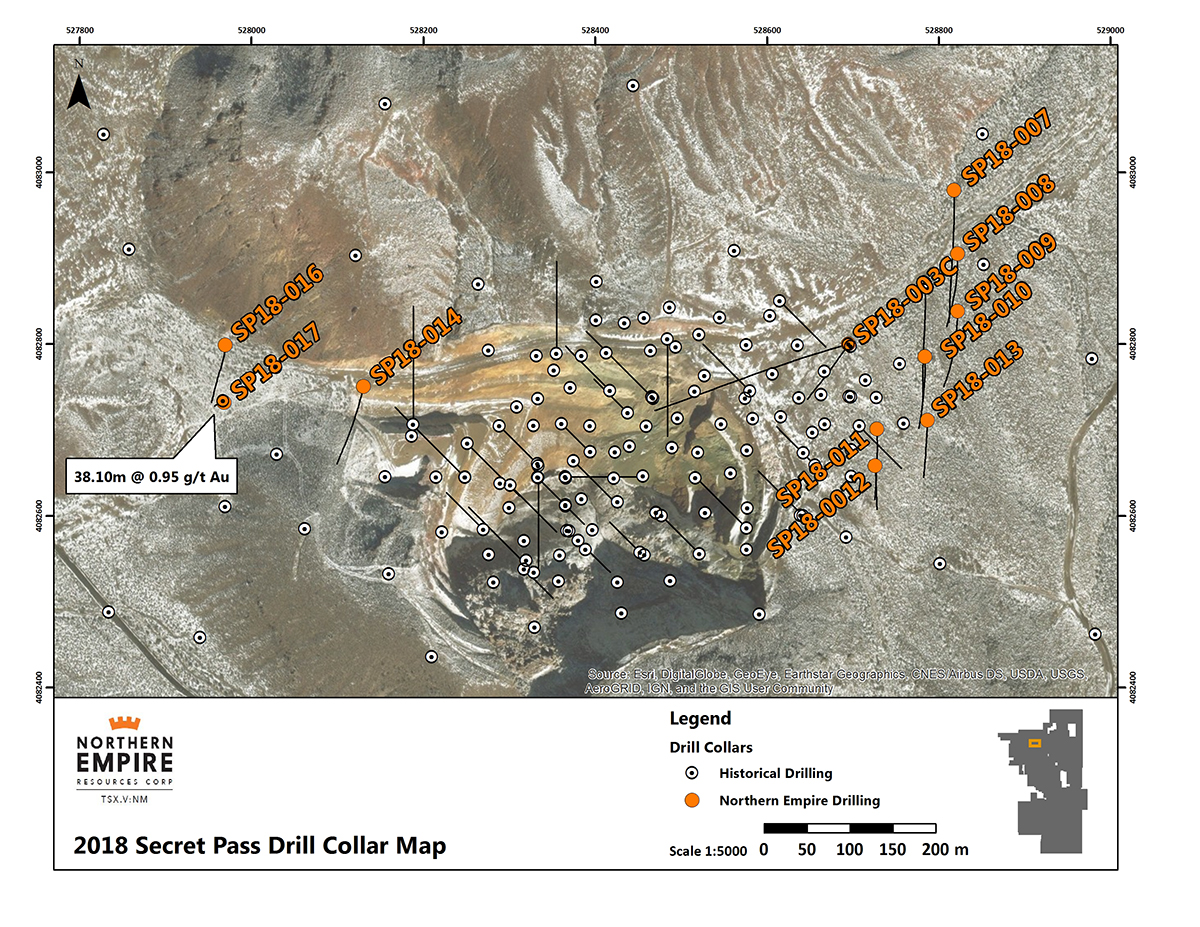
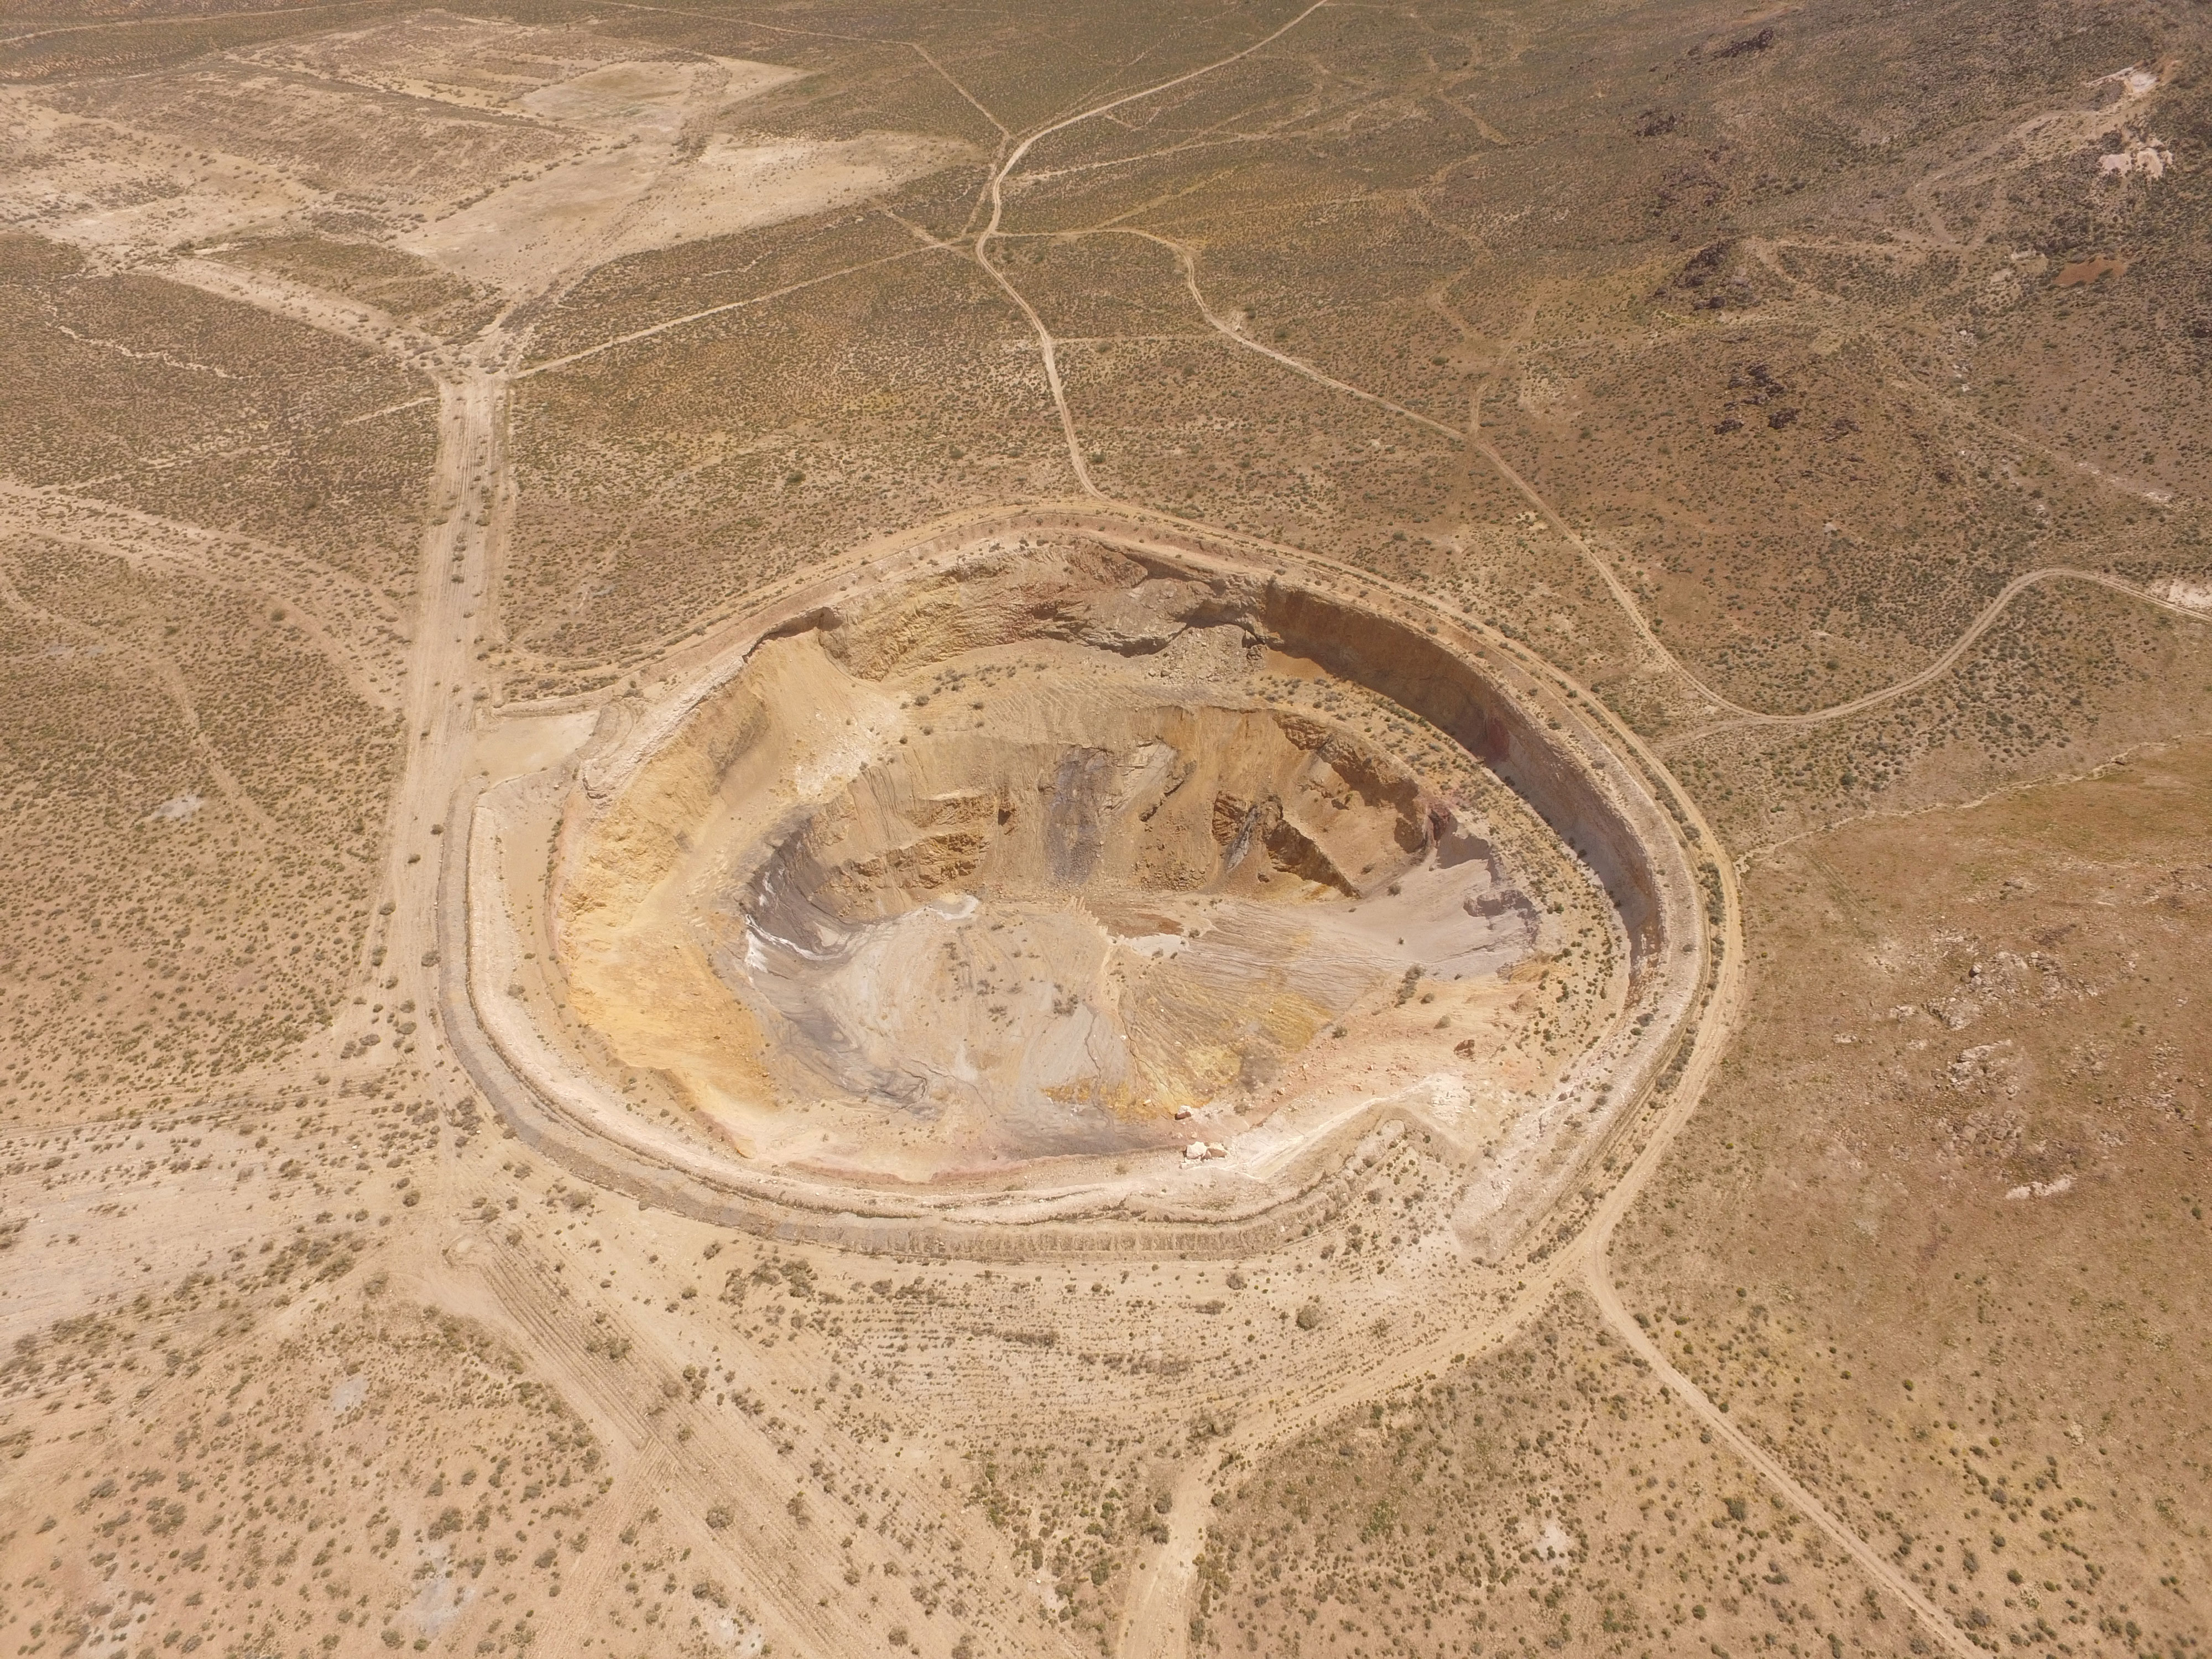
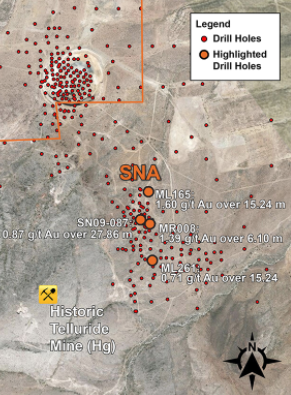


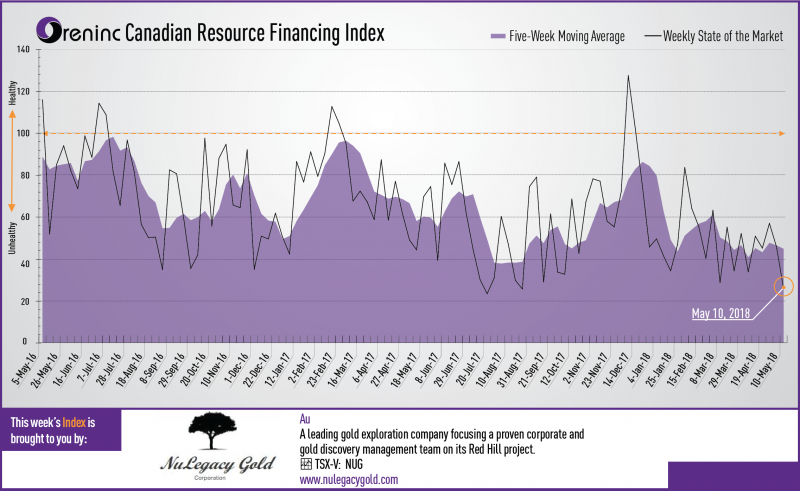

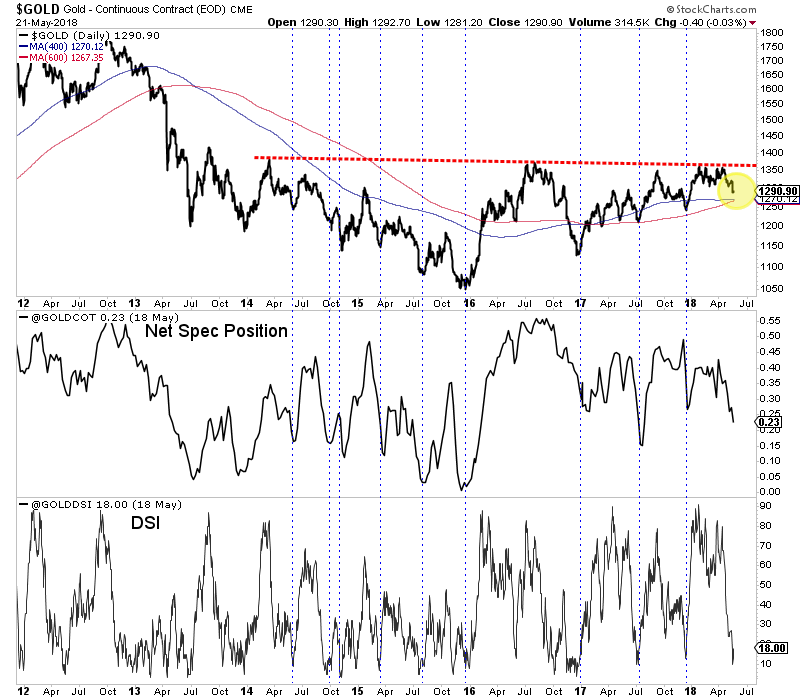
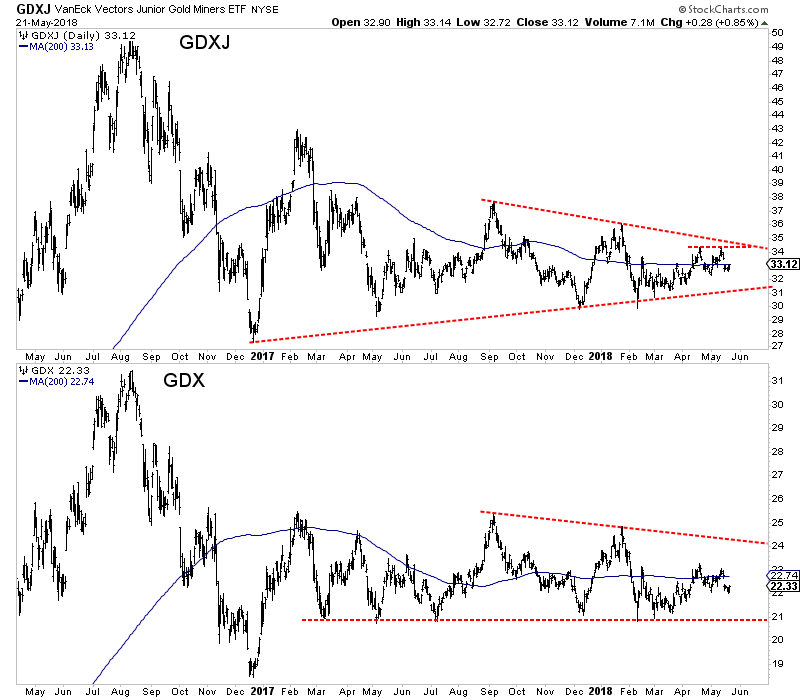


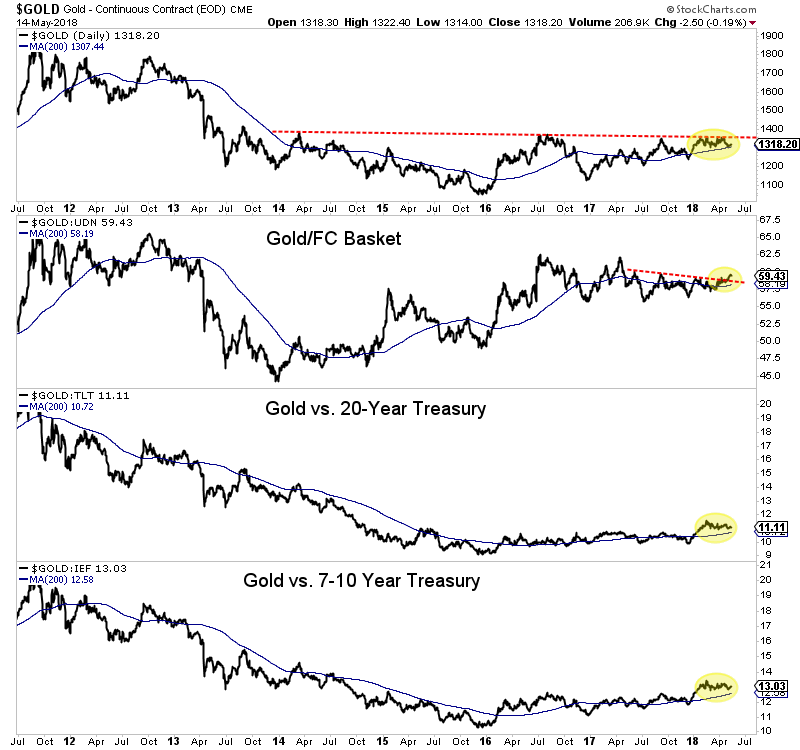
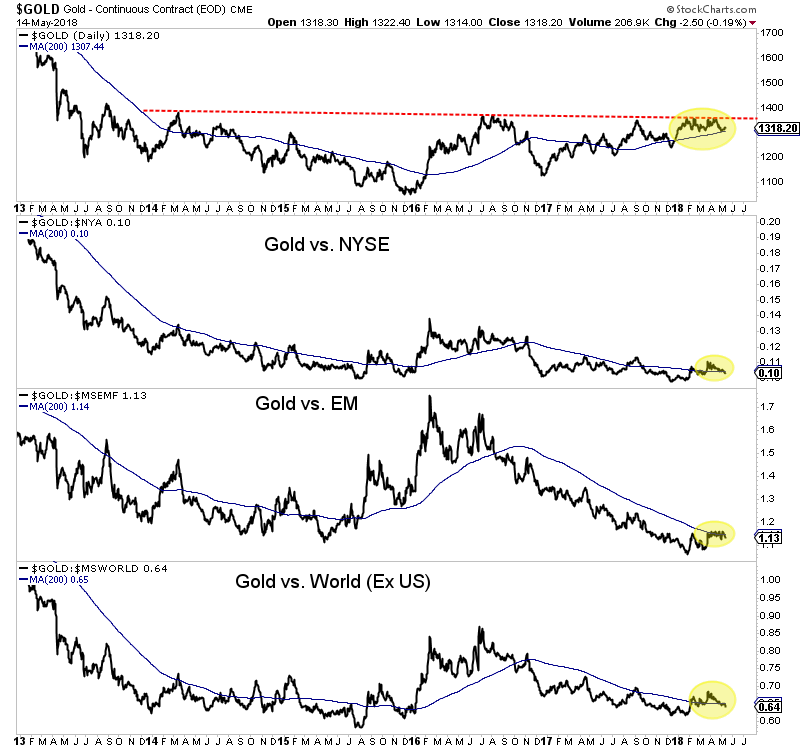


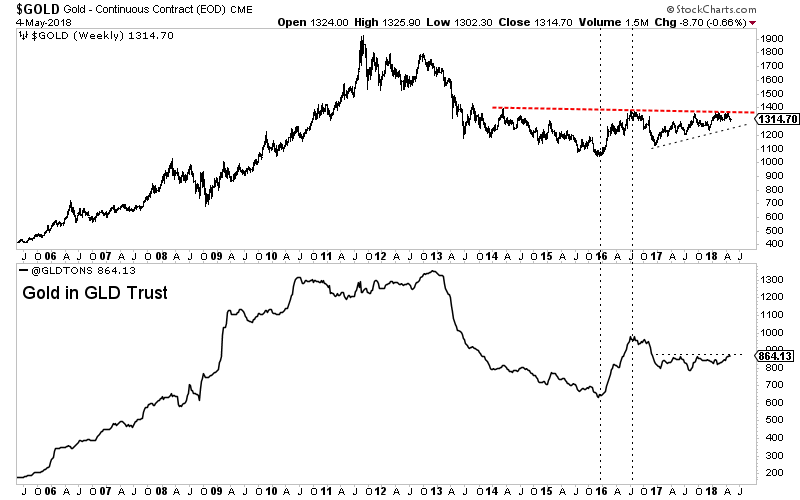
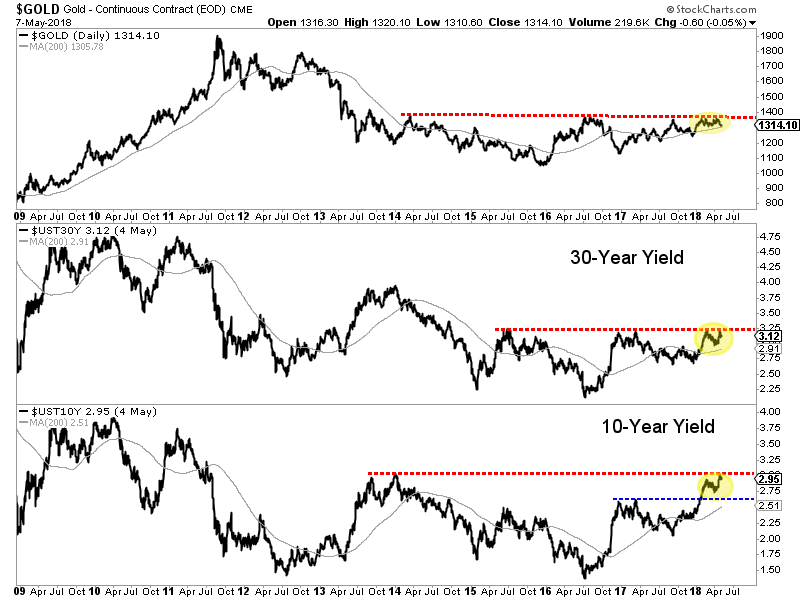
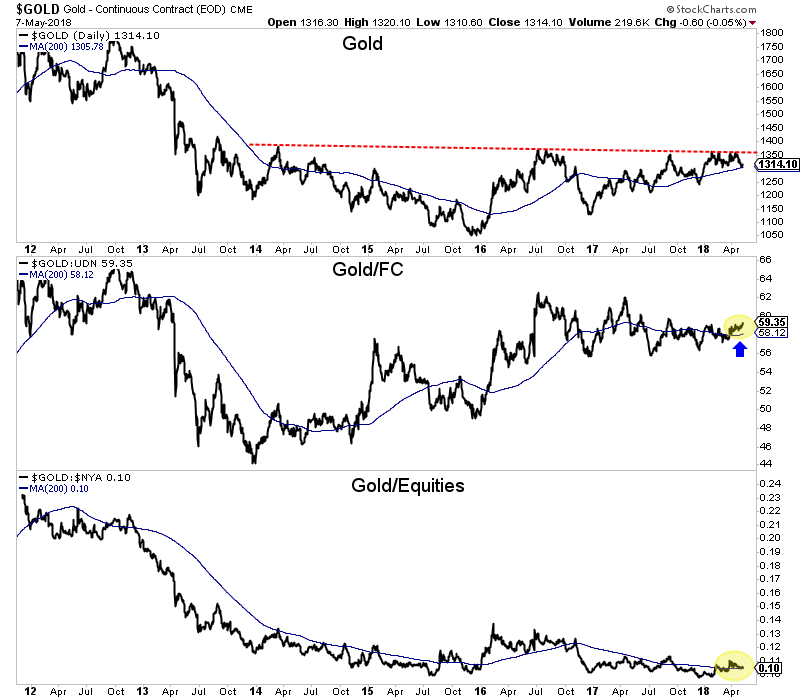
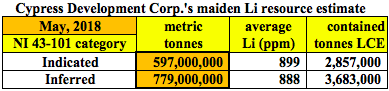
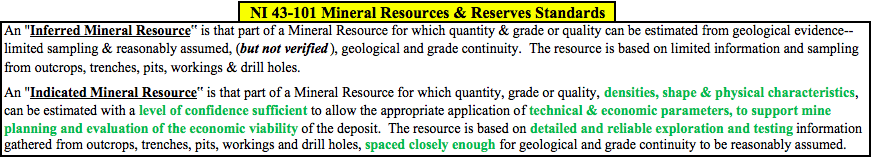
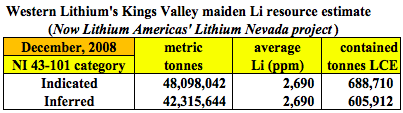
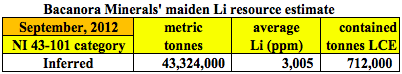
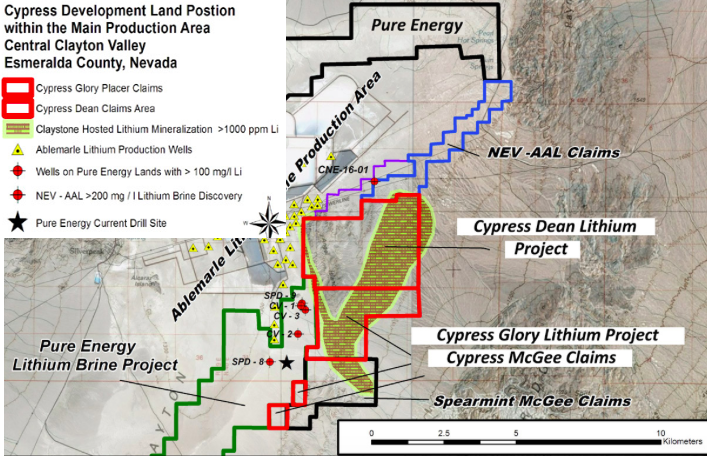
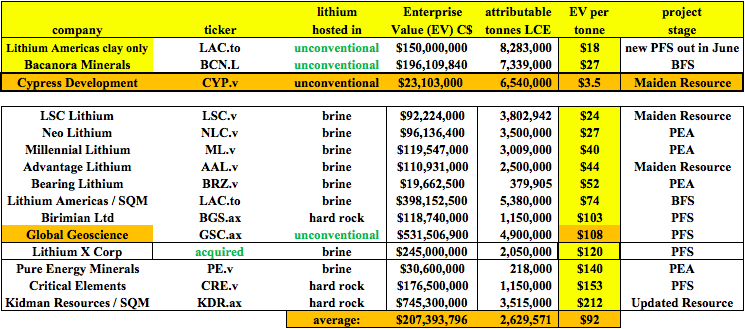
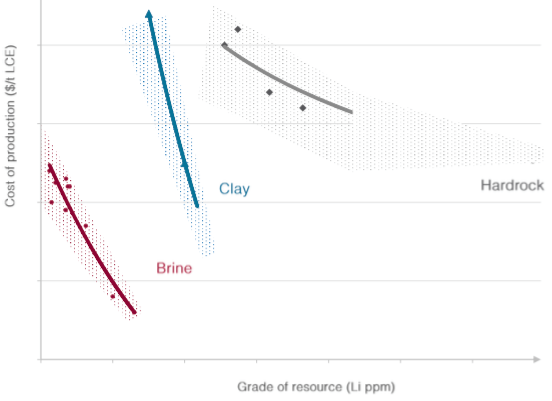
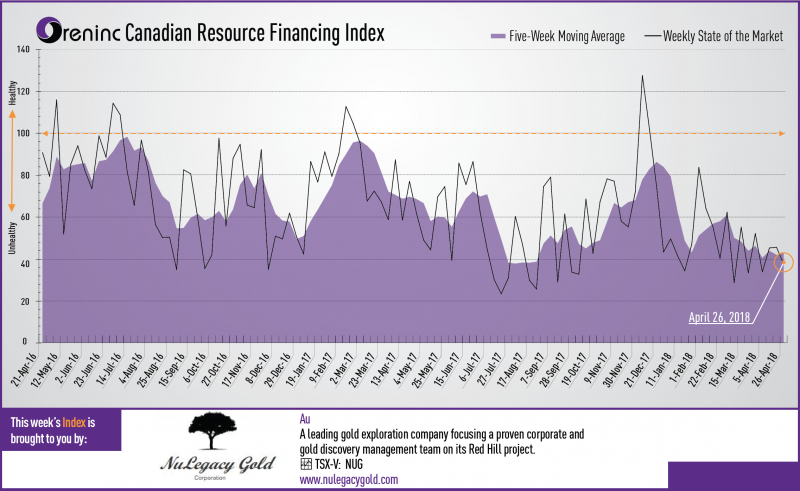

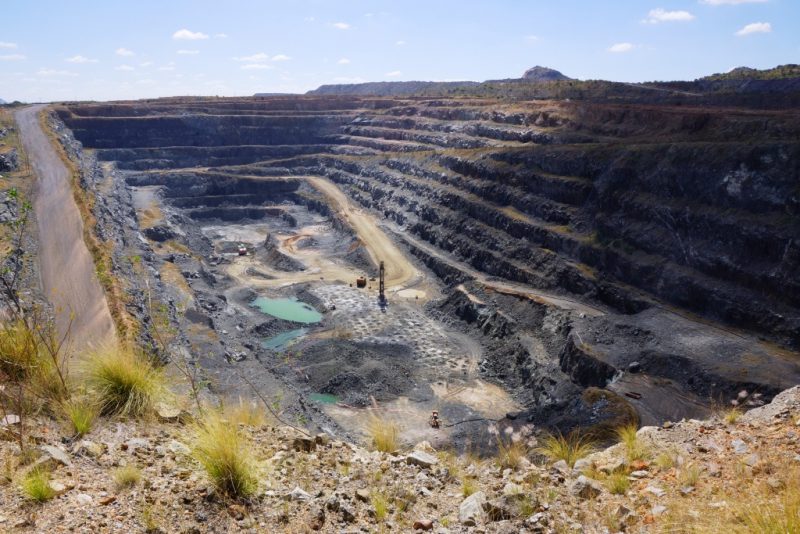
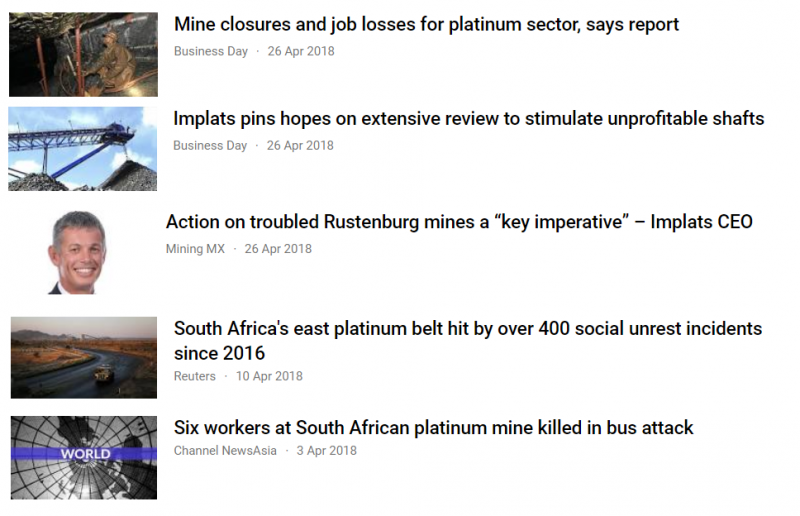
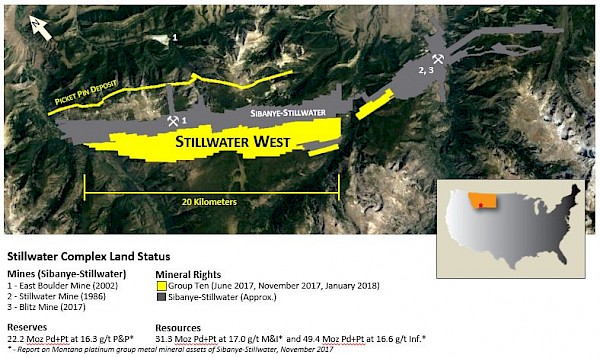
 Follow us on Twitter
 Become our facebook fan


