The dollar and the US stock market may be starting their next major legs down today. Please click here now. Double-click to enlarge this ominous US dollar versus Japanese yen chart.
Central banks around the world are ramping up their tightening. Back in 2013-2014 when I predicted quantitative tightening and relentless rate hikes were imminent, almost nobody believed me.
I promised that this tightening cycle would be like no other because of the enormous size of the QE money balls in Japan, Europe, and America. The tightening action is moving the money balls out of the deflationary government bonds asset class and into the inflationary fractional reserve banking system.
Powell just raised rates again and is poised to launch another increase in quantitative tightening. He’s also beginning to change the spread between the Fed funds rate and the excess reserves rate that banks get paid to keep money at the Fed.Going forward, I expect him to put much more pressure on banks to move money out of the Fed. This is highly inflationary action.
Please click here now. Double-click to enlarge. The US stock market looks like a technical train wreck.
For the stock market, one mainstream money manager just referred to the global tightening cycle in play as akin to a sports team losing their goalie!
It’s obvious that the stock market is doomed. Powell appears determined to push through another rate hike in either August or September. Maybe the market staggers sideways or slightly higher until then, but the US stock market train is headed towards a global central bank tightening cliff. It’s going to go right over that cliff and implode, and tariffs are just icing on the cake.
Please click here now. Double-click to enlarge this interesting T-bond chart. Stock market money managers usually buy bonds when they panic, and that’s starting to happen now.
This time they are jumping from the fire to the fry pan. They believe the Fed will blink and stop hiking. In contrast, I predict the hiking will be accelerated, with a possible half point hike coming in December as inflation continues to rise.
Because of the widening spread between the Fed funds and excess reserve rates, banks will become more aggressive about moving money out of the Fed.Ultimately, the money managers will panic-sell bonds and buy gold as they see the stock market melting but inflation getting even stronger.
The bottom line is that Powell’s tightening actions to date have not done enough damage to the bond market to kill it as a safe haven for stock market investors. That will change fairly soon.
Please click here now. Double-click to enlarge this GDX chart. Gold stocks continue to meander sideways in my important $23 to $21 accumulation zone.
Many individual miners have started to trade independently of the ETFs and mine stock indexes, and are staging fabulous rallies. There are always some outperformers in a sideways market, but the large number of them staging these rallies now is quite impressive.
Note the strong volume bar that occurred on Friday. Gold stocks are in very strong hands now at a time where some possible “game changing” news is coming for bullion.
On that note, please click here now. India and China are the biggest markets for physical gold, and price discovery on the COMEX and LBMA ultimately relates to changes in demand there versus mine and scrap supply.
When Narendra Modi got elected as India’s prime minister, he put Arun Jaitley in charge of the finance department. This was disappointing, because Jaitley’s actions and words have been very negative for gold, and the finance ministry has the power to set the gold import duty.
Jaitley has a long history of health issues, and he just had a kidney transplant. Piyush Goyal has been appointed as “interim” finance minister. He’s pro-gold and fought against the import duty. There are rumours that his appointment may become permanent.
If that happens, I think gold investors around the world are going to watch the import duty tapered to zero just like American QE was tapered to zero.
Please click here now. Double-click to enlarge this spectacular long-term gold price chart. The Indian finance ministry is the main driver of the global gold price doldrums that have been in play for the past seven years.
It’s unknown if Goyal takes charge of the finance ministry on a permanent basis, but if he does, that is likely the catalyst that launches a massive and sustained rise in Indian gold demand. That demand will be enough to drive gold in an Elliott C wave advance to at least $1650, and probably $2000!
If “Royal Goyal” has charge of India’s finance ministry at the same time as Powell is joined by the ECB and then Japan in a giant effort to roll the QE money balls into the fractional reserve banking system, gold will likely surge to $3000 – $5000 very quickly.
When gold began its “eight-bagger” advance from the $250 area in 1999, few people anticipated the upside potential. The highest price targets coming from mainstream analysts were in the $400 area. Most of them thought gold was going to stay in the doldrums for decades, while the stock market would never decline in a material way. They had no clue what was coming!
Please click here now. Double-click to enlarge. I believe the potential for another eight-bagger is much stronger now than it was in 1998. This quarterly bar chart shows gold making an epic bull wedge breakout.
All that’s technically in play right now is a pullback from the breakout zone and that’s very healthy. Note the rise in volume from 1998-2002. That came ahead of the runaway action in the price. The exact same thing is happening now. Gold and silver investors should have absolute confidence in their holdings… and look to eagerly accumulate more!
Stewart Thomson is no longer an investment advisor. The information provided by Stewart and Graceland Updates is for general information purposes only. Before taking any action on any investment, it is imperative that you consult with multiple properly licensed, experienced and qualified investment advisors and get numerous opinions before taking any action. Your minimum risk on any investment in the world is: 100% loss of all your money. You may be taking or preparing to take leveraged positions in investments and not know it, exposing yourself to unlimited risks. This is highly concerning if you are an investor in any derivatives products. There is an approx $700 trillion OTC Derivatives Iceberg with a tiny portion written off officially. The bottom line:
Are You Prepared?
Fed week is exciting for some. Gold bulls and bugs alike hope the Fed will do something or say something that will trigger a huge move in precious metals. It doesn’t work like that. The Fed follows the market, which for the Fed Funds rate (FFR) is the 2-year yield. The 2-year yield has been screaming higher over the past 12 months and it implies at least another two rate hikes in the future. That’s not good for precious metals and could be partly why (among other reasons) Gold and gold stocks have lost their 200-day moving averages. Whatever the reason, the short-term technicals are negative and there is risk of increased selling before a potential rebound in July.
First, let’s take a look at Gold and gold against the equity market. As we can see from the chart, Gold in June has failed twice at its 200-day moving average. That is different from 2017 when each time Gold lost its 200-day moving average, it made a V rebound back above it.
Gold & Gold/Stocks
Gold’s weakness against the broad equity market is another concern. At the bottom of the chart we plot Gold against the NYSE, a broad stock market index. The ratio recently failed at its downtrending 200-day moving average and is also threatening a move to new lows for essentially the first time since 2015. (The December 2017 break was not sustained to the downside).
Elsewhere, the miners have spent the second quarter wrestling with their 200-day moving averages. GDX failed at its 200-dma twice in the past month, including last week. Meanwhile, GDXJ has shown a tiny bit more strength but essentially has wrestled with its 200-dma since April. The silver stocks (SIL) have been weaker as they have not traded above their 200-dma since January and could have started to breakdown on Friday by closing at 3-month low.
GDX, GDXJ, & SIL
The immediate outlook for precious metals is negative as the price action suggests but current bearish sentiment implies a rebound is on the horizon. The summer could be playing out as we anticipated three weeks ago. An immediate move lower could push Gold to strong support around $1260 and that would put sentiment indicators into truly extreme territory. From there, it is critical that the sector recaptures 200-day moving averages. Given our recent cautious views, we have narrowed our focus to a smaller group of companies capable of performing well in this environment. To follow our guidance and learn our favorite juniors for the next 6 to 12 months, consider learning about our premium service.
A negative divergence between gold and silver occurred in May 2011. Now, the opposite situation is in play; a positive divergence is occurring.
Please click here now. Double-click to enlarge this daily gold chart.
Gold made a minor trend low at the start of May, and another one a few weeks later.
Please click here now. Double-click to enlarge. Silver also made a minor trend low in early May, but then diverged with gold. Silver began a making a series of higher highs and higher lows.
It’s true that intermediate trend rallies in precious metals tend to end with silver outperforming gold, but it’s also true that major trending moves tend to begin with the type of divergence that is happening now.
Inflationary pressures are building around the world. Please click here now. This type of situation is likely to be resolved not with lower fuel costs, but with higher wages.
Wage pressures are growing everywhere. Silver is like a blood hound, sniffing the catalysts of inflation before they move the prices of almost everything significantly higher.
Please click here now. Double-click to enlarge this sugar chart. It looks very similar to silver.
Please click here now. When inflation began to show signs of appearing in the mid 1960s, sugar began to rise. It spiked dramatically in the early 1970s.
The rise in Chinese and Indian wages is the biggest inflationary catalyst in the world. It’s relentless and powered by a population of three billion people.
There are about eight times as many people in China and India as there are in the United States, and the GDP growth rates are vastly higher. India grows at 6% in a recession, while America grows at 3% in a boom. India is headed for 10% GDP growth, and wages and prices are going to rise in a similar way.
The income growth coming out of China and India is an inflationary tidal wave and global tariffs simply add gasoline to the fire.
What mainstream economists in the West don’t seem to understand is that US interest rates are far below rates in China and India. Powell’s rate hikes create short term turmoil in emerging markets, but that’s just short-term noise in a big inflationary picture.
The United States needs vastly higher interest rates to stop the Chindian tidal wave and that is not going to be happening.
One of my subscribers notes that in Japan there are now more adult diapers sold than baby diapers. I expect the same thing to happen in America fairly quickly. By demographics definition, the US population is not ready for the inflationary freight train that is coming, and cannot get ready.
Please click here now. Sanctions are deflationary. Military spending is deflationary because it doesn’t boost money velocity the way money moving around in the global economy does. Peace in Korea will reduce military spending and the money will be used elsewhere.
North Korea is a small country, but Trump has already stated he wants Russia back in the G8. An end to sanctions in North Korea opens the door to ending them against Russia, and that opens the door to ending them against Iran.
The bottom line is that everything that is happening in the world right now, and I mean everything… is significant fuel for higher inflation that modest rate hikes in America are powerless to stop.
Please click here now. Double-click to enlarge this Northern Star chart. For many years I’ve urged gold stock investors to get involved with the stocks in my vital “Thunder Down Under” Australian gold stocks portfolio.
Most of them are trading well above their 2016 highs, and many are above their 2011 highs. Investors who listened and took action have greatly prospered.
The good news: The gold bull era that is being created by income growth in China and India is going to make most of the precious metal mining stocks that trade on North American stock exchanges look just like Northern Star.
Please click here now. Double-click to enlarge. The overall technical picture for GDX and North American miners continues to get more positive by the day.
The entire $23 – $18 price range is a buy zone that will likely be looked back on as one of the greatest buying opportunities in the history of financial markets.
Regardless of the upside potential for inflation-oriented investments, gold and silver stock investors should be totally comfortable with the current price action. A Chindian income growth wind is gently blowing the sails of the Western gold community’s boats. Enjoy the breeze, because it’s not going away!
Special Offer For Website Readers: Please send me an Email to freereports4@gracelandupdates.com and I’ll send you my free “Junior Gold Stock Power Boats!” report. I highlight eight junior gold (and silver) stocks that look like high-powered race boats. These stocks are ready to give investors outrageously positive price performance in both the short and long term! I include hardcore buy and sell point for each stock.
Stewart Thomson is no longer an investment advisor. The information provided by Stewart and Graceland Updates is for general information purposes only. Before taking any action on any investment, it is imperative that you consult with multiple properly licensed, experienced and qualified investment advisors and get numerous opinions before taking any action. Your minimum risk on any investment in the world is: 100% loss of all your money. You may be taking or preparing to take leveraged positions in investments and not know it, exposing yourself to unlimited risks. This is highly concerning if you are an investor in any derivatives products. There is an approx $700 trillion OTC Derivatives Iceberg with a tiny portion written off officially. The bottom line:
Are You Prepared?
Last week index score: 45.96
This week: 35.42
Zinc One Resources (TSX-V: Z) reported the final drill results from the high-grade zinc discovery in the Mina Chica zone of its Bongará zinc project in north-central Peru.
The Oreninc Index fell in the week ending June 8th, 2018 to 35.42 from 45.96 a week ago as financings decreased, and broker action stayed away.
Gold spent the week flirting again with the US$1,300/oz level in the run up to the G7 summit in Canada, with US president Donald Trumplooking to pick a fight with anyone that would pay him attention as he also prepares for a summit meeting with North Korean leader Kim Jong-un. Despite the trade sabre-rattling, those watching the precious metals space are waiting for the outcome of the US Federal Reserve Market Committee (FOMC) meeting this coming week and any indications related to further interest rate increases.
Financings and broker activity continue to be sparse as Oreninc’s Kai Hoffmann showed at the 121 Mining Investment Conference in New York last week, as interest in the mining sector continues in a funk.
On to the money: total fund raises announced halved to C$50.8 million, a two-week low, which included no brokered financings and no bought deal financings. The average offer size fell to C$2.0 million, an eleven-week low whilst the number of financings fell to 25, a two-week low.
Gold closed up at US$1,298/oz from US$1,293/oz a week ago. Gold is now down 0.36% this year. The US dollar index closed down a tad at 93.53 from 94.15 a week ago. The van Eck managed GDXJ closed down a smidge at US$32.78 from US$32.80. The index is down 3.96% so far in 2018. The US Global Go Gold ETF increased to US$12.95 from US$12.71 a week ago. It is now down 0.46% so far in 2018. The HUI Arca Gold BUGS Index closed down at 178.83 from 179.15 last week. The SPDR GLD ETF continued to sell off and closed its inventory down at 828.76 tonnes from at 836.42 tonnes a week ago.
In other commodities, silver closed up at US$16.78/oz from US$16.41/oz a week ago. Copper’s gain accelerated as it closed up at US$3.30/lb from US$3.09/lb last week. Oil continued to lose ground as it closed down slightly at US$65.74 a barrel from US$65.81 a barrel a week ago.
The Dow Jones Industrial Average saw a strong rebound to close up at 25,316 from 24,635 last week. Canada’s S&P/TSX Composite Index also saw a winning week to close up at 16,202 from 16,043 the previous week. The S&P/TSX Venture Composite Index also closed up at 775.22 from 765.94 last week.
Summary:
Number of financings decreased to 25, a two-week low.
One brokered financing was announced this week for C$8.0m, a one-week high.
No bought-deal financings were announced this week, a one-week low.
Total dollars nearly halved to C$50.8, a two-week low.
Average offer size dropped to C$2.0m, an eleven-week low.
Financing Highlights
Nouveau Monde Graphite (TSX-V: NOU) opened an C$8.0 million private placement @ C$0.30 with Eight Capital and Haywood Securities as co-lead agents.
Syndicate including Canaccord Genuity and Desjardins Securities.
Each unit comprised of one share and half a warrant exercisable @ C$0.40 for two years.
Net proceeds for capital allocations related to Nouveau Monde’s graphite demonstration plant in Saint-Michel-des-Saints.
Major Financing Openings:
Nouveau Monde Graphite (TSX-V: NOU) opened a C$ 8 million offering underwritten by a syndicate led by Eight Capital on a best effortsbasis. Each unit includes half a warrant that expires in 24 months.
MGX Minerals (CSE: XMG) opened a C$ 7.01 million offering on a best efforts basis. Each unit includes a warrant that expires in 36 months. The deal is expected to close on or about June 18th.
GoviEx Uranium (TSX-V: GXU) opened a C$ 6.06 million offering on a best efforts basis. Each unit includes a warrant that expires in 36 months.
Golden Dawn Minerals (TSX-V: GOM) opened a C$ 5.4 million offering on a best efforts basis. Each unit includes a warrant that expires in 36 months.
Major Financing Closings:
Troilus Gold (TSX-V: TLG) closed a C$ 10.01 million offering underwritten by a syndicate led by GMP Securities on a bought deal basis.
Almaden Minerals (TSX: AMM) closed a C$ 9.44 million offering underwritten by a syndicate led by Sprott Capital Partners on a best efforts basis. Each unit included half a warrant that expires in 48 months.
GoviEx Uranium (CSE: GXU) closed a C$ 6.06 million offering on a best efforts basis. Each unit included a warrant that expires in 36 months.
Troilus Gold (TSX-V: TLG) closed a C$ 5.75 million offering on a best efforts basis.
Company News
Zinc One Resources (TSX-V:Z) reported the final drill results from the high-grade zinc discovery in the Mina Chica zone of its Bongará zinc project in north-central Peru.
High-grade zinc mineralization is about 200m long and 120m wide.
Highlights included 21m @ 27.5% Zn in hole MCH-18-041.
Analysis
With a new high-grade zinc discovery, this phase of drilling has been very successful, adds to the potential of the project, even though the size potential of the Mina Chica zone will have to wait for a future drilling programme. And with only a small portion of the 6km mineralized trend tested, there is a lot more exploration (and results) to come in the future.
About Oreinc.com:
Oreninc.com is North America’s leading provider of relevant financing information in the junior commodities space. Since 2011, the company has been keeping track of financings in the junior mining as well as oil and gas space. Logging all relevant deal and company information into its proprietary database, called the Oreninc Deal Log, Oreninc quickly became the go-to website in the mining financing space for investors, analysts, fund managers and company executives alike.
The Oreninc Deal Log keeps track of over 1,400 companies, bringing transparency to an otherwise impenetrable jungle of information. The goal is to increase the visibility of transactions and to show financings activity in a digestible format. Through its daily logging activities, Oreninc is in a position to pinpoint momentum changes in the markets, identify which commodities are trending and which projects are currently receiving funding.
Early summer is the weakest time of the year seasonally for gold, silver, and their miners’ stocks. With traders’ attention diverted to vacations and summer fun, their precious-metals interest and investment demand wane considerably. Thus this entire sector, and often the markets in general, suffer a seasonal lull this time of year. But these summer doldrums offer the best seasonal buying opportunities of the year.
This doldrums term is very apt for gold’s summer predicament. It describes a zone in the world’s oceans surrounding the equator. There hot air is constantly rising, creating long-lived low-pressure areas. They are often calm, with little or no prevailing winds. History is full of accounts of sailing ships getting trapped in this zone for days or even weeks, unable to make any headway. The doldrums were murder on ships’ morale.
Crews had no idea when the winds would pick up again, while they continued burning through their precious stores of food and drink. Without moving air, the stifling heat and humidity were suffocating on these ships long before air conditioning. Misery and boredom were extreme, leading to fights breaking out and occasional mutinies. Being trapped in the doldrums was viewed with dread, it was a very trying experience.
Gold investors can somewhat relate. Like clockwork nearly every summer, gold starts drifting listlessly sideways. It often can’t make significant progress no matter what the trends looked like heading into June, July, and August. As the days and weeks slowly pass, sentiment deteriorates markedly. Patience is gradually exhausted, supplanted with deep frustration. Plenty of traders capitulate, abandoning ship.
Thus after decades of trading gold, silver, and their miners’ stocks, I’ve come to call this time of year the summer doldrums. Junes and Julies in particular are usually desolate sentiment wastelands for precious metals, totally devoid of recurring seasonal demand surges. Unlike the rest of the year, these summer months simply lack any major income-cycle or cultural drivers of outsized gold investment demand.
The vast majority of the world’s investors and speculators live in the northern hemisphere, so markets take a back seat to the great joys of summer. Traders take advantage of the long sunny days and kids being out of school to go on extended vacations, hang out with friends, and enjoy life. And when they aren’t paying much attention to the markets, naturally they aren’t allocating much new capital to gold.
Given gold’s dull summer action historically, it’s never wise to expect too much from it this time of year. Summer rallies can happen, but they aren’t common. So expectations need to be tempered, especially in June and July. That early-1990s Gin Blossoms song “Hey Jealousy” comes to mind, declaring “If you don’t expect too much from me, you might not be let down.” The markets are ultimately an expectations game.
Quantifying gold’s summer seasonal tendencies during bull markets requires all relevant years’ price action to be recast in perfectly-comparable percentage terms. That’s accomplished by individually indexing each calendar year’s gold price to its last close before market summers, which is May’s final trading day. That’s set at 100 and then all gold-price action that summer is calculated off that common indexed baseline.
So gold trading at an indexed level of 105 simply means it has rallied 5% from May’s final close, while 95 shows it’s down 5%. This methodology renders all bull-market-year gold summers in like terms. That’s critical since gold’s price range has been so vast, from $257 in April 2001 to $1894 in August 2011. That span encompassed gold’s last secular bull, which enjoyed a colossal 638.2% gain over those 10.4 years!
So 2001 to 2011 were certainly bull years. 2012 was technically one too, despite gold suffering a major correction following that powerful bull run. At worst that year, gold fell 18.8% from its 2011 peak. That was not quite enough to enter formal bear territory at a 20% drop. But 2013 to 2015 were definitely brutal bear years, which need to be excluded since gold behaves very differently in bull and bear markets.
In early 2013 the Fed’s wildly-unprecedented open-ended QE3 campaign ramped to full speed, radically distorting the markets. Stock markets levitated on the Fed’s implied backstopping, slaughtering demand for alternative investments led by gold. In Q2’13 alone, gold plummeted by 22.8% which proved its worst quarter in an astounding 93 years! Gold’s bear continued until the Fed’s initial rate hike of this cycle in 2015.
The day after that first rate hike in 9.5 years in mid-December 2015, gold plunged to a major 6.1-year secular low. Then it surged out of that irrational rate-hike scare, formally crossing the +20% new-bull threshold in early March 2016. Ever since, gold has remained in this young bull. At worst in December 2016 after gold was crushed on the post-election Trumphoria stock-market surge, it had only corrected 17.3%.
So the bull-market years for gold in modern history ran from 2001 to 2012, skipped the intervening bear-market years of 2013 to 2015, and resumed in 2016 to 2018. Thus these are the years most relevant to understanding gold’s typical summer-doldrums performance, which is necessary for managing your own expectations this time of year. This spilled-spaghetti mess of a chart is actually simple and easy to understand.
The yellow lines show gold’s individual-year summer price action indexed from each May’s final close for all years from 2001 to 2012 and 2016 to 2017. Together they establish gold’s summer trading range. All those bull-market years’ individual indexes are then averaged together in the red line, revealing gold’s central summer tendency. Finally the indexed current-year gold action for 2018 is superimposed in blue.t
While there are outlier years, gold generally drifts listlessly in the summer doldrums much like a sailing ship trapped near the equator. The center-mass drift trend is crystal-clear in this chart. The vast majority of the time in June, July, and August, gold simply meanders between +/-5% from May’s final close. This year that equates to a probable summer range between $1233 and $1363. Gold tends to stay well within trend.
Understanding gold’s typical behavior this time of year is very important for traders. Sentiment isn’t only determined by outcome, but by the interplay between outcome and expectations. If gold rallies 5% but you expected 10% gains, you will be disappointed and grow discouraged and bearish. But if gold rallies that same 5% and you expected no gains, you’ll be excited and get optimistic and bullish. Expectations are key.
History has proven it’s wise not to expect too much from gold in these lazy market summers, particularly June and July. Occasionally gold still manages to stage a big summer rally, which is a bonus. But most of the time gold doesn’t veer materially from its usual summer-drift trading range, where it’s often adrift like a classic tall ship. With range breakouts either way rare, there’s usually little to get excited about.
In this chart I labeled some of the outlying years where gold burst out of its usual summer-drift trend, both to the upside and downside. But these exciting summers are unusual, and can’t be expected very often. Most of the time gold grinds sideways on balance not far from its May close. Traders not armed with this critical knowledge often wax bearish during gold’s summer doldrums and exit in frustration, a grave mistake.
Gold’s summer-doldrums lull marks the best time of the year seasonally to deploy capital, to buy low at a time when few others are willing. Gold enjoys powerful seasonal rallies that start in Augusts and run until the following Mays! These are fueled by outsized investment demand driven by a series of major income-cycle and cultural factors from around the world. Summer is when investors should be bullish, not bearish.
The red average indexed line above encompassing 2001 to 2012 and 2016 to 2017 reveals gold’s true underlying summer trend in bull-market years. Technically gold’s major seasonal low arrives relatively early in summers, mid-June. On average through all these modern bull-market years, gold slumped 1.0% between May’s close and that summer nadir. But that’s probably still too early to deploy capital.
Check out the yellow indexed lines in this chart. They tend to cluster closer to flat-lined in mid-June than through all of July. The only reason gold’s seasonal low appears in mid-June mathematically is a single extreme-outlier year, 2006. Gold’s spring seasonal rally was epic that year, gold rocketed 33.4% higher to a dazzling new bull high of $720 in just 2.0 months between mid-March and mid-May! That was incredible.
Extreme euphoria had catapulted gold an astounding 38.9% above its 200-day moving average, radically overbought by any standard. That was way too far too fast to be sustainable, so after that gold had to pay the piper in a sharp mean-reversion overshoot. So over the next month or so into mid-June, gold’s overheated price plummeted 21.9%! That crazy outlier is the only reason gold’s major summer low isn’t in July.
There were 14 bull-market years from 2001 to 2012 and 2016 to 2017. That’s a big-enough sample to smooth out the trend, but not large enough to prevent extreme deviations from skewing it a bit. Gold’s true major summer seasonal low is really closer to early-to-mid July. After that month’s opening holiday week in the States to celebrate Independence Day, investment capital inflows usually start ramping back up.
On average in these modern bull-market years, gold slipped 0.2% in Junes before rallying 0.9% in Julies. After that first lazy summer week in July, gold tends to gradually start clawing its way higher again. But this is so subtle that Julies often still feel summer-doldrumsy. By the final trading day in Julies, gold is still only 0.7% higher than its May close kicking off summers. That’s too small to restore damaged sentiment.
Since gold exited May 2018 at $1298, an average 0.7% rally by July’s end would put it at $1307. That’s hardly enough to generate excitement after two psychologically-grating months of drifting. But the best times to deploy any investment capital is when no one else wants to so prices are low. Gold’s summer doldrums come to swift ends in Augusts, which saw hefty average gains of 2.2% in these bull-market years!
And that’s just the start of gold’s major autumn seasonal rally, which has averaged strong 6.6% gains between mid-Junes and late Septembers. That’s driven by Asian gold demand coming back online, first post-harvest-surplus buying and later Indian-wedding-season buying. June is the worst of gold’s summer doldrums, and the first half of July is when to buy back in. It’s important to be fully deployed before August.
These gold summer doldrums driven by investors pulling back from the markets to enjoy their vacation season don’t exist in a vacuum. Gold’s fortunes drive the entire precious-metals complex, including both silver and the stocks of the gold and silver miners. These are effectively leveraged plays on gold, so the summer doldrums in them mirror and exaggerate gold’s own. Check out this same chart type applied to silver.
Since silver is much more volatile than gold, naturally its summer-doldrums-drift trading range is wider. The great majority of the time, silver meanders between +/-10% from its final May close. That came in at $16.39 this year, implying a summer-2018 silver trading range between $14.75 and $18.03. While silver suffered that extreme June-2006 selling anomaly too, its major seasonal low arrives a couple weeks after gold’s.
On average in these same modern bull-market years of 2001 to 2012 and 2016 to 2017, silver dropped 4.2% between May’s close and late June. That’s much deeper than gold’s 1.0% seasonal slump, which isn’t surprising given silver’s leverage to gold. Silver’s summer performances are also much lumpier than gold’s. Junes see average silver losses of 3.3%, but those are more than made back in strong rebounds in Julies.
Silver’s big 4.1% average rally in Julies amplifies gold’s gains by an impressive 4.6x. But unfortunately silver hasn’t been able to maintain that seasonal momentum, with Augusts averaging a slight decline of 0.3%. Overall from the end of May to the end of August, silver’s summer-doldrums performance tends to be flat. Silver just averaged a 0.4% full-summer gain, way behind gold’s 2.9% through June, July, and August.
That means silver sentiment this time of year is often worse than gold’s, which is already plenty bearish. The summer doldrums are more challenging for silver than gold. Being in the newsletter business for a couple decades now, I’ve heard from countless discouraged investors over the summers. While I haven’t tracked this, it sure feels like silver investors have been disproportionately represented in this feedback.
Since gold is silver’s primary driver, this white metal is stuck in the same dull drifting boat as gold in the market summers. Silver usually amplifies whatever is happening in gold, both good and bad. But again the brunt of silver’s summer weakness is borne in Junes. Fully expecting this seasonal weakness and rolling with the punches helps prevent being disheartened, which in turn can lead to irrationally selling low.
The gold miners’ stocks are also hostage to gold’s summer doldrums. This last chart applies this same analysis to the flagship HUI gold-stock index, which is closely mirrored by that leading GDX VanEck Vectors Gold Miners ETF. The major gold stocks tend to leverage gold’s gains and losses by 2x to 3x, so it’s not surprising that the HUI’s summer-doldrums-drift trading range is also twice as wide as gold’s own.
The gold miners’ stocks share silver’s center-mass summer drift running +/-10% from May’s close. This year the HUI entered the summer doldrums at 180.1, implying a June, July, and August trading range of 162.1 to 198.1. While gold stocks’ GDX ETF is too new to do long-term seasonal analysis, in GDX terms this summer range translates to $20.11 to $24.57 this year. That’s based off a May 31st close of $22.34.
Like gold, the gold stocks’ major summer seasonal low arrives in mid-June. On average in these modern bull-market years of 2001 to 2012 and 2016 to 2017, by then the HUI had slid 2.3% from its May close. Then gold stocks tended to more than fully rebound by the end of June, making for an average 0.8% gain that month. But there’s no follow-through in July, where the gold stocks averaged a modest 0.2% loss.
Overall between the end of May and the end of July, which encompasses the dark heart of the summer doldrums, the HUI averaged a trivial 0.6% gain. Again two solid months of grinding sideways on balance is hard for traders to stomach, especially if they’re not aware of the summer-doldrums drift. The key to surviving it with minimum psychological angst is to fully expect it. Managing expectations in markets is essential!
But also like gold, the big payoff for weathering the gold-stock summer starts in August. With gold’s major autumn rally getting underway, the gold stocks as measured by the HUI amplify it with strong average gains of 4.2% in Augusts! And that’s only the start of gold stocks’ parallel autumn rally with gold’s, which has averaged 10.5% gains from late Julies to late Septembers. Gold-stock upside resumes in late summers.
Like everything in life, withstanding the precious-metals summer doldrums is much less challenging if you know they’re coming. While outlying years happen, they aren’t common. So the only safe bet to make is expecting gold, silver, and the stocks of their miners to languish in Junes and Julies. Then when these drifts again come to pass, you won’t be surprised and won’t get too bearish. That will protect you from selling low.
This summer actually has a pretty interesting setup for gold that’s more bullish than usual. Gold’s short-term price moves are dominated by speculators’ gold-futures trading. These guys have been selling like crazy since late April in response to a major short-squeeze rally in the US dollar. That’s left their gold-futures long positions exceptionally low entering this summer, which is very unusual and quite bullish.
With total spec longs near the bottom of their past-year trading range, that sizable gold-futures selling that can hit in summers is likely already exhausted. The usual summer-doldrums gold-futures dump was effectively pulled forward, short-circuiting gold’s spring rally. That means gold is much more likely than usual to see mean-reversion futures buying in the coming weeks, especially after next week’s big FOMC meeting.
The Fed is universally expected to hike rates for the 7th time in this cycle on June 13th. That is one of the every-other FOMC meetings also accompanied by the newest dot-plot federal-funds-rate forecast by top Fed officials. And afterwards the Fed’s new chairman Jerome Powell will hold a press conference. If any of this is less hawkish on more rate hikes than traders expect, speculators could aggressively buy gold futures.
Another counter-seasonal bullish factor for gold is today’s radical gold underinvestment coupled with these hyper-complacent bubble-valued stock markets. Whenever the inevitable next major stock selloff arrives, which could be this summer, gold investment demand will surge. Stock selloffs are great for gold since it tends to rally when stocks weaken. That makes gold the ultimate portfolio diversifier during such times.
And with the Fed both relentlessly ratcheting up interest rates and accelerating its young quantitative-tightening campaign to start to unwind QE, the stock markets are facing mounting headwinds. The extreme central-bank liquidity that drove them so high is being reversed, a dangerous omen. Gold investment demand will start returning to favor in a big way whenever they decisively roll over, even if it happens this summer.
Smart contrarians who want to buy low realize gold’s summer doldrums are a gift. They offer the best seasonal buying opportunities of the year in gold, silver, and their miners’ stocks. This is not the time to disengage, but to do your research and get deployed in great gold and silver stocks at bargain-basement prices. They are wildly undervalued and basing today, ready to scream higher when gold sentiment turns.
We’ve been hard at work at Zeal in recent weeks preparing for these great summer buying opportunities. I’ve been researching the latest fundamentals of the world’s best gold and silver miners to make a shopping list for the summer-doldrums lows. These coming trades will easily have the potential to double before next summer as the precious-metals sector mean reverts higher. Buying low is the key to big gains later.
Now is the time to get ready, so we share our research and trades via acclaimed weekly and monthly newsletters. They draw on my vast experience, knowledge, wisdom, and ongoing research to explain what’s going on in the markets, why, and how to trade them with specific stocks. As of the end of Q1, all 998 newsletter stock trades recommended since 2001 have averaged stellar annualized realized gains of +19.4%! For just $12 an issue, you too can learn to think, trade, and thrive like contrarians. Subscribe today!
The bottom line is gold, silver, and their miners’ stocks usually drift listlessly during market summers. As investors shift their focus from markets to vacations, capital inflows wane. Junes and Julies in particular are simply devoid of the big recurring gold-investment-demand surges seen during much of the rest of the year, leaving them weak. Investors need to expect lackluster sideways action on balance this time of year.
Gold’s summer doldrums shouldn’t be a psychological burden, as they are a great opportunity to buy low before major autumn rallies. Those tend to be stealthily born in early-to-mid Julies before accelerating in Augusts. So investors must do their research homework in early summers, in order to be ready to deploy capital in mid summers before sizable late-summer rallies. Summer doldrums should be embraced, not dreaded.
In the West, gold has rallied decently during five of the past seven recessions. I’ve suggested that the current situation in America is something like 1965 – 1970, when inflation began a long and strong up cycle.
That’s partly why I’m adamant that it’s the best time in American history to own a portfolio (a global portfolio) of companies involved in precious metals mining and jewellery.
The other reason that I’m excited about these stocks is that in the East, when people get richer, they buy gold. They are now getting a lot richer, and a lot faster.
Simply put, deflation is out, and inflation is in. It’s really that simple, and investors around the world need to get positioned right now to ensure they get maximum financial benefit.
Please click here now. With their statements and analysis, Morgan Stanley moves “thunder cash” in the institutional investor community.
Their top US equity man, Mike “Mr. Big” Wilson, predicts that while US markets are a clear short-term buy, valuations peaked in 2017, and prices will peak in 2018.
I’m in 100% agreement with Mike. Tactically, I’ve urged investors who are not afraid of price chasing to buy some bank stocks, energy stocks, and growth stocks. Gamblers can buy call options.
That’s how to play the final months of upside fun in the US stock market, but investors must be seriously prepared for years of inflationary bear market horror to follow this blow-off top.
I’ve predicted that only the most astute stock pickers will survive being invested in the US stock market from 2019 forwards. In the coming inflationary inferno, index and ETF investors will essentially be turned into tumbleweed, burning in a financial desert.
When will the inferno begin? Well, I think it happens in the upcoming September – October US stock market “crash season”, and by year-end at the latest. I expect gold to go ballistic as that happens, because it will be an inflation-oriented meltdown, and that means institutional thunder-buying takes place in the metals.
Please click here now. Double-click to enlarge this GDX chart. In terms of time, I think gold stocks will initially surge higher for two to three years as the stock market falls.
Most of the gains should be sustained due to an imminent drop in US and Chinese gold mining production. Canadian, Australian, and Russian miners should be the clear leaders in what I call the gold bull era.
Note the diamond pattern in play on that GDX chart. A drift down from it now would put GDX at my key buy area of $21 just in time for the Fed’s next rate hike. That hike will put another major nail in the US stock market valuations coffin. It will be followed at the end of June with another ramp-up in QT.
Many investors who failed to buy the stock market in 2008-2010 and are buying now are trying to convince themselves that the Fed will back off from more hikes and QT. This is very childish thinking. Those engaged in it will soon learn the hard way that the Fed doesn’t care about their silly stock market price chase.
On a demographics note: In my professional opinion, about 60% of the Western gold community is now composed of younger “smart money” investors. They have been invested in the US stock and bond markets and are becoming very concerned (and rightly so) about the growing risk that inflation will cause a severe bear market in these traditional asset classes.
This new breed of gold bug has more patience than the “old guard” gold fear trade investors. The old guard focused more on financial system risk and government debt that threatened to create a kind of “parabolic moment” of vertical price rise for precious metals. The transition from deflation to insidious inflation is an enormous process that requires investor patience, but it is now well underway.
Please click here now. Double-click to enlarge this beautiful silver chart. The silver price has been consolidating the rally from the summer of 2017 in a nice symmetrical triangle pattern. Silver is highly correlated to gold, but during periods of inflation there is also a significant correlation with sugar.
That’s because the average “man/woman on the street” tends to see gold as too high-priced to buy. Silver’s lower price is more enticing, and they can relate to an ounce of silver rising like the price of a pound of sugar rises.
Please click here now. Double-click to enlarge. Sugar is arguably even better than money velocity as an inflation indicator.
Investors should watch for a two-month close over the blue downtrend line. That must be followed by a two-week close over sixteen cents a pound. That price action is likely to indicate that inflation is becoming a firestorm for the stock market and will function as a green light for most gold stocks to blast higher.
Note the peak in the summer of 2016 for sugar. That functioned as a red light for gold stock investors. The next signal will be a green one and investors need to get prepared now.
In contrast to the hyperinflation envisioned by older gold bugs who focused on bank and financial system risk, the type of inflation that is coming now is more like the inflation of 1966 -1975, on an even bigger scale because of rampant Chindian income growth. It’s insidious.
This inflation will last for a hundred years and likely for much longer, not just for a decade or two like in the 1970s. It’s a process akin to millions of solid gold termites invading the US stock and bond market house. No bug spray works, so the institutional investors inside the house will all leave.
The bottom line: If you can’t fight a gold bug invasion, you have to join it. Gold stocks will rise thousands of percentage points higher as investors begin to understand what is happening. The inflation is imminent, and investors must get prepared!
Thanks!
Stewart Thomson
Graceland Updates
Note: We are privacy oriented. We accept cheques, credit card, and if needed, PayPal.
Written between 4am-7am. 5-6 issues per week. Emailed at aprox 9am daily.
Stewart Thomson is no longer an investment advisor. The information provided by Stewart and Graceland Updates is for general information purposes only. Before taking any action on any investment, it is imperative that you consult with multiple properly licensed, experienced and qualified investment advisors and get numerous opinions before taking any action. Your minimum risk on any investment in the world is: 100% loss of all your money. You may be taking or preparing to take leveraged positions in investments and not know it, exposing yourself to unlimited risks. This is highly concerning if you are an investor in any derivatives products. There is an approx $700 trillion OTC Derivatives Iceberg with a tiny portion written off officially. The bottom line:
Are You Prepared?
The major silver miners’ stocks remain deeply out of favor, languishing near multi-year lows. Of course that reflects investors’ lack of interest in silver itself. It has greatly lagged, not following gold higher like usual over the past year and a half. That’s really torpedoed silver-stock sentiment, making for a challenging environment for silver miners. But they’re weathering it as their recently-released Q1’18 results show.
Four times a year publicly-traded companies release treasure troves of valuable information in the form of quarterly reports. Companies trading in the States are required to file 10-Qs with the US Securities and Exchange Commission by 45 calendar days after quarter-ends. Canadian companies have similar requirements. In other countries with half-year reporting, many companies still partially report quarterly.
Unfortunately the universe of major silver miners to analyze and invest in is pretty small. Silver mining is a tough business both geologically and economically. Primary silver deposits, those with enough silver to generate over half their revenues when mined, are quite rare. Most of the world’s silver ore formed alongside base metals or gold. Their value usually well outweighs silver’s, relegating it to byproduct status.
The Silver Institute has long been the authority on world silver supply-and-demand trends. It published its latest annual World Silver Survey covering 2017 in mid-April. Last year only 28% of the silver mined around the globe came from primary silver mines! 36% came from primary lead/zinc mines, 23% copper, and 12% gold. That’s nothing new, the silver miners have long supplied less than a third of world mined supply.
It’s very challenging to find and develop the scarce silver-heavy deposits supporting primary silver mines. And it’s even harder forging them into primary-silver-mining businesses. Since silver isn’t very valuable, most silver miners need multiple mines in order to generate sufficient cash flows. Traditional major silver miners are increasingly diversifying into gold production at silver’s expense, chasing its superior economics.
So there aren’t many major silver miners left out there, and their purity is shrinking. The definitive list of these companies to analyze comes from the most-popular silver-stock investment vehicle, the SIL Global X Silver Miners ETF. In mid-May at the end of Q1’s earnings season, SIL’s net assets were running 6.4x greater than its next-largest competitor’s. So SIL continues to dominate this small niche contrarian sector.
While SIL has its flaws, it’s the closest thing we have to a silver-stock index. As ETF investing continues to eclipse individual-stock picking, SIL inclusion is very important for silver miners. It grants them better access to the vast pools of stock-market capital. Differential SIL-share buying by investors requires this ETF’s managers to buy more shares in its underlying component companies, bidding their stock prices higher.
In mid-May as the major silver miners were finishing reporting their Q1’18 results, SIL included 24 “Silver Miners”. Unfortunately the great majority aren’t primary silver miners, most generate well under half their revenues from silver. That’s not necessarily an indictment against SIL’s stock picking, but a reflection of the state of this industry. There aren’t enough significant primary silver miners left to fully flesh out an ETF.
This disappointing reality makes SIL somewhat problematic. The only reason investors would buy SIL is they want silver-stock exposure. But if SIL’s underlying component companies generate well under 40% of their sales from silver mining, they aren’t going to be very responsive to silver price moves. And most of that capital intended to go into primary silver miners is instead diverted into byproduct silver miners.
So the silver-mining ETFs sucking in capital investors thought they were allocating to real primary silver miners effectively starves them. Their stock prices aren’t bid high enough to attract in more investors, so they can’t issue sufficient new shares to finance big silver-mining expansions. This is exacerbating the silver-as-a-byproduct trend. Only sustained much-higher silver prices for years to come could reverse this tragedy.
Every quarter I dig into the latest results from the major silver miners of SIL to get a better understanding of how they and this industry are faring fundamentally. I feed a bunch of data into a big spreadsheet, some of which made it into the table below. It includes key data for the top 17 SIL component companies, an arbitrary number that fits in this table. That’s a commanding sample at 95.1% of SIL’s total weighting!
While most of these top 17 SIL components had reported on Q1’18 by mid-May, not all had. Some of these major silver miners trade in the UK or Mexico, where financial results are only required in half-year increments. If a field is left blank in this table, it means that data wasn’t available by the end of Q1’s earnings season. Some of SIL’s components also report in gold-centric terms, excluding silver-specific data.
The first couple columns of this table show each SIL component’s symbol and weighting within this ETF as of mid-May. While most of these stocks trade on US exchanges, some symbols are listings from companies’ primary foreign stock exchanges. That’s followed by each miner’s Q1’18 silver production in ounces, along with its absolute year-over-year change. Next comes this same quarter’s gold production.
Nearly all the major silver miners in SIL also produce significant-to-large amounts of gold! That’s truly a double-edged sword. While gold really stabilizes and boosts silver miners’ cash flows, it also retards their stocks’ sensitivity to silver itself. So the next column reveals how pure these elite silver miners are, approximating their percentages of Q1’18 revenues actually derived from silver. This is calculated two ways.
The large majority of these top SIL silver miners reported total Q1 sales. Those are divided by quarterly silver production multiplied by silver’s average price in Q1, yielding an accurate relative-purity gauge. In cases where Q1 sales weren’t reported, I estimated them by adding silver sales to gold sales based on their production and average quarterly prices. That’s less optimal, since it ignores any base-metals production.
Next comes the major silver miners’ most-important fundamental data for investors, cash costs and all-in sustaining costs per ounce mined. The latter directly drives profitability which ultimately determines stock prices. These key costs are also followed by YoY changes. Last but not least the annual changes are shown in operating cash flows generated and hard GAAP earnings, with a couple exceptions necessary.
Percentage changes aren’t relevant or meaningful if data shifted from positive to negative or vice versa, or if derived from two negative numbers. So in those cases I included raw underlying data rather than weird or misleading percentage changes. This whole dataset together offers a fantastic high-level read on how the major silver miners are faring fundamentally as an industry. They kept hanging in there in Q1’18.
Silver has always been driven by gold, effectively acting like a gold sentiment gauge. Generally big silver uplegs only happen after gold has rallied long enough and high enough to convince traders its gains are sustainable. Then the way-smaller silver market tends to start leveraging and amplifying gold’s moves by 2x to 3x. But strangely gold’s strength over the past year didn’t spill into silver, leaving its miners struggling.
Silver’s average price actually fell 4.1% between Q1’17 and Q1’18, despite a sizable 8.9% YoY rally in gold’s average price! Normally silver would’ve powered 18% to 27% higher on such a meaningful gold advance. But it went the other way because gold sentiment remained poor. Investors spent 2017 deeply enamored with the extraordinary levitating general stock markets, ignoring everything else including gold and silver.
With investors not interested, the already-battered silver stocks continued to languish near lows for most of 2017. These miners had insufficient capital and incentives to grow production, which is the lifeblood of mining. So unfortunately these top 17 SIL components collectively suffered sharp declines in both silver and gold production over the past year. That naturally hurt their operating and financial results in Q1’18.
These elite major silver miners’ total silver mined last quarter fell 5.3% YoY to 72.0m ounces! That was certainly not offset by higher gold production, which dropped an even-worse 8.1% YoY to 1243k ounces. And sadly those production declines are actually skewed smaller than sector reality. Note above the only big absolute gains in silver production came from two silver behemoths, Fresnillo and Industrias Peñoles.
Their silver production soared 14.0% and 13.1% YoY in Q1, bucking the weakening trend seen in many of the rest of these major miners. Together Fresnillo and Peñoles added 3.9m ounces of silver mined to the SIL-top-17 total. Without that huge boost, the overall silver production for these elite miners would’ve fallen a huge 10.4% YoY. And I suspect these Mexican giants’ silver production may be double-counted.
Fresnillo and Industrias Peñoles have an incestuous relationship, as the former used to be wholly owned by the latter. Industrias Peñoles spun off Fresnillo back in May 2008 on the London Stock Exchange. While Fresnillo’s financial reporting is decent, Industrias Peñoles’ is murky. Neither my decades studying financial statements as a Certified Public Accountant nor my rudimentary Spanish can penetrate very deep.
So I haven’t been able to track down how much of Fresnillo that Industrias Peñoles still owns, nor whether the silver production reported by these silver-mining monsters is actually fully mutually exclusive. I’m assuming it is for this analysis, but I’m skeptical. Both companies reported their huge YoY growth in silver production was the result of Fresnillo’s new San Julián silver mine ramping up, which is a big one.
San Julián produced 3568k ounces of silver in Q1’18 alone, along with fairly-large gold, zinc, and lead byproducts. It’s anticipated to produce 11.6m and 63.7k ounces of silver and gold annually for 12 years. Without San Julián, which could be double-reported between Fresnillo and Industrias Peñoles, the top SIL silver miners’ production would look very different. These elite silver miners have had a challenging year.
Fully excluding Fresnillo and Peñoles, the rest of these top SIL components saw their collective silver production plunge 16.8% YoY to 39.2m ounces! The mediocre silver-mining economics from these weak silver prices combined with company-specific problems have really hit this industry. Leading the drop in silver production were a couple of long-time American favorites, Tahoe Resources and SSR Mining.
Tahoe was originally spun off by Goldcorp to develop the incredible high-grade Escobal silver mine in Guatemala. Everything went well for its first few years, with this mine providing 1000+ great high-paying jobs to locals and contributing big taxes to the national economy. Then a group of anti-mining activists filed a frivolous and baseless lawsuit with the intent of shutting down Escobal. The whole thing was a farce.
Tahoe wasn’t even the target, Guatemala’s Ministry of Energy and Mines was. This regulator allegedly did not sufficiently consult with the Xinca indigenous people before granting Escobal’s permits! Only in a third-world country plagued with rampant government corruption would that be Tahoe’s problem instead of bureaucrats’. They apparently didn’t hold enough meetings, so Escobal’s mining license was actually suspended.
Tahoe was forced to temporarily mothball its crown-jewel silver mine, and eventually fire many of its local Guatemalan employees. The dishonorable Guatemalan government continues to drag its feet on this case, inexplicably strangling one of its largest taxpayers. It has even allowed violent anti-mine militants to illegally blockade the road to Escobal, often physically attacking trucks and drivers supplying this mine!
Thus Tahoe’s silver production plummeted 100% YoY from 5700k ounces to zero! That’s certainly not an existential threat, as Tahoe still has other sizable gold-mining operations. In early May’s Q1’18 report, Tahoe’s management is still optimistic a court ruling in its favor is soon coming. Then its licenses will be reinstated and it can slowly resume mining at Escobal. Hopefully this whole mess isn’t a stealth expropriation.
SSR Mining’s silver production fell a less-extreme-but-still-huge 38.3% YoY to 938k ounces in Q1’18. This has nothing to do with geopolitics like Tahoe’s nightmare, but is simply the forecast depletion of its old Pirquitas silver mine. SSR Mining, which used to be called Silver Standard Resources, is exploring in the area trying to extend the life of this mine. But most of its financial resources are being poured into its gold mines.
That gold focus among these top silver miners is common across SIL’s components. As the silver-percentage column above shows, most of these elite silver miners are actually primary gold miners by revenue! Only 3 of these 17 earned more than half of their Q1’18 sales from mining silver, and they are highlighted in blue. WPM, HL, PAAS, CDE, and TAHO are also top-34 components in the leading GDX gold miners’ ETF!
While they only comprised 8.7% of GDX’s total weighting in mid-May, this highlights how difficult it is to find primary silver miners. SIL’s managers have an impossible job these days with the major silver miners increasingly shifting to gold. They are really scraping the bottom of the barrel to find more silver miners. In Q3’17 they added Korea Zinc, and it’s now SIL’s 3rd-biggest holding with a hefty 11.9% total weighting.
That was intriguing, as I’d never heard of this company after decades of intensely studying and actively trading silver stocks. So I looked into Korea Zinc and found it was merely a smelter, not even a miner! The latest financial data I could find in English was 2015’s. That year Korea Zinc “produced” 63.3m ounces of silver, which was largely a byproduct from its main business of smelting zinc, lead, copper, and gold.
I ran the numbers for the heck of it, and silver was implied as 32% of Korea Zinc’s 2015 revenues. The fact SIL’s managers included a company like this that doesn’t even mine silver as a top SIL component shows how rare major silver miners have become. The economics of silver mining at today’s prices are inferior to gold mining. Thus the average silver-purity percentage of revenues of these SIL miners is only 36.8%.
That’s right in line with the past year’s trend, with 2017 seeing 38.5%, 37.6%, 40.1%, and 35.8% from Q1 to Q4. This reflects gold mining’s economics being superior to silver mining’s these days. Silver mining is as capital-intensive as gold mining, requiring similar large expenses for planning, permitting, and constructing mines and mills. It needs similar heavy excavators and haul trucks to dig and move the silver-bearing ore.
But silver generates much lower cash flows due to its lower price. Consider hypothetical mid-sized silver and gold miners, which might produce 10m and 300k ounces annually. At last quarter’s average metals prices, these silver and gold mines would yield $167m and $399m of yearly sales. It’s far easier to pay the bills mining gold than silver, which is unfortunate. But until silver surges again, that’s the way things are.
While I understand this, as a long-time silver-stock investor it saddens me primary silver miners have apparently become a dying breed. When silver starts powering higher in one of its gigantic uplegs and way outperforms gold again, this industry’s silver-purity percentage will rise. But unless silver not only shoots far ahead but stays there while gold lags, it’s hard to see major-silver-mining purity significantly reversing.
Unfortunately SIL’s mid-May composition was such that there wasn’t a lot of Q1 cost data reported by its top component miners. A half-dozen of these top SIL companies trade in the UK, South Korea, Mexico, and Peru, where reporting only comes in half-year increments. There are also primary gold miners that don’t report silver costs, and a silver explorer with no production. So silver cost data remains scarce.
Nevertheless it’s always useful to look at what we have. Industrywide silver-mining costs are one of the most-critical fundamental data points for silver-stock investors. As long as the miners can produce silver for well under prevailing silver prices, they remain fundamentally sound. Cost knowledge helps traders weather this sector’s occasional fear-driven plunges without succumbing to selling low like the rest of the herd.
There are two major ways to measure silver-mining costs, classic cash costs per ounce and the superior all-in sustaining costs. Both are useful metrics. Cash costs are the acid test of silver-miner survivability in lower-silver-price environments, revealing the worst-case silver levels necessary to keep the mines running. All-in sustaining costs show where silver needs to trade to maintain current mining tempos indefinitely.
Cash costs naturally encompass all cash expenses necessary to produce each ounce of silver, including all direct production costs, mine-level administration, smelting, refining, transport, regulatory, royalty, and tax expenses. In Q1’18, these top 17 SIL-component silver miners that reported cash costs averaged $5.05 per ounce. That plunged a whopping 25.2% YoY, making it look like silver miners are far more efficient.
But that’s misleading. Because of hefty byproduct credits from gold and base metals, Hecla Mining and Fortuna Silver Mines both reported negative cash costs in Q1. They are an accounting fiction, as mining silver still costs a lot of money. But crediting byproduct sales to silver can slash reported cash costs. In the comparable quarter a year earlier, there were no negative cash costs at any of SIL’s top 17 miners.
Those super-low cash costs offset SSR Mining’s crazy-high $17.07 per ounce. That’s not normal either, the result of that winding down of its lone silver mine. Excluding these extreme outliers, the remaining handful of silver miners had average cash costs of $5.50 per ounce. As long as silver prices stay above those levels, the silver miners can keep the lights on at their mines. Sub-$6 silver is wildly inconceivable.
Way more important than cash costs are the far-superior all-in sustaining costs. They were introduced by the World Gold Council in June 2013 to give investors a much-better understanding of what it really costs to maintain a silver mine as an ongoing concern. AISCs include all direct cash costs, but then add on everything else that is necessary to maintain and replenish operations at current silver-production levels.
These additional expenses include exploration for new silver to mine to replace depleting deposits, mine-development and construction expenses, remediation, and mine reclamation. They also include the corporate-level administration expenses necessary to oversee silver mines. All-in sustaining costs are the most-important silver-mining cost metric by far for investors, revealing silver miners’ true operating profitability.
In Q1’18 these top 17 SIL miners reporting AISCs averaged just $10.92 per ounce. That’s down 5.1% YoY, and still way below last quarter’s low average silver price of $16.72. Excluding SSRM’s $18.37 which is again a non-representative mine-depletion outlier, that slides to $9.42. Despite all the tough challenges the major silver miners are facing, they are still able to produce silver quite profitably today.
All-in sustaining costs and production are inversely related. Lower silver production, which many of SIL’s top components suffered last quarter, leaves fewer ounces to spread the big fixed costs of mining across. Yet average AISCs still retreated, showing these top silver miners are getting more efficient at producing their metal. That will grant the silver miners more upside profits leverage to rising silver as this metal recovers.
With last quarter’s $16.72 average silver price, $10.92 AISCs show the silver miners still earning pretty-fat profits of $5.81 per ounce. That’s actually only down 2.2% YoY because Q1’17’s higher silver prices were paired with higher AISCs. Since mining costs are largely fixed during planning and construction, these silver-mining profits will explode as silver mean reverts higher. And silver has vast room to run from here.
Today’s silver price remains crazy-low relative to prevailing gold levels, portending huge mean-reversion upside. The long-term average Silver/Gold Ratio runs around 56, which means it takes 56 ounces of silver to equal the value of one ounce of gold. Silver is greatly underperforming gold so far in 2018, with the SGR averaging a stock-panic-like 79.6 YTD as of late May! So silver is overdue to catch up with gold.
At a 56 SGR and $1300 gold, silver is easily heading near $23.25. That’s 39% above its Q1 average. Assuming the major silver miners’ all-in sustaining costs hold, that implies profits per ounce soaring 112% higher! Plug in a higher gold price or the usual mean-reversion overshoot after an SGR extreme, and the silver-mining profits upside is far greater. Silver miners’ inherent profits leverage to rising silver is incredible.
While all-in sustaining costs are the single-most-important fundamental measure that investors need to keep an eye on, other metrics offer peripheral reads on the major silver miners’ fundamental health. The more important ones include cash flows generated from operations, GAAP accounting profits, revenues, and cash on hand. They all deteriorated in Q1’18, as you’d expect with lower silver production and prices.
Before we get into them, these comparisons are a bit misleading. In Q1’18 12 of these SIL-top-17 silver miners reported quarterly financial results, compared to 14 a year earlier. So it’s not quite an apples-to-apples comparison. One reason is Silvercorp Metals, which clawed its way back into SIL’s top 17 over the past year. SVM tends to meander in and out of that 17th spot depending on its market cap relative to its peers.
SVM has a fiscal year ending March 31st, so its full-year results that require more time to prepare and get audited come later than normal quarterly results. I did all the underlying data collection and analysis for this essay, and wrote the draft, before they were reported in late May. Korea Zinc also doesn’t report in English as far as I can tell. Both of these light-blue-highlighted stocks weren’t in SIL’s top 17 a year ago.
Among these top SIL components reporting Q1’18 financial results, operating cash flows plunged 33.6% YoY to $528m. That’s still a strong number for such a small industry, proving that silver mines are still heavily cash-flow positive in general. Since cash on balance sheets actually slid 4.6% YoY to $2973m, the silver miners were apparently spending that cash flow on expansions that have yet to bear production fruit.
Overall sales among these elite silver miners dropped 13.0% YoY to $2699m. That makes sense given their 5.3% lower silver production and 4.1% lower average silver prices in Q1. Of course profits amplify falling sales, so the top 17 SIL silver stocks saw earnings plunge 24.1% YoY to $273m. But these silver miners were still enjoying profitable operations even with silver mired near lows in such miserable bearishness.
As silver powers higher in coming quarters, silver-mining profits will really leverage its advance. And that will fundamentally support far-higher silver-stock prices. The investors who will make out like bandits on this are the early contrarians willing to buy in low, before everyone else realizes what is coming. By the time silver surges higher with gold so silver stocks regain favor again, the big gains will have already been won.
While investors and speculators alike can certainly play the silver miners’ long-stalled mean-reversion bull with this leading SIL ETF, individual silver stocks with superior fundamentals will enjoy the best gains by far. Their upside will trounce the ETFs, which are burdened by companies that don’t generate enough of their sales from silver. A handpicked portfolio of purer elite silver miners will yield much-greater wealth creation.
At Zeal we’ve literally spent tens of thousands of hours researching individual silver stocks and markets, so we can better decide what to trade and when. As of the end of Q4, this has resulted in 983 stock trades recommended in real-time to our newsletter subscribers since 2001. Fighting the crowd to buy low and sell high is very profitable, as all these trades averaged stellar annualized realized gains of +20.2%!
The key to this success is staying informed and being contrarian. That means buying low before others figure it out, before undervalued silver stocks soar much higher. An easy way to keep abreast is through our acclaimed weekly and monthly newsletters. They draw on my vast experience, knowledge, wisdom, and ongoing research to explain what’s going on in the markets, why, and how to trade them with specific stocks. For only $12 per issue, you can learn to think, trade, and thrive like contrarians. Subscribe today, and get deployed in the great gold and silver stocks in our full trading books!
The bottom line is the major silver miners fared fine in Q1 despite some real challenges. A combination of silver continuing to seriously lag gold, along with anomalous company-specific problems, weighed on miners’ collective results. Yet they continued to produce silver at all-in sustaining costs way below Q1’s low prevailing silver prices. And their ongoing diversification into gold leaves them financially stronger.
With silver-stock sentiment remaining excessively bearish, this sector is primed to soar as silver itself resumes mean reverting higher to catch up with gold’s young bull market. The silver miners’ profits leverage to rising silver prices remains outstanding. After fleeing silver stocks so relentlessly over the past 21 months, investors will have to do big buying to reestablish silver-mining positions. That will fuel major upside.
On April 20th, Centenera Mining [TSX-V: CT, OTCQB: CTMIF]reported a strong partial drill hole result at its Esperanza Copper-Gold porphyry project in San Juan Province, Argentina. Excitement over this assay was running high. Management believed that the core looked good, so they rushed the top 166 meters to the lab.
Sometimes when expectations are elevated, actual news can disappoint…. not in this case! The plan was to punch down to 500 m, but drilling difficulties ended the hole at 387 m. Importantly, Esperanza remains open at depth and in all directions.
Mineralization was excellent through the top 166 m. On May 8th, Centenera put out the full drill hole assay, covering 387 m (from surface). Before jumping into the details, let me put into perspective historical work that Centenera has access to. Prior drilling returned the following highlights:
Mineralization outcrops at surface with a pyrite halo extending over a 1,400 m x 850 m area, drill holes generally intersected mineralization at surface, and the deposit is open in all directions. The majority of holes terminated in mineralization, the deposit is open at depth. Several holes demonstrated increasing grade with depth.
These are solid numbers, the best interval was 88 m, weighing in at 0.69% Copper (“Cu”) Equivalent (“Eq.”). The goal with this year’s drilling is to find more results like these through prudent step-out drilling. When exploring porphyry targets, one needs to find both wide intervals — 100+ meters, plus high-grade — say 0.60%-1.00% Cu Eq.
Having said that, the depth of a porphyry target matters a lot. All else equal, near-surface deposits can be viable at lower grades because pre-stripping (mining waste rock, or overburden, to reach an orebody) is expensive and time consuming. That’s why this first full assay from Centenera’s 2018 drill program is so exciting; a wide interval, plus strong grade,plus continuous mineralization from surface.
Drill hole 18-ESP-025 collared in mineralization that continued to the bottom of the hole at 387 m (hole abandoned due to drilling difficulties). Mineralization remains open at depth.
There is a number of porphyry exploration and development projects around the world with 0.30%-0.40% Cu Eq.orebodies. The lower the grade, the smaller the margin for error and the greater the need for abundant size. Centenera’s May 8th announcement places it well on its way to establishing economic grade, now it’s a matter of delineating a large-scale deposit. A surface expression of 1,400 x 850 meters is a good start.
East-west cross section showing complete results from 18-ESP-025 and a few previous drill holes. The exploration vector to higher grade Cu & Au is interpreted to be west, where 2 targets are highlighted. All drill holes are open at depth, and there’s significant untested ground to the west & east. Green = Cu grade / Red = Au grade.
By large-scale I mean > 3 billion pounds Cu Eq. This year’s drilling will be testing for bulk tonnage potential. Readers please note, the Company might not be able to identify muti-billions of pounds in a maiden resource estimate, but perhaps management can do so over time.
According to the Company, drill hole #: 18-ESP-025 would have ranked #3 among top global Cu intersections drilled in q1 2018. Drill intersections ranked by [the Cu portion only, multiplied by interval width (in meters)]. Despite a very promisingCu-Au project, and several other projects / properties in Argentina, Centenera’s market cap remains fairly low at justC$10.2 M / US$ 7.9 M. Shares are at C$0.14.
The above ranking is of projects where Cu is the primary metal and does not take into account other commodity credits. For example, Esperanza has meaningful gold credits that are not included. In addition to being at surface, (vs. an avg. depth to top of interval of 437 m) the Esperanza project is in a favorable mining province in Argentina, in fact the single best province — San Juan — (as measured by the latest annual Fraser Institute of Mining Survey).
A 0.40% Cu Eq.NI 43-101 compliant resource estimate would mark a robust outcome. Although there’s limited evidence of large scale to date, management’s goal is to find at least 500 million tonnes of mineralization (by no means a sure thing). 500 million tonnes at a grade of 0.40% would equate to nearly 4.5 billion Cu Eq. pounds. Management’s stated goal for its projects is to, “drill, add value and advance to JV or sale.”
I expanded the above chart from a prior article I wrote about Centenera Mining to include higher grades along the left side. This does not mean I believe that the overall mineralized grade will be up to 0.70%-0.75% Cu Eq., but in a constrained open-pit scenario (a subset of the entire deposit), perhapsa Cu Eq. of 0.45%+ could be achieved.
Near-term catalysts
Centenera has several catalysts worth watching for. First and foremost — another drill result in June. That hole was completed to a depth of approximately 450 m. Also, a possible update on its 100% owned Organullo epithermal gold project in Salta province. {2nd best province in Argentina–see brief overview of Organullo on left}
A study conducted in 2012 (using historical drill data) resulted inpotential tonnages & exploration target grades of gold.
** These potential exploration target quantities & grades are conceptual in nature, insufficient exploration & geological modelling has been done to define a mineral resource.
The conceptual (initial) target is between 600-960k ounces gold, grading between 0.92-0.94 g/t Au. Management acknowledges that Organullo will require a lot of drilling.
Another important catalyst is the upcoming closing of Centenera’sC$3 million capital raise. Once fresh capital has been banked, investors will stop worrying about that perceived overhang.
In the second half of 2018, there’s a decent chance cash burn will decrease as management finds partner(s) on one or both main projects. Partnerships typically involve giving up partial ownership in exchange for being free-carried(partner pays 100% of project costs) for a number of years [through key exploration (and possibly development) milestones].
It’s not hard to speculate on prospective partners. For instance, below a list of 20 companies that are Major or mid-tier Copper & Gold miners / project developers, with assets in Argentina and/or Chile, Peru, Ecuador. The top 9 players by market cap would not look at Centenera without evidence of the possibilityof finding > 10 billion pounds Cu Eq. The bottom 3 are small compared to the others, but could certainly come up with a relatively modest amount ofupfront funding required to get the Esperanza project into more robust, steady, active exploration.
I believe that Centenera Mining’s valuation at C$10.1 M / USD$ 7.8 M is too cheap given its portfolio of projects & properties in Argentina. Savvy natural resource stock investors point out that there are dozens of copper-focused porphyry targets in the hands of juniors that have > 1 billion pounds Cu Eq. That’s true, I’m tracking about 3 dozen.
However, there are red flags associated with many of the other prospects. For example, several projects are in higher-risk (than Argentina) or even dangerous jurisdictions in countries including the Philippines, Russia, Mongolia, Indonesia, the DRC & Namibia.Even Peru, the 2nd largest Cu producing country in the world, a jurisdiction with at least 5 major Cu projects held by juniors, is facing increasing challenges on the community relations front.
And, the largest Cu producing country by far, Chile, has prospective projects at elevations above ~4,000 meters that introduce a whole new set of risks, expenses & challenges. In part due to high altitude, Chile is much more sensitive to water issues. I’ve been told that Chile has become considerably more expensive to operate in than most other S. American countries.
Other potential red flags…. some projects have PEAs or PFSs with mediocre-to-poor economics; cap-ex figures twice or more the size of a project’s after-tax NPV. Or, IRRsbelow 15%, assumed Cu prices above US$3/lb., payback periods > 6 years, grades < 0.35%Cu Eq., strip ratios > 3:1.
Finally, infrastructure & project logistics– bulk mining operations require favorable access to transportation, roads, rail, port, power, water, a reliable work force and mining services / equipment providers.
Centenera Mining’s [TSX-V: CT, OTCQB: CTMIF] Esperanza project is probably in the middle of the pack on this score compared to the 3 dozen global juniors I’m tracking, but better than that among assets in S. America due to it being in San Juan province, having a very low strip ratio and being high grade. Esperanza is just 35 km from power lines and enjoys year-round road access. NOTE: {we still need to see further evidence of large-scale potential….}
Disclosures: The content of this article is for information purposes only. Readers fully understand and agree that nothing contained herein, written by Peter Epstein, about Centenera Mining, including but not limited to, commentary, opinions, views, assumptions, reported facts, calculations, etc. is to be considered, in any way whatsoever, implicit or explicit investment advice. Further, nothing contained herein is a recommendation or solicitation to buy, hold or sell any security. The content contained herein is not directed at any individual or group. Peter Epstein and Epstein Research [ER] are not responsible, under any circumstances whatsoever, for investment actions taken by the reader. Peter Epstein and [ER] have never been, and are not currently, a registered or licensed financial advisor or broker/dealer, investment advisor, stockbroker, trader, money manager, compliance or legal officer, and they do not perform market making activities. Peter Epstein and [ER] are not directly employed by any company, group, organization, party or person. The shares of Centenera Mining are highly speculative, not suitable for all investors. Readers understand and agree that investments in small cap stocks can result in a 100% loss of invested funds. It is assumed and agreed upon by readers that they will consult with their own licensed or registered financial advisors before making any investment decisions.
At the time this article was posted, Peter Epstein owned shares and stock options of Centenera Miningand the Company was a sponsor ofEpstein Research. Readers understand and agree that they must conduct their own due diligence above and beyond reading this article. While the author believes he’s diligent in screening out companies that, for any reasons whatsoever, are unattractive investment opportunities, he cannot guarantee that his efforts will (or have been) successful. Mr. Epstein & [ER] are not responsible for any perceived, or actual, errors including, but not limited to, commentary, opinions, views, assumptions, reported facts & financial calculations, or for the completeness of this article or future content. Mr. Epstein & [ER] are not expected or required to subsequently follow or cover events & news, or write about any particular company or topic. Mr. Epstein and [ER] are not experts in any company, industry sector or investment topic.


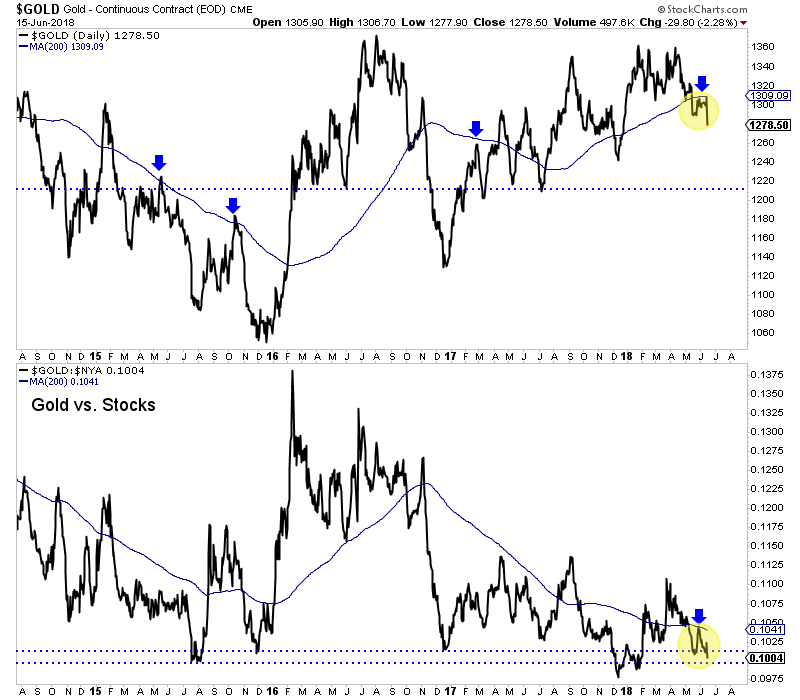
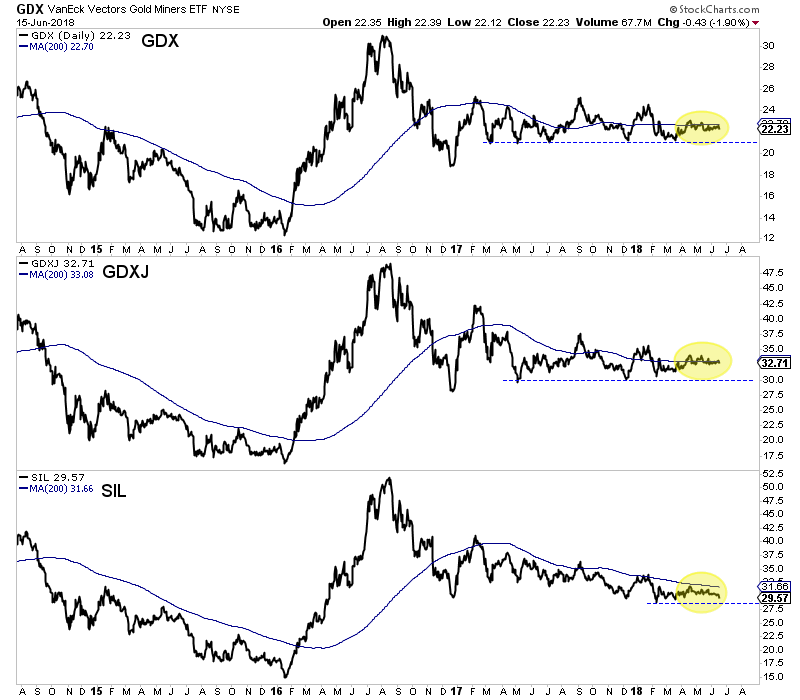
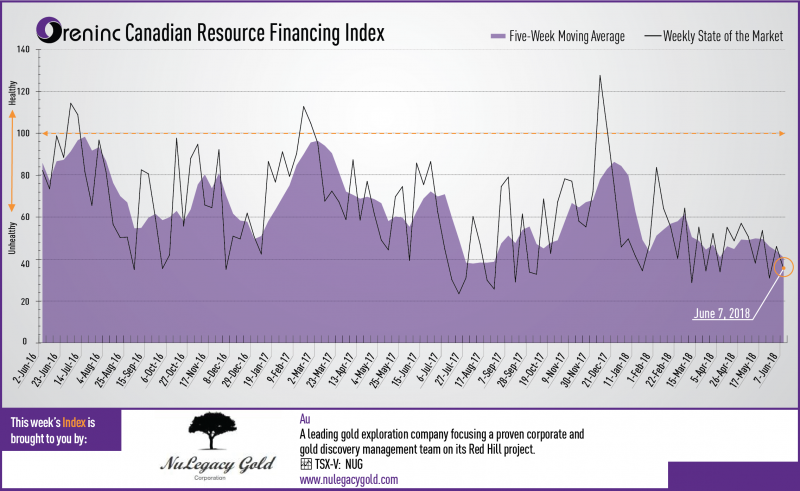

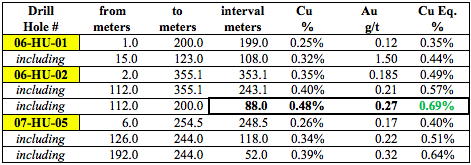
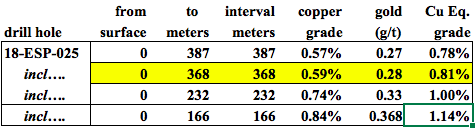
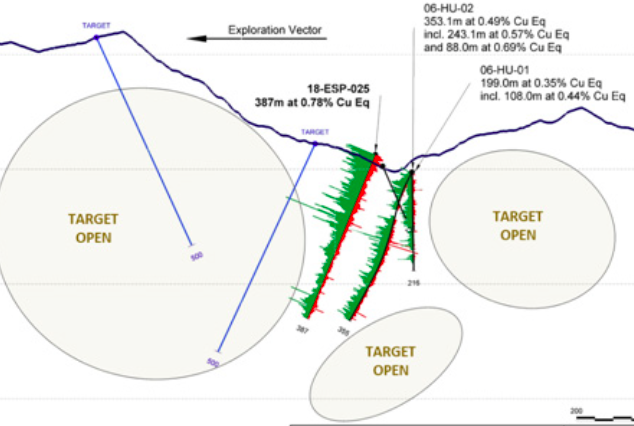
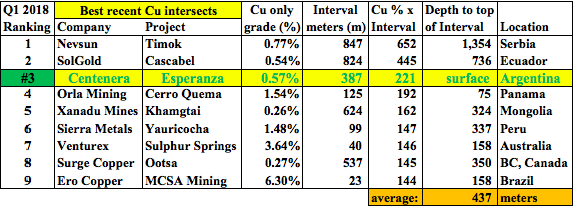
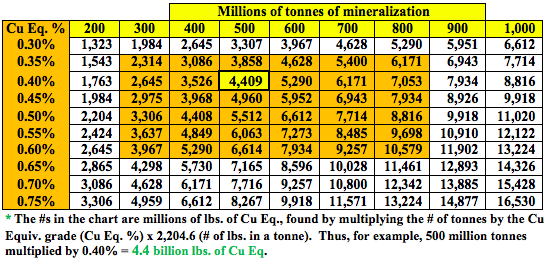
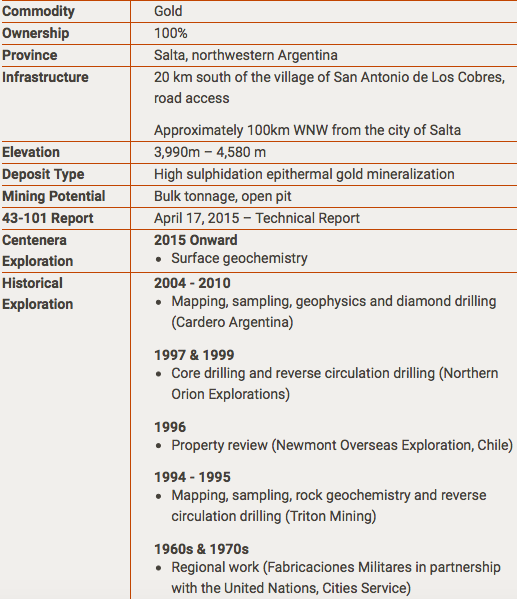
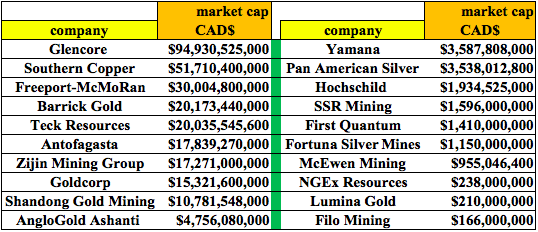
 Follow us on Twitter
 Become our facebook fan


