
The major silver miners’ stocks have been thrashed, pummeled to brutal multi-year lows. They suffered serious collateral damage as silver plunged on gold’s breakdown, driven by crazy-extreme all-time-record silver-futures short selling. All this technical carnage left investors reeling, devastating sentiment. The silver miners’ recently-reported Q2’18 results reveal whether their anomalous plunge was justified fundamentally.
Four times a year publicly-traded companies release treasure troves of valuable information in the form of quarterly reports. Companies trading in the States are required to file 10-Qs with the US Securities and Exchange Commission by 45 calendar days after quarter-ends. Canadian companies have similar requirements. In other countries with half-year reporting, many companies still partially report quarterly.
Unfortunately the universe of major silver miners to analyze and invest in is pretty small. Silver mining is a tough business both geologically and economically. Primary silver deposits, those with enough silver to generate over half their revenues when mined, are quite rare. Most of the world’s silver ore formed alongside base metals or gold. Their value usually well outweighs silver’s, relegating it to byproduct status.
The Silver Institute has long been the authority on world silver supply-and-demand trends. It published its latest annual World Silver Survey covering 2017 in mid-April. Last year only 28% of the silver mined around the globe came from primary silver mines! 36% came from primary lead/zinc mines, 23% copper, and 12% gold. That’s nothing new, the silver miners have long supplied less than a third of world mined supply.
It’s very challenging to find and develop the scarce silver-heavy deposits supporting primary silver mines. And it’s even harder forging them into primary-silver-mining businesses. Since silver isn’t very valuable, most silver miners need multiple mines in order to generate sufficient cash flows. Traditional major silver miners are increasingly diversifying into gold production at silver’s expense, chasing its superior economics.
So there aren’t many major silver miners left out there, and their purity is shrinking. The definitive list of these companies to analyze comes from the most-popular silver-stock investment vehicle, the SIL Global X Silver Miners ETF. In mid-August at the end of Q2’s earnings season, SIL’s net assets were running 6.7x greater than its next-largest competitor’s. So SIL continues to dominate this small niche contrarian sector.
While SIL has its flaws, it’s the closest thing we have to a silver-stock index. As ETF investing continues to eclipse individual-stock picking, SIL inclusion is very important for silver miners. It grants them better access to the vast pools of stock-market capital. Differential SIL-share buying by investors requires this ETF’s managers to buy more shares in its underlying component companies, bidding their stock prices higher.
In mid-August as the silver miners were finishing reporting their Q2’18 results, SIL included 23 “Silver Miners”. Unfortunately the great majority aren’t primary silver miners, most generate well under half their revenues from silver. That’s not necessarily an indictment against SIL’s stock picking, but a reflection of the state of this industry. There aren’t enough significant primary silver miners left to fully flesh out an ETF.
This disappointing reality makes SIL somewhat problematic. The only reason investors would buy SIL is they want silver-stock exposure. But if SIL’s underlying component companies generate just over a third of their sales from silver mining, they aren’t going to be very responsive to silver price moves. And most of that ETF capital intended to go into primary silver miners is instead diverted into byproduct silver miners.
So silver-mining ETFs sucking in capital investors thought they were allocating to real primary silver miners effectively starves them. Their stock prices aren’t bid high enough to attract in more investors, so they can’t issue sufficient new shares to finance big silver-mining expansions. This is exacerbating the silver-as-a-byproduct trend. Only sustained much-higher silver prices for years to come could reverse this.
Every quarter I dig into the latest results from the major silver miners of SIL to get a better understanding of how they and this industry are faring fundamentally. I feed a bunch of data into a big spreadsheet, some of which made it into the table below. It includes key data for the top 17 SIL component companies, an arbitrary number that fits in this table. That’s a commanding sample at 95.8% of SIL’s total weighting!
While most of these top 17 SIL components had reported on Q2’18 by mid-August, not all had. Some of these major silver miners trade in the UK or Mexico, where financial results are only required in half-year increments. If a field is left blank in this table, it means that data wasn’t available by the end of Q2’s earnings season. Some of SIL’s components also report in gold-centric terms, excluding silver-specific data.
The first couple columns of this table show each SIL component’s symbol and weighting within this ETF as of mid-August. While most of these stocks trade on US exchanges, some symbols are listings from companies’ primary foreign stock exchanges. That’s followed by each miner’s Q2’18 silver production in ounces, along with its absolute year-over-year change. Next comes this same quarter’s gold production.
Nearly all the major silver miners in SIL also produce significant-to-large amounts of gold! That’s truly a double-edged sword. While gold really stabilizes and boosts silver miners’ cash flows, it also retards their stocks’ sensitivity to silver itself. So the next column reveals how pure these elite silver miners are, approximating their percentages of Q2’18 revenues actually derived from silver. This is calculated two ways.
The large majority of these top SIL silver miners reported total Q2 revenues. Quarterly silver production multiplied by silver’s average price in Q2 can be divided by these sales to yield an accurate relative-purity gauge. When Q2 sales weren’t reported, I estimated them by adding silver sales to gold sales based on their production and average quarterly prices. But that’s less optimal, as it ignores any base-metals byproducts.
Next comes the major silver miners’ most-important fundamental data for investors, cash costs and all-in sustaining costs per ounce mined. The latter directly drives profitability which ultimately determines stock prices. These key costs are also followed by YoY changes. Last but not least the annual changes are shown in operating cash flows generated and hard GAAP earnings, with a couple exceptions necessary.
Percentage changes aren’t relevant or meaningful if data shifted from positive to negative or vice versa, or if derived from two negative numbers. So in those cases I included raw underlying data rather than weird or misleading percentage changes. This whole dataset together offers a fantastic high-level read on how the major silver miners are faring fundamentally as an industry. Was their recent plunge righteous?
Production is naturally the lifeblood of the silver-mining sector. The more silver and increasingly gold that these elite miners can wrest from the bowels of the earth, the stronger their fundamental positions and outlooks. These top 17 SIL silver miners failed to increase their mining tempos over this past year. Their collective silver and gold production deteriorated 4.4% and 2.1% YoY to 75.1m and 1327k ounces mined.
According to the Silver Institute’s latest WSS, total world silver mine production averaged 213.0m ounces per quarter in 2017. So at 75.1m in Q2, these top 17 SIL components were responsible for 35.3% of that rate. And their overall production decline last quarter is misleading, heavily skewed by two outliers with unusual situations. Tahoe Resources and SSR Mining reported huge 100.0% and 46.3% YoY production plunges!
Without TAHO and SSRM, the rest of these elite silver miners were able to grow their collective silver production by a decent 2.0% YoY. That’s impressive considering the miserable silver-price environment. Between Q2’17 and Q2’18, the average quarterly silver price slumped 3.9% to $16.51. That was really weak compared to gold, which actually rose 3.9% in quarterly-average terms to $1306 across these quarters.
Silver has always been driven by gold, effectively acting like a gold sentiment gauge. Generally big silver uplegs only happen after gold has rallied long enough and high enough to convince traders its gains are sustainable. Then the way-smaller silver market tends to start leveraging and amplifying gold’s moves by 2x to 3x. But gold sentiment was so insipid over this past year that no excitement was sparked for silver.
Yet the top 17 SIL silver miners excluding TAHO and SSRM were able to buck those silver headwinds to still grow production. That is setting up these companies for stronger profits growth once silver’s price inevitably mean reverts higher. It’s important to understand what’s going on with TAHO and SSRM though, as these are long-time favorites among American investors. TAHO’s silver production should return.
Tahoe was originally spun off by Goldcorp to develop the incredible high-grade Escobal silver mine in Guatemala, which went live in Q4’13. Everything went well for its first few years. By Q1’17, Escobal was a well-oiled machine producing 5700k ounces of silver. That provided 1000+ great high-paying jobs to locals and contributed big taxes to Guatemala’s economy. Escobal was a great economic boon for this country.
But a radical group of anti-mining activists managed to spoil everything, cruelly casting their fellow countrymen out of work. They filed a frivolous and baseless lawsuit against Guatemala’s Ministry of Energy and Mines, Tahoe wasn’t even the target! It alleged this regulator had not sufficiently consulted with the indigenous Xinca people before granting Escobal’s permits. And they don’t even live around this mine site.
Only in a third-world country plagued with rampant government corruption would a regulator apparently not holding enough meetings be a company’s problem. Instead of resolving this, a high Guatemalan court inexplicably actually suspended Escobal’s mining license in early Q3’17! Tahoe was forced to temporarily mothball its crown-jewel silver mine, and thus eventually lay off its Guatemalan employees.
That license was technically reinstated a couple months later, but the activists appealed to a higher court. It required the regulator to study the indigenous people in surrounding areas and report back, and now needs to make a decision. The government also needs to clear out an illegal roadblock to the mine site by violent anti-mine militants, who have blockaded Escobal supplies and physically attacked trucks and drivers!
So Escobal has been dead in the water with zero production for an entire year, an unthinkable outcome. This whole thing is a farce, a gross miscarriage of justice. Sooner or later the Guatemalan bureaucrats will get all their useless paperwork done and Escobal will come back online. After a few quarters or so of spinning back up, Escobal’s silver production should return to pre-fiasco levels around 5700k ounces a quarter.
That would boost SIL’s top 17 components’ current overall silver production by 7.6%. In my decades of intensely researching and actively trading mining stocks, I’ve never seen anything like this Escobal debacle. While TAHO’s cashflows are really impaired without this silver mine which was actually the world’s largest primary, it can weather this nightmare because of its other gold mines that yielded 102.6k ounces in Q2’18.
Thankfully SSR Mining’s silver-production plunge is far less dramatic. This company used to be known as Silver Standard Resources, and its old Pirquitas silver mine is simply depleting as forecast. SSRM is exploring in the area trying to extend the life of this old mine, which was joint-ventured and renamed the Puna Operations. But most of SSRM’s resources are being poured into its far-more-profitable gold mines.
That gold focus among these top silver miners is common across SIL’s components. As the silver-percentage column above shows, most of these elite silver miners are actually primary gold miners by revenue! Only 3 of these 17 earned more than half of their Q2’18 sales from mining silver, and they are highlighted in blue. WPM, PAAS, and TAHO are also top-34 components in the leading GDX gold miners’ ETF!
While they only comprised 7.8% of GDX’s total weighting in mid-August, this highlights how difficult it is to find primary silver miners. SIL’s managers have an impossible job these days with the major silver miners increasingly shifting to gold. They are really scraping the bottom of the barrel to find more silver miners. In Q3’17 they added Korea Zinc, and it’s now SIL’s 3rd-biggest holding with a hefty 11.9% total weighting.
That was intriguing, as I’d never heard of this company after decades deeply immersed in this small silver-mining sector. So I looked into Korea Zinc and found it was merely a smelter, not even a miner! Its English-language disclosures are atrocious, starting with its homepage reading “We are Korea Zinc, the world’s one of the best smelting company”. The latest production data I can find in English is still 2015’s.
That year Korea Zinc “produced” 63.3m ozs of silver, which averages to 15.8m quarterly. That is largely a byproduct from its main businesses of smelting zinc, lead, copper, and gold. The fact SIL’s managers included a company like this that doesn’t even mine silver as a top SIL component shows how rare major silver miners have become. The economics of silver mining at today’s prices are way inferior to gold mining.
The traditional major silver miners are painfully aware of this, and have spent years actively diversifying into gold. In Q2’18, the average percentage of revenues these top 17 SIL miners derived from silver was only 36.3%. That’s right in line with the recent trend, with the prior four quarters seeing 36.1%, 39.3%, 35.3%, and 36.4%. This relatively-low silver exposure is why SIL isn’t as responsive to silver as investors expect.
Silver mining is every bit as capital-intensive as gold mining, requiring similar large expenses for planning, permitting, and constructing mines and mills. It needs similar heavy excavators and haul trucks to dig and move the silver-bearing ore. Similar levels of employees are necessary to run these mines. But silver generates much lower cash flows due to its lower price. Consider hypothetical mid-sized silver and gold mines.
They might produce 10m and 300k ounces annually. At last quarter’s average prices, these silver and gold mines would yield $165m and $392m of yearly sales. Unfortunately it is far easier to pay the bills mining gold these days. So primary silver miners are increasingly becoming a dying breed, which is sad. The traditional major silver miners are adapting by ramping their gold production often at silver’s expense.
This industry’s flagging silver purity and thus deteriorating responsiveness to silver price trends will be hard to reverse. Silver would need to far outperform gold, rocketing higher in one of its gigantic uplegs while gold lags. And it would have to stay relatively strong compared to gold for years after that to entice big capital spending back into primary silver mines. While possible, that seems like a stretch in today’s markets.
Unfortunately SIL’s mid-August composition was such that there wasn’t a lot of Q2 cost data reported by its top component miners. A half-dozen of these top SIL companies trade in the UK, South Korea, Mexico, and Peru, where reporting only comes in half-year increments. There are also primary gold miners that don’t report silver costs, and a silver explorer with no production. So silver cost data remains scarce.
Nevertheless it’s always useful to look at what we have. Industrywide silver-mining costs are one of the most-critical fundamental data points for silver-stock investors. As long as the miners can produce silver for well under prevailing silver prices, they remain fundamentally sound. Cost knowledge helps traders weather this sector’s occasional fear-driven plunges without succumbing to selling low like the rest of the herd.
There are two major ways to measure silver-mining costs, classic cash costs per ounce and the superior all-in sustaining costs. Both are useful metrics. Cash costs are the acid test of silver-miner survivability in lower-silver-price environments, revealing the worst-case silver levels necessary to keep the mines running. All-in sustaining costs show where silver needs to trade to maintain current mining tempos indefinitely.
Cash costs naturally encompass all cash expenses necessary to produce each ounce of silver, including all direct production costs, mine-level administration, smelting, refining, transport, regulatory, royalty, and tax expenses. In Q2’18, these top 17 SIL-component silver miners that reported cash costs averaged just $3.95 per ounce! That plunged a whopping 37.6% YoY, making it look like these miners are getting more efficient.
But that’s misleading. Because of hefty byproduct credits from gold and base metals, Hecla Mining and Fortuna Silver Mines both reported negative cash costs in Q2. They are an accounting fiction, as mining silver still costs a lot of money. But crediting byproduct sales to silver can slash reported cash costs. In the comparable quarter a year earlier, there were no negative cash costs at any of SIL’s top 17 miners.
Those super-low cash costs offset SSR Mining’s crazy-high $14.73 per ounce. That’s not normal either, the result of that winding down of its lone silver mine. Excluding these extreme outliers, the remaining handful of silver miners had average cash costs of $4.83 per ounce. As long as silver prices stay above those levels, the silver miners can keep the lights on at their mines. Sub-$5 silver is wildly inconceivable!
Way more important than cash costs are the far-superior all-in sustaining costs. They were introduced by the World Gold Council in June 2013 to give investors a much-better understanding of what it really costs to maintain silver mines as ongoing concerns. AISCs include all direct cash costs, but then add on everything else that is necessary to maintain and replenish operations at current silver-production levels.
These additional expenses include exploration for new silver to mine to replace depleting deposits, mine-development and construction expenses, remediation, and mine reclamation. They also include the corporate-level administration expenses necessary to oversee silver mines. All-in sustaining costs are the most-important silver-mining cost metric by far for investors, revealing silver miners’ true operating profitability.
In Q2’18 these top 17 SIL miners reporting AISCs averaged just $10.93 per ounce! That was down 6.3% YoY, and was way below silver’s average price of $16.51 last quarter. Even if the two extreme outliers are thrown out, SSRM’s abnormally-high mine-depletion $17.66 AISC and SVM’s incredibly-low huge-byproduct-credit $0.41 AISC, the remaining average is similar at $11.56. Silver mining remains very profitable!
Even at worst in August’s plunge driven by speculators’ crazy-extreme all-time-record silver-futures short selling, silver merely hit $14.44 on close. That’s still way above this industry’s total production costs any way you slice it. That implies even at peak fear the elite top silver miners of SIL were still earning hefty 24% profit margins! So there’s no doubt the recent frantic silver-stock selling wasn’t fundamentally righteous.
SIL getting hammered to deep 2.5-year lows in mid-August was the product of irrational fear run amok, it had nothing to do with how the silver miners are faring. At Q2’s average silver price and AISCs, these miners were earning $5.58 per ounce. Most other industries would die for such 34% margins. And those are going to explode higher as silver inevitably mean reverts back up again, probably violently given this setup.
Silver stocks plunged in August because silver did. That was driven by truly-extreme silver-futures short selling by speculators. They ramped their shorts to a wild new all-time record high of 114.5k contracts in mid-August! All that short selling is guaranteed proportional near-future buying, as excessive shorts must be closed by buying offsetting long contracts. Short-covering rallies are self-feeding, catapulting silver higher.
The more speculators buy to cover, the faster silver surges. The faster it surges, the more they have to buy to cover or face catastrophic losses due to the extreme leverage inherent in silver futures. It would take 73.0k contracts of buying to return spec shorts to their 52-week low seen in mid-September 2017. That’s the equivalent of 364.9m ounces, or nearly 43% of last year’s entire global mined supply! Talk about big.
And today’s silver prices are super-low relative to prevailing gold levels, portending huge mean-reversion upside. The long-term average Silver/Gold Ratio runs around 56x, which means it takes 56 ounces of silver to equal the value of one ounce of gold. Silver is greatly underperforming gold so far in 2018, with the SGR averaging a stock-panic-like 80.2x thus far in August! So silver is overdue to catch up with gold.
At a 56x SGR and $1200 gold, silver is easily heading near $21.50. That’s 30% above its Q2 average. Assuming the major silver miners’ all-in sustaining costs hold, that implies profits per ounce soaring 89% higher! And the record silver-futures short covering necessary after record silver-futures short selling is very likely to fuel a massive mean-reversion overshoot, making the silver-mining-profits upside much greater.
And silver miners’ AISCs generally don’t change much regardless of prevailing silver prices, since silver-mining costs are largely fixed during mine planning and construction. The top 17 SIL miners’ AISCs in the past four quarters averaged $11.66, $9.73, $10.16, and $10.92. So Q2’18’s $10.93 was right in line. Costs aren’t going to rise much as silver recovers, and higher production may even push them lower still.
While all-in sustaining costs are the single-most-important fundamental measure that investors need to keep an eye on, other metrics offer peripheral reads on the major silver miners’ fundamental health. The more important ones include cash flows generated from operations, GAAP accounting profits, revenues, and cash on hand. They were all decent to healthy in Q2’18 despite the low silver prices and weak sentiment.
These SIL-top-17 silver miners’ collective revenues only fell 1.5% YoY to $3114m. That reflects higher gold prices which offset the lower silver ones. That drove operating-cash-flow generation of $758m, which was 27.0% lower YoY. That’s not unreasonable given the 3.9% lower average silver prices from Q2’17 to Q2’18 and the 4.4% lower silver production among these elite silver majors. Cash flows remain fine.
These silver miners’ balance-sheet cash and short-term investments still powered 18.0% higher YoY to $3637m. The bigger their cash hoards, the easier the elite silver miners can weather these weak silver prices. Big treasuries also give them more capital to expand existing mines and buy or build new ones. A fundamental surprise seemed to come in hard GAAP accounting profits though, which soared 110.6% YoY!
But the $343m total earnings in Q2’18 were wildly skewed by a huge $246m non-recurring gain Wheaton Precious Metals reported. 77% of its massive $318m in profits came from gains on the sale of one of its silver streams. Back that out of overall top-17-SIL-component earnings, and they actually plunged 40.3% YoY. But they were still positive at $97m, and have incredible upside potential as silver’s price inevitably recovers.
The silver-mining stocks are doing way better fundamentally than they’ve been given credit for. Their mining costs remain far below prevailing silver levels, driving strong profitability even at August’s deep silver-price lows. That capitulation silver-stock plummeting fueled by cascading selling as stop losses were sequentially run wasn’t justified fundamentally. It was an extreme sentiment anomaly that can’t persist.
So a big mean-reversion rebound higher is inevitable and imminent. While traders can play that in SIL, that’s mostly a bet on primary gold miners with byproduct silver production. The best gains by far will be won in smaller purer mid-tier and junior silver miners with superior fundamentals. A carefully-handpicked portfolio of these miners will generate much-greater wealth creation than ETFs dominated by non-primary miners.
At Zeal we’ve literally spent tens of thousands of hours researching individual silver stocks and markets, so we can better decide what to trade and when. As of the end of Q2, this has resulted in 1012 stock trades recommended in real-time to our newsletter subscribers since 2001. Fighting the crowd to buy low and sell high is very profitable, as all these trades averaged stellar annualized realized gains of +19.3%!
The key to this success is staying informed and being contrarian. That means buying low when others are scared, before undervalued silver stocks soar much higher. An easy way to keep abreast is through our acclaimed weekly and monthly newsletters. They draw on my vast experience, knowledge, wisdom, and ongoing research to explain what’s going on in the markets, why, and how to trade them with specific stocks. Subscribe today while great silver stocks remain dirt-cheap!
The bottom line is the major silver miners’ fundamentals remain solid based on their recently-reported Q2’18 results. They continue to mine silver at all-in sustaining costs far below even mid-August’s deep silver lows. Their still-impressive profits will multiply as silver rebounds higher violently on record futures short covering. Investment capital will flood back into this tiny sector, catapulting silver stocks up sharply.
So traders need to look through the recent frightened herd sentiment to understand the silver miners’ hard fundamentals. These forsaken stocks are radically undervalued even at today’s low silver prices, let alone where silver heads during the next major gold upleg. Silver is poised to rocket higher soon as that mandatory extreme short covering gets underway. So the opportunities to buy dirt-cheap miners are fleeting.
- Gold’s impressive rally continues to accelerate. Key fundamental and technical price drivers are playing a bullish song with almost perfect harmony.
- Please click here now. Double-click to enlarge what may be the most beautiful weekly chart continuation pattern in the history of markets.
- Note the awesome stance of the RSI and Stochastics oscillators as gold begins to ascend from the right shoulder low of the pattern.
- If Michelangelo could be brought back to life, he would surely consider the picture being painted by the current technical action on this gold chart to be a “bull era masterpiece”.
- Gold’s fabulous technical posture received a solid fundamental boost from two key central banks on Friday. Please click here now. The PBOC just announced an important change in price discovery for the yuan versus the dollar.
- Please click here now. The “tariffs tantrum” created a decline in the yuan versus the dollar, and that’s what created the decline in gold to the right shoulder low.
- The yuan is now rallying, and the PBOC announcement should give this rally some serious legs.
- If the rupee also begins a rally against the dollar as the strong demand season for gold begins in India, gold’s right shoulder rally could turn into a major barnburner!
- US central bank chair Jay Powell also added more fuel to gold’s rally on Friday, when he hinted that rates could be normalized by mid 2019. This powerful central banker also suggested that US GDP growth of 3% cannot be sustained for much longer.
- Many analysts hoped that the Trump administration could extend the business cycle and corporate tax cuts have certainly helped to do that.
- Unfortunately, Trump has shot most of his economic booster shot bullets, and his administration brings middle of the road republicanism to the table, not libertarianism.
- Given the current demographics of the United States (population age, debt, and a declining “petro-dollar”), it’s going very difficult to “make most of the citizens great” with this approach.
- Trump himself is a highly skilled business builder. Individuals with his incredible skills can thrive in almost any environment. In a socialist country like China, India, or Germany, Trump would likely be just as successful as he’s been in America, and perhaps even more so due to his incredible drive to overcome adversity.
- Unfortunately, the average business owner doesn’t have his skills or energy, and they need vastly more libertarian support than the US government can currently provide.
- The bottom line: US population demographics are horrific. House prices in most areas are unaffordable for almost anyone who isn’t rich or hasn’t inherited money. There is no incentive for industry to produce cheap electric cars. Property taxes are outrageously high and still rising relentlessly.
- To reach and sustain the kind of long term growth rates that Trump has targeted, the income tax and the capital gains tax can’t just be cut. They need to be eliminated completely.
- Back in 2014 I predicted that US GDP would peak in the 4% – 5% range in a single quarter during the 2017 – 2019 time frame. It happened in 2018. I’ve further predicted that GDP begins to fade in 2019 and steadily declines to the 1%-2% range. That prediction looks to be perfectly on track, and I’m sticking with it.
- Please click here now. Commerzbank is a member of both the LBMA and the COMEX. Their analytical work command tremendous respect in the institutional investment community.
- Their top analysts now suggest that gold will reach $1300 by year-end and $1500 by 2019. I don’t use time targets, but my weekly chart bull continuation pattern for gold bullion is perfectly in sync with their scenario.
- Please click here now. Double-click to enlarge this Chinese stock market chart. Events in America are lining up with events in China and India to create a picture-perfect gold price surge to the $1500 area in 2019.
- This Chinese stock market chart shows the FXI-NYSE ETF in a beautiful bull wedge pattern. The upside breakout that I’m forecasting would put Chinese gold buyers in a very good mood just as the strong demand season begins!
- Please click here now. Double-click to enlarge this key GDX chart. A Vanguard gold-oriented mutual fund is transitioning to a more “general commodity” holdings approach. That’s put pressure on gold stocks in a “one off” or “black swan” manner as the fund sells a lot of gold stocks to make the transition. The good news is that this selling seems to be largely complete now.
- I realise that the gold stocks decline may have caught some investors by surprise, but those with put options for insurance easily took it in stride. This is simply a great and unique opportunity to buy GDX and quality gold stocks near the base of my $21 – $18 accumulation zone.
- As the majestic rally from gold bullion’s right shoulder low accelerates, Vanguard’s selling ends, and gold stocks are poised to stage “hypersonic” outperformance against all asset classes. Key fundamental and technical price drivers will soon make all gold stock investors look and feel like they are King Kong, lording over a fabulous bull era!
The junior gold miners’ stocks have been thrashed in August, plummeting to brutal multi-year lows. Such carnage naturally left sentiment far more bearish than usual in this forsaken contrarian sector. But these extremely-battered gold-stock prices certainly aren’t justified fundamentally. Junior gold miners’ collective results from their just-completed Q2’18 earnings season prove their stock prices need to mean revert way higher.
Four times a year publicly-traded companies release treasure troves of valuable information in the form of quarterly reports. Companies trading in the States are required to file 10-Qs with the US Securities and Exchange Commission by 45 calendar days after quarter-ends. Canadian companies have similar requirements. In other countries with half-year reporting, many companies still partially report quarterly.
The definitive list of elite “junior” gold stocks to analyze comes from the world’s most-popular junior-gold-stock investment vehicle. This week the GDXJ VanEck Vectors Junior Gold Miners ETF reported $4.5b in net assets. Among all gold-stock ETFs, that was second only to GDX’s $8.4b. That is GDXJ’s big-brother ETF that includes larger major gold miners. GDXJ’s popularity testifies to the great allure of juniors.
Unfortunately this fame created serious problems for GDXJ a couple years ago, resulting in a stealthy major mission change. This ETF is quite literally the victim of its own success. GDXJ grew so large in the first half of 2016 as gold stocks soared in a massive upleg that it risked running afoul of Canadian securities laws. And most of the world’s smaller gold miners and explorers trade on Canadian stock exchanges.
Since Canada is the center of the junior-gold universe, any ETF seeking to own this sector will have to be heavily invested there. But once any investor including an ETF buys up a 20%+ stake in any Canadian stock, it is legally deemed to be a takeover offer that must be extended to all shareholders! As capital flooded into GDXJ in 2016 to gain junior-gold exposure, its ownership in smaller components soared near 20%.
Obviously hundreds of thousands of investors buying shares in an ETF have no intention of taking over gold-mining companies, no matter how big their collective stakes. That’s a totally-different scenario than a single corporate investor buying 20%+. GDXJ’s managers should’ve lobbied Canadian regulators and lawmakers to exempt ETFs from that 20% takeover rule. But instead they chose an inferior, easier fix.
Since GDXJ’s issuer controls the junior-gold-stock index underlying its ETF, it simply chose to unilaterally redefine what junior gold miners are. It rejiggered its index to fill GDXJ’s ranks with larger mid-tier gold miners, while greatly demoting true smaller junior gold miners in terms of their ETF weightings. This controversial move defying long decades of convention was done quietly behind the scenes to avoid backlash.
There’s no formal definition of a junior gold miner, which gives cover to GDXJ’s managers pushing the limits. Major gold miners are generally those that produce over 1m ounces of gold annually. For decades juniors were considered to be sub-200k-ounce producers. So 300k ounces per year is a very-generous threshold. Anything between 300k to 1m ounces annually is in the mid-tier realm, where GDXJ now traffics.
That high 300k-ounce-per-year junior cutoff translates into 75k ounces per quarter. Following the end of the gold miners’ Q2’18 earnings season in mid-August, I dug into the top 34 GDXJ components’ results. That’s simply an arbitrary number that fits neatly into the tables below. Although GDXJ included a staggering 71 component stocks this week, the top 34 accounted for a commanding 81.1% of its total weighting.
Out of these top 34 GDXJ companies, only 4 primary gold miners met that sub-75k-ounce-per-quarter qualification to be a junior gold miner! Their quarterly production is rendered in blue below, and they collectively accounted for just 8.9% of GDXJ’s total weighting. But even that is really overstated, as 3 of these are long-time traditional major silver miners that are increasingly diversifying into gold in recent years.
GDXJ is inarguably now a pure mid-tier gold-miner ETF, and really ought to be advertised as such. While its holdings include some of the world’s best gold miners with huge upside potential, the great majority definitely aren’t classic junior gold miners. At least this ETF’s big composition changes are stabilizing, as Q2’18 was the first quarter since mid-2016 where GDXJ’s components didn’t radically change year-over-year.
I’ve been doing these deep quarterly dives into GDXJ’s top components for years now. In Q2’18, fully 32 of the top 34 GDXJ components were also GDX components! These are separate and distinct ETFs, a “Gold Miners ETF” and a “Junior Gold Miners ETF”. So they shouldn’t have to own many of the same companies. In the tables below I highlighted the symbols of rare GDXJ components not also in GDX in yellow.
These 32 GDX components accounted for 78.4% of GDXJ’s total weighting, not just its top 34. They also represented 38.0% of GDX’s total weighting. Thus nearly 4/5ths of this “Junior Gold Miners ETF” is made up by over 3/8ths of the major “Gold Miners ETF”! These GDXJ components also in GDX start at the 10th-highest weighting in that latter larger ETF and extend down to 47th. GDXJ is mostly smaller GDX stocks.
In a welcome change from GDXJ’s vast component turmoil of recent years, only 2 of its top 34 stocks are new since Q2’17. Their symbols are highlighted in light blue below. Thus the top GDXJ components’ collective results are finally getting comparable again in year-over-year terms. Analyzing ETFs is much easier if their larger components aren’t constantly in flux. Hopefully changes going forward are relatively minor.
Despite all this, GDXJ remains the leading “junior-gold” benchmark. So every quarter I wade through tons of data from its top components’ latest results, and dump it into a big spreadsheet for analysis. The highlights make it into these tables. Most of these top 34 GDXJ gold miners trade in the US and Canada, where comprehensive quarterly reporting is required by regulators. But others trade in Australia and the UK.
In these countries and most of the rest of the world, regulators only mandate that companies report their results in half-year increments. Some do still issue quarterly production reports, but don’t release financial statements. There are wide variations in reporting styles, data presented, and release timing. So blank fields in these tables mean a company hadn’t reported that particular data for Q2’18 as of this Wednesday.
The first couple columns of these tables show each GDXJ component’s symbol and weighting within this ETF as of this week. While most of these stocks trade on US exchanges, some symbols are listings from companies’ primary foreign stock exchanges. That’s followed by each gold miner’s Q2’18 production in ounces, which is mostly in pure-gold terms. That excludes byproduct metals often present in gold ore.
Those are usually silver and base metals like copper, which are valuable. They are sold to offset some of the considerable costs of gold mining, lowering per-ounce costs and thus raising overall profitability. In cases where companies didn’t separate out gold and lumped all production into gold-equivalent ounces, those GEOs are included instead. Then production’s absolute year-over-year change from Q2’17 is shown.
Next comes gold miners’ most-important fundamental data for investors, cash costs and all-in sustaining costs per ounce mined. The latter directly drives profitability which ultimately determines stock prices. These key costs are also followed by YoY changes. Last but not least the annual changes are shown in operating cash flows generated, hard GAAP earnings, sales, and cash on hand with a couple exceptions.
Percentage changes aren’t relevant or meaningful if data shifted from positive to negative or vice versa, or if derived from two negative numbers. So in those cases I included raw underlying data rather than weird or misleading percentage changes. This whole dataset together offers a fantastic high-level read on how the mid-tier gold miners are faring fundamentally as an industry. August’s plunge wasn’t righteous.
It was great to see GDXJ’s top 34 components almost unchanged from Q2’17, with only two new stocks in those ranks. My previous essays on GDXJ components’ quarterly results had been a sea of light blue since 2016. But one of the new components in Q2’18 is inexplicably the giant largely-African miner AngloGold Ashanti. It produced an enormous 805k ounces of gold last quarter, the largest in GDXJ by far.
Remember that major-gold-miner threshold has long been 1m+ ounces per year. AU’s production is annualizing to over 3x that, making this company the world’s 3rd-largest gold miner last quarter. Why on earth would managers running a “Junior Gold Miners ETF” even consider AngloGold Ashanti? It is as far from junior-dom as gold miners get. Having so many of the same stocks in both GDXJ and GDX is a big problem.
Such massive overlap between these two ETFs is a huge lost opportunity for VanEck. It owns and manages GDX, GDXJ, and even the MVIS indexing company that decides exactly which gold stocks are included in each. With one company in total control, there’s no need for any overlap in the underlying companies of what should be two very-different gold-stock ETFs. Inclusion ought to be mutually-exclusive.
VanEck could greatly increase the utility of its gold-stock ETFs and thus their ultimate success by starting with one big combined list of the world’s better gold miners. Then it could take the top 20 or 25 in terms of annual gold production and assign them to GDX. Based on Q2’18 production, that would run down near 127k or 92k ounces per quarter. Then the next-largest 30 or 40 gold miners could be assigned to GDXJ.
Getting smaller gold miners back into GDXJ would be a huge boon for the junior-gold-mining industry. Most investors naturally assume this “Junior Gold Miners ETF” owns junior gold miners, which is where they are trying to allocate their capital. But since most of GDXJ’s funds are instead diverted into much-larger mid-tiers and even some majors, the juniors are effectively being starved of capital intended for them.
That’s one of the big reasons smaller gold miners’ stock prices are so darned low. They aren’t getting enough capital inflows from gold-stock-ETF investing. So their share prices aren’t bid higher. They rely on issuing shares to finance their exploration projects and mine builds. But when their stock prices are down in the dumps, that is heavily dilutive. So GDXJ is strangling the very industry its investors want to own!
Back to these mid-tier gold miners’ Q2’18 results, production is the best place to start since that is the lifeblood of the entire gold-mining industry. These top 34 GDXJ gold miners that had specifically reported Q2 production as of the middle of this week produced 4467k ounces. That surged a massive 24.7% YoY, implying these miners are thriving. But that’s almost all driven by that huge 805k-ounce boost from AU’s inclusion.
Without AngloGold Ashanti which wasn’t there in Q2’17, the rest of the top 34 GDXJ gold miners saw their total production climb 2.2% YoY to 3662k ounces. That’s a little behind the 3.0% annual growth in overall global mine production in Q2’18 according to the World Gold Council’s latest Gold Demand Trends report. But these mid-tier miners are still faring far better than the majors that dominate that other GDX ETF.
As discussed last week in my essay on the GDX gold miners’ Q2’18 results, their production adjusted for quarterly data availability plunged a sharp 7.7% YoY! With big economically-viable gold deposits getting increasingly hard to discover, the majors are really struggling to replace depleting production. So much of the growth is coming from the mid-tiers and juniors, which will help their stock prices outperform the majors.
Starting from far-lower production bases, most of the smaller gold miners can ramp production by adding single new mines. These are often modest in scale and cost compared to the giant mines the majors need to target. Since growing production greatly boosts profits, investment capital will increasingly flow into mid-tier gold miners in coming years. So GDXJ’s upside should well outpace the major-dominated GDX’s.
For all GDXJ’s faults, it does still offer investors exposure to much-smaller gold miners. The average quarterly production of all the top 34 GDXJ miners reporting it in Q2 was 144.1k ounces. That is 44% smaller than the 258.3k averaged by the top 34 GDX miners last quarter. And again AU’s crazy inclusion really skews this. Ex-AU, the GDXJ average falls to 122.1k. That annualizes to 488k, solidly in the mid-tier realm.
With today’s set of top-34 GDXJ gold miners achieving relatively-good production growth, their costs per ounce should’ve declined proportionally. Higher production yields more gold to spread mining’s big fixed costs across. And lower per-ounce costs naturally lead to higher profits. So production growth is highly sought after by gold-stock investors, with companies able to achieve it commanding premium prices.
There are two major ways to measure gold-mining costs, classic cash costs per ounce and the superior all-in sustaining costs per ounce. Both are useful metrics. Cash costs are the acid test of gold-miner survivability in lower-gold-price environments, revealing the worst-case gold levels necessary to keep the mines running. All-in sustaining costs show where gold needs to trade to maintain current mining tempos indefinitely.
Cash costs naturally encompass all cash expenses necessary to produce each ounce of gold, including all direct production costs, mine-level administration, smelting, refining, transport, regulatory, royalty, and tax expenses. In Q2’18, these top 34 GDXJ-component gold miners that reported cash costs averaged $631 per ounce. That was actually up a slight 0.5% YoY, contrary to what you’d expect with higher production.
The majority of reporting gold miners saw cash costs rise significantly last quarter. There were plenty of challenges at various individual mines, including unexpected downtimes and lower ore grades. Both of those yield fewer ounces to bear the burden of gold mining’s big fixed costs. General price inflation is also mounting thanks to the trillions of dollars of money central banks conjured out of thin air over the past decade.
$631 per ounce is still very healthy, not much worse than the GDX majors’ average of $610 last quarter. That means these elite mid-tier gold miners could temporarily weather gold prices way down into the mid-$600s and still keep their mines running! At worst in mid-August, gold plunged to $1174 on close driven by epic all-time-record gold-futures short selling. Gold had fallen 4.1% month-to-date by that point, a big loss.
But the GDXJ gold miners suffered disproportionally, with this ETF’s price plummeting 15.5% MTD in sympathy with gold! That 3.8x downside leverage was excessive, the result of irrational herd sentiment. GDXJ’s share price was crushed to a brutal 2.4-year low, implying these miners are in fundamental peril. But with gold still trading a whopping 86% above their cash costs even at recent lows, that clearly wasn’t the case.
Way more important than cash costs are the far-superior all-in sustaining costs. They were introduced by the World Gold Council in June 2013 to give investors a much-better understanding of what it really costs to maintain gold mines as ongoing concerns. AISCs include all direct cash costs, but then add on everything else that is necessary to maintain and replenish operations at current gold-production levels.
These additional expenses include exploration for new gold to mine to replace depleting deposits, mine-development and construction expenses, remediation, and mine reclamation. They also include the corporate-level administration expenses necessary to oversee gold mines. All-in sustaining costs are the most-important gold-mining cost metric by far for investors, revealing gold miners’ true operating profitability.
These top 34 GDXJ gold miners reporting AISCs saw them average $886 per ounce in Q2’18. That was also up a modest 0.9% YoY, so costs didn’t decline proportionally with rising production. Still $886 is an excellent level compared to prevailing gold prices, and competitive with the GDX majors which averaged $856 last quarter. $886 is right in line with the past four quarters’ trend of $879, $877, $855, and $923 too.
The fundamental implications of this are very bullish, proving that this month’s gold-stock capitulation was purely an overdone herd-sentiment thing. Gold averaged $1306 in Q2’18, up 3.9% YoY. That means the top GDXJ gold miners were earning average profits just under $420 per ounce. Thanks to AISCs mostly holding the line and modestly-higher gold prices, those earnings rose a solid 10.7% YoY from $379 in Q2’17.
With gold mining considerably more profitable last quarter than a year earlier, you’d think the gold-stock prices would’ve been proportionally higher. Yet GDXJ’s average price in Q2 still slipped 1.1% lower YoY, which makes no sense fundamentally. And even if August’s capitulation-grade $1175 gold was able to magically persist as if those crazy-record gold-futures shorts were never covered, gold mining is still very profitable.
At Q2’18’s average AISCs which are again right in line with recent years’ levels, $1175 gold would still yield hefty $289-per-ounce profits for the mid-tier gold miners. Those don’t justify deep multi-year lows in gold-stock prices. And these profits will balloon dramatically as gold inevitably mean reverts much higher. Extreme gold-futures short-covering buying is imminent, and will be proportional to August’s record shorting.
The impact of higher gold prices on mid-tier-gold-miner profitability is easy to model. Assuming flat all-in sustaining costs at Q2’s $886 per ounce, 10%, 20%, and 30% gold rallies from mid-August’s lows would lead to collective gold-mining profits surging 40%, 81%, and 122%! And another 30% gold upleg isn’t a stretch at all. In the first half of 2016 alone after the first stock-market corrections in years, gold soared 29.9%.
GDXJ skyrocketed 202.5% higher in 7.0 months in largely that same span! Gold-mining profits and thus gold-stock prices surge dramatically when gold is powering higher. Years of neglect from investors have forced the gold miners to get lean and efficient, which will really amplify their fundamental upside during the next major gold upleg. The investors and speculators who buy in early and cheap could earn fortunes.
As long as the gold miners can produce gold at all-in sustaining costs way below prevailing gold prices, they will generate big profits for investors. Eventually their stock-price levels have to reflect their true underlying profitability. With $1175+ gold and $886 AISCs, the mid-tier gold miners’ stocks must mean revert way higher. Their extreme low levels today are fundamentally absurd, they can’t and won’t last for long.
With GDXJ’s radical composition changes finally settling down, the rest of its top 34 components’ core fundamentals are finally comparable year-over-year again. It’s nice to have that massive rejiggering in GDXJ’s underlying index past us. These elite mid-tier miners’ total revenues climbed 9.3% YoY to $5558m, well outpacing gold’s 3.9% YoY gain. That 2.2% higher production excluding AngloGold Ashanti also helped.
Those sales helped generate cash flows from operations of $1384m. While 5.1% lower YoY, that is still massively positive for this small contrarian sector. As long as gold mines are yielding far more cash than they cost to run, the mid-tier gold miners remain fundamentally healthy. Positive cash flows build capital necessary to expand operations, and helped drive these miners’ cash war chests up 9.3% YoY to $6784m in Q2.
But their hard GAAP profits as reported to regulators collectively looked terrible, collapsing from a strong $751m in Q2’17 to a big $146m loss in Q2’18! Is that the fundamental monkey wrench justifying these wretched stock-price levels? Not at all, as big unusual items flushed through bottom lines can make profits comparisons very misleading. There were two huge non-recurring items that mostly drove this big swing.
A year ago in Q2’17, elite mid-tier miner IAMGOLD reported a colossal $524m one-time non-cash gain from the reversal of mine-impairment charges. That accounted for nearly 70% of the top 34 GDXJ gold miners’ overall profits that quarter! Without that unusual item, their total Q2’17 profits were just $227m. Another unusual item heavily skewed last quarter’s latest profits, coming from mid-tier gold miner New Gold.
Gold mining is very challenging and risky, with many problems not evident until mining is well underway. New Gold’s serious troubles illustrate why diversifying capital across multiple gold miners is essential for all contrarian investors. NGD’s young Rainy River gold mine isn’t living up to potential due to variability in ore grades and processing. So in late July NGD slashed Rainy River’s 2018 production outlook by a huge 30%!
Not only did NGD’s stock crater, but this Rainy River situation is so bad New Gold recorded a $282m impairment charge on that mine! Such unusual non-recurring items flow directly into profits. Without that New Gold disaster, the top 34 GDJX gold miners’ total GAAP earnings in Q2’18 were $136m. While still down a major 40.2% YoY, that $91m drop is a fraction the size of the $897m including those unusual items.
The mid-tier gold miners’ recently-reported solid-to-strong Q2’18 results prove that their brutal plunge in August wasn’t fundamentally righteous. Like all capitulations fueled by cascading stop-loss selling, it was merely a sentimental and technical thing. As gold surges on the record futures short-covering buying that is imminent, the battered gold stocks will mean revert dramatically higher. And the mid-tiers will lead the way.
While GDXJ should certainly no longer be advertised as a “Junior Gold Miners ETF”, it offers exposure to some of the best mid-tier gold miners on the planet. It’s really growing on me, I like this new GDXJ way better than GDX. That being said, GDXJ is still burdened by overdiversification and way too many gold miners that shouldn’t be in there. They are either too large, are saddled with inferior fundamentals, or both.
So the best way to play the gold miners’ coming massive mean-reversion bull is in individual stocks with superior fundamentals. Their gains will ultimately trounce the major ETFs like GDXJ and GDX. There’s no doubt carefully-handpicked portfolios of elite gold and silver miners will generate much-greater wealth creation. GDXJ’s component list is a great starting point, but pruning it way down offers far-bigger upside.
At Zeal we’ve literally spent tens of thousands of hours researching individual gold stocks and markets, so we can better decide what to trade and when. As of the end of Q2, this has resulted in 1012 stock trades recommended in real-time to our newsletter subscribers since 2001. Fighting the crowd to buy low and sell high is very profitable, as all these trades averaged stellar annualized realized gains of +19.3%!
The key to this success is staying informed and being contrarian. That means buying low when others are scared, before undervalued gold stocks soar much higher. An easy way to keep abreast is through our acclaimed weekly and monthly newsletters. They draw on my vast experience, knowledge, wisdom, and ongoing research to explain what’s going on in the markets, why, and how to trade them with specific stocks. Subscribe today and take advantage of our 20%-off summer-doldrums sale! We’re redeploying stopped capital in new gold-stock trades at extreme fire-sale prices.
The bottom line is the mid-tier gold miners reported solid-to-strong fundamentals in their recent Q2’18 results. They were able to modestly grow their production despite the majors’ falling rather sharply. More gold mined combined with essentially-flat costs and higher average gold prices fueled solid profits growth. The mid-tiers’ production costs were far below prevailing gold prices even at mid-August’s deep capitulation lows.
That gold plunge that dragged gold stocks sharply lower was driven by crazy-all-time-record gold-futures short selling. Those extreme positions must soon be closed with proportional buying, which will catapult gold sharply higher. With gold-stock prices trading at such fundamentally-absurd levels today, they ought to soar and really leverage gold’s coming mean-reversion gains. Their post-capitulation upside is huge.
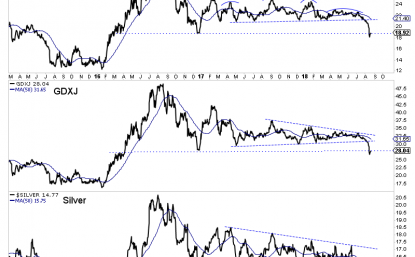
Last week GDX and GDXJ were down almost 12% at their lows on Thursday. Since then, they’ve recovered but only a tiny fraction of recent losses.
The crash did result in the miners reaching an extreme oversold condition while trading around long-term support at their December 2016 lows. It was the perfect setup for shorts to cover. That combination often results in at least a relief rally.
While a rally is underway, where it goes from here remains to be seen.
One thing to keep in mind, the recent decline was the result of a technical breakdown that followed months and months of consolidation. It’s extremely unlikely to immediately reverse course.
With that said, let’s keep in mind the measured downside targets.
For GDX, the downside target is $16.50-$17.00. For GDXJ, it’s $23-$24 and for Silver it is $12.70-$13.10.
On the sentiment front we should note that Gold’s net speculative position reached 1.5% of open interest. That is the second lowest reading in the past 17 years. Does that mean this is December 2015 or 2001 for Gold?
Do note that sentiment was at a similar level twice in 2013 and Gold trended lower after a rebound. Moreover, look at what happened in the 1980s and 1990s.
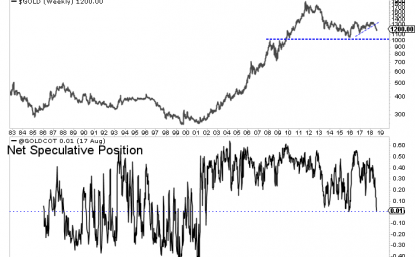
With the net speculative position already down to 1.5%, it figures to go negative if Gold is going to test its low at $1040/oz or even $1000/oz. If you think sentiment cannot get worse, think again.
Ultimately, its not sentiment or technicals that will decide a major bottom but fundamentals. After studying decades of history as well as the current market environment, we became convinced that precious metals will not begin a bull market until the Federal Reserve is done hiking rates.
Consider the following.
Over the past 60 years, in 10 of the last 12 rate hike cycles gold stocks boast an average gain of 185% with a minimum gain of 54%. The advance began on average one month and a median of two months after the Fed Funds rate peaked.
The precious metals sector is currently extremely oversold and a relief rally is underway. It should last at least a few more weeks and maybe a few months. However, the primary trend is down and there are downside targets that are even lower. Our plan is to let the rally run its course and when the time is right, go short again.
The major gold miners’ stocks plummeted in brutal cascading selling this week as stops were run. That shattered strong multi-year support, devastating sentiment among the handful of contrarians remaining in this forsaken sector. With fear and despair extreme, it’s critical to take a deep breath and get grounded in the gold miners’ just-reported Q2’18 fundamentals. They reveal if this surprise anomalous plunge was justified.
Four times a year publicly-traded companies release treasure troves of valuable information in the form of quarterly reports. Companies trading in the States are required to file 10-Qs with the US Securities and Exchange Commission by 45 calendar days after quarter-ends. Canadian companies have similar requirements. In other countries with half-year reporting, many companies still partially report quarterly.
The definitive list of major gold-mining stocks to analyze comes from the world’s most-popular gold-stock investment vehicle, the GDX VanEck Vectors Gold Miners ETF. Its composition and performance are similar to the benchmark HUI gold-stock index. GDX utterly dominates this sector, with no meaningful competition. This week GDX’s net assets are 33.4x larger than the next-biggest 1x-long major-gold-miners ETF!
GDX is effectively the gold-mining industry’s blue-chip index, including the biggest and best publicly-traded gold miners from around the globe. GDX inclusion is not only prestigious, but grants gold miners better access to the vast pools of stock-market capital. As ETF investing continues to rise, capital inflows into leading sector ETFs require their managers to buy more shares in underlying component companies.
GDX’s component list this week ran 49 “Gold Miners” long. While the great majority of GDX stocks do fit that bill, it also contains gold-royalty companies and major silver miners. All the world’s big primary gold miners publicly traded in major markets are included. Every quarter I look into the latest operating and financial results of the top 34 GDX companies, which is just an arbitrary number fitting neatly into these tables.
That’s a commanding sample, as GDX’s 34 largest components now account for a whopping 91.7% of its total weighting! These elite miners that reported Q2’18 results produced 241.0 metric tons of gold, which accounts for fully 28.8% of last quarter’s total global gold production. That ran 835.5t per the recently-released Q2’18 Gold Demand Trends report from the World Gold Council. I’ll discuss production more below.
Most of these top 34 GDX gold miners trade in the US and Canada where comprehensive quarterly reporting is required by regulators. But some trade in Australia and the UK, where companies just need to report in half-year increments. Fortunately those gold miners do still tend to issue production reports without financial statements each quarter. There are still wide variations in reporting styles and data offered.
Every quarter I wade through a ton of data from these elite gold miners’ latest results and dump it into a big spreadsheet for analysis. The highlights make it into these tables. Blank fields mean a company had not reported that data for Q2’18 as of this Wednesday. Looking at the major gold miners’ latest results in aggregate offers valuable insights on this industry’s current fundamental health unrivaled anywhere else.
The first couple columns of these tables show each GDX component’s symbol and weighting within this ETF as of this week. While most of these stocks trade on US exchanges, some symbols are listings from companies’ primary foreign stock exchanges. That’s followed by each gold miner’s Q2’18 production in ounces, which is mostly in pure-gold terms. That excludes byproduct metals often present in gold ore.
Those are usually silver and base metals like copper, which are valuable. They are sold to offset some of the considerable costs of gold mining, lowering per-ounce costs and thus raising overall profitability. In cases where companies didn’t separate out gold and lumped all production into gold-equivalent ounces, those GEOs are included instead. Then production’s absolute year-over-year change from Q2’17 is shown.
Next comes gold miners’ most-important fundamental data for investors, cash costs and all-in sustaining costs per ounce mined. The latter directly drives profitability which ultimately determines stock prices. These key costs are also followed by YoY changes. Last but not least the annual changes are shown in operating cash flows generated, hard GAAP earnings, sales, and cash on hand with a couple exceptions.
Percentage changes aren’t relevant or meaningful if data shifted from positive to negative or vice versa, or if derived from two negative numbers. So in those cases I included raw underlying data rather than weird or misleading percentage changes. This whole dataset together offers a fantastic high-level read on how the major gold miners are faring fundamentally as an industry. Was this week’s plummeting righteous?
This ongoing quarterly post-earnings-season project to better understand how the gold-mining industry is actually faring fundamentally is tedious and time-consuming. The best insights don’t emerge until all the research is complete, as the big picture is more illuminating than individual companies’ results. As I was doing much of this work this week, the plummeting gold-stock prices cast a dark psychological pall over everything.
I always start at the top of GDX’s component list and gradually work my way down, examining the latest quarterly filings from each company. Early on I was shocked by the sharp annual production declines at the world’s biggest gold miners! Newmont Mining and Barrick Gold have run neck-and-neck as the top gold miners for long decades now. Compared to most other gold miners, their resources may as well be unlimited.
They have diversified portfolios of gold mines across continents and many countries, and deep pipelines of exploration projects and new-mine builds. NEM and ABX pour vast amounts of capital into maintaining their gold production as existing mines are depleted. The major gold miners hate reporting declines in production, as investors punish stocks for it with sizable selling. It is seen as signaling deteriorating health.
So gold miners suffering production drops often intentionally obscure it by omitting normal year-over-year comparisons from their press releases announcing quarterly results. They don’t present the tables with the current quarter next to the comparable prior-year quarter like they do when production is growing. It feels like a game of misdirection, emphasizing other metrics while forcing investors to dig deeper for that data.
The bigger the gold miners, the more opportunities they have to make up production shortfalls at some of their mines from other mines in their portfolios. So it was stunning to see NEM report its Q2’18 production plunging 14.1% YoY. And ABX’s was much worse, plummeting a catastrophic 25.5% YoY! That ominous trend infected other top gold miners too. Goldcorp mined 10.1% less gold in Q2’18 than it did a year earlier.
Kinross Gold’s production fell 13.4% YoY. Together these 4 elite major gold miners account for almost a quarter of GDX’s total weighting! How on earth can their total production plunge 17.3% from 4.1m ounces in Q2’17 to 3.4m ounces in Q2’18? That was actually contrary to the gold-mining industry as a whole. Again according to that latest WGC GDT, overall world mine production grew 3.0% YoY from Q2’17 to Q2’18.
The excuses given are nothing new to gold-mining investors, primarily lower-grade ore processed along with geological and geopolitical challenges at various individual mines. Wresting gold from the bowels of the earth in remote locations is never easy, as all the low-hanging fruit has long since been mined. With even the biggest and the best gold miners failing to maintain production, peak-gold theories are bolstered.
Incredibly as a whole, these top 34 GDX gold miners responsible for well over a quarter of the total world gold mined in Q2 saw their overall production plummet 20.9% YoY to 7.7m ounces! That’s skewed though, as two major South African gold miners had reported their Q2’17 production a year ago this week but had yet to disclose Q2’18 production as of Wednesday’s data cutoff for this essay. They chose not to do it this year.
AngloGold Ashanti and Gold Fields report in half-year increments, so they have no obligation to separate out quarters. I wonder if the reason they did last year but not this year is to mask slowing production. If their H1’18 results are divided by two, they would’ve added another 789k and 497k ounces. But that still leaves GDX’s top 34 miners with collective gold production down a sharp 7.7% YoY, way worse than the industry.
While Q2’18’s underperformance by the biggest gold miners dominating GDX and the HUI was striking, it is nothing new. That’s why I’ve long recommended investors avoid many of the largest gold miners. Mid-tier miners with growing production as they bring new mines online and much-smaller market caps have far-greater upside potential during gold uplegs. They are bucking the increasingly-evident peak-gold predicament.
Gold deposits economically viable to mine are very rare in the natural world, and getting much harder to find after centuries of exploration. It is growing ever more expensive to explore for gold, in places that are getting less hospitable with every passing year. Even after new deposits are discovered, jumping through all the Draconian regulatory hoops necessary to secure permitting for construction can take another decade.
Building the gold mines takes additional years and hundreds of millions if not billions of dollars each! This industry normally has enough capital to invest in replenishing depleting production. But ever since 2013 when gold plunged on extreme central-bank machinations, the gold miners have been heavily starved of necessary capital. So their new-production pipeline has inexorably withered away to a shadow of its former self.
As long as gold stocks remain deeply out of favor among investors because gold prices are so low, this supply deterioration will continue if not accelerate. But even if gold doubled or tripled today and stayed high for years, it would still take well over a decade for world mined supply to adjust. Some top mining CEOs and analysts believe we are seeing peak gold, that production will keep declining regardless of gold prices.
Peak gold is likely bearish for the largest gold miners that drive GDX and the HUI. Capital inflows from investors will wane along with their production. But lower gold mined supply on balance going forward is wildly bullish for the mid-tier and junior gold miners growing their production! The resulting higher gold prices will catapult their profits and thus stock prices higher, attracting in investors fleeing the struggling majors.
The only way to reap these massive gains is directly investing in the best individual gold miners. Their fundamentals are far superior to their sector as a whole. While buying GDX is easy, the lion’s share of that capital is funneled into the major gold miners with slowing production. Their underperformance will dilute away any outperformance among mid-tier miners in this ETF, leading to mediocre overall gains.
One key reason slowing production is bad for gold miners is it usually leads to proportionally-higher costs. Again in Q2’18 NEM’s production fell 14.1% YoY, so its all-in sustaining costs rose a symmetrical 15.8% YoY. ABX’s colossal 25.5% production drop fueled 20.6% higher AISCs. And KGC’s 13.4% lower gold production last quarter forced its AISCs 11.9% higher. Higher mining costs naturally drive profits lower.
With major gold miners’ production falling sharply, their costs of mining should be proportionally higher. Gold-mining costs are largely fixed during mine-planning stages, when engineers and geologists decide which ore to mine, how to dig to it, and how to process it. The actual mining generally requires the same levels of infrastructure, equipment, and employees quarter after quarter. Little changes in throughput terms.
The mills processing the gold-bearing ore and inevitable accompanying waste rock have hard limits to tonnages they can chew through. When richer ore is processed, more ounces of gold are produced to spread the big fixed costs across. But when mine managers have to dig through lower-grade ore, either on the way to higher-grade stuff later or in depleting mines, fewer ounces of gold must bear the full cost burden.
So as I started digging through the top 34 GDX components’ Q2 results, I expected to see the major gold miners’ collective AISCs rise due to lower production. That’s certainly bearish fundamentally, portending lower profits that could justify some of the brutal gold-stock selling this summer. But as a whole, rather amazingly these elite gold miners held the line on costs! The top majors’ rises were offset by other miners.
There are two major ways to measure gold-mining costs, classic cash costs per ounce and the superior all-in sustaining costs per ounce. Both are useful metrics. Cash costs are the acid test of gold-miner survivability in lower-gold-price environments, revealing the worst-case gold levels necessary to keep the mines running. All-in sustaining costs show where gold needs to trade to maintain current mining tempos indefinitely.
Cash costs naturally encompass all cash expenses necessary to produce each ounce of gold, including all direct production costs, mine-level administration, smelting, refining, transport, regulatory, royalty, and tax expenses. In Q2’18, these top 34 GDX-component gold miners that reported cash costs averaged $610 per ounce. That was merely up 0.8% YoY from Q2’17, rather remarkable considering the lower production!
The capitulation-grade gold-stock selling this week was horrendous, with GDX plummeting 9.5% in just 3 trading days ending Wednesday. This leading gold-stock ETF plunged to $18.60 per share, shattering its major $21 support that had held strong through five major challenges since the dawn of 2017. Down a dreadful 20.0% year-to-date, GDX was trading at a miserable 2.5-year low on cascading stop-loss selling.
But with cash costs averaging $610 per ounce, the major gold miners are certainly in no fundamental peril! While gold somehow managed to plunge 2.9% in those same few trading days despite crazy-all-time-record spec gold-futures shorts, it was still near $1176. The gold stocks face no existential threat as long as gold prices remain far above the cash costs of mining it. There’s nothing to fear fundamentally this week.
Way more important than cash costs are the far-superior all-in sustaining costs. They were introduced by the World Gold Council in June 2013 to give investors a much-better understanding of what it really costs to maintain gold mines as ongoing concerns. AISCs include all direct cash costs, but then add on everything else that is necessary to maintain and replenish operations at current gold-production levels.
These additional expenses include exploration for new gold to mine to replace depleting deposits, mine-development and construction expenses, remediation, and mine reclamation. They also include the corporate-level administration expenses necessary to oversee gold mines. All-in sustaining costs are the most-important gold-mining cost metric by far for investors, revealing gold miners’ true operating profitability.
With the top 34 GDX gold miners’ Q2’18 production down 20.9% YoY or even 7.7% if that implied South African production is added in, I would’ve bet their AISCs would’ve surged proportionally. Yet incredibly they actually slipped 1.3% YoY to just $856 per ounce! This was no anomaly either, as the top 34 GDX miners’ AISCs have averaged $867, $868, $858, and $884 over the past four quarters. Q2’18’s were in trend.
The fundamental implications of this are very bullish, proving that this week’s gold-stock capitulation was purely an overdone herd-sentiment thing. Gold averaged $1306 in Q2’18, up 3.9% YoY. That means the elite major gold miners were earning average profits just under $450 per ounce. Thanks to the slightly-lower AISCs and modestly-higher gold price, those earnings rose 15.2% YoY from the $390 per ounce in Q2’17.
With gold mining a heck of a lot more profitable last quarter than a year earlier, you’d think the gold-stock prices would’ve been proportionally higher. Yet GDX’s average price last quarter was 1.5% lower YoY. That makes zero sense fundamentally. And even if this week’s capitulation-grade $1175 gold was able to magically persist as if those crazy-record gold-futures shorts were never covered, gold mining is still very profitable.
At Q2’18’s average AISCs which are again exactly in line with recent years’ levels, $1175 gold would still yield hefty $319-per-ounce profits for the major gold miners. That number is quite provocative. This Wednesday the flagship HUI gold-stock index plunged to 143.3 on that cascading-stop-loss selling, a deep 2.5-year low. But the first time the HUI ever hit this week’s levels was way back in May 2002, 16.2 years ago!
Then gold was trading near $326, which was its best levels of its young secular bull at that point. Think about this absurd fundamental disconnect. Today’s gold-stock prices were first seen way back when the entire gold price was about the same level as today’s absolute profitability alone! That is just ridiculous, highlighting the extreme undervaluation in gold stocks. Their crazy-low stock prices are an extreme anomaly.
Should a sector running hefty 27% profit margins even at $1175 gold be trading this week at price levels first seen when gold was 72% lower? Hell no! Similar past capitulation-like anomalies have led to huge subsequent mean-reversion-rebound gains. During 2008’s stock panic, the HUI fell as low as 151.6 in response to $720 gold. Those were higher gold-stock prices than this week despite gold being 38% lower!
Just like this week, back in October 2008 fear was extreme as investors fled gold stocks. They foolishly assumed extreme gold and gold-stock declines could persist indefinitely rather than quickly burning themselves out. So the traders who couldn’t get past their own herd-driven emotions sold at the bottom. They unfortunately missed the HUI more than quadrupling over the next 2.9 years with a major 319.0% bull run!
As long as the gold miners can produce gold at all-in sustaining costs way below prevailing gold prices, they will generate big profits for investors. Eventually their stock-price levels have to reflect their true underlying profitability. With $1175ish gold and $856 AISCs, the gold miners’ stock prices must rebound radically higher. Their extreme low levels today are fundamentally absurd, they can’t and won’t last for long.
The rest of the top 34 GDX gold miners’ core fundamentals in Q2’18 reflected their lower year-over-year production. Their overall cash flows generated from operations fell 18.3% YoY to $2747m. That’s not out of line considering the 7.2% decrease in sales to $9993m due to less gold mined. Interestingly in addition to mining 20.9% less gold YoY excluding those non-reporting South African miners, silver production fell more.
GDX has plenty of major silver miners among its ranks, as the pool of major gold miners is fairly small. Silver is much less profitable to mine than gold at current depressed price levels, so traditional big silver miners are increasingly investing in diversifying into gold mining. The top 34 GDX components’ overall silver production plummeted 32.4% YoY to 29.1m ounces in Q2’18! That helped sales fall despite higher gold prices.
These top 34 GDX gold miners’ total GAAP accounting profits reported to regulators looked like a disaster in Q2’18. They cratered 66.2% YoY to $802m! But that’s very misleading, as one-off charges and gains flowing through to miners’ bottom lines can greatly distort headline profitability. There were a couple massive non-recurring gains in Q2’17 results that I discussed a year ago that artificially boosted those profits.
Back then Barrick Gold reported an enormous $880m gain selling half and quarter interests in a couple major gold projects in Argentina and Chile. And IAMGOLD reversed impairment charges to report a huge $524m non-cash gain. Removing just these two unusual items alone from overall Q2’17 profits recasts Q2’18’s decline as a far-milder 17.1% YoY. That’s about what you’d expect with sales sliding 7.2% in that span.
While not included in this table, the average trailing-twelve-month price-to-earnings ratios of these major gold miners declined 2.2% YoY to 38.0x. And that number is skewed way high by a few outliers, as there are plenty of top 34 GDX gold miners trading at cheap TTM P/Es in the low double digits or even single digits this week. The gold miners’ earnings are fine, and don’t remotely justify this week’s capitulation-like plunge.
Another fundamental metric for gold miners’ health is their cash balances. Despite the lower production and sales in Q2’18, these top 34 GDX components exited it with $12.4b of cash on their balance sheets. That provides a huge buffer to weather lower gold, and gives them enough capital firepower to expand existing mines and build or buy new ones to help offset declining production. That was only down 9.6% YoY.
If your view on gold-mining stocks is solely based on their price levels, you’re probably convinced they are doomed after this week’s plunge. Everyone freaked out as they got sucked into anomalous gold selling which triggered all kinds of involuntary stop-loss selling. This definitely wasn’t the first time this sector was hammered by fearful herd psychology, and certainly won’t be the last. But such extreme anomalies soon reverse.
While sentiment is devastated, the major gold miners’ underlying fundamentals remain strong. They are struggling with shrinking production overall, but their mining costs still remain far below prevailing gold prices still driving strong profitability. While sales reflect fewer ounces mined, they are still generating big operating cash flows and earnings. Today’s gold-stock price levels are ludicrous relative to their fundamentals!
So a big mean-reversion rebound higher is inevitable and imminent. While traders can play that in GDX, that is mostly a bet on the largest gold miners with slowing production. The best gains by far will be won in smaller mid-tier and junior gold miners with superior fundamentals. A carefully-handpicked portfolio of elite gold and silver miners will generate much-greater wealth creation than ETFs dominated by underperformers.
At Zeal we’ve literally spent tens of thousands of hours researching individual gold stocks and markets, so we can better decide what to trade and when. As of the end of Q2, this has resulted in 1012 stock trades recommended in real-time to our newsletter subscribers since 2001. Fighting the crowd to buy low and sell high is very profitable, as all these trades averaged stellar annualized realized gains of +19.3%!
The key to this success is staying informed and being contrarian. That means buying low when others are scared, before undervalued gold stocks soar much higher. An easy way to keep abreast is through our acclaimed weekly and monthly newsletters. They draw on my vast experience, knowledge, wisdom, and ongoing research to explain what’s going on in the markets, why, and how to trade them with specific stocks. Subscribe today and take advantage of our 20%-off summer-doldrums sale! We’re redeploying stopped capital in new gold-stock trades at extreme fire-sale prices.
The bottom line is the major gold miners’ fundamentals are quite strong based on their recently-reported Q2’18 results. While production declined sharply, these miners still held the line on all-in sustaining costs. That fueled fat operating profits and strong cash flows. These will only grow as gold rebounds on record futures short covering. Many miners are forecasting improving H2’18 production as well on higher-grade ore.
Yet gold stocks are priced today as if they are doomed to spiral lower forever. That’s truly fundamentally absurd given their strong profits even at this week’s battered gold levels. Traders need to look through this frightened herd sentiment to understand these anomalous gold-stock prices soon have to mean revert radically higher. It’s hard staying long while everyone else is scared, but that’s when big gains are won.
Titan Mining Corporation (TSX: TI) is a Canadian-based mining company which produces zinc concentrate at its 100%-owned Empire State Mine (“ESM”) in St. Lawrence County, New York State. ESM includes a suite of seven historic zinc mines. One of these – ESM #4 mine – has recently restarted production and, with both near-mine and regional exploration activities underway, this historic mining district is being revived. Backed by strong leadership and local community support, Titan Mining is focused on discovering and developing additional high-grade, low-cost mineral resources, increasing production and extending the mine life at ESM.
Built for Growth – Leveraging Excess Capacity to Drive Cash Flow
St. Lawrence County has a rich history of mining which spans 100 years. Titan Mining controls over 80,000 acres of mineral rights in the district and has established mining and processing infrastructure. Mill commissioning was completed and the first ore hoisted at ESM in late January 2018. Mill throughput is expected to ramp up to a rate of 1,800 tons per day (“tpd”) by the first quarter of 2019. The capacity of the shaft and mill are both significantly higher at 3,800 tpd and 5,000 tpd, respectively.
Backed by a positive long-term outlook for zinc prices, Titan Mining is moving forward with the revival of the mining district. Strong leadership and local community support are two key factors in this success.
Leadership at Titan Mining
Chair and CEO Richard Warke has spent over thirty years in the global resource sector, with a focus on mining. An experienced and well-respected leader in the resource industry, Richard Warke has a successful, long-term track record of creating shareholder value at the Augusta Group of Companies – this includes the merger of Newcastle Gold into Equinox Gold (~C$200M deal in 2017) and the sale of Arizona Mining (sold for ~C$2.1B in 2018), Augusta Resource Corporation (sold for ~C$666M in 2014) and Ventana Gold Corp. (sold for ~C$1.6B in 2011).
The rest of the management team at Titan Mining is comprised of executives with an extensive track record in capital markets and responsible exploration, development and operations.
Directors at Titan Mining include George Pataki, the former, three-term Governor of New York, and Donald Taylor and Robert Wares, award-winning explorers with a combined 65 years of experience in mineral exploration and research. Donald Taylor received the Prospectors and Developers Association of Canada’s (“PDAC”) 2018 Thayer Lindsley Award for the 2014 discovery of the Taylor lead-zinc-silver deposit in Arizona. Robert Wares is the co-winner of the PDAC’s 2007 “Prospector of the Year Award” for the discovery of the Canadian Malartic gold deposit in Quebec.
Local Community Support
The company is well aware that the discovery, development and production of mineral resources requires broad community support and is committed to partnering with the local community. To promote local growth, the company purchases goods and services from nearby businesses and has developed a training program to provide prospective local workers with the skills needed to become qualified underground miners. Program graduates become part of the workforce of over 200 people, of which approximately 70% are from the local area. The result is a 21st century mine with strong local support and potential for impressive growth.
The reopening of the mine on June 12, 2018 was a cause for celebration in the town of Gouverneur, New York, and other communities surrounding the mine. Organizations such as the New York Power Authority (“NYPA”) and Workforce Development Institute are supporting the mine by providing funds for the new miners’ training program. NYPA has also committed to provide low-cost power from the St. Lawrence-Franklin D. Roosevelt Power Project as part of an initiative to help businesses in the North Country over the long term.
Looking to the Future
Based on an updated preliminary economic assessment filed in May 2018, ESM is forecast to produce an annual average of 80 million pounds of payable zinc in concentrate over its eight-year mine life, at C1 cash costs of US$0.70/lb and all-in sustaining costs (“AISC”) of US$0.79/lb of zinc(1). With first concentrate shipped in March 2018, the company expects to achieve commercial production in Q3/18.
There is good potential to increase both production and mine life at ESM. A study has already commenced on an expansion of production at ESM #4 mine to 3,000 tpd in 2020, and an extension of the mine life beyond the initial estimate of eight years. In 2022, management is targeting further expansion of production to fill the mill capacity of 5,000 tpd.
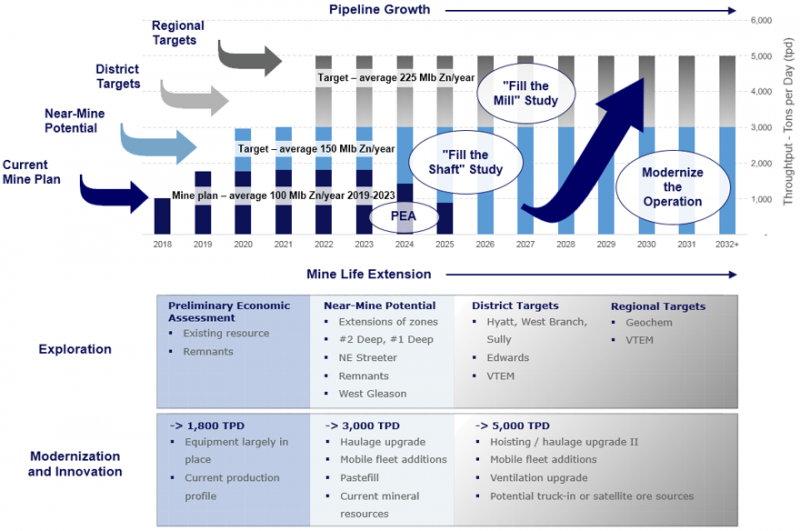
Production growth and mine life extension are expected to be supported by the recently-expanded mineral resources at the mine, further near-mine mineral resource additions, and district and regional exploration. In June, the company identified several mineralized zones close to the #4 shaft at the mine. These zones contain historic mineralized material and are open down-plunge. If economic, there is potential for them to be developed relatively quickly and with lower capital expenditure than would be required for more distal zones.
The restart of mining in this historic district is driven by attractive economic returns. Modernization and innovation are expected to be an integral part of the growth plan at ESM, driving an increase in productivity of up to 20-40%, and lowering costs at the mine.
Titan Mining is positioned to benefit from any strengthening in zinc prices, which are currently supported by low inventories, and expects to transition to positive free cash flow in H2/18.
1. C1 cash costs are defined as site-level cash operating costs (mining, processing, G&A, royalties), plus off-site transportation and treatment charges. AISC refers to all-in sustaining costs which are defined as C1 cash costs plus sustaining capital. C1 cash costs and AISC per pound are calculated by dividing the C1 cash costs and AISC, respectively, by the payable metal production expected in the period.
The mega-cap stocks that dominate the US markets are just finishing another monster earnings season. It wasn’t just profits that soared under Republicans’ big corporate tax cuts, but sales surged too. That’s no mean feat for massive mature companies, but sustained growth at this torrid pace is impossible. So peak-earnings fears continue to mount while valuations shoot even higher into dangerous bubble territory.
Four times a year publicly-traded companies release treasure troves of valuable information in the form of quarterly reports. Required by the US Securities and Exchange Commission, these 10-Qs contain the best fundamental data available to investors and speculators. They dispel all the sentimental distortions inevitably surrounding prevailing stock-price levels, revealing the underlying hard fundamental realities.
The deadline for filing 10-Qs for “large accelerated filers” is 40 days after fiscal quarter-ends. The SEC defines this as companies with market capitalizations over $700m. That currently includes every single stock in the flagship S&P 500 stock index, which includes the biggest and best American companies. As Q2’18 ended, the smallest SPX stock had a market cap of $4.1b which was 1/225th the size of leader Apple.
The middle of this week marked 39 days since the end of calendar Q2, so almost all of the big US stocks of the S&P 500 have reported. The exceptions are companies running fiscal quarters out of sync with calendar quarters. Walmart, Home Depot, Cisco, and NVIDIA have fiscal quarters ending a month after calendar ones, so their “Q2” results weren’t out yet as of this Wednesday. They’ll arrive in coming weeks.
The S&P 500 (SPX) is the world’s most-important stock index by far, weighting the best US companies by market capitalization. So not surprisingly the world’s largest and most-important ETF is the SPY SPDR S&P 500 ETF which tracks the SPX. This week it had huge net assets of $271.3b! The IVV iShares Core S&P 500 ETF and VOO Vanguard S&P 500 ETF also track the SPX with $155.9b and $96.6b of net assets.
The vast majority of investors own the big US stocks of the SPX, as they are the top holdings of nearly all investment funds. So if you are in the US markets at all, including with retirement capital, the fortunes of the big US stocks are very important for your overall wealth. Thus once a quarter after earnings season it’s essential to check in to see how they are faring fundamentally. Their results also portend stock-price trends.
Unfortunately my small financial-research company lacks the manpower to analyze all 500 SPX stocks in SPY each quarter. Support our business with enough newsletter subscriptions, and I would gladly hire the people necessary to do it. For now we’re digging into the top 34 SPX/SPY components ranked by market capitalization. That’s an arbitrary number that fits neatly into the tables below, and a dominant sample.
As of the end of Q2’18 on June 29th, these 34 companies accounted for a staggering 42.6% of the total weighting in SPY and the SPX itself! These are the mightiest of American companies, the widely-held mega-cap stocks everyone knows and loves. For comparison, it took the bottom 431 SPX companies to match its top 34 stocks’ weighting! The entire stock markets greatly depend on how the big US stocks are doing.
Every quarter I wade through the 10-Q SEC filings of these top SPX companies for a ton of fundamental data I dump into a spreadsheet for analysis. The highlights make it into these tables below. They start with each company’s symbol, weighting in the SPX and SPY, and market cap as of the final trading day of Q2’18. That’s followed by the year-over-year change in each company’s market capitalization, a critical metric.
Major US corporations have been engaged in a wildly-unprecedented stock-buyback binge ever since the Fed forced interest rates to deep artificial lows during 2008’s stock panic. Thus the appreciation in their share prices also reflects shrinking shares outstanding. Looking at market-cap changes instead of just underlying share-price changes effectively normalizes out stock buybacks, offering purer views of value.
That’s followed by quarterly sales along with their YoY changes. Top-line revenues are one of the best indicators of businesses’ health. While profits can be easily manipulated quarter-to-quarter by playing with all kinds of accounting estimates, sales are tougher to artificially inflate. Ultimately sales growth is necessary for companies to expand, as bottom-line earnings growth driven by cost-cutting is inherently limited.
Operating cash flows are also important, showing how much capital companies’ businesses are actually generating. Using cash to make more cash is a core tenet of capitalism. Unfortunately most companies are now obscuring quarterly OCFs by reporting them in year-to-date terms, which lumps in multiple quarters together. So these tables only include Q2 operating cash flows if specifically broken out by companies.
Next are the actual hard quarterly earnings that must be reported to the SEC under Generally Accepted Accounting Principles. Late in bull markets, companies tend to use fake pro-forma earnings to downplay real GAAP results. These are derided as EBS earnings, Everything but the Bad Stuff! Companies often arbitrarily ignore certain expenses on a pro-forma basis to artificially boost their profits, which is very misleading.
While we’re also collecting the earnings-per-share data Wall Street loves, it’s more important to consider total profits. Stock buybacks are executed to manipulate EPS higher, because the shares-outstanding denominator of its calculation shrinks as shares are repurchased. Raw profits are a cleaner measure, again effectively neutralizing the impacts of stock buybacks. They better reflect underlying business performance.
Finally the trailing-twelve-month price-to-earnings ratio as of the end of Q2’18 is noted. TTM P/Es look at the last four reported quarters of actual GAAP profits compared to prevailing stock prices. They are the gold-standard metric for valuations. Wall Street often intentionally obscures these hard P/Es by using the fictional forward P/Es instead, which are literally mere guesses about future profits that often prove far too optimistic.
Not surprisingly in the second quarter under this new slashed-corporate-taxes regime, many of the mega-cap US stocks reported spectacular Q2’18 results. For the most part sales, OCFs, and earnings surged dramatically. The big problem is such blistering tax-cut-driven growth rates are impossible to sustain for long at the vast scales these huge companies operate at. Downside risks are serious with bubble valuations.
The elite market-darling mega tech stocks continue to dominate the US stock markets. Most famous are the FANG names, Facebook, Amazon, Netflix, and Alphabet which used to be called Google. Apple and Microsoft should be added to those rarified beloved ranks. Together these half-dozen companies alone accounted for nearly 1/6th of the SPX’s entire market cap! That’s an incredible concentration of capital.
This highlights the extreme narrowing breadth behind this very-late-stage bull market. At the month-end just before Trump’s election victory in early November 2016, these same tech giants weighed in at 12.3% of the SPX weighting compared to 16.4% today. And if you go all the way back to this bull’s birth month of March 2009, MSFT, GOOGL, AAPL, and AMZN weighed in at 5.4%. FB and NFLX weren’t yet in the SPX.
Ever more capital is crowding into fewer and fewer stocks as fund managers chase the biggest winners and increasingly pile into them. And these 6 elite mega techs’ Q2’18 results show why they are widely adored. Their revenues rocketed 30.3% YoY on average, more than doubling the 14.0% growth in this entire top-34 list! Excluding these techs, the rest of the top 34 only grew their sales by 10.0% or a third as much.
That vast outperformance is reflected in their market-cap gains too, which again normalize out all the big stock buybacks. Overall these top SPY companies’ values surged 23.5% higher YoY, nearly doubling the 12.2% SPX gain from the ends of Q2’17 to Q2’18. But these top 6 tech stocks’ stellar average gains of 57.5% YoY dwarfed the rest of the top 34’s 16.2% annual appreciation! These stocks are loved for good reason.
The same is true on the profits front, with AAPL, AMZN, GOOGL, MSFT, FB, and NFLX trouncing the rest of these biggest US stocks. These 6 tech giants saw staggering average earnings growth of 289.1% YoY, compared to 30.9% for the rest of the top 34. That former number is heavily skewed by Amazon’s results though, as its profits skyrocketed an astounding 1186% from $197m in Q2’17 to $2534m in Q2’18.
Netflix had a similar enormous 484% YoY gain in earnings from a super-low level. Interestingly the rest of these big 6 tech stocks saw average growth of just 16.0% YoY, only about half that of the rest of the top 34. That proves the enormous surge in mega-cap-tech stock prices over this past year wasn’t driven by earnings as bulls often claim. Stock-price appreciation has far outstretched profits growth, an ominous sign.
In conservative hard trailing-twelve-month price-to-earnings-ratio terms, the big-6 tech giants sported an incredible average P/E of 107.3x earnings exiting Q2! That is deep into formal stock-bubble territory over 28x, which is itself double the century-and-a-quarter average fair value of 14x in the US stock markets. Again AMZN and NFLX are skewing this way higher though, with their insane 214.8x and 263.9x P/E ratios.
P/Es are the annual ratio of prevailing stock-price levels to underlying profits. So they can be viewed as the number of years it would take a company to earn back the price new investors today are paying for it. A stock bought at 200x earnings would take 200 years to merely recoup its purchase price through profits, assuming no growth of course. Buying at these heights is crazy given humans’ relatively-short investing lifespan.
Assuming people start investing young at 25 years old and retire at 65, that gives them about 40 years of prime investing time. So buying any stock above 40x implies a time horizon well beyond what anyone actually has. And provocatively even excluding the crazy P/Es of Amazon and Netflix, the rest of these big 6 tech stocks still average extremely-high 41.2x P/Es. And ominously that is right in line with market averages.
Without those elite tech leaders, the rest of these top 34 SPY stocks had average TTM P/Es of 41.0x when they exited Q2. History has proven countless times that buying stocks near such extreme bubble valuations has soon led to massive losses in the subsequent bear markets that always follow bulls. So these stock markets are extraordinarily risky at these valuations, truly an accident waiting to happen.
When stocks are exceedingly overvalued, the downside risks are radically greater than upside potential. After everyone is effectively all-in one of these universally-held mega tech stocks, there aren’t enough new buyers left to drive them higher no matter how good news happens to be. And these investors who bought in high and late can quickly become herd sellers when some bad news inevitably comes to pass.
Q2’18’s earnings season has already proven this in spades despite the extreme euphoria surrounding the stock markets and elite tech stocks in particular. Fully 3 of the 4 beloved FANG stocks showed just how overbought stocks react to news. The recent price action in Amazon, Netflix, and Facebook following their Q2 results is a serious cautionary tale for investors convinced mega tech stocks can rally indefinitely.
Everyone loves Amazon, but it is priced far beyond perfection. Its stock skyrocketed 75% YoY to leave Q2 with that ludicrous P/E of 214.8x. When any stock gets so radically overbought and overvalued, it has a tough time moving materially higher no matter what happens. Normally stocks shoot higher on blowout quarterly results as new investors flood into the strong company. But Amazon couldn’t find many buyers.
After the close on July 26th Amazon reported a monster blowout Q2. Its earnings per share of $5.07 was more than double analysts’ estimate of $2.50! Revenues, operating cash flows, and profits rocketed up an astounding 39.3%, 93.5%, and 1186.3% YoY. AMZN’s revenue guidance for Q3 at a midpoint running $55.8b also hit the low end of Wall Street expectations. Any normal stock would soar the next day on all that.
But while Amazon stock mustered a decent 4.0% gain at best the next day, that faded to a mere +0.5% close. AMZN was priced for perfection, so not even one of its best quarters ever was enough to bring in more buyers. Everyone already owns it, so who is left to deploy new capital? AMZN slumped 1.7% over the next several trading days, though it has since recovered to new record highs with the strong stock markets.
Netflix was the best-performing large US stock over the past year, skyrocketing 162% higher between the ends of Q2’17 to Q2’18! It had an absurd TTM P/E of 263.9x leaving Q2, more extreme than Amazon’s. But man, investors love Netflix with a quasi-religious fervor and believe it can do no wrong at any price. So Wall Street was eagerly anticipating NFLX’s Q2 results that came out after the close back on July 16th.
And they were really darned good. EPS of $0.85 beat the expectations of $0.79. On an absolute basis, sales and profits soared 40.3% and 484.3% YoY! Netflix did report negative operating cash flows, but it has been burning cash forever so that was no surprise. Yet despite these strong results this priced-for-perfection market-darling stock plunged 13%ish in after-hours trading! Good news wasn’t good enough.
Investors weren’t happy because subscriber growth was slowing. NFLX reported 5.2m net new streaming subscriptions in Q2, below the 6.3m expected and 7.4m in Q1. Netflix itself had provided earlier guidance of 1.2m US adds, but the actual was way short at 0.7m. So NFLX stock plummeted as much as 14.1% the next trading day before rebounding to a still-ugly -5.2% close. It couldn’t rally on great Q2 financial results.
And universally-held big stocks not responding favorably to quarterly results can quickly damage traders’ euphoric enthusiasm for them. The selling in Netflix’s stock gradually cascaded following that big hit on Q2 results. Over the next couple weeks, NFLX dropped 16.4% from its close just before that Q2 earnings release! The mega tech stocks aren’t invincible, and are very risky trading so high with everyone all-in.
With the possible exception of mighty Apple, Facebook was widely considered the least risky of the elite tech stocks as Q2 ended. Its 32.5x P/E was almost low by mega-tech standards, only bested by the 17.9x of Apple which is in a league of its own. FB reported after the close on July 25th, and shared great results led by a modest EPS beat of $1.74 compared to $1.72 expected. But the absolute gains were really big.
Facebook’s sales, operating cash flows, and profits soared 41.9%, 17.5%, and 31.1% YoY! That top-line revenue growth in particular was huge, nearly the best out of all these top 34 SPY stocks. And FB’s profits were growing so fast that it was the only elite mega-tech stock to see its TTM P/E actually decline YoY, retreating 14.2%. So FB looked much safer fundamentally than the other FANG stocks dominating the SPX.
But Facebook’s stock effectively crashed in after-hours trading immediately after those Q2 results, falling as much as 24%! The reason? It guided to slowing sales growth in Q3 and Q4 in the high single digits. FB was obviously priced for perfection and universally owned too, leaving nothing but herd sellers when anything finally disappointed. The next day FB stock plummeted a catastrophic 19.0%, stunning investors.
That wiped out an inconceivable $119.4b in market capitalization! That was the worst ever seen in one day by any single company in US stock-market history. More than ever investors and speculators need to realize that their beloved FANG stocks along with MSFT and AAPL aren’t magically exempt from serious selloffs. When any stocks are way overbought and wildly overvalued, it’s only a matter of time until selling hits.
Without these mega tech stocks, the US stock markets never would’ve gotten anywhere close to their current near-record heights. The flood of investment capital into Netflix over this past year was so huge it catapulted that company well into the ranks of the top 34. Its symbol is highlighted in light blue, along with a few other stocks, because it is new in the SPX’s top 34 in Q2. Outsized tech gains can’t happen forever.
Interestingly I found something else in their quarterly reports I haven’t yet seen discussed elsewhere. The total debt of these top 6 mega tech stocks soared an average of 36.5% higher YoY! That is way beyond the rest of the top 34 excluding the giant banks which have very-different balance sheets. Those other 18 top-34 SPY companies saw total debt only climb 6.0% YoY. Mega-tech debt is rocketing at 6.1x that rate!
While the elite tech stocks do have huge cash hoards, their spiraling debt is ominous. With the Fed deep into its latest rate-hike cycle, the carrying costs of debt are rising fast. With each passing month and each bond companies roll over, their interest expenses increase. At best those will cut into their profits, which will push their nosebleed P/Es even higher. They will have to slow debt growth and eventually pay back much.
We are talking huge amounts, $588.2b of total debt across Apple, Amazon, Google, Microsoft, Facebook, and Netflix alone! The main reason most of these companies are ramping their debt so fast is to finance massive stock buybacks propelling their share prices higher. They will have to really slow or even stop their huge buyback campaigns if their total debt or the carrying costs on it grow too large, a serious threat now.
These top 34 SPX stocks collectively had an extreme average trailing-twelve-month price-to-earnings ratio of 53.4x leaving Q2! That is nearly double historical bubble levels, exceedingly dangerous. There are far-higher odds the next major move in these hyper-expensive stock markets will be down rather than up. The next couple quarters face very different psychology and monetary winds than this rallying past year.
In both Q3 and Q4 last year, traders were ecstatic over the Republicans’ record corporate tax cuts that were excitingly nearing. In Q1 and Q2 this year, traders were dazzled by the incredible profits growth largely driven by sharply-lower taxes. While that will continue to some extent in Q3 and Q4 this year, the initial exuberance has mostly run its course. Big US stocks are facing tougher comparables going forward.
But the real threat to these bubblicious extreme stock markets is the Fed’s young quantitative-tightening campaign. It started imperceptibly in Q4’17 to begin unwinding the staggering $3625b of quantitative-easing money printing the Fed unleashed over 6.7 years starting in late 2008. Total QT in Q4’17 was just $30b. But it grew to another $60b in Q1’18 and then another $90b in Q2’18. And it is still getting bigger.
In this current Q3’18, another $120b of QE is going to be wiped out by QT. And finally in Q4’18, this new Fed QT will hit its terminal speed of $150b per quarter. That’s expected to last for some time. If the Fed merely wants to reverse just half of its extreme QE, it will have to run QT at that full-speed $50b-per-month pace for fully 2.5 years. That extreme monetary-destruction headwind is unprecedented in world history.
Today’s enormous stock bull grew so extreme because the Fed’s epic QE levitated stock markets, driving their valuations to nosebleed heights. What Fed QE giveth, Fed QT taketh away. At the same time the European Central Bank is tapering its own colossal QE campaign to nothing too. Between the Fed and ECB alone, 2018 will see $900b less central-bank liquidity than 2017! That’s certainly going to leave a mark.
The odds are very high that a major new bear market is awakening. Stock markets inexorably levitated by long years of extreme central-bank easing now face record tightening as that easing finally starts to be unwound. Thanks to that extreme QE as well as the Fed’s radically-unprecedented 7-year-long zero-interest-rate policy, this SPX bull extended to a monster 324.6% gain over 8.9 years as of its late-January peak!
That is nearly the second-largest and easily the second-longest stock bull in all of US history. Stock bulls always eventually peak in extreme euphoria, and then give way to subsequent proportional bears. With today’s valuations so deep into dangerous bubble territory, not even blowout earnings will be enough to keep stocks from sliding. Normal bear markets after normal bulls often maul stock markets down 50% off highs!
And after this epic QE-fueled largely-artificial monster stock bull, the inevitable bear to come is very likely to prove much bigger and meaner than normal. If the Fed’s QT doesn’t spawn it, peak earnings will. The past year’s extreme growth rates in sales and profits at the largest US companies from already-high base levels aren’t sustainable mathematically. Traders will freak out when they see growth slow or even reverse.
Investors really need to lighten up on their stock-heavy portfolios, or put stop losses in place, to protect themselves from the coming central-bank-tightening-triggered valuation mean reversion in the form of a major new stock bear. Cash is king in bear markets, as its buying power grows. Investors who hold cash during a 50% bear market can double their stock holdings at the bottom by buying back their stocks at half-price!
SPY put options can also be used to hedge downside risks. They are still relatively cheap now with complacency rampant, but their prices will surge quickly when stocks start selling off materially again. Even better than cash and SPY puts is gold, the anti-stock trade. Gold is a rare asset that tends to move counter to stock markets, leading to soaring investment demand for portfolio diversification when stocks fall.
Gold surged nearly 30% higher in the first half of 2016 in a new bull run that was initially sparked by the last major correction in stock markets early that year. If the stock markets indeed roll over into a new bear soon, gold’s coming gains should be much greater. And they will be dwarfed by those of the best gold miners’ stocks, whose profits leverage gold’s gains. Gold stocks skyrocketed 182% higher in 2016’s first half!
Absolutely essential in bear markets is cultivating excellent contrarian intelligence sources. That’s our specialty at Zeal. After decades studying the markets and trading, we really walk the contrarian walk. We buy low when few others will, so we can later sell high when few others can. While Wall Street will deny the coming stock-market bear all the way down, we will help you both understand it and prosper during it.
We’ve long published acclaimed weekly and monthly newsletters for speculators and investors. They draw on my vast experience, knowledge, wisdom, and ongoing research to explain what’s going on in the markets, why, and how to trade them with specific stocks. As of the end of Q2, all 1012 stock trades recommended in real-time to our newsletter subscribers since 2001 averaged stellar annualized realized gains of +19.3%! Subscribe today and take advantage of our 20%-off summer-doldrums sale before it ends.
The bottom line is the big US stocks’ latest quarterly results again proved amazingly good. Sales and profits soared year-over-year on those record corporate tax cuts and the widespread optimism they fueled. But earnings are still way too low to justify today’s super-high stock prices, spawning dangerous bubble valuations. That portends far-weaker markets ahead, led by serious selling in market-darling mega techs.
These near-record-high stock markets are reaching buying exhaustion, when stocks can’t rally much on good news and plummet on bad news. Earnings are likely peaking with the corporate-tax-cut euphoria as well, with deteriorating profits growth ahead. As if that’s not worrisome enough for hyper-overvalued stocks, these priced-for-perfection markets face accelerating Fed QT in coming quarters. Talk about bearish!
The following interview of Brett Heath, CEO of Metalla Royalty & Streaming (TSX-V: MTA) / (OTCQB: MTAFF) was conducted by phone and email over a one week period ended July 18th. Metalla is a small-cap precious metals royalty / streaming company. The investment thesis (in my opinion) is that someday it will be acquired by a larger player in the sector.
In the meantime, it trades at roughly 1/3 the valuation of peer industry giants. Brett and his accomplished team are growing the Company rapidly via prudent transactions that diversify risk and appear to have highly attractive return profiles. {corporate presentation}
I’ve written a few articles on Metalla Royalty & Streaming and I’m happy to report that management has delivered on its promises. It was up-listed to tier 1 on the TSX-v, instituted and has already increased a monthly cash dividend, made accretive deals and has several more in the works (including Valgold Resources). Metalla has secured several new team members and closed a blockbuster transaction with prominent mid-tier miner Coeur Mining.
Without further preamble, here’s my exclusive interview with President & CEO Brett Heath.
Brett, when we first met, you had a couple of early stage royalties and a C$ 10 M market cap. Now you have a growing portfolio of producing, development & exploration royalties / streams and a C$ 60 Mmarket cap. How were you able to do this?
As far as mining investments go, it’s hard to beat the stability of precious metals royalties. Just look at companies like Franco-Nevada (NYSE: FNV) / (TSX: FNV), Wheaton Precious Metals (NYSE: WPM) / (TSX: WPM) or Royal Gold (NYSE: RGLD). They have significantly outperformed traditional mining companies and the underlying gold price over the last decade.
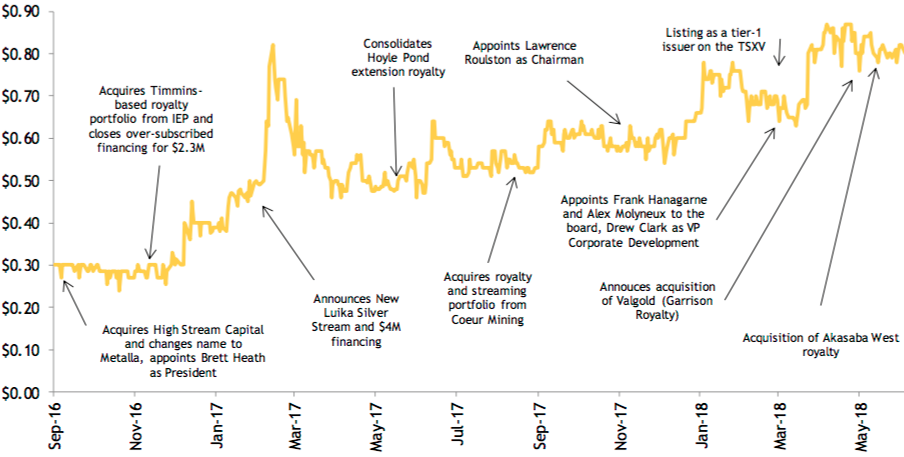
That success created an opportunity that Metalla, just 1/200th the average market cap of those three, has been able to capitalize on. Our size allows us to look at hundreds of royalty & streaming deals that aren’t big enough to move the needle of larger companies.
Our third-party acquisition strategy has allowed us to pick up royalties on projects operated by multi-billion-dollar companies like Goldcorp, Pan American Silver, Tahoe Resources, Agnico-Eagle, TOHO Zinc and Osisko Mining (not to be confused with Osisko Gold Royalties). These strong operators will drive big premiums for Metalla shareholders as we continue to add more royalties and streams to the portfolio.
How important is your team? You say that you benefit from smaller, more attractive transactions, but the Majors have deep pockets and access to top-notch financial advisors & mining experts.
Our team is critical. Every deal is different. Each requires specific expertise once you get down into the details. That’s why we have a strong, full-time team and we also retain consulting experts to help us solve unique problems in the deal process. This means we have access to the same caliber of legal, technical and financial (tax/accounting, etc.) people as our much larger peers, but without the bloated payroll.
Among our officers and directors we have decades of experience in all facets of the mining industry. We also have an expansive network to tap when we need a technical geologist, engineer or metallurgist to perform specific jurisdictional and mining due diligence.
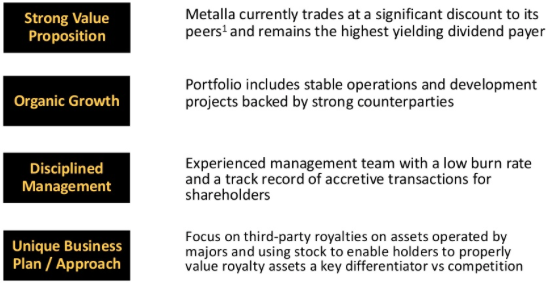
On our Board is Frank Hanagarne, Sr. VP & COO Coeur Mining. Coeur Mining (NYSE: CDE) has an EV of C$2.3 billion and vast experience with operating mines in North Americas. As you can imagine, having the COO of a successful mid-tier precious metals company on our Board is extremely useful. Frank was also an executive at Newmont Mining during the formation of Franco-Nevada, so in addition to having a strong technical background, he has in-depth knowledge and understanding of the royalty and streaming space.
We also have E.B. Tucker & Lawrence Roulston, two well-known mining industry analysts / financiers / investors with admirable track records and amazing industry contacts.
We recently appointed Alex Molyneux to our Board. He has a tremendous amount of direct deal-making experience and was the Head of Metals & Mining Investment Banking, Asia Pacific for Citigroup in Hong Kong. Alex lives in Taiwan and has a remarkable network of contacts, especially across Asia, that should help propel Metalla forward.
Drew Clark is our VP of Corporate Development, he previously worked for Premier Royalty which was taken over by Sandstorm Gold.
Your most recently announced deal is the outright acquisition of Valgold Resources (expected to close within a month). Please tell readers about this deal.
Valgold Resources (TSX-V: VAL) is an excellent example of our business model at work. It’s an all-share transaction, so we’re not laying out any cash. Metalla’s share price has outperformed our peer group, so we don’t mind issuing a relatively modest number of new shares to lock down a highly attractive gold royalty on a potentially world-class project in the tier-1 mining jurisdiction of Ontario, Canada.
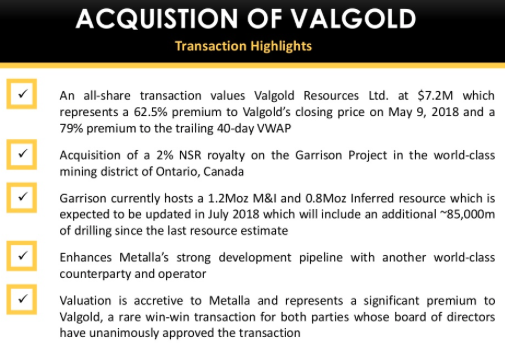
The Garrison Gold project is operated by Osisko Mining, a proven mine builder. Garrison is an essential project for them. We think uncapped upside on our 2% NSR is very exciting and could produce a long-term return that’s much higher than the base case scenario.
Metalla recently provided attributable silver equivalent guidance for the fiscal year ending May 31, 2019. Can you walk us through your thinking?
We expect sales to be roughly 500,000 to 600,000 silver equivalent ounces (attributable to Metalla). That compares to about 520,000 ounces in the year ended May 31, 2018. Keep in mind, that’s what we expect from our existing portfolio, it does not include potential acquisitions.
We continue to work on a number of new deals, some of which on assets very close to, or actually in production. In our guidance we indicated annual revenue could be C$9 – C$12 M. That’s based on 500-600k attributable ounces of silver, an exchange rate of C$1.25/US$1.00 and an average silver price of US$16.50/oz.
Based on our FY 2019 guidance, and assuming that the Valgold transaction closes, we’re trading at an Enterprise Value (market cap + debt – cash) to Revenue ratio (“EV/Rev“) of about 6-8 times. The EV/Rev ratio averages about 18 times for our larger competitors. So, Franco-Nevada, Wheaton Precious Metals, Royal Gold & Sandstorm (on average) trade at nearly three times our valuation. That means there’s lots of room for share price appreciation in our opinion.
Okay, thanks for that, I was going to ask you about Metalla’s valuation vs. peers….
Yes, we trade cheap vs. larger peers. To be fair, they are more established and deserve to trade at a premium, but our shareholders believe the valuation gap will shrink as we continue to add more royalties and streams. We’ve closed eight transactions since we first met less than two years ago. If we keep that pace, shareholders won’t have to wait long.
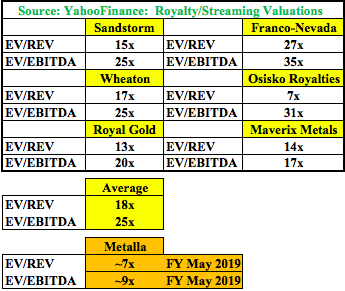
In the meantime, we pay a cash dividend. The current yield is 2.4%. That’s higher than all the precious metals royalty/streaming peers. And, we pay that dividend monthly. We want our shareholders to feel like ‘Gold Landlords‘ receiving tangible cash every month.
Please tell us more about your dividend policy, shouldn’t a fast growing company retain its cash flow to plow back into growth?
Generally yes, which is why we don’t pay out all of our profits in the form of dividends. However, dividends are a critical part of total investment returns. Our shareholders funded the business, and they deserve a portion of the profits we generate. We expect to continue growing our dividend (but not all at once) until it reaches a payout ratio of roughly 50% of free cash flow. As a reference point, our payout ratio will be about 30% of free cash flow after ValGold closes.
One more important point to consider is that a cash dividend creates a unique check on management’s behavior. Our board feels strongly that companies not paying dividends tend to be less successful asset buyers over time.
This philosophy seems to be popular so far. Our stock price is holding up nicely in what’s been a tough year for gold and silver so far.
Thanks Brett, that was very helpful. Good luck with your upcoming acquisitions. I look forward to my monthly dividend checks. For more on Metalla Royalty & Streaming (TSX-V: MTA) / (OTCQB: MTAFF) please check out the: {corporate presentation}
Disclosures: The content of this interview is for illustrative and information purposes only. Readers fully understand and agree that nothing contained herein, written by Peter Epstein of Epstein Research, [ER] including but not limited to, commentary, opinions, views, assumptions, reported facts, estimates, calculations, etc. is to be considered implicit or explicit, investment advice. Further, nothing contained herein is a recommendation or solicitation to buy or sell any security. Mr. Epstein and [ER] are not responsible for investment actions taken by the reader. Mr. Epstein and [ER] have never been, and are not currently, a registered or licensed financial advisor or broker/dealer, investment advisor, stockbroker, trader, money manager, compliance or legal officer, and they do not perform market making activities. Mr. Epstein and [ER] are not directly employed by any company, group, organization, party or person. Shares of Metalla Royalty are speculative, not suitable for all investors. Readers understand and agree that investments in small cap stocks can result in a 100% loss of invested funds. It is assumed and agreed upon by readers that they consult with their own licensed or registered financial advisors before making investment decisions.
At the time this article was posted, Peter Epstein owned shares in Metalla Royalty and the Company was an advertiser on [ER]. By virtue of ownership of the Company’s shares and it being an advertiser on [ER], Peter Epstein is biased in his views on the Company. Readers understand and agree that they must conduct their own research, above and beyond reading this article. While the author believes he’s diligent in screening out companies that are unattractive investment opportunities, he cannot guarantee that his efforts will (or have been) successful. Mr. Epstein & [ER] are not responsible for any perceived, or actual, errors including, but not limited to, commentary, opinions, views, assumptions, reported facts & financial calculations, or for the completeness of this article. Mr. Epstein & [ER] are not expected or required to subsequently follow or cover events & news, or write about any particular company or topic. Mr. Epstein and [ER] are not experts in any company, industry sector or investment topic.
If you would like to receive our free newsletter via email, simply enter your email address below & click subscribe.
 Follow us on Twitter
 Become our facebook fan
CONNECT WITH US
Tweets
Tweet with hash tag #miningfeeds or @miningfeeds and your tweets will be displayed across this site.
MOST ACTIVE MINING STOCKS
Daily Gainers
 CMC Metals Ltd. CMC Metals Ltd. |
CMB.V | +900.00% |
 Eden Energy Ltd Eden Energy Ltd |
EDE.AX | +200.00% |
| GoviEx Uranium Inc. |
GXU.V | +42.86% |
| Eagle Nickel Ltd. |
ENL.AX | +41.67% |
| Citigold Corp. Limited |
CTO.AX | +33.33% |
| Mount Burgess Mining NL |
MTB.AX | +33.33% |
| Exalt Resources Limited |
ERD.AX | +31.94% |
| Casa Minerals Inc. |
CASA.V | +30.00% |
| Cariboo Rose Resources Ltd |
CRB.V | +28.57% |
| Belmont Resources Inc. |
BEA.V | +28.57% |


