
- The magnificent gold price rally has paused in the $1300 area for the past few weeks. Monday was COMEX option expiry day.
- With that now out of the way, gold is already staging more upside action!
- Please click here now. Double-click to enlarge this daily gold chart. A bullish upside channel breakout is in play and the consolidation was a flag-like pattern.
- Also, note my key 14,7,7 series Stochastics oscillator at the bottom of the chart. A buy signal that occurs in the 40-60 area is a momentum-oriented signal, as opposed to a value-oriented signal that occurs in the 0-20 area.
- These are technical signs of a tremendously healthy market.
- Please click here now. Double-click to enlarge this spectacular long term gold chart.
- The technical excellence being showcased on the daily gold chart is typical during rallies from the final right shoulder low in this type of enormous inverse H&S bull continuation pattern.
- I’ve been almost alone amongst gold analysts in suggesting that the brief five-year decline from 2011-2016 was a typical “ho hum” correction in a bull market rather than a “vicious bear market”.
- There’s no question that junior gold stocks experienced a bear market then, but they have experienced a myriad of bear markets since the gold bullion bull market began in 1999-2002.
- Gold bullion bull and bear cycles last a long time. Twenty years is a short period of time for a gold bull or bear market, and many last a century or longer.
- I’ve predicted that this bull market will last a minimum of a hundred years, and more likely two hundred, and I stand by that prediction without wavering.
- Most of the world has been in a deflationary cycle since 1980. That’s when global bond yields peaked. Gold stocks tend to crash repeatedly in a deflationary cycle along with stock markets.
- In an inflationary cycle, gold stocks rally when stock markets rally… and they rally when stock markets fall. In August of 2018 I told investors to get ready for a sea change event; I predicted global stocks would crash in September-October, and gold stocks would surge higher as the stock markets crashed.
- That’s exactly what happened then, and I’ll calmly predict that it’s going to keep happening for the next decade of time.
- Please click here now. Double-click to enlarge. Silver bullion’s daily chart looks fabulous.
- There’s a double bottom pattern in play with a solid breakout. Note how the pullback stopped well above the $15 support zone. That’s another sign of a very healthy precious metals market.
- Key bank analysts are tuning into the solid fundamentals picture for silver. “Supply growth has started to slow, more than for any other precious metal.” – John LaForge, Wells Fargo Bank, Jan 28, 2019.
- Unlike America, China has tremendous “wiggle room” to stimulate its economy. GDP growth can likely be sustained at 4%-6% for many years, while it’s likely to be sub 2% in America for a long time. That bodes well for industrial silver demand, and Bloomberg analysts predict that demand will rise by 50% over the next 4-5 years!
- India is in an even stronger position than China, and vastly stronger than America. GDP growth is almost 8% now. It could rise above 10% and it probably needs to, to provide jobs for all the young citizens entering the workforce every day.
- Please click here now. Double-click to enlarge this silver stocks ETF chart. SIL is lagging GDX right now, and that’s technically positive; silver tends to lead as intermediate trends end, and lag as they begin and accelerate.
- Goldman’s analysts feel the global GDP and earnings decline in play now will hurt silver demand, but I think they are underestimating the ability of the Chinese government to stimulate.
- They are also underestimating the anger of American blue-collar workers who were essentially deflated (and arguably conned) by the central bank with its QE program. QE benefitted the banks, the stock market, and government.
- Blue-collar Americans wanted tax cuts. Corporations got a tax cut and the workers got nothing. Now they want their own version of QE handouts, in the form of wage hikes. Those hikes are going to happen as America enters a long period of GDP and corporate earnings stagnation. That’s phenomenal news for silver stock and bullion investors!
- Please click here now. Double-click to enlarge this GDX daily chart. Volume is positive, and the month-long consolidation appears to be ending. A gold-positive statement from the Fed today should move GDX like a shooting star towards my next $23 target price!
Special Offer For Website Readers: Please send me an Email to freereports4@gracelandupdates.com and I’ll send you my free “GDXJ Stars In The Sky!” report. I highlight key intermediate producers in the GDXJ ETF, with historical and current buy and sell points for eager traders and investors!
Stewart Thomson
Graceland Updates
Email:
Stewart Thomson is a retired Merrill Lynch broker. Stewart writes the Graceland Updates daily between 4am-7am. They are sent out around 8am-9am. The newsletter is attractively priced and the format is a unique numbered point form. Giving clarity of each point and saving valuable reading time.
Risks, Disclaimers, Legal
Stewart Thomson is no longer an investment advisor. The information provided by Stewart and Graceland Updates is for general information purposes only. Before taking any action on any investment, it is imperative that you consult with multiple properly licensed, experienced and qualified investment advisors and get numerous opinions before taking any action. Your minimum risk on any investment in the world is: 100% loss of all your money. You may be taking or preparing to take leveraged positions in investments and not know it, exposing yourself to unlimited risks. This is highly concerning if you are an investor in any derivatives products. There is an approx $700 trillion OTC Derivatives Iceberg with a tiny portion written off officially. The bottom line:
Are You Prepared?
The gold miners’ stocks have slumped in January, tilting sentiment back to bearish. This sector’s strong December upward momentum was checked by gold’s own upleg stalling out. Gold investment demand growth slowed on the blistering stock-market rally. But uplegs always flow and ebb, and this young gold-stock upleg merely paused. The gold miners’ gains will likely resume soon, rekindling bullish psychology.
Most investors and analysts track the gold-mining sector with its leading ETF, the GDX VanEck Vectors Gold Miners ETF. GDX was this sector’s pioneering ETF birthed in May 2006, creating a huge first-mover advantage that is insurmountable. This week GDX’s net assets of $9.9b were an incredible 56.7x larger than the next-biggest 1x-long major-gold-miners ETF! GDX dominates this space with little competition.
Back in early September, the gold stocks plunged to a major 2.6-year secular low per GDX. This sector suffered a brutal forced capitulation on cascading stop-loss selling, devastating sentiment. The triggering catalyst was gold getting pounded to its own major lows in mid-August on record futures short selling. At worst GDX fell to $17.57 on close, which was down an ugly 24.4% year-to-date. Most traders fled in disgust.
But major new uplegs are born in peak despair, and that was it. The gold stocks started recovering out of those fundamentally-absurd levels, gradually carving a solid upleg. By early January GDX had rallied 22.3% higher in 3.7 months, fueling more-optimistic sector sentiment. Plenty of speculators and investors including me were comparing 2019’s setup for gold stocks to the first half of 2016, a wildly-lucrative stretch.
That was just after today’s gold bull ignited, and its maiden upleg surged 29.9% higher in just 6.7 months. Such gold strength ignited a flood of capital into the gold miners, catapulting GDX an enormous 151.2% higher in essentially that same span! This year when GDX’s latest closing upleg high of $21.48 was achieved on January 3rd, traders were salivating at the prospects of another mighty H1’16-like gold-stock upleg.
But instead of powering higher, the gold stocks stalled and started drifting lower. By last Friday the 18th, GDX had slumped 5.4% over a couple of weeks or so to $20.31. That really discouraged the gold-stock traders, torpedoing the nascent bullishness driven by GDX’s powerful 10.5% December rally. I’ve been getting lots of e-mails from discouraged traders moping, and often convinced this gold-stock upleg fizzled.
Sentiment has really deteriorated in recent weeks as gold-stock prices retreated. One manifestation of this resurgent bearishness is apparent in how individual gold miners’ stocks are reacting to company-specific news. Early in new quarters, many gold miners report their prior quarter’s production. And early in new years, plenty also give guidance for new full-year production. Traders are selling hard on this news.
Even though these production reports and outlooks have generally been flat to good, they are being used as excuses to sell. When traders wax bearish, all news is considered bad. So when pessimism reigns early in new quarters, it’s not unusual to see traders flee. Conversely when gold stocks are rallying nicely early in new quarters, this news is typically bought. Gold stocks’ reaction to news is a sentiment indicator.
Interestingly selling on full-year production guidance is usually a poor decision. Gold-miner managers try to maximize their compensation which is heavily driven by their stock’s price. So they tend to lowball their production estimates early in new years, leaving room to beat them later in those years. Then when they exceed their own expectations, their stocks catch strong bids into year-ends maximizing their personal earnings.
Plenty of traders have written me worrying that January 2019 is nothing like January 2016, arguing that a major new gold-stock upleg isn’t underway. They are dead wrong, everyone forgets the gold stocks also fell in much of that pivotal month. In the first couple weeks of January 2016, GDX actually dropped 9.1% despite a parallel 2.5% gold surge! Then like now, emotional gold-stock traders were irrationally scared.
That monster H1’16 gold-stock upleg didn’t start until January 20th that year, which was that month’s 12th trading day. That was after most of the post-quarter and new-year news releases. This year’s slump is actually better, not worse. GDX was only down 3.7% month-to-date on this month’s 13th trading day, on gold’s slight 0.1% drift lower over that span. Early-year weakness doesn’t preclude major uplegs brewing!
While most traders want to assume otherwise, gold stocks’ young upleg remains very much alive and well. This chart is updated from my essay several weeks ago heralding GDX’s major upside triple breakout, a super-bullish technical event. While GDX did slump in recent weeks after achieving that, its upleg is still rock-solid. All uplegs meander higher in fits and starts, taking two steps forward before one step back.

I’m not going to rehash this chart after analyzing it in depth just a few weeks ago. But scared gold-stock traders can take solace in some brief observations. First note the early-January-2019 pullback in GDX is far less severe than the early-January-2016 one. While that month birthed a monster upleg, it wasn’t all rainbows and unicorns until the very end. Weak-handed excitable traders had to be shaken out before the surge.
Second look at GDX’s solid upleg since early September 2018, which again rallied 22.3% at best over 3.7 months as of January 3rd. Uplegs are simply series of higher lows and higher highs often unfolding in a defined uptrend channel. All that still perfectly applies to GDX, its technicals remain very bullish. Both its upleg lows and highs are gradually marching higher, revealing zero technical strain on this young upleg.
Once again this upleg was born at GDX’s deep 2.6-year low of $17.57 on September 11th. Over the next few weeks into early October, GDX surged 8.4% to $19.05. Then it quickly pulled back to $18.39, which was still 4.7% above upleg-start levels. From there GDX powered up another 9.3% over the next couple weeks to $20.10 in late October. Then it suffered a bigger retreat to $18.42 by mid-November, still a higher low.
GDX rebounded strongly from there, surging another 16.6% to $21.48 by early January. And after such a strong run it slumped again to $20.31 last Friday. While it remains to be seen if that proves the latest upleg low, the higher lows so far have run $18.39, $18.42, and $20.31. And the higher highs clocked in at $19.05, $20.10, and $21.48. This is a textbook-perfect gold-stock upleg so far, offering nothing to worry about.
These higher lows and higher highs have formed an excellent uptrend channel for this upleg. Connecting these lows and highs creates parallel lower-support and upper-resistance lines. I didn’t draw them in this chart because they’d be difficult to see at this scale, but they are really well-defined. As of this week the support line extends near $19.50. So even if GDX slumped that low, its uptrend channel would remain intact.
Resistance now projects near $21.75, which would be another new upleg high. Odds are GDX will head back up there to challenge it in the coming few weeks or so. GDX may have started bouncing from last Friday’s level a bit under its 200-day moving average, which is now running $20.65. It could head a little lower first to its 50dma which is down near $20.14. And maybe it will even drop to $19.50 lower support.
It’s important to realize that as long as GDX remains above that uptrend-channel support line, its upleg is just fine. Any action over that is merely upleg noise that isn’t worth worrying about technically. It is normal for pullbacks within uplegs to bleed away bullishness and rekindle bearishness. That’s actually essential for uplegs’ health and longevity, keeping sentiment balanced so uplegs don’t prematurely burn out.
All the upside triple-breakout analysis and bullishness I discussed in early January remains valid and in force today. This gold-stock upleg has just paused, which is par for the course. All uplegs flow and ebb, gradually meandering higher on balance. None shoot up in straight lines, not even that monster one in H1’16. That was riddled with multiple strong selloffs, with one even hitting support below GDX’s 50dma.
The reason this young gold-stock upleg paused in recent weeks was gold’s own upleg stalled out. Gold miners’ stocks are ultimately just leveraged plays on gold. Their profits really amplify changes in gold’s price, which lets major gold miners’ stocks leverage gold’s underlying moves by 2x to 3x. Gold’s own young upleg that is driving gold stocks’ one hit its latest high near $1294 in early January the same day as GDX.
At that point gold had rallied 10.2% upleg-to-date, which GDX’s 22.3% upleg leveraged by a normal 2.2x in a similar span. Gold had bottomed a few weeks before the gold stocks, in mid-August instead of early September. Gold stocks’ performance relative to gold in this upleg has been normal. That leverage is often on the low side of its range early in young uplegs, then climbs to the high side later as momentum mounts.
At worst since its own January 3rd high, gold had slumped 1.0% to $1280 on last Friday. It is certainly no coincidence that is the exact span of gold stocks’ latest pullback. GDX’s young upleg will resume as soon as gold catches a bid again. That is dependent on gold investment demand resuming. It was strong in Q4, but faded significantly in January. This next chart looks at the leading proxy for gold investment demand.
That is the physical bullion holdings the dominant GLD SPDR Gold Shares gold ETF holds in trust for its shareholders. They are reported daily, a far-higher-resolution read than the quarterly supply-and-demand data from the World Gold Council. In last week’s essay I explained this chart in depth, analyzing why the capital flows into and out of GLD alone by American stock investors overwhelmingly drive the global gold price.
It superimposes GLD’s bullion holdings in blue over the gold price in red. Rising GLD holdings show that American stock-market capital is moving into gold via the conduit of this leading gold ETF. In Q4 and especially December gold surged higher on heavy differential buying of GLD shares. But in January that GLD buying has moderated. That’s why gold’s advance stalled out, which in turn drove gold stocks’ pause.
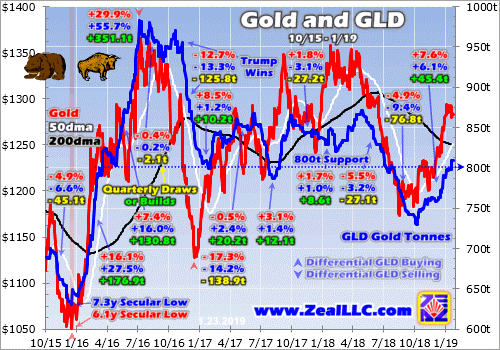
Again I discussed this chart just last week, so there’s no need for more comprehensive analysis. For our purposes today, note how GLD’s holdings climbed modestly in October and November after they had fallen to a deep 2.6-year secular low of their own in early October. GLD had suffered 5 consecutive monthly draws of 24.2 metric tons, 28.0t, 18.8t, 45.0t, and 12.9t between May and September, an ugly streak.
But that trend of American stock-market investors selling gold via GLD shares ended in early October. GLD enjoyed its first big build the very day the US stock markets suffered their first sharp plunge! That snowballed into an 11.8t build in October and 7.7t in November. That investment buying fueled modest gold rallies of 2.1% and 0.5% those months. Then in December that GLD-share buying really accelerated.
Last month enjoyed a sizable 25.9t build in GLD’s holdings, the biggest since September 2017. Those capital inflows fueled a much-larger 4.9% gold rally in December. When investment capital is flowing into gold, its price naturally climbs. And that in turn drives the gold miners’ stocks higher. Gold’s 2.1%, 0.5%, and 4.9% gains in the last several months drove parallel 2.2%, 0.8%, and 10.5% monthly rallies in GDX.
On the surface January has looked good too, with GLD’s holdings surging another 22.1t month-to-date as of the middle of this week. But nearly 9/10ths of that build came on only 2 trading days, January 2nd and 18th. Out of 15 trading days so far, January has seen 4 GLD-holdings build days, 3 draw days, and fully 8 unchanged. American stock investors’ differential GLD-share buying hasn’t been consistent this month.
That’s enabled gold-futures speculators to push gold modestly lower. Unfortunately we can’t know how much selling they’ve done, or whether it was exiting longs or adding new shorts, because of the federal-government partial shutdown. The weekly Commitments of Traders reports usually published by the CFTC haven’t been released since mid-December, so there is no data on gold-futures speculators’ trading.
But gold drifting lower this month despite a solid GLD build on balance proves they have to be selling. A sharp bounce in the US Dollar Index is a major factor driving those gold-futures sales. But the main one is the surging US stock markets. They are really retarding gold investment demand, making investors forget the wisdom of prudently diversifying their stock-heavy portfolios with gold. That has paused gold stocks.
The flagship U.S. S&P 500 broad-market stock index (SPX) plunged 19.8% over 3.1 months between late September and late December, a severe correction nearly entering bear-market territory. It was that SPX drop that reignited gold investment demand and fueled gold’s latest young upleg. Last week’s essay dug into this critical relationship between the SPX and gold. The SPX’s sharp rebound since weighed on gold demand.
Between the SPX’s Christmas Eve near-bear low and last Friday, this leading index rocketed up 13.6% in just several weeks! That violent bounce that looked and felt exactly like a bear-market rally nearly erased 4/7ths of the preceding correction. That has reignited widespread greed and complacency in the stock markets, the exact mission of bear rallies which are the biggest and fastest seen in all of stock-market history.
Gold stalled out in January because the SPX is surging so fiercely, retarding the impetus to diversify with gold. And the gold-stock upleg paused because gold stopped advancing. So this probable bear rally in the stock markets is to blame for gold stocks’ early-year weakness. But once these overbought U.S. stock markets roll over decisively again, gold psychology will flip back to favorable and big investment buying will resume.
When gold starts powering higher again, gold stocks will be off to the races. That portends big gains still coming in GDX, and even larger ones in its little brother GDXJ. It is effectively a mid-tier gold miners ETF these days, and its upleg gains during recent years’ bull market have outpaced GDX’s by about 1.4x on average. GDXJ simply has a better mix of gold miners than GDX, with fewer problems expanding production.
Yet the best gains by far won’t be won in the ETFs, but in the smaller mid-tier and junior gold miners with superior fundamentals. GDXJ still has deadweight in its top holdings, miners struggling with declining production and rising costs. The better gold miners are growing their output through new mine builds and expansions, generating greater gains. Finding and owning these better gold-mining stocks is essential.
The earlier you get deployed, the greater your gains will be. That’s why the trading books in our popular weekly and monthly newsletters are currently full of better gold and silver miners mostly added in recent months. The gains we won in 2016 were amazing the last time American stock investors returned to gold. Our newsletter stock trades that year averaged +111.0% and +89.7% annualized realized gains respectively!
The gold-stock gains should be similarly huge in this next major gold upleg. The gold miners are the last undervalued sector in these still-very-expensive stock markets, and rally with gold during stock-market bears unlike anything else. To multiply your wealth in the stock markets you have to do your homework and stay abreast, which our newsletters really help. They explain what’s going on in the markets, why, and how to trade them with specific stocks. You can subscribe today for just $12 per issue!
The bottom line is this young gold-stock upleg is just paused. The current technicals certainly don’t justify increasingly-bearish sentiment. This sector’s leading benchmark GDX is carving higher lows and higher highs, climbing on balance in a well-defined uptrend channel. Uplegs don’t shoot higher in straight lines, pullbacks within them are normal and expected. They serve to rebalance sentiment keeping uplegs healthy.
Gold stocks’ pullback this month was driven by gold’s own young upleg stalling. Strong gold investment demand fueled by recent months’ serious stock-market selloff moderated after stocks screamed higher in a violent bear-market-rally-like bounce. The resulting rekindled bullish psychology overshadowed gold again. But once stock-market selling resumes, so will the young uplegs in gold and its miners’ stocks.
Adam Hamilton, CPA
January 29, 2019
Copyright 2000 – 2019 Zeal LLC (www.ZealLLC.com)
by Morris Hubbartt
Jan 28, 2019
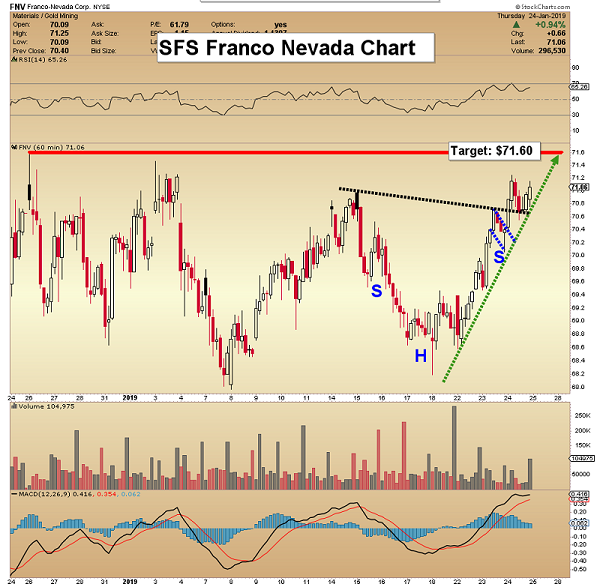
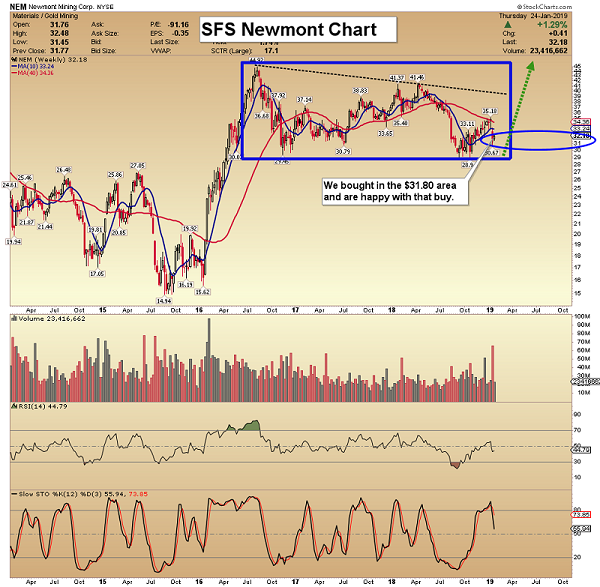
Here are today’s videos and charts (double-click to enlarge):
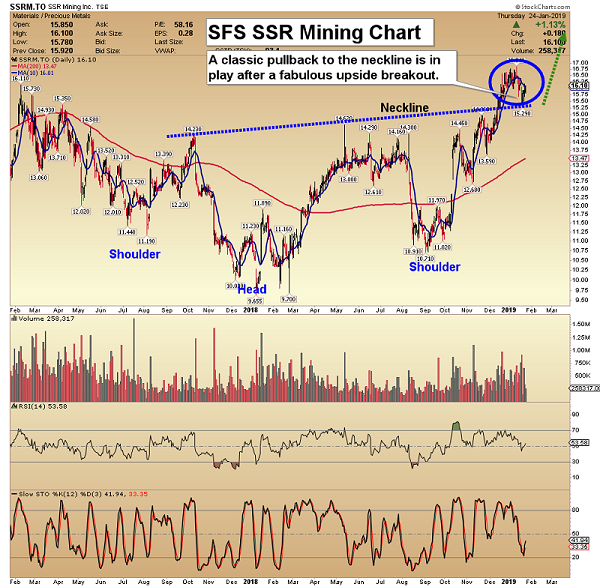
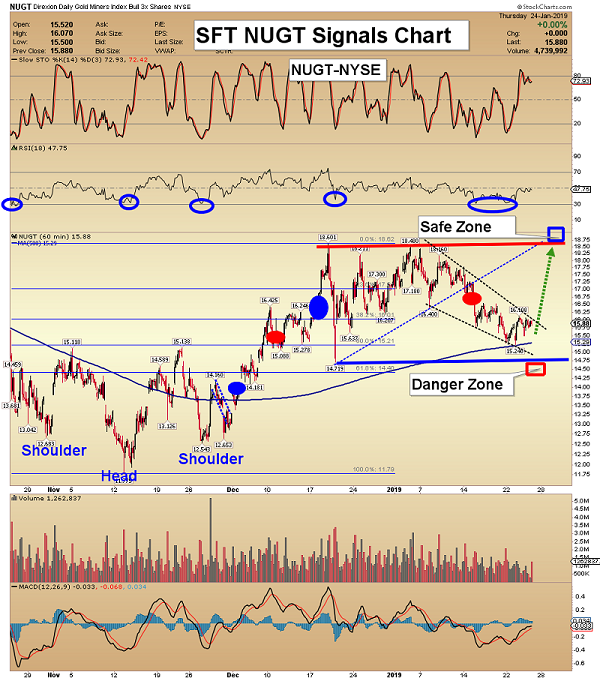
SFS Key Charts, Signals, & Video Analysis
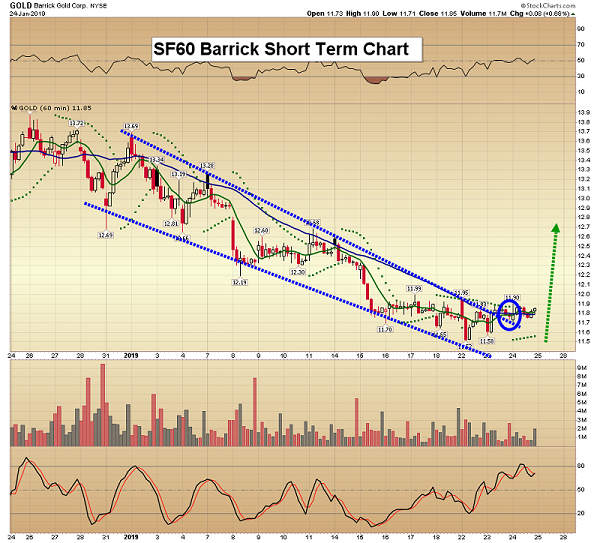
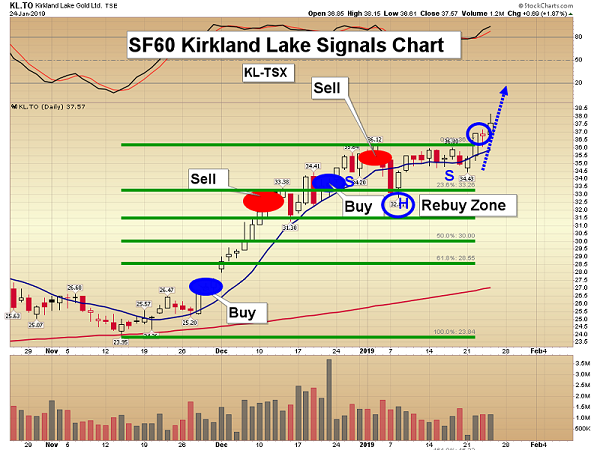
SF60 Key Charts, Signals, & Video Analysis

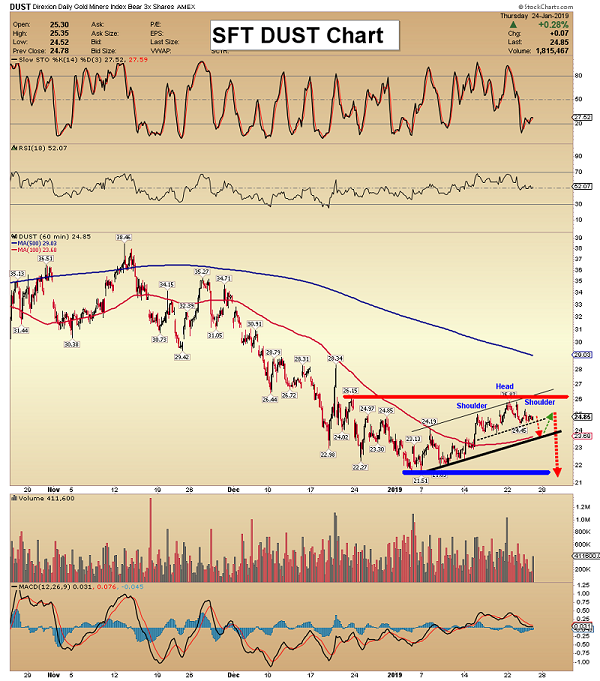
SF Trader Key Charts, Signals, & Video Analysis
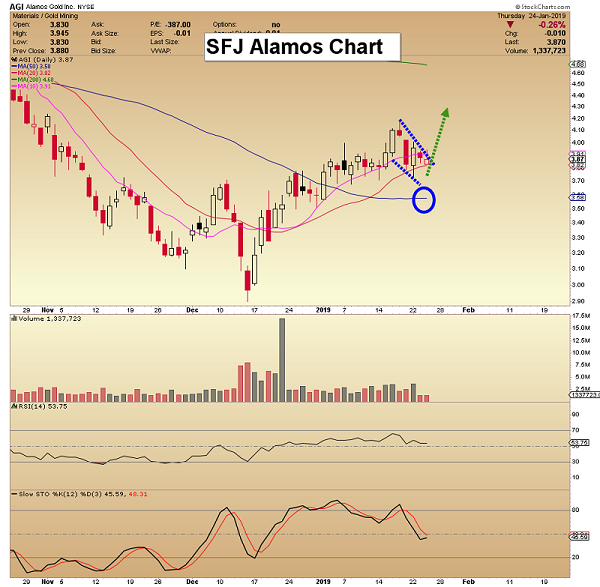
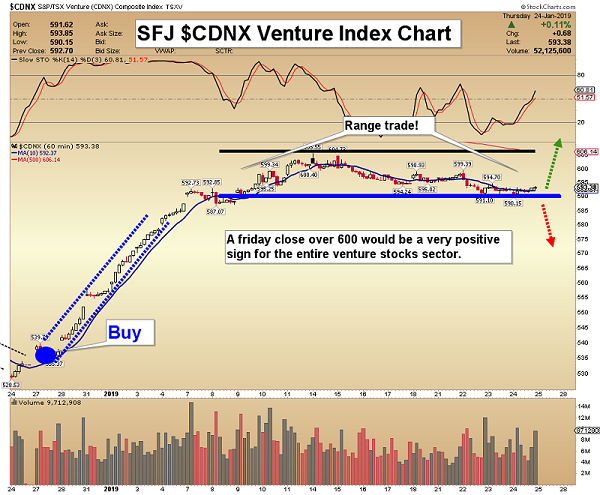
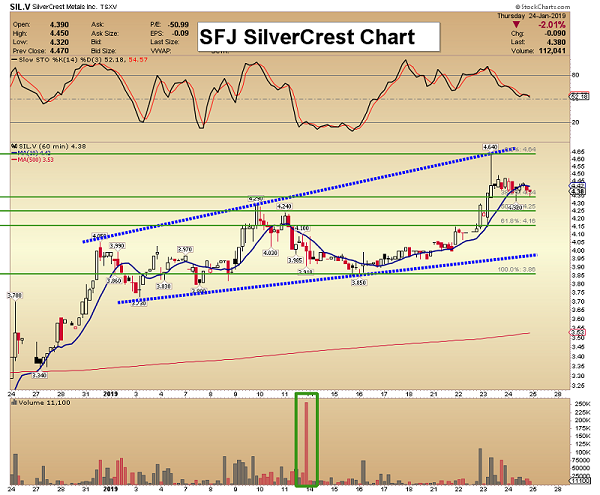
SFJ Key Charts, Signals, & Video Analysis
Thanks,
Morris Hubbartt
Unique Introduction For Website Readers: Send me an email to signals@superforcesignals.com and I’ll send you 3 of my next Super Force Surge Signals free of charge, as I send them to paid subscribers. Thank you!
Stay alert for our Super Force alerts, sent by email to subscribers, for both the daily charts on Super Force Signals at www.superforcesignals.com and for the 60 minute charts at www.superforce60.com
About Super Force Signals:
Our Super Force signals are created thru our proprietary blend of the highest quality technical analysis and many years of successful business building. We are two business owners with excellent synergy. We understand risk and reward. Our subscribers are generally successful business owners, people like yourself with speculative funds, looking for serious management of your risk and reward in the market.
Frank Johnson: Executive Editor, Macro Risk Manager.
Morris Hubbartt: Chief Market Analyst, Trading Risk Specialist.
Email:
by Peter Epstein
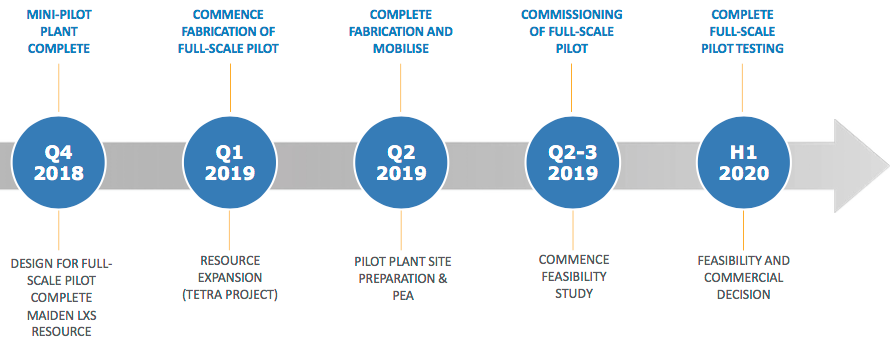
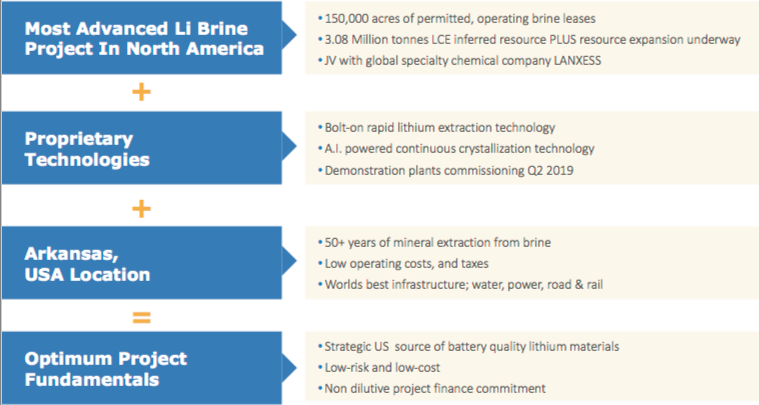
CEO Robert Mintak has 2 unconventional lithium projects in the U.S., one of which he believes is de-risked more than most lithium projects around the world due to infrastructure, permitting, jurisdiction and other key factors. While Robert can’t know for sure until Standard Lithium releases a Preliminary Economic Assessment (PEA), it seems likely that cap-ex will be low compared to conventional brine projects. For reasons explained below, op-ex is likely to be in the bottom half of the industry cost curve. The Company’s goal is to be in the bottom quartile.
Standard Lithium is on a clear path to signing a JV with giant German chemical company, LANXESS. If the JV is consummated, LANXESS will be committed to funding commercial development. This would be a tremendous de-risking event for the project and for Standard Lithium. Funding has been a huge challenge for lithium brine projects around the world. Please continue reading to learn more about this unique U.S. lithium project which could reach initial production in 2 years, 2021.
Peter Epstein: Please explain Standard Lithium to readers who are unfamiliar with your company:
Robert Mintak: We are an integrated technology and specialty chemical company. We are listed on the TSX-V as a mining exploration company but we are not exploring, you won’t see any new mineral discovery announcements coming any time soon. Our business model is simple and somewhat unconventional compared to our peers, we believe the fastest way to go into production and to limit investor risk is to form strategic partnerships that allow us to piggyback off the existing infrastructure and investment of massive operating commercial brine assets in the USA.
I have been involved in the lithium sector for the better part of the past decade. My experience and successes in the lithium sector have been in forging strategic relationships and partnerships with large multinational companies and stakeholders. Previous to Standard Lithium at Pure Energy I brought POSCO, Tenova Bateman, SRI and Tesla to the table, at Standard Lithium we have continued that dynamic with the agreements and partnerships executed including NYSE listed Tetra Technologies and of course our announced planned JV with LANXESS.
Epstein: How is your proprietary process different from lithium brine operations like those found in Argentina?
Mintak: First, I would like to state that the project drives the process. Every lithium brine project globally is by and large wholly unique. Not only the chemistry of the brine, when developing the process flow sheet, as a project builder you need to consider access to and cost of, chemical reagents, water, power.
Permitting, extraction & re-injection of brine, access to land and a skilled workforce arefundamental considerations before you even begin bench-scale testing. Trying to force an extraction technology on a project is akin to the square peg round hole analogy.
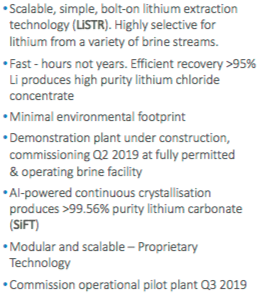
Going back to your question, our patent-pending selective extraction, technology, we call “LiSTR” vis-a-vis a typical Argentine brine project that would use either solar evaporation ponds or a modified version of solar evaporation with ion exchange. As I mentioned, the project drives the process.
Mintak: It rains in south Arkansas, the land is hilly and forested, evaporation ponds are not an option. There has been significant work done over the years, by researchers, universities, large chemical companies etc. on lithium extraction processes and so we stand on the shoulders of giants or as we like to say, ‘we are boldly going where others have already gone’.
A unique advantage in south Arkansas is access to large volumes of raw brine to process test. Unlike our peers, we can literally open a spigot and fill large IBC’s or totes with brine and ship to our facility for process testing. We do not need to permit a well, or get extraction permits. This cut months off the development timeline and allowed us to test a number of existing extraction processes including, but not limited to; solvent extraction, a variety of ion exchange resins, nanofiltration, and floatation.
Through this test work, we have developed a proprietary process that uses a solid ceramic adsorbent material with a crystal lattice that is capable of selectively pulling Li + ions from the waste brine after it has gone through the bromine-extraction step. The ceramic adsorbent materials are mounted in stirred-tank reactors that contain brine. In the second step, the adsorbent releases the Li + ions for recovery. Importantly, the Li-extraction process takes advantage of the fact that the brine leaves the bromine process heated to ~70°C.
This means that no additional energy is required, the reaction kinetics for the adsorption is suitable. The process is capable of reducing the time required for Li extraction from many months (with the evaporation ponds) to hours, and is capable of producing a high-purity lithium chloride solution for further processing into battery quality compounds. The LiSTR process is designed to be scalable at each stage, from bench scale – mini-pilot- demonstration – commercial. We are using technologies and processes used in other industries, we are not reinventing the wheel, just turning it.
Epstein: How might your cap-ex compare to that of lithium brine projects? For instance, there are 6 projects at PEA-stage, or more advanced, with an average cap-ex of C$540M:
Mintak: We have not published a PEA, so I cannot comment directly on cost comparisons other than pointing to the existing infrastructure at the project. The well-fields are in place and currently producing and circulating 125 million barrels of brine annually. The pipelines are in place, as is power and water. Road and rail is at the site. This is a bolt-on technology to existing chemical plants.
Epstein: How might your op-ex/tonne compare to that of lithium brine projects?
Mintak: Again, we have not yet published a PEA, but we are targeting the lowest quartile cost of production for lithium carbonate. We have confidence that this is achievable as the primary cost inputs are very attractive in south Arkansas, power and water are plentiful and inexpensive. Chemical reagents are produced in or shipped in close proximity to south Arkansas, the region is well connected to the Houston shipping channel. At the project level, we can leverage the buying power of a global chemical company when procuring materials and service agreements.
Epstein: Please describe who LANXESS is. In what ways (if any) is LANXESS already helping you?
Mintak: LANXESS is a global specialty chemical company based in Cologne, Germany. They operate 74 chemical plants around the world, 19,000 employees. 2017 revenue around $11 billion. They acquired Chemtura in 2017 for $2.57 billion which included the Arkansas bromine business.
Current land operations in southern Arkansas encompass more than 150,000 acres, 10,000 brine leases, and surface agreements and 250 miles of pipelines. Their three bromine extraction plants currently employ approximately 500 people and they process and reinject 125 million barrels of brine annually (over 5 billion gallons)
We have signed a binding MOU and a general term sheet for a planned JV with LANXESS for the phased development of the south Arkansas project with the goal of producing battery quality lithium materials on a mass scale from brine that is a by-product of existing bromine production facilities run by LANXESS and from 30,000 acres of undeveloped brine leases that Standard Lithium holds.
As part of the binding MOU, we will locate and operate our pilot plant at one of LANXESS’ chemical plants in south Arkansas. We will connect the plant into their brine pipeline system, post bromine extraction, and demonstrate (on a continuous basis) our selective lithium extraction process. We will also be locating our AI-powered lithium carbonate crystallization pilot plant at the site in south Arkansas.
The MOU we have struck with LANXESS allows us to leverage their massive infrastructure investment to de-risk our processing technology without having to spend 10’s of millions of dollars on resource development and the years of time that would entail. The planned JV with LANXESS includes a commitment from them for commercial project financing (subject to proof of concept and a positive PFS). That is a very important differentiator between Standard Lithium and our peers.
Epstein: In addition to LANXESS, you have been working with a number of other parties, please explain.
Mintak: As a development company, managing the runway and executing on our business plan requires strategic planning. We have taken the stance that we can accomplish more and in a more cost-effective manner, through strategic partnerships and agreements. In south Arkansas, we secured the only available large brine lease package with our agreement with NYSE listed Tetra Technologies.
For our pilot plant development, we are working with two global brands, Salt Works Technologies in Richmond B.C. and Zeton in Burlington Ontario. For analytics and research, we are working with two professors from the fine chemical/pharma departments at the University of British Columbia.
Epstein: What’s the status of your pilot plant, and what are the next steps?
Mintak: Two pilot plants. We have two pilot plants in development. “LiSTR”, the selective extraction demonstration pilot plant is under construction in Burlington Ontario. Zeton is a global leader in pilot plant construction. The plant will be shipped from Zeton to south Arkansas in Q2 of this year and will be located at LANXESS’ Southern Bromine Extraction plant.
The site has virtually everything required to operate in place; steam, water, power, and the demo plant will connect to the existing brine feed and disposal pipeline system. We intend to run this plant in a continuous operating state, not in a batch process. We expect to run the plant through Q3/4 of 2019 and Q1 of 2020. The results of this work will feed into a Feasibility study targeted to be completed in Q2 2020.
The second pilot plant is our “SiFT” Lithium Carbonate Crystallisation Pilot Plant which is being built by Saltworks Technologies Inc., at their facility in Richmond, British Columbia, Canada. The crystallisation technologies used today in the industry were developed in the mid-twentieth century and are suited for producing technical grade compounds. As higher and higher purity compounds are needed by cathode makers the industry needs to evolve.
Mintak: The SiFT process has been developed by Prof. Jason Hein at the University of British Columbia and introduces advances and technologies from the pharma and fine chemical world to the lithium battery material world. It integrates Artificial Intelligence (AI) enabled high-speed, multi-image photo-microscopy and computer image recognition for crystal size and shape that acts like an auto-pilot, continually monitoring and optimizing the process. We have an operating prototype pilot plant that we are currently testing. The next step is to build a demonstration-scale plant that we will ship to Arkansas in the Q3 of 2019.
Epstein: Most conventional brine projects are planned for about 20,000-30,000 tonnes of Lithium Carbonate Equiv. (“LCE)/yr. Will your project be able to scale up to that range?
Mintak: Yes, that is an achievable production target based upon current commercial brine production volumes, with an expansion opportunity from our undeveloped brine leases.
Epstein: Please describe Standard Lithium’s near-term catalysts.
Mintak: The immediate near-term catalysts to watch for are a PEA in late Q1 or early Q2 and of course, our pilot plant(s) being moved to site and commissioned in the first half of this year. Investors can also expect further details on our strategic agreement with LANXESS.
Thank you Mr. Mintak for a detailed review of Standard Lithium (TSX-V: SLL) / (OTCQB: STLHF).
Peter Epstein – January 25, 2019
Disclosures: The content of this interview is for information only. Readers fully understand and agree that nothing contained herein, written by Peter Epstein of Epstein Research [ER], (together, [ER]) about Standard Lithium, including but not limited to, commentary, opinions, views, assumptions, reported facts, calculations, etc. is not to be considered implicit or explicit investment advice. Nothing contained herein is a recommendation or solicitation to buy or sell any security. [ER] is not responsible under any circumstances for investment actions taken by the reader. [ER] has never been, and is not currently, a registered or licensed financial advisor or broker/dealer, investment advisor, stockbroker, trader, money manager, compliance or legal officer, and does not perform market making activities. [ER] is not directly employed by any company, group, organization, party or person. The shares of Standard Lithium are highly speculative, not suitable for all investors. Readers understand and agree that investments in small cap stocks can result in a 100% loss of invested funds. It is assumed and agreed upon by readers that they will consult with their own licensed or registered financial advisors before making any investment decisions.
At the time this interview was posted, Peter Epstein owned shares in Standard Lithium and it was an advertiser on [ER]. Readers understand and agree that they must conduct their own due diligence above and beyond reading this article. While the author believes he’s diligent in screening out companies that, for any reasons whatsoever, are unattractive investment opportunities, he cannot guarantee that his efforts will (or have been) successful. [ER] is not responsible for any perceived, or actual, errors including, but not limited to, commentary, opinions, views, assumptions, reported facts & financial calculations, or for the completeness of this article or future content. [ER] is not expected or required to subsequently follow or cover events & news, or write about any particular company or topic. [ER] is not an expert in any company, industry sector or investment topic. [ER] may buy or sell shares in Standard Lithium and other advertising companies at any time.
- Is the price correction in gold already over?
- Please click here now. Double-click to enlarge. I told investors to prepare for a modest and healthy correction from the $1300 area, and that’s happened.
- Gold hasn’t even reached the first Fibonacci retracement line after staging a magnificent rally from the $1173 area. That’s a sign of immense technical strength.
- Please click here now. Double-click to enlarge. Silver has carved out a beautiful double bottom pattern. It’s now staging a textbook pullback to the neckline of that pattern.
- Whether the precious metals market correction is over or has a bit further to go is not important. What matters is the fundamental picture. That picture is healthy, and it’s about to get exponentially healthier.
- Please click here now. The odds of an import tax cut in the world’s most important gold market are higher now than at any point since the taxes were ramped up in 2012-2013.
- “You need the Indians to buy oil or gold.” – Jeff Currie, Global Head of Commodities Research, Goldman Sachs, Jan 16, 2019. Jeff says, “Buy commodities.”
- While senior citizens in the Western gold community may long for what is essentially a remake of the 1970s fear trade oriented gold market, today’s gold market is mainly about the rise of gold as a respected asset class. That’s being created by the ongoing rise of China and India as economic titans.
- Today’s Western fear trade for gold is more like icing on that cake than the centre stage price driver that it was in the 1970s.
- In a nutshell, a “goldaholic army” of three billion Chindian citizens is becoming wealthier at a very fast pace. That’s creating annual gold demand growth of 6%-8% that is essentially relentless. Mine supply can’t seem to grow more than 2%.
- It’s becoming a “no-brainer” that the gold price will rise consistently for decades to come, and probably for the next two centuries.
- The current price correction in gold is likely almost entirely due to the actions of Indian dealers operating on both China’s SGE and in Mumbai. They are in “quiet mode” ahead of the February budget that is expected to bring a significant cut in the import tax.
- In their eyes, there’s simply no point buying gold now when they can likely get it 5% cheaper in just a few weeks. Also, a duty cut would create a positive vibe amongst Indian citizens similar to the vibe created by Donald Trump’s MAGA program.
- The “minor” difference, of course, is that India is an gold-oriented emerging empire with the best citizen demographics and strongest GDP growth in the world. The bottom line: The current price correction in gold is probably the healthiest and most stable since the price corrections of 2003-2004.
- While today’s gold cake is Chindian, the icing is pretty tasty too. On that note, please click here now. Only 37% of America’s business leaders are optimistic. Top bank economists almost universally predict U.S. corporate earnings growth will fade from the 20%+ level to single digits and GDP will slide towards 1% by year-end.
- My recommendation for stock market investors is to focus on my short term guswinger.com signals for UDOW and SDOW while waiting for a major US business cycle trough. Once the trough happens (years from now) investors can begin accumulating big name US stocks using my unique pyramid generator to gracefully tranche into the market.
- US politicians promise citizens and corporations that enormous tariff taxes will “Make ‘Em Great”. This, while US blue collar workers are struggling with wages that are still below 1968 levels in real terms. These workers don’t need walls around an entitlements-themed ecosystem. They need serious tax cuts (all the way to zero) and they are just not happening.
- A single corporate tax cut to only the 20% level is not enough to make America great again, especially when there’s no corresponding chop in the size of government. Income tax, property tax, and capital gains tax need to be eliminated and replaced with a goods/service and financial transaction tax. That would reduce the size of the government dramatically and bring trillions of investment dollars roaring into the country.
- America could easily become a super-sized version of Switzerland, but in the eyes of its biggest hedge fund manager Ray Dalio, the country is instead staging an almost macabre debt-obsessed dance that ends with: Inflationary depression!
- America’s terrible population demographics and entitlements-oriented society are a giant drag on long term GDP growth. Business leaders know they can’t supply the government and the entitlements-obsessed citizens with anywhere near the amount of capital required to maintain this bizarre system.
- That’s spurring U.S. institutional interest in gold, and it’s happening as India’s government is about to follow China’s lead and endorse gold as a respected asset class.
- Gold is becoming an asset class like stocks and real estate that is not owned as a market “hedge” but for long term capital appreciation.
- Please click here now. Western institutional money has flowed into the key SPDR gold bullion ETF as the price has softly corrected from the $1300. That’s another sign of a very healthy market.
- Please click here now. Double-click to enlarge. As with gold, the correction in most gold stocks could be over! Note the bull wedge in play and the soft volume on the recent price decline. Now there’s a spike in volume and that could mark the end of price softness. A sell-off in the US stock market seems imminent, and I told gold stock enthusiasts in August to expect solid action from GDX in a stock market meltdown. That’s exactly what transpired… and the same thing is likely about to happen again!
Special Offer For Website Readers: Please send me an Email to freereports4@gracelandupdates.com and I’ll send you my free “Senior Gold Stock Superstars!” report. I highlight ten senior gold stocks that are poised to benefit from even a small gold price rally. I include key buy and sell tactics for both traders and investors!
Stewart Thomson
Graceland Updates
Email:
Risks, Disclaimers, Legal
Stewart Thomson is no longer an investment advisor. The information provided by Stewart and Graceland Updates is for general information purposes only. Before taking any action on any investment, it is imperative that you consult with multiple properly licensed, experienced and qualified investment advisors and get numerous opinions before taking any action. Your minimum risk on any investment in the world is: 100% loss of all your money. You may be taking or preparing to take leveraged positions in investments and not know it, exposing yourself to unlimited risks. This is highly concerning if you are an investor in any derivatives products. There is an approx $700 trillion OTC Derivatives Iceberg with a tiny portion written off officially. The bottom line:
Are You Prepared?
Last week we discussed the difference between a rally and bull market.
Gold stocks have been in a rally.
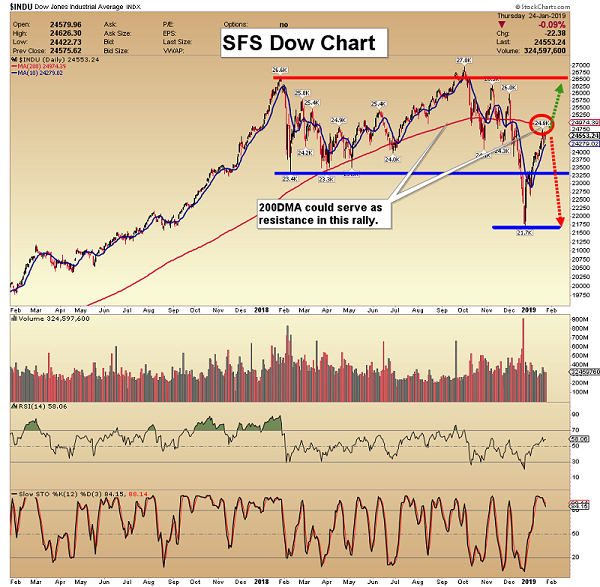
That rally is now over as gold stocks peaked at their 400-day moving averages days ago and sliced through their 200-day moving averages Friday.
Take a look at the charts of any gold stock index (GDX, GDXJ, HUI) and it’s clear they are in a downtrend.
Go back two to three years. You’ll see lower highs and lower lows. That’s a downtrend!
Until that changes, we have to respect that.
The change will come when the market knows the Fed is done hiking and anticipates the start of rate cuts.
Going back 65 years, I counted 13 times when the Fed went from rate hikes to rate cuts. The average gain in gold stocks during 11 of those periods was 172%.
The moves higher began an average and median of three to four months after the time of the last hike.
If the final hike is in March or June then the bull run should begin around the average time frame. If December 2018 was the final hike, then obviously the move higher could begin after the average or median period.
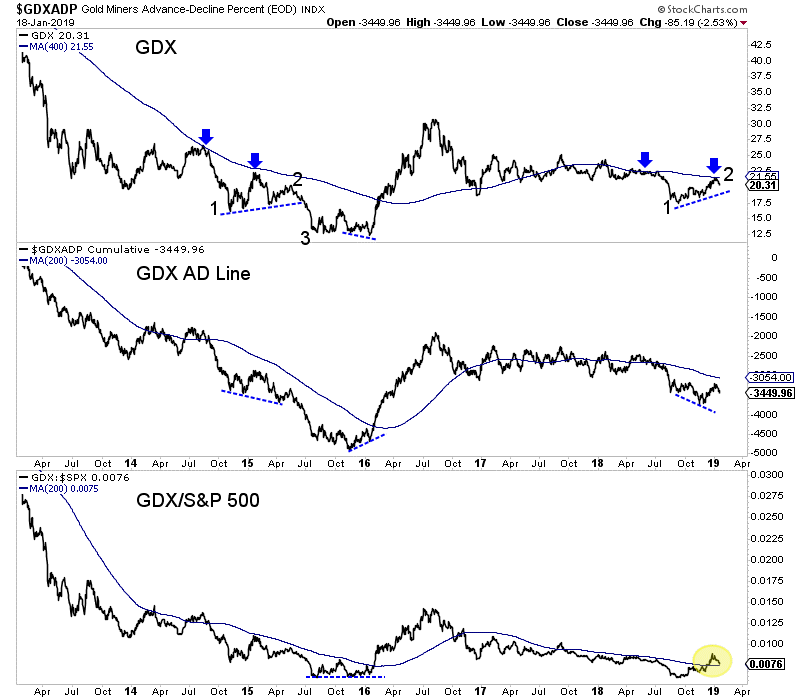
The immediate risk is the gold stocks could be starting another leg lower. In the chart below, we see similarities between GDX today and where it was in Q2 2015.
At both junctures the market had finished rallying after breaking down from a long consolidation. Note the points 1,2,3 and also the similarities in the advance-decline line. One positive difference is GDX relative to the stock market has surpassed its 200-day moving average.
In summation, we are looking for one more leg lower before a potential historic buying opportunity in precious metals. How much lower and for how long could depend on how soon the market is certain the Fed is done hiking.
There is no need to chase anything now as there will be plenty of time to get into cheap juniors that can triple and quadruple once things really get going. Recall that many juniors began huge moves months after epic sector lows in January 2016, October 2008, May 2005 and November 2000. Don’t chase the wrong stocks right now. To prepare yourself for some epic buying opportunities in junior gold and silver stocks, consider learning more about our premium service.
by Captain Ewave
Gold:
Short Term Update:
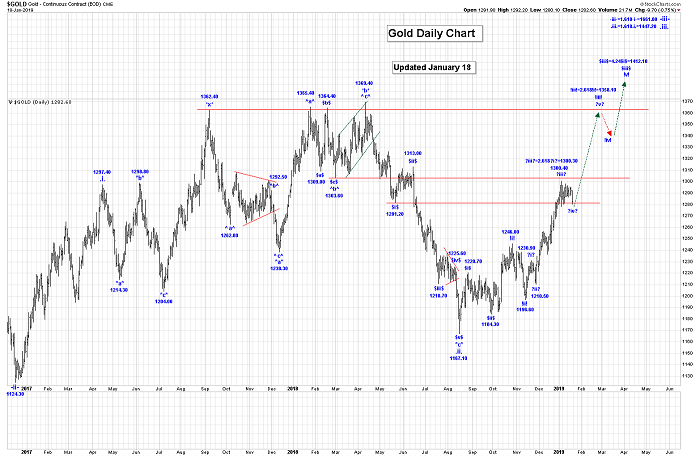
Within wave .iii. we continue to work on our first impulsive sequence, as shown on the daily gold chart.
We have taken a very bullish approach and are working on the assumption that only wave ?iii? ended at the 1300.40 high and that we are now correcting in wave ?iv?.
Our retracement levels for wave ?iv? are:
23.6% = 1279.20
38.2% = 1266.10
On the intraday chart it now looks like wave ?iv? has become more complex than just a simple bullish triangle, and we should expect gold to move back to at least the 1278.20 level, before wave ?iv? ends.
Wave ?iv? does include a small bearish triangle within its internal corrective pattern. Once wave ?iv? ends we expect another push higher in wave ?v? to complete all of !iii!. Our next projected target for the end of wave ?v? and !iii! is:
!iii! = 2.168!i! = 1358.40
We do have higher projections and wave .iii. should subdivide into a 5 wave impulsive sequence in its journey higher.
This triangle pattern will only be eliminated if we now trade below the 1278.10 low.
Even if this triangle pattern is eliminated the trading patterns on the intraday chart still suggest that the drop from the wave ?iii? high of 1300.40 is corrective, which supports higher prices ahead!
Our first projection for the end of wave .iii. is:
.iii. = 1.618.i. = 1447.20
Weekly Gold Chart:
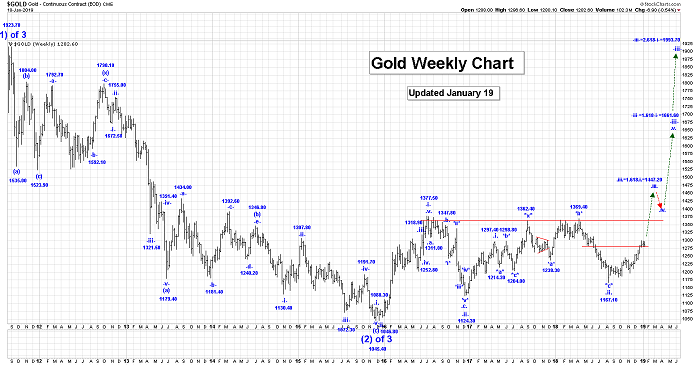
Longer term, our projections for the end of wave -iii-, as shown on this weekly gold chart, are:
-iii-=1.618-i-=1661.80
-iii-=2.618-i-=1993.70
Trading Recommendation: Go long gold. Use puts as stops.
Free Offer For Website Readers: Please send me an Email to admin@captainewave.com and I’ll send you our key “Silver Surge: Is This For Real?” report! We focus on a powerful silver stock as well as key short and long term charts for silver bullion. We include tactical approaches to make money on the current wave counts action!
Thank-you!
Captain Ewave & Crew
Email: admin@captainewave.com
Website: www.captainewave.com
Risk: CAPTAINEWAVE.COM IS AN IMPERSONAL ADVISORY SERVICE. AND THEREFORE, NO CONSIDERATION CAN OR IS MADE TOWARD YOUR FINANCIAL CIRCUMSTANCES. ALL MATERIAL PRESENTED WITHIN CAPTAINEWAVE.COM IS NOT TO BE REGARDED AS INVESTMENT ADVICE, BUT FOR GENERAL INFORMATIONAL PURPOSES ONLY. TRADING STOCKS DOES INVOLVE RISK, SO CAUTION MUST ALWAYS BE UTILIZED. WE CANNOT GUARANTEE PROFITS OR FREEDOM FROM LOSS. YOU ASSUME THE ENTIRE COST AND RISK OF ANY TRADING YOU CHOOSE TO UNDERTAKE. YOU ALSO AGREE TO BEAR COMPLETE RESPONSIBILITY FOR YOUR INVESTMENT RESEARCH AND DECISIONS AND ACKNOWLEDGE THAT CAPTAINEWAVE.COM HAS NOT AND WILL NOT MAKE ANY SPECIFIC RECOMMENDATIONS OR GIVE ADVICE TO YOU OR ANY OF ITS CLIENTS UPON WHICH THEY SHOULD RELY. CAPTAINEWAVE.COM SUGGESTS THAT THE CLIENT/MEMBER TEST ALL INFORMATION AND TRADING METHODOLOGIES PROVIDED AT OUR SITE THROUGH PAPER TRADING OR SOME OTHER FORM OF TESTING. CAPTAINEWAVE.COM, ITS OWNERS, OR ITS REPRESENTATIVES ARE NOT REGISTERED AS SECURITIES BROKER-DEALERS OR INVESTMENT ADVISORS EITHER WITH THE U.S. SECURITIES AND EXCHANGE COMMISSION OR WITH ANY STATE SECURITIES REGULATORY AUTHORITY. WE RECOMMEND CONSULTING WITH A REGISTERED INVESTMENT ADVISOR, BROKER-DEALER, AND/OR FINANCIAL ADVISOR. IF YOU CHOOSE TO INVEST WITH OR WITHOUT SEEKING ADVICE FROM SUCH AN ADVISOR OR ENTITY, THEN ANY CONSEQUENCES RESULTING FROM YOUR INVESTMENTS ARE YOUR SOLE RESPONSIBILITY.
ALL INFORMATION POSTED IS BELIEVED TO COME FROM RELIABLE SOURCES. CAPTAINEWAVE.COM DOES NOT WARRANT THE ACCURACY, CORRECTNESS, OR COMPLETENESS OF INFORMATION AVAILABLE FROM ITS SERVICE AND THEREFORE WILL NOT BE LIABLE FOR ANY LOSS INCURRED. DUE TO THE ELECTRONIC NATURE OF THE INTERNET, THE CAPTAINEWAVE.COM WEBSITE, ITS E-MAIL & DISTRIBUTION SERVICES AND ANY OTHER SUCH “ALERTS” COULD FAIL AT ANY GIVEN TIME. CAPTAINEWAVE.COM WILL NOT BE RESPONSIBLE FOR UNAVAILABILITY OF USE OF ITS WEBSITE, NOR UNDELIVERED E-MAILS, OR “ALERTS” DUE TO INTERNET BANDWIDTH PROBLEMS, EQUIPMENT FAILURE, OR ACTS OF GOD. CAPTAINEWAVE.COM DOES NOT WARRANT THAT THE TRANSMISSION OF E-MAILS, OR ANY “ALERT” WILL BE UNINTERRUPTED OR ERROR-FREE. CAPTAINEWAVE.COM WILL NOT BE LIABLE FOR THE ACTS OR OMISSIONS OF ANY THIRD PARTY WITH REGARDS TO CAPTAINEWAVE.COM DELAY OR NON-DELIVERY OF THE CAPTAINEWAVE.COM NIGHTLY EMAILS OR “ALERTS”. FURTHER, WE DO NOT RECEIVE ANY FORM OF PAYMENT OR OTHER COMPENSATION FOR PUBLISHING INFORMATION, NEWS, RESEARCH OR ANY OTHER MATERIAL CONCERNING ANY SECURITIES ON OUR SITE OR PUBLISH ANY INFORMATION ON OUR SITE THAT IS INTENDED TO AFFECT OR INFLUENCE THE VALUE OF SECURITIES.
THERE IS NO GUARANTEE PAST PERFORMANCE WILL BE INDICATIVE OF FUTURE RESULTS. NO ASSURANCE CAN BE GIVEN THAT THE RECOMMENDATIONS OF CAPTAINEWAVE.COM WILL BE PROFITABLE OR WILL NOT BE SUBJECT TO LOSSES. ALL CLIENTS SHOULD UNDERSTAND THAT THE RESULTS OF A PARTICULAR PERIOD WILL NOT NECESSARILY BE INDICATIVE OF RESULTS IN FUTURE PERIODS. THE RESULTS LISTED AT THIS WEBSITE ARE BASED ON HYPOTHETICAL TRADES. PLAINLY SPEAKING, THESE TRADES WERE NOT ACTUALLY EXECUTED. HYPOTHETICAL OR SIMULATED PERFORMANCE RESULTS HAVE CERTAIN INHERENT LIMITATIONS. UNLIKE AN ACTUAL PERFORMANCE RECORD, SIMULATED TRADES DO NOT REPRESENT ACTUAL TRADING. ALSO, SINCE THE TRADES HAVE NOT ACTUALLY BEEN EXECUTED, THE RESULTS MAY HAVE OVER OR UNDER COMPENSATED FOR THE IMPACT, IF ANY, OF CERTAIN MARKET FACTORS SUCH AS LACK OF LIQUIDITY. YOU MAY HAVE DONE BETTER OR WORSE THAN THE RESULTS PORTRAYED. NO REPRESENTATION IS BEING MADE THAT ANY ACCOUNT WILL OR IS LIKELY TO ACHIEVE PROFITS OR LOSSES SIMILAR TO THOSE SHOWN. NO INDEPENDENT PARTY HAS AUDITED THE HYPOTHETICAL PERFORMANCE CONTAINED AT THIS WEBSITE, NOR HAS ANY INDEPENDENT PARTY UNDERTAKEN TO CONFIRM THAT THEY REFLECT THE TRADING METHOD UNDER THE ASSUMPTIONS OR CONDITIONS SPECIFIED HEREAFTER. WHILE THE RESULTS PRESENTED AT THIS WEBSITE ARE BASED UPON CERTAIN ASSUMPTIONS BELIEVED TO REFLECT ACTUAL TRADING CONDITIONS, THESE ASSUMPTIONS MAY NOT INCLUDE ALL VARIABLES THAT WILL AFFECT, OR HAVE IN THE PAST AFFECTED, THE EXECUTION OF TRADES INDICATED BY CAPTAINEWAVE.COM. THE HYPOTHETICAL RESULTS ON THIS WEBSITE ARE BASED ON THE ASSUMPTION THAT THE CLIENT BUY AND SELLS THE POSITIONS AT THE OPEN PRICE OF THE STOCK. THE SIMULATION ASSUMES PURCHASE AND SALE PRICES BELIEVED TO BE ATTAINABLE. IN ACTUAL TRADING, PRICES RECEIVED MAY OR MAY NOT BE THE SAME AS THE ASSUMED ORDER PRICES.
Gold investment demand reversed sharply higher in recent months, fueling a strong gold rally. The big stock-market selloff rekindled interest in prudently diversifying stock-heavy portfolios with counter-moving gold. These mounting investment-capital inflows into gold are likely to persist and intensify. Both weaker stock markets and higher gold prices will continue to drive more investment demand, growing gold’s upleg.
Early in Q4’18, gold reached a major inflection point. It languished during the first three quarters of 2018, down 8.5% year-to-date by the end of Q3. Investors wanted nothing to do with alternative investments with the stock markets powering to new record highs. The flagship S&P 500 broad-market stock index (SPX) had rallied 9.0% in the first 3/4ths of last year. That left gold deeply out of favor heading into Q4.
But a critical psychological switch was flipped as the SPX started sliding last quarter. After long years with little material downside, stock traders had been lulled into overpowering complacency. They were shocked awake as the SPX plunged 14.0% in Q4, its worst quarter since Q3’11. They poured back into gold as stocks burned, driving it a strong 7.6% higher in Q4! Rekindled investment demand was the driver.
Unfortunately gold investment demand is rather murky. Gold is bought and sold every day all over the world, in countless venues ranging from major exchanges to tiny third-world merchants. Tracking even the majority of this in real-time is impossible. The best-available data on global gold investment comes from the World Gold Council. But it is only published once per quarter, about a month after quarter-ends.
I can’t wait to see the WGC’s new Q4’18 Gold Demand Trends report due out in early February. These quarterly GDTs are very well done and essential reading for all investors. But while detailed and informative, their resolution is really low only being released 4 times per year. Investors need alternative data sources to understand and game what’s going on with gold investment demand between the GDTs, like now.
Thankfully there’s an excellent proxy of investors’ capital flows into and out of gold published daily, a high-resolution read. It is the physical gold bullion held in trust for the shareholders of the world’s dominant gold exchange-traded fund. That of course is the American GLD SPDR Gold Shares. GLD was created and launched by the World Gold Council way back in November 2004, and has grown into a gold juggernaut.
As part of the WGC’s GDT work each quarter, it tracks the world’s top 10 physically-backed gold ETFs. At the end of Q3’18 when you could hardly give away gold to American investors, GLD’s holdings still accounted for nearly 32% of the world’s top-10 gold-ETF total. Add in the 2nd-largest ETF which is also American, the IAU iShares Gold Trust, and these two leading ETFs control over 3/7ths of the global top-10 total.
The primary constituency for American gold ETFs is American stock investors. So what they are doing in terms of capital flows through GLD especially is exceedingly important for gold. In recent years most of the major quarterly moves in gold prices are nearly fully explainable by GLD’s holdings alone! They must be watched daily, as changes in them have proven the key to gold’s fortunes. It’s important to understand why.
The American stock markets are the biggest in the world, and American investors’ capital is vast beyond compare. At the end of Q3’18, the collective market capitalization of the 500 elite SPX stocks alone was a staggering $26,141.4b. By comparison, GLD’s total physical-gold-bullion holdings of 742.2 metric tons were only worth $28.4b. That’s less than 1/9th of a single percent, which for all intents and purposes is zero.
Thus if even the tiniest fraction of U.S. stock-market capital migrates into or out of GLD shares, gold itself moves big. This dominant gold ETF effectively acts as a conduit between stock-market capital and gold. But as these colossal pools of capital slosh into and out of GLD, it is always at risk of failing its mission of tracking the gold price. The supply and demand of GLD shares and gold are independent of each other.
So differential buying or selling of GLD shares by American stock investors must be directly equalized into the underlying global gold market. This mechanism is simple in concept. When GLD shares are being bought faster than gold itself, this ETF’s price threatens to decouple from gold’s price to the upside. To prevent this, GLD’s managers need to shunt that excess GLD-share demand directly into gold in real-time.
They issue enough new GLD shares to offset that excess demand, and then use the proceeds to buy physical gold bullion held in trust for GLD’s shareholders. So when GLD’s daily holdings are rising, that reveals American stock-market capital is flowing into gold. This GLD capital pipeline into gold also works similarly on the downside, when American stock investors dump GLD shares faster than gold is being sold.
GLD’s share price will soon disconnect from gold’s price to the downside. This ETF’s managers avoid that by buying back GLD shares to sop up the excess supply. They raise the capital to do this by selling some of GLD’s physical-gold-bullion holdings. So when GLD’s daily holdings are falling, American stock-market capital is being pulled back out of gold. These holdings closely mirror world gold-investment trends.
My chart this week compares GLD’s daily gold holdings in metric tons with the gold price over the past several years or so. After falling to a major 6.1-year secular low in December 2015, gold started powering higher in a new bull market. Since gold hasn’t retreated 20%+ from its bull-to-date peak in July 2016, this bull remains alive and well. It has been overwhelmingly driven by American stock-market capital flows via GLD.

Let’s start in the middle of 2018, when GLD’s holdings were stable above 800t which has proven major support for this bull market. In much of the first half of last year, the stock markets were largely grinding sideways after the SPX suffered a sharp-yet-shallow-and-short correction in early February. The SPX finally started climbing decisively again in early Q3, ultimately achieving 5 new all-time record highs in that quarter.
That stoked incredible euphoria, convincing investors these amazing stock markets could rally indefinitely. By late September the SPX had skyrocketed 333.2% higher over 9.5 years, making for the 2nd-largest and 1st-longest stock bull in U.S. history! With general stocks looking invincible, there was little incentive to prudently diversify stock-heavy portfolios with gold. American stock investors were actually fleeing it.
In Q3 they sold GLD shares so aggressively that it forced a serious 76.8t or 9.4% draw in GLD’s holdings! All that selling pressure pushed world gold prices 4.9% lower that quarter. And GLD alone was mostly responsible. The WGC’s Q3 GDT showed total global gold demand actually grew a slight 0.6% year-over-year that quarter to 964.3t. Every major demand category grew considerably with a lone exception.
Global investment demand plunged 20.8% YoY to 194.9t. The WGC breaks it out into two major sub-categories, physical bar-and-coin demand and gold-ETF demand. The former was very strong, surging 28.0% YoY to 298.1t. But the latter plummeted from +13.2t in Q3’17 to -103.2t in Q3’18! Gold would’ve rallied nicely that quarter if not for GLD, which accounted for a commanding 2/3rds of that total world ETF drop.
When American stock investors are sustaining selling GLD shares faster than gold is being sold, it forces the world gold price lower. That serious Q3’18 GLD-holdings draw was the worst by far since back in Q4’16. That was when Trump’s surprise election victory with Republicans controlling both chambers of Congress ignited a major stock-market rally on hopes for big tax cuts soon. The resulting euphoria hammered gold.
While the SPX only climbed 3.3% in Q4’16, 8 new all-time record highs were achieved. American stock investors jettisoned gold with reckless abandon, both to chase that stock surge and out of relief that the political uncertainty didn’t trigger a stock selloff as feared. The differential GLD-share selling proved so intense that this ETF suffered a colossal 125.8t or 13.3% holdings draw, which crushed gold 12.7% lower!
Total world gold demand per the latest WGC GDT dropped 103.4t or 9.0% YoY that quarter. That huge GLD draw alone was 122% of that! Overall global gold-ETF demand fell 107.0t from -66.4t in Q4’15 to -173.4t in Q4’16. GLD’s draw was 118% of that. So literally the only reason gold plunged in Trump’s election quarter was American stock investors pulling big capital out of GLD forcing it to sell physical gold bullion.
Compared to that extreme dump, gold was relatively resilient in Q3’18. While GLD’s draw ran 61% of that Q4’16 episode, gold only declined 39% as much. There were hints the stock markets were ready to roll over into a long-overdue new bear. On Q3’s final trading day with the SPX just under its recent record peak, I published an essay explaining why Q4’s first-ever full-speed Fed QT was this stock bull’s death knell.
Indeed within a week of Fed QT ramping up to $50b per month of monetary destruction, the SPX started to falter. Its first serious down day erupted on October 10th when this leading stock-market benchmark plunged 3.3%. That triggered a major sentiment shift in gold. GLD enjoyed a large 1.2% holdings build that day on heavy differential GLD-share buying. Those were its first capital inflows at all since late July.
That very day American stock investors’ faith in perpetually-levitating stock markets started to crack, they started remembering gold. As Q4 wore on and that SPX selloff snowballed into a 4%+ pullback, a 10%+ correction, and narrowly missed new-bear-market territory at -19.8% on Christmas Eve, gold investment demand continued growing. Tending to rally when stocks fall, gold is essential for wisely diversifying portfolios.
By the time the dust settled on Q4, American stock-market capital sloshing back into gold via that GLD conduit had fueled a 45.4t or 6.1% holdings build. That was the biggest by far since way back in Q2’16 soon after this latest gold bull was born. All that differential GLD-share buying forced gold 7.6% higher in Q4 as the SPX plunged 14.0%. The WGC’s coming Q4’18 GDT will likely prove GLD largely drove gold’s gains.
The last time American stock investors started returning to gold after stock-market corrections spooked them was in the first half of 2016. Remember gold had just slumped to a major 6.1-year secular low, so it was deeply out of favor suffering incredibly-bearish sentiment. Yet in Q1’16 GLD’s holdings skyrocketed an epic 176.9t of 27.5% higher, which catapulted gold up 16.1%. Nothing else mattered per the WGC.
Overall world gold demand soared 188.1t or 17.1% YoY that quarter. GLD’s enormous build driven by American stock investors returning to gold accounted for an amazing 94% of that! If their vast pools of capital hadn’t sloshed back into gold via GLD that quarter, this bull never would’ve been born. And that utter dominance of American stock-market-capital inflows through GLD persisted in the subsequent quarter.
In Q2’16 gold surged another 7.4% higher on a 130.8t or 16.0% GLD-holdings build. The WGC reports that total world gold demand climbed 123.5t or 13.2% YoY that quarter. GLD’s huge build alone was responsible for 106% of that. So again without American stock-market capital moving into gold through that leading GLD conduit, that initial gold-bull upleg wouldn’t even exist. GLD dominates the gold world.
There have been 13 quarters since Q4’15 when today’s gold bull was born. 8 of them have seen major gold moves higher or lower. In all but one of these cases, GLD’s builds or draws accounted for the vast majority of the overall yearly change in total world gold demand. In the remaining 5 quarters where gold ground sideways or moved comparatively modestly, GLD’s holdings didn’t change very much either.
So there’s no doubt GLD’s strong build in Q4’18 ignited and fueled by this new SPX selloff is an important omen for gold. Once American stock investors start buying gold again via GLD shares in a big way, the resulting major gold uplegs tend to become self-feeding. Investors love chasing performance. The higher gold rallies, the more stock investors want to own GLD. And the more GLD they buy, the faster gold climbs.
And while correction-grade 10%+ stock-market selloffs are the catalysts that trigger renewed investment demand for gold, it usually persists well after the SPX bottoms and bounces. In essentially the first half of 2016, gold blasted 29.9% higher in just 6.7 months. That was totally fueled by an epic 351.1t or 55.7% build in GLD’s holdings as American stock investors rushed back into gold. That upleg peaked in early July.
But the 13.3% SPX correction that spawned it actually bottomed in mid-February. Over the following 4.9 months leading into gold’s top, the SPX blasted 16.4% higher! Nearly 3/4ths of gold’s upleg duration came after the stock selloff that ignited it, and just over 3/4ths of GLD’s upleg build also happened after the SPX had bottomed. Major gold uplegs take on a life of their own after being triggered by stock selloffs.
So even if today’s stock selloff ended at a severe correction on Christmas Eve and this record bull still has farther to run, gold investment demand should remain strong on upside momentum. But far more likely the long-overdue young new stock bear is being born. The SPX’s enormous and violent surge since that deep Christmas Eve low looks exactly like a classic bear-market rally technically, an ominous sign.
Bear-market rallies are the biggest and fastest ever witnessed in all of stock-market history. They soar out of major lows in sharp V-bounces on frantic short covering, then gradually run out of momentum over a couple to few weeks. If the stock markets are indeed rolling over into a new bear, far more weakness is guaranteed over the next couple years or so. That will fuel sustained gold-investment-demand growth.
Bear markets in stocks following major bulls are nothing to be trifled with. The last couple bears in the early and late 2000s saw the SPX fall 49.1% over 2.6 years and 56.8% over 1.4 years! 50% bears are common and expected after large bulls. And if we are early in the next bear, gold will likely be the top-performing asset class while it runs its course. American stock investors buying GLD shares will lead the way.
So far in January 2019, this huge apparent bear-market rally in the SPX has stalled investment demand for gold. Like many bear rallies, it has rekindled great greed and complacency. So GLD hasn’t experienced many significant builds yet in this young new year. But those capital inflows will return with a vengeance once the SPX starts rolling over and weakening again, likely driving gold sharply higher like in early 2016.
Again that sustained investment demand in H1’16 catapulted the yellow metal 29.9% higher pretty much exclusively on differential GLD-share buying. A mere 20% upleg off gold’s recent mid-August low driven by record gold-futures short selling would catapult it back up over $1400. Anything above the bull-to-date peak of $1365 in July 2016 is going to unleash a flood of new investor excitement in gold and big demand.
So this gold bull is likely to grow a lot larger in coming quarters. The greatest beneficiaries will be the gold miners’ stocks, as their profits leverage gold’s gains. Roughly during that mostly-H1’16 major gold upleg, the leading GDX and GDXJ gold-stock ETFs rocketed 151.2% and 202.5% higher! The better gold stocks with good fundamentals are going to soar again during gold’s next upleg, which is already well underway.
The earlier you get deployed, the greater your gains will be. That’s why the trading books in our popular weekly and monthly newsletters are currently full of better gold and silver miners mostly added in recent months. The gains we won in 2016 were amazing the last time American stock investors returned to gold. Our newsletter stock trades that year averaged +111.0% and +89.7% annualized realized gains respectively!
The gold-stock gains should be similarly huge in this next major gold upleg. The gold miners are the last undervalued sector in these still-very-expensive stock markets, and rally with gold during stock-market bears unlike anything else. To multiply your wealth in the stock markets you have to do your homework and stay abreast, which our newsletters really help. They explain what’s going on in the markets, why, and how to trade them with specific stocks. You can subscribe today for just $12 per issue!
The bottom line is gold investment demand began surging again in Q4, ignited by that major stock-market selloff. American stock investors started remembering gold, returning to GLD to diversify their portfolios which drove gold sharply higher. Once gold begins returning to favor after such major inflection points, its uplegs tend to grow large. Investment buying is self-feeding, with higher gold prices enticing in ever more capital.
Gold buying begets gold buying long after stock markets bounce, as investors love chasing performance. But odds are these lofty stock markets are now rolling over into a major new bear, portending much more weakness to come. Gold investment demand will thrive for years in that scenario, catapulting both gold and the stocks of its miners far higher. There’s no better place to multiply wealth during bear markets.
Adam Hamilton, CPA
January 21, 2019
Copyright 2000 – 2019 Zeal LLC (www.ZealLLC.com)
- “Some analysts believe China could deliver 2 trillion yuan ($296.21 billion) worth of cuts in taxes and fees, and allow local governments to issue another 2 trillion yuan in special bonds largely used to fund key projects.” – CNBC News, Jan 15, 2019.
- China’s economy is likely to grow in the 6.2%-6.5% range for 2019 and the stimulus is inflationary. While that growth is the slowest pace in almost thirty years, it’s still “head and shoulders” above the horrifying meltdown in growth that the United States is likely about to experience.
- Please click here now. Goldman is predicting a meltdown in U.S. earnings growth from 20%+ in 2018 to just 3% to 6% for 2019!
- Goldman’s heavyweight analysts are also predicting that US GDP growth melts towards 1% by the third quarter of this year. This, while Morgan Stanley is predicting an “earnings recession”.
- Germany’s economy is already slipping towards 1% GDP growth and EU earnings are unlikely to grow more 5% in 2019.
- Interestingly, most big bank economists are predicting an uptick in inflation will accompany the slide in Western earnings and GDP growth. Clearly, all roads lead to…gold!
- On that note, please click here now. Double-click to enlarge. Gold continues to perform remarkably well at a time when a substantial pullback would be expected.
- Conspiracy buffs are waiting for the “banksters” to smash the gold price. Where is the smash? Well, it doesn’t exist. All that’s happening is mild consolidation.
- A pullback to key Fibonacci retracement lines in the $1250-$1260 area would be healthy but even that may not happen. Current technical action indicates a very healthy gold market.
- Please click here now. Gold has raced to an all-time high against the Australian dollar. There’s a loose triangle pattern in play. The target of that pattern is well above $2000.
- It’s very important for gold stock enthusiasts to make some effort to own at least a few Australian gold stocks that trade on Australian markets. Many of these stocks have been in powerful uptrends for years and are likely in a new acceleration phase.
- Gold is also doing well against the British Pound and the Cbone (Canadian dollar). Most of the world’s gold stocks trade on the Canadian stock market and a lot of them are beginning to show good technical action.
- Please click here now. Double-click to enlarge. The paint is barely dry on the Barrick-Rangold merger, and now Newmont is buying Goldcorp!
- When mergers or takeovers happen, I like to see the new entity prove itself technically, with momentum. In the case of Barrick (GOLD-NYSE), I’ve suggested that investors need to see a weekly close of $14 for that to happen.
- For Newmont, I need to see a weekly close of $36. That would suggest institutional money managers are endorsing the new entity. Once that happens I would be a buyer of every dollar of price weakness in the stock.
- Both Barrick and Newmont are key GDX components. I’m impressed with the relative strength of GDX in the face of the softness in both those stocks.
- Please click here now. Double-click to enlarge. While GDX “should” pull back to about $20 from the current price zone, the technical action is superb.
- Note the fade in volume as price drifts sideways in the $21.50 resistance area. That’s extremely positive. Eager accumulators should be buyers of every ten cents of price weakness between $21 and $20.
- Once the current consolidation ends, I’m anticipating a surge to the $23 price area… on strengthening volume.
- Goldman’s influential gold market analyst Jeff Currie has a new $1425 target for gold in 2019. That’s an important number, because most gold and silver miners have made a significant effort to reduce their AISC (all-in sustaining cost) numbers.
- A gold price in the $1400+ area would turn many of these companies into “cash cows”… and do so at a time when most companies in America face an earnings and revenue meltdown.
- An institutional stampede into gold stocks in this new and emerging situation is not a pipe dream. It’s becoming more of a probable event than just a potential scenario.
- Please click here now. Double-click to enlarge. My weekly gold chart shows that $1300 resistance is merely a pitstop on the road to the inverse H&S bottom neckline at about $1392.
- If Goldman’s $1425 target price is achieved in 2019, it would mean gold has traded well above the neckline, ushering in a new target zone of about $1750. That $1750 price would turn most gold miners into not just cash cows, but cash cow superstars!
Special Offer For Website Readers: Please send me an Email to freereports4@gracelandupdates.com and I’ll send you my free “Golden Sweet Spot” report. I highlight six gold stocks trading the $3 to $7 price range that give investors an ideal mix of managed risk and potentially enormous reward! I include key buy and sell points for each stock.
Stewart Thomson
Graceland Updates
Email:
Risks, Disclaimers, Legal
Stewart Thomson is no longer an investment advisor. The information provided by Stewart and Graceland Updates is for general information purposes only. Before taking any action on any investment, it is imperative that you consult with multiple properly licensed, experienced and qualified investment advisors and get numerous opinions before taking any action. Your minimum risk on any investment in the world is: 100% loss of all your money. You may be taking or preparing to take leveraged positions in investments and not know it, exposing yourself to unlimited risks. This is highly concerning if you are an investor in any derivatives products. There is an approx $700 trillion OTC Derivatives Iceberg with a tiny portion written off officially. The bottom line:
Are You Prepared?
Gold miners’ exchange-traded funds are surging with gold powering higher. These mounting gains are naturally fueling growing interest in the leading gold-stock investment vehicles. Traders looking to deploy capital are wondering which major gold-stock ETF is superior, offering the best balance between upside potential, component fundamentals, and risks. GDXJ takes the crown, besting its larger big brother GDX.
By my count, there are currently 14 gold miners ETFs trading in U.S. markets. But that’s not authoritative, as the broader ETF industry is constantly in flux. These gold-stock ETFs collectively held $17.5b in net assets as of the middle of this week. And two major ETFs utterly dominated, commanding fully 85.1% of all those gold-stock investments! They are of course GDX and GDXJ, which dwarf everything else in this sector.
The GDX VanEck Vectors Gold Miners ETF and GDXJ VanEck Vectors Junior Gold Miners ETF hold net assets of $10.6b and $4.4b, or 60.2% and 24.9% of American gold-stock ETFs’ total. They have a huge and likely-insurmountable first movers’ advantage, being birthed way back in May 2006 and November 2009 respectively. They’ve gradually built great brand recognition, even being viewed as primary sector indexes.
When hedge funds report their equity holdings every quarter, if they have any gold-stock exposure GDX or GDXJ often top those lists. When gold miners are discussed on CNBC, GDX and to a lesser extent GDXJ are used in charts as sector benchmarks. VanEck’s popular pair of leading gold-miners ETFs are well-known to investors and speculators interested in this sector. They are effectively the only game in town.
With one company managing both GDX and GDXJ, and actively marketing them as a “Gold Miners ETF” and a “Junior Gold Miners ETF”, you’d think they are as different as their names imply. But unfortunately that’s not really the case. GDX and GDXJ hold many of the same component gold miners, with massive overlap in their holdings. And GDXJ’s definitely aren’t junior gold stocks, but actually larger mid-tier gold miners.
I’ve researched and written extensively on this. Every quarter I wade through the latest results from the top 34 component stocks of both GDX and GDXJ. The latest-available data is still Q3’18’s, as the full-year reports including Q4 aren’t due until 60 to 75 days after year-end depending on companies’ market capitalizations. As the recent Q3 earnings season wrapped up, GDXJ’s components were a subset of GDX’s.
GDXJ’s top 34 stocks accounted for 82.9% of its total weighting. And fully 31 of these components were also GDX components. These common gold miners across both ETFs weighed in at a massive 79.2% of GDXJ’s total weighting, and 31.7% of GDX’s. So nearly 4/5ths of this “Junior Gold Miners ETF” is made up by nearly 1/3rd of the major “Gold Miners ETF”. GDXJ is now a mid-tier gold miners ETF, not a junior one!
It wasn’t always this way, with GDXJ staying true to its advertised mission in its early years. But GDXJ became a victim of its own success in the first half of 2016. A young gold bull fueled skyrocketing gold-stock prices as traders flooded in to chase their rallies. GDXJ quickly grew so large that it risked running afoul of Canadian securities laws, where most of the world’s smaller gold miners’ and explorers’ stocks trade.
In the Canadian stock exchanges which are the centre of the junior-gold universe, an antiquated rule severely hobbles ETFs. Once any investor including ETFs acquires a 20%+ stake in any Canadian stock, it is legally deemed a takeover offer that must be extended to all shareholders! American stock-market capital flooding into GDXJ in early 2016 pushed many of its Canadian-junior ownership percentages near 20%.
Obviously hundreds of thousands of investors buying ETF shares have no intention of taking over gold-mining companies, no matter how big their collective stakes. That’s a totally-different scenario than a single corporate investor buying 20%+. Instead of lobbying Canadian regulators to exempt ETFs, GDXJ’s managers chose to unilaterally redefine what junior gold miners are. Stakes in Canadian juniors were slashed.
For decades juniors were often considered to be gold miners producing less than 200k ounces annually. To give GDXJ the benefit of the doubt, I conservatively expand that to 300k. That works out to 75k per quarter. In Q3’18, only 3 of the top 34 GDXJ component stocks were primary gold miners that met this junior threshold! The rest were mid-tier miners between 300k to 1m ounces per year, and even 1m+ majors.
GDXJ made these mission changes stealthily, knowing they would be controversial. It took me quarters to piece this all together, and I was an outspoken critic of the “Junior Gold Miners ETF” no longer being what it was billed as. But if you ignore the deceptive title, GDXJ has grown into an amazing mid-tier gold-miners ETF. It owns lots of the world’s best gold miners, which are given much-higher weightings than in GDX.
The mid-tier gold miners producing between 300k to 1m ounces per year are in the sweet spot for stock-price upside. Unlike the majors over 1m which are struggling with production declines, the mid-tiers are expanding existing mines and building new ones to boost their output and earnings. The mid-tier gold miners have smaller market caps too, making it much easier for capital inflows to bid up their stock prices.
Production is the lifeblood of the gold-mining industry, so traders often prize growth there above anything else when picking gold stocks. In Q3’18, the top 34 GDX gold miners including all the majors saw their total production decline 2.9% year-over-year to 9.5m ounces! That was stunning compared to the World Gold Council’s read on overall global gold mined that quarter, which actually grew a healthy 1.9% YoY.
GDX is heavily burdened by giant gold miners with shrinking production and high market caps, retarding its upside potential. GDXJ has some similar problems but to a lesser extent. Inexplicably GDXJ includes the major South African gold miners which are the worst in this industry for falling production and high mining costs. In Q3 four of them weighing in at 13.1% of GDXJ’s weighting suffered sizable production declines.
Excluding them and a fast-growing mid-tier gold miner that was oddly removed from GDXJ over the past year, the rest of the top 34 GDXJ gold miners achieved strong 3.4% YoY production growth in Q3! All the growth in the gold-mining industry is now coming from the mid-tier miners. GDXJ not only holds the best mid-tiers, but they have much-higher weightings than in the major-dominated GDX. GDXJ is the place to be.
In addition to the mid-tier gold miners’ growing production and lower market capitalizations, their mining costs are in line with the majors. In Q3 the top 34 GDX gold miners averaged all-in sustaining costs of $877 per ounce. The difference between that and prevailing gold prices shows industry profitability. The top 34 GDXJ gold miners had similar $911 AISCs in Q3. Without those South African majors, it was $877 too.
So if you can get past the fact GDXJ certainly isn’t a “Junior Gold Miners” ETF, it is superior to GDX in every way. The top 34 GDX stocks averaged 288.8k ounces mined in Q3, while GDXJ’s top 34 came in 43% lower at 163.3k. That’s still far above the 75k conservative junior threshold, but this mid-tier gold-miner range is where the vast majority of world production growth is happening. GDXJ action reflects this.
I’ve been writing about GDXJ outperforming GDX in my quarterly-results essays and newsletters for the better part of several years now. But until this week I hadn’t done the work to formally quantify GDXJ’s superior upside. I’ve been curious about it for some time, and have received more questions on it with gold stocks powering higher again. So I dug into this gold-stock bull’s GDXJ and GDX performances so far.
Since gold miners’ stocks are exceedingly volatile, bulls and bears in them are often delineated instead by gold itself. Today’s gold bull was born in December 2015 before surging in a powerful upleg in the first half of 2016. While gold has suffered a couple of serious corrections since, it never crossed that -20% new-bear threshold. So with gold in a continuous bull market for 3.1 years now, so too are the gold stocks.
They are effectively leveraged plays on gold since gold-mining profits directly amplify underlying moves in gold. The major gold stocks of GDX generally leverage gold uplegs and corrections by 2x to 3x. So if gold rallies 10%, GDX usually climbs 20% to 30%. Since GDX has become the leading benchmark for this entire sector, GDXJ’s performance is best considered relative to GDX’s. This chart summarizes it all.
GDX and GDXJ were both hammered to fundamentally-absurd all-time lows back in mid-January 2016 soon after gold’s own 6.1-year secular low. Ever since gold stocks have meandered in a series of bull-market uplegs and corrections. The performances of GDXJ and GDX in these recent years are rendered in blue and red below. Key stats are shown for each major gold ETF’s uplegs and corrections during that span.
The vertical light-blue lines divide up GDXJ’s uplegs and corrections, which generally match GDX’s but sometimes see major lows or highs out of sync. Each GDXJ upleg or correction shows GDXJ’s total gain or loss, the time that move took in months, GDX’s corresponding move over that identical span, and GDXJ’s leverage to GDX in yellow. The actual full GDX uplegs and corrections are also shown below in red.
Even in today’s young, delayed, mostly-unpopular, and weak gold-stock bull, GDXJ has outperformed GDX by a wide margin. And that’s despite GDXJ morphing from being a true junior-gold-miner ETF in the first half of 2016 to a mid-tier gold-miner ETF over the subsequent year. Even holding bigger gold miners, their superior fundamentals to the struggling majors have enabled GDXJ to keep the performance crown.
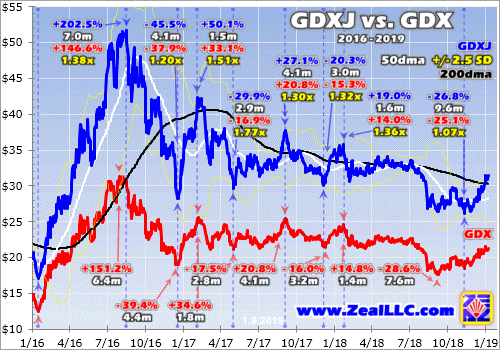
In just 6.4 months in largely the first half of 2016, gold stocks as measured by GDX skyrocketed 151.2% higher on a 29.9% gold upleg. GDXJ well-outperformed GDX in roughly that same span, blasting 202.5% higher in 7.0 months! GDX actually rallied 146.6% within GDXJ’s exact upleg, showing the mid-tier gold-stock ETF leveraged the major gold-stock ETF’s massive upleg by a solid 1.38x. GDXJ’s upside bested GDX’s.
Gold’s powerful initial upleg was followed by a massive correction in the second half of 2016, where it plunged 17.3% after Trump’s surprise election victory unleashed a huge stock-market surge on hopes for big tax cuts soon. The gold-stock carnage as gold plunged was great, with GDXJ plummeting 45.5% in just 4.1 months. Interestingly that leveraged GDX’s downside by 1.20x, much less than in the preceding upleg.
Ever since, the gold stocks have been mostly stuck in a big consolidation trading range. Enthusiasm for this sector waned to nothing as general stocks kept powering higher in recent years which relegated gold to drift sideways as well. While this extraordinary gold-stock-bull disruption was highly unusual, it was the result of record U.S. corporate tax cuts levitating the stock markets. That one-off event finally passed in 2018.
If you go through all this gold-stock bull’s uplegs, GDXJ’s gains outpaced GDX’s by an average of 1.39x! Ranging from 1.30x on the low side to 1.51x on the high side, there was not a single gold-stock upleg in recent years where GDXJ didn’t majorly outperform GDX. Taking GDX’s usual 2x to 3x leverage to gold and adding another 39% of marginal GDXJ gains on top of that is impressive. What trader wouldn’t want that?
GDXJ’s much-superior upside in this young bull is also accompanied by outsized downside relative to GDX during gold-stock corrections. That’s logical, as bigger mid-tier gold-stock gains in preceding uplegs leave more room to sell off in subsequent corrections. Interestingly though, GDXJ’s downside leverage averaging 1.34x is a bit lower than its upside leverage in uplegs. That is skewed to the high side as well.
It ranged from a low of 1.07x in the latest gold-stock selloff last summer and autumn to a staggering 1.77x in spring 2017. That outlier was the result of GDXJ’s gold miners surging far faster than GDX’s in early 2017. Without that anomaly, GDXJ’s downside leverage to GDX during corrections averages only 1.20x. That is merely about half its upside leverage, so GDXJ’s added risks are disproportionally smaller than its better upside.
Given all this, there is really no reason to bother with GDX at all if you are deploying capital in major gold-stock ETFs. GDXJ has better mid-tier gold miners growing their production while trading at lower market caps than the struggling majors. GDXJ has demonstrated much-better upside during gold-stock uplegs throughout this young bull, yet its downside during corrections isn’t proportional. GDXJ is far superior.
That being said, investors and speculators are much better off avoiding these major gold ETFs entirely! While GDXJ is nowhere near as bad as GDX, both are still burdened by major gold miners with declining production and rising costs. It doesn’t make any sense to own such laggards when they can be avoided entirely in favor of mid-tiers and true juniors with great fundamentals like growing production and stable costs.
The best strategy for riding this reaccelerating gold bull to wealth-multiplying gains in gold stocks is to carefully handpick the best mid-tier gold miners mostly included in GDXJ. Every quarter I break out this ETF’s top 34 and look at their production, costs, operating cash flows, earnings, and sales trends among others. That exercise helps separate the gold miners with better fundamentals from the lagging weaker ones.
So instead of just settling and owning GDXJ, even-better gains are highly probable by sticking to mid-tiers and juniors with superior fundamentals. They rank lower in GDXJ’s weightings and are usually growing their production organically or through new mine builds that recently came online or will soon be live. With plenty of great gold miners in this sector, there’s simply no need to hold the laggards retarding even GDXJ.
With gold stocks now enjoying a major upside breakout, massive new investment buying is coming. And the best gains by far will be won in smaller mid-tier and junior gold miners with superior fundamentals. While GDXJ itself will power dramatically higher despite some deadweight in its holdings, the better gold miners will generate much-greater wealth creation. Finding and owning these better gold-mining stocks is essential.
That’s one of my important missions at Zeal, relentlessly studying the gold-stock world to uncover the stocks with the greatest upside potential. The trading books in both our weekly and monthly newsletters are currently full of these better gold and silver miners. Most of these trades are relatively new, added in recent months as gold stocks recovered from deep lows. So it’s not too late to get deployed ahead of big gains!
To multiply your wealth in stocks you have to do some homework and stay abreast, which our popular newsletters really help. They explain what’s going on in the markets, why, and how to trade them with specific stocks. Walking the contrarian walk is very profitable. As of Q3, we’ve recommended and realized 1045 newsletter stock trades since 2001. Their average annualized realized gain including all losers is +17.7%! That’s double the long-term stock-market average. Subscribe today for just $12 per issue!
The bottom line is GDXJ’s upside easily bests GDX’s. While GDXJ is now really a mid-tier gold miners ETF instead of the junior one advertised, it holds some of the world’s best gold miners. Unlike struggling majors which dominate GDX, plenty of mid-tiers are still growing their production. They enjoy superior fundamentals and are weighted much more heavily in GDXJ than GDX, giving it much-better potential gains.
Throughout this entire young gold bull of recent years, GDXJ has well-outperformed GDX during gold-stock uplegs. While that has also led to bigger downside during corrections, it is disproportionally small compared to the upleg gains. GDXJ simply offers superior gold-stock sector exposure than GDX. But both these major gold-stock ETFs are still burdened with laggards dragging down their overall performances.
Adam Hamilton, CPA
January 14, 2019
Copyright 2000 – 2019 Zeal LLC (www.ZealLLC.com)
Guest Post by Bill Powers
January 11, 2019
Adrian Day of Adrian Day Asset Management is a seasoned investor, speaker, author, and adviser. In this interview, Adrian shares key takeaways from 2018 that affect the resource sector and offers his commentary on the Barrick-Randgold merger and its significance. Adrian also provides general insights on mergers and acquisitions within the mining sector, what he looks for in a junior royalty company, and his outlook on copper and copper mining stocks. Dispersed throughout the interview, Adrian discusses five mining stocks that he likes and which he thinks present an exceptional investment opportunity right now.
Bill: Welcome back and thanks for tuning in. You’re listening to the Mining Stock Education podcast and I’m Bill Powers, your host. For this episode, I’m joined by Adrian Day of Adrian Day Asset Management. Adrian is a well-known investor, speaker, author, and adviser when it comes to resource investing, and as I’ve said previous times on this podcast, Adrian wrote the first book that I ever read on resource investing and helped to pique my interest in this niche sector. Well, my last interview with Adrian was about two years ago at PDAC 2017, but Adrian joins me again today, so Adrian, thanks for taking the time to come on the podcast and share your insights.
Adrian: Well, thank you very much, and thank you for the nice comments, as well.
Bill: Let’s talk about the resource sector, first last year, as you peer back over 2018, can you recap for us some of the highlights, and important events that you see, and their significance?
Adrian: As I’m sure most of the listeners know, most resources were down during the year. Resources are a tricky thing because all of the indices are different, and most of the indices are actually commodity indices, which will therefore include a lot of soft commodities like grains and cattle and so on, which most of the people who follow resources are not really interested in, but nonetheless, most of them were down last year, the entire group was down 13%, and that’s even though some of the soft commodities were up, but clearly the most important things were the continued strength in the dollar for most of the year, other things being equal as we know, and things are never equal, but other things being equal, any time you price something in dollars, if the dollar is strong, the dollar price of that commodity is weaker, obviously.
The second major factor was the growing, ongoing tariff war between the U.S. and China in particular, and concerns that that might lead to a swelling global economy, so it’s the tariff war itself, but it’s also concerns of what it might lead to. And then of course, the third thing was the ongoing, the step up in I hate to call it tightening, but interest rate increases by the federal reserve. As you know, they announced that they had stopped QE and we’re going to start tightening back in 2015, and we saw one small rate hike at the end of this 2015 in December, and then a whole year later, we saw another one, so those are very slow in coming, but last year, we had four raises, and so it appeared perhaps that the fed was going to continue pushing rates up, so all those three, and that of course, also not only is that raising the cost of capital for a capital-intensive industry, so that’s a negative in and of itself, but secondly, the concern of raising rates too much might lead to a slowing economy again.
So those three factors, I think, were the main things that just pushed commodities down, and they’re all macro. I’m not talking anything micro, because I think last year the macro, other than perhaps for oil, I think the macro was far more important than the micro last year.
Bill: Within the major miners last year, we saw Barrick and Randgold merge. What’s your commentary on their merger and its significance?
Adrian: Well, it’s interesting because there was, as you know, no premium offered. Barrick obviously approached Randgold. I think it means more to Barrick than it did to Randgold, but there was no premium offered, which was very unusual, and Barrick has suggested, and Bristow from Randgold has echoed that, that we’re likely to see more mergers, more no-premium mergers as the industry consolidates. This is a very, very, for the size of the industry, it is an extremely fragmented industry, both among seniors and even more so among juniors. Very, very fragmented. That is inefficient because if you have 20 companies of a $2 billion size, you’ve got 20 managements to support. It’ll be interesting to see what happens with the Randgold-Barrick, I know that’s not what you were asking me about, but the most important thing to watch there, I think, is the difference in styles between Mark Bristow and Randgold and John Thornton and the masters of the universe at Barrick.
It’ll be interesting to see if they can consolidate or if there’s going to be a culture clash, but that’s a different question. I think we’re going to see consolidation. We have to. We’re going to see it among juniors as well. The difficulty always is if you don’t have strong asset synergies, then your synergies have to come, your benefits have to come from cost savings, which means reducing overlapping managements, essentially, and most people who run companies don’t want to voluntarily give up their jobs, and that is, I think, the biggest problem we have in not rationalizing the industry, particularly at the junior side.
Bill: Unless there’s a large premium and there’s some incentive for management, a windfall, would you say, at the junior level? It’s just that windfall that management would get that would cause them to acquiesce and give into such a merger?
Adrian: No, absolutely, and I think you’re more likely to see that kind of premium when a company, let’s say an exploration company, makes a discovery, and another company wants that discovery because it’s synergistic with something they have, and they’ll offer a premium. I was thinking more, and I don’t particularly want to mention names, because I don’t want anyone to get the wrong impression, but you look at a lot of, let’s say exploration companies, that might be doing good work, but just haven’t made a discovery, and you might have a company, an $8 million market cap, a $12 million market cap, a $10 million market cap, each of those companies has their own managements plus their own regulatory requirements and everything else, and typically if the company is a $10 million market cap, I would say typically 75% of the money they raise goes into overhead, not into the ground.
So if you combine three or four or five companies of $10 million, $15 million each, first of all, you get something that’s a little bit more liquid and therefore more open to more investors or more investors are open to it, $200 million market cap, let’s say. Still small but not micro, and maybe you can reduce, if you have a $200 million market cap, you can reduce $150 million overhead. You can reduce that to $100 million or $75 million, which means more of the money you raise can actually go into the ground, and so it’s not that any of these companies, in many cases, it’s not that any of these companies are doing bad work or are crooks, that’s a totally different issue. I’m talking about good companies with good managements doing good work, but if you’re only $10 or $20 million market cap, inevitably you have to keep raising money, and inevitably a lot of that money, a majority of that money has to go to just staying alive, regulatory fees, compliance fees, filing fees, et cetera, et cetera.
That’s if they’re not overpaying themselves or anything. Again, we’re not even getting to the companies where they overpay. We’re just talking about good companies doing good work, but if they don’t make a discovery, nobody is going to offer them a premium. Why would you offer a premium to someone that doesn’t have a discovery and doesn’t offer you particular synergies? There’s a lack of incentive for these companies to merge because nobody who went out, some of them were 15 years with Placer Dome and again, I’m not talking about anyone in particular, this is a hybrid individual, and he got tired of a big company and he went out and started his own company and raised some money. He doesn’t want to give up his company, and that’s a problem.
Bill: Still talking about mergers and acquisitions except from the investor’s perspective and where they can find the best value in 2019, I’ve spoken to Rick Rule a couple times over the past year and he points out that he thinks one of the most consistent and best opportunities for resource investors is trying to locate those takeover targets before they’re taken out. Would you agree with that and is that one of the places where you’re looking for your investment dollars in 2019?
Adrian: Well, far be it from me to disagree with Rick Rule. I think how I see it is I look at potential takeovers as icing on the cake, so I rarely, not never, I rarely buy a company simply because I think it’s going to get taken over because all too often, one can be disappointed, or it can frankly just take too long before that comes to pass, but if I like a company, I like the management, I like the property, I like what they’ve got anyway, then a takeover can be icing on the cake, and we do have several companies we own, but I expect that I’m fully expecting to get taken over at some point, and frankly, over the last couple of years, we’ve had four, five that have been taken over. Yeah. We’ve got several, and I don’t know if you want names?
Bill: Yeah. Please provide names. What’s of interest to you? You make some of your positions public through your writings or through interviews like this. Can you comment on any of your positions that you’ve made public and some of them that you think are the best value right now?
Adrian: Yeah. I’ll mention on the junior side, I’ll mention a couple, and this one gets back to takeover. Almaden has a great project called Ixtaca in Mexico. It’s a gold-copper project. They’ve just completed a final feasibility. They’ve applied for permits. Almaden is a junior company, very small company. Good people. One would not typically expect them to put this project into production. It’s a very low capex project, a very simple project to run metallurgically, so Almaden is suggesting that in fact they might put it into production themselves if they don’t get an attractive enough offer because it is a simple project and so on.
We own it because we like the project, we like the economics. The thing is selling at about a fifth of the value of … Don’t quote me. It’s even less than a fifth of the value of the feasibility study. At the same time, it’s the kind of project that I wouldn’t be surprised if someone was interested in taking over. 50% silver is very attractive to a lot of silver companies, where primary silver mines are increasingly rare, so this is an attractive project from that point of view, and it’s in Mexico, which despite everything about the new administration, Mexico still remains one of the best mining jurisdictions in the world, so I’m just looking this up. It’s got an after-tax value of $310 million. It’s got a market cap of $80 million.
I think there’s a lot of room there for someone to come in and take the company over, so again, we don’t own it just because we think it’s going to get taken over, but we think there’s a strong possibility that it might get taken over.
Bill: So you like royalty companies. That’s well known. You often in many interviews talk about some of the larger billion dollar plus royalty companies, but of recent years there’s been more of the smaller junior royalty companies come up. Can you talk about what you look for in a junior royalty company, and what are your general comments on, let’s say, the sub-$500 million market cap and below royalty space right now?
Adrian: Yeah. Good question. The first thing I look for is the same thing I look for in any junior company, which is management. You’ve got to have a strong management, and strong management means obviously a lot of things. A management that can execute. A management that has a good business plan and has vision, can execute, can talk to the market, and so on. That’s number one, and number two is balance sheets. You want a company that is able to raise money because it has connections, does not overspend. That’s important. And so when you’re looking at the thing with royalties is there’s a huge difference in valuation between a small royalty and a large royalty.
So if you look at my favorite junior, which would be Metalla. Metalla is a $70 million market cap. Let me just see what the … We don’t even have a P/E ratio. I’m just looking at a metric so we can compare. Price to cash flow of 26, and if we looked at Franco-Nevada, we get a price to cash flow of about the same, but on other metrics, the bigger ones are a lot smaller, on enterprise value, and so on. And so you buy a junior rather than a senior because you think they have the ability to grow and the ability for that valuation to expand, so you want to look at a company that has been able to execute. Metalla, for example, has been around about a little over two years now, two and a half years, and they’ve managed to get four producing royalties, a pipeline of about 14 or 15 in various stages from exploration to developmental, and near-term production, and in fact, they’ve actually introduced a dividend now. The dividend yield is about 2.3% right now. It’s an attractive dividend yield in and of its own right. It’s unusual for a growing junior to pay a dividend.
Bill: Is that the smallest market cap company in the junior space that pays a dividend? You may not know it offhand, but that strikes me as well.
Adrian: It’s definitely one of. I know there’s been one or two that I think had to stop the dividend because it just didn’t make sense. In the case of Metalla, they’re paying a percentage of their revenue as a dividend, so there’s absolutely no reason why they shouldn’t be able to sustain paying a dividend, and I think the idea, again, it’s unusual, but the idea was to show that the revenues that they had achieved were actually sustainable. So you want a royalty that’s growing and that can add various projects and get a diversity of royalty income coming in. Again as I mentioned, Metalla has four producing royalties. Franco has something like 43, so it’s a somewhat different scale, but the idea is that they will build up that revenue stream, and the diversity of the revenue stream, and potentially this would be a takeover candidate at some point for a senior royalty company that has difficulty adding to its royalty base, but that’s maybe two or three years away from now. That’s not an immediate prospect. We own Metalla right now because it’s a solid company, good balance sheet, great management, and it’s growing.
Bill: Would you say that the competition amongst those sub-$500 million dollar market cap junior royalty companies is stiffening, that it’s more competitive for these deals?
Adrian: It’s getting more competitive. For the larger royalties, it’s extremely competitive, as you know. They all look at the same things, Franco, Royal, Wheaton, and Osisko to a large degree, to some degree, but if a royalty is available, they’re all looking at it, and no company is going to do a private deal on a half billion dollar royalty. It always go out to auction or they’ll talk to others, and frankly who gets it depends really on who happens to have the cash at the time and for whom it most logically fits. If someone has just done two big copper deals, a gold byproduct from big Chilean copper mines, they may not be willing to pay up for another billion dollar Chilean copper mine byproduct credit royalty, if you understand what I mean, but sometimes the returns on these deals at current prices are extremely low.
There was one deal recently, a large deal, over half a billion, with a stated return of 1.1%, and it wasn’t necessarily a bad deal. It was a 60 or 70 year mine life, and it was a mine with a lot of upside potential, but nonetheless, that just gives you an indication of how competitive that sector is. When Metalla started, they were really able to … I think it’s true to say that for smaller deals, it’s sometimes able to do a transaction between a royalty company and a company without that project going out to auction to other companies. It has been possible, and so you see a particular company that you think you can do a transaction with, it’s been possible to do it, but I think increasingly, companies are wanting to shove their deals to everybody, and there are more juniors out there, so that sector is going to get a little bit more competitive.
But you know, there aren’t that many companies at the sub-$100 million. People often think of Sandstorm as a small one, but Sandstorm is $850 million market cap, so it’s small compared with Franco, but that’s 10 times larger than Metalla, so at the moment, and I don’t mean to keep harping on Metalla, but at the moment, a company of that size can be a lot more nimble than most of the market, and frankly, they can look at deals that other companies aren’t interested it.
Bill: I was talking to a mining engineer recently, and he said that even though investors looking at these deals may see a 15% IRR, internal rate or return, there’s not a lot of 15% internal rate of return projects out there. Would you agree with that?
Adrian: For royalties or for projects generally?
Bill: For royalties in particular.
Adrian: Definitely for royalties. No question. If you have a 15% IRR on a royalty that is acquired, or created, there’s probably something wrong with it, which it might be in the Sudan or whatever. Any double digit rate of return on a royalty is pretty tough.
Bill: Adrian, before you go, I’d like to get your comments on copper. That’s a metal that you like. Two years ago when I first interviewed you, in fact, you told me that copper was your number one after the precious metals. What’s your perspective on copper right now? We saw copper fall from about $3.30 a pound at the peak, halfway through last year, and now it’s close to 52 week lows, trading around $2.67 per pound. We have the trade talk and the trade truce supposedly between the US and China right now. Can copper in your opinion fall even lower in 2019? We know that there’s the supply deficit ahead of us here, but what about copper in 2019, and in particular, what about the copper equities? Could the copper equities even go lower?
Adrian: Well, things can always go lower. That’s one of the things you certainly learn in the resource business, resource investing, that however cheap they are, however cheap they appear, undervalued they appear, they can always go lower. Copper was interesting last year because as you mentioned, copper actually had a quite strong first half of the year, so it really struck me that copper was really beginning to turn around until the tariff trade dispute really heated up, and that’s what knocked it back. Copper remains after gold, it remains my favorite metal and my favorite base metal, and it does face that near-term production deficit, even without a pickup in demand. Now of course, you don’t want demand to collapse because of a global recession or a Chinese recession, but you don’t need a great pickup in demand for copper to move into a deficit.
You look at big copper mines are very rare. One has to really emphasize this. A big copper mine is very, very rare, and Richard Adkerson, the CEO of Freeport, on the latest conference call, mentioned something really fascinating. Despite the fact that we had that super cycle from 2001 for 10 years, when China was developing and all the base metals including copper were going crazy, not a single new copper mine has joined the list of top 10 producers or top 10 in reserves. Not a single one, despite the fact that we had that super cycle and despite the fact that people were spending money looking. Not only are they rare, but they take time to develop. Freeport has recently announced that apart from a couple of mines already in development, they are not giving the go-ahead to any new mines until the copper price looks more certain.
He said it would take a minimum of five to seven years for another mine to commence production from the time they give the go-ahead, and the way he put it was even a shovel-ready mine, five years minimum from the time the go-ahead is given. He indicated, and I think it’s true, that that stands, so no new mines is true for most of the global, major copper miners in the world. And so you can look ahead with a fair degree of certainty, a high degree of certainty, in fact, on what the potential production next year, the year after, three, four, five years from now, you can look ahead five years with a high degree of certainty what the potential production is going to be, because there’s going to be nothing producing copper in 2023. Nothing that we don’t already know about, right?
On the other hand, there’s a bigger chance of downside surprises. Some of the big copper mines start depleting quicker than we thought, there’s an earthquake in Chile that causes disruptions-
Bill: The union strikes.
Adrian: Union strikes, et cetera. The surprises with copper production are likely to be on the downside, not on the upside, so absent a collapse in demand, we are going to see shortages in three or four years’ time, and that’s got to mean higher prices. We are accumulating copper companies. I think you do need a company with low-cost mines so they can withstand short-term weakness, continue to withstand any continued weakness, and a lot of these mining companies do have their own peculiar problems, but we like Freeport a lot. That’s the largest outside the Chilean government-owned Codelco, it’s the largest private, publicly traded copper company in the world.
Freeport I think is very, very cheap, and they’ve cleaned up the balance sheet tremendously. They’ve done a superb job at cleaning up the balance sheet. Lundin which again has a great balance sheet. I wouldn’t call Freeport’s great, by the way. I’d just say they’ve done a good job cleaning it up. Lundin on the other hand, Lundin Mining does have a great balance sheet. They’ve got a lot of cash. They’re in a position to buy something if something good comes along. As you know, they tried to buy the Timok and they tried to buy Nevsun, but that didn’t work. They got trumped. Frankly, an unusual idea, I like Zijin, which is the Chinese company that purchased Nevsun, the largest gold-mining company in China, but a large, diversified mining company. Gold is their largest asset but copper is about half of what they have in gold and they want to increase their copper, and they also have some zinc mines they’ve bought.
They recently did a secondary offering just last week in order to finance the Nevsun purchase. Stock fell sharply from nearly 3.20 down to 2.76. I think it’s a good buy at today’s price, and it pays a dividend at 3% or something, 4% now. 4%, sorry, at today’s price.
Bill: Adrian, if I could do one follow-up question on copper, you’re a long-term investor, so you’re not in it for short-term trading, but for the short-term trading speculators listening to us, with the trade negotiations between the U.S. and China occurring right now, do you think specifically the copper equities and the junior equities, what’s being priced into those equities now? In other words, is there a lot of downside? If the trade talks fall apart between the U.S. and China, how much downside is still left in some of these depressed equities?
Adrian: Good question. I don’t think there’s a lot of downside left anymore. You look at the major ones and they are selling very close to their lows. You look at the juniors, which were slammed on tax loss selling as well as the macro scenario we’ve discussed. I don’t think there’s a lot of downside left. Obviously, if there was an abrupt end to trade talks with some nasty tweets on either side, the stocks would fall, no question, but I don’t think there’s a major sustained downside at this point.
Bill: Well, Adrian, before you go, is there any contact information or ways people could follow you?
Adrian: Oh, thank you. I appreciate that. Yeah. The best thing is to look at the website first, which is www.adriandayassetmanagement.com, all one word.
Bill: Adrian, thank you for the conversation. I appreciate you joining me on the podcast. Have a great day.
Adrian: Thank you. I appreciate it.
About the Author: Bill Powers is the host of the Mining Stock Education podcast which interviews many of the top names in the natural resource sector and profiles quality mining investment opportunities. Bill is an avid resource investor with an entrepreneurial background in sales, management, and small business development. His latest interviews can be found at MiningStockEducation.com.
January 8, 2019
- It’s time for the queen of assets to rest and consolidate. Nothing goes up in a straight line, and that’s certainly true for gold!
- Please click here now. Double-click to enlarge this daily gold chart.
- A pullback to about $1250 would be a healthy 50% retracement of the $100 rally from $1200 to $1300.
- Gold begins 2019 with some very positive news in play. Please click here now. After a two-year hiatus, China’s central bank is back in gold market action!
- The bank had been consistently buying about 15-20 tons of gold a month. When those purchases are added to buying from Russia and other central banks, they are quite price-supportive.
- It’s great to see China back on the buy, and analysts in India are projecting a ramp-up in gold imports there of about 20% for the first six months of 2019.
- The ECB (Europe’s central bank) is projecting higher inflation and easing growth for 2019.
- The love trade is healthy, the central bank trade is healthy, and global stock markets are on the rocks.
- On that note, please click here now. Double-click to enlarge. I’m a bit worried that the US stock market rally could peter out quickly.
- Please click here now. Institutional money managers are cutting back their allocations to US equities, and rightly so.
- The business cycle is entering the eighth and ninth innings, wage inflation is poised to spike in full-time jobs, and earnings have clearly plateaued.
- Please click here now. China’s central bank and government have vastly more “wiggle room” than America’s do to stimulate the economy.
- China’s stimulus is inflationary, and that’s good news for gold.
- The U.S. government is shut down. That’s not a position of strength, to put it mildly. These shutdowns have happened so many times that citizens are now numb and don’t seem to care.
- It’s not a good thing; the government just can’t seem to break its addiction to borrowing more and more money.
- The U.S. government has been very vocal in its opposition to the modest interest rate rates from the Fed. I don’t see any economic stress from these hikes, and senior citizens have been paid nothing in their savings accounts for years.
- Rate hikes are an indicator that inflation is in the air. They haven’t hurt gold, they help senior citizens, and they put pressure on banks to make business loans rather than finance stock market buybacks to enrich corporate directors.
- Rate hikes do put pressure on the ability of the U.S. government to borrow ever-more money, and that pressure is good.
- Please click here now. Double-click to enlarge this daily silver chart.
- The uptrend is solid. A pullback is normal, expected, and healthy. Note the Fibonacci lines in play around the demand line of the uptrend channel.
- Silver feels almost as solid as gold does right now, and that’s likely due to the growing threat of stagflation throughout much of the world.
- Please click here now. Double-click to enlarge this nice GDX daily chart.
- Like most sectors of the precious metals asset class, GDX is taking a breather after it successfully penetrated key resistance in the $20.70 area.
- From a technical perspective, the range trade in the $20-$21.50 area has a 67% chance of being resolved with a rally to $23. The current consolidation could be the last opportunity for excited investors to buy in this price zone before GDX moves above $23 and stays there for quite a long period of time!
Special Offer For Website Readers: Please send me an Email to freereports4@gracelandupdates.com and I’ll send you my free “Silver Stocks Rock!” report. I highlight the SIL and SILJ ETF component stocks that are poised to enter January like silver bullets shot out of a golden gun! I include key tactics to keep investors on the winning side of the action… in both the short and long term!
Thanks!
Stewart Thomson
Graceland Updates
Email:
Stewart Thomson is a retired Merrill Lynch broker. Stewart writes the Graceland Updates daily between 4am-7am. They are sent out around 8am-9am. The newsletter is attractively priced and the format is a unique numbered point form. Giving clarity of each point and saving valuable reading time.
Risks, Disclaimers, Legal
Stewart Thomson is no longer an investment advisor. The information provided by Stewart and Graceland Updates is for general information purposes only. Before taking any action on any investment, it is imperative that you consult with multiple properly licensed, experienced and qualified investment advisors and get numerous opinions before taking any action. Your minimum risk on any investment in the world is: 100% loss of all your money. You may be taking or preparing to take leveraged positions in investments and not know it, exposing yourself to unlimited risks. This is highly concerning if you are an investor in any derivatives products. There is an approx $700 trillion OTC Derivatives Iceberg with a tiny portion written off officially. The bottom line:
Are You Prepared?
The precious metals complex has enjoyed a nice run in recent months.
GDX has gained 25% since the September lows while GDXJ has gained 22% since its November low. Gold has rallied over $100/oz since its October low and Silver has surged in recent weeks.
The Gold community is getting excited again. They think the equity market is doomed and Gold has started a real bull run. That may be true but in the interim there are questions on the sustainability of recent strength.
Below we plot GDX with its advance decline (A/D) line and its RSI indicator. We already know that the A/D line has been carrying a few negative divergences.
With respect to RSI, typically in a strong, trending move it will surpass 70 (sooner rather than later) and that indicates strong momentum which implies some sustainability.
As GDX tests its 400-day moving average, it is lacking strong breadth and strong momentum.
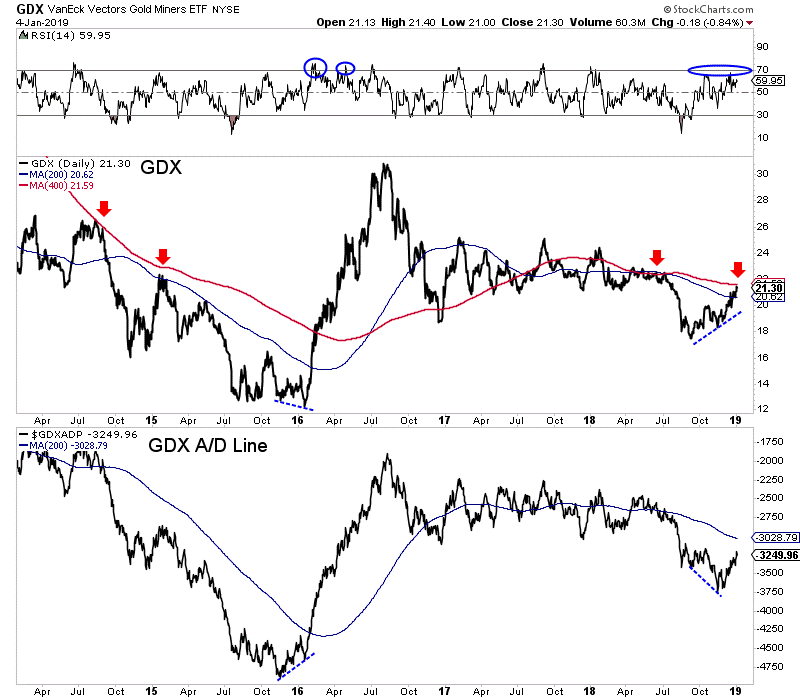
Meanwhile, Gold finally reached an RSI of +70 but after it occurred Gold formed a bearish reversal at strong resistance at $1300. That is why we want momentum to reach overbought conditions sooner rather than later.
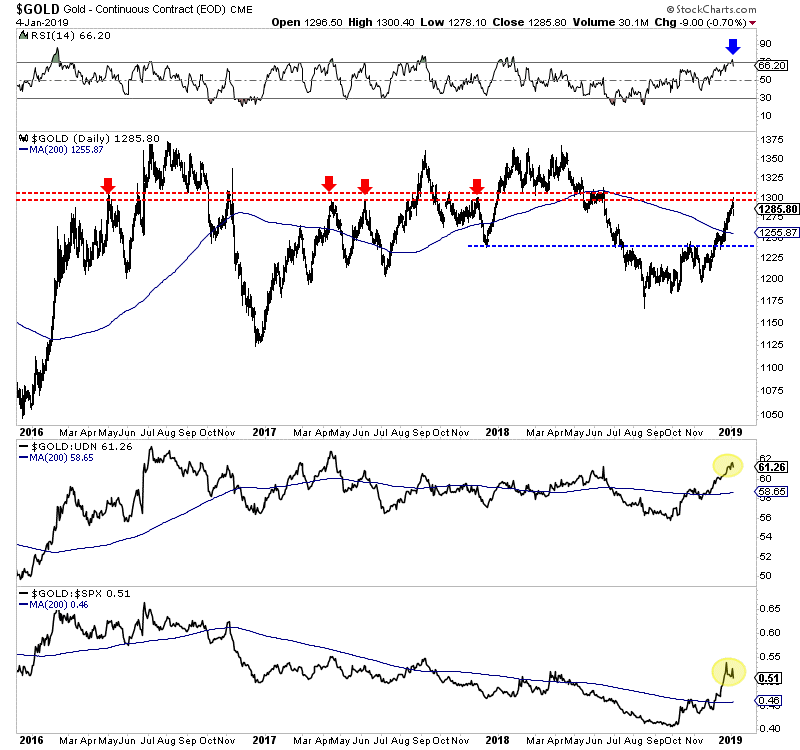
Silver (not shown) formed a similar bearish reversal as it approached resistance at $16.00.
Precious metals have tested resistance but with a lack of strong momentum and strong breadth. This implies that recent strength is probably not immediately sustainable.
Can precious metals digest and maintain recent gains or will they give most of them back as has been the case for years and years?
Assuming precious metals correct and consolidate, then there are multiple things we want to watch including breadth and relative strength against stocks and foreign currencies. In addition, we also should watch how the miners perform relative to Gold.
If Gold pushes past $1300 and the gold stocks surge past their 400-day moving averages it would signal a change in character for the market. At that juncture it would difficult to argue against a bull market.
In any case, it is not wise to chase strength until we get more evidence that a bull market has started. There will be plenty of time to get into cheap juniors that can triple and quadruple once things really get going. Note that many juniors began huge moves months after lows in January 2016, October 2008, May 2005 and November 2000. To prepare yourself for some epic buying opportunities in junior gold and silver stocks in 2019, consider learning more about our premium service.
The gold stocks’ young upleg is really growing, on a trajectory to become major. This contrarian sector is breaking out to the upside on multiple fronts technically, which is really improving sentiment. Traders’ extreme bearishness of late summer has mostly abated, with bullish shoots taking root. Fundamentals certainly justify the mounting gold-stock buying, with earnings set to surge on higher gold prices in coming quarters.
This baby new year should prove far happier for gold stocks than 2018. This sector’s performance is measured by the share price of the flagship gold-stock investment vehicle, which is the GDX VanEck Vectors Gold Miners ETF. This week it held shares worth $10.5b in 46 major and mid-tier gold and silver miners from around the world. GDX is now 60.1x larger than the next-biggest 1x-long major-gold-miners ETF!
2018 was rough for the gold miners, with GDX slumping 9.3%. Weaker gold prices were to blame, as gold is the dominant driver of gold-mining earnings. While the yellow metal recovered to a mere 1.6% loss last year, it slumped much lower in late summer. By mid-August extreme record gold-futures short selling had pummeled it down 9.9% year-to-date. That eviscerated gold-stock psychology, scaring traders out.
The major gold miners’ stocks suffered a brutal forced capitulation in that gold low’s wake as stop losses were triggered leading to cascading selling. So by mid-September, GDX had cratered 24.4% YTD. This bloodbath really turned traders off from this small contrarian sector. But as I warned just days later back in mid-September near the lows, that extreme selling heralded the birth of a major new gold-stock upleg.
GDX has indeed powered higher on balance ever since, rallying 20.0% in 3.4 months by Christmas Eve. That was fueled by the roughly-parallel young gold upleg that climbed 9.3% by the middle of this week. Things are really looking up for the gold stocks. Investors and speculators alike are starting to remember the big upside this small sector enjoys in major uplegs. Key breakouts are confirming one is underway.
Several weeks ago I wrote an essay analyzing the imminent upside triple breakout in GDX. Closing at $20.12 that day, GDX was on the verge of surging back over $21. That is an exceedingly-important level for the major gold miners technically. This updated chart shows why, and reveals the gold stocks are now enjoying their longest and best-foundationed upleg in years. And it is going to grow a lot larger as gold rallies.
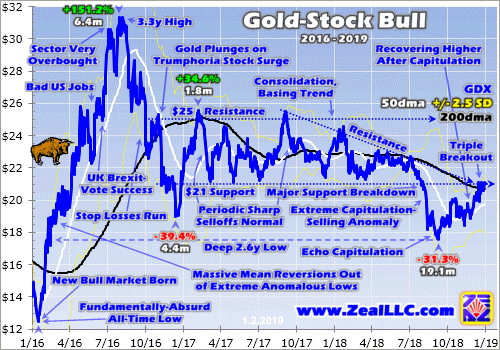
Three major upper resistance zones have converged at GDX $21. This was strong lower support for the gold miners’ stocks in a major consolidation basing trend that lasted for 21.5 months. It only failed in early August when gold was pounded by that extreme record futures short selling. Once they break, old support levels often become new resistance zones. Traders are wary to buy aggressively before they are overcome.
GDX $21 is also where the downward-sloping upper resistance line from gold stocks’ descending-triangle technical pattern has ended up. That connected the lower GDX highs that have vexed this sector since September 2017. The final and most-important resistance zone near GDX $21 is its key 200-day moving average. This essential line is usually the most-widely-watched by all the technically-oriented traders.
Market history has long shown 200dmas often prove the key dividing line between bull and bear markets. When prices surge back above their 200dmas after long periods underneath them, traders usually flood back in driving exploding upside momentum. 200dma upside breakouts often herald new bull markets or powerful uplegs within existing bulls. So GDX powering back over its 200dma is a major gold-stock buy signal.
While GDX has been meandering around $21 since Christmas Eve, that 200dma breakout has already happened! Since this leading gold-stock ETF’s 200dma is falling, the last time it was actually at $21 was in mid-November. This week the black 200dma line above has slumped to $20.72. A decisive breakout is 1% over that level. GDX achieved this milestone on December 18th, and has mostly maintained it since.
But with that 200dma still rounding to GDX $21, that is still the triple-resistance zone traders need to see left decisively behind. That critical upside breakout is happening before our very eyes! With GDX closing near $21.50, investors and speculators alike are going to consider the gold stocks off to the races. They will rush to buy and chase the upward momentum, accelerating it. This fuels major gold-stock uplegs.
The more capital traders deploy in gold stocks, the faster their share prices rise. The bigger their gains, the more traders want to buy. This virtuous circle of capital inflows has propelled past gold-stock uplegs to monstrous proportions. The last example of gold stocks powering higher out of major secular lows happened in largely the first half of 2016. The setup for that huge gold-stock upleg was very similar to today’s.
After being pummeled to a major secular low in mid-January 2016, selling was exhausted and buyers started to return. GDX began powering higher, spurred on by a parallel young gold upleg. GDX blasted up through its 200dma and capital flooded in. By the time that major buying ran its course, GDX soared an amazing 151.2% higher in just 6.4 months! Those kinds of returns are what give gold stocks their allure.
The necessary psychology to maintain that gold-stock momentum resulted from a relatively-minor 29.9% gold upleg in roughly the same span. The major gold miners of GDX leveraged and amplified gold’s gains by 5.1x! That was far better than the usual 2x to 3x because the gold stocks were so beaten down, trading at fundamentally-absurd levels when that upleg was born. Yet those huge gains still weren’t too exceptional.
Despite GDX’s mounting popularity as the leading gold-stock benchmark, this ETF is relatively new with a May 2006 birth. The previous secular gold-stock bull ran for 10.8 years, extending from November 2000 to September 2011. During that long span the classic HUI NYSE Arca Gold BUGS Index skyrocketed an astounding 1664.4% higher! The world’s most-hated sector today multiplied investors’ wealth by nearly 18x.
That was driven by a parallel 638.2% secular gold bull, which the major gold stocks of the HUI leveraged by 2.6x. The individual upleg cycles within that mammoth gold-stock bull show uplegs in this sector tend to be very large. Excluding the epic mean-reversion rebound out of late 2008’s first-in-a-century stock-market panic, the HUI enjoyed 11 normal uplegs. Their average gain was a staggering 80.7% over 7.9 months!
That last secular gold-stock bull offered traders 11 separate opportunities over 11 years to almost double their capital! So while GDX’s monster 151% upleg in H1’16 was definitely on the huge side, the last bull’s 81% average uplegs weren’t tremendously behind. When investment capital returns to gold stocks in a material way, their upside is massive. Today’s young GDX upleg could easily grow to 80%+ later this year.
Even a full-on doubling is fairly conservative considering how low gold stocks were hammered in early September’s cascading forced capitulation. GDX bottomed at $17.57 on September 11th, which was a deep 2.6-year low. A 100% gain from there would merely carry it to $35.14. That would be a new high for this gold-stock bull, as GDX last peaked at $31.32 in early August 2016. But GDX $35 is still relatively low.
Back in September 2011 as that last secular gold-stock bull crested, GDX peaked at $66.63 on close. It averaged $52.61 in the three full calendar years of 2010, 2011, and 2012. Gold-stock levels have been much higher on balance in the past. So seeing GDX double from its recent lows in this young upleg isn’t a stretch at all. And major gold-stock uplegs aren’t just a technical-buying-fueling-bullish-sentiment thing.
They are also supported by fundamentals. Gold-mining costs are essentially fixed during mine-planning stages. That’s when geologists and engineers decide which gold ore to mine, how to dig to it, and how to process that ore to extract the gold. Once hundreds of millions of dollars are spent to build the mines and mills, the mining costs generally don’t fluctuate much. Real-world data abundantly confirms this truth.
Every quarter I wade through the latest financial and operational reports of the top 34 GDX gold miners. They finished reporting their latest Q3’18 results in mid-November, which I painstakingly analyzed in an essay as usual. The top 34 GDX gold miners accounted for nearly 94% of this ETF’s total weighting. And their average all-in sustaining costs for producing each ounce of gold ran $877. That was right in line.
The previous four quarters’ top 34 GDX gold miners’ average AISCs came in at $868, $858, $884, and $856 averaging $867. So the major gold miners’ costs for producing gold don’t change much regardless of what the gold price is doing. Thus higher gold prices feed directly through to bottom lines in amplified fashion. Gold stocks’ earnings surge during gold uplegs, fundamentally justifying monster gold-stock gains.
In Q3’18 plenty of major gold miners actually reported that they expected AISCs to retreat in Q4’18 as production recovered out of various temporary setbacks. So I expect to see lower average AISCs among the top 34 GDX gold miners in their upcoming Q4 results. But let’s conservatively assume that Q3’18’s $877 average AISCs hold into Q4. Higher prevailing gold prices in Q4 portend bigger gold-mining profits.
The average gold price climbed 1.4% quarter-on-quarter in Q4 near $1228. That implies the major gold miners of GDX were earning $351 per ounce at $877 average AISCs. In Q3 the lower average $1211 gold price drove profits of $334 per ounce. So gold-mining earnings are likely to climb by at least 5.1% QoQ in Q4’18 results. That is 3.6x upside leverage to gold, so outsized gold-stock gains are righteous.
No one knows what gold will average in Q1’19, but I bet it’s going to be much higher than Q4’s $1228. Gold thrives during stock-market selloffs as investors remember diversifying their stock-heavy portfolios with alternative investments. And with burning stock markets rolling over into a young bear driven by full-speed Fed quantitative tightening, gold investment demand is likely to push gold higher for a long time to come.
But let’s assume gold does nothing on balance in Q1, and merely averages $1280 when the dust settles. That is still 4.3% higher sequentially from Q4. At $1280 gold prices and $877 AISCs, gold-mining profits in Q1 would run $403 per ounce. That is another 14.8% higher than Q4’s projected level, implying 3.4x earnings leverage to gold. As long as gold gradually climbs on balance, the gold stocks deserve to soar.
Because their profits surge much faster than gold, so do gold-stock prices. Gold stocks again tend to outperform gold by 2x to 3x during major uplegs. So if gold rallies 30%, GDX will usually power up 60% to 90%. The major gold miners’ stocks remain wildly undervalued relative to prevailing gold prices. Back in mid-October when GDX was just clawing back out of the $18s, I made that fundamental case in depth.
But while GDX is a fine sector investment vehicle with a lot to like, it’s not without its problems. In Q3’18 for example, the top 34 GDX gold miners saw their overall gold production retreat 2.9% year-over-year. The world’s 4 largest gold miners Newmont, Barrick, AngloGold, and Kinross suffered annual production drops of 2.0%, 7.6%, 14.6%, and 10.4% in Q3. Goldcorp’s plunged an anomalously-extreme 20.5% YoY!
These 5 major gold miners alone accounted for over 30% of GDX’s total weighting. Other gold miners among its top components are also struggling with production. While GDX has to own the biggest and best gold miners no matter how they are faring, their underperformance really drags down GDX’s upside. The biggest and fastest gold-stock price gains accrue in smaller mid-tier gold miners growing their production.
So instead of buying GDX, far better gains are highly probable from handpicking fundamentally-superior GDX-component stocks to own. These include mid-tier gold miners lower in GDX’s rankings that are still growing their production organically, or through new mine builds that recently came online or will soon be live. With plenty of great gold miners in this sector, investors and speculators have no need to hold laggards.
With GDX now enjoying a major upside breakout, massive new investment buying is coming. And the best gains by far will be won in smaller mid-tier and junior gold miners with superior fundamentals. While GDX itself will power dramatically higher despite the deadweight in its holdings, the better gold miners will generate much-greater wealth creation. Finding and owning these better gold-mining stocks is essential.
That’s one of my important missions at Zeal, relentlessly studying the gold-stock world to uncover the stocks with the greatest upside potential. The trading books in both our weekly and monthly newsletters are currently full of these better gold and silver miners. Most of these trades are relatively new, added in recent months as gold stocks recovered from deep lows. So it’s not too late to get deployed ahead of big gains!
To multiply your wealth in stocks you have to do some homework and stay abreast, which our popular newsletters really help. They explain what’s going on in the markets, why, and how to trade them with specific stocks. Walking the contrarian walk is very profitable. As of Q3, we’ve recommended and realized 1045 newsletter stock trades since 2001. Their average annualized realized gain including all losers is +17.7%! That’s double the long-term stock-market average. Subscribe today for just $12 per issue!
The bottom line is this young gold-stock upleg is growing. It is now surging in a major upside breakout that should unleash a flood of new buying. With gold climbing on balance too, everything is in place to fuel a major gold-stock upleg. That could easily portend a doubling in the major gold miners’ stocks from their recent deep lows. This sector’s technicals, sentiment, and fundamentals all support massive gains from here.
The higher gold stocks are driven, the more traders want to buy them to chase their outperformance. The more gold stocks rally, the more bullish sentiment becomes leading to mounting capital inflows. Higher gold prices justify all that fundamentally, as gold-mining profits leverage and amplify gold’s gains. This is the best gold-stock setup seen since early 2016, which led to GDX soaring 151% in just over a half-year.
Adam Hamilton, CPA
January 7, 2019
Copyright 2000 – 2019 Zeal LLC (www.ZealLLC.com)
- As the new year begins, gold continues to gain respect as the ultimate investment asset. Unfortunately, the same cannot be said for the U.S. dollar.
- Most investors tend to view the dollar as a “safe haven”, but the big bank FOREX traders that really move the currency market view the dollar as a risk-on asset class.
- They view gold and the Japanese yen as the main risk-off assets. So, when the dollar falls against the yen and gold as the U.S. stock market rises, all may not be quite as well as investors think it is!
- Please click here now: http://www.graceland-updates.com/images/stories/19jan/2019jan1usd1.png Double-click to enlarge. After building an immense sloping H&S top pattern, the dollar has collapsed against the yen and is now almost in “free fall”.
- That top pattern is technically a “head and shoulders (top) bear consolidation pattern”, and its implications are ominous.
- At my guswinger.com swing trade service (where I personally take all the trades myself), I’m short the dollar versus the yen (and short the dollar versus the yuan) in the FOREX market. Traders are making solid profits on these anti-dollar trades.
- We’re also long NUGT and Barrick. With John Thornton and Mark Bristow at Barrick’s helm, I now have a $200 long-term price target for Barrick. The NYSE stock symbol is set to change from ABX to GOLD tomorrow, and that’s positive news.
- Please click here now: http://www.graceland-updates.com/images/stories/19jan/2018jan1gold1.png Double-click to enlarge. As 2019 begins, investors need to think hard about whether it’s more important to predict a late cycle rally for the US stock market… or a much better idea to focus on the spectacularly bullish price action taking place on the long-term gold chart.
- India’s government is launching a new pro-gold policy within a few weeks. That will see gold become endorsed as a respected investment asset class by the government. A significant chop in the import duty will likely follow, and discussions are already underway with Russian entities about duty-free imports.
- In America, the current collapse in the dollar comes late in the business cycle. The big bank FOREX departments are almost universally negative on the dollar, and rightly so.
- Please click here now: http://www.graceland-updates.com/images/stories/19jan/2019jan1dow1.png Double-click to enlarge. The dollar melt-down against the yen is happening as the US stock market trades lower on ramped-up quantitative tightening that Fed chair Powell now says is on “auto pilot”. Investors who ignore quantitative tightening in the late stage of the US business cycle are making as big a mistake as ignoring quantitative easing at the 2009 trough of the cycle.
- Also, a Dow Theory sell signal could take place in 2019 if both the Transports and the Industrials cannot make new daily closing highs… and then break the current lows.
- I’m long the Dow now via UDOW but that’s just a technical swing trade, albeit a winner already. In the big picture, investors need to think about only one thing in 2019 and that is…
- While the job market is officially very tight, a lot of that tightness can be explained by the large number of part-time jobs. The labour department counts one worker working two part-time jobs as two people working. That’s arguably fraudulent accounting. Regardless, the huge number of part-time jobs is the main cause of the slow growth in wage inflation.
- Having said that, as the full-time jobs market tightens significantly in 2019, much more wage inflation will appear… and it will do so as corporate earnings fade towards the single digits growth range.
- In a nutshell: Welcome America, to the rebirth of… Stagflation!
- I’ve predicted that investors are making a mistake if they sit around and wait for Trump to “make things great” while the U.S. government debt rises ever-higher in the late stage of the business cycle. It’s an understandable mistake that comes from frustration with the hideous socialist and war-mongering policies of past U.S. administrations. The murderous war-mongering has been financed with gargantuan debt, making it even more vile.
- Regardless, the much wiser plan of action is to use Trump’s incredible work ethic and business acumen as personal inspiration to take professional action in the gold and silver market.
- On that note, please click here now: http://www.graceland-updates.com/images/stories/19jan/2019jan1si1.png Double-click to enlarge this awesome silver chart. I wanted to see a three-day close over $15.20, a Friday close over that same price, and I also hoped to see that “cake” iced with a 2018 year-end close above $15.20.
- All three technical events occurred! While the short-term target is the decent price area at $16, I am projecting much higher prices over the 2019-2022 time frame. It’s important that all precious metals investors understand that while gold soared above its 1980 high in 2010-2011, silver barely made it back to its 1980 high of about $50. That’s because the world has been in a general deflationary (lower rates) cycle since about 1980.
- Now, stagflation and higher rates over the long-term (like occurred in America in 1966 -1980) is beginning. When silver barely made it back to its 1980 high after 30 years, the price action was not “parabolic” like it was in the late 1970s. It was more of a modest blip related to gold dragging silver modestly higher in an overall risk-off play. What’s coming for silver now is much different than what happened in 2011. It will be parabolic (as stagflation reaches a crescendo, years from now), but it’s only barely beginning.
- Please click here now: http://www.graceland-updates.com/images/stories/19jan/2018jan1gdx1.png Double-click to enlarge. I’ve boldly referred to GDX as “Prince of Assets GDX” and called the entire $23 – $18 price zone the most important investor accumulation zone in the history of markets.
- With maverick money managers like Ray Dalio calling for a U.S. inflationary depression while amateur investors try to gamble on the late stage of the stock market cycle, I predict there’s a 90% chance that I’m proven correct.
- On this GDX chart, I’d like investors to note the bullish action, the enormous volume, and also take a close look at the $21.67 resistance area that GDX has already closed above repeatedly since arriving there. All the price action is positive, and it’s poised to become much more positive as January trading gets underway. Perhaps I should let “Queen Gold” and “King Silver” have the final word as 2019 begins, which is: Happy New Year to the entire world gold community!
Special Offer For Website Readers: Please send me an Email to freereports4@gracelandupdates.com and I’ll send you my free “Silver Stocks Rock!” report. I highlight the SIL and SILJ ETF component stocks that are poised to enter January like silver bullets shot out of a golden gun! I include key tactics to keep investors on the winning side of the action in both the short and long term!
Stewart Thomson
Graceland Updates
Stewart Thomson is a retired Merrill Lynch broker. Stewart writes the Graceland Updates daily between 4am-7am. They are sent out around 8am-9am. The newsletter is attractively priced and the format is a unique numbered point form. Giving clarity of each point and saving valuable reading time.
Risks, Disclaimers, Legal
Stewart Thomson is no longer an investment advisor. The information provided by Stewart and Graceland Updates is for general information purposes only. Before taking any action on any investment, it is imperative that you consult with multiple properly licensed, experienced and qualified investment advisors and get numerous opinions before taking any action. Your minimum risk on any investment in the world is: 100% loss of all your money. You may be taking or preparing to take leveraged positions in investments and not know it, exposing yourself to unlimited risks. This is highly concerning if you are an investor in any derivatives products. There is an approx $700 trillion OTC Derivatives Iceberg with a tiny portion written off officially. The bottom line:
Are You Prepared?
by Robert Kientz
Summary
- I discuss the recent streaming deal with Northern Vertex CEO Ken Berry.
- We also go over the $8 million private placement.
- During the interview, we cover extensively the accomplishments for 2018 as well as the options the company has to expand production and acquire new assets.
- I analyze the optionality for both companies, Maverix and Northern Vertex.
- I discuss why this deal, along with the Sprott relationship, says a lot about confidence in Northern Vertex to deliver the goods on their project.
Author’s note: I have covered Northern Vertex (NHVCF) previously in 2018 in these articles here, here, and here.
The purpose of this article is to update you on the recent streaming deal with Maverix Metals (OTCPK:MACIF) as well as the $8 million funds earned through a private stock placement. Both deals were aimed at cleaning up the debt on the balance sheet as well as providing cash for operations and some further exploration of the Moss mine area.
I interviewed Kenneth Berry who is President, CEO, and a Director with the company. CFO Christopher Park and Communications Manager Chris Curran were also in attendance.
Video Interview:
Here are some key takeaways from the interview.
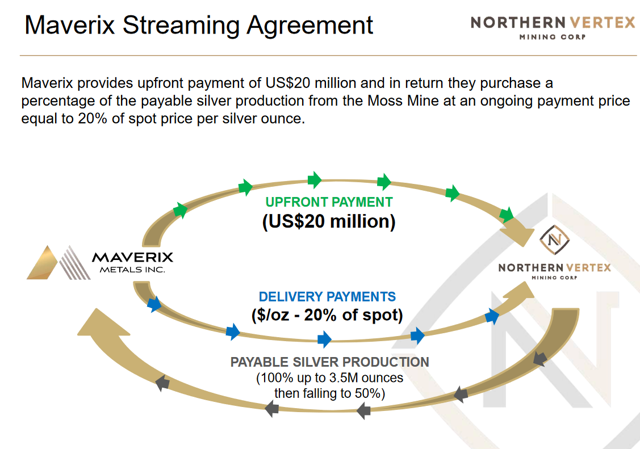
Source: Northern Vertex
- Northern Vertex has retired the debt they had with Sprott.
- Maverix gives $20 million up front for the opportunity to purchase up to 3.5 million ounces of silver at 20% of the spot price.
- After those ounces are purchased, Maverix maintains the ability to purchase up to 50% of future silver production using the same terms.
- Both companies profit from the deal and it offers optionality on a potentially rising silver price for both parties.
- The $8 million private placement provides the company money to fund operations and should solidify the balance sheet for 2019 while the company works on optimizing the gold and silver recovery from their mine.
In addition to those points, Northern Vertex has options to increase exploration of the Moss mine area in the Oatman district with award winning exploration team Perry Durning and Bud Hillemeyer.
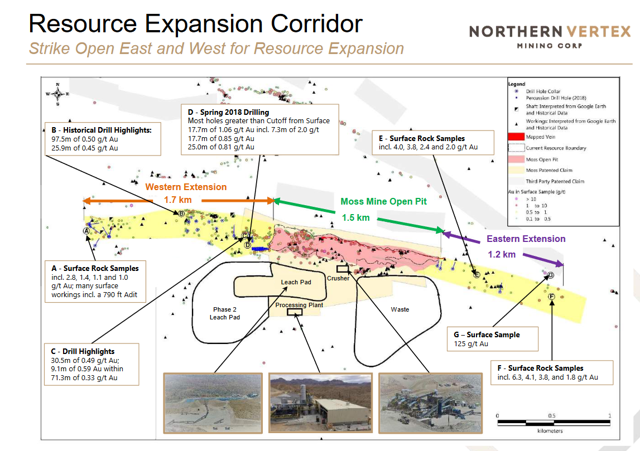
Source: Northern Vertex
In addition to the exploration upside, now that Northern Vertex has solidified their financial standing, the company is positioned to take advantage of possible expansion. Some research provided to the company shows the power of increasing both production rates and reserves in terms of market liquidity, higher market capitalization, and more analyst coverage.
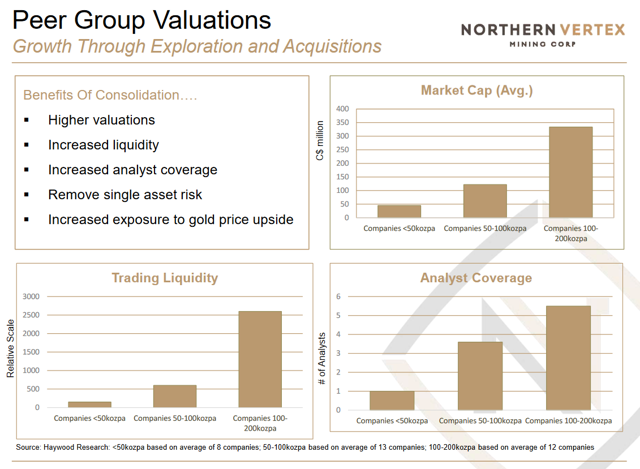
Source: Northern Vertex, Haywood Research
Optionality Analysis for Maverix and Northern Vertex
Here is my optionality analysis for both companies given different possible silver prices, including spot price as of time of writing the article.
| Northern Vertex Project Feasibility, Moss Mine | |
| Project Silver Ounces (M&I) | 4,610,000 |
| Silver Recovery Rate | 65.00% |
| Recoverable Ounces, Initial | 2,996,500 |
| Gold Ounces (M&I) | 377,000 |
| Maverix Agreement | |
| Tranche 1 Stream Ounces | 3,500,000 |
| Difference to be found through expanded exploration | 503,500 |
| Maverix spot-based payments ($14.81 silver spot as of 12-24-2018) | $8,875,633.00 |
| Initial Payment to Northern Vertex | $20,000,000.00 |
| Total Payments to Northern Vertex | $28,875,633.00 |
| Maverix Total Cost of Silver per ounce | $9.64 |
| Maverix Optionality Analysis | |
| Silver @ $17.50/ounce, total project silver value | $52,438,750.00 |
| Maverix 20% spot payment | $10,487,750.00 |
| Maverix Total Cost of Silver per ounce | $10.17 |
| Northern Vertex – per gold ounce byproduct credit from silver stream | $80.87 |
| Silver Rises to $20/ounce (2016 high) | $59,930,000.00 |
| Maverix 20% spot payment | $11,986,000.00 |
| Maverix Total Cost of Silver | $10.67 |
| Northern Vertex – per gold ounce byproduct credit from silver stream | $84.84 |
| Silver Rises to $25/ounce | $74,912,500.00 |
| Maverix 20% spot payment | $14,982,500.00 |
| Maverix Total Cost of Silver | $11.67 |
| Northern Vertex – per gold ounce byproduct credit from silver stream | $92.79 |
Source: Author Calculations
Maverix is making out pretty well on this deal, staying under the current floor for the silver price. If silver price does rise substantially, Maverix’s total cost of silver as a percent of the spot price falls precipitously.
Northern Vertex gets immediate partial monetization of their silver and higher byproduct credits, per project gold ounce, as the price of silver rises. The original project feasibility study had the AISC (all in sustaining cost) of gold at $603 given the silver byproduct credits. Since this deal was put into place, we can expect the AISC to rise somewhat due to sharing the silver profits with Maverix.
However, the project is still low cost with respect to the average gold mining costs found in the industry. And Northern Vertex just eliminated a lot of risk from their balance sheet by eliminating the Sprott debt and adding to their cash reserves. This move should provide plenty of runway to optimize their mine and get to their expected production rates without having to take on additional debt.
What the Deal Says About Confidence in the Project
The new financing shows that streaming companies such as Maverix Metals have confidence in the company to deliver on production targets.
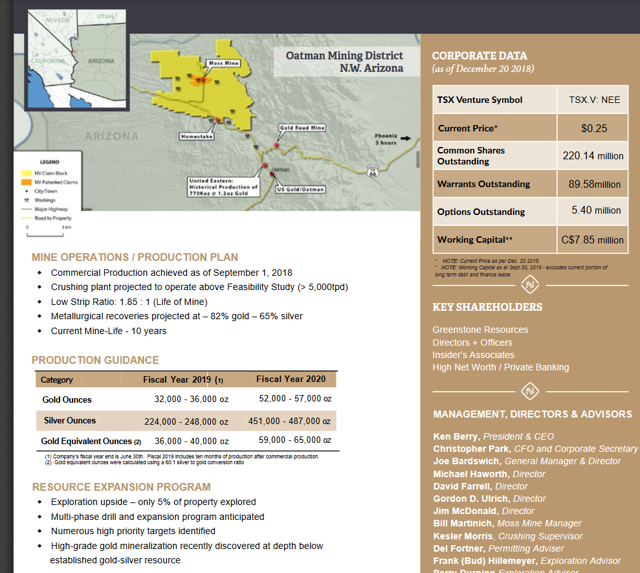
Source: Northern Vertex
Maverix Metals has an established streaming agreement with Pan American Silver at La Colorada in Mexico and Endeavour Mining in Burkina Faso, so it is no stranger to making deals with strong, established precious metals mining companies.
But Maverix’s strategy also seems to be financing smaller development projects with solid price upside. In the case of this deal with Northern Vertex, they saw an opportunity to finance a new operator and obtain undervalued silver assets that give them a very cash flow positive optionality play on the upside price for silver.
The best time to make this deal was right after Northern Vertex began production, had some debts to pay for developing the mine, and had not delivered the bulk of the metals in the project yet.
Further, the Maverix option includes total mine output well beyond the initial 2.99 million recoverable silver ounces. The agreement agrees to purchase 100% of silver ounces up to 3.5 million. Also, the deal gives Maverix the ability to purchase 50% of silver beyond the 3.5 million ounces, suggesting Maverix thinks there is more gold and silver to be found on the property, perhaps in the Western and Eastern extensions as shown in the graphic above.
Maverix is not the only company that has shown confidence in Northern Vertex to produce on the project. Sprott had provided a $100 million line of credit initially which Nortern Vertex had drawn $20 million against. I am told by management that the possibility of further financing with Sprott, should the company want to expand, is still an option as they have maintained their positive relationship. Paying off the debt early and strengthening the balance sheet certainly helps the case if they needed to use that option.
What are the Risks?
The main risk that I took away from the conversation with Ken Berry was that Northern Vertex is not ready to estimate their current AISC. To be fair, they have not had enough production time to calculate actual production costs plus additional expenditures to expand operations. It will take more time for data to be made available to come up with a tangible, reliable AISC number.
Further, he stated that the initial production costs of gold are above the feasibility number, which was $603 per gold ounce. I am not overly worried about that right now for two reasons:
- a) they are early in production, and it is not abnormal to have higher costs while operations are fine tuned and
- b) the AISC is so low that it could rise substantially and still be way below current gold spot price of $1271.70 at time of this writing.
However, there is still a risk that the costs are substantially higher than the feasibility study would indicate, which would drive the overall project value down. Northern Vertex’s current market cap is currently valued well below their project NPV.
The research provided in the graphic above from Haywood Research shows that overall sector market caps are priced within ranges and not tied directly to project NPVs, but more on sentiment indicators like analyst coverage and overall project size. Investors have not appeared to spent enough time in precious metals sector to appropriately value projects and make their bets.
As the general stock market volatility continues into 2019, I believe investors will spend time analyzing their options and find that the precious metals markets are sorely undervalued.
I believe this to be an arbitrage opportunity right now for smart value investors looking at cheaply priced assets, and perhaps licking their wounds from falling stock values in the wildly popular technology sector which has been punished since October.
I think the market scenario has played into Northern Vertex’s hands as it has allowed them to develop the mine largely unnoticed, while still showing the ability to finance their operations with two established industry partners who know how precious metals mining works.
When the broad market takes notice of the sector, Northern Vertex will likely be one of the companies that catches some of that new investor money coming in due to their relatively low level risk factors.
Stay Tuned
We are much closer to the Renaissance in precious metals markets than we have been since the last major market crash. The macro story is playing into the hands of precious metals, and will reward the miners and investors with key positions.
Therefore, for 2019 I will be adding coverage for more companies in the precious metals sector that I also believe are undervalued. And lastly, I will continue to provide coverage for Northern Vertex throughout 2019 as production continues to ramp up and major news events happen.
Robert Kientz, January 3, 2019
If you would like to receive our free newsletter via email, simply enter your email address below & click subscribe.
 Follow us on Twitter
 Become our facebook fan
CONNECT WITH US
Tweets
Tweet with hash tag #miningfeeds or @miningfeeds and your tweets will be displayed across this site.
MOST ACTIVE MINING STOCKS
Daily Gainers
 CMC Metals Ltd. CMC Metals Ltd. |
CMB.V | +900.00% |
 Eden Energy Ltd Eden Energy Ltd |
EDE.AX | +200.00% |
| GoviEx Uranium Inc. |
GXU.V | +42.86% |
| Eagle Nickel Ltd. |
ENL.AX | +41.67% |
| Citigold Corp. Limited |
CTO.AX | +33.33% |
| Mount Burgess Mining NL |
MTB.AX | +33.33% |
| Exalt Resources Limited |
ERD.AX | +31.94% |
| Casa Minerals Inc. |
CASA.V | +30.00% |
| Cariboo Rose Resources Ltd |
CRB.V | +28.57% |
| Belmont Resources Inc. |
BEA.V | +28.57% |


