
Back in 2013 I recall having a bearish view on the stock market due to extremely bullish sentiment readings. The market completely ignored that, made a major breakout through 13 year resistance and continued running for years.
Lesson learned.
Turning to Gold, we find something similar during major breakouts in 2005, 2007 and 2009. In the chart below we plot Gold along with its net speculative position (as a percentage of open interest) and the widely followed daily sentiment index.
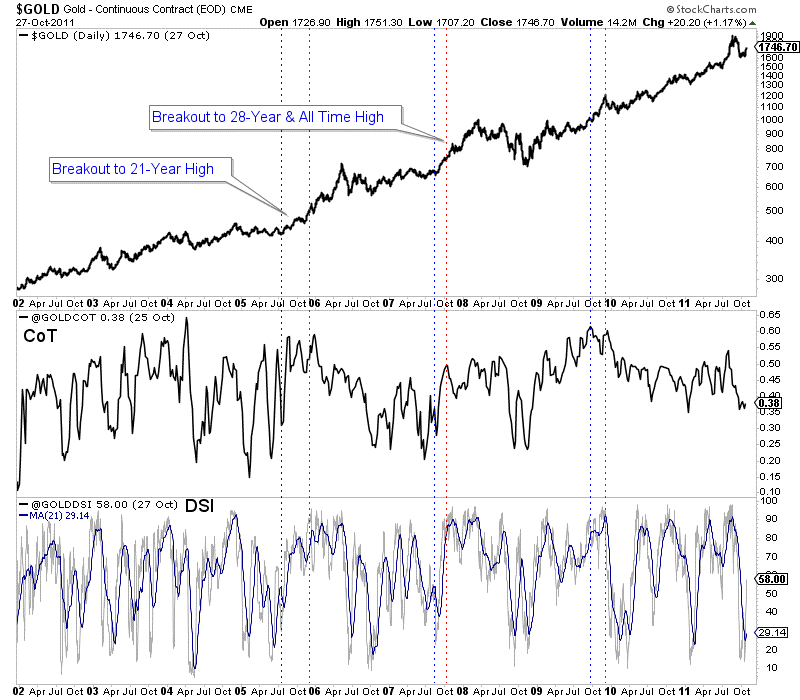
In August 2005 and the start of 2006, the net speculative position in Gold reached (excluding 2004) what were the highest levels since the start of the data in 1987.
In late 2007, the net speculative position was not at an extreme but the daily sentiment index spent quite a bit of time around 90% bulls immediately prior to Gold breaking out to a new all time high.
Both the net speculative position and daily sentiment index were very elevated in the fall of 2009, immediately prior to Gold breaking out above its 2008 peak. The net speculative position then was at its second highest level since 1987.
As of February 5, when the Gold price closed at $1319/oz, the net speculative position in Gold was 27% of open interest. Gold gained $30/oz since then but that is well below the 55%-60% peak levels seen in 2016, 2012, 2009 and 2004-2006.
While that is encouraging, history shows that if and when Gold breaks its resistance ($1375-$1400/oz) sentiment indicators figure to be close to bullish extremes. When a market is coming out of a bad bear market or on the cusp of a multi-year breakout, bullish sentiment isn’t necessarily bearish.
In fact, a market that cannot register bullish sentiment extremes is one that may not be strong enough to breakout.
Circling back to the present, the one thing that can prevent Gold from breaking out is renewed underperformance against the stock market. In the chart below we plot Gold and GDX against the S&P 500.
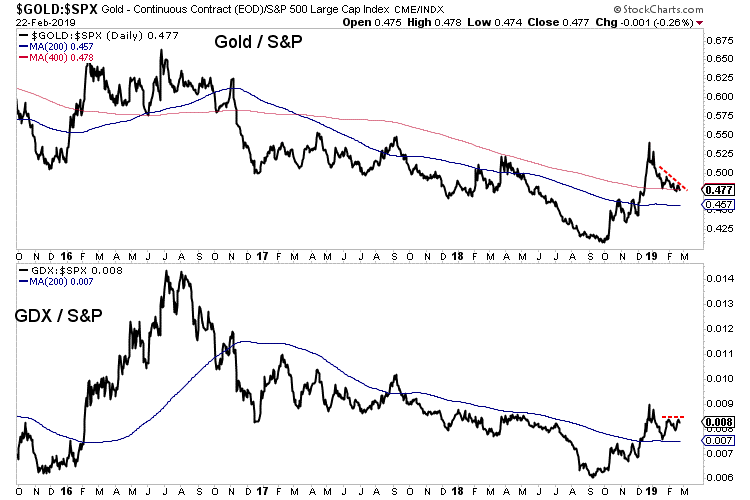
Precious metals stopped outperforming the stock market in late December and the Gold to S&P 500 ratio appears weak and likely to weaken further.
The S&P 500 recently cleared its moving average resistance and its advance decline line hit a new all time high. These things suggest higher prices in the near future and that, rather than bullish sentiment would provide resistance to Gold over the next few months.
Although Gold will not break resistance in that scenario, we should keep an eye on the gold stocks which have shown improving breadth and relative strength. Plenty of great values remain and there is still plenty of time to position yourself to take advantage. If a huge breakout is coming later in the year then the next few months may be your last chance. To learn what stocks we are buying and have 3x to 5x potential consider learning more about our premium service.
- The biggest driver of major markets right now is the possibility of a U.S.-China trade deal.
- On that note, please click here now. The U.S. government’s wild launch of tariff taxes caused global markets to swoon in the first half of 2018. Gold and the Chinese stock market were hurt more than a lot of other markets.
- Gold has done well with QE, QT, falling rates, and rising rates, but tariff taxes hurt the Chinese economy. That put a damper on the growth of Chinese gold demand.
- The Chinese stock market is now rallying in anticipation of a trade deal, but even if there is no deal (unlikely), the Chinese government has embarked on a significant stimulus program.
- U.S. money managers are getting more interested in the Chinese stock market because of that stimulus. A trade deal that includes more intellectual property protection would create a huge U.S. stock market rally. More importantly, it would create a huge rally in the Chinese market and that would increase gold demand significantly.
- If the Fed hikes or signals that QT is going back to auto pilot mode, institutional money managers will buy gold because of growing concerns about the U.S. government’s ability to finance itself, and because the Fed’s move would hurt low interest rate loans for U.S. stock market buybacks. A situation like September 2018 would occur, with gold rallying and stock markets tanking.
- On the other hand, a pause in hikes and an earlier-than-expected end to QT is also viewed as good news for gold.
- Additionally, even without a trade deal, China’s economy is becoming consumer-oriented, and that means more imports and less exports. In turn, that means less need for the purchase of U.S. government debt.
- A trade deal would speed up this process.
- The U.S. government’s ability to finance itself without foreign government purchases of its bonds is becoming a significant concern for powerful money managers like Larry Fink of Blackrock.
- The bottom line: A trade deal is good for stock markets and gold, but it likely flips the U.S. government’s financial situation out of the fry pan… and into the fire!
- Clearly, the current global-macro situation is extremely positive for gold. What about the technical situation? For the answer to that question, please click here now. Double-click to enlarge this daily gold chart.
- It really doesn’t matter whether gold makes a beeline for my new $1400 target immediately, or whether there’s a “pitstop” in the $1300-$1280 support zone.
- It doesn’t matter because the big picture fundamentals and technicals are outrageously positive, so there’s no need for fear amongst investors.
- Please click here now. Double-click to enlarge. The higher-price implications of the technical action on this weekly gold chart are obvious. The $1000/ounce price zone is major support, $2000 is resistance, and $3000 is the target price!
- The world’s need for dollars is declining, for a multitude of reasons. Please click here now. Whether it’s caused by the simple but gargantuan growth of the Chinese and Indian economies, or the U.S. government’s “My way or the highway” approach to sanctioning Russia, bank and government entities around the world are steadily distancing themselves from the dollar.
- Gold is the best way for individuals, banks, and governments to do that. The buy programs of emerging central banks are only in their infancy, and the tonnage being bought is consistently rising.
- As somebody who aggressively bought the U.S. stock market right into the October 2008-March 2009 lows, I can assure the Western gold community that there is no event to fear in the current gold market. The market is rock-solid.
- The rise of the Eastern economies is a titanic force that is creating both de-dollarization and demand growth for gold. Citizens of the East view gold as the best investment asset from both a risk and reward perspective. Their view is now being adopted by more and more Western money managers. In time (and not much time), this positive view of gold will also be the view of the average American citizen. Gold bashers like Warren Buffett prospered in the fiat era, but that era is waning fast. A new bull era is being born and all roads lead to gold.
- Please click here now. Double-click to enlarge this interesting GDX chart. Merger-mania is underway in the gold and silver mining stocks and there’s “bull flag mania” on the daily GDX chart!
- Larger gold mining entities are required to service the global demand growth for gold. I’ve predicted that Chinese miners, banks, and industrial companies will ultimately be involved in mergers with Western mining companies.
- In the coming years, gold miners could become as important as the giant base metal miners.
- Please click here now. Double-click to enlarge. That’s another look at the GDX daily chart, with the support zones highlighted. Mining stock enthusiasts should be buyers of their favourite miners any time GDX trades at a support zone.
- Gold stock investors should understand that the current market is not like the early 2000s, 2007, or 2016. This is a market like the 1970s, and the upside fun… has only just begun!
Special Offer For Website Readers: Please send me an Email to freereports4@gracelandupdates.com and I’ll send you my free “Gold Stocks Merger Mania!” report. I highlight ten fabulous gold miners that are ripe to be taken over, with key buy and sell points for each stock! Email me today, and I’ll send it to you today!
Stewart Thomson
Graceland Updates
Email:
Stewart Thomson is a retired Merrill Lynch broker. Stewart writes the Graceland Updates daily between 4am-7am. They are sent out around 8am-9am. The newsletter is attractively priced and the format is a unique numbered point form. Giving clarity of each point and saving valuable reading time.
Risks, Disclaimers, Legal
Stewart Thomson is no longer an investment advisor. The information provided by Stewart and Graceland Updates is for general information purposes only. Before taking any action on any investment, it is imperative that you consult with multiple properly licensed, experienced and qualified investment advisors and get numerous opinions before taking any action. Your minimum risk on any investment in the world is: 100% loss of all your money. You may be taking or preparing to take leveraged positions in investments and not know it, exposing yourself to unlimited risks. This is highly concerning if you are an investor in any derivatives products. There is an approx $700 trillion OTC Derivatives Iceberg with a tiny portion written off officially. The bottom line:
Are You Prepared?
Feb 26, 2019
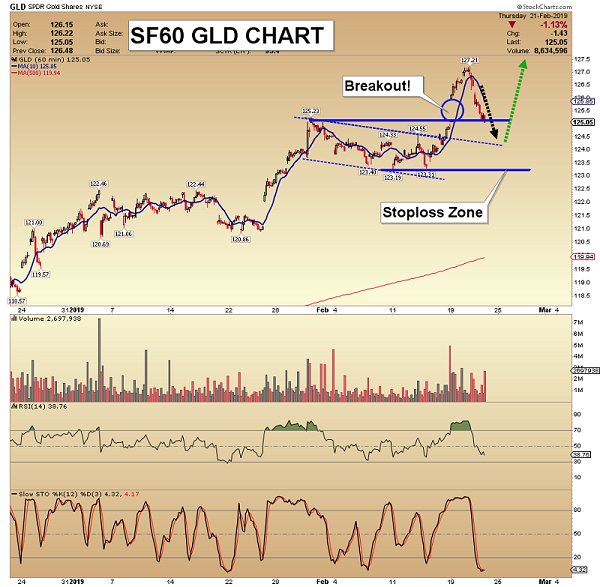
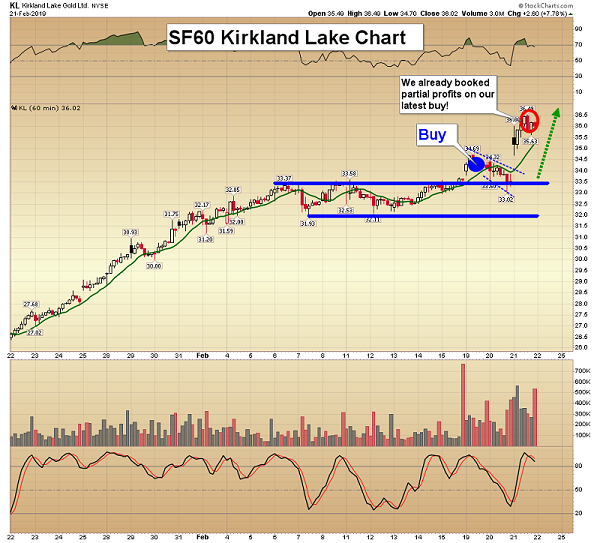
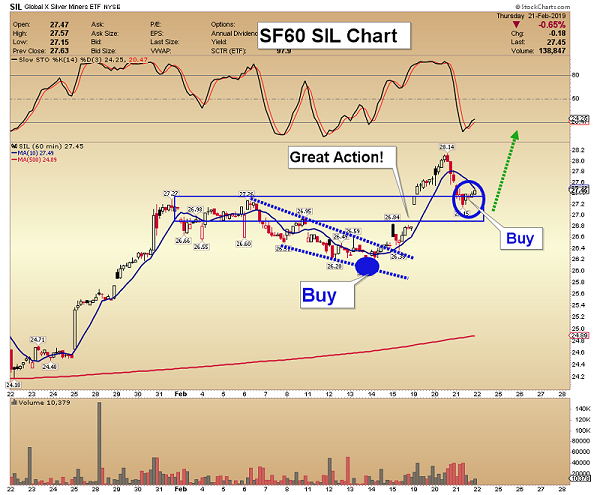
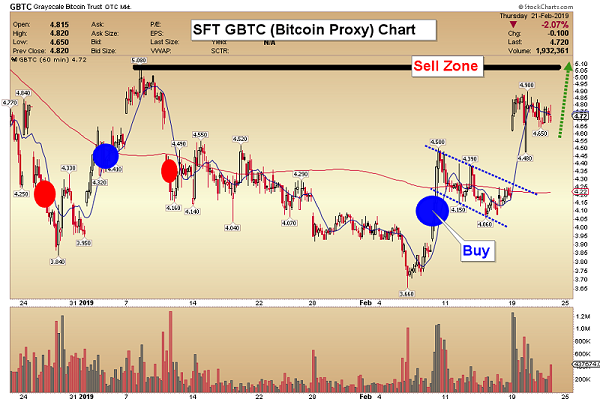
Here are today’s videos and charts (double-click to enlarge):
SFS Key Charts, Signals, & Video Analysis
SF60 Key Charts, Signals, & Video Analysis
SF Trader Key Charts, Signals, & Video Analysis
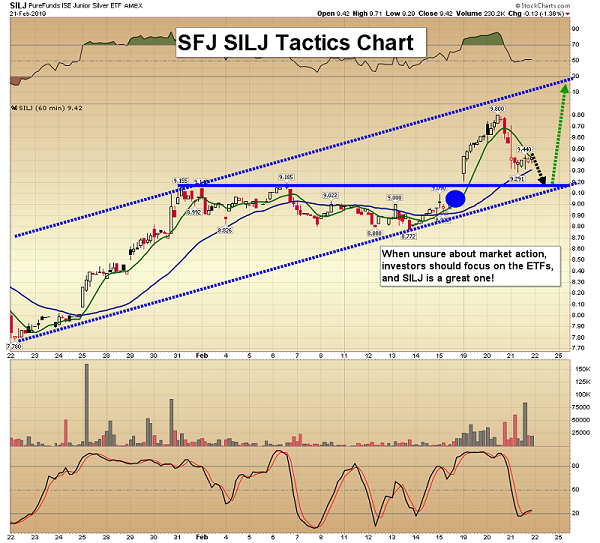
SFJ Key Charts, Signals, & Video Analysis
Thanks,
Morris Hubbartt
Unique Introduction For Web Readers: Send me an email to signals@superforcesignals.com and I’ll send you my “Hot Off The Press” junior miners free report, and 3 of my next Super Force Surge Signals free of charge, as I send them to paid subscribers. Thank you!
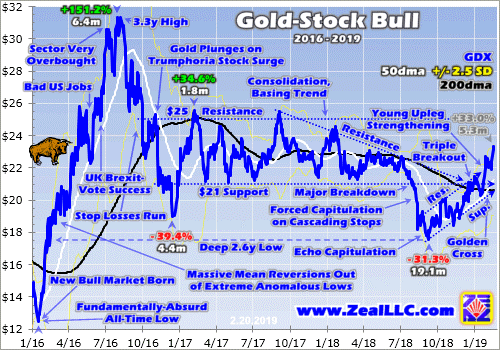
The gold miners’ stocks surged strongly last week, blasting to new upleg highs. The mounting gains are naturally driving more interest in this small contrarian sector, shifting sentiment towards bullish. Despite their accelerating rally, gold stocks still remain fairly low technically and deeply undervalued relative to gold. So their strengthening upleg likely has plenty of room to run considerably higher in coming months.
The gold miners’ stocks are ultimately leveraged plays on gold, which overwhelmingly drives their profits. The much-maligned yellow metal has enjoyed a strong upleg since mid-August, when record gold-futures short selling pounded it to a deep 19.3-month low of $1174. Gold has been gradually powering higher on balance ever since, surging near $1341. That makes for 14.2% gains over 6.1 months, an excellent run.
Gold miners’ earnings are amplifying these higher gold prices, driving this parallel gold-stock upleg. This is readily evident in the most-popular gold-stock benchmark, the GDX VanEck Vectors Gold Miners ETF. Launched back in May 2006, GDX has an insurmountable first-mover lead. This week its net assets of $11.1b were a whopping 50.6x larger than the next-biggest 1x-long major-gold-miners-ETF competitor!
The gold stocks as measured by GDX have certainly capitalized on gold’s advance. Between its own brutal 2.6-year low in early September and this week, GDX has surged 33.0% higher in 5.3 months. That works out to gold stocks leveraging gold’s gains by 2.3x in recent months. That is right in line with the 2x to 3x usually seen historically in the major gold miners. Many smaller gold miners are doing even better.
As this upleg was being born and growing, I wrote multiple essays explaining what was happening and why it was important to get heavily long gold stocks. We filled the trading books in our newsletters with great smaller gold and silver miners with superior fundamentals to the majors. Our unrealized gains this week were already running 60%+ on multiple trades! This young gold-stock upleg is even now quite lucrative.
While it is always better to buy in earlier than later, GDX’s 33.0% upleg to date remains relatively small. In essentially the first half of 2016, GDX soared 151.2% higher in just 6.4 months in its last major upleg! Really-big uplegs are par for the course in the volatile gold-stock sector. Gold stocks’ last secular bull ran from November 2000 to September 2011. Half of that was in the pre-gold-stock-ETF era before GDX’s launch.
During that long 10.8-year span, the classic HUI NYSE Arca Gold BUGS Index skyrocketed an incredible 1664.4% higher! That life-changing secular bull consisted of 12 separate uplegs. One was an anomaly, the mean reversion out of 2008’s first stock panic in a century. Excluding that behemoth, the 11 normal ones averaged hefty gains of 80.7% over 7.9 months. So GDX’s recent run is nothing by this sector’s standards.
At this stage all gold stocks have really done is regain their sharp late-summer losses. This GDX chart over the past few years or so illuminates the gold-stock technicals. The major gold miners’ stocks have merely climbed back up into their multi-year consolidation basing trading range. The lion’s share of this upleg’s gains are most probable as GDX breaks out above longstanding resistance, likely in coming months.
For fully 21.5 months leading into August 2018, GDX consolidated in a well-defined trading range from $21 lower support to $25 upper resistance. That sideways grind bled away bullish psychology, leading many traders to abandon this drifting sector. By late last summer not many were left, and most of them were soon driven out too. August’s extreme record gold-futures short selling spawned a washout in gold stocks.
Because this sector is so volatile, running loose trailing stops is essential for managing risk. The lower gold was hammered, the more selling pressure mounted in its miners. That forced them to stop losses, unleashing more mechanical selling and fueling a vicious circle. Gold stocks cascaded lower in a brutal forced capitulation into mid-August, and a secondary echo capitulation bashed them lower still in early September.
GDX’s $21 support was shattered as this benchmark ETF plunged to $17.57 by mid-September. Several days later I published an essay Gold-Stock Forced Capitulation explaining all this right in those depths of bearish despair. I concluded “…the aftermath of capitulations is exceedingly bullish. … The technicals and sentiment spawned by capitulations are so extreme they usually birth massive uplegs and entire bull markets.”
With GDX just plunging to an extreme and unsustainable 2.6-year low, we were aggressively buying great gold stocks and recommending them to our newsletter subscribers. Being bullish when everyone else was bearish was the right call of course. The gold stocks started powering higher in their upleg persisting to today. I did my best to let speculators and investors know about the great upside opportunities in this sector.
Since that forced-capitulation essay, I’ve published 23 more weekly essays on subsequent Fridays. Fully 14 of those were about gold stocks, exploring their deep undervaluation relative to gold, their excellent technicals, and strong fundamentals. If you want to multiply your wealth in the stock markets, you have to pay attention all the time. Most traders make the costly mistake of ignoring sectors until they get exciting.
I’ve been trading stocks for over three decades now, and doing it full-time professionally to earn a living for two-thirds of that long span. One of the most-important lessons I’ve learned is it’s critical to always keep plugged in. If you are not following the markets, you are missing great opportunities. The only way to buy low before later selling high is staying abreast of beaten-down sectors, especially when they are despised.
The gold stocks kept marching higher on balance after that anomalous forced capitulation, carving higher lows and higher highs. In mid-October with GDX under $19 I explained why gold stocks were Stocks’ Last Cheap Sector. I concluded, “These gold miners’ stock prices are wildly undervalued relative to the metal which drives their profits. So they are overdue for a massive mean reversion and eventually overshoot.”
This new gold-stock upleg mostly drifted sideways in November, discouraging even early contrarians. I did my usual quarterly analyses of the newest Q3’18 results of the major gold miners of GDX and mid-tier gold miners of the GDXJ Van Eck Vectors Junior Gold Miners ETF. This critical fundamental homework proved “…the major gold miners’ fundamentals remain far stronger than implied by their left-for-dead stock prices.”
While few traders cared about gold stocks in this upleg’s initial few months, December’s action started to change that. Gold surged 4.9% higher to $1282 that month as the US stock markets rolled over into a severe near-bear correction. Down 19.8% at worst since its late-September peak, the flagship S&P 500 broad-market stock index plunged 9.2% in its worst December since 1931 in the midst of the Great Depression!
The gold miners’ stocks ignored the burning stock markets to follow gold higher and leverage its gains like usual. GDX blasted up 10.5% that month, amplifying gold’s strong advance by a solid 2.1x! Finally this young gold-stock upleg was getting big enough to attract traders’ attention. I continued to do my best to spread awareness, writing about an imminent Gold-Stock Triple Breakout in mid-December with GDX near $20.
This leading gold-stock benchmark was on the verge of breaking out above three major upper-resistance zones simultaneously. These included the old $21 support of its consolidation basing trend, a downward-sloping resistance line from a bearish descending-triangle technical pattern, and most importantly GDX’s key 200-day moving average. Gold stocks’ improving technicals were on the verge of getting far more bullish.
I concluded, “Three major GDX resistance zones have converged just above current levels. Once the gold stocks surge decisively over, the technically-oriented traders will take notice. They will likely start chasing the momentum accelerating the gains, with buying begetting buying.” That indeed came to pass. By early January that super-bullish upside triple breakout in GDX had already become a fait accompli.
I wrote another essay Gold-Stock Upleg Breaking Out to explain the huge upside potential the gold stocks had after clearing those essential technical hurdles. I concluded this gold-stock upleg “is now surging in a major upside breakout that should unleash a flood of new buying. With gold climbing on balance too, everything is in place to fuel a major gold-stock upleg.” There were many opportunities to buy gold stocks low.
January was a roller-coaster month for gold stocks, with GDX rallying then swooning then surging to big new upleg highs at month-end. But on balance this leading gold-stock benchmark continued carving both higher lows and higher highs. In late January I explained why Gold-Stock Upleg Pauses were nothing to worry about. All major uplegs flow and ebb, surging two steps forward before slumping one step back.
Speculators and investors needed to remember that “Uplegs don’t shoot higher in straight lines, pullbacks within them are normal and expected. They serve to rebalance sentiment keeping uplegs healthy.” Then in early February GDX flashed one of the most-powerful buy signals of all, the fabled Golden Cross. That is when its 50dma crosses back above its 200dma soon after a major secular low in GDX, a wildly-bullish omen.
But gold stocks again retreated in early February after surging in late January, again worrying traders who lacked perspective. So a couple weeks ago with GDX just over $22, I published another essay showing Gold Stocks Gather Steam. It explained that rare Golden Cross buy signal and concluded, “All this has really started to shift sentiment back to bullish, which will attract in lots more capital to chase the momentum.”
That indeed proved correct again. The more you study markets, the deeper you understand them and the more sense their seemingly-capricious rhythms make. The more your market experience and knowledge grow, the higher the odds you can figure out what’s most likely next. If you aren’t in a position to watch markets full-time for decades, it’s essential to spend a little time and money to learn from someone who is and has.
I started investing in stocks when I was 12 years old, using money earned from summer jobs. I had very little market knowledge in those early years. So I subscribed to a few financial newsletters written by market experts with vastly more experience and wisdom than me. Their hard-earned insights from long decades of study kept me on the right track to gradually grow my meager capital at the time. I loved those guys!
Universally in life, the more time anyone spends doing anything the better they get at it. Success is often directly proportional to time on task. So if you can’t or don’t want to devote your life to trading, you need to diligently and consistently learn from those who have. Being right on this gold-stock upleg is no big deal, as it’s been garden-variety and in line with precedent so far. It has been both predictable and gameable.
After drifting lower in the first half of February, GDX started surging again late last week. Heading into last weekend the major gold stocks enjoyed solid 1.0% and 1.3% daily rallies per this ETF. Those were directly driven by gold climbing 0.5% and 0.7% after slumping to its own mid-month lows. While US stock markets were closed Monday, that gold-stocks-rallying-and-amplifying-gold trend really accelerated on Tuesday.
After edging up to a new upleg high last Friday, gold continued climbing modestly in foreign trading over the long weekend in the U.S. By Tuesday morning gold-futures speculators were seeing gold at its best levels in 10.1 months. So they apparently rushed to buy, catapulting gold 1.5% higher to $1341! GDX surged 3.2% that day, leveraging gold’s advance by 2.1x. That momentum drove another 1.0% rally Wednesday.
But despite the major gold stocks climbing 33.0% in 5.3 months as of the middle of this week, they remain fairly low technically. At $23.36, GDX was merely back up to the middle of its old multi-year consolidation basing trend between $21 to $25. Traders aren’t going to get really excited until GDX powers decisively above $25 for the first time since mid-2016. While improving, gold-stock psychology is still relatively bearish.
I suspect GDX will challenge $25 in the next few months. Though this sector often experiences a seasonal lull into mid-March, gold stocks then enjoy a strong spring rally. As long as gold continues slowly climbing on balance, the gold stocks have excellent upside potential. Remember GDX’s last major upleg soared 151.2% in essentially the first half of 2016, and the prior secular gold-stock bull’s uplegs averaged +80.7%!
While the major gold miners’ technicals and sentiment both support bigger gains to come, perhaps the most-bullish argument of all comes from the fundamental side. The gold stocks remain relatively low compared to prevailing gold prices, the metal which directly drives their profits. They need to mean revert much higher to regain normal levels compared to gold. A simple ratio of gold stocks to gold illustrates this.
The GLD SPDR Gold Shares is the world’s dominant gold ETF. Dividing GDX’s daily close by GLD’s daily close yields the GDX/GLD Ratio, a great fundamental proxy for gold-stock valuations. Hammered to the low side by gold stocks’ late-summer forced capitulation, the GGR is just now regaining average levels for recent years’ gold bull. But mean reversions rarely stop at the averages, instead overshooting proportionally.
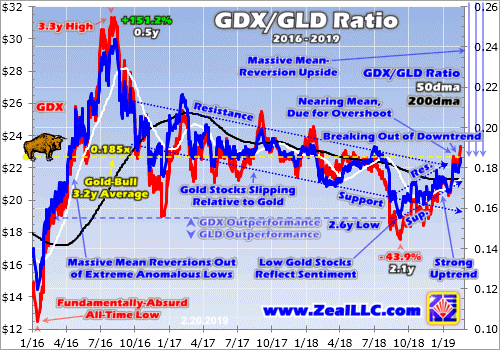
I explained this chart in depth a couple weeks ago in another essay, so just a brief update today. This Wednesday the GGR clawed back up to 0.185x, which is exactly at the 3.2-year average since today’s gold bull was born in mid-December 2015. At worst in mid-September, the GGR plunged to a deep 2.6-year secular low of 0.155x. That was 0.030x under this bull’s mean, portending a proportional overshoot higher.
Before this gold-stock upleg gives up its ghost, the odds really favor the GGR surging back to 0.215x. At this week’s gold-upleg-to-date high of $126.70 in GLD, that implies GDX near $27.25. That would be a powerful breakout above that old $25 consolidation-trend resistance line, and would catalyze a lot more trader interest in this small sector! It would extend this current gold-stock upleg’s gains to a more-normal 55.1%.
But if gold keeps rallying like it ought to as these overvalued and overbought US stock markets roll over again, the potential gold-stock upside is far greater. $1400 gold is just 4.4% above this week’s levels, not a stretch at all. That would be a new bull-market high exceeding July 2016’s $1365, generating serious excitement to attract in new traders. At a proportional-overshoot 0.215x GGR, that leaves GDX near $28.50.
That’s still not particularly high, as GDX traded over $31.25 in early August 2016 in its own gold-bull-to-date peak. With speculators and investors actually excited about gold stocks then, the GGR hit 0.244x. Apply that to $1400 gold, and the GDX target climbs above $32.25. That would grow this upleg to +84%, right in line with the prior secular bull’s average. Make no mistake, the gold-stock upside from here is still big!
And that’s just this upleg, not the entire gold-stock bull. In the 2 years before 2008’s stock panic radically changed the markets, the GGR averaged 0.591x. In the 2 years after of 2009 and 2010, the GGR was still far higher than recent levels averaging 0.422x. Plug in the much-higher historical GGRs seen when gold stocks were far more popular, and higher gold prices, and GDX’s potential upside in this bull gets huge.
The best gains in today’s mounting gold-stock upleg are likely still yet to come. While you can play it in GDX, the major gold miners dominating this ETF are really struggling to grow their production. And that problem is even worse in the newly-merged super-majors, further retarding GDX’s performance. So the best gains will be won in smaller gold miners with superior fundamentals that are still expanding their outputs.
The earlier you get deployed, the greater your gains will be. That’s why the trading books in our popular weekly and monthly newsletters are currently full of better gold and silver miners mostly added in recent months. The gains we won in 2016 were amazing the last time American stock investors returned to gold. Our newsletter stock trades that year averaged +111.0% and +89.7% annualized realized gains respectively!
Coming gold-stock gains should be similarly huge as today’s strengthening gold and gold-stock uplegs grow. To multiply your wealth in the stock markets you have to do your homework and stay abreast, which our newsletters really help. They explain what’s going on in the markets, why, and how to trade them with specific stocks. You can subscribe today for just $12 per issue! That’s a trivial pittance for decades of hard-won market experience, knowledge, wisdom, and ongoing research.
The bottom line is gold stocks just surged higher again, their upleg getting stronger on balance. GDX continues to carve higher lows and higher highs, fueling improving sentiment. More traders are getting interested in this sector and bringing in more capital, driving gold stocks higher to strengthen a virtuous circle of buying. Gold-stock technicals, sentiment, and fundamentals all argue for bigger gains to come.
This current upleg remains relatively small by sector precedent. And gold stocks are just regaining their bull-average levels relative to gold, with lots of room to rally on a proportional mean overshoot. While a seasonal lull nears, mid-upleg pullbacks or consolidating drifts are normal and healthy. This gold-stock upleg is likely to grow a heck of a lot bigger in coming months’ major spring rally. Get deployed if you aren’t yet!
Adam Hamilton, CPA
February 25, 2019
Copyright 2000 – 2019 Zeal LLC (www.ZealLLC.com)
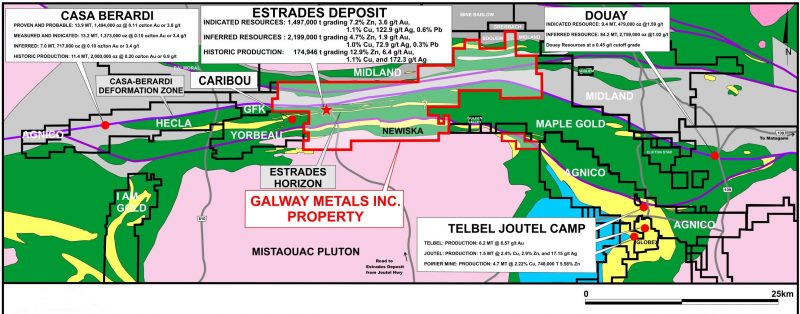
Galway Metals (GWM.V, GAYMF) is a Canadian exploration stock with two prospective projects located in strategic locations. Fundamentally, some things stand out.
1. Insiders
Over 30% of outstanding shares are in the hands of management and insiders. High quality management as both CEO and Chief Geo come from Kirkland Lake Gold (KL.TO) where they also held management positions. Another reputable insider is Wesdome’s (WDO.TO) CEO Duncan Middlemiss, who has an advising role at Galway Metals. Connections like these could be important in a later stage should
exploration continue in the current direction.
In the past year, 5 insiders have been buying their own stock, of which CEO Robert Hinchcliffe invested the highest amount. Through 2018, he bought $285,000 worth of stock in the open market and another $100,000 in a private placement. Other insiders put in between $25,000 and $88,000 of their own money into Galway Metals.
Insiders are dedicated as well. When looking at their personal holdings, the biggest part of this is held in GWM shares. Data like this can be retrieved on marketscreener.com. Management in this business usually has seats on more than one company’s board, which means they hold more than just one stock. Therefore, it’s interesting to see the weight of these. Allocations at Galway Metals show conviction: CEO 89%, VP 73%
and Chief Geo 47%.
2. History
Galway Metals was spun out of the Galway Resources takeover by AUX in 2012. At the time, Galway Resources was sold for $340M. Management is largely the same since then, so they’re experienced in growing an exploration stage company to one that’s prepared for production. Galway Resources (GWY) shareholders received a 47% premium in that deal.
3. Projects
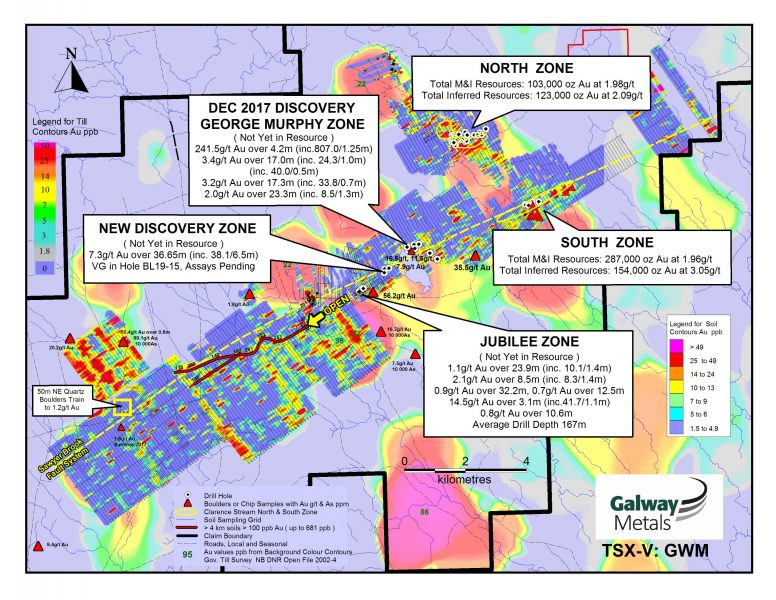
Galway Metals has 2 projects in Eastern Canada in mine friendly jurisdictions in areas where infrastructure such as roads, railways and mills are closeby. Both projects have an existing resource for both gold and industrial metals. One million ounces of gold have been mapped to date and if we add the other metals, there’s 1.8 million gold equivalent ounces. These past years there has been a resource upgrade yearly, and this year as well, they will upgrade their existing resources on both projects
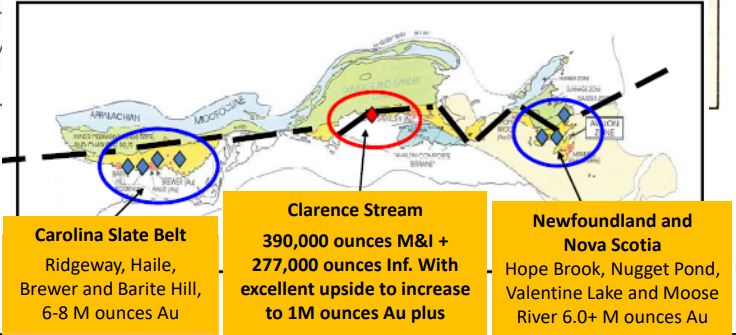
Clarence Stream
Located in mining friendly New Brunswick and in the proximity of a processing mill and (rail)roads nearby. Management hints that this project can represent a new gold district in Canada. Findings to date continue to prove this out: This project has 5 discovered zones thus
far on the main NE-SW trend with high possibility for new discoveries going by soil anomalies. Galway just announced assays from their fifth and new discovered zone: 7.3g/t over 36.7m (38.1g/t over 6.5m). A 50m stepout has been drilled which intersected visual gold twice. Results from this are pending.
This new discovery is in the middle of two known zones (Jubilee and George Murphy) that are 2km apart. Galway controls 65km of this main NE-SW trend and management believes this shares the same structure and has similar geology as Marathon’s (MOZ.TO) Valentine Lake project. Only 5km have been drilled and all zones are open in every direction. Wide mineralization at shallow depths with grades which would make this suitable for open pit mining.
Estrades
Polymetallic project that saw production in 1990-1991:174,946 tonnes grading 6.4 g/t Au, 172.3 g/t Ag, 12.9% Zn and 1.1% Cu. Previous owner stopped production when metals prices dropped in 1991. Since then this former mine has been dormant for over 25 years. Located in mining friendly Québec with multiple deposits, active and historic mines in
the proximity. 31km of strike hosting 3 mineralized trends which hold a resource that’s high in Zinc (20.75% ZnEq) and Gold (11.28g/t AuEq).
Just like the Clarence Stream project, this is currently being drilled so news from here should flow in coming weeks.
4. Cashed up
All that drilling costs money. Therefore, it’s interesting to know that Galway has about $7M in the bank after a recently closed private placement (in which 4 insiders participated), which means they can continue this aggressive exploration. Galway Metals doesn’t have any debt. Also of importance is that chief geo and vice president bought warrants with an execution price of $0.50, which -when executed- will add $750,000 to the treasury.
5. Catalysts 2019
Two catalysts this year for a revaluation. Catalyst # 1: Exploration success and new discoveries on Clarence Stream and Estrades. On Clarence stream, investors have a couple of pending results to look
forward to from drill cores that showed visual gold as well as future step-out holes from current zones. Catalyst # 2: Resource upgrade 2019 including the new zones. Management pointed at a resource upgrade this year that will – for the first time- include 2 new zones at Clarence Stream.
6. Comparables and valuation
When looking at other Eastern Canadian companies that share this continent scale trend, it’s easy to see their Clarence Stream project is favourably located in between known multi million ounce gold camps.
Similarities with Oceanagold’s Haile mine, which is an open pit mine that shares shallow depth in combination with high grades. Another similar case is Atlantic Gold over in Nova Scotia. This has the same
widespread gold occurrences on their property and built a central processing facility that’s currently being fed by the surrounding deposits.
Galway is not yet at this stage and management may not have the intention to mine it themselves. Just going by similar geological features and challenges, it’s positive to see nearby succeeded projects.
As valuation goes, when looking at the only metric we can currently apply – which is the enterprise value on a proven gold ounce basis- we’re sitting at $17.4/oz whereas this sector’s (pre feasibility) average is $52/oz. Noteworthy that this number is based on the current resource, that only holds 2 of the 5 zones at Clarence Stream.
7. In Closing
As said in the intro, Galway has a lot going for it. Two catalysts this year that will continue to get fed from multiple fronts. Galway has a rather tight share float (107M) and they don’t need to collect funds any
time soon, meaning that their share price will benefit with a leverage effect when exploration continues to deliver. Management is experienced, respected, committed and on the buying side. Not to be taken for granted in any sector. Eastern Canadian gold deposits are on the rise and going by the fundamentals there’s good potential that this too will turn out to be a multi million ounce deposit, eyed by producing mining companies. Going by the EV/oz metric, there should be plenty of room for upside.
Jonas De Roose
February 22, 2019
Author Jonas De Roose is a Belgian retail investor in precious and base metals stocks with a drive for research and learning. He has a background in business development and marketing. He owns shares in Galway Metals and his article is not intended as investment advice. This article is based on his findings and based on his personal opinion. If you have suggestions regarding this company feel free to contact him at jonasderoose@hotmail.com.
- As U.S. markets re-open after the holiday, the world’s “queen of assets” continues her glorious ascent to higher prices. Please click here now. Double-click to enlarge this magnificent short term gold chart.
- The rise above $1332 ushers in my new short-term target: $1355!
- Please click here now. Gold is well on its way to becoming a mainstream asset like stocks and bonds.
- The reason for that is the “citizen wealth effect” created by the relentless rise of China and India. These gold-oriented nations are well on their way to becoming the most gargantuan economic empires in the history of the world.
- It’s simple mathematics: There are eight Chindians for every American, and about half of the Chindians are under the age of 35.
- It’s an unstoppable force that I refer to as, “The Gold Bull Era”.
- In the West, gold has been traditionally bought only when major stock, bond, currency, and real estate markets get into trouble.
- In contrast, Chindian citizens view gold as the “ultimate asset”, meaning they buy it in both good times and bad.
- This view is beginning to gain acceptance amongst Western analysts and money managers and I’m predicting it will continue to do so for many decades.
- Gold’s role as ultimate asset was showcased in the September-December period when it rose while U.S. stock markets tumbled.
- Most gold bugs were stunned by the incredible price action, and even more stunned as the GDX gold stocks ETF soared too!
- Now, gold is rallying while U.S. stock markets rise, and most analysts are again somewhat shocked as their attempted top calls for gold fail repeatedly.
- This type of “win-win” price action is unique to gold and I’ll boldly state that it is essentially here to stay!
- Please click here now. Double-click to enlarge. On this daily chart, gold looks like a freight train that cannot be stopped.
- From a big picture technical perspective, this type of daily chart action is expected and normal. To understand why I say that, please click here now. Double-click to enlarge what I consider to be the greatest weekly chart in the history of markets.
- Gold appears to be rallying from the final right shoulder in a multi-shouldered inverse H&S bull continuation pattern. Incredibly, that pattern itself appears to be just the head of a much more gargantuan pattern with a target price of $3000!
- In this situation, the current “freight train” technical action being showcased by gold on the daily chart is perfectly normal.
- Please click here now. Double-click to enlarge this key GDX daily chart. A spectacular bull flag breakout occurred on Friday.
- In pre-market action this morning, the price is gapping higher.
- Please click here now. Double-click to enlarge. That’s another look at GDX on a short-term chart.
- With the bull flag breakout now in play, stop-loss enthusiasts can now raise their protective profit-locks from $20.10 to $21.75.
- Please click here now. Double-click to enlarge this silver stocks ETF chart.
- A classic staircase chart pattern is developing. Traders can raise protective stop-loss orders from $24 to $26.
- I recommend that all investors carry some silver and associated miners in their portfolios and the $26 stop-loss level for SIL-NYSE allows investors to board this precious metals “freight train” with minimal risk and maximum potential reward!
Special Offer For Website Readers: Please send me an Email to freereports4@gracelandupdates.com and I’ll send you my free “Golden Cogs In The Bull Era Wheel!” report. I highlight six of the hottest mining stocks in the world that are poised to lead the sector in 2019, with pinpoint tactics to help traders and investors get richer!
Thanks!!
Stewart Thomson
Graceland Updates
Email:
Graceland Updates daily between 4am-7am. They are sent out around 8am-9am. The newsletter is attractively priced and the format is a unique numbered point form. Giving clarity of each point and saving valuable reading time.
Risks, Disclaimers, Legal
Stewart Thomson is no longer an investment advisor. The information provided by Stewart and Graceland Updates is for general information purposes only. Before taking any action on any investment, it is imperative that you consult with multiple properly licensed, experienced and qualified investment advisors and get numerous opinions before taking any action. Your minimum risk on any investment in the world is: 100% loss of all your money. You may be taking or preparing to take leveraged positions in investments and not know it, exposing yourself to unlimited risks. This is highly concerning if you are an investor in any derivatives products. There is an approx $700 trillion OTC Derivatives Iceberg with a tiny portion written off officially. The bottom line:
Are You Prepared?
Roughly one year ago and prior to that we observed that the gold stocks could be following the recovery template from what we deemed a “mega bear market.”
We define that as a bear market that is over two and a half years in time and over 80% in price. It cuts both ways.
The gold stocks from 2011 to January 2016 had declined more than 80% and for more than four years. It was a textbook mega bear market.
The sharp recovery in 2016 quickly faded and left us wondering if there was a historical comparison.
Turns out, there are three strong and relevant comparisons.
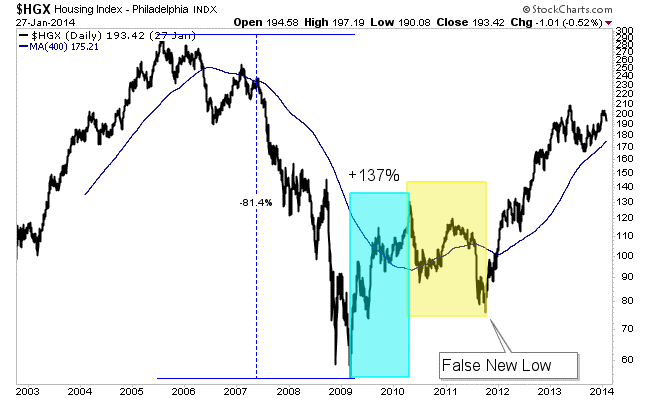
The housing sector declined 81% from its peak in 2005 to the market bottom in March 2009. Then it rebounded 137% before correcting 42% over 18 months. The correction ended with a false new low.
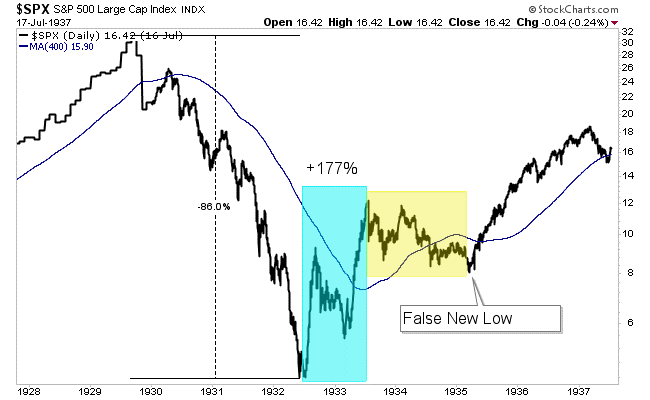
The S&P 500 crashed nearly 90% over a nearly three year period. Then it rebounded 177% before correcting for 20 months. That correction also ended in a false new low.
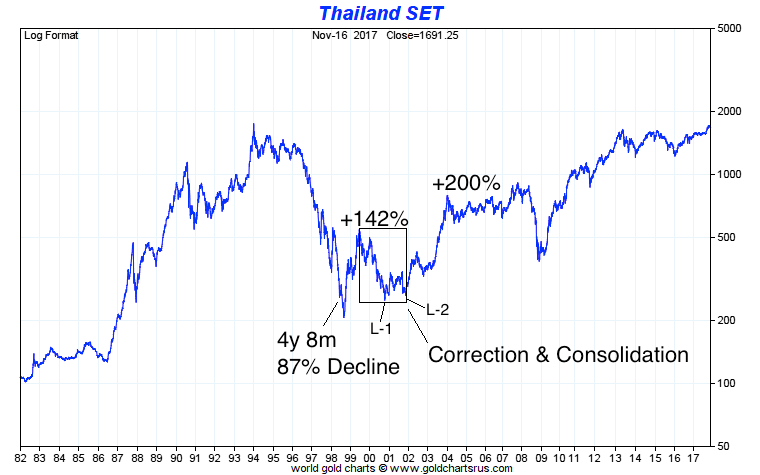
Thailand from 1994 through 2000 is quite similar to the gold stocks from 2011 through 2016. Before its 200% move higher from 2002 through 2003, Thailand corrected 54% over a 2-year and 5-month period.
Note that its final low at the end of 2001 could have been a false new low if not for the initial sharp correction down to L1.
The template for a recovery from a mega bear market is as follows.
Following the bear market low, a sharp rally begins that lasts only six to twelve months. Then the market endures a significant correction that lasts a minimum of 18 months and ends with a breakdown to new lows (which ends up being a false move).
Then the major wave higher begins.
Here is the data on those three examples, another one (Mortgage sector) and the gold stocks (GDX).
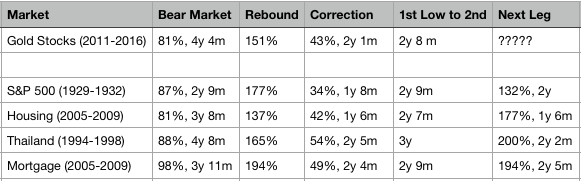
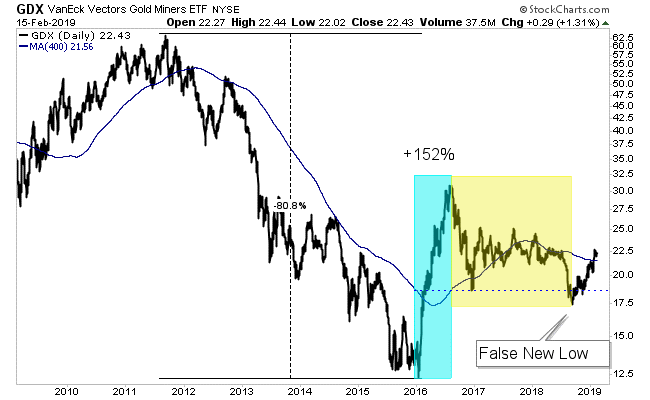
Note how the time between the bear market bottom and the correction low (for the gold stocks) is almost identical to three of the four examples. Also, note how the second leg higher surpassed the initial rebound in each example (ex S&P 500).
Here is how GDX stacks up (visually) with the others. Its rebound (and potentially second leg higher) began after the false breakdown in September.
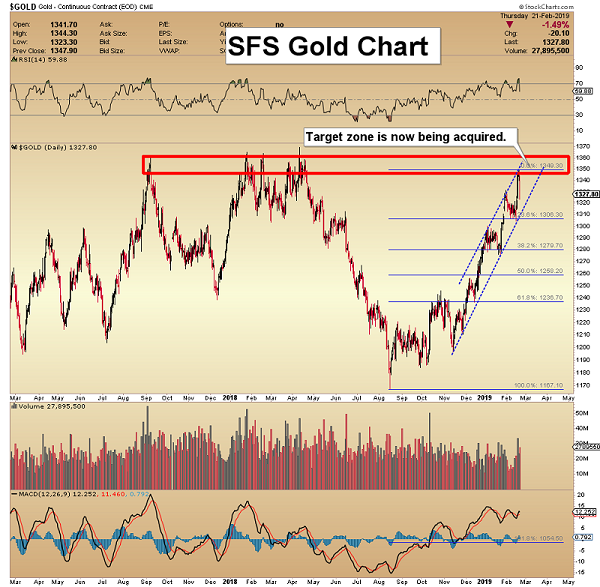
Last week we asked the question whether gold stocks would correct or consolidate in a bullish fashion. The evidence now favors a bullish consolidation. As a result, we are looking at potential near-term upside targets of $1350-$1360 for Gold, $25 for GDX and $37 for GDXJ.
The short-term trend is healthy and this historical comparison is table-pounding bullish. We’ve been increasing our exposure and will continue to do so. Plenty of great values remain and there is time to position yourself to take advantage. To learn what stocks we are buying and think have 3x to 5x potential consider learning more about our premium service.
February 20, 2019
by Jordan Roy-Byrne
The world’s two biggest gold miners both announced mega-mergers over the past 5 months or so. These huge deals briefly garnered some interest in the usually-forgotten gold-stock sector, and fleeting praise from Wall Street analysts. But gold-stock mega-mergers are bad news for gold-miner shareholders on all sides. They reveal the serious struggles of major gold miners, and really retard future upside in their stocks.
For decades the largest gold miners in the world have been Newmont Mining (NEM) and Barrick Gold (ABX). These behemoths have long dwarfed all their peers in operational scope. While the gold miners are in the process of reporting Q4’18 results now, their latest complete set remains Q3’18’s. As after every quarterly earnings season, I analyzed them in depth for the major gold miners of GDX back in mid-November.
The GDX VanEck Vectors Gold Miners ETF is the world’s leading and dominant gold-stock investment vehicle. In Q3 alone NEM and ABX mined a staggering 1286k and 1149k ounces of gold! To put this in perspective, the average of the next 8 largest gold miners rounding out the top 10 was just 508k ounces. Newmont and Barrick have long been in a league of their own, with commensurate market capitalizations.
In mid-November NEM and ABX were worth $17.1b and $14.9b, granting them massive 11.0% and 9.5% weightings within GDX. These two gold giants alone accounted for over 1/5th of GDX! That gives them outsized influence in not only that ETF, but in the entire gold-stock sector. GDX is the sector benchmark of choice for gold stocks these days, so the fortunes of NEM and ABX stocks really affect overall performance.
Gold-mining stocks are generally divided into three tiers based on their production. Anything over 1000k ounces annually is considered a major, which works out to 250k per quarter. NEM and ABX produced so much gold in Q3 they exceeded this threshold by a colossal 5.1x and 4.6x! They are really super-majors. Mid-tier gold miners produce between 300k to 1000k ounces every year, while juniors are under 300k.
Back on September 24th, 2018, Barrick Gold shocked the gold-stock world. It announced it was merging with Randgold (GOLD), which was really an all-stock acquisition of GOLD by ABX worth $6.5b. Barrick shareholders would own 2/3rds of the new combined company, while Randgold’s would own the rest. To avoid confusion, this essay uses the classic ABX and GOLD stock symbols to represent Barrick and Randgold.
ABX had been Barrick’s ticker for decades, but was just recently abandoned on January 2nd. With this mega-merger finished, the new company took over the excellent GOLD symbol going forward. That is a wise decision, as anyone who types “gold” into any brokerage account will see Barrick Gold. Years ago before Randgold got that coveted symbol, another major miner had it and really seemed to benefit from it.
In Q3 Randgold was the 10th-largest gold miner in the world producing 309k ounces. Added on top of Barrick’s 1149k, the new combined 1458k would take back the top-gold-miner crown from Newmont which produced 1286k that quarter. Apparently size matters a lot when you’re a gold-mining executive. But with both ABX and GOLD suffering chronic declining production, that mega-merger reeked of desperation.
Newmont’s leadership wasn’t happy with losing the pole position among global gold miners. So it soon got to work on looking for a mega-merger of its own. On January 14th, NEM announced it was acquiring major miner Goldcorp (GG) in an all-stock deal worth $10.0b! That looked like one-upmanship taking it to Barrick. NEM and GG shareholders would own about 2/3rds and 1/3rd of the new combined colossus.
Goldcorp was the world’s 7th-largest gold miner in Q3’18, producing 503k ounces of gold. Added on to Newmont’s 1286k, that creates a new monster running at an unprecedented 1789k-ounce quarterly rate! If bigger is better, these new combined super-major gold miners ought to be the best seen in history. But unfortunately in gold mining that isn’t true, and these new giants will likely fare worse than if they hadn’t merged.
In their merger announcements, the CEOs of all 4 of these major gold miners tried hard to sell their deals as wonderful news for shareholders. They argued that synergies and cost savings would make these new combined titans more effective at producing superior returns for their shareholders going forward. And as always with any large merger, Wall Street analysts universally applauded these mega-mergers as good.
Sadly the opposite is likely true, these deals are bad news for all the owners of Newmont and Barrick as well as former owners of Goldcorp and Randgold. These new giant super-majors are even bad news for the gold-mining sector as a whole. The odds are really high that their stocks will really underperform the smaller major, mid-tier, and junior gold miners in coming years. That will hurt this entire sector on multiple fronts.
Contrary to their CEOs’ marketing propaganda, none of these four major gold miners approached these deals from positions of strength. They’ve all been struggling with weakening production and rising costs. Gold mines are wasting assets that are constantly depleting, and it is increasingly challenging to find new gold to mine economically at the scale and pace the majors need. These mergers didn’t solve that core problem!
This table looks at the quarterly production, its year-over-year change, and all-in sustaining costs per ounce mined of Barrick, Randgold, Newmont, and Goldcorp during today’s secular gold bull. It started in late Q4’15 out of deep 6.1-year secular lows in gold. Barrick deleted Randgold’s old website, so there is no Q4’15 GOLD data. And as of Wednesday afternoon NEM and GG hadn’t yet reported full Q4’18 results.
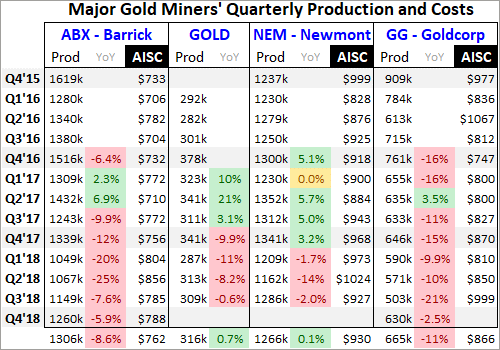
Barrick and Newmont didn’t just effectively dilute their shareholders by 50% for some relatively-meager cost-saving synergies, but because they can’t grow their production internally. ABX’s gold mined each quarter has been falling sharply on balance for years! It has seen brutal YoY drops as high as 25.5%, which ought to be impossible for a world-class gold major. 7 of the last 9 quarters have seen big declines.
Barrick’s average quarterly production since Q4’16 plunged an astounding 8.6% YoY. The reason Barrick’s management blew $6.5b in stock buying Randgold is they desperately needed more production to mask the precipitous drop in their own. Barrick’s total 2018 production of 4525k ounces was 18.0% below the 5516k it mined only a couple years earlier in 2016. At best adding Randgold just regains those losses.
And GOLD has been suffering the same production struggles as ABX. Over its past 4 reported quarters, Randgold’s gold mined has fallen an average of 7.4% YoY. Can bringing two rapidly-depleting major gold miners together magically make a stronger one? I doubt it. Barrick’s reported production will enjoy a big temporary boost for its first four quarters as a merged company, and then waning production will again be unmasked.
While the new giant Barrick will have more capital to develop new gold mines and expand existing ones, it seems unlikely that will be enough to turn this super-major around. Barrick and Randgold operated about 12 and 4 gold mines respectively pre-merger. So bringing another few online in coming years might not move the needle enough to outpace depletion. And it takes over a decade to permit and build new mines.
The entire gold-mining industry has been greatly starved of capital largely since 2013, with 2016 being a modest exception. Thus the big investments necessary to find new large-scale gold deposits and slowly advance them to mine builds have been severely lacking. So this whole industry’s pipeline of new gold to mine has been crippled, all but pinched shut. Declining miners merging does little to solve this problem.
Newmont has fared way better than Barrick in recent years, actually enjoying strong production growth on balance from Q4’16 to Q4’17. But this past year even mighty NEM has started to suffer from waning gold production. It averaged 5.9% YoY declines in the first three quarters of 2018. I suspect NEM is just a little behind ABX in rolling over into depletion outpacing mining growth. ABX’s merger forced NEM to act.
While Goldcorp was long celebrated as the world’s best major gold miner, it has been struggling for years with slowing production. Over the last 9 quarters GG only saw one modest production gain, with its gold mined dropping a colossal 11.0% YoY each quarter on average! So although GG produces about twice as much gold as Randgold, it might be a worse acquisition target due to its faster pace of shrinking production.
Like ABX and GOLD, it’s hard to imagine combining two more weakening majors NEM and GG will yield a way to stop and reverse their falling production. Again for their first four quarters together this new giant Newmont will appear to see big annual production growth. But once that post-merger comparison rolls past, the declining gold across all its mines will again be revealed. Mega-mergers can’t negate mine depletion.
Randgold didn’t even bother reporting industry-standard all-in sustaining costs, which is why they’re not included above. But its cash costs were often on the high side, so it’s likely the new combined company will drag overall mining costs higher. Barrick’s major-leading low AISCs aren’t likely to last with GOLD’s mines thrown in the mix, which means higher costs and lower overall profitability for Barrick going forward.
Newmont should benefit more from Goldcorp’s lower cost structure. NEM averaged $975 AISCs in the first three quarters of 2018, way higher than the $877 average in Q3’18 among the GDX gold miners. GG’s AISCs averaged $886 over that 9-month span, so the new combined Newmont should benefit from lower costs. But that may not last long, as weakening production eventually pushes per-ounce costs higher.
Gold-mining costs are largely fixed quarter after quarter, with actual mining requiring the same levels of infrastructure, equipment, and employees. So slowing production yields fewer ounces to spread mining’s big fixed costs across. If these new super-major gold behemoths can’t arrest their depleting production, their costs will inevitably rise in the future hurting profitability. Again these mega-mergers didn’t solve that problem.
So it looks like the managements of Barrick and Newmont just issued $6.5b and $10.0b of new stock so they could report big merger-driven production surges for a single year! Once those pre- and post-merger year-over-year comparisons pass, the vexing waning-production problems at all four of these predecessor gold miners will again become apparent. But that’s not even the biggest reason these mergers are bad news!
Even before these mergers as apparent in mid-November when I analyzed Q3’18 results, both Newmont and Barrick already had very-large market capitalizations of $17.1b and $14.9b. That again granted them massive 11.0% and 9.5% weightings in GDX. Like most stock indexes and ETFs, GDX’s components are weighted by market cap. Goldcorp and Randgold ranked 6th and 7th then in market cap and weightings.
Adding NEM and GG together as of mid-November would catapult their market cap and GDX weighting to $25.1b and 16.0%. Adding ABX and GOLD together yields a similar $22.3b market cap and 14.5% total GDX weighting. So these two super-majors alone could account for a crazy 30.5% of GDX’s weighting! That is almost scarily concentrated, although we don’t yet know how GDX’s managers will deal with this.
As of this week the new combined Barrick only has an 11.1% GDX weighting, while Newmont is at 8.2% since its mega-merger is not yet consummated. It will be interesting to see whether the new companies’ weightings going forward are kept in market-cap proportion or somehow limited. I hope it’s the latter, as many of the other gold miners in GDX have far-better growth prospects than these new super-majors.
ETF weightings aside, higher market caps create plenty of problems of their own. I’ve written essays in the past on picking great gold stocks, and surprisingly market capitalization is the single most important factor for future gains. The gold stocks with the largest market caps usually significantly underperform their smaller peers. These new super-majors are so darned big that they really compound this problem.
In mid-November when I analyzed the GDX miners’ Q3’18 results, the average market cap of its top 34 component stocks was $4.3b. Excluding NEM and ABX, that fell to $3.5b. It takes proportionally more capital inflows, investors buying shares, to push a larger stock higher than a smaller one. If the super-majors are worth $24b, it takes 6x as much buying of their stocks to drive the same gains as on a $4b company!
Imagine the different forces involved turning a supertanker versus a tugboat. The bigger any stock in the stock markets, the more inertia it has and thus the more capital is needed to overcome that and move the stock. And market-cap issues are not just a size thing in gold stocks. Smaller major, mid-tier, and junior gold miners have way fewer gold mines and much-lower production, which makes it far easier to grow output.
While Newmont is a temporary exception since it was bucking the major trend and growing production in 2017, Barrick, Randgold, and Goldcorp all really underperformed their sector in recent years. This chart looks at the indexed performance in ABX, GOLD, NEM, and GG stocks compared to the leading sector ETFs of GDX and the smaller GDXJ which largely tracks mid-tier gold miners under 1m ounces annually.
Both GDX and GDXJ fell to all-time lows back in mid-January 2016 when this gold-stock bull was born. So all 6 stocks are indexed to 100 as of that day, revealing their relative performance since. Despite their heavy weighting in GDX, the major gold miners generally lag their key sector benchmarks. ABX, GOLD, and GG have really struggled in recent years as their managers failed to stem big production declines.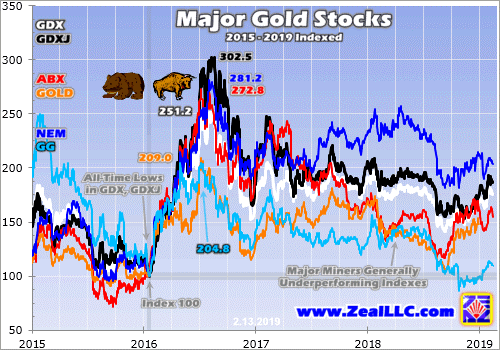
This chart is pretty damning, showing why the managers of Barrick and Newmont are desperate to show rising production even if only for a year after their wildly-expensive mega-mergers. ABX and GOLD have both been really underperforming their peers, scaring investors away while putting serious pressure on managements to turn things around. NEM resisted that, but its production started to decline too in 2018.
And GG has been a basket case, actually managing to fall below its deep secular lows of early 2016 in recent months! That’s a sad fate for what was the world’s best major gold miner for many years. NEM buying this dog is likely to drag down NEM’s stock performance to some midpoint between what it has done and how GG has fared. For the most part the largest gold miners haven’t been good investments.
The much-larger market caps coming from combining struggling majors into super-majors is highly likely to exacerbate this underperformance trend. The new Newmont and Barrick are way bigger and far more ponderous, and will require a lot more share buying to move their stock prices materially higher. But why will most investors even bother to buy these titans when many smaller mid-tier gold miners are thriving?
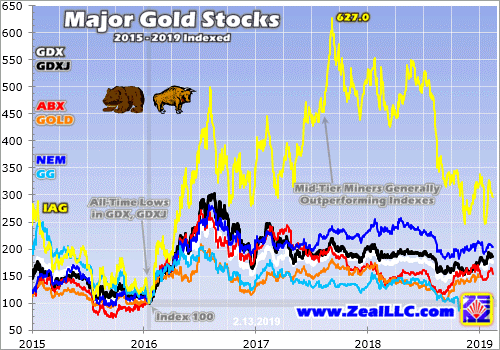
This next chart adds a single additional mid-tier gold miner to illustrate their outperformance. I chose IAMGOLD (IAG) for this example for a couple reasons. It produced 882k ounces in all of 2018, which makes it a larger mid-tier gold miner nearing that 1000k+ major threshold. And IAG is unremarkable fundamentally. It mined the same 882k ounces in 2017, so there was no production growth at all last year.
And its 2018 all-in sustaining costs are expected to come in on the high side near $1070 per ounce, which is worse than most of the majors. So there’s really nothing special about IAG operationally suggesting it should far outperform. If I wanted to cherry pick, there are other mid-tier miners that have trounced what IAG has done in recent years. Yet even IAG wildly outperformed the majors and sector ETFs during this gold bull.
If Newmont and Barrick were the only gold-mining stocks, they’d certainly be worth owning during a secular gold bull. But why own these massive supertanker-like gold miners when smaller major, mid-tier, and junior gold miners’ stocks are performing way better? The smaller miners not only have lower market caps easier to bid higher with much-smaller capital inflows, but plenty also have superior fundamentals.
They tend to have just a few or less gold mines, making it much easier to grow production by expanding existing mines or building new ones. Those expansion events act as major psychological catalysts to get investors interested in those stocks, fueling disproportionally-large buying to catapult them higher. There is really no reason to deploy capital in large majors when mid-tiers are easily running circles around them.
Even if like me you don’t own Newmont or Barrick and have no intention of investing in them, they could cause problems for the entire gold-stock sector. Their hefty GDX weightings mean their stocks have way-outsized influence in how that leading ETF fares. If these super-majors’ giant stocks lag, they are going to retard GDX’s upside which in turn will leave traders less optimistic and more skeptical on gold miners’ outlook.
So mega-market-cap gold miners could significantly slow the overall sentiment shift from bearish back to bullish which is necessary to attract in buying. If capital inflows diminish because of the perception this sector isn’t rallying enough, the bull-market uplegs will unfold slower and maybe end smaller. Even more problematic, the super-majors’ high weightings in GDX suck ETF capital away from more-deserving miners.
Most investors prefer sector ETFs over individual stocks, so lots of capital will flow into GDX as investors get interested in gold stocks again. GDX’s managers have to allocate any differential buying pressure into its underlying component companies in proportion to their weightings. The newly-merged Barrick and Newmont will likely command much-bigger weightings, starving smaller component miners of capital inflows.
But despite these mega-mergers being bad for everyone except the managers of those companies paying themselves huge compensation, all is not gloom and doom. If the new Newmont and Barrick continue to suffer waning production after their initial merger-boost year, investors will shift capital out of them into the other gold miners. That will gradually throttle their market caps and thus weightings in GDX, mitigating damage.
And if these super-majors taint the performance or expected upside in GDX enough, GDXJ may very well usurp it as the gold-stock sector benchmark of choice! While falsely billed as a Junior Gold Miners ETF, GDXJ has really become a mid-tier gold miners’ ETF. It has been increasingly outperforming GDX, and that trend could accelerate since GDXJ will hopefully never include the larger majors led by NEM and ABX.
With so many fundamentally-superior smaller gold miners to pick from, investors have no need to own the larger majors. Plenty of mid-tier miners are still growing their production organically, by expanding their existing mines or building new ones. Their upside as gold continues marching higher in its bull market is enormous, dwarfing what is possible in the giant majors struggling with waning production. Avoid the latter!
One of my important missions at Zeal is relentlessly studying the gold-stock world to uncover the stocks with the greatest upside potential. The trading books in both our weekly and monthly newsletters are currently full of these better gold and silver miners. Most of these trades are relatively new, added in recent months as gold stocks recovered from deep lows. So it’s not too late to get deployed ahead of big gains!
To multiply your wealth in stocks you have to do some homework and stay abreast, which our popular newsletters really help. They explain what’s going on in the markets, why, and how to trade them with specific stocks. Walking the contrarian walk is very profitable. As of Q4, we’ve recommended and realized 1076 newsletter stock trades since 2001. Their average annualized realized gain including all losers is +16.1%! That’s nearly double the long-term stock-market average. Subscribe today for just $12 per issue!
The bottom line is gold-stock mega-mergers are bad news for everyone in this sector. Combining major gold miners already struggling with slowing production doesn’t solve the problem, but only masks it for a single year. The resulting super-majors’ massive market capitalizations saddle their share prices with big inertia. They are going to require much-larger capital inflows to rally materially, really retarding their upside.
Their higher weightings within sector ETFs will lead to worse perceived sector performance, delaying the necessary sentiment shift from bearish back to bullish. And the super-majors will suck up more of the capital allocated to gold-stock ETFs, starving smaller and more-worthy gold miners of buying. Thankfully some of these problems can be avoided by shunning Newmont and Barrick, and sticking with great mid-tier miners.
Adam Hamilton, CPA
February 19, 2019
Copyright 2000 – 2019 Zeal LLC (www.ZealLLC.com)
Executive Chairman Ivan Bebek and his team at Auryn Resources have already built and sold two successful exploration companies. But now they are convinced that they are on the cusp of two potential world-class discoveries that will far exceed their previous successes. In this interview, Ivan shares how Auryn assembled a top-notch technical and management team who have been able to locate and now pursue what they believe could turn out to be massive discoveries at their Committee Bay project in the Arctic and at their Sombrero property in Peru. Ivan discusses in detail not only the prospective nature of these projects, but also how he plans to fund up to four years of aggressive exploration with no shareholder dilution. Auryn Resources will see steady news flow throughout 2019, so this is an exploration story worth following.
Bill: Welcome back, and thanks for tuning into another Mining Stock Education episode. I’m Bill Powers your host. Joining me today is Ivan Bebek, executive chairman of Auryn Resources. Auryn is currently looking at numerous potential catalysts in 2019, so this is a story that you’ll definitely want to pay attention to. Auryn trades on the TSX and NYSE American under the ticker AUG. Fully diluted the company has under 97 million shares out with a current market cap of a little under US$100 million. So with that being said, Ivan, welcome to the podcast.
Ivan: Thank you so much. Pleasure to be here.
Bill: Ivan, as you know, we were able to meet in person at Minds and Money Toronto last October and we talked, it was supposed to be for 25 minutes, we ended up speaking for an hour and 15 minutes. And during the course of that conversation, we talked about one of your key projects, Sombrero, and you really got me excited by just the confidence and the belief that you’re onto something world class here. You’ve already built and sold two successful mining companies. I’d like to start off with you sharing regarding the anatomy of making a world class discovery. What does it take? You’ve done it twice, but this one seems to be even bigger with Auryn right now. What does it take to put together a team that can really pursue a world class discovery?
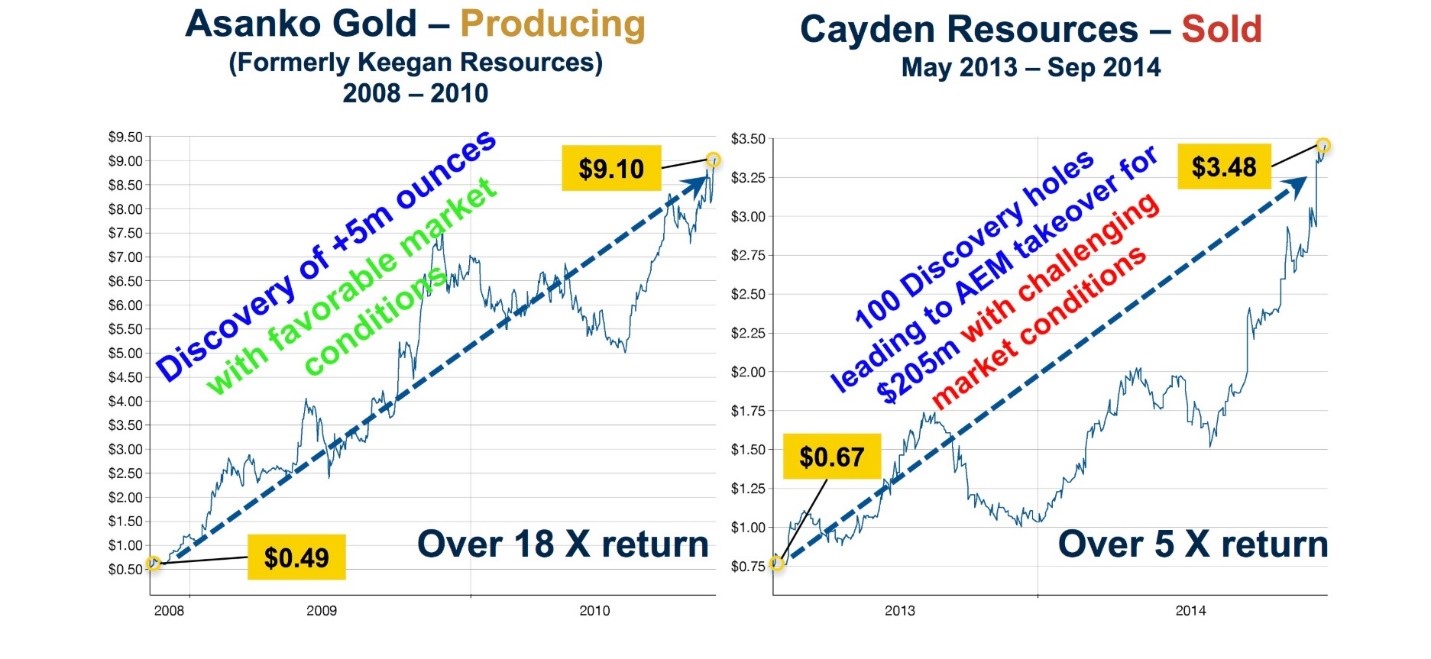
Ivan: Well thank you very much for having me on here, it was nice to meet you back in Toronto. So the anatomy of a team, it sounds easy once it’s done, but it’s actually not. We’ve been working together as a group for 13 years. My partner Shawn Wallace and myself, we started Keegan, we found 5 million ounces of gold in Ghana, West Africa that’s producing 10 million ounce gold mine. We did that with a really small team and we did that as our inaugural company to prove ourselves. We evolved as we went along, as you would, and I would say the main ingredient of creating a great team is success. And so finding 5 million ounces of gold was the first success.
We then poured into another exploration opportunity and we tried to improve on what we did with Keegan and expand that team and that’s where we came up with Cayden and where we sold it to Agnico Eagle for $205 million in 2014. Both share prices performed extremely well for shareholders. The first company went from $.49 to $9 per share. The second one went from $.67 a year before the takeout, to a $3.50 takeout share price, which doubled if you held shares Agnico for 14 months later.
So not only did we attract a lot of these really high-quality geologists, Dan McCoy, who is our key geologists that brought us into Keegan and Cayden’s assets, he’s the gentleman who recruited these Newmont gentlemen, Michael Hendrickson and Dave Smithson and are leading the charge for Auryn. So we had technical success. We impressed our own geologists with our financial capabilities and then we had market success, which gave us the ability to raise a lot of money which being over $600 million since 2005 in combined good and bad markets, which is a fairly impressive number if you followed the last decade of mining stocks and whatnot.
So that comes down to how we came together with Auryn and how this anatomy of going after these major world-class discovery exists. And this is where we took him,. The gentlemen Dave Smithson and Michael Hendrickson, both from Newmont, Michael Hendrickson was a former structural geologist, Dave was the former global mapper. They were imperative on the Cayden sale. These gentlemen brought a bunch of world experts from Newmont, including the former chief geologist of Newmont, Antonio Arribas, who’s on our board, Antonio was also the VP of Geosciences for BHP, a $140 billion base metal company today. Anyway, these guys brought in some of these world experts; about six in particular, They all have different expertise, different backgrounds. So it’s not one geologist that’s doing every element of the science is each guy has done his own science as an expert and they work together as a team.
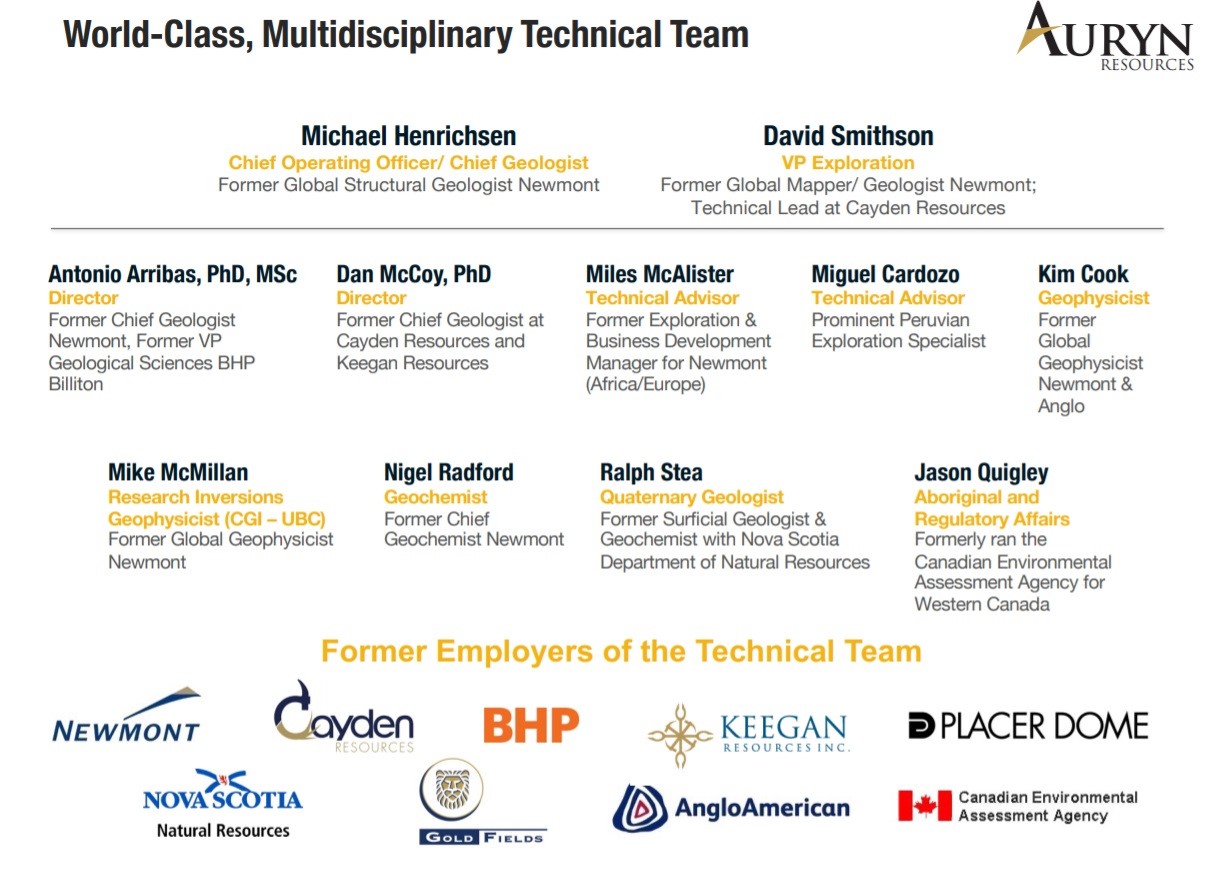
They found several million ounces for Newmont. They were imperative in our success and Cayden. And when we assembled Auryn we went out and said, “Hey guys, we want to do something bigger than we’ve done before. Five million ounces is great. It made people a lot of money, but we want to have a 10, 20 million ounce discovery or two on our belt and let’s go shopping. Let’s go do this. We have a lot of wind behind our back from Cayden and we’ve made a lot of people money, our ability to raise money is incredible.” And then we had went out and we built a seven project portfolio in Auryn. So first major part of the anatomy is technical team. We earned that through our successes of our first two companies.
Second major part is the portfolio project and if you remember 2014 when we put Auryn together and started to assemble the company, we went out and acquired stuff that was worth pennies on the dollar. We bought Committee Bay for $18 million. It cost us 13 million shares. That company used to trade at a $200 million valuation as North Country Gold in the last bull market. So these are the kinds of asset buys we were doing and we were buying major district opportunities, large scale, that’s a 300 kilometer long gold belt. And then in that process we met a guy named Miguel Cardozo. Miguel Cardozo is part of our team. He runs our Peruvian operations. Miguel’s credited with the discovery of Yanacocha as a gold deposit when he worked with Newmont in Peru. That’s a 60 million ounce epithermal discovery in Peru that he made where he led the charge of.
So this is kind of the people we got to work with. This is kind of the outlook we went and took on and what we internally described ourselves as intelligently as a junior exploration company with a majors’ exploration team and a majors’ exploration appetite. And so fast forward a few years, we’ve obviously raised quite a bit of money for Auryn, about $100 million to date. Along that path we met Goldcorp and Goldcorp recognized the scale of some of these gold projects and copper gold now with Sombrero coming online, and they came in and gave us $36 million dollars, which was the largest investment by a major into a junior in the entire market I think in the last 20 years as initial investment. So that was a tremendous validation to what we’ve assembled, and we’re now at the pinnacle of two massive discoveries. One being potentially at Committee Bay and the other one down being at Sombrero. And the way I’ve been describing this for the investing audience is I believe as an investor and as an executive with bias because it’s our company, but I’m still looking for something on the planet that rivals the exploration potential both in Sombrero and Committee Bay and I have not found it yet. So I think categorically these are two of the biggest exploration swings you can take as an investors, as an executive right now in the business.
Bill: So you’ve been in this business for 20 years, would you say that Sombrero ranks right at the top?
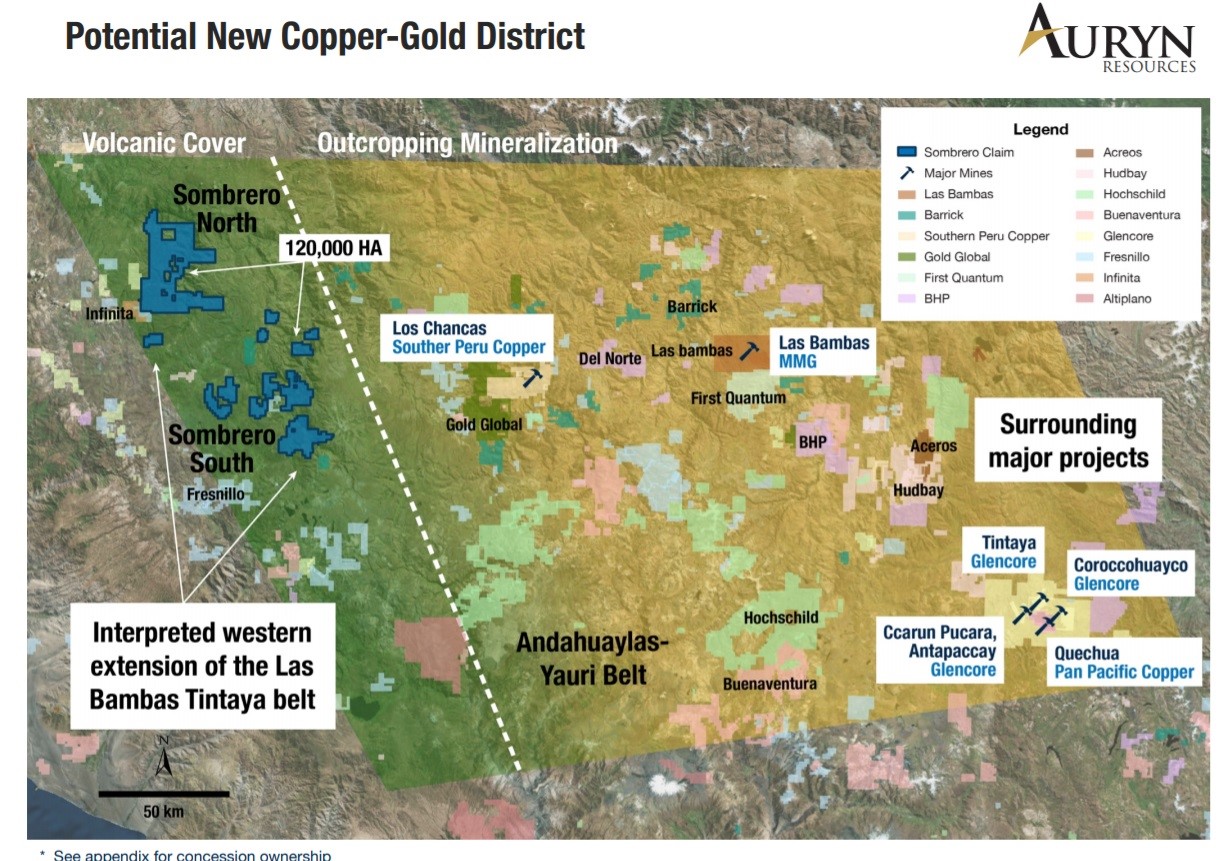
Ivan: I’d say by far, I’ve seen things as an investor, I got to be a shareholder an Aurelian, that was a tremendous discovery in Ecuador. I was a shareholder in Red Back mining, which was the discovery in Mauritania, that 30 million ounce deposit over in Africa. Looking at Sombrero pre drilling, we’re comparing it as an analog and the video on our website does a very good job of doing that to a mine called Las Bambas. Las Bambas is about equivalent of 50 million ounces of gold or $60 billion of metal. It’s copper-moly, we’re copper-gold, and that’s obviously a better factor for us, but the scale of what we’re exploring there it rivals the Las Bambas deposit in size and the more we look, and the more layers of data we take, the more confidence we have that we might be onto a big system like that. And it’s never been drilled before, the evidence is really, really strong and we’re continually signing (confidentiality agreements) on it, something I haven’t talked too much about, but several of the major mining companies around the world have come to us to sign confidentiality agreements so they could get a really close look at this before we start drilling it later this summer.
Bill: An astute investor is going to listen to us talk about the potential and they might ask themselves, well, if the potential is so great, how did MMG or BHP and some others in the region miss this opportunity? And what would be your response to such an investor?
Ivan: Well, my response would be the facts. I think about six different major companies, including the ones you have mentioned have walked on this property before and have taken a look. The first miss, and everyone’s recognizing this across that crowd because all of them have come back to sign confidentiality agreements and there’s obviously dialogue about why they missed it. The government actually mapped the volcanic rocks which cover most of the outcropping mineralizations covered by volcanic rocks. It was mapped at a very young age, that a lot of people didn’t believe would host the deposits next door, people were in a box in this part of Peru, there’s not just Las Bambas, there’s about five major copper-moly porphyries next door within 50 to 200 kilometers away, this major belt. We believe this is the extension of the belt, we believe it was missed because there’s volcanic rocks that cover a lot of the potential mineralization. People thought it was young.
We are the first ever people to pull trenches on Sombrero. We got to pull back the cover, we got to pull back the gravels and we got to sample, one of those trenches ran 109 meters of .7% CuEq. That trench has gaps in it and we just gave ourselves zero in that calculation because we couldn’t sample the whole entire trench, but part of the trench ran 30 meters of 1.93% copper, which is spectacular. What’s even more impressive about that is that we’re trenching in the world of copper, gold porphyries, high grade copper-gold over 100 plus meters width. And that’s truly spectacular. So the guy’s like possibly MMG or BHP or any of the others that have missed this, had they seen these trenches that we’ve been pulling, we’ve got another 150 meters of a half a percent copper gold in another area. We got gold grades on surface up to a 193 grams per ton. We have copper up to 16%. There’s a tremendous metal budget here, there’s plus hundred meter widths of really, really high grade copper and gold being sampled by us. Nobody would have ignored any of this and that’s why everyone’s come to sign CA’s.
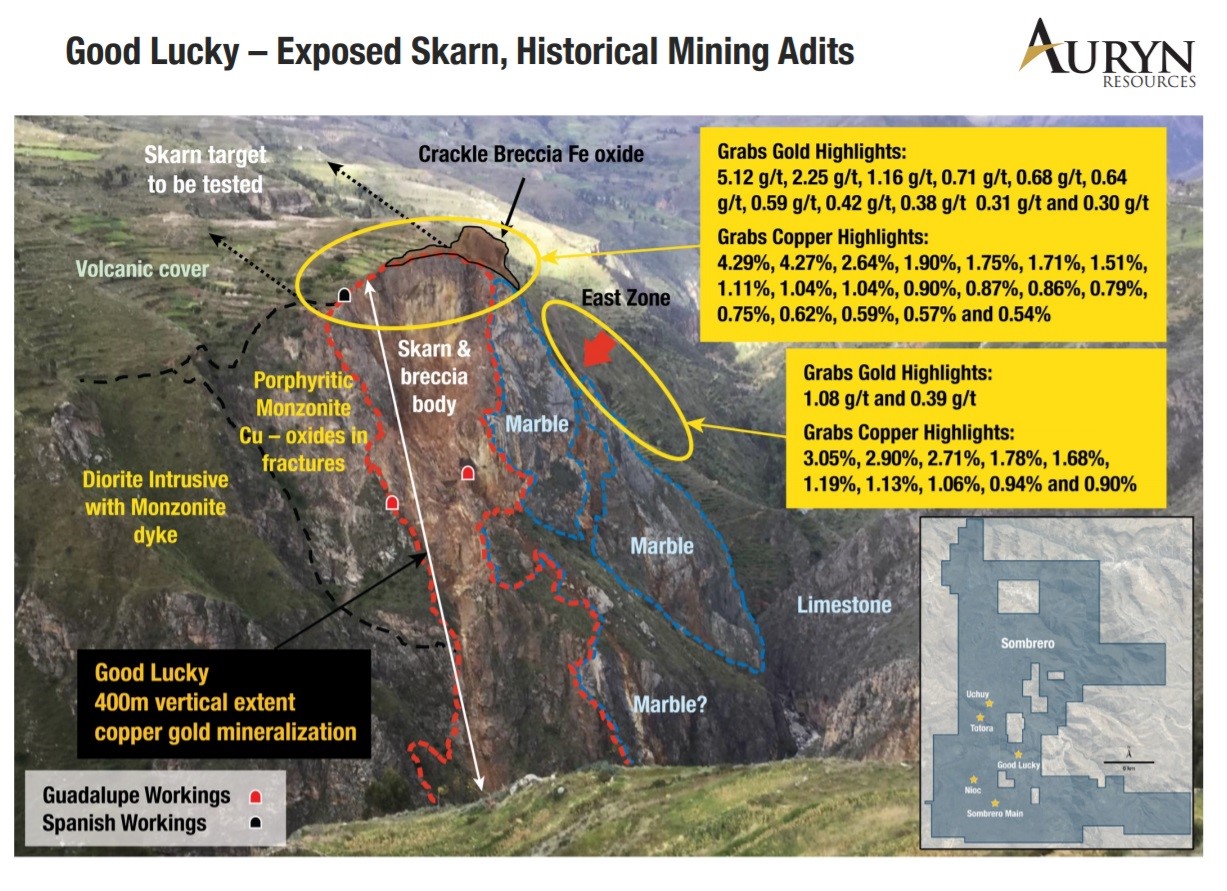
The crowd has definitely shifted and our geologists said we went outside the box and I’m going to quote Dave Smithson in here actually, his comment was, “We first came here and nobody liked it because they saw gold but they were looking for copper and we saw hill side on our second visit called “Good Lucky”. You could see on our website or in our presentation a really beautiful section of a hill where river cut a canyon and you could see mining at it in the side of the hill where they were mining high grade copper halfway down a 400 meter cliff. And then we went down to the bottom, we see bornite, which is high grade copper, huge metal for high grade copper if you know the copper world. But people were looking for copper and they were focusing on this project, considering it to possibly be a gold rich project, and obviously that changed dramatically for us and it’s been basically every visit we’ve done on the property since things have gotten better, we found more outcropping mineralization, we found sampled more high grade and a lot of other elements that are really giving us a strong indication this could be a major copper gold system.
Bill: And after you discovered a lot of these excellent surface results, then you massively increased your land package. Can you talk about that?
Ivan: Yes. So we started with about 5,000 hectors, we got the project from Miguel Cardozo, the gentleman who found Yanacocha as a gold deposit. And we quickly got excited about it because we found copper gold at the edges of our property boundary. So we did what any smart, intelligent, aggressive junior would do, and we start staking ground all around us. We got to about 40,000 hectare land position through the staking. And then our guys, Michael Hendrickson and Dave Smithson, they turned and said, “Hey guys we have this very special way of sampling streams at the bottom of canyons to determine if there’s gold or copper or other metals running off the rocks that are predominantly covered. Can we go screen 8,000 square kilometers?
Jaw drops, that first 8,000 square kilometers, that’s a lot of screening. How much is this going to cost? It costs us about probably about US$700,000 to do this. Obviously we were well financed when we chose to do this, and then we increased our land position to 120,000 hectors. We did this for two reasons, one, first and foremost, because if we got Sombrero right and if this belt continues, that host some of the world’s largest copper porphyry deposits, we want to have as much of that as possible. And the second reason why we did it was we knew when we got on Sombero, everyone’s going to come if we start pulling hundred meter plus trenches of mineralization, which is exactly what’s happened as of now. So we wanted to be first. We were. We wanted to be greedy and we wanted to have the potential, not for one Las Bambas or Tintaya, we wanted multiple of those type of discoveries to be in our land position for the next decade of discoveries. And I believe we’d given ourselves the perfect shot. We got everything we wanted and now we’re comfortable to sign CA’s and let the big guys come in and take a look.
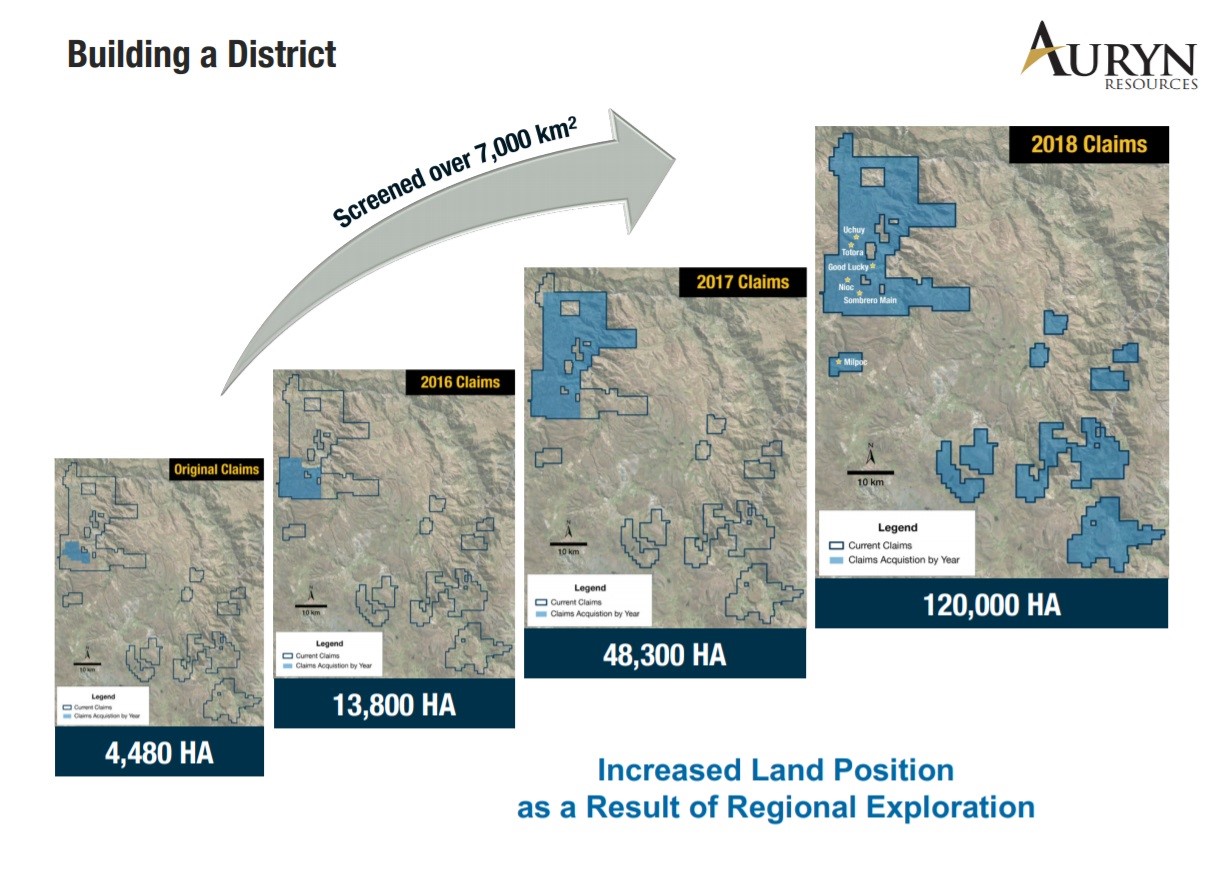
Bill: What is it going to cost to drill this project this year? Can you talk any more about the targets you have and the timeline that investors should look to this year?
Ivan: Yeah. So a couple things, right now we’re in the permitting phase, we’ve applied for 40 drill pads, which gives you a lot more room than the typical 20 you get in an initial permit, it takes a couple more months to get this permit but like I said, we’re in process, we are well on the way, we expect it June/July of this year. It can take a month or two longer, you never know. But right now we’re on track. We don’t see any foreseeable delays.
We’re going to drill 15,000 meters, is our plan on our first path, that will cost us about $5 million Canadian to do that first path of drilling, not a huge cost, we don’t have to worry about having money for that until we get permits later this summer. We’re about to resume trenching, we’ve only trenched and sampled one of five major centers that could be standalone flagship company making assets. So we’re about to get our trenching resuming to go on trench number two, number three, number four, number five, so by the time we’re actually drilling, we will have had five major centers all sampled, ready for permitting and drilling.
And so we’ve got our hands full, we’re going to have a lot of news for the market in terms of trenching these new areas. You kind of have to listen to the punchline, we’re comparing ourselves to Las Bambas and were saying that this thing could be as big as Las Bambas and we’re only on the first of five major targets, so we’re going to be following that up here quite shortly with trenching to show a bunch more things that could also be big discoveries like that. So perfect case from an exploration investor’s perspective, you’re waiting for drill permits while you keep adding more huge targets to the equation.
Bill: What about your relationship with the indigenous people and is there any infrastructure nearby?
Ivan: Yes. So a couple of things there. The local communities we took our time with them, we are under the guidance of Peruvians, Miguel Cardozo’s managing them. Instead of rushing, trying to get the drill bit out, we built really strong relations, took us about a year for the first major community agreement and that one’s been working out really well since we’ve done that. The second one has taken us just over two years and we’re just collecting signatures now, so it’s in the phase of being complete.
I’ll say one comment about Peru and communities, this is one of the major risks that can come up for any company that’s operating there, we came into Peru with a different project and the first thing we did before we took any samples off the ground was bringing a million dollar water program to bring water and irrigation to their fields. We spend about $240,000 over four years and then we brought in an NGO to come in and pick up the balance to do that. So what I heard when we first got to Peru and what we heard as a team was the people who came in the last bull market came and gave everybody money, but they left and there was no sustainability factor. Money was spent and communities, we’re a little bit upset in some areas of Peru.
So our theme as a group, as action before words. So we come in there and we started doing things for the communities before we start talking and making promises and stuff like that along the lines of what we will do. And so we’ve covered that part incredibly well. The second part of your question was asking me about the infrastructure. Since we’ve had the Sombrero project, and we like to think the government was foreshadowing the discovery because they built high tension power lines over the edge of our property. We have power for a major mine at our project. There are roads right into the project. There are two towns with about 800 people peripheral to the project, not on top of it, nobody has to be moved but nearby where we’d have a local workforce. We’re only at 3,900 meters elevation. People mine up to 5,500 meters elevation in the Andes. And so it’s reasonable an elevation, you have a road to the project, you have a power source which generally is a major cost factor.
So we have to think about, when I say all of those things, to answer your question, it’s profitability. Couldn’t be a better scenario. The only thing that could improve this would be a railway and if you go and google “Las Bambas railway”, you see there’s a lot of talk about one that’s nearly approved to be built from Las Bambas and all these other major nearby mines to the coast, which would be a tremendous add onto us. It’d be perfect infrastructure from all aspects.
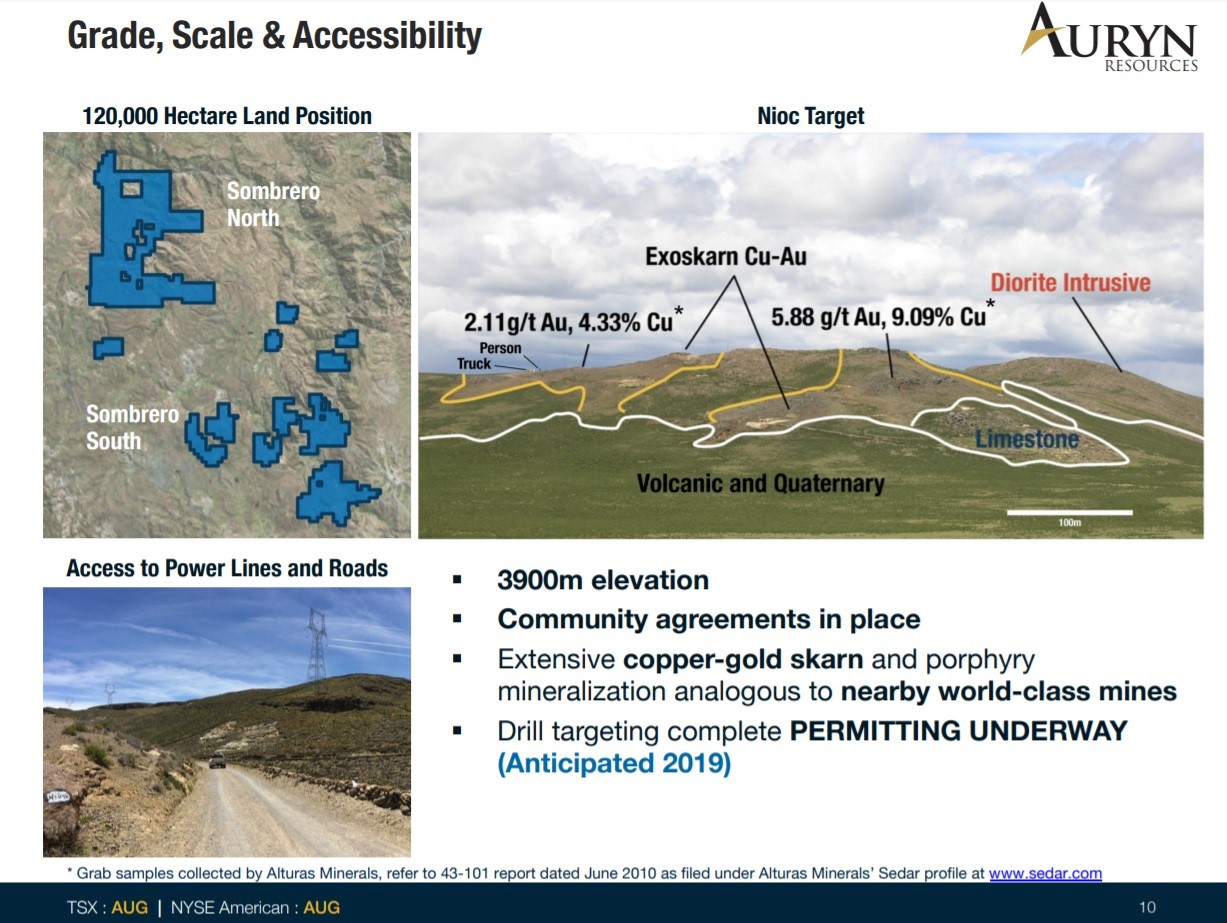
Bill: You had told me back in October that you plan to aggressively pursue Sombrero as well as Committee Bay, which we haven’t spoken about yet, but how do you expect to fund this program?
Ivan: Yeah. So were we had $2 million in January last month, is how we started the year. That will take us into May before we need any more money. If you listen to me or any of my colleagues on the road right now, we’re not looking money, we’re going to be marketing our company to create awareness about the opportunity. And sharing the trenching and about the Committee Bay, which we’ll talk about in a minute. But we’re not looking for money because we have seven projects, two of them we’ve been very public about, are ones we’d consider selling if we got the right prices for them. And one of them is two years into the negotiation, the other one’s about a year and a half, so we’re at very mature stages of potentially one of these two things happening before we have to say the word “financing” again.
Conservatively, one of them would give us one year of drilling and working capital, is what we anticipate. If we sell the other one, we might end up with a combination of about four years of aggressive drilling and working capital to go out there and not have to say the word “financing” for four years would truly be spectacular for us with these kind of big projects on the deck.
Bill: If you were to sell both of them in the near term, what do you think that would do to your market capitalization?
Ivan: Oh, well, 90 million shares out issued and outstanding, the price I would speculate we net would probably be about 70 or eighty cents per share in cash, which can give you about $40 million for two of the biggest exploration swings globally, Committee Bay and Sombrero. I think there’d be a dramatic re rate on us, there’s a value to speculation about what you might drill. We saw a market cap of $250 million twice before we went to drill Committee Bay, which we haven’t even talked about yet. Now we have Sombrero online as well. Multiple projects takes away the risk, the obvious nature of the mineralization at Sombrero is going to allow people to speculate pretty aggressively. What would you pay in terms of share price as an investor to have a seat at a table where you’re taking a $60 billion swing? Finding a ball of metal in the ground with tons of indicators, big company signing CA’s, third party validations all over the place. What would you be wanting to pay if you might find something worth that much money?
Las Bambas was sold for $8 billion back in 2014, the same year we sold Cayden so middle of the bear market. I believe $6 billion was the metal content of a $60 billion ball of metal in the ground. So we have 90 million shares out, we have about $100 million market cap, we’re looking to raise about $60 to $70 million net of taxes from asset sales. I think you’d see much more than a double before we went drilling. That would be my speculation with the ability to drill for three or four years without saying the word “financing” in a rising commodity market, it would be spectacular
Bill: And if the sales didn’t go through, I know there’s a newsletter writer that I follow and he recommends your company just for the fact that you’re able to raise money easily.
Ivan: Yeah. So we’ve raised $600 million. As an insider in the public markets, I’ve bought 3.2 million dollars of Auryn shares in the last three and a half years, as high as $3.70 Canadian per share and as low as a $1.15 per share Canadian. My point there is not only do we have the ability to write a check into our own company and we’ve obviously done that, we have a tremendous following with investors. We’ve made a lot of money over the years. The money we need for one year of drilling both projects and working capital is probably around $15 million Canadian and we could get that this week if we wanted it. But we are extremely anti-dilutive. We are a very large shareholders, we own 15 percent of our company and we treat our company as investors would want to treat their own company in terms of dilution and financing.
So in that equation, with the ability to write our own checks into our own company, gives us a tremendous opportunity here to really deliver a very robust share price return by staying away from the market, from financings. If those assets sales take longer, that’s the consequence I think, not happening but they’ll happen eventually, then we would likely do a really small funding, a non-brokered private placement for $5 million which would cover trenching in Peru and G&A so that we could wait for better metal prices to get more out of those transactions. But to be honest, we’re sitting here in February, I’m marketing all month, we’re going to PDAC, we’re marketing in Europe and everything we’re doing, it doesn’t have the word “financing” attached to it. It’s just creating awareness on the opportunities that Sombrero and round five up at Committee Bay.
Bill: I was watching your share price movement and right after the Vancouver conferences in January, you saw a nice spike.
Ivan: Yeah, that’s just the crowds, we had just started talking about Sombrero. Vancouver two weeks ago was week one, we were just in California for a week, we’re in Florida next week, we are going to go through our global network and being around this business and as a group for about 13 years, we have a lot of investors to show how big the opportunities are at Sombrero and how mature we’re getting with the potential discovery at Committee Bay, underpinned with two potential asset sales that are nearly imminent to take place. So that’s what we’re excited about, that’s why we’re going out there and truly out of everything I’ve seen in 20 years, Sombrero is number one on my list and I’m going to tell the whole world about it because everybody should, who has ever bought an exploration stock should be watching the story.
Bill: Your other flagship project is Committee Bay, you’ve been at that project for four years and you’ve spent $50 million on it. What can we expect in 2019 with this project?
Ivan: So great question came up to me the other day and the question actually was you’ve been there for four years, you spent over $50 million dollars, I believe we’ve drilled over 250 holes on the project, we’ve taken over 400,000 till samples along a 300 kilometer long belt, which has gold shedding on one side to the other. And so that all being said, that’s a lot of work, where is the deposit? And you guys have the Newmont exploration team, how come you’ve spent all this money and haven’t found it? In the middle of the belt, there is a deposit, 1.3 million ounces of about eight grams per ton, but the belt is covered 95 percent by till, the whole belt is covered by till meaning there’s five to 40 meters of dirt on top of the rocks and you’re up in the Arctic, so glaciers have moved over these rocks or the dirt on the rocks. It’s not easy to find these things or we would have never been able to acquire it ourselves.
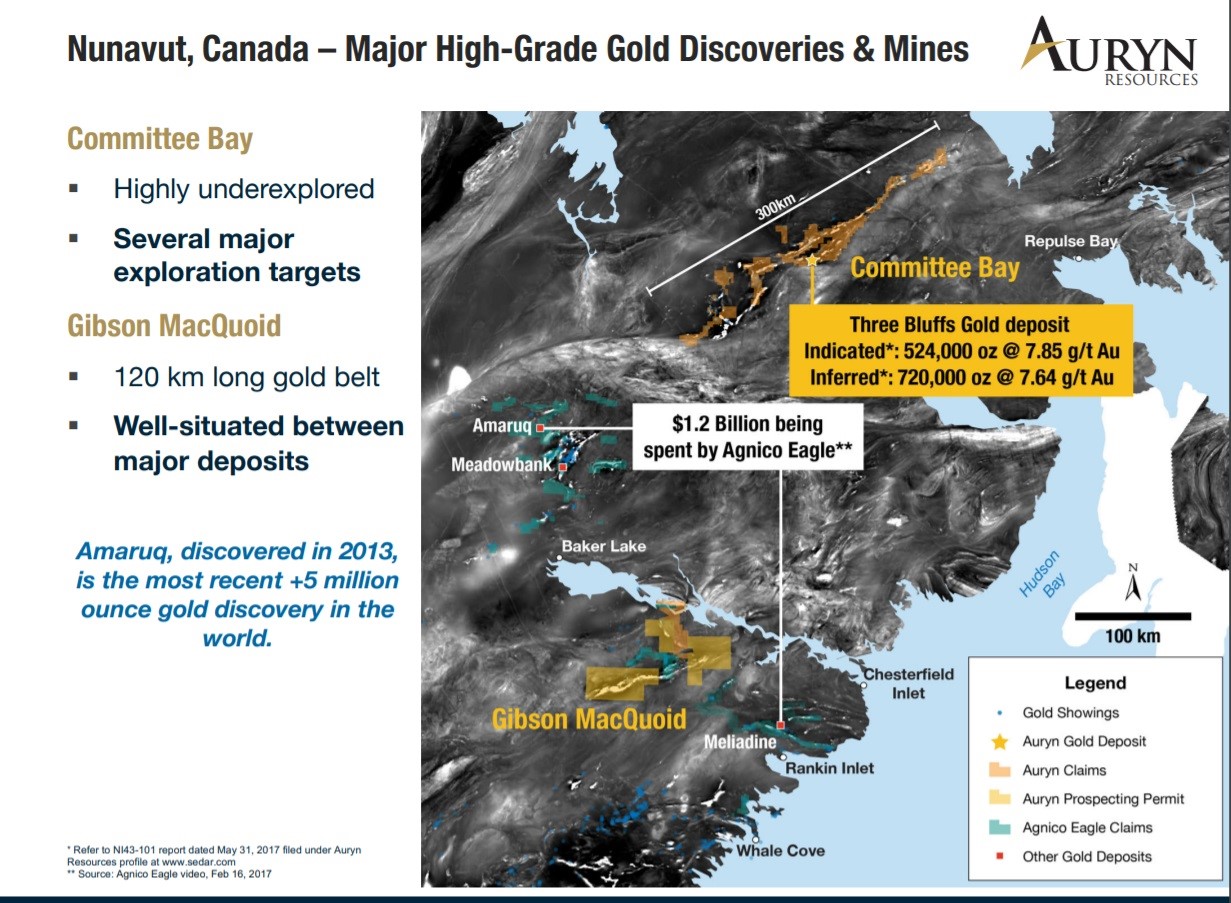
The comment I got was when you guys walk away from this project, and most certainly wouldn’t do it for another five or ten years because you have 18 targets along this big belt to go test, which is going to take time. Where the guys are at now is they’ve brought in machine learning to process all that data on the entire belt. And one of our Newmont geologists has met up or partnered up with a technical specialists, we’ve had a press release about this and it’s truly amazing what they’ve done. And first of all, the data inputs are extremely high quality of the way we take samples, the way we assay samples, the world experts formerly with Newmont that are inputting the data. So data in data out is obviously a major contributor.
The neural networks these guys are using is the same one google uses as Amazon, Facebook. And if you ever had the experience where you’re on their website, you’re looking at boats or something or tennis rackets or whatever sport you play, or you say it even out loud now you don’t even have to go look at it, and then you get some random marketing email that shows you a bunch of product for sale that you were thinking about or talking about. So imagine that exact same neural network which has been used by google, now you’re putting in geoscientific data. We took three bluffs the deposit, we gave it one third of the high grade at three bluffs and we taught it how to find in that. And then we challenge it to find the other two thirds. And it came out with about a 99 percent accuracy finding the other two thirds.
So in my opinion, it works. In about three weeks, the end of this month, end of February we’re going to have the results of the learning, which is gonna show targets that we’re going to drill this to Committee Bay alongside targets that our geologists have found. But truly the future of major discoveries is either hidden deposits or it is things like Sombrero that were overlooked or it’s contentious land owners that wouldn’t sell to an exploration company prior that finally sell. And I think if you listen to Barrick, Teck and Goldcorp and a lot of these big companies, everyone’s talking about AI platforms coming into mining and the true reason why is the computer that we’re using are the neural network and the ability for it to process data is about a thousand times the capacity of the human brain. So you’re basically saving 20 years of crunching numbers by doing it through a computer in a period of three to six months, and that’s the opportunity there.
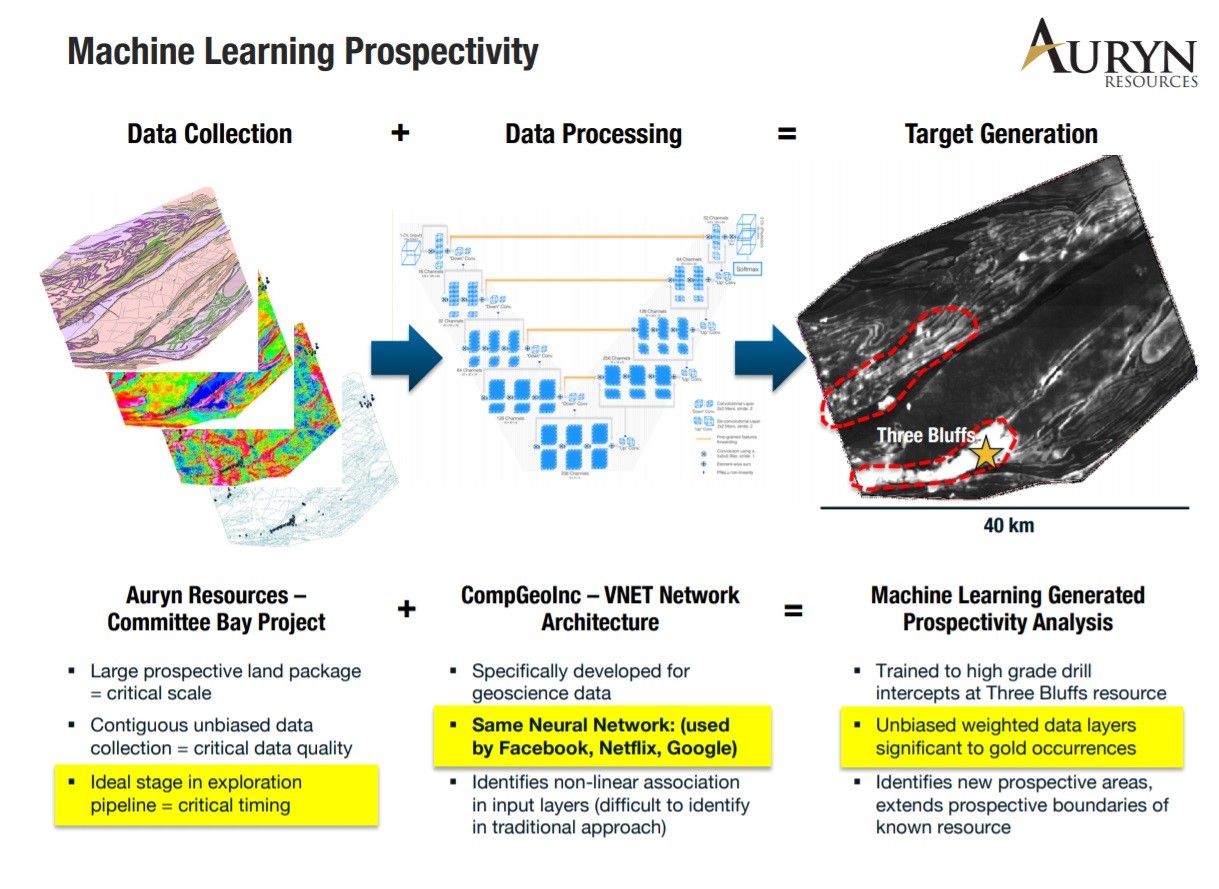
The last comment I’ll make on Committee Bay, and this is for all the Committee Bay shareholders that have owned us, that have sold us, that have speculated with us and that can’t get enough of risking their money for Committee Bay discovery, we’ve only physically been on the ground at Committee Bay for about eight and a half months, and so we’ve drilled 250 holes, we’ve taken 400,000 till samples in eight and a half months of physically being on a property and in comparison to Sombrero where we’d been on the ground physically for about 11 months, you have to take that into context of how little time we’ve actually spent at Committee Bay.
And the reason why is we spent about two months at windows of exploration each summer, we’re not exploring through the winter, you could in the right environment of a discovery, you could drill year round. Agnico Eagle’s doing it on this major mine they found next door called Amaruq, but for us, we’ve only been on the ground for about eight and a half months since we’ve had it. We’ve collected all this data and the real discoveries are going to come out of Committee Bay, we think this season. Not only because we’ve learned so much about these deposits we’ve been going after and we feel we’re on the edge of some major discoveries, but we brought in the computer to process all that data that I’ve told you that we’ve just collected.
It’s going to be one of the most exciting drill programs that I’ve been part of with Committee Bay, but also to go test the computer learning, if it’s right, the whole belt opens up again, you have 300 kilometers of gold shedding off a belt. It becomes one of the phenomes in the world to go find major gold deposits and to quantify how hard these deposits are to find too, in those four years that we’ve been going up there so far, nobody else has found a 5 million ounce or better gold deposit. The last major mine in the world found that’s over 5 million ounces of gold is Amaruq, 6 million ounces of six grams per ton, which was found by Agnico Eagle right next to us at that Committee Bay. Nobody has found anything since 2013 of consequences in the gold side of the business that’s being explored. We’re not the only ones, but I’d liked to argue we have some of the best real estate for high grade gold in Canada and a massive copper-gold discovery in potentially in Peru.
Bill: Yeah. And it balances the portfolio, there’s going to be news flow constantly in the years to come.
Ivan: Yeah. So news flow is a main catalyst for all juniors and what we’re looking at for news flow here is the releasing of the AI targeting, Committee Bay targeting, as well as the resuming of trenching in Peru. Those would be two main drivers that drive a lot of speculation towards the summer, but you might see the first asset sale in the coming weeks or month or two. And the second one might be right behind it or they might happen both at the same time.
If you see the gold price performing, expect the asset sales to happen probably a lot quicker. If the gold price goes down, they might take longer, that’s the only way I would say you can wager how long these things might take. But, again, we’re in the very mature discussions of these asset sales and we’re confident that one or both could happen this year.
Bill: Ivan, Rick Rule always teaches speculators that they need to know at least three things that could go wrong with a gold speculative company that’s pursuing a discovery. So the question posed to you as the executive chairman would be, what would keep you up at night? When you look at the company and you look at your projects, what are some things that could go wrong?
Ivan: That’s a really great question, and I’ve had the chance to meet Rick in 2003 and get to know him for the last 15, 16 years. The first answer to that question would be communities in Peru, that’s the obvious one, that’s the easy one. We have a really good handle on that as I’ve been quite elaborate about that and I don’t think there’s any serious risks there at all, but that’s one of the big red flags that someone could throw out and lose little sleep at night.
Second one would be metal prices. We don’t need higher metal prices than today, but if the metal prices go into a massive tailspin, then that would obviously slow us down and we would be conservative with our spend and we wouldn’t get to go drill as quickly as we wanted to because we wouldn’t want to dilute ourselves in that process.
And thirdly, you’ve asked me for three, I’d have to go onto personnel. You don’t want to lose any geologists to something tragic or something else. We have incredible people on our team and I think if we lost part of our technical team somehow that would be something we could recover and repair, but it would be the other thing I don’t want anything to happen to anybody on a personal basis. There’s no danger in where we’re working, but life is interesting enough in itself, there’s airplanes, there’s all kinds of things that can happen. It was such a remarkable feat for us to put together this group of people as a team. It was such a remarkable feat to put together this portfolio of projects and we don’t want to lose anyone, so those are my three
Bill: Auryn trades under the ticker AUG, you can go on the website. It’s www.aurynresources.com. There you can listen to a Ivan’s lead geologist describing in detail in about a 17-minute youtube video, why they chose a specific targets at Sombrero, it’s very easy to understand for the non-technically trained person to understand the excitement regarding this project. There you can also view the most recent presentation that is up there to see the prospective nature of also Committee Bay, not just Sombrero. Ivan, as we conclude, is there anything else you’d like to share with the listeners?
Ivan: If you’re not going to own us, you most certainly should follow us because I think we have a chance to find the world’s biggest on two different projects.
Bill: Well, I appreciate the conversation. It was a pleasure meeting you in person. And we’ll be talking to you again throughout 2019.
Ivan: Thank you so much. Appreciate it.
by Bill Powers
ABOUT THE AUTHOR:
Bill Powers is the host of the Mining Stock Education podcast which interviews many of the top names in the natural resource sector and profiles quality mining investment opportunities. Bill is an avid resource investor with an entrepreneurial background in sales, management, and small business development. His latest interviews can be found at MiningStockEducation.com.
Gold stocks have to do more to confirm they are in a new bull market.
Sure, they’ve surged above key moving average resistance and breadth has improved.
However, the gold stocks have not yet broken the pattern of lower highs and breadth, while improved, is not at bull market levels yet. Let’s review where things currently stand.
In recent weeks GDX and GDXJ surged above the critical 400-day moving average which has been an excellent indicator of the primary trend dating back to 2012. That’s positive and hasn’t happened since the summer of 2017.
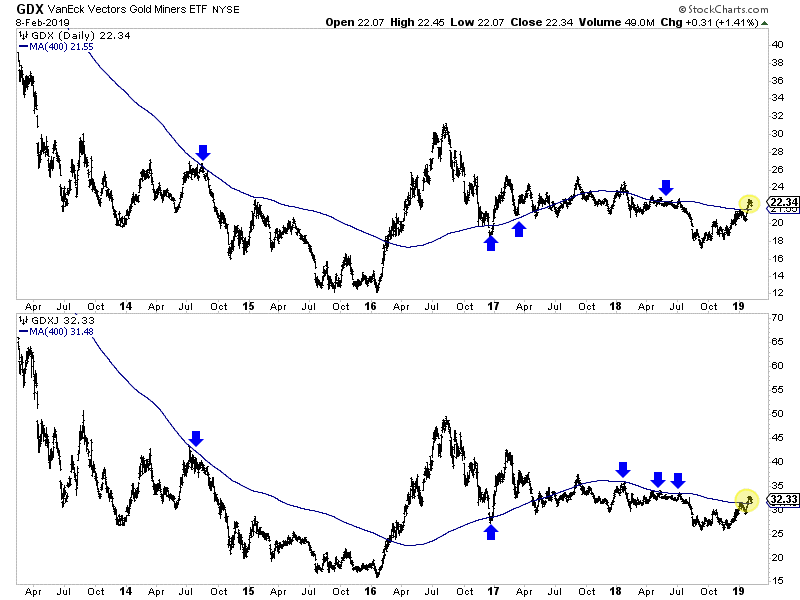
Moving forward, I see two plausible scenarios for the gold stocks.
They are either going to build a bullish consolidation (as I’ve sketched out below) or they will have a longer and deeper retracement which could lead to a test of the 200-day moving averages (not shown) near $20.50 for GDX and $30 for GDXJ.
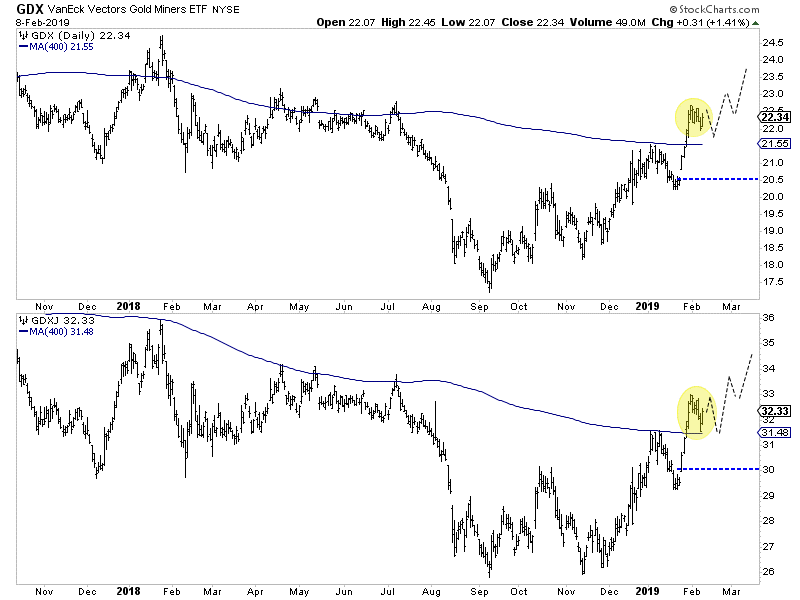
In the bullish scenario, look for the miners to hold above their 400-day moving averages and build a tight consolidation. If that develops, we would gain strong confidence in a bullish outcome.
In the bearish scenario, the miners would sell off below recent lows and threaten a test of the 200-day moving averages and the nearby open gaps.
Also, keep an eye on Silver, which like the miners will outperform when the sector trend is established. Note that on Thursday Silver bounced from the $15.60-$15.65/oz level which has been a critical level over the past two years. (See the arrows in the chart).
Should Silver hold that low then it should be able to rally above its 400-day moving average for the first time in over a year and test $17.25.
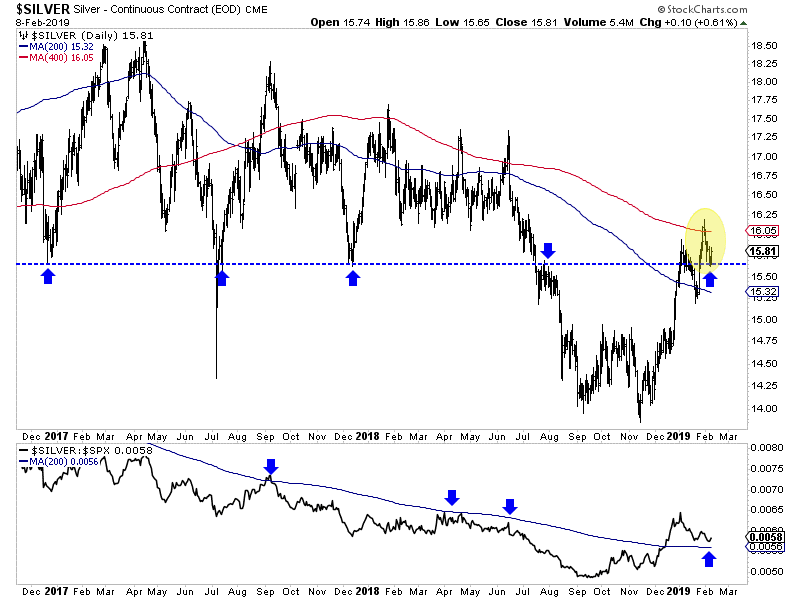
At the bottom of the chart we plot Silver against the S&P 500 and according to the 200-day moving average, that relative trend has turned in favor of Silver.
The bottom line is if GDX, GDXJ and Silver can maintain the lows from last week and firm up against the S&P 500 then they are likely going higher. If those lows break convincingly then look for a longer and deeper correction.
Essentially, should a bullish consolidation develop, we will prepare to put more capital to work. If not, then a deeper and longer correction is more likely which means we can be patient. To prepare yourself for some epic buying opportunities in junior gold and silver stocks before this bull market really gets going, consider learning more about our premium service.
- Is the latest tiny price correction in gold already done?
- Please click here now. Double-click to enlarge this daily gold chart. The uptrend looks majestic, and especially so in the face of the dollar’s strength against the euro and the yen.
- Whether gold rallies from the current $1306 support zone or from $1280 is not important. What’s important is the overall strength of the market, both fundamentally and technically.
- A staircase uptrend pattern (in place now for gold) is an indication of a very healthy market.
- Please click here now. Double-click to enlarge. The big technical picture for gold is also glorious!
- On the fundamentals front, the European economy is rolling over faster than America’s is right now. This situation is positive for gold. Europeans are nervous, especially in Germany, and they are steadily putting money into gold and physical gold ETFs.
- The dollar is strong against the yen because of the rally in global stock markets. That rally is happening in the face of fading U.S. corporate earnings because of the actions of the U.S. central bank.
- Stock markets initially tend to rally as the U.S. business cycle peaks and the Fed stops raising rates, but institutional investors soon become concerned that the Fed’s about-face is related to more serious concerns about the economy. Value players have sold out and many money managers are now in a “sell the rallies” mindset rather than “buy the dips”.
- Please click here now. The Fed’s change of stance is good news for gold but not so good news for the stock market (except in the very short term). Rates have barely risen off the floor despite this being one of the longest economic upcycles in the history of America.
- The upcycle was long in terms of time but horrifying in terms of actual growth. Arguably, the biggest real economy growth has been in the part-time jobs market. It’s also plausible that there would not have been any growth at all without the massive increase in government debt.
- The democrats have control of the House now and some influential players want to tie stock market buybacks to wage increases. That’s clearly inflationary and perhaps much more so than most analysts realize. Even if the legislation doesn’t get passed, I believe it will be passed “in spirit.”
- Key democrats also support the UBI (universal basic income) and free medical care. I’ve dubbed UBI the common man’s QE. These programs are all inflationary and are being proposed as the Fed changes its stance. That’s a “done deal” recipe for major stagflation over the long term.
- In the current big picture, I’ve suggested that rate hikes, QT, QE, and rate cuts are all win-win for gold. Rate hikes put pressure on the stock buyback programs and help push the QE money ball in the commercial banking system. That’s inflationary.
- Rate hikes also put pressure on the U.S. government’s ability to finance itself. That’s positive for gold.
- Rate cuts now reduce the carry cost for gold and boost the safe haven trade as investors flee stock markets as the fear of recession grows. That’s also positive for gold.
- Please click here now. Kudos to Congressman Mooney for doing the right thing. I urge all members of the U.S. gold community to call their congressional reps and demand they back Mooney’s proposed legislation.
- I’ve predicted that with China and India leading the way, gold will become an “approved and respected” mainstream asset in the years ahead, just like stocks and bonds. If Mooney gets serious support, it can happen even faster than I’ve predicted.
- Please click here now. As noted, the big picture for gold is glorious… both technically and fundamentally.
- Please click here now. Respected mainstream firm Bernstein has obviously joined “Team Gold”. They highlight the ongoing drop in America’s share of global GDP. Nothing Trump is doing will reverse that drop because it’s related to the West’s horrifying population demographics.
- The current U.S. government plan to reverse its insane debt growth with tariff taxes, a single corporate tax cut, a few regulatory red tape chops, no more rate hikes, and a border wall… is like trying to stop Niagara Falls by throwing a few popsicle sticks into the water.
- The temptation for the debt-worshipping U.S. government to inflate will soon be overwhelming. Clearly, elite U.S. analysts like Bernstein are already anticipating this is an imminent event.
- Please click here now. Double-click to enlarge this fabulous GDX chart. GDX and most high-quality gold stocks soared from September-December and did so while the U.S. stock market crashed. Then GDX soared in January while the stock market rallied.
- There’s now a bull flag in play and while gold looks great in this price correction, GDX looks even better. The $21.50 support zone for GDX is the equivalent of $1306 for gold, but the price hasn’t even reached that $21.50 level! There’s still a high probability that GDX blasts towards my next short-term target at $25 without even touching that support zone. That would be “outrageously bullish”.
- I refer to GDX as the “Prince of Assets” and to high quality individual gold stocks as “Knights Of The Round Bull Era Table”, and with good reason; it’s a glorious time to be invested in gold and the companies that mine it! These price corrections are not painful. They are so mild (and even enjoyable) that it’s almost ridiculous. The good news is that this theme is now poised to continue… for a very long time!
Special Offer For Website Readers: Please send me an Email to freereports4@gracelandupdates.com and I’ll send you my free “Walking The ETF Components Talk!” report. I compare the relative merits of the main precious metals ETFs and evaluate the top three performers in each ETF. Email me today, and I’ll send it to your inbox oday!
Thanks!!
Stewart Thomson
Graceland Updates
Email:
Stewart Thomson is a retired Merrill Lynch broker. Stewart writes the Graceland Updates daily between 4am-7am. They are sent out around 8am-9am. The newsletter is attractively priced and the format is a unique numbered point form. Giving clarity of each point and saving valuable reading time.
Risks, Disclaimers, Legal
Stewart Thomson is no longer an investment advisor. The information provided by Stewart and Graceland Updates is for general information purposes only. Before taking any action on any investment, it is imperative that you consult with multiple properly licensed, experienced and qualified investment advisors and get numerous opinions before taking any action. Your minimum risk on any investment in the world is: 100% loss of all your money. You may be taking or preparing to take leveraged positions in investments and not know it, exposing yourself to unlimited risks. This is highly concerning if you are an investor in any derivatives products. There is an approx $700 trillion OTC Derivatives Iceberg with a tiny portion written off officially. The bottom line:
Are You Prepared?
Morris Hubbartt
Feb 12, 2019
Here are today’s videos and charts (double-click to enlarge):
SFS Key Charts, Signals, & Video Analysis
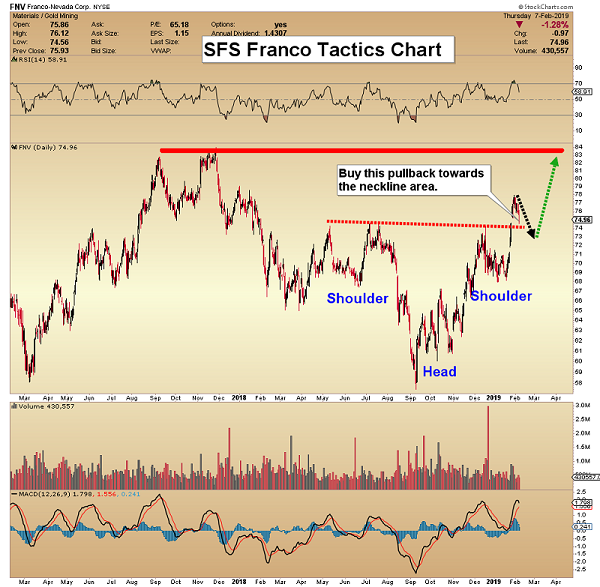
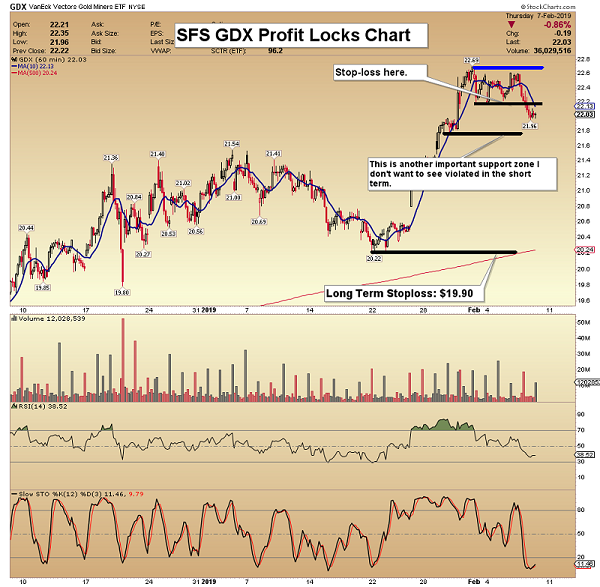
SF60 Key Charts, Signals, & Video Analysis
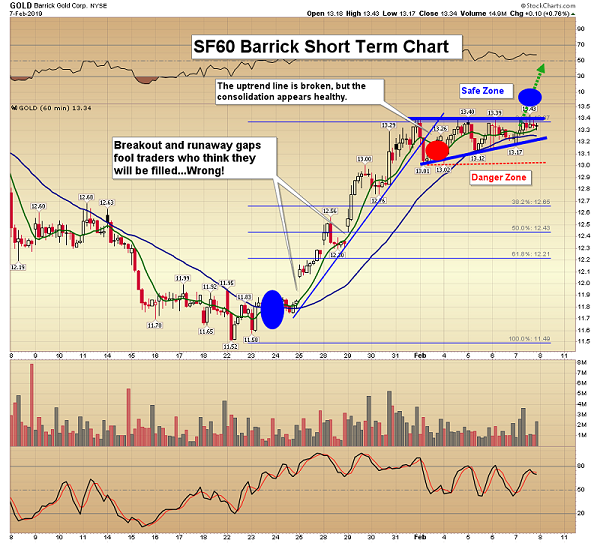
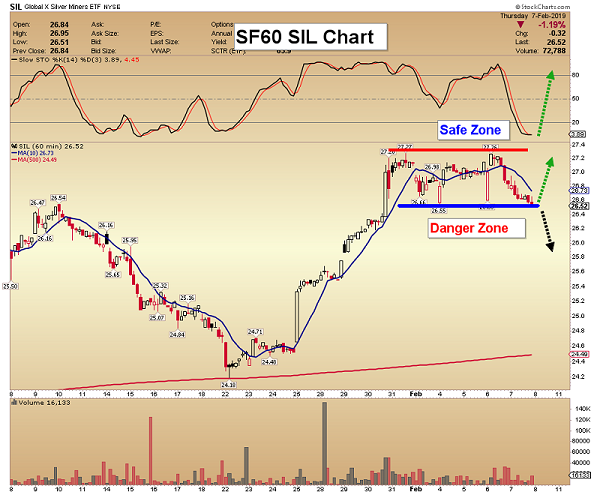
SF Trader Key Charts, Signals, & Video Analysis

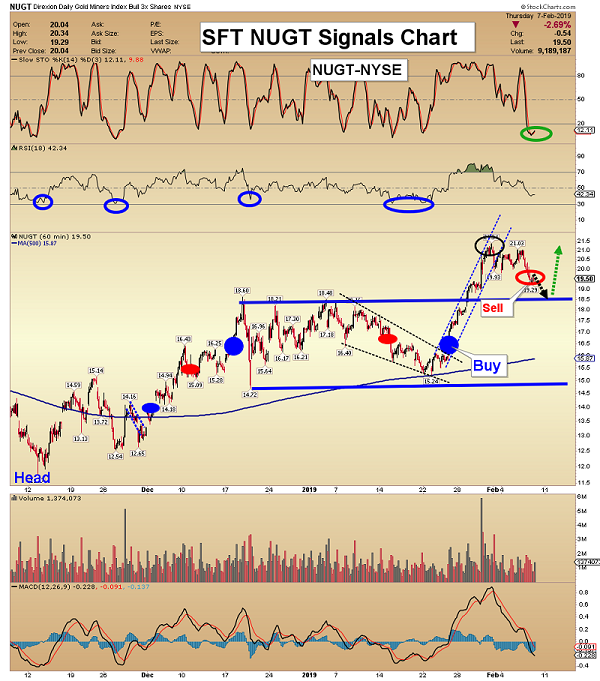
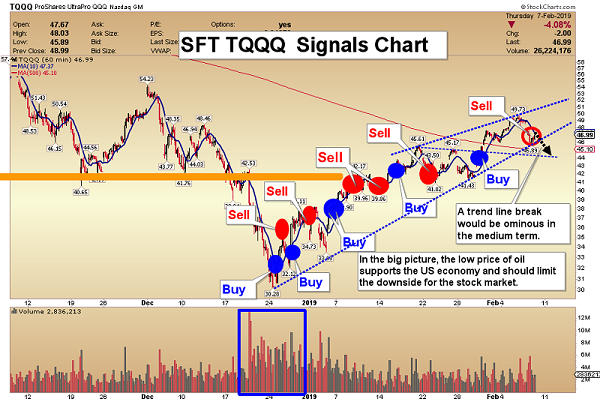
SFJ Key Charts, Signals, & Video Analysis
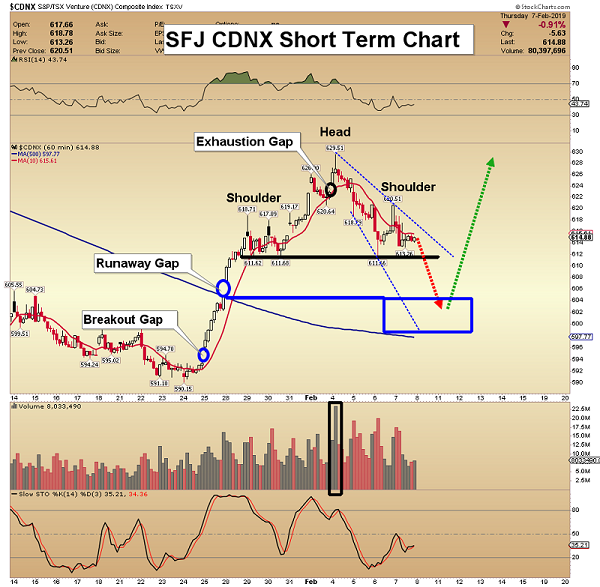
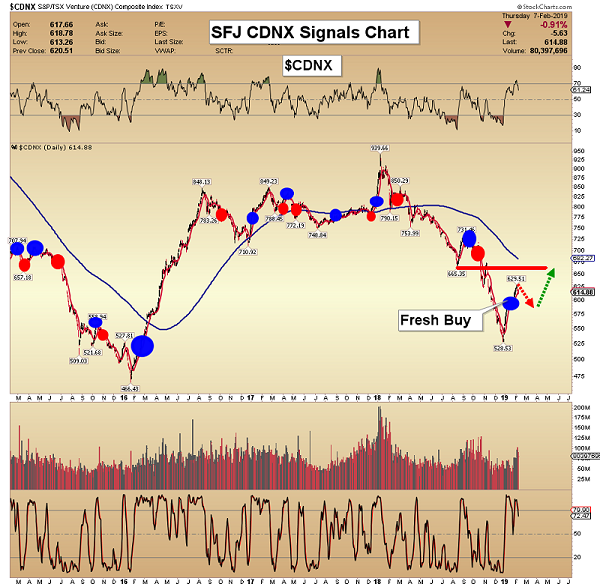
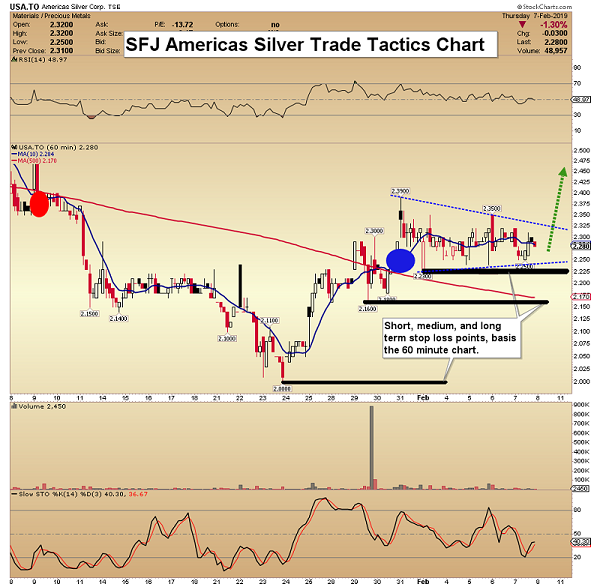
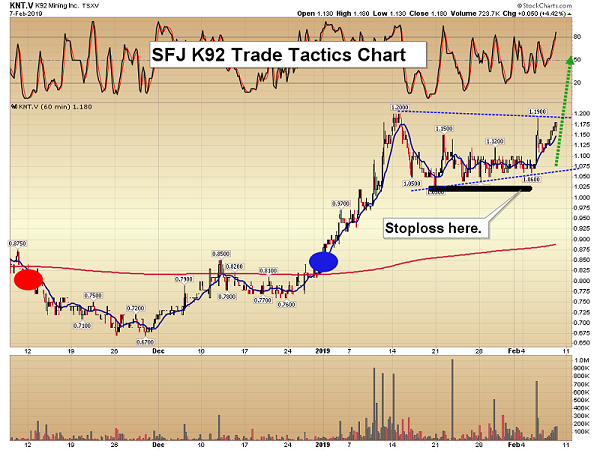
Thanks,
Morris Hubbartt
Unique Introduction For Website Readers: Send me an email to signals@superforcesignals.com and I’ll send you two hot junior stocks with buy, sell, and stoploss levels, plus 3 of my next Super Force Surge Signals free of charge, as I send them to paid subscribers. Thank you!
Stay alert for our Super Force alerts, sent by email to subscribers, for both the daily charts on Super Force Signals at www.superforcesignals.com and for the 60 minute charts at www.superforce60.com
About Super Force Signals:
Our Super Force signals are created thru our proprietary blend of the highest quality technical analysis and many years of successful business building. We are two business owners with excellent synergy. We understand risk and reward. Our subscribers are generally successful business owners, people like yourself with speculative funds, looking for serious management of your risk and reward in the market.
Frank Johnson: Executive Editor, Macro Risk Manager.
Morris Hubbartt: Chief Market Analyst, Trading Risk Specialist.
Email:
Gold stocks’ young upleg is gathering steam, marching steadily to higher lows and higher highs. These bullish technicals are gradually improving sentiment, fueling mounting interest in this contrarian sector. That’s helping the gold stocks regain lost ground relative to gold, the driver of their profits. Fundamentals are growing more favorable as gold itself powers higher. All this portends much-bigger gold-stock gains coming.
Despite a strong rebound upleg in recent months, the gold miners’ stocks are still flying under the radars of most speculators and investors. They aren’t aware the gold stocks are running again, and likely don’t realize how massive gold-stock uplegs can grow. That’s unfortunate, because the biggest gains are won early in young uplegs before they are universally recognized. Buying low early on is the key to multiplying wealth.
The most-popular gold-stock benchmark these days is the GDX VanEck Vectors Gold Miners ETF. It was launched way back in May 2006, giving it a first-mover advantage that has grown into an insurmountable lead. This week GDX’s net assets of $10.5b were a colossal 52.4x larger than the next-biggest 1x-long major-gold-miners-ETF competitor! GDX is the lens through which most traders now view gold-stock fortunes.
And they’ve been excellent in recent months, with GDX boasting performance well outpacing gold as well as the general stock markets. This first chart looks at this sector ETF’s price action over the last several years or so. That’s technically been a gold-stock bull, because gold itself remained in a bull market over that span. Since gold overwhelmingly drives gold-stock performance, it defines gold-stock bull-bear cycles.
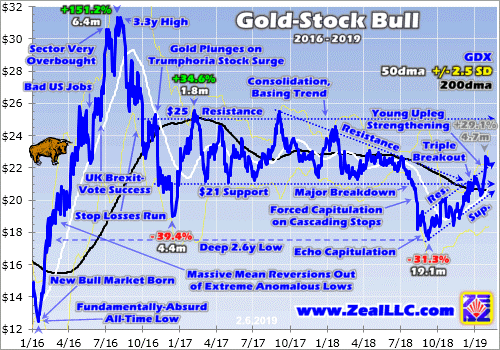
In mid-September GDX shares plunged to a deep 2.6-year secular low. That was fueled by an extreme forced capitulation in gold-stock shares, the result of stop losses being sequentially triggered in cascading fashion. The GDX price action of recent years setting the stage for this latest low and subsequent upleg is important to understand, and I’ve written recent essays explaining it. Today’s focus is the young upleg since.
It’s actually been quite impressive, and more traders will soon take notice. After bottoming at $17.57 on September 11th, GDX started powering higher in the tight well-defined uptrend bracketed above. Despite the incredibly-bearish sentiment you’d expect after a capitulation plunge leading to major lows, the gold stocks started marching higher on balance. Their young upleg has gathered steam and achieved much since.
GDX has carved a textbook-perfect series of higher lows and higher highs. That inexorably pushed it to a major triple breakout in late December and early January. GDX clawed back above three major overhead resistance lines. The first was the longstanding $21 support of GDX’s prior consolidation basing trend, which had persisted for 21.5 months before early August. Following a major breakdown, it became resistance.
The second was the downward-sloping resistance of a bearish descending-triangle technical pattern that had formed since GDX crested in early September 2017. And the third and most important was GDX’s 200-day moving average, shown in black in this chart. Seeing GDX overcome all three of these major overhead resistance zones in short order was a very bullish sign implying gold stocks were off to the races.
At best so far their young upleg per GDX has powered 29.1% higher in 4.7 months! That’s impressive by any standard. For comparison the S&P 500 broad-market stock index actually fell 6.4% during that span. And gold only rallied 10.3% in its own parallel upleg, so the major gold stocks have enjoyed good 2.8x upside leverage to the metal which drives their profits. That’s on the high side of the typical 2x to 3x range.
GDX has pulled back modestly since hitting its latest upleg high on January 31st, which was a breakout above its uptrend channel. Mid-upleg retreats within trend are perfectly normal and expected. They keep uplegs healthy and extend their longevity by periodically bleeding off excess greed. Without pullbacks, it would flare bright enough to suck in enough near-future buying for the upleg to prematurely exhaust itself.
And just this week this young gold-stock upleg reached another major technical milestone. On Tuesday GDX flashed a Golden Cross buy signal as its 50dma climbed back above its 200dma. Golden Crosses following deep oversold lows are incredibly bullish, signaling major new uplegs or entire bull markets! So they are one of the most-widely-followed and heeded buying signals among technically-oriented traders.
The initial major upleg of this gold-stock bull soared in essentially the first half of 2016, when GDX skyrocketed 151.2% higher in just 6.4 months! Nearly 2/3rds of those entire gains happened after the last Golden Cross following super-oversold lows flashed in early March 2016. These powerful buy signals aren’t just hard technical confirmation that a major upleg is underway, but they occur fairly early in upleg lifespans.
Today’s young gold-stock upleg is the most-consistent, longest-lived, and technically-sound one seen since that H1’16 monster! In general the more gradually uplegs rally, the stronger their technical and sentimental foundations and the longer they are likely to last. Slow-and-steady gains help prevent trader psychology from getting too unbalanced and extreme, granting more time for capital inflows to push prices higher.
GDX did enjoy a larger 34.6% surge over just 1.8 months leading into early February 2017. But that was so sharp it soon burned itself out and failed. Today’s young upleg is far more solid with a lot more staying power. And it remains on the small side by gold-stock standards, implying the lion’s share of its gains are still coming. While GDX’s massive 151.2% blast higher in H1’16 was unusual, gold-stock uplegs tend to get big.
The last secular gold-stock bull ran from November 2000 to September 2011. Just over half of that was in the pre-gold-stock-ETF era before GDX’s launch, so a different benchmark was used to measure it. During that long 10.8-year span, the classic HUI NYSE Arca Gold Bugs Index skyrocketed an astounding 1664.4% higher! Today’s hated gold stocks were the best-performing stock-market sector of that decade.
That life-changing secular gold-stock bull consisted of 12 separate uplegs. Excluding a giant anomalous one soaring after 2008’s first stock panic in a century, the 11 normal ones averaged gains of 80.7% over 7.9 months! Large uplegs are par for the course in the small and volatile gold-stock sector. So the 29.1% GDX gains we’ve seen so far in today’s young upleg are nothing. It’s likely to grow much larger in coming months.
Technically GDX should easily rally to $25 fairly soon, which was the old upper-resistance line of its long consolidation basing trend. That would extend this upleg’s gains over 42%. At that point GDX’s upside momentum would likely drive an upside breakout. And seeing GDX climbing to new multi-year highs over $25 would certainly catch traders’ attention, leading to a surge in capital inflows to chase gold stocks’ upside.
GDX’s bull-to-date peak was $31.32 in early August 2016, which wasn’t lofty as a mere 3.3-year high. It wouldn’t surprise me at all to see GDX challenge those levels before this young upleg matures then gives up its ghost. Rather interestingly that would grow this upleg to 78% gains, which is right in line with the previous secular bull’s average. The gold stocks still have lots of room to power much higher from here.
Their coming gains are inexorably intertwined with gold like usual. Gold-stock uplegs are directly driven by parallel gold uplegs. Rising gold prices boost gold stocks both sentimentally and fundamentally. They motivate speculators and investors to redeploy capital in the gold miners, and buying begets buying. The longer and higher gold stocks rally, the more traders want to buy them. Gold gains fuel this virtuous circle.
But more importantly higher gold prices directly drive higher earnings at the gold miners, fundamentally justifying higher gold-stock prices. This critical relationship is approximated by the ratio between gold-stock and gold price levels. It also portends big gold-stock gains coming. This next chart looks at the GDX/GLD Ratio during recent years’ gold-stock bull. GLD SPDR Gold Shares is the world’s leading gold ETF.
When this GGR is rising it means gold stocks are outperforming gold. That’s normally what happens in gold-stock uplegs. Like GDX itself, its ratio to gold is also climbing in a strong uptrend since those deep mid-September gold-stock lows. But the GGR remains on the low side of today’s gold bull, and has vast room to mean revert higher to pre-bull averages. I explained all this in depth back in a mid-October essay.
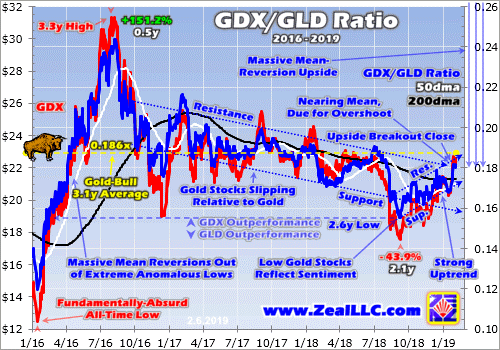
In mid-September as gold stocks’ forced capitulation decimated sentiment, the GGR collapsed to merely 0.155x. A single share of GDX was worth less than 1/6th of a single share of GLD. That also happened to be a 2.6-year secular low in the ratio of gold-stock price levels to gold prices. That simply reflected the seriously-bearish psychology that invariably accompanies major lows. But the GGR has recovered since.
By that latest interim GDX high on January 31st, the GGR had mean reverted back up to 0.182x. That is actually still below this bull market’s average of 0.186x over the past several years or so. But the climbing GGR proves gold stocks are making a major recovery relative to gold. Note above today’s young upleg is seeing the longest, strongest, and solidest GGR rally since H1’16! This upleg is the real deal, no flash in the pan.
After the GGR is forced to major lows or highs well off its averages, it tends to not only mean revert but overshoot proportionally. Since this key fundamental metric of gold stocks fell 0.030x below its bull mean at worst in mid-September, it ought to power a similar amount back above it before this upleg matures. That implies a 0.216x GGR is likely as gold stocks get more popular the longer their upleg rallies higher.
This week GLD traded near $124, so GDX regaining 0.216x means its price would rally to $26.78. That would make for a 52% upleg at today’s gold prices, and would drive that major breakout over GDX’s old $25 resistance line. And of course higher gold prices would lead to proportionally-higher GDX targets at any given GDX/GLD Ratio. Looking at today’s gold-stock levels compared to past means shows huge upside.
Back in mid-October when GDX was still only trading in the $18s and few believed a new gold-stock upleg had been born, I explored the GGR. This small contrarian sector was the last cheap one in wildly-expensive stock markets. I looked at some past GGR levels from the last secular gold-stock bull to point out how far gold stocks could soar. Consider the couple-year spans surrounding 2008’s wild stock panic.
In the 2 years after that extreme anomaly, 2009 and 2010, the GGR averaged 0.422x. And in the 2 years before that fear superstorm, it averaged 0.591x. Those are not high levels at major gold-stock toppings when euphoria reigned, but mere means. GDX ought to be able to regain those well-established levels later on in this bull market. At today’s gold prices, the post-panic average would catapult GDX to $52.33.
That would make for 198% gains from the recent secular low, a tripling in major gold miners’ stock prices! And that still wouldn’t be close to GDX’s $66.63 record hit at the end of gold stocks’ last secular bull back in September 2011. At the pre-panic 2-year-average GGR, this week’s gold levels would support an all-time GDX high of $73.28. That’s 317% higher than recent lows, more than a quadrupling in gold-stock price levels!
And all this assumes flat gold in the low $1300s, which is very unlikely. Gold is enjoying its own young upleg powering higher, which was sparked by the serious stock-market selloff in Q4. At $1350, $1400, or $1450 gold, the gold-stock price levels implied by GGR mean reversions are much higher. And that doesn’t account for the typical proportional overshoot towards the opposite extreme after deep GGR lows are hit.
The key takeaway here is gold stocks’ upside potential remains very large despite the progress so far in this young upleg. The big majority of this particular gold-stock upleg almost certainly remains ahead, so it’s not too late to get deployed before everyone else figures it out. Once gold stocks start surging faster than gold, the resulting bullish psychology becomes self-feeding enticing in more capital fueling bigger gains.
Big gold-stock uplegs are fully justified fundamentally by higher gold prices. Consider an example. The gold miners are now reporting their Q4 results, but the last complete set was Q3’s. Then the major gold miners of GDX reported average all-in-sustaining costs of $877 per ounce. These generally don’t change much regardless of prevailing gold prices. Mining costs are largely fixed when mines are being planned.
That’s when engineers and geologists decide which ore to mine, how to dig to it, and how to process it to recover the gold. So higher gold prices directly amplify gold miners’ bottom lines. While I’ll wade through the gold miners’ Q4 results once they are all released and write a new essay on them, AISCs are highly likely to remain near Q3 levels. Let’s call it $875 per ounce. In Q4 gold’s price averaged $1228 despite the rally.
That means the major gold miners were collectively earning about $353 per ounce mined. Meanwhile so far in Q1 gold is averaging $1296, which is a hefty 5.5% higher quarter-on-quarter. Assuming AISCs are flat across this industry, that implies gold miners are now earning $421 per ounce. That’s a massive 19.3% QoQ jump in profits on a 5.5% higher gold price, making for strong 3.5x upside leverage to gold.
The higher prevailing gold prices thanks to its own upleg are fueling fatter earnings for the gold miners. That provides the critical fundamental underpinning supporting major gold-stock uplegs. They are not just psychological phenomena driven by shifting sentiment, but actually reflect better operating conditions. I doubt historical gold-stock uplegs could’ve averaged such big gains without real fundamental foundations.
The unfortunate thing about major gold-stock uplegs is most speculators and investors ignore them until way too late. Traders love buying high and chasing momentum, but hate buying low before those big gains happen. So sadly the great majority of traders miss the great majority of major gold-stock uplegs. They don’t start deploying capital until after most of the gains are already won, which usually leads to later losses.
While today’s young upleg is gathering steam, we’ve likely only seen the first third or so. Thus there is still time to buy gold stocks relatively low before others start chasing their momentum in coming months after they are much higher. Why buy high later when you can still buy low now? And the best gains won’t be won in big ETFs like GDX, but in the stocks of fundamentally-superior smaller mid-tier and junior gold miners.
The major gold miners dominating GDX are really struggling to grow their gold production. Depletion is outpacing mine growth leading to higher costs and lower profits. That really retards their and thus GDX’s upside potential. But plenty of smaller gold miners are growing their output through new mine builds and expansions, which also lowers their costs. Their stocks’ upside potential utterly trounces the GDX majors.
The earlier you get deployed, the greater your gains will be. That’s why the trading books in our popular weekly and monthly newsletters are currently full of better gold and silver miners mostly added in recent months. The gains we won in 2016 were amazing the last time American stock investors returned to gold. Our newsletter stock trades that year averaged +111.0% and +89.7% annualized realized gains respectively!
The gold-stock gains should be similarly huge as today’s young gold and gold-stock uplegs grow. The gold miners are the last undervalued sector in these still-expensive stock markets, and rally with gold during stock-market bears unlike anything else. To multiply your wealth in the stock markets you have to do your homework and stay abreast, which our newsletters really help. They explain what’s going on in the markets, why, and how to trade them with specific stocks. You can subscribe today for just $12 per issue!
The bottom line is this young gold-stock upleg is really gathering steam. Technically it has rallied higher on balance for months now in a strong uptrend, carving higher lows and higher highs. GDX has broken out above three major resistance lines, and just flashed a key Golden Cross buy signal! All this has really started to shift sentiment back to bullish, which will attract in lots more capital to chase the momentum.
And these mounting gold-stock gains are fundamentally justified by gold’s own growing upleg. Gold-stock earnings amplify underlying gains in gold, making big stock-price surges righteous. Now is the time to get deployed relatively low, before most traders figure this out and start piling in. The evidence suggests a major gold-stock upleg is underway and mounting, and they tend to average gains far bigger than today’s.
Adam Hamilton, CPA
February 11, 2019
Copyright 2000 – 2019 Zeal LLC (www.ZealLLC.com)
Delrey Metals Corp.’s (CSE:DLRY, FSE:1OZ) mandate is to create shareholder value by sourcing, financing & developing undervalued strategic energy metals properties & projects through staking ground or making accretive, prudently and creatively financed acquisitions & joint ventures / farm-ins. They’re off to a good start and have a clean balance sheet with just 34 million shares outstanding and cash of ~C$ 1.5 million. The market cap is about C$8 M = US$6.1 M. The Company is aggressively pursuing additional strategic energy metals assets, and have honed in on 2 or 3 in particular.
Delrey Metals has acquired 5 highly prospective properties in Canada. 4 are prospective for vanadium, for a total of 9,482 hectares, and 1 is a cobalt–copper-zinc opportunity that Cobalt 27 Capital Corp. acquired a 2% NSR on. All 4 vanadium assets will be receiving airborne magnetic surveys and geophysics in February. Subject to results, management will determine which properties to focus on. Both the Porcher and Blackie properties have unique features that if confirmed, will likely make them top priority targets for the next phase of exploration.
Early Days for the Canadian Vanadium Opportunity
Interest in vanadium has grown along with the price. Demand from China continues to be the key driver. While the rest of the world grows at 2%-3% per year, a bad year for China is +6%, and its the 2nd largest economy on the planet. Not only does China use a tremendous amount of steel, it uses huge quantities or rebar which is used in construction & infrastructure building (and rebuilding).
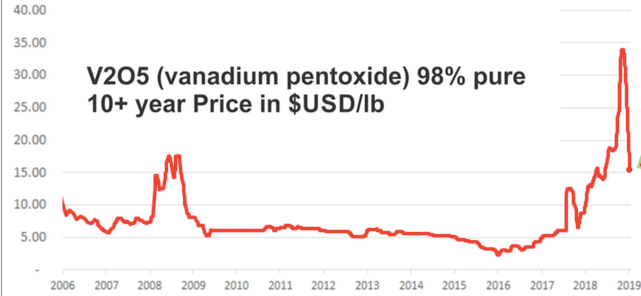
Regarding vanadium pentoxide pricing, there’s been a lot of angst over the recent dramatic decline, but Chinese prices seem to be settling in around US$17/lb. The chart above shows a price closer to US$15/lb., but the price was US$16.90/lb. as of February 3rd. It topped out at nearly US$35/lb. in November, so the price has been halved from a 13-yr. high. Importantly, US$17/lb. is still a strong price, up from a low of US$2.35/lb. on 12/31/15. From $2.35/lb., the Chinese vanadium pentoxide price has risen at a 3-yr CAGR of ~93%. A price between US$15-US$25 is a sweet spot, too high a price and VRBs get priced out of the market.
Perfect Storm of Demand & Supply Fundamentals
Vanadium is primarily used (91%) to strengthen steel rebar, (2 pounds of vanadium added to a tonne of steel doubles its strength), last year China came out with new regulations for Chinese rebar makers– use more vanadium! However, reportedly, 30%-40% of Chinese rebar producers did not follow the regulation implemented in November, which was likely a big factor in the vanadium price crash. The increased demand from this initiative alone is estimated at 10,000 tonnes per year. That’s on a global market of about 90,000 tonnes. 10,000 tonnes/yr. is what Largo Resources’ main mine in Brazil produces, one of the largest mines in the world.
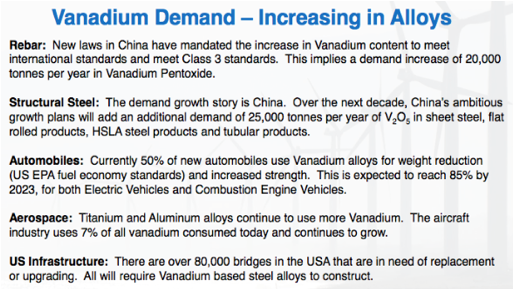
Global demand for vanadium is also being enhanced by other internal moves in China, most notably a total ban on the import of slag and scrap (waste products) that contain vanadium. These waste streams had been used as feedstock for vanadium producers in China. The ban is expected to reduce domestic Chinese production by ~5,000 tonnes/yr.
Quickly on the supply side there have been mine closures dating back to 2015 that are impacting the market. In 2015 a major Brazilian company liquidated, closing the Evraz Highveld mine, representing 10%-15% of global vanadium production. However, at the time the inventory of vanadium was high, so there was a limited price reaction.
Fast forward 2-3 years, there have been other smaller mine closures in China & Brazil, and the above mentioned increase in demand, causing vanadium inventory to be drawn down substantially. Therefore, both sustained demand drivers and ongoing supply constraints help explain the price move from $2.35/lb. at the end of 2015 to a peak of nearly US$35/lb. in 4th qtr. 2018.
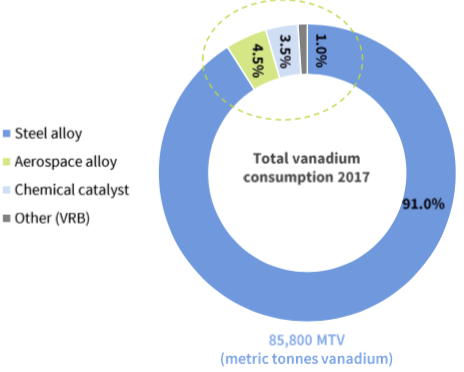
Vanadium Reflux Flow Batteries Could use 31k tonnes of V2O5 by 2025
And then there’s Vanadium Reflux Flow Batteries (“VRBs“). They represent just ~1.5% of the global vanadium market, but some pundits have large, grid-scale energy storage growing at a CAGR of up to 40%. Roskill forecasts vanadium use in VRBs to be 31,000 tonnes by 2025. If true, VRB’s would be a significant demand driver, easily overtaking the uses in Aerospace & chemical catalysts combined.
2019 could be a sweet spot in vanadium pricing, several experts expect prices in the US$15/lb. to US$25/lb. range. That would sustain bullish sentiment for companies with properties outside of China, Russia & South Africa. Delrey Metals has exactly that, 5 early-stage prospects in Canada, all with decent infrastructure, all situated on past producing mining or logging sites, and most important, all having had historical work. Prior work included magnetic and other surveys, soil sampling, surface samples, concentrates were made from some samples, and a drill program (at the Star property).
Blackie Vanadium Property
The Blackie Vanadium property is in west-central British Columbia,, ~96 km south-southwest from Prince Rupert. The property is on Banks Island and is accessible year-round. It is located on tidewater, accessible to the Prince Rupert deep water port, which allows for an 8 day trip to North American west coast ports. There’s a network of logging roads (<500 meters away) allowing for low-cost exploration & development.
The property consists of 5 tenures covering 1,213 Hectares, open for expansion in multiple directions. Blackie is on a brownfield site, the Yellow Giant underground mine was operational as recently as 2015. Blackie is host to a gabbroic body 1.2 km by 0.4 km, with an estimated thickness of at least 500 m (McDougall, 1985).
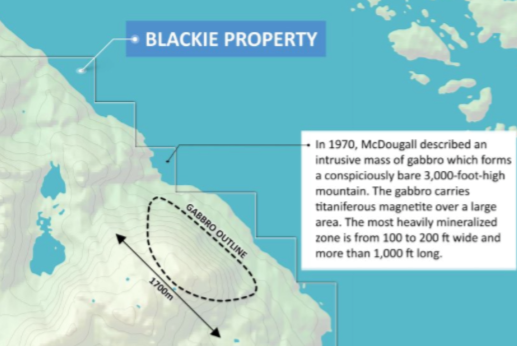
Assays from samples collected by McDougall (1984) ranged from 20% to 25% Iron, 1.1% to 1.9% Titanium, and up to 0.33% V (0.59% V205). Concentrate results made from these samples returned 0.5% to 1% V (0.89% to 1.78% V205). Individual outcrop results from a previous operator returned up to 49% Iron, 7.0% Titanium and an extremely anomalous 1.2% V (2.14% V2O5). “Several million tons of Iron-Titanium-Vanadium bearing material are known at this locality” 1(Rose and Mulligan, 1970).
The Porcher property
The Porcher property is located in west-central BC, ~38 km south-southwest from Prince Rupert. The property is located on Porcher Island and is accessible year-round. There’s a network of nearby logging roads, allowing for cost-effective exploration & development.
Porcher consists of 7 tenures covering 3,122 Hectares, open for expansion in multiple directions. The property is located in a past-producing mining district. The Surf Point Mine, located ~9 km from the Porcher property, operated from 1919 through to 1939. Like with the Blackie property, Porcher is located on tidewater, less than 39 km from Prince Rupert’s deep water port.
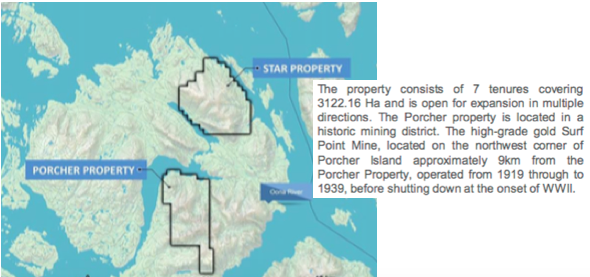
Porcher is host to 2 gabbroic dykes hosting iron-titanium-vanadium mineralization. These sizable dykes are 5.2 km x 1 km, and 4 km x 0.6 km. The dykes are coincident with a large magnetic anomaly identified in the Canada 200 m Residual Total Magnetic field dataset. Limited sampling by McDougall (1961) was completed, with concentrate results ranging from 0.3% to 1.5% Titanium and 0.2% to 0.5% V (0.34% to 0.84% V205). V2O5 deposits globally range from about 0.3% to 0.7%.
Peneece Vanadium Property
The Peneece Vanadium property is in southwest BC, a narrow coastal mainland fjord 85 km east of Vancouver Island. The property consists of 5 tenures covering 1,500 Hectares, open for expansion in multiple directions. Peneece is located along tidewater and is accessible year-round. There’s a network of logging roads within the center of the project area.
The property is host to a >4.8 km long by 0.8 km wide (open to the northwest) pyritic gabbroic complex associated with a very large and intense magnetic anomaly which is believed to be caused by a large body of vanadium-bearing massive titaniferous magnetite.
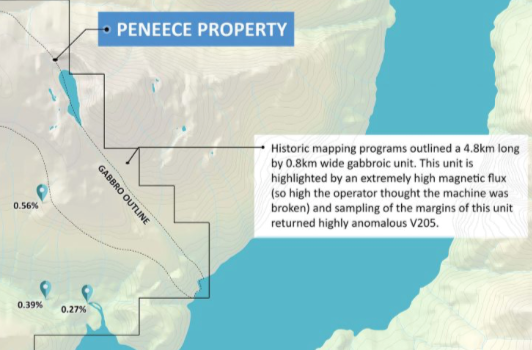
Access problems prevented sampling of the highly magnetic core, and only marginal material samples were obtained. Concentrate results from these samples graded 0.16% to 0.33% V (0.29% to 0.59% V205 – AR 12204) and up to 6.5g/t Ag, a precious metal not typically found in these systems.
The Star Property
The Star property is located in west-central BC, ~ 27 km south-southwest from Prince Rupert. Like the Porcher property, Star is situated on Porcher Island and is accessible year-round. There’s a network of logging roads covering the majority of the property.
Star consists of 4 tenures covering 3,647 Hectares, open for expansion in multiple directions. The Star property is in the same historic mining district as the Porcher property. A gold mine operated from 1919 to 1939. It is located 10 km from the Star property.
The eastern part of the property was explored and drilled in 1955 for Iron Ore by One Resources Canada Corp. Twelve short (<50 m) diamond drill holes were completed for a total of 696 m, targeting a small magnetic anomaly. Conclusions from this work program were that ‘at least several hundred thousand tonnes of magnetite-bearing rock with a grade of the order of 35% Iron exist within the drilling area’ (PF671671).
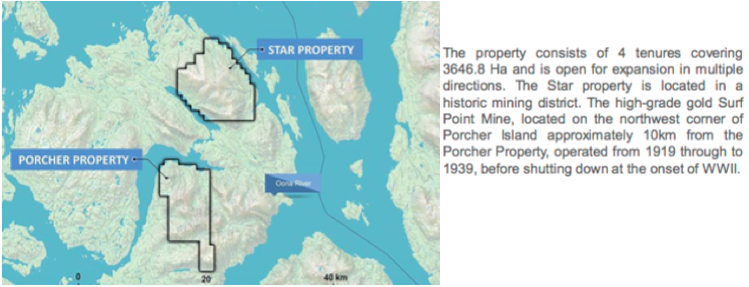
The One Resources Canada Corp. 200m Residual Total Magnetic field dataset highlights a large 5 km x 7 km magnetic high located in the center of the Star claim group. Historic drilling indicated a much larger resource potentially exists within the property area to the west. While the historic drill program did not analyze the magnetite for Vanadium, a Regional Geochemical Survey (RGS) was completed by the British Columbia Geological Survey in 2000 over the Star claim group, which highlighted up to 148 ppm vanadium-in-silt (99th percentile) and 5.06% Iron.
Management believes the Star property has the makings of a significant vanadium discovery including a large magnetic (5km x 7km) high, drained by extremely anomalous vanadium-in-stream results, with a several hundred-thousand-tonne magnetite resource on the margin.
The Sunset Property
The Sunset Property consists of 4 mineral titles covering 785 Hectares. The area had exploration work done in the 1970’s-1980’s. Several cobalt-copper-zinc soil geochemistry anomalies were discovered. In 1987, Decade International outlined a large cobalt‐copper‐zinc anomaly.
A recent exploration program consisting of mapping, grid preparation, geochemical soil sampling & magnetometer surveys has been done, validating the previous cobalt‐copper-zinc soil geochemical anomaly. Copper values in soil over 500 ppm, when plotted with historical values, indicate a cluster about 1,000 meters by 500 meters. Numerous anomalous Cobalt values lie within this area and a smaller cluster of anomalous zinc in soil is also present.
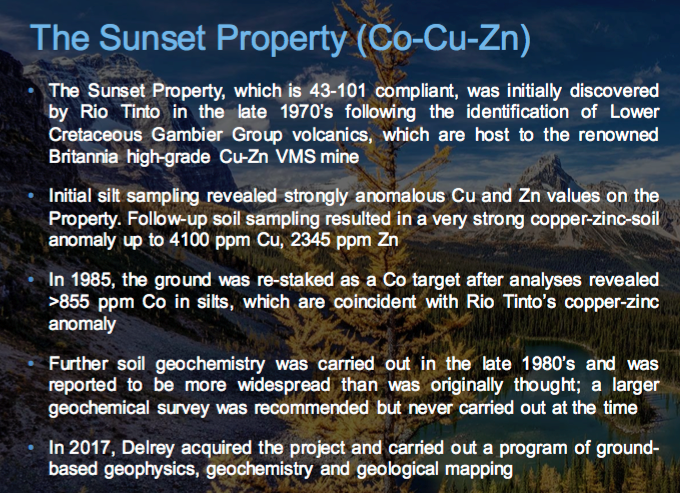
The presence of elevated levels of Cobalt is interesting, and a 2% NSR royalty on Cobalt only has been sold to Cobalt 27 Capital Corp.
Delrey Metals recently finished a phase one exploration program at Sunset. In September 2018, the Company collected 708 soil samples, 68 rock samples and 11 stream sediment samples. As a result of the sampling, management extended its cobalt-copper-zinc anomaly about a kilometre to the west, and discovered a new zone, called Roughrider, which graded up to 4.3% copper. Management believes the new zone may indicate a cobalt-copper-zinc VMS-style of mineralization.
With these 5 properties, investors have multiple opportunities to win if management advances any of the properties to a maiden resource or to a PEA. If one believes in the fundamentals of Vanadium, Canada is a great place to be looking for potentially economic deposits. In addition, management is actively looking at other attractive properties to acquire or option. 2019 is shaping up to be a busy and productive year for Delrey Metals (CSE:DLRY, FSE:1OZ).
Disclosures: The content of this article is for information only. Readers fully understand and agree that nothing contained herein, written by Peter Epstein of Epstein Research [ER], (together, [ER]) about Delrey Metals, including but not limited to, commentary, opinions, views, assumptions, reported facts, calculations, etc. is not to be considered implicit or explicit investment advice. Nothing co-ntained herein is a recommendation or solicitation to buy or sell any security. [ER] is not responsible under any circumstances for investment actions taken by the reader. [ER] has never been, and is not currently, a registered or licensed financial advisor or broker/dealer, investment advisor, stockbroker, trader, money manager, compliance or legal officer, and does not perform market making activities. [ER] is not directly employed by any company, group, organization, party or person. The shares of Delrey Metals are highly speculative, not suitable for all investors. Readers understand and agree that investments in small cap stocks can result in a 100% loss of invested funds. It is assumed and agreed upon by readers that they will consult with their own licensed or registered financial advisors before making any investment decisions.
At the time this article was posted, Delrey Metals was an advertiser on [ER]. Readers understand and agree that they must conduct their own due diligence above and beyond reading this article. While the author believes he’s diligent in screening out companies that, for any reasons whatsoever, are unattractive investment opportunities, he cannot guarantee that his efforts will (or have been) successful. [ER] is not responsible for any perceived, or actual, errors including, but not limited to, commentary, opinions, views, assumptions, reported facts & financial calculations, or for the completeness of this article or future content. [ER] is not expected or required to subsequently follow or cover events & news, or write about any particular company or topic. [ER] is not an expert in any company, industry sector or investment topic. [ER] may buy or sell shares in Delrey Metals and other advertising companies at any time.
- Gold price sales offer opportunity but patience is required. I like to see a market swoon of at least $50/ounce before buying any fresh medium-term gold or related positions.
- Most amateur gold investors should wait for $100/ounce declines before buying or use very tight stop-losses to protect their capital.
- When buying, it’s important that investors have strong hands accompanying them, and the smaller dips don’t attract Chindian dealer or COMEX commercial trader buying in much size.
- Please click here now. Double-click to enlarge. Gold has rallied about $130 since the August lows of about $1175.
- A consolidation or correction becomes more likely as a rally extends in both price and time. That doesn’t mean a correction has to happen now, but it does mean investors need to get emotionally prepared for it to happen.
- A 50% correction would see gold trade near the $1250 area and that would represent about an $80 price sale from the $1330 area highs. That’s not likely enough of a pullback to guarantee significant Chindian dealer and COMEX commercial buying of size.
- If gold’s rally continued to $1350 before the correction began, a pullback to $1250 would become an important buying area for long term investors.
- Please click here now. Double-click to enlarge this short-term gold chart. Some “head & shoulder topping” action is beginning to present itself. Charts are created by fundamentals, and while the big picture for gold is truly spectacular, the short-term picture is somewhat negative.
- That’s because the Chinese New Year holiday is in play. China’s gold market is closed this week, and it’s an important cog in the gold demand wheel.
- Please click here now. Double-click to enlarge. While it’s true that Chinese demand tends to swoon at this time of year, this year I believe it’s unlikely to produce anything more than a modest and heathy correction. I’m already quite impressed with the orderly nature of the sell-off.
- In America, top bank economists predict GDP growth will slip to 2% or lower by the third quarter, which is also stock market “crash season”. Republicans lost the House because they refused to eliminate income taxes for the poor, and now powerful politicians in the House want to reduce stock buybacks that have been supporting the stock market.
- Jay Powell has warned investors that the U.S. stock market is at risk of a crash. Wall Street money managers predict he won’t raise rates at all this year, but I’ve called that wishful thinking.
- I don’t think the money managers need to be worried about rate hikes because of strong growth, but I do think they need to be very concerned about the possible emergence of US stagflation in the second half of the year. That could send money managers into gold stocks in quite a major way. The bottom line:
- In the short term, gold faces modest seasonal headwinds. In the medium and long term, gold has mighty tailwinds!
- Please click here now. Double-click to enlarge this NUGT chart. For short term action, I suggest traders use my guswinger.com trade service to trade NUGT, DUST, UDOW, and SDOW. I’ve highlighted my latest mechanical system trades on this chart.
- Short term trading in the gold market should be just one part of an overall investment program. The ability to take quick action can help reduce investor tension. In contrast, my sole focus for the U.S. stock market is short term trading. The market is too dangerous now to engage in long term positioning with large amounts of risk capital.
- U.S. stocks should stagger somewhat higher because the business cycle still has some life left in it, but risk now dramatically overwhelms potential reward. Powell’s change in tone could be related to the money managers and the U.S. government begging him to give them a break.
- Unfortunately, it’s more likely that he has the same outlook the bank economists and I have for the US economy; a meltdown in U.S. GDP growth and corporate earnings is imminent.
- With the U.S. government operating on massive debt growth autopilot, a slowdown in GDP is almost certain to be accompanied by a loss of confidence in the ability of the government to finance itself.
- From a gold investor’s standpoint, what’s particularly interesting is that it appears that foreign central banks are slowly but surely replacing their U.S. Treasury bond holdings with gold bullion! This is likely putting pressure on the Fed to dial back its QT program and that could create an even bigger loss of confidence event.
- Long term positions in the U.S. stock market need to be accumulated at the business cycle trough, and that trough is likely to bring vastly lower stock market prices than investors see in front of them now.
- Please click here now. Double-click to enlarge this GDX chart. Over the past twenty years, gold stocks have generally had severe price corrections when gold has staged modest swoons. That’s because a deflationary theme was in play.
- Now, an inflationary theme is beginning. Some individual gold stocks are holding their gains when gold declines, and the GDX and SIL indexes are not staging any crash-like sell-offs when gold declines.
- While profit booking is always a good thing (especially with oscillators overbought after a sharp run higher in the price), GDX is technically very healthy, and a possible bull flag pattern is in play. Will that pattern continue to form as the Chinese gold market stays closed this week? I think so. Will the price then burst out of the flag pattern and surge past $23 and reach my new $25 target? I think so, too!
Special Offer For Website Readers: Please send me an Email to freereports4@gracelandupdates.com and I’ll send you my free “Juniors With The Uptrend Juice!” report. I highlight key junior miners that are now in clear uptrends and technically healthy, with precision buy, sell, and optional stoploss prices for money making action!
Stewart Thomson
Graceland Updates
Email:
Risks, Disclaimers, Legal
Stewart Thomson is no longer an investment advisor. The information provided by Stewart and Graceland Updates is for general information purposes only. Before taking any action on any investment, it is imperative that you consult with multiple properly licensed, experienced and qualified investment advisors and get numerous opinions before taking any action. Your minimum risk on any investment in the world is: 100% loss of all your money. You may be taking or preparing to take leveraged positions in investments and not know it, exposing yourself to unlimited risks. This is highly concerning if you are an investor in any derivatives products. There is an approx $700 trillion OTC Derivatives Iceberg with a tiny portion written off officially. The bottom line:
Are You Prepared?
First we need to define what a breakout actually is. It is when the price breaks a pattern or a range and a new trend is therefore established.
Today, people are all too quick to refer to almost every move higher as a breakout. Just google “Gold Breakout” and you’ll see what I mean.
Sure, closing above $1300 was a breakout for Gold. But that’s hardly significant. If and when Gold surpasses the wall (resistance at $1350-$1375), it will mark a real breakout.
The good news is Gold is currently in a much better position both fundamentally and technically than it was in 2016, 2017 and 2018.
Let me start with the technicals.
Gold in real terms is stronger than at any other time in the past few years.
In the chart below we plot Gold against foreign currencies (FC), stocks, bonds and commodities. The four vertical lines highlight the points when Gold was testing its wall of resistance.
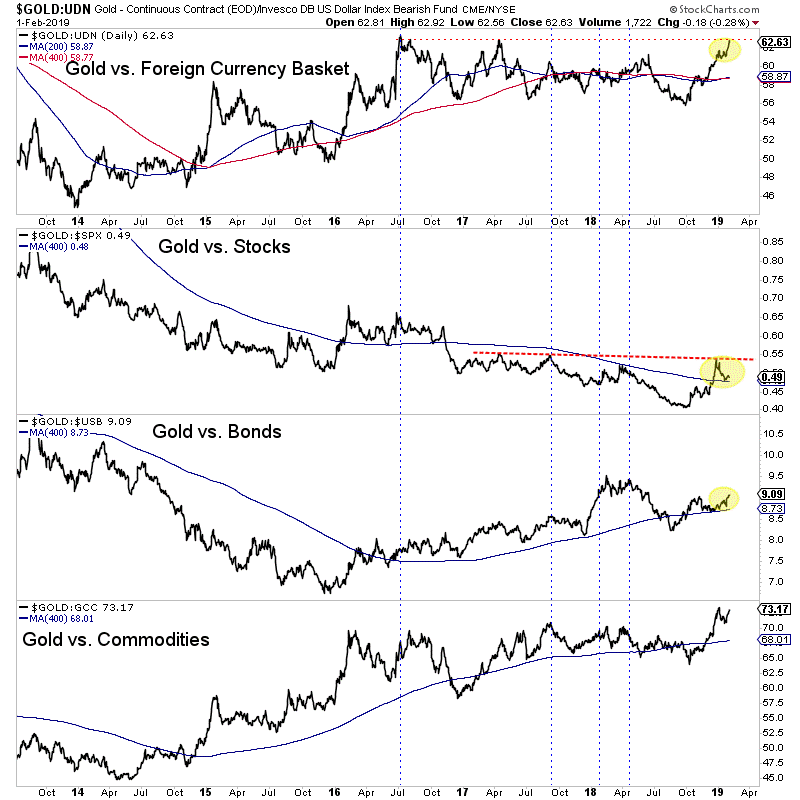
During 2017 through 2018, Gold was driven mostly by a weak dollar. In relative terms, Gold was weak against FC and stocks.
Relative to summer 2016, Gold is currently stronger against bonds and commodities and is inches away from testing its 2016 high against FC.
The last thing holding Gold back is the stock market. Note that the Gold to S&P 500 ratio has not made a higher high in recent days. While its holding above moving average support it desperately needs to make a higher high to confirm a new Gold bull market is underway.
The performance of Gold relative to the stock market is connected to the fundamentals for Gold.
If the stock rally and economic data hold firm, the Fed could reintroduce rate hikes into the equation. That’s not a bullish scenario for Gold. (It’s important to keep this in mind).
On the other hand, if the market is right, the Fed is done hiking rates and will make its first rate cut in 2020.
That scenario eventually implies equity market weakness, a push higher in the Gold to stock market ratio and a breakout in Gold.
So who should we trust: the market or the Fed, who thinks they could hike this year?
The gold stocks are providing additional evidence. They exploded above their 400-day moving averages and have shown strong breadth over the past two weeks.
At present, the weight of the evidence is favoring bullish outcomes for precious metals. Ultimately, if Gold and gold stocks extend their outperformance against the stock market then look out for a breakout and a full blown bull market. To prepare yourself for some epic buying opportunities in junior gold and silver stocks, consider learning more about our premium service.
by Morris Hubbartt
February 5, 2019
Here are today’s videos and charts (double-click to enlarge):
SFS Key Charts, Signals, & Video Analysis
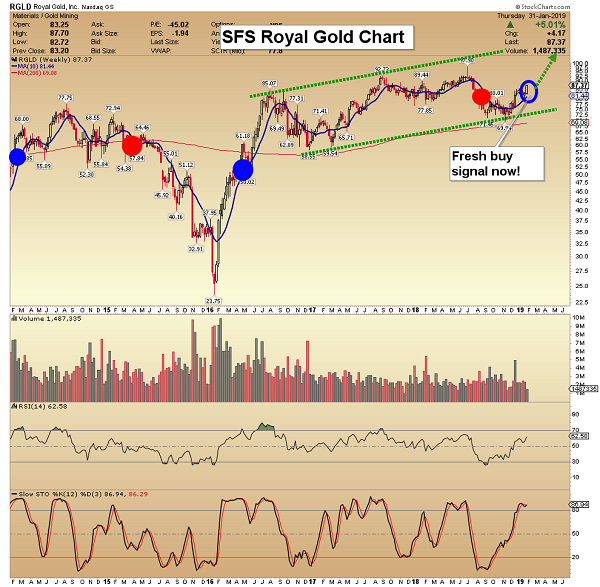
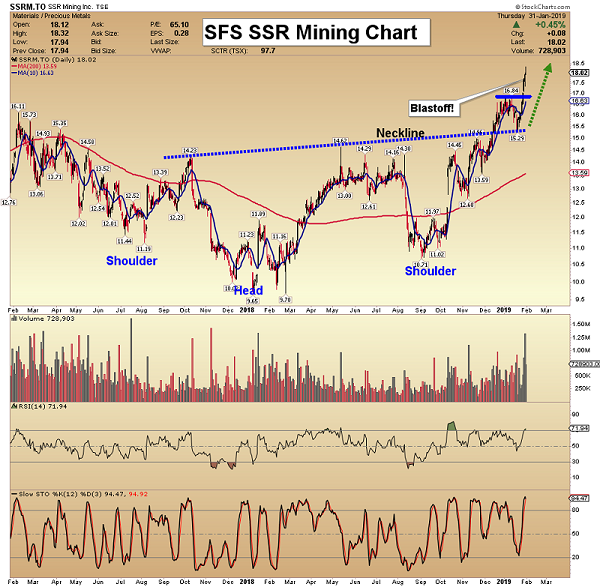

SF60 Key Charts, Signals, & Video Analysis

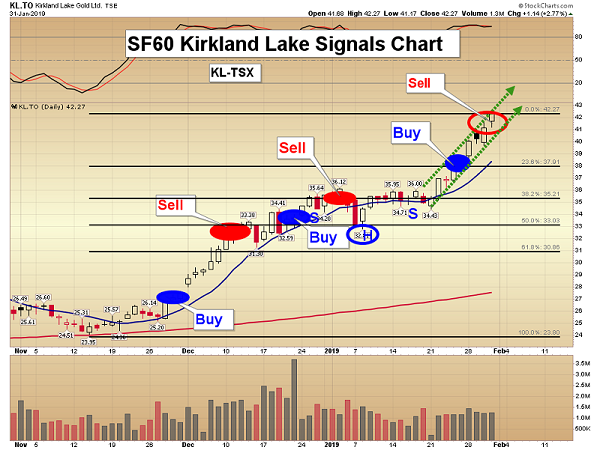
SF Trader Key Charts, Signals, & Video Analysis
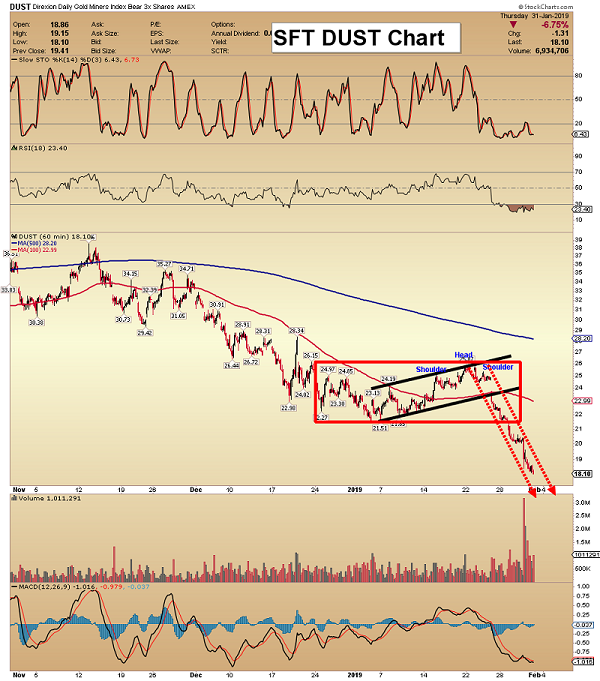
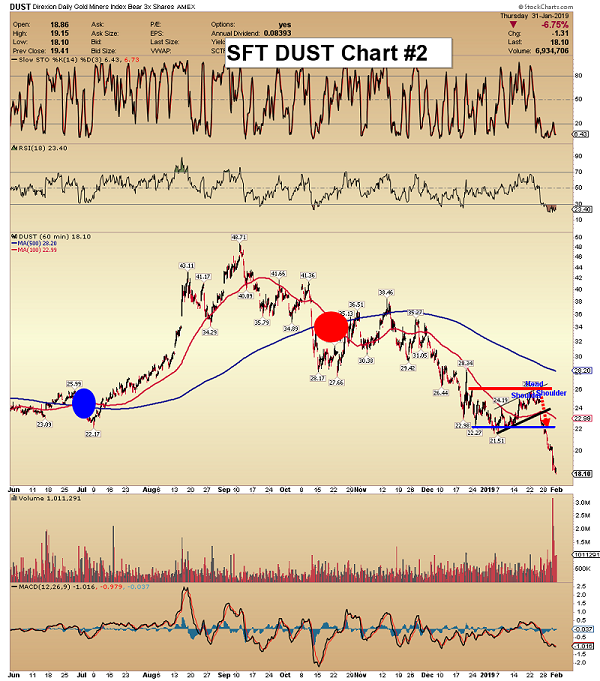
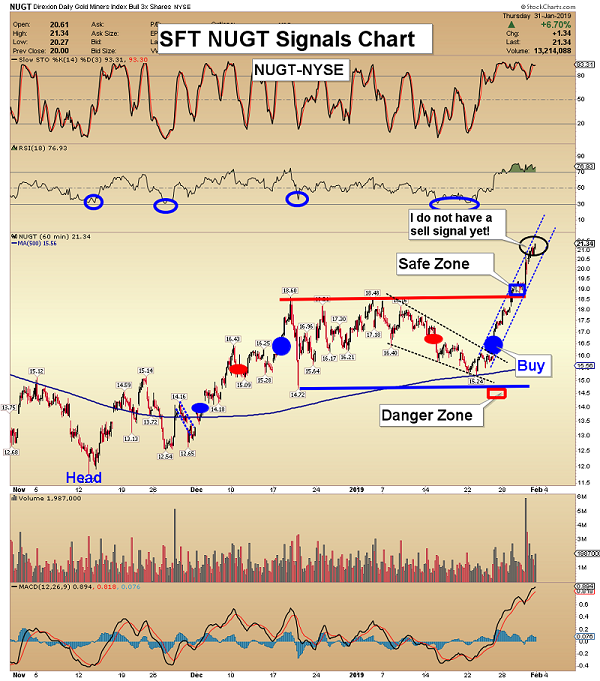
SFJ Key Charts, Signals, & Video Analysis
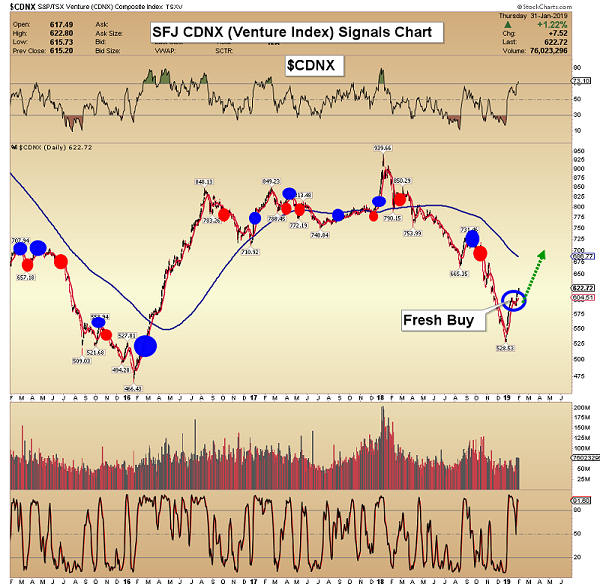
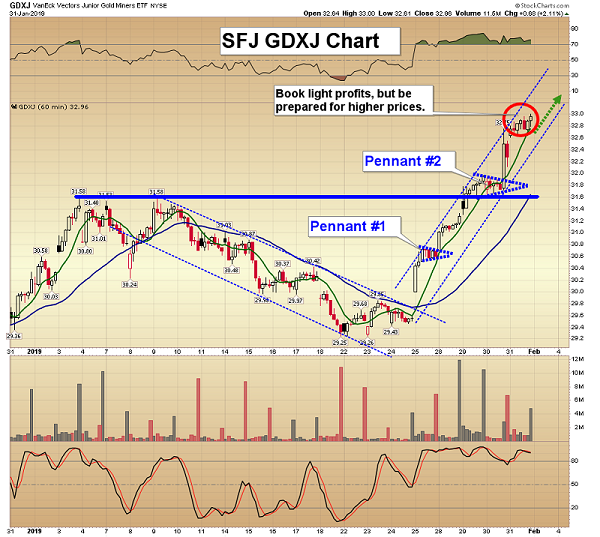
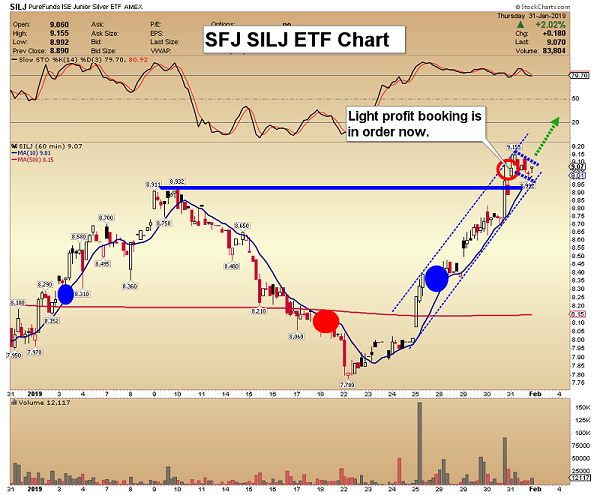
Thanks,
Morris Hubbartt
Unique Introduction For Website Readers: Send me an email to signals@superforcesignals.com and I’ll send you 3 of my next Super Force Surge Signals free of charge, as I send them to paid subscribers. I’ll also send you a video on three of the hottest junior gold stocks! Thank you!
Stay alert for our Super Force alerts, sent by email to subscribers, for both the daily charts on Super Force Signals at www.superforcesignals.com and for the 60 minute charts at www.superforce60.com
About Super Force Signals:
Our Super Force signals are created thru our proprietary blend of the highest quality technical analysis and many years of successful business building. We are two business owners with excellent synergy. We understand risk and reward. Our subscribers are generally successful business owners, people like yourself with speculative funds, looking for serious management of your risk and reward in the market.
Frank Johnson: Executive Editor, Macro Risk Manager.
Morris Hubbartt: Chief Market Analyst, Trading Risk Specialist.
Email:
Silver recently started outperforming gold again, a watershed event. For long years this white metal has mostly lagged the yellow one, relentlessly battering silver sentiment. But gold surging into year-end 2018 finally sparked some life into moribund silver. This is a bullish sign, as silver has soared in the past once rising prices reach critical mass in attracting new investment capital. Silver looks to be nearing that point again.
Despite a good finish, 2018 was a rough year for silver. Its price slumped 8.6%, way worse than gold’s -1.6% performance. And that still masks miserable intra-year action. At worst in mid-November, silver had plunged 17.3% year-to-date. That was 2.2x gold’s comparable loss, and at $13.99 silver languished at a major 2.8-year low. A soul-crushing 96% of its early-2016 bull market had been reversed and lost!
Back in December 2015 silver had bottomed a few days before gold at a deep 6.4-year secular low. Over the next 7.6 months silver soared 50.2% higher, outpacing gold’s parallel new-bull upleg by 1.7x. That promising start didn’t pan out though, silver crumbed once gold’s advance stalled and failed. Ever since its August 2016 peak of $20.56, silver mostly ground sideways sandwiched between two major downlegs.
It was the latter one that finally bottomed in mid-November 2018, with hope lost and silver bearishness universal and suffocating. Silver’s fortunes are heavily dependent on gold, and silver effectively acts like a gold sentiment gauge. The weak silver prices reflected the lack of enthusiasm for gold, which wasn’t far above its own 19.3-month low of mid-August. Gold had slumped to $1200, and threatened to break below.
For better or worse, gold drives silver. Traders usually ignore the tiny silver market until gold has rallied long enough and high enough to convince them its upside momentum is sustainable. So when gold itself is down in the dumps, silver doesn’t have a prayer. But gold bottomed that day and started clawing back higher, so silver joined along in the bounce. That gradually grew into a new silver upleg over the next 8 weeks.
By early January, silver had rallied 12.4% on a 7.7% gold rally. That made for 1.6x upside leverage to gold, which is still on the low side historically. But it was a welcome change after silver spent much of last year sliding considerably. A sub-span of that advance really caught my attention. Between the hawkish FOMC meeting on December 19th to the young new year on January 3rd, silver surged 7.9% in 9 trading days.
That was 1.9x gold’s 4.2% advance, and silver’s best outperformance relative to gold since that major upleg in H1’16! Something was changing in the left-for-dead silver market, with capital starting to return after more than a couple years of self-imposed exile. Over this past week silver enjoyed another solid stretch of outperformance, offering further confirmation. It started last Friday when gold itself soared 1.7%.
Gold ignited after a Wall Street Journal article claiming the Fed was considering ending its quantitative tightening early! That dovishness hit the U.S. dollar and catapulted gold higher. Over the next 4 trading day’s silver surged 4.8% on gold’s 3.0%, for 1.6x leverage. If that buying can push silver high enough to reach a psychological critical mass and become self-feeding, it portends major silver upside in coming months.
The more silver rallies, the more speculators and investors will want to buy it. The more capital they push into silver, the faster it will ascend. Buying begets buying in silver just like almost everywhere else in the markets. While upside momentum in itself is bullish anytime, silver’s upside potential is far greater than usual because it has been so darned undervalued. That’s made room for massive mean-reversion gains.
Silver’s “valuation” can be inferred relative to gold, its dominant driver. While the global silver and gold supply-and-demand profiles are independent with little direct linkage, these precious metals are joined at the hip psychologically. Silver rarely rallies materially unless gold leads the way. Silver traders look to gold for cues, which makes silver amplify gold’s moves. Silver’s technical relationship to gold is ironclad.
All this makes the Silver/Gold Ratio the most-important fundamental measure of silver-price levels. It is technically calculated by dividing daily silver closes by daily gold closes. But that yields tiny decimals that are hard to parse mentally, like the mid-week SGR of 0.012x. It is far more brain-friendly to consider this ratio from the opposite direction, via the Gold/Silver Ratio. This week it ran at an easier-to-comprehend 82.2x.
Mathematically the SGR is identical to an inverted GSR. So charting the GSR with an upside-down scale yields the same line as the SGR, but with way-more-intelligible numbers. Here this inverted-GSR SGR proxy in blue is superimposed over the silver price in red. Silver has rarely been lower relative to gold than it was in recent months. That portends monster upside as silver mean reverts higher leveraging gold.
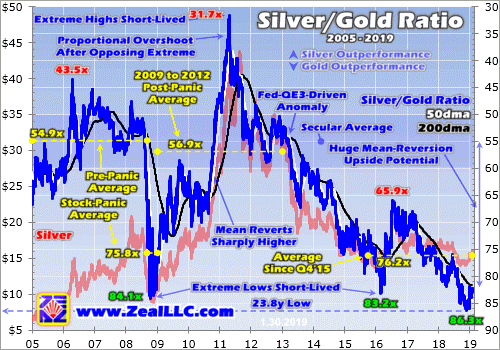
At that latest secular silver low in mid-November, the SGR fell to 85.9x. In other words, it took nearly 86 ounces of silver to equal the value of one ounce of gold. While silver started recovering, it initially lagged gold enough to force the SGR lower still. At the end of November it slumped as low as 86.3x on close, an astounding level. That was actually an extreme 23.8-year secular low in the SGR, nearly a quarter-century!
Silver hadn’t been lower relative to gold since early March 1995, practically a lifetime ago considering all that’s happened in the financial markets since. Even during the greatest market fear event in our lifetimes the SGR wasn’t lower. During late 2008’s first-in-a-century stock panic, the SGR just briefly hit 84.1x in mid-October. Being highly-speculative and super-sensitive to sentiment, silver had plummeted leading into it.
That stock-panic episode of extreme SGR lows shows what’s probable after silver inevitably reverses and mean reverts higher. Over the 3.7 years since 2005 leading into that panic, the SGR averaged 54.9x. That was right in line with the mid-50s that had been normal for decades. Silver had generally oscillated around 1/55th the price of gold, so miners had long used 55x as the proxy for calculating silver-equivalent ounces.
With silver so radically out of whack relative to gold, those extreme SGR panic lows weren’t sustainable. Like a beachball pushed too far under water, silver was ready to explode higher to reestablish its normal relationship with gold. That indeed happened during the post-panic years. After plummeting as low as $8.92 in late-November 2008, silver more than doubled by early December 2009 with a 115.4% gain.
While silver was really outperforming gold after its anomalous lows, at best in that initial post-panic rally the SGR only regained 58.6x. That was still below the 55x secular average. So silver continued slowly grinding higher on balance into late 2010. Then gold started surging again, creating the right sentiment conditions to unleash self-feeding silver buying. Silver skyrocketed from there, surging far faster than gold!
The faster silver soared into early 2011, the more traders wanted to own it and the more capital they poured into it. This psychological phenomenon of higher prices being more attractive runs through nearly all markets. The crazy bitcoin mania in late 2017 was a recent example. Silver’s virtuous circle of surging and new capital inflows finally climaxed in late April 2011 at $48.43 per ounce. That was one heck of a bull.
Starting from those extreme stock-panic lows radically undervalued relative to gold, silver had rocketed 442.9% higher in 2.4 years! And that massive run didn’t simply stop at a 55x SGR, but instead the huge buying momentum drove a proportional upside overshoot. The SGR peaked at 31.7x, which was 4/5ths as far above that long-term 55x mean as the SGR was below it at stock-panic lows. This principle is crucial.
After longstanding price relationships driven by some kind of inexorable fundamental or psychological links are forced to extremes, they don’t just mean revert. That reversion momentum blasts them right through their average to overshoot proportionally towards the opposing extreme! This behavior is very pendulum-like. The farther the SGR is pulled one way, the stronger its swing towards the other side of the arc.
Interestingly that massive mean-reversion-overshoot bull following 2008’s stock panic ultimately dragged the SGR high enough to average 56.9x in those post-panic years between 2009 to 2012. Despite great volatility in this ratio, it continued to gravitate towards that 55x secular mean. That persisted until early 2013 when the Fed’s unprecedented open-ended third quantitative-easing campaign greatly distorted markets.
That year alone the Fed conjured $1020b of QE capital out of thin air to inject into the markets! That forced the flagship US S&P 500 broad-market stock index 29.6% higher that year. Such blistering gains made investors forget about gold and silver, so they fell precipitously. That shattered fragile sentiment leading to multi-year bear markets in the precious metals. Silver leveraged gold’s downside like usual.
Thus the SGR slowly collapsed between early 2013 to early 2016 as gold and silver languished in Fed-driven bear markets. That was a very-challenging time psychologically, scaring away the great majority of contrarian speculators and investors. Ultimately silver plunged so far that the SGR fell to 83.2x at worst in late February 2016. That was an extreme low rivaling the 2008 stock panic’s, which truly defies all reason.
Again such SGR extremes weren’t sustainable, so silver blasted higher with gold and amplified its gains in roughly the first half of 2016. Unfortunately that new-bull upleg was cut short, capping silver at mere 50.2% gains and the SGR at 65.9x. Silver’s typical mean reversion out of extreme SGR lows was indeed underway, but unfortunately it was short-circuited by Trump’s stunning surprise election victory that November.
The stock markets started surging on hopes for big tax cuts soon with Republicans controlling the House, Senate, and presidency. So stock traders dumped gold-ETF shares which hammered the gold price and sucked silver down with it. Silver continued underperforming gold on balance until late November 2018 and that latest extreme 86.3x SGR low. Silver both fell faster than gold and rallied slower than it over this span.
Again that crazy nearly-quarter-century low in silver prices relative to gold prices was more extreme than both during late 2008’s stock panic and after late 2015’s secular low. Shockingly the SGR average since Q4’15 is now running 76.2x, which is actually worse than the 75.8x in the four months in late 2008 hosting that stock panic! Silver has languished far too low relative to gold in recent years, an unsustainable anomaly.
That guarantees a massive mean reversion higher for silver as gold’s young upleg continues to unfold. Seeing gold power higher on balance will motivate speculators and investors to redeploy into silver, which will fuel outsized gains in the white metal. That process is already underway, as proven by silver’s sharp gains relative to gold straddling the dawn of this new year. Silver is starting to outperform gold and mean revert!
Let’s assume the worst-case scenario, a silver upleg that fizzles prematurely due to an exogenous shock like Trump’s election win was back in late 2016. If the SGR merely revisits 65x, at $1250 gold that would mean silver near $19.25. While that’s only a 38% upleg from the mid-November lows, it is still well worth riding. At $1300 and $1350 gold, that very-low 65x SGR would yield silver prices near $20.00 and $20.75.
But with the stock markets almost certainly rolling over into a major new bear, it’s unlikely gold’s upleg will be truncated small again. As long as stocks generally weaken, gold investment demand will remain high driving up gold prices. That will keep traders excited about silver, chasing its gains and bidding it ever higher. It’s hard to imagine the SGR not at least mean reverting to its 55x secular average in this scenario.
At 55x and $1250, $1300, and $1350 gold, silver would power up near $22.75, $23.75, and $24.50. Such levels would make for a total silver upleg of 63%, 70%, and 75% from those deep mid-November lows. So even without a proportional overshoot, silver’s upside potential is big after being hammered to such deep lows relative to gold. Some magnitude of mean reversion higher is certain after such extreme SGR lows.
It would take a major gold upleg running for a couple years to fuel an SGR overshoot. In essentially the first half of 2016, this gold bull’s first upleg powered about 30% higher. That is actually on the small side by historical gold-upleg standards. Apply it to gold’s deep mid-August lows driven by record short selling in gold futures, and that yields an upleg target near $1525. That would work wonders for silver sentiment.
Once gold breaks decisively above its bull-to-date peak of $1365 from July 2016, excitement will explode driving outsized self-feeding investment demand. That should fuel a proportional mean-reversion overshoot in silver. Silver far outperforming gold as capital flooded in could even push the SGR up near 35x briefly. While such an upside extreme wouldn’t last any longer than downside ones, silver would soar.
At $1400, $1450, and $1500 gold, a mean-reversion-overshoot SGR of 35x would catapult silver way up near $40.00, $41.50, and $42.75 per ounce! That implies silver upleg gains ranging from 186% to 206% from mid-November’s low. The key takeaway here is after extreme SGR lows, silver’s resulting mean-reversion gains can grow massive. Silver far outperforms gold for a long time after underperforming for years.
That inevitable outperformance already started through late December and early January, when the SGR recovered sharply from 86.3x to 82.0x. That rapid rebound in silver prices is a strong indication that a major mean reversion is now underway. And history proves that once silver starts moving, it tends to rally fast as momentum builds. Buying begets buying, with higher silver prices fueling larger capital inflows.
As always the biggest gains will be won by the fearless contrarians who buy in early before everyone else figures this out. Investors and speculators alike can play silver’s big coming upside in physical bullion, its leading SLV iShares Silver Trust silver ETF, and the silver miners’ stocks. But only the latter will leverage silver’s gains, making them exceptionally attractive. Consider their example from that last major silver upleg.
Again in 7.6 months in mostly the first half of 2016, silver powered 50.2% higher before Trump’s surprise election win short-circuited that rally. The leading SIL Global X Silver Miners ETF rocketed an immense 247.8% higher in essentially that same span! That made for huge 4.9x upside leverage to silver’s gains, which is pretty awesome. The major silver miners’ stocks will amplify silver’s upside in its next big upleg too.
At Zeal we recognized the extreme anomalous lows in the SGR in late 2015 and early 2016 and deployed aggressively in both gold and silver stocks. The resulting gains were outstanding, with the stock trades in our popular weekly and monthly newsletters averaging +111.0% and +89.7% annualized realized gains in 2016! We’ve filled our trading books again in recent months in anticipation of the next big gold and silver uplegs.
To multiply your wealth in the stock markets, you have to do your homework and stay informed. That’s where our newsletters really help. They draw on my decades of experience, knowledge, wisdom, and ongoing research to explain what’s going on in the markets, why, and how to trade them with specific stocks. I study the markets all day everyday so you don’t have to. Subscribe today and enjoy the fruits of our hard work for just $12 per issue!
The bottom line is silver has started outperforming gold again. After getting pummeled near a quarter-century low relative to gold, silver started surging late last year. Following past extreme SGR lows, silver powered higher in major-to-massive mean-reversion uplegs and bull markets. Their advents have been signaled by silver beginning to rally faster than gold after suffering long periods of underperformance.
That’s now happening again, which is a super-bullish omen for silver. Capital inflows are accelerating as gold’s gains restore more-favorable sentiment. As long as gold continues meandering higher on balance, silver buying will beget more silver buying. That portends big gains coming in silver and especially the stocks of its miners. Silver mean reversions higher out of extreme lows relative to gold can run for years.
Adam Hamilton, CPA
February 4, 2019
Copyright 2000 – 2019 Zeal LLC (www.ZealLLC.com)
If you would like to receive our free newsletter via email, simply enter your email address below & click subscribe.
 Follow us on Twitter
 Become our facebook fan
CONNECT WITH US
Tweets
Tweet with hash tag #miningfeeds or @miningfeeds and your tweets will be displayed across this site.
MOST ACTIVE MINING STOCKS
Daily Gainers
 CMC Metals Ltd. CMC Metals Ltd. |
CMB.V | +900.00% |
 Eden Energy Ltd Eden Energy Ltd |
EDE.AX | +200.00% |
| GoviEx Uranium Inc. |
GXU.V | +42.86% |
| Eagle Nickel Ltd. |
ENL.AX | +41.67% |
| Citigold Corp. Limited |
CTO.AX | +33.33% |
| Mount Burgess Mining NL |
MTB.AX | +33.33% |
| Exalt Resources Limited |
ERD.AX | +31.94% |
| Casa Minerals Inc. |
CASA.V | +30.00% |
| Cariboo Rose Resources Ltd |
CRB.V | +28.57% |
| Belmont Resources Inc. |
BEA.V | +28.57% |


