
Eskay Creek, formerly the world’s highest-grade gold mine, may be headed for a re-start due to very promising exploration work completed by Skeena Resources (TSX.V: SKE).
Eskay Creek was operated by Barrick Gold until shutting down in 2008 due to a combination of high operating costs and a low gold price. Skeena picked up the option to explore the closed mine and has been working diligently on the project for the last two years.
Skeena has proved up a 4-million ounce gold equivalent resource at 4.5 grams/ton (indicated and inferred) open pit. The open pit aspect makes this a tantalizing prospect for investors.
Skeena sees a pathway to making the ultimate total resource larger and bringing the grade closer to 6 grams/ton. Work over the next year will determine the viability of re-opening the mine. Skeena believes Eskay Creek is the best open pit deposit of any junior miner in the world, and the stock price is yet to reflect this.
Jonathan Roth of CEO.ca sat down with Skeena’s CEO Walter Coles, Jr. and Skeena’s VP of Communications Kelly Earle to discuss the company’s discoveries, what the next steps are, and why investors should be paying attention.
Jonathan Roth: What attracted you to Skeena? Because obviously you had a lot of options. Why would you come to Skeena?
Kelly Earle: So, I was initially drawn to the Golden Triangle, the assets they were bringing into the fold, the possibility of acquiring two past producing mines as legendary as Snip and Eskay Creek. So that’s really what drew me in. But then what kept me here was really the team, a really young, keen team that I think is really the future of junior mining in Vancouver.
Jonathan Roth: Why don’t you unpack what you’ve discovered up at Eskay Creek?
Kelly Earle: So, at Eskay Creek, excitingly, we just announced a 4 million-ounce resource combined between indicated and inferred at 4.5 grams/ton open pit. To put that in context, most open pit mines operating today are around the one to two gram/ton mark. And ours is at 4.5 grams/ton and we see a pathway to bring it closer to six grams/ton. So, it’s a world class deposit from a once-legendary mine. Eskay Creek was the highest-grade gold producer in the world when it was in production. It’s very exciting to think that we’ve really just have found what’s left, what the remnants are. But even the remnants are extremely high grade by today’s standards.
Jonathan Roth: Barrick owned Eskay Creek and then they stopped mining at around 2007, 2008, somewhere around there?
Kelly Earle: Yes, 2008.
Jonathan Roth: So why did they stop, given the fact of what you folks have discovered?
Kelly Earle: We get this question a lot. It’s hard for people to understand: if it’s so great, if there’s 4 million ounces left there, why on earth did Barrick walk away? And it’s really just a function of the price of gold and how remote the mine was at the time.
So, when the mine was in operation, it was all diesel powered. So absolutely everything ran on diesel, which for the most part was flown in and flown out. There was road access, but it was still diesel powered. Secondly, the price of gold was significantly lower than it is today. So, the decision to shut the mine down was made in 2005. Price of gold was around $450, $500 an ounce. That meant the cutoff grade – to hit a 20 gram per ton head grade at the mill – they needed a 15 gram per ton cut-off grade, which is crazy by today’s standards.
So, anything below 15 grams per ton was just considered waste. So, if you look at it in the context of the time frame, it made sense that the mine shut down. Also, Barrick was just bringing Placer Dome on board, this was a big several hundred thousand ounce a year producer. The grades were dropping off at Eskay, the production annually was dropping off. It didn’t make sense to keep it open anymore because of how remote it was and the cost of producing it. So, in many ways we’re lucky because we’re left with the remnants that are now extremely high grade by today’s standards and the infrastructure has also improved dramatically since the mine was in production.
Jonathan Roth: The infrastructure obviously must be already there, and my understanding is that things are even easier to get in and out of there than they were say even a decade ago?
Kelly Earle: Within the last year, Highway 37 and the Northwest Transmission Line have been put in, which goes all the way up to Imperial Metals Red Chris Mine. Then within the last 10 years, there have been three hydroelectric facilities built between Snip and Eskay Creek. So, areas that were once all diesel operated for mines, we now have 4 cents a kilowatt hour power – so dramatically changes the opex.
We’ve talked to some engineers who said historically 50% of opex would have been diesel. Now with hydroelectric power, that would be more like 10 to 15%. So, it dramatically changes the cost to put it back into production. And at Eskay, the hydroelectric facility’s only seven kilometers away, down a paved road.
Jonathan Roth: This is Skeena’s CEO, Walter Coles Junior. The son of a very senior former US diplomat working in states that comprised the former Soviet Union, Coles is well versed in navigating the halls of power. Skeena’s projects are located in British Columbia, and Coles has made it a priority to maintain an excellent relationship with BC’s left leaning provincial government and local First Nations groups.
Walter Coles: For us, our experience with the NDP government has been phenomenal. From John Horgan as a premier to Michele Mungall, the mines minister; to her staff, Dave Nikolejsin, who’s a deputy mines minister. I’ll even shout out Peter Robb, who’s the assistant deputy mines minister. When we’ve had problems with delays in permitting, we go to Victoria and things are fixed right away.
Jonathan Roth: There’s been a general perception that the NDP government and British Columbia is not favorable to resource development projects. Obviously, you’ve seen the flip opposite of that?
Walter Coles: I think the facts can speak for themselves. BC has permitted more mines in Canada than any other province in the last three years. That speaks for itself. KSM last year got all their permits. The Red Mountain, IDM’s Red Mountain Mine got all of their permits. Pretium was permitted, I believe, in less than two years. I’m talking about the Brucejack Mine. Red Chris got all of, that’s Imperial Metals, was able to permit the Red Chris Mine. This is all on the Golden Triangle and all within the last three and a half years. In my view, there’s strong political support for mining in this province.
Jonathan Roth: So, what’s the game plan then moving forward?
Walter Coles: Our game plan is to aggressively advance Eskay Creek. The idea is we get the PEA done early in Q3 and we’ll immediately start, I hope, we’ll start pushing towards a feasibility study and we’ll probably start to permit Eskay Creek as well, to be able to put this mine back into production in the next couple years.
Jonathan Roth: So, you know obviously the resource market has been really tough for investors. It’s about as tough as it gets.
Walter Coles: Understatement.
Jonathan Roth: Right. So why, given the general market that’s out there, why should investors give you maybe a second or third look?
Walter Coles: It’s easy. In my mind, it comes down to Eskay and Snip. Snip is our other project, again, a past producing mine. There just aren’t deposits like this around the world. They’re very, very rare and our market cap right now today is about 40 million, 42 million Canadian. And we have 4 million ounces of very high grade, very attractive resource. It’s a combination of gold and silver, but I call it 4.5 million ounces of gold equivalent.
If you look at the valuations of other very well run companies, let’s say a Barkerville or let’s say an Osisko or let’s say an Ascot, as comparables to Skeena, all of those market caps are north of $175 million, and frankly we have more resource than any of those companies. And ours is open pit. The rest of them gotta go underground. So ours is easier mining. I would say adjusted for open pit versus underground, better grade, and we have more. And our market cap is like 15 to 20 percent of what these other companies are valued at. So, we are extremely undervalued right now. So if you’re an investor and you want to have exposure to precious metals, to gold, this is a way you can have leverage and the quality of the assets that we have right now, in my mind, would mean that your risk of losing money is probably a lot less than your risk of making a lot of money. That’s the kind of asymmetric investment opportunities all of us look for.
Jonathan Roth: So, you just mentioned a word there. You said undervalued. Why do you think Skeena’s been so undervalued for so long?
Walter Coles: Yeah, well, I would argue that our success at raising capital from some of the mining focused institutions, like mutual funds and hedge funds around the world, has come back to haunt us because there’s been a trend in the world of pulling capital out of actively managed investment funds and putting that capital into passively managed funds, like ETFs, index funds. So a lot of the mutual funds that we raise money from have faced redemptions over the last 18 months, and even though they told us they liked our project, their investors were pulling money out of their funds, so they were forced sellers of Skeena over the last year and a half. Unfortunately, in my mind, it’s like the worst in the 10 years that I’ve been involved with the sector, it’s the worst I’ve ever seen it. The consequence was we had forced sellers and there’s no bid, no buyers. So that’s taken Skeena down to the level it’s been in for the last six months. But I think we’re through all of that. I think those forced sellers are out and so I think the stock is now at an inflection point where there’s no more sellers. Now the question is: is there any stock available?
Jonathan Roth: What do you have going on now and what do you see happening over the next say six months to a year in terms of your work there?
Kelly Earle: So, we just put out the resource at Eskay that I mentioned, the 4 million ounces, and we’re working hard on metallurgy, because that is a question that we get a lot. Historically, there are a lot of deleterious elements, mercury, arsenic, that were associated. It’s a VMS deposit, volcanogenic massive sulfide deposit. You get extremely high grade, but then you also get some mercury and arsenic, so we’re working on the metallurgy now. We are very confident that it will be clean ore. We’re mining in mostly a different ore type than what was mined historically, but we need the metallurgy out and that report to show the market that it is going to be mineable. So that’s a key milestone that’s coming up for us within the next month.
Then after that, we’re going to be pushing forward on a preliminary economic assessment. So, we’re pretty excited about that. We run the numbers internally and they’re looking good. We’ve hired an engineering firm and we’ve brought an engineer on board to represent Skeena. So, we’re growing and we’re pushing towards that PEA and then while that’s all going on, we will be drilling.
I think people should give Skeena a look because of the amazing quality of Eskay Creek. I mentioned before about when I was part of Hod Maden I didn’t realize it at the time. I think Walter and I and the rest of our team are beginning to realize: this is an amazing deposit that we’re a part of. This is going to be one of the highest-grade open pit mines in North America, if not the world, when it goes back to production. It’s pretty rare that you sit on a brownfield site in a stable jurisdiction, with first nations and government support, 4 million ounces, 4.5 grams open pit. That’s a once-in-a-lifetime project to be a part of and I wholeheartedly believe that Eskay Creek will be back into production.
Walter Coles: We have something very special and it’s hard to find assets like this one. The Eskay Creek deposit is the best open pit deposit that any junior company in the entire world holds right now.
Courtesy: CEO.ca
Disclaimer
All statements in this report, other than statements of historical fact should be considered forward-looking statements. These statements relate to future events or future performance. Forward-looking statements are often, but not always identified by the use of words such as “seek”, “anticipate”, “plan”, “continue”, “estimate”, “expect”, “may”, “will”, “project”, “predict”, “potential”, “targeting”, “intend”, “could”, “might”, “should”, “believe” and similar expressions. Much of this report is comprised of statements of projection. These statements involve known and unknown risks, uncertainties and other factors that may cause actual results or events to differ materially from those anticipated in such forward-looking statements. Risks and uncertainties respecting mineral exploration companies are generally disclosed in the annual financial or other filing documents of those and similar companies as filed with the relevant securities commissions, and should be reviewed by any reader of this video.
Roth Multimedia executive producer Jonathan Roth is an online financial content producer. He is focused on researching and marketing resource and other public companies. Nothing in this video should be construed as a solicitation to buy or sell any securities mentioned anywhere in this video. This article is intended for informational and entertainment purposes only! Be advised Jonathan Roth is not a registered broker-dealer or financial advisor. Before investing in any securities, you should consult with your financial advisor and a registered broker-dealer. In many cases Jonathan Roth owns shares in the companies he features. For those reasons, please be aware that Jonathan Roth can be considered extremely biased in regards to the companies he writes about and features in his videos. Jonathan Roth does not own and never has owned any shares in Skeena Resources. He was paid for production of this video and another to be released at a later date.
Because Jonathan Roth has been paid by Skeena Resources, there is an inherent conflict of interest involved that may influence his perspective on Skeena Resources. This is why you should conduct extensive due diligence as well as seek the advice of your financial advisor and a registered broker-dealer before investing in any securities. Jonathan Roth may purchase shares of Skeena Resources for the purpose of selling them for his own profit and will buy or sell at any time without notice to anyone, including readers/viewers of this video.
Jonathan Roth shall not be liable for any damages, losses, or costs of any kind or type arising out of or in any way connected with the use of this video. You should independently investigate and fully understand all risks before investing. When investing in speculative stocks, it is possible to lose your entire investment.
Any decision to purchase or sell as a result of the opinions expressed in this report will be the full responsibility of the person authorizing such transaction, and should only be made after such person has consulted a registered financial advisor and conducted thorough due diligence. Information in this report has been obtained from sources considered to be reliable, but we do not guarantee that they are accurate or complete. Our views and opinions in this video are our own views and are based on information that we have received, which we assumed to be reliable. We do not guarantee that any of the companies mentioned in this video (specifically Skeena Resources) will perform as we expect, and any comparisons we have made to other companies may not be valid or come into effect.
Jonathan Roth does not undertake any obligation to publicly update or revise any statements made in this video & article.
Gold has failed to gain traction over the past couple months, normally a seasonally-strong time. That has really weighed on sentiment, leaving traders increasingly bearish. Gold investment demand has flagged dramatically with lofty stock markets spewing great euphoria. That’s given gold-futures speculators the run of the market, where they have sold aggressively including extreme shorting. But that’s actually very bullish.
Gold price action is driven by the collective trading of both investors and speculators. The former control vast amounts of capital, which dominates gold prices when it is migrating in or out. But investors’ interest in gold withers when stock markets are super-high. When stocks seemingly do nothing but rally, there’s no perceived need to prudently diversify stock-heavy portfolios with counter-moving gold. It falls out of favor.
Extreme stock-market euphoria is gold’s primary problem now, acting like kryptonite for gold investment. This week the flagship US S&P 500 broad-market stock index clawed back to a new all-time record high. That extended its monster rebound rally since late December’s near-bear lows to 24.8%! The farther the stock markets advance, the more gold is forgotten. Investors have relentlessly pulled capital back out of gold.
The best proxy for gold investment demand is the physical gold-bullion holdings of the world’s dominant gold exchange-traded fund, the American GLD SPDR Gold Shares. In early October soon after the S&P 500 peaked but before it started plunging in its severe 19.8% correction, GLD’s holdings slumped to a deep 2.6-year low of 730.2 metric tons. I explained these stock-market and GLD dynamics in depth last week.
Then the very day the stock markets first dropped hard, investors remembered gold. Over the next 3.8 months into late January, GLD’s holdings surged 12.8% to 823.9t on heavy capital inflows from American stock investors. That helped push gold 8.9% higher in that span. But as euphoria came roaring back as the S&P 500 rebounded sharply from its deep selloff, gold’s relative luster again faded in investors’ eyes.
Between late January and this week, they’ve dumped GLD shares much faster than gold itself was being sold. That has forced GLD’s holdings 9.2% lower in the last 2.8 months to 747.9t, helping push gold’s price down 2.7%. Over 4/5ths of gold’s stock-market-correction-driven investment surge has now been erased, leaving GLD’s holdings just 2.4% above their secular lows of early October before stocks plunged!
The gold-investment selling via GLD in recent months has been relentless, especially in February and now April. During February’s 19 trading days, 13 saw GLD draws averaging 0.4%. And as of the middle of this week, April’s 17 trading days so far have seen 12 GLD-draw days also averaging 0.4%. Gold has faced unyielding selling pressure from American stock investors as the S&P 500 levitated ever higher.
There’s an old proverb stating “when the cat’s away, the mice will play”. That concept perfectly applies to the gold market. When investors are away, the gold-futures speculators will play. Investors’ capital just dwarfs speculators’, so when gold investment demand is robust spec trading is drowned out and usually irrelevant. But when investors aren’t interested, the gold-price impact of gold-futures trading is magnified.
These traders already punch far above their weights, their capital being far more potent than investors’ on a dollar-for-dollar basis. Gold futures allow extreme leverage far beyond anything legal in the stock markets. Each gold-futures contract controls 100 troy ounces of gold, which is worth $127,500 at $1275. But gold-futures speculators are only required to keep $3,400 cash in their accounts for each gold-futures contract.
That gives them absurd maximum leverage up to 37.5x, compared to the decades-old 2.0x limit in stock markets! At 30x leverage, every dollar deployed in gold futures has literally 30x the price impact on gold as another dollar used to buy gold outright. Just $1 of gold-futures capital flows yield the same gold-price result as $30 of investment capital flows. Gold-futures trading’s impact on gold is wildly disproportionate.
Further amplifying gold-futures speculators’ outsized influence, the American gold-futures price is gold’s global reference one. So when heavy gold-futures selling blasts that headline price lower, the resulting negative psychology quickly infects the rest of the world gold markets. Gold-futures trading is effectively the tail that wags the gold-investment dog. This vexing problem shouldn’t be allowed to exist, but it does.
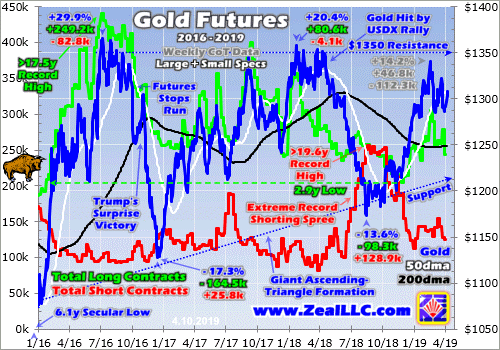
Over the past couple months as mounting stock-market euphoria seduced investment capital out of gold, speculators’ gold-futures selling has soared to extremes at times. That really exacerbated the counter-seasonal downside pressure on gold prices. This heavy selling is evident in the weekly Commitments of Traders reports from the CFTC, which detail speculators’ collective long and short positions in gold futures.
This chart superimposes several years of daily gold prices in blue over the weekly CoT data. Total spec long contracts are shown in greed, and total shorts in red. The falling longs and rising shorts since gold last peaked near $1341 in mid-February are a big reason for its recent weakness. But the lower specs push their longs and the higher they ramp their shorts, the more bullish gold’s near-term outlook grows.
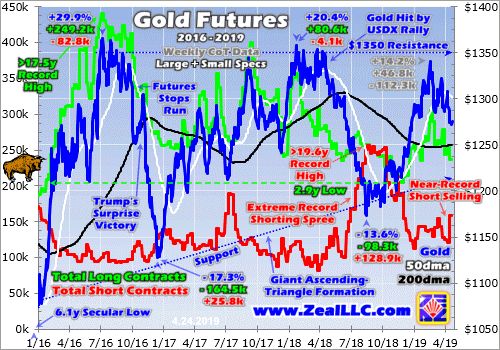
A couple weeks ago I dug deeper into gold futures’ impact on gold prices in recent years, so I’m going to focus on recent months here. On February 19th when gold surged to $1341, total spec longs and shorts were running 305.0k and 138.5k contracts. While those longs remained way below recent years’ peaks, they were still near the highest levels seen in the past year. I developed a simple metric to quantify that.
This chart shows the general rule on gold-futures trading driving gold price action. When speculators are buying by either adding new longs or covering existing shorts, gold rallies. When they are selling existing longs or adding new shorts, gold retreats. So the lower spec longs, and the higher spec shorts, the more bullish gold’s near-term outlook. The opposite is also true, higher longs and lower shorts are bearish for gold.
Gold’s biggest uplegs in recent years emerged from relatively-low spec longs and/or relatively-high spec shorts. Figuring out how low or high both sides of this trade happen to be can be done by looking at current levels compared to their trading ranges over the past year. When gold peaked at $1341 9 weeks ago, total spec longs were running 96% up into their 52-week trading range. That was certainly relatively high.
That left speculators little room to buy more gold-futures long contracts unless they expanded their total capital allocation back to bigger prior-year levels. If they didn’t, they had a lot more room to sell than to buy. That same CoT week, total spec shorts were running 32% up into their own past-year trading range. Thus the short-side guys had probable remaining room to cover 1/3rd of their shorts, which was relatively low.
If investors had been buying gold, if the mounting stock euphoria hadn’t been sucking capital out of gold, speculators’ gold-futures positioning wouldn’t have mattered much. But with investors missing in action, the gold-futures traders were ruling the roost. And they started selling heavily in the CoT week ending on Tuesday March 5th. Be aware that CoT weeks always run from Tuesday closes to Tuesday closes.
Gold began that CoT week looking great, trading at $1328. But speculators started selling gold futures, pushing gold down towards $1300. That is a hugely-important psychological level for gold, which seems to attract gold-futures stop losses like gravity. So as $1300 neared and failed, gold-futures selling ramped up massively. That CoT week ended with specs dumping 34.0k long contracts while adding 11.9k short ones!
A 20k+ contract change in either spec longs or shorts in a single CoT week is the threshold where huge begins. 20k contracts control the equivalent of 62.2 metric tons of gold, way too much for normal markets to absorb in a single week. That big bout of spec gold-futures long selling that kicked off the last couple months’ gold slump was exceptional. At that point 1053 CoT weeks had passed since early 1999, a long span.
That CoT week’s spec long selling ranked as the 20th largest ever witnessed, a rare event. And in terms of speculators’ total gold-futures selling including both longs and shorts, it was the 11th largest on record! It’s important to realize that gold-futures selling of that magnitude is unusual, unsustainable, and self-limiting. The lower spec longs and the higher spec shorts, the less gold futures these traders have left to sell.
That extreme selling blitz puking out the equivalent of 142.6t of gold in a single CoT week would probably have been the end of it without the growing stock-market euphoria. Gold usually carves a major seasonal low in mid-March before powering higher in its spring rally. But with the S&P 500 levitating and investors still selling gold on balance, sentiment stayed fairly bearish so gold-futures specs had the run of the market.
Still gold defied the surging stock markets to rally like usual, climbing back to $1322 by March 25th. The gold-futures speculators were responsible, adding 20.4k new long contracts while covering 15.4k short ones in the CoT week ending a day later. That was the equivalent of 111.3t of gold buying. But over the next CoT week, that reversed into heavy selling. That again surrounded gold plunging back under $1300.
For decades now I’ve intensely studied and closely watched the markets in real-time. I get up at 5am and follow the data and news feeds until 4pm or later. Usually when gold or the stock markets make some big intraday move, it’s explainable by news or data. Neither gold’s 1.7% plunge on March 1st, nor its later 1.4% drop on March 28th, had any apparent catalysts! But both days saw gold break back below $1300.
Running extreme leverage up to 37.5x, gold-futures speculators can’t afford to be wrong for long. A mere 2.7% gold price move against their positions would wipe out 100% of their capital risked at such leverage! So these guys have to maintain an ultra-short-term price-dominated focus, and they have to run tight stop losses or risk quick ruin. Long-side gold-futures traders have long clustered stops near that key $1300 level.
So when gold falls back through $1300 from above, mechanical stop-loss orders start triggering resulting in forced long selling. That quickly pushes gold even lower, tripping more stops to fuel cascading selling. By the time the dust settled in that CoT week ending on April 2nd with gold battered back to $1291, total spec gold-futures longs had plummeted 35.3k contracts! They weren’t short selling then, as shorts fell 2.1k.
That massive long dump was again exceptional, ranking as the 18th largest ever witnessed out of 1057 CoT weeks since early 1999 at that point. Speculators can’t maintain such crazy selling rates for long, as just 7 weeks at that pace would drive their longs to zero which will never happen. For the second time in 4 CoT weeks, extreme spec gold-futures long selling hammered gold from well above $1300 to back below.
But gold soon started recovering even while investors mesmerized by stock euphoria exited. Gold again climbed up over $1300, hitting $1308 on April 10th. This metal really wants to power higher even with investment capital fleeing to chase the lofty stock markets. Yet once again extreme gold-futures selling erupted in the latest CoT week reported before this essay was published, which ended last Tuesday April 16th.
For the third time in 7 weeks, extreme gold-futures selling flared as gold passed back down below $1300. Once again there were no significant data or news catalysts around the world, gold-futures selling just snowballed to a stunning degree. That CoT week total spec longs dropped another 17.5k contracts, close to that 20k+ huge threshold. But total spec shorts exploded an utterly-astounding 36.9k contracts higher!
That single-CoT-week shorting was so crazy it ranked as the 2nd highest ever witnessed out of the 1059 CoT weeks since early 1999! The only bigger shorting week was back in mid-November 2015, soon after the Fed telegraphed its first rate hike of the recent cycle. Yet that record shorting would soon prove very bullish for gold, birthing a major bull market. Gold surged 29.9% higher in 6.7 months in the first half of 2016.
Considered together in that latest reported CoT week ending April 16th, speculators’ total long and short selling rocketed to 54.4k contracts! That is the 5th highest on record, incredibly extreme. The 1st and 4th weighed in at 70.4k and 56.7k, and both occurred in December 2017. That record gold-futures selling also proved very bullish, as gold soon surged sharply to challenge a major bull-market breakout above $1350.
Big gold-futures selling is always bullish for gold, because those bearish bets will soon be unwound with proportional buying. This current episode won’t prove an exception, especially with near-record shorting. While making bullish long-side gold-futures trades is voluntary, short covering is mandatory. Shorting is effectively borrowing gold futures that traders don’t own, those contracts have to be repurchased and paid back.
Between gold’s latest interim high in mid-February to this extreme latest-reported CoT week, total spec longs collapsed 68.5k contracts or 22.5%. That’s a lot in a short span, leaving longs running just 32% up into their past-year trading range. That means specs easily have room to do over 2/3rds of their likely near-term long buying, and much more if higher gold prices excite traders enough to bet at previous years’ scales.
And over the last 8 reported CoT weeks, total spec shorts rose 19.5k contracts. That left them 37% up into their own past-year trading range. That’s not high, but it still leaves a lot more shorts that have to be covered with offsetting buying as gold reverses higher again. Total spec selling since February 19th ran 88.0k contracts, the equivalent of 273.9t of gold. That’s helped force gold 4.8% lower from $1341 to $1276.
The bright side of all this gold-futures selling is it is inherently self-limiting and self-correcting. The more these traders sell, the less they have left to sell. And the higher the odds they will start buying in a big way to mean revert their recent bearish bets back to normal. One of these days some catalyst will arise that will spark major spec gold-futures buying. Gold will surge sharply for weeks as buying normalizes bets.
The biggest casualty of recent months’ extreme near-record gold-futures selling was the gold miners’ stocks, which amplify moves in gold. The major gold miners of the leading GDX VanEck Vectors Gold Miners ETF tend to leverage gold’s action by 2x to 3x. That has weighed on gold-stock prices and psychology since mid-February. GDX slumped while gold-futures speculators battered the gold price lower.
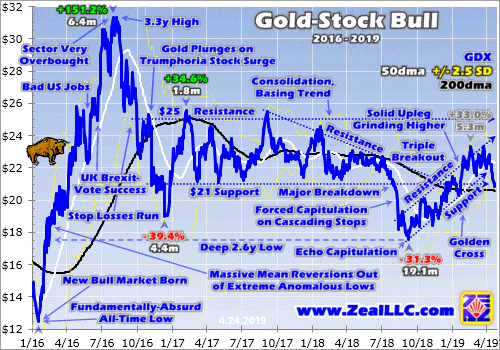
Despite that extreme gold-futures selling nearing records, and incredible stock-market euphoria stunting gold investment demand, the gold stocks have weathered this storm really well. GDX did knife back under its upleg’s support, nearing its 200-day moving average which is much-stronger support. But the major gold stocks have proven impressively resilient overall, largely consolidating high as gold swooned.
Again gold was pounded 4.8% lower over those 8 CoT weeks starting near $1341 and ending way down near $1276. At 2x to 3x normal leverage, the gold stocks would’ve plunged almost 10% to 15%. Yet over that exact span GDX merely slid 5.7%, just 1.2x gold’s loss! And GDX’s leverage was healthy before that as gold rallied, running 2.8x at best by mid-February. The gold stocks have really been holding their own.
Gold stocks are set to surge again once gold reverses decisively higher, which is increasingly likely any day now. These lofty euphoric stock markets are going to inevitably encounter some catalyst sparking significant selling, which will snowball after such a massive and long rally steeped in such epic complacency. Gold investment demand will turn on a dime as stock markets roll over, just like back in early October.
And when gold starts moving higher, the hyper-leveraged gold-futures speculators will rush to buy and pile on to its upside momentum. And after slashing their longs and ramping their shorts over the past couple months, they have major buying to do to reestablish bullish positioning relative to gold to ride its next rally. As leveraged gold-futures capital inflows force gold higher, gold stocks will really amplify its gains.
The last time major gold investment buying lined up with major gold-futures buying by the speculators was in roughly the first half of 2016. That catapulted gold 29.9% higher in 6.7 months kicking off this bull. The major gold stocks as measured by GDX soared 151.2% in essentially that same span, amplifying the big gold gains by 5.1x. Gold stocks are the place to be when traders are pouring capital back into gold!
One of my core missions at Zeal is relentlessly studying the gold-stock world to uncover the stocks with superior fundamentals and upside potential. The trading books in both our popular weekly and monthly newsletters are currently full of these better gold and silver miners. We’ve added plenty of new trades since mid-February as older ones were stopped out, which are ready to surge much higher as gold recovers.
To multiply your capital in the markets, you have to stay informed. Our newsletters are a great way, easy to read and affordable. They draw on my vast experience, knowledge, wisdom, and ongoing research to explain what’s going on in the markets, why, and how to trade them with specific stocks. As of Q1 we’ve recommended and realized 1089 newsletter stock trades since 2001, averaging annualized realized gains of +15.8%! That’s nearly double the long-term stock-market average. Subscribe today for just $12 per issue!
The bottom line is gold has been bludgeoned by extreme gold-futures selling in the past couple months, culminating in near-record shorting. That’s what forced gold lower during its usual spring-rally timeframe. With investors seduced by the lofty euphoric stock markets, gold-futures speculators have been running roughshod over gold prices. But their heavy selling is self-limiting, and will reverse into proportional buying.
Speculators’ big bearish shift in gold-futures positioning will have to be normalized, resulting in big buying that will push gold higher. That upside momentum could really grow, especially when stock markets roll over and again rekindle gold investment demand. The biggest gains as gold mean reverts back higher will come in the stocks of its miners. They’ve proven resilient as gold swooned, and are poised to surge again.
Adam Hamilton, CPA
April 30, 2019
Copyright 2000 – 2019 Zeal LLC (www.ZealLLC.com)
- The weak physical demand season continues to cause gold to drift with a clear but modest downside bias.
- Despite the swoon, most top bank analysts are extremely positive in their outlook for gold in the second half of the year.
- Please click here now. Standard Chartered analyst Suki Cooper notes a high correlation between the Fed’s actions now and in 2006. Gold does respond to a more dovish Fed, but not immediately.
- Suki also predicts U.S. GDP growth will be under 2.5% in 2019, fade to under 2% in 2020, and a downturn will begin in 2021.
- She expects the Fed to remain in pause mode and then announce a rate cut as growth and corporate profits continue to fade.
- The IMF predicts a similar fade in global growth generally, with the exception of China. India is also likely to see strong growth and that will likely be augmented with government handouts related to the election there.
- Essentially, the West will see fading growth. The Fed’s actions will be negative for the dollar and positive for the fear trade for gold. The East will see solid growth and that will be supportive for the love trade for gold.
- The big picture for gold in both the East and the West is positive.
- Please click here now. Double-click to enlarge this GDX chart.
- While the bank analysts are happy to wait out the weak season, I focus on swing trading with my guswinger.com trade alerts service. While many gold investors are a bit gloomy right now, we’ve been “riding the gravy train” with DUST-NYSE throughout most of the latest GDX downturn.
- Recent COT reports show the commercials doing aggressive buying of both gold and silver COMEX contracts. That’s positive but it doesn’t reduce account drawdowns for gold stock investors.
- Ultimately, winning trades are how to reduce drawdowns and commercial traders on the COMEX are currently covering enormous short positions at huge profits.
- Diversification plays a key role in successful investing. A modest allocation of capital to a solid swing trade program should be part of that diversification.
- To view the daily gold chart, please click here now. Double-click to enlarge.
- A potential bull wedge pattern is in play, but until there’s a bigger rally it’s not an actual textbook pattern.
- On a positive note, the blue lag line of my 14,7,7 Stochastics oscillator is almost oversold and “rallies with teeth” tend to occur when that happens.
- Chinese citizens are becoming more positive about their economy and gold demand is perking up. The Akha Teej festival in India is scheduled for May 7 and demand is picking up there too.
- The commercial trader buying on the COMEX could be related to this Chindian love trade but the intensity of the buying could also suggest that commercial traders are also anticipating the U.S. stock market could have a particularly nasty “Sell in May and go away”
- The S&P 500 index is near its highs and oil prices keep climbing. For now, oil is really in a sweet spot where it is high enough to help S&P500 earnings but not too high to hurt consumers.
- That could change quite dramatically, depending on how Iran responds to the U.S. government’s “My way or the highway” announcement to end sanctions waivers on Iranian oil exports.
- Good news for oil company earnings could quickly morph into “stagflationary concern” and this could be on the minds of the COMEX commercial traders who are buying gold and silver extremely aggressively now.
- American “Gmen” enforce these sanctions by threatening to cut nations off from the dollar-oriented US financial system unless they follow their orders. In the big picture, U.S. government “my way or the highwayism” related to Iran is simply going to accelerate the global wave of de-dollarization, which is good news for gold investors.
- Please click here now. Double-click to enlarge this GDX chart. The 50% retracement zone in the $20.50 area and the 60% retracement zone in the $20 area are where gold stock investors should look for a significant rally to begin.
- The bottom line is that physical market demand softness is likely to continue into the summer… but a big relief rally for the entire precious metals sector is imminent!
Special Offer For Website Readers: Please send me an Email to freereports4@gracelandupdates.com and I’ll send you my free “Golden Exceptions To The Rule!” report. I highlight key miners that are blasting higher even with the gold/silver price swoon and I include pinpoint buy and sell trigger points for each stock!
Thanks!!
Cheers
Stewart Thomson
Graceland Updates
Written between 4am-7am. 5-6 issues per week. Emailed at approx 9am daily.
Email:
Graceland Updates daily between 4am-7am. They are sent out around 8am-9am. The newsletter is attractively priced and the format is a unique numbered point form. Giving clarity of each point and saving valuable reading time.
Risks, Disclaimers, Legal
Stewart Thomson is no longer an investment advisor. The information provided by Stewart and Graceland Updates is for general information purposes only. Before taking any action on any investment, it is imperative that you consult with multiple properly licensed, experienced and qualified investment advisors and get numerous opinions before taking any action. Your minimum risk on any investment in the world is: 100% loss of all your money. You may be taking or preparing to take leveraged positions in investments and not know it, exposing yourself to unlimited risks. This is highly concerning if you are an investor in any derivatives products. There is an approx $700 trillion OTC Derivatives Iceberg with a tiny portion written off officially. The bottom line:
Are You Prepared?
The downside potential in precious metals discussed last week is playing out as Gold and gold stocks have broken down technically.
The global economy appears to be firming and that is evidenced by a sustained rebound in global equity markets.
As a result, the potential for a rate cut which pushed precious metals higher is now unwinding. That has caused the breakdown in precious metals and there is more unwinding to go.
We have trumpeted the need (in precious metals) for a rate cut as a fundamental catalyst for the next bull market. But there is another scenario that plays well for Gold.
Let’s step back for a second and remember that Gold is driven by declining real interest rates and secondarily, a steepening yield curve. Either essentially entails Fed rate cuts or inflation rising faster than short-term rates which in other words equates to rising inflation expectations.
In the chart below we plot Gold along with a number of fundamental indicators for Gold. These include the real 5-year TIPS yield (as calculated from the TIPS market), the real 5-year yield, the real fed funds rate and the yield curve (upside down).
If the Federal Reserve is not cutting rates in the next 12 months then the best case scenario for Gold would be a bump in inflation that leads to a material decline in real interest rates and a steepening of the yield curve.
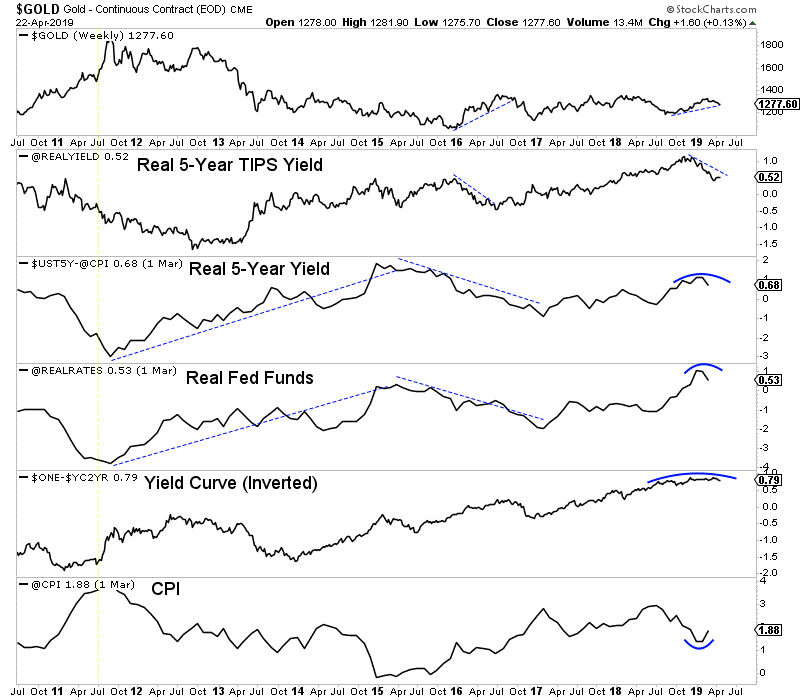
The CPI is rebounding and if it were to reach 3% while the Fed stands pat, that would equate to a real Fed Funds rate of -1.6%. That would imply a decline of -2.1% from here.
Gold would definitely rally in that scenario but for now, the market is focused on the declining expectations for a rate cut in the next 12 months. Until the unwinding of that trade is complete, Gold is likely to trade lower.
However, the point is that we should not be bearish for long if inflation indicators and inflation expectations increase in a sustained fashion. That equates to falling real interest rates which is bullish for Gold.
The CPI may ultimately need to exceed 3% or even 4% to spring a huge breakout in Gold, but a return to 3% with the Fed remaining paused could push Gold back to the wall of resistance.
The gold stocks are extremely oversold on a short-term basis and a rally should begin within the next day or two. That being said, the path of least resistance is lower until the market shifts its focus from a rate cut to rising inflation. That will take some time.
The months ahead could be an especially opportune time to position yourself in this sector. We will be looking for anything we missed in recent months that gives us a second chance opportunity. To learn what stocks we own and intend to buy that have 3x to 5x potential, consider learning more about our premium service.
By Jordan Roy-Byrne CMT, MFTA
April 25, 2019
The great euphoria emanating from these near-record-high stock markets is breathtaking. Traders are again convinced stocks do nothing but rally indefinitely. That everything-is-awesome mindset has stunted gold’s latest upleg, since there’s no perceived need for prudently diversifying stock-heavy portfolios. But that psychology can change fast, as we saw a half-year ago. Gold investment roars back as stocks roll over.
The word “euphoria” is widely misunderstood, often confused with “mania.” The latter is when stocks rocket vertically in blowoff tops, and is defined as “an excessively intense enthusiasm, interest, or desire”. The US stock markets certainly aren’t in a mania. At its latest high last Friday, the flagship U.S. S&P 500 broad-market stock index (SPX) had only edged up 1.2% over the past 14.5 months. That’s not parabolic.
The closest thing to a mania seen in recent years was the SPX’s 18.4% surge over just 5.3 months that led into its initial January 2018 peak. Traders were ecstatic about Republicans’ coming major corporate tax cuts, and aggressively piled into stocks. While euphoria accompanies manias, it is entirely different. It is simply “a strong feeling of happiness, confidence, or well-being”. That psychology is universal today.
Traders have fully persuaded themselves that these stock markets have virtually no material downside risks. Like all sentiment, that’s the direct result of recent price action. These beliefs were last seen in late September and early October. The SPX had just hit a dazzling all-time record high, extending its monster bull market to 333.2% gains over 9.5 years. That was the second-biggest and first-longest in U.S. history!
Gold was deeply out of favor near that last SPX topping too. As a rare counter-moving asset that tends to rally when stock markets weaken, gold investment demand wanes when stock euphoria grows extreme. The whole discipline of portfolio diversification is based on acknowledging that stock markets rise and fall. Since investors can’t know when the next major stock-market selloff will erupt, they keep some non-stock holdings.
But euphoria blinds traders to long centuries of financial wisdom. They tend to extrapolate present conditions out into infinity, assuming they will last indefinitely. But betting any trend will run forever is just plain foolish, as markets are forever cyclical. “Complacency” always accompanies euphoria, “a feeling of contentment or self-satisfaction, especially when coupled with an unawareness of danger or trouble”.
Soon after traders overwhelmingly believe major selloffs are extinct, the next one pummels them. The endless stock-market cycles reassert themselves with a vengeance, punishing the scoffers. The severe correction after late-September’s peak is a textbook example. Over the next 3.1 months into Christmas Eve, the SPX plunged 19.8%! That was right on the verge of confirming a new bear at its -20% threshold.
Traders were confronted with the painful truth that stock markets don’t rally forever, that major selloffs are inevitable. So gold investment demand surged as investors rushed to start diversifying their bleeding stock-dominated portfolios. Major stock-market plunges are always followed by big and sharp rebound rallies. Just 5 weeks after those deep near-bear lows, the SPX had blasted 15.0% higher by the end of January.
That’s when euphoria and complacency started to return. These perilous herd emotions strengthened with every daily SPX rally over the past several months or so. The higher the stock markets bounced, the more selloff fears faded. That left portfolio diversification and gold investment increasingly out of favor again. The result is today’s extreme euphoria resembles late September’s, traders don’t have a care in the world.
While euphoria and complacency are ethereal and unmeasurable, they can be inferred. The classic VIX fear gauge is the most-popular way. It quantifies the implied volatility options traders expect in the SPX over the next month, as expressed through their collective trades. While a high VIX reveals fear, a low one shows the direct opposite which is complacency. Last Friday the VIX slumped under 12.0 on close.
The SPX’s massive rebound rally had extended to 23.7% over 3.6 months, recovering over 19/20ths of the preceding severe-correction losses. The SPX had soared back to within just 0.8% of its record peak of 6.7 months earlier! The stocks-to-the-moon zeitgeist had returned in an extreme way. The VIX hadn’t been lower since early October, when the SPX still lingered merely 0.2% under its unprecedented crest.
So per the leading approximation, traders’ current euphoria and fear have reverted right back to their very same high and low levels just before the last major SPX selloff! That’s why gold has slumped in recent weeks. Investors forget about it when they come to believe stock markets’ downside risks have vanished. When they buy into that peaking delusion that stocks can rally indefinitely, there’s no perceived need for gold.
This psychology creates an inverse relationship between stock-market levels and gold. It becomes most-pronounced when stock markets are near record highs generating great euphoria. This chart shows how the SPX and gold have traded over the past several years or so. Ever since that mania-like SPX surge into late January 2018 on corporate-tax-cut hopes, gold has generally meandered in opposition to stock markets.
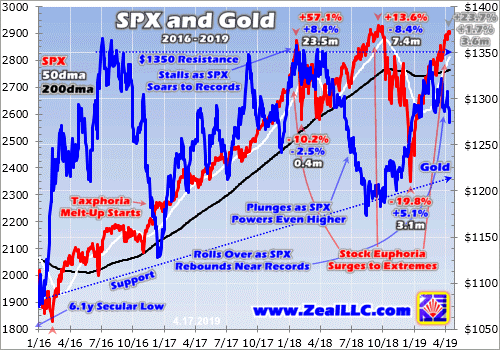
The greater stock-market euphoria, for the most part the weaker gold investment demand and thus gold prices. And of course euphoria is a direct function of how high the stock markets are. The SPX has surged to record and near-record levels 3 times over the past 15 months or so. It peaked at 2872.9 in late January 2018, 2930.8 in late September 2018, and has shot as high as 2907.4 so far in mid-April 2019.
These two confirmed major toppings along with today’s likely third averaged 2903.7, so call it 2900. The SPX is now trading just slightly above January 2018 levels, despite last year being one of the greatest in history for corporate-profits growth. The underlying earnings of the 500 elite SPX companies soared well over 20% in 2018! The SPX should’ve surged proportionally on such strong underlying fundamentals.
But it didn’t, mostly grinding sideways to lower. The U.S. stock markets were already wildly overvalued, spending most of last year trading literally in bubble territory. That’s 28x+ in trailing-twelve-month price-to-earnings-ratio terms, twice historical fair value at 14x. Stocks were already far too expensive to bid to major new highs, a dangerous problem which persists in their latest quarterly results. And 2018 was one-off.
Its four quarters were the only ones comparing pre-tax-cut and post-tax-cut results. That unprecedented discontinuity is the only reason earnings growth was so enormous last year. Profits are expected to stall out this year at best, and likely shrink. All quarterly comparisons going forward already include those big corporate tax cuts. So if the SPX couldn’t materially rally even in 2018, it’s in a world of trouble this year.
In December 2017 just before the corporate tax cuts kicked in, the 500 SPX stocks traded at a simple-average TTM P/E ratio of 30.7x. At the end of March 2019, that had merely retreated modestly to 26.3x which is still just under perilous bubble territory. Without strong double-digit earnings growth, such rich stock valuation levels won’t be sustainable for long. That’s great news for gold’s investment demand and prices.
The first time the SPX topped in January 2018, gold’s powerful upleg stalled just shy of breaking out to new bull-market highs. Gold held those strong levels until the SPX started powering higher again, which quickly rekindled euphoria dousing portfolio diversification. Gold suffered a major correction as the SPX challenged and exceeded new records into September 2018. Gold languished near lows as the SPX peaked.
Gold investment demand didn’t flare again to force gold higher until the SPX decisively rolled over from those all-time record highs. Once the stock markets started falling long enough and far enough to scare traders into remembering stocks can fall too, gold investment demand surged pushing this metal’s prices much higher. Gold was nearing another breakout before stock-market euphoria grew extreme again.
That’s why gold’s latest upleg stalled in recent weeks, why its price has slumped after nearing another major bull-market breakout. Gold has actually shown remarkable resiliency considering stock euphoria soaring right back up to early-October extremes. Last Friday when the VIX fell under 12.0 on close, gold was trading near $1291. That was way better than early October’s $1198 the last time the VIX traded that low.
Stock-market psychology’s primary impact on gold is sentimental. The higher stocks and the greater the herd belief they will keep rallying, the more gold interest and investment demand fade. But there’s also a way to measure capital flows into and out of gold from American stock investors. That is through the gold-bullion holdings of the world’s leading and dominant gold exchange-traded fund, the GLD SPDR Gold Shares.
GLD is a behemoth, holding 752.9 metric tons of physical gold bullion in trust for its shareholders this week. According to the World Gold Council, GLD is the world’s biggest gold ETF by far. At the end of Q4’18 its gold holdings were 2.8x larger than its next-biggest competitor’s. GLD commanded nearly 3/7ths of the total gold bullion held by the world’s top-10-largest physical-gold-backed ETFs, a vast amount!
GLD’s mission is to track the gold price, to give stock traders easy access to gold exposure. This is only possible if GLD can vent excess supply and demand for its shares directly into the global gold market, as the supply and demand for GLD shares is independent of gold’s own. GLD prices can’t mirror gold prices unless this ETF is able to buy and sell physical gold bullion to equalize supply and demand, which it does daily.
It also reports its total gold holdings daily, allowing traders to see whether American stock-market capital is flowing into or out of gold. When GLD’s holdings are rising, investors are buying gold. When they are falling, investors are selling gold. The capital flows into and out of GLD are heavily influenced by stock-market fortunes, stunted when euphoria grows extreme. Gold investment has suffered with the SPX so high.
Understanding how these capital flows work is important. When traders buy GLD shares faster than gold itself is being bought, GLD’s price threatens to decouple from gold to the upside. GLD’s managers avert this by shunting that excess GLD-share demand directly into gold itself. They issue enough new GLD shares to offset that differential demand, and use the proceeds to buy more physical gold bullion to hold in trust.
Conversely when GLD shares are being sold faster than gold, GLD’s price will soon break away from gold on the downside. GLD’s managers stave that off by buying back its shares to sop up that excess supply. The capital necessary to finance those repurchases is obtained by selling some of GLD’s physical-gold-bullion holdings. So rising and falling GLD holdings show stock-market capital migrating into and out of gold.
This chart superimposes GLD’s daily gold holdings in metric tons over the closing gold price. They are well-correlated with gold, showing American stock traders’ GLD trading heavily influences how gold is faring. Each calendar quarter’s gold-price percentage change, and both the percentage and absolute changes in GLD’s holdings, are noted. Over the past year in extreme SPX euphoria, GLD has driven gold.
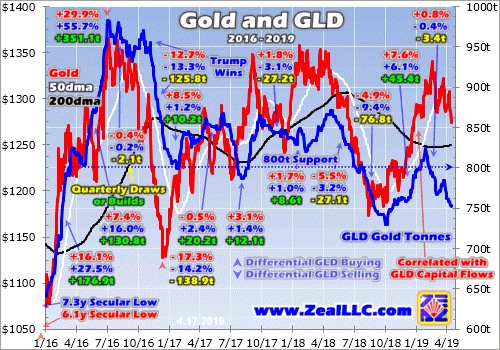
Incredibly GLD’s and thus American stock traders’ huge impact on the gold price is often not understood. Overlooking it is a grave error, greatly hobbling chances of multiplying wealth in gold. To show how dominant GLD is, consider some of the larger quarterly gold moves of this young bull born from deep 6.1-year secular lows in mid-December 2015. GLD’s holdings languished near 7.3-year lows at that same time.
In Q1’16 gold surged 16.1% after the first SPX corrections in 3.6 years made traders remember gold’s crucial role in portfolio diversification. They flooded into GLD shares at dizzying rates, catapulting its holdings 27.5% or 176.9t higher that quarter! Per the latest comprehensive fundamental data from the World Gold Council, GLD’s build accounted for 84% of the year-over-year growth in total global gold demand!
In Q2’16 that massive gold upleg continued, pushing gold another 7.4% higher. GLD’s holdings surged another 16.0% or 130.8t higher on heavy differential buying by American traders. That GLD build alone ran 106% of gold’s total YoY worldwide demand growth! Had U.S. stock-market capital not been flowing into gold via GLD, this gold bull never would’ve existed. Q4’16’s gold plunge drove home that critical point.
After Trump won the presidency that quarter, stock markets surged on hopes for big tax cuts soon with Republicans controlling the U.S. government. Euphoria soared with the SPX, leading investors to jettison gold and chase stocks. Gold plunged 12.7% that quarter, driven by a huge 13.3% or 125.8t draw in GLD’s holdings. That selling was a whopping 112% of the total YoY decline in global gold demand that quarter!
While American stock traders certainly aren’t the only gold investors, they command vast capital that has really moved gold in recent years. Gold’s price behavior in each quarter of this bull has generally been quite proportional with capital flows into and out of GLD. That’s certainly proven true in this past year as well, when SPX euphoria ran rampant other than deep in Q4’18’s severe near-bear correction in the SPX.
After that initial SPX peak in January 2018 and the subsequent sharp-yet-shallow-and-short correction, gold investment demand grew as euphoria wavered. Between mid-January to late April that year, GLD enjoyed a 5.1% holdings build. That wasn’t enough to push gold much higher, it only climbed 0.4%. Differential GLD-share trading isn’t gold’s only driver, gold-futures trading also plays a major role for different reasons.
But as the SPX powered higher out of that initial post-topping selloff, so did investors’ stock euphoria. So they again started to pull capital out of GLD faster than gold was falling, forcing a major holdings draw. Between late April to early October soon after the SPX’s second topping and new all-time record highs, GLD’s holdings plunged 16.2%. That gold-investment exodus pushed gold prices 9.0% lower in that span.
The relentless slump in GLD’s holdings reversed sharply on a very telling day. American stock traders finally started aggressively buying GLD again on October 10th, forcing a major 1.2% daily holdings build. What happened? That was the first day the SPX sold off hard after its recent record high, plunging 3.3% to shatter complacency. That budding sentiment shift was evident in the VIX, which soared 39.7% to 22.6.
The more that serious Q4’18 SPX selloff intensified, the greater gold investment demand grew. This was most evident in December, when the stock markets plunged a brutal 9.2% alone! That pain really helped investors remember the wisdom of having gold allocations in their stock-heavy portfolios. Gold surged 4.9% that month on a 3.4% GLD-holdings build. Gold investment was strong with stock euphoria gone.
Investors’ interest in gold continued well after the SPX started rebounding, as GLD’s holdings peaked in late January 2019 about 5 weeks after the SPX had bottomed. But with the SPX already soaring 15.0% off its lows, euphoria was mushrooming rapidly. Between early October to late January, GLD’s holdings surged 12.8% driving a parallel 9.7% gold rally with stock euphoria not stunting gold investment demand.
Though gold’s latest interim high of $1341 came a couple weeks later in mid-February, American stock traders’ capital outflows from gold were well underway. As the SPX powered ever higher that month, GLD suffered draws on fully 13 of its 19 trading days! That differential GLD-share selling on resurgent stock euphoria continued to this week. Since late January, GLD’s holdings have shrunk another 8.7%.
Though gold has been fairly resilient considering the lofty stock-market levels, it still slid 3.3% in that span. Gold’s upleg was stunted by stock markets’ powerful rebound rally. It rekindled the same levels of extreme euphoria and complacency seen near the SPX’s late-September record peak. With everyone once again convinced stocks can rally indefinitely with no material selloffs, gold investment demand withered.
While wearying for long-suffering contrarian investors, this is actually quite bullish for gold. Back in early October GLD’s holdings slumped to 730.2t in extreme stock-bull-peaking euphoria. Gold fell as low as $1188 as GLD’s holdings bottomed before the SPX started dropping again. Forced way back down to 752.3t this week, GLD’s holdings are only 3.0% above those deep early-October lows. Yet gold was way higher.
At $1276, gold was fully 7.4% above its own early-October low! This is a much-higher base from which to launch its next surge higher, with gold-investment buying potential via GLD shares almost fully reset! When these dangerously-overvalued stock markets inevitably roll over again, American stock traders will again remember prudently diversifying with gold. Their big capital inflows will again drive gold much higher.
That has real potential to fuel a major bull-market breakout for gold above its $1365 bull-to-date peak seen way back in July 2016. This is even more likely because gold-futures speculators aren’t very long as I discussed in last week’s essay. Just like American stock traders, they have lots of room to buy gold aggressively as it resumes marching higher. Gold investment demand only grows as gold prices climb.
Realize gold’s big problem right now is universal stock-market euphoria at extreme stock-bull-peaking levels. But that won’t last, it never does. Once the SPX inescapably starts sliding again in its next material selloff, gold demand will surge back. These lofty overvalued and overbought stock markets near record highs look exhausted. They are likely to turn back south any day, bleeding away euphoria and rekindling gold.
The biggest beneficiaries of gold uplegs are the gold miners’ stocks, which tend to leverage gold’s gains by 2x to 3x. Back in essentially the first half of 2016 when gold surged 29.9% higher in response to back-to-back SPX corrections, the leading GDX and GDXJ gold-stock ETFs soared 151.2% and 202.5% higher in roughly that same span! When gold starts powering higher again, the coming gold-stock gains will be big.
One of my core missions at Zeal is relentlessly studying the gold-stock world to uncover the stocks with superior fundamentals and upside potential. The trading books in both our popular weekly and monthly newsletters are currently full of these better gold and silver miners. Mostly added in recent months as gold stocks recovered from deep lows, our unrealized gains are still running as high as 59% this week!
To multiply your capital in the markets, you have to stay informed. Our newsletters are a great way, easy to read and affordable. They draw on my vast experience, knowledge, wisdom, and ongoing research to explain what’s going on in the markets, why, and how to trade them with specific stocks. As of Q1 we’ve recommended and realized 1089 newsletter stock trades since 2001, averaging annualized realized gains of +15.8%! That’s nearly double the long-term stock-market average. Subscribe today for just $12 per issue!
The bottom line is stock-market euphoria has stunted gold’s upleg. With U.S. stock markets once again back up challenging all-time-record highs, traders have forgotten the hard lessons from late September’s peak. They’ve deluded themselves into believing stocks can rally indefinitely, that near-bubble valuations don’t matter. Thus gold investment demand has withered, which is normal when stock markets are topping.
But once these lofty stock markets inevitably roll over decisively again, gold demand will come roaring back just like in Q4. Investors will remember the wisdom of prudently diversifying their stock-dominated portfolios with counter-moving gold, and start shifting capital back in. That will push gold prices much higher, with real potential for a major bull-market breakout. The gold stocks will amplify those gains like usual.
Adam Hamilton, CPA
April 24, 2019
Copyright 2000 – 2019 Zeal LLC (www.ZealLLC.com)
- Global stock and bond markets continue to be driven by the macros of a possible trade deal, accommodative central banks, weaker earnings, continued stock buybacks, and rising government debt.
- Gold is driven by these same macros, but it has the additional price driver of seasonal Chindian physical market demand.
- It’s currently the soft season for physical demand, but the rest of the price drivers are quite positive. Most big bank analysts have gold price targets of about $1400 for 2019.
- Unfortunately, they don’t see gold reaching their target prices until seasonal physical demand strengthens later in the year.
- Please click here now. Double-click to enlarge this key USD vs yen chart. During the September-December period in 2018, global stock markets tumbled as the Fed put pressure on the stock market with higher rates and QT on “autopilot”.
- Risk-on markets (stocks and the dollar) tumbled, and risk-off markets (yen and gold) soared. Then a dramatic about-face by the Fed in late December sent the dollar and stocks soaring.
- Note that gold continued to rise until mid-February even though stocks and the dollar rallied. That’s because of strong Chinese New Year physical market demand.
- The bottom line: When push comes to shove, it is the physical market that ultimately determines the actions the COMEX commercial traders take and that determines the price trend.
- In 2019, from February to the current time frame, risk-on markets have continued to strengthen, physical market demand continues its seasonal softness, and so gold meanders sideways with a slight downwards bias.
- Please click here now. Double-click to enlarge this chart of DIA-NYSE, a Dow proxy ETF. From a technical perspective, the U.S. stock market has meandered sideways since the U.S. government launched a wave of tariff taxes.
- Then it began crashing when the Fed became more aggressive about rate hikes and QT in the late stage of the current business cycle.
- The market can probably rally to around where it would have been without the “tariff tax tantrum”, but most mainstream analysts don’t see much more than 2% GDP growth over the long term for the U.S. economy.
- It could be said that in America there are a few thousand modestly-socialist politicians and more than 300 million capitalist citizens. Likewise, it could be said in China and India there are a few thousand fully-socialist politicians and 3 billion capitalist citizens.
- Regardless of how they vote, citizens in all three countries generally work hard to make ends meet and to build quality products… while being controlled by debt-worshipping politicians.
- Chindian citizens are in the early stages of their latest empire cycle, and U.S. citizens are in the late stages of their first empire cycle. A gold-orientation of the gargantuan Chindian population essentially guarantees that gold will quickly become a mainstream asset for global investment.
- That’s because there is only about 1% annual growth in mine supply while Chindian citizen wealth is growing at about 6%-8% each year. Gold demand growth mirrors citizen wealth growth.
- In America, the Fed’s accommodative stance can only buy the government limited time. The rate of annual U.S. government debt growth is very similar to Chindian citizen wealth growth.
- On that note, please click here now. Double-click to enlarge. I’m predicting that the gold price drivers of the U.S. government debt behemoth and the Chindian wealth trade are set to collide… in this weekly chart inverse H&S neckline zone at about $1450.
- That should push gold towards the $2000 area neckline zone of an even bigger inverse H&S pattern that targets the $3000 price area.
- Please click here now. Double-click to enlarge this short-term GDX chart. I’ve highlighted my guswinger.com buy and sell signals on the chart. I buy NUGT when there’s a GDX buy signal and buy DUST when there is a GDX sell signal.
- This proprietary system is mechanical and investors are almost always in a trade. The current daily chart price action in GDX is boring at best and can be demoralizing, but for swing traders, almost every day is exciting! The bottom line:
- During the strong season, core positions will make the most money for investors in the gold market. During the weak season (now), a solid short-term trading plan reduces negative emotion, limits drawdowns, and puts money in the bank.
- Please click here now. Double-click to enlarge this daily gold chart. Some investors may be concerned about the fourth touching of the $1288 June futures and $1280 cash market floor, but my question to them is:
- Is this a floor, or is it a sponge? The gold market now is vastly different (both fundamentally and technically) than it was when the price touched the $1523 area for the fourth time in 2013. Investors should think about modest price softness on a $1280 area sponge rather than possible sharp weakness at a $1280 floor. The $1450-$1400 price zone will become a beautiful floor as the gargantuan Chindian wealth trade and U.S. government debt behemoth of doom collide!
Stewart Thomson
Graceland Updates
Email:
Stewart Thomson is a retired Merrill Lynch broker. Stewart writes the Graceland Updates daily between 4am-7am. They are sent out around 8am-9am. The newsletter is attractively priced and the format is a unique numbered point form. Giving clarity of each point and saving valuable reading time.
Risks, Disclaimers, Legal
Stewart Thomson is no longer an investment advisor. The information provided by Stewart and Graceland Updates is for general information purposes only. Before taking any action on any investment, it is imperative that you consult with multiple properly licensed, experienced and qualified investment advisors and get numerous opinions before taking any action. Your minimum risk on any investment in the world is: 100% loss of all your money. You may be taking or preparing to take leveraged positions in investments and not know it, exposing yourself to unlimited risks. This is highly concerning if you are an investor in any derivatives products. There is an approx $700 trillion OTC Derivatives Iceberg with a tiny portion written off officially. The bottom line:
Are You Prepared?
The big picture fundamentals for precious metals have been trending more bullish in recent months as expectations for the Federal Reserve went from a few rate hikes in 2019 to an expectation of a rate cut within the next 12 months. That is aligned with the peak in the 2-year yield and growing concerns over slowing growth globally.
However, that doesn’t preclude a temporary improvement in the economy and markets. China is stimulating again. Global equities have recovered and the S&P 500 is on the cusp of a new high.
All of this means a Fed rate cut in the next 12 months is less likely. Not unlikely but less likely.
Precious Metals have been trading on Fed rate expectations for a while. Higher highs in equities and some stabilization in the economy will chip away at expectations for a rate cut and as a result, some bearish price action is showing up in the precious metals sector.
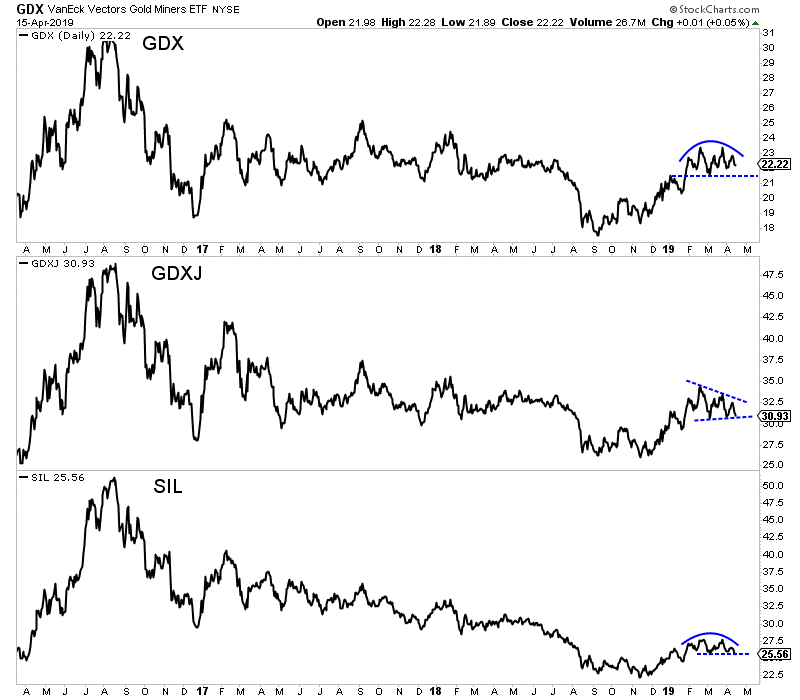
Below we plot the daily line charts of the gold and silver stocks.
They have formed bearish patterns with the silver stocks (SIL) leading to the downside followed by GDXJ while GDX has held up the best. These charts need to hold their early March low to avoid a break to the downside.
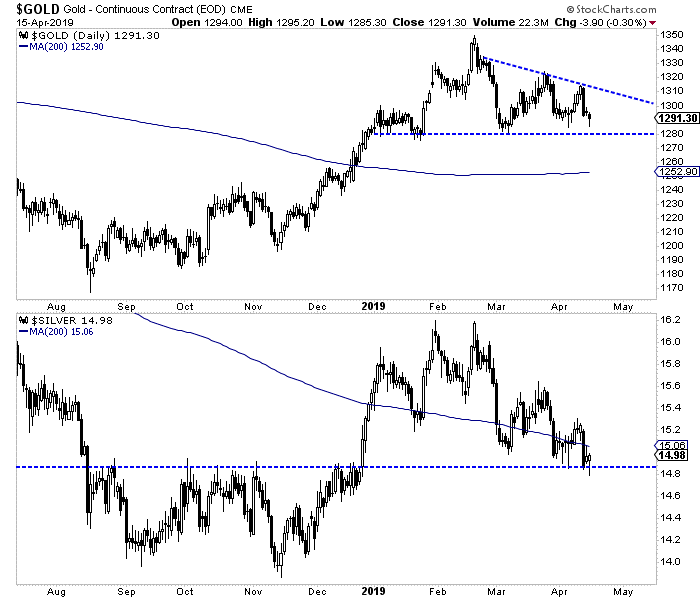
Turning to the metals, we find Silver has been leading the entire complex lower. It has found temporary support just below $15.00.
Meanwhile, Gold has formed a bearish pattern and if it loses support at $1280 will likely dump to its 200-day moving average at $1253 and probably lower.
Circling back to the gold stocks, I do want to note the weekly candle charts because they illustrate the big picture prognosis.
We can see that for GDX and GDXJ the critical levels are clearly $23 and $34. The gold stocks have failed to break resistance for now but it’s clear that a weekly close above those levels would signal a bull market.
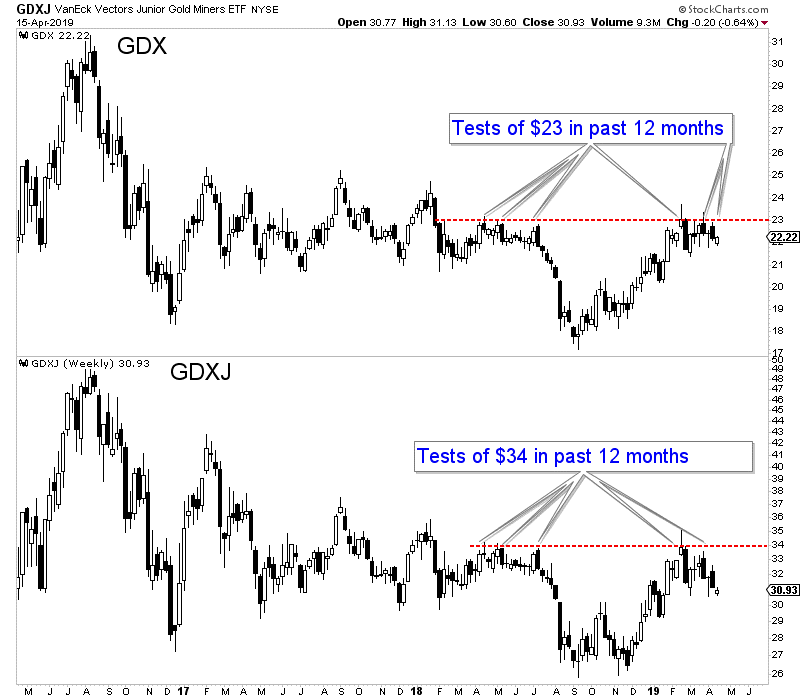
If the miners and Gold break lower then it’s no reason to throw in the towel. We would not be surprised if the next low the miners make could be the last one before a bull run begins.
In the meantime, the question is will it be a higher low or will the miners form huge double bottoms at $18 and $26?
The weeks and months ahead should be an especially opportune time to position yourself in this sector. We will be looking for anything we missed in recent months that gives us a second chance opportunity. To learn what stocks we own and intend to buy that have 3x to 5x potential, consider learning more about our premium service.
Gold has faded from interest in the past couple months, overshadowed by the monster stock-market rally. But gold has been consolidating high, quietly basing before its next challenge to major $1350 bull-market resistance. A decisive breakout above will really catch investors’ attention, greatly improving sentiment and driving major capital inflows. With gold-futures speculators not very long yet, plenty of buying power exists.
Last August gold was pummeled to a 19.3-month low near $1174 by extreme all-time-record short selling in gold futures. The speculators trading these derivatives command a wildly-disproportional influence on short-term gold price action, especially when investors aren’t buying. Gold-futures trading bullies gold’s price around considerably to majorly, which can really distort psychology surrounding the gold market.
The main reason is the incredible leverage inherent in gold futures. This week the maintenance margin required to trade a single 100-troy-ounce gold-futures contract is just $3400. That’s the minimum cash traders have to keep in their accounts. Yet at the recent $1300 gold price, each contract controls gold worth $130,000. So gold-futures speculators are legally allowed to run extreme leverage up to 38.2x!
That’s extraordinarily risky of course. A mere 2.6% adverse move in gold against traders’ fully-leveraged positions would result in 100% total losses. It’s amazing these guys can sleep at night. For comparison, the stock markets’ legal limit has been 2x leverage since 1974. 10x, 20x, 30x+ is crazy, and has been very problematic for gold for decades. It greatly amplifies gold-futures speculators’ impact on gold prices.
Every dollar deployed in gold futures at 30x leverage literally has 30x the influence on gold prices as a dollar invested in gold outright! So even though gold-futures speculators have far less capital available than investors, it is way more potent amplified up to 38x! Thus when gold investment demand is weak like recently with stellar stock-market complacency, gold-futures speculators utterly dominate gold price action.
Their collective trading effectively controls gold psychology too, since the American gold-futures price has become the world’s leading gold reference one. Investors start feeling bullish on gold and buying usually only after gold-futures speculators push its price higher. And gold-futures selling leaves investors bearish and worried, impelling them to exit gold. Gold-futures trading is the tail that wags the gold-investment dog!
So everyone interested in gold has no choice but to follow what the gold-futures speculators as a herd are doing. The US Commodity Futures Trading Commission publishes weekly data showing their collective positioning, the famous Commitments of Traders reports. They are released late Friday afternoons, and show traders’ aggregate gold-futures long and short contracts held as of the preceding Tuesday closes.
Despite gold’s solid upleg since those deep mid-August lows, these traders still have lots of buying power left to push gold considerably higher. This first chart superimposes the daily gold price in blue over specs’ weekly total gold-futures long and short contracts in greed and red. The great majority of gold’s upleg-to-date gains have been driven by short-covering buying. Very bullishly the larger long buying is still yet to come.
In mid-August when today’s gold upleg was born, speculators’ total gold-futures shorts rocketed way up to 256.7k contracts! That was the highest witnessed in the 19.6 years since early 1999, almost certainly an all-time record. That unprecedented orgy of extreme shorting hammered gold from roughly $1300 down to $1175 in a couple months or so. That sharp futures-driven gold plunge naturally devastated psychology.
The gold-futures traders were effectively borrowing gold they didn’t own to dump in the markets, hoping to buy it back later at lower prices and profitably repay those debts. They were doing it at extreme 30x+ leverage, proportionally amplifying their capital’s price impact. That record shorting spree had nothing to do with fundamentals, it was a snowballing momentum thing. Yet investors were spooked into selling in sympathy.
In mid-June when gold traded just over $1300, total spec shorts were only 100.3k contracts. But over the next 10 CoT weeks they skyrocketed 156% higher to that record 256.7k. The resulting gold carnage led American stock investors to sell shares in the leading GLD SPDR Gold Shares gold ETF much faster than gold was being sold. That forced its gold-bullion holdings 60.1 metric tons or 7.2% lower in that short span!
Gold bottomed the very week gold-futures short sellers had exhausted themselves, reached the limits of their available capital. Since then gold has powered nicely higher on balance, enjoying a 14.2% upleg over the next 6.2 months into mid-February. Gold peaked near $1341 then and has been consolidating high ever since. This upleg has been almost fully driven by gold-futures buying, which is totally normal.
To close gold-futures short positions and repay those debts, speculators have to buy gold-futures long contracts to offset them. They bought to cover an enormous 112.3k short contracts in this upleg’s span, mostly unwinding last summer’s record shorting spree. They also added another 46.8k long contracts, leveraged upside bets on gold’s price. Despite all that gold-futures buying, there is still room for much more.
Major gold uplegs have three stages, each driven by distinctive buying from different groups of traders. Uplegs are always born and initially fueled by gold-futures short covering, as speculators are motivated to buy to cover and realize their shorting profits. Short covering quickly becomes self-feeding, as resulting fast gold-price gains force other short-side traders to rapidly buy to cover or face catastrophic leveraged losses.
Thus that stage-one short-covering buying quickly burns itself out after a couple months or so. But it first pushes gold high enough for long enough to convince long-side gold-futures speculators to return. They command way more capital than the short-side guys, as evidenced by the green long line in this chart usually being much higher than the red short line. Spec gold-futures long buying is uplegs’ second stage.
That unfolds more gradually than short covering, typically 6 months or longer. Long-side traders not only have lots more capital to deploy, but their buying is voluntary. They have to really believe gold is heading higher to make such risky hyper-leveraged upside bets. In contrast short covering is mandatory and often involuntary, as those effective debts must legally be repaid. Stage-one buying directly ignites stage two.
Gold has real bull-market breakout potential in the coming months because this current upleg hasn’t yet seen much gold-futures long buying. Stage two is underway, but the majority is likely still yet to come. The green total-spec-gold-futures-longs line above proves this. At best in mid-February near gold’s latest high, total spec longs peaked at 305.0k contracts. And they have since retreated sharply to 243.8k as of last Tuesday.
Both levels are really low by bull-to-date precedent. This young secular gold bull was born out of deep 6.1-year secular lows in mid-December 2015. Its maiden upleg was big and fast, gold rocketed 29.9% higher in just 6.7 months in essentially the first half of 2016. As that peaked in early July 2016, total spec longs hit an all-time record high of 440.4k contracts! Gold-futures traders piled on, helping fuel big upside momentum.
Total spec shorts that same CoT week ran 100.2k contracts. That upleg had been partially driven by the gold-futures speculators buying a monster 249.2k longs while covering 82.8k shorts. Gold crested at $1365 in early July, which remains this bull’s best level today. Over the subsequent years $1350 would repel gold multiple times, becoming major overhead resistance as gold kept failing to break out above it.
Speculators soon started to unwind their excessive long positions, helping hammer gold 17.3% lower by mid-December 2016. That heavy gold-futures selling was greatly exacerbated by stock markets surging after Trump’s surprise election victory. This gold bull’s second upleg emerged from the ashes, driven first by gold-futures short covering which soon ignited gold-futures long buying. That was also the first upleg’s order.
Gold powered another 20.4% higher to $1358 by late January 2018, and once again gave up its ghost right near that key $1350 resistance. Gold-futures speculators ultimately played a smaller role in that upleg as investors returned. Gold investment buying is the third stage of gold uplegs, which can grow far larger than gold-futures-driven stages. Futures buying is a two-stage ignition mechanism to attract investors.
Total gold-futures longs only climbed 80.6k contracts during that second upleg, while shorts only slipped 4.1k. That’s somewhat misleading though, as the precise upleg dates mask the green long line trending higher while the red short line trended lower. When that upleg peaked, total spec longs and shorts were running 356.4k and 121.9k contracts. The former was still much higher than today’s levels, a very-bullish omen.
This gold bull’s first two uplegs failed with total spec longs far higher than today’s 243.8k, averaging 398.4k contracts. Second-stage spec long buying has exhausted itself and killed uplegs between roughly 350k to 450k contracts in this gold bull. So the sub-250k levels seen last Tuesday remained way too low to likely signal a mature gold upleg. Speculators still have room to do the majority of their stage-two long buying!
This gold upleg is highly likely to see at least another 100k contracts of long buying, and potentially up to 200k if gold returns to favor! That is the gold-futures equivalent to another 311 to 622 metric tons of gold. That will almost certainly catapult gold much higher, just like during this bull’s prior uplegs. Given where gold is today, this creates major bull-market breakout potential. A concerted assault on $1350 is likely.
Throughout this entire gold bull, gold has never been higher with sub-250k spec longs than it is today near $1300! Usually the yellow metal was only around $1250 at this kind of positioning. So we are now witnessing gold’s highest basing in its bull market relative to spec longs. $1350 isn’t much higher than $1300, just another 3.8%. There’s a good chance the remaining stage-two buying will drive gold there.
While it’s certainly not exact, 50k contracts of gold-futures long buying in this bull’s other gold uplegs have often pushed gold $50 higher. Again we are almost certain to see another 100k and potentially a best case of 200k. So gold has never been better positioned in this bull market to surge up to and through its multi-year $1350 resistance! A decisive breakout above $1350 would change everything in the gold market.
Gold-futures speculators are necessarily trapped in the short term by their extreme leverage. They don’t care what gold does, they just want to ride its momentum. Investors are way different, with no leverage at all they have a long-term focus. There’s nothing that excites them more, and drives more capital inflows into gold, than new bull-market highs. Higher highs prove gold is still marching, portending more future gains.
Investors haven’t seen a new gold-bull high since way back in early July 2016, which feels like forever ago in these markets. As the months and years paraded by and gold kept failing to best $1350, most investors gradually lost interest in gold. While its bull-market lower-support zone has gradually risen, the horizontal upper resistance really tainted psychology. Gold has been viewed as consolidating, not in a bull.
But 100k to 200k contracts of spec gold-futures long buying starting near $1300 has real potential to blast gold back above $1350. A decisive breakout is 1%+ beyond that, or $1364. Once gold climbs back over $1365, it will start hitting new bull-to-date highs. That will bring gold back into the financial news in a big way, rekindling investor interest and capital inflows. The resulting bullish sentiment becomes self-feeding.
Major stage-three investment gold buying gets way more likely the higher gold forges above $1350. It’s ironic that although investment is all about buying low when assets are out of favor, the great majority of investors instead prefer to buy high. They love chasing winners, and increasingly crowd into positions the higher their prices climb. There’s no doubt new bull-market gold highs will fuel big excitement in this metal.
Gold’s bull-market breakout potential in the coming months is amplified by a couple other major factors. Gold is in a seasonally-strong time of the year, enjoying its seasonal spring rally. That provides a solid sentimental tailwind that should help motivate gold-futures speculators to continue rebuilding their low gold-futures long positions. Their buying also becomes self-feeding the higher and longer gold runs.
Far more importantly, gold-investment levels are really low thanks to the monster stock-market rally since late December. With the US stock markets skyrocketing from ugly near-bear severe-correction lows to nearly regaining September’s all-time highs, complacency and euphoria are epic. Stock investors have virtually no fear of a major stock-market selloff, which like usual has greatly retarded gold investment demand.
But these lofty stock markets are dangerously overvalued and overbought, heading into a Q1’19 earnings season which is looking to be the weakest in years. When the stock markets roll over again, investors will again remember the wisdom of prudently diversifying their stock-dominated portfolios with gold. It tends to rally when stock markets weaken, a rare and desirable quality. The next material stock selloff will goose gold.
Back in December when the flagship US S&P 500 stock index plunged 9.2%, gold surged 4.9% higher. Any material stock-market selloff, regardless of the reason, will quickly rekindle gold investment demand. And if investors start buying even before gold-futures speculators’ stage-two long buying is complete, a decisive breakout back above $1350 is all but certain. This gold bull’s upside breakout potential is very real.
The biggest beneficiaries of higher gold prices reviving interest in its bull market will be the gold miners’ stocks. The major gold miners of the GDX VanEck Vectors Gold Miners ETF usually amplify gold’s own moves by 2x to 3x. So a 10% gold rally will often translate into 20% to 30% GDX gains. But when gold really shifts back into favor among investors, the upside can be far greater. We’ve already seen that in this bull.
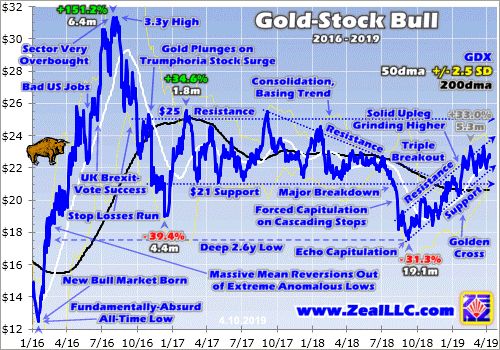
This GDX gold-stock-bull chart is updated from last week’s essay, where I explained the bullish gold-stock situation in depth. So check that out if you need to get up to speed. But for our purposes today, note the last time gold powered to new bull-market highs exciting investors was during this bull’s first upleg largely in the first half of 2016. GDX skyrocketed 151.2% higher in essentially the same span of that 29.9% gold upleg!
That made for outstanding 5.1x upside leverage to gold from the major gold miners. The smaller mid-tier and junior gold miners of the GDXJ VanEck Vectors Junior Gold Miners ETF did even better. With their superior fundamentals and lower market capitalizations, mid-tier upside is much better than the majors. Even if gold merely challenges $1350 again, the gold stocks will surge dramatically higher as traders flock back.
So while the lack of interest in gold and its miners’ stocks these days is understandable, it is unfortunate. The biggest gains are won by buying relatively low before everyone gets excited about an asset or stock sector. Once gold and the gold stocks start surging again as $1350 nears, speculators and investors alike will have to buy much higher. Deploying aggressively before new bull highs should yield impressive gains.
One of my core missions at Zeal is relentlessly studying the gold-stock world to uncover the stocks with superior fundamentals and upside potential. The trading books in both our popular weekly and monthly newsletters are currently full of these better gold and silver miners. Mostly added in recent months as gold stocks recovered from deep lows, our unrealized gains are already running as high as 76% this week!
To multiply your capital in the markets, you have to stay informed. Our newsletters are a great way, easy to read and affordable. They draw on my vast experience, knowledge, wisdom, and ongoing research to explain what’s going on in the markets, why, and how to trade them with specific stocks. As of Q1 we’ve recommended and realized 1089 newsletter stock trades since 2001, averaging annualized realized gains of +15.8%! That’s nearly double the long-term stock-market average. Subscribe today for just $12 per issue!
The bottom line is this gold bull now has the highest major-upside-breakout potential of its entire lifespan. This latest gold upleg fueled by gold-futures buying hasn’t matured yet, as speculators’ long positioning remains quite low. For the first time in this bull, gold is already consolidating high around $1300 before most of the likely gold-futures long buying has run its course. That makes an assault on $1350 very likely.
If gold can break decisively above that multi-year resistance and start forging new bull-market highs, its psychology will greatly improve. Investors will take notice and start buying again, driving gold higher and fueling mounting bullishness. The gold miners’ stocks will be the biggest beneficiaries of new bull-market gold highs. Their stocks soared the last time investors were excited about this gold bull, rapidly multiplying wealth.
Adam Hamilton, CPA
April 15, 2019
Copyright 2000 – 2019 Zeal LLC (www.ZealLLC.com)
Green shoots? Anyone seeing the green shoots of a Springtime recovery in lithium stocks? No, me neither…. However, I do note one positive development, Lithium Americas is receiving US$160M for 12.5% of its JV brine project in Argentina. That implies a C$1.7 billion valuation for the entire project, of which Lithium Americas will own half. This is the best news since POSCO paid US$280M to Galaxy Resources for 17,500 hectares in Catamarca province, Argentina. They paid US$16,000/ha for a reported 2.54 million tonnes of high-grade resources.
Speaking of Catamarca,that’s where CEO David Tafel’s company Portofino Resources (TSX-V: POR) controls 3 projects totaling > 8,600 hectares. One of the Projects is very near the projects of POSCO & Galaxy. Another is near Neo Lithium’s very high-grade 3Q project. I recognize I’m name dropping and playing the close-ology game, but Portofino has 3 shots at glory. Three legitimate chances of finding good, or even high-grade lithium deposits. Yet its market cap is just C$2M. This seems like attractive risk/reward to me.
Please give readers the latest snapshot of Portofino Resources.
Sure. Portofino Resources holds an interest in 3 lithium property groups in Argentina representing over 8,600 hectares. Our projects are located within the world-renowned “Lithium Triangle”, specifically focused in Catamarca Province, which was ranked by the Fraser Institute Annual Survey of Mining Companies, 2018, as the best mining province in Argentina. The Hombre Muerto West project is our most advanced and is within Argentina’s most prolific producing lithium brine Salar.
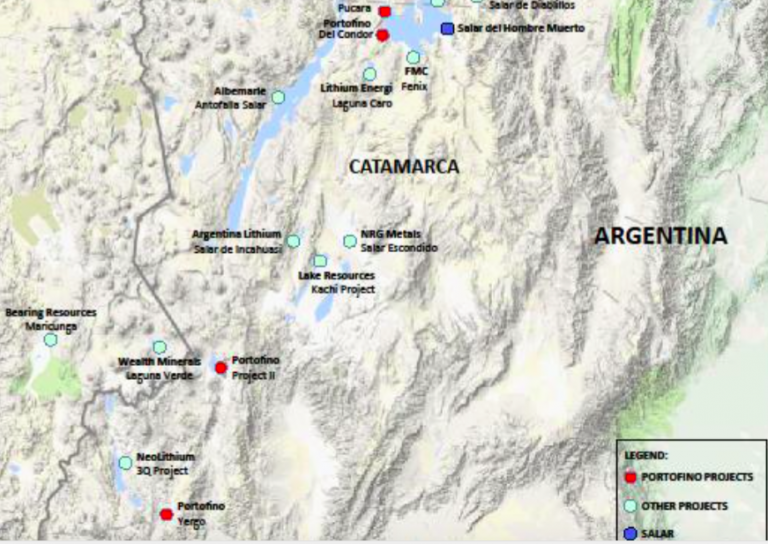
Portofino’s close neighbors in the Hombre del Muerto Salar include Majors– Livent Corp. (formerly FMC Lithium) and POSCO, and Australian-listed Galaxy Resources. All of our projects have been negotiated on the basis of 4-yr earn-in agreements with very low upfront costs. Between now and the end of next year, our total cash outlay is ~US$50K, for all 3 projects, and that’s not until 2020. I should add, we have no work commitments or royalties on any of our projects.
Very few lithium stocks are doing well lately, or over the past year for that matter. What’s your view of the sector?
Yes, it has been a very tough year for lithium stocks and lithium company shareholders, as the excitement for lithium projects has retreated and share trading has dried up. The market is no longer interested in companies with vast hectarage. It’s more about advancing projects with good addresses and good grades. Investors have become much more selective. However, a few companies with promising projects have begun to move up off their lows, and I believe this will continue. NOTE: {Bacanora Lithium, Lithium Americas & Neo Lithium are up an average of ~75% from their 52-week lows}
Tell us more about the Hombre Muerto West project, how many drill holes are planned?
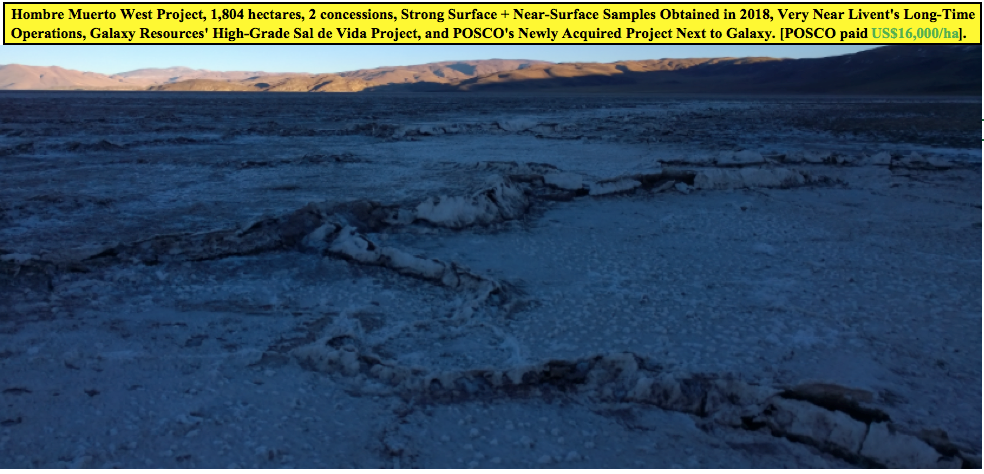
We have a team on site that should complete a geophysical survey by the end of April. This is a follow up on encouraging lithium results achieved during last year’s surface sampling. The present program will help define the extent of brine in the sub-surface, which will be used to define targets for initial drilling. We expect to generate at least 2 or 3 drill targets from the geophysics. Drilling should commence following interpretation of the survey results.
What grades & intercept widths would your team consider to be a success?
Depending upon geophysical results, we will likely drill to an initial depth of 150m and hope for grades exceeding 400-500 ml/L lithium over 75-100m.
What excites you most about Hombre Muerto West?
Our Hombre Muerto West project is located within the best known and top producing lithium brine Salar in Argentina. Galaxy Resources recently sold a portion of their holdings in the Salar to POSCO for US$280 million (US$16,000 per hectare!). In 2018, our geological team sampled 18 sites in a near-surface auger program. Six samples were over 700 mg/L lithium and the highest sample returned 1,031 mg/L lithium plus 9,511 mg/L potassium. The samples also contained low impurity levels, including low magnesium.
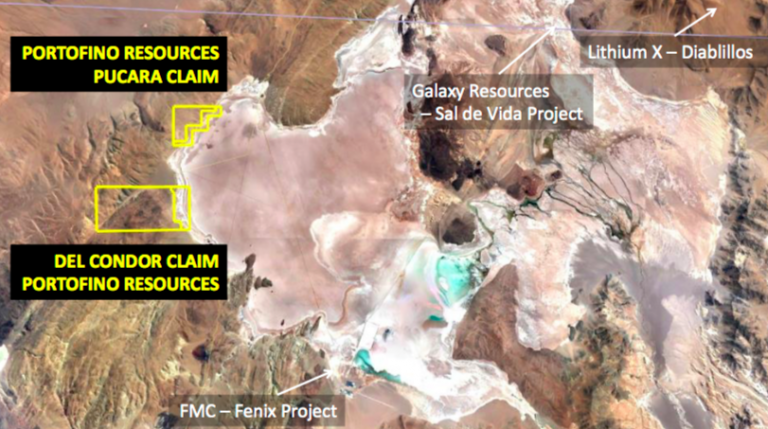
Please tell us more about your second project, named Project II.
Portofino can acquire 85% of Project II, which is 3,950 hectares in size, located approximately 10 km from the Chile border, and 65 km northeast of Neo Lithium Corp’s well known 3Q project. Historical exploration work included near-surface auger brine samples that averaged 274 mg/L lithium, with several in excess of 300 mg/L lithium.
What excites you most about Project II?
Project II captures the whole salar, has relatively easy access, and has returned consistent surface / near-surface sampling results over a wide area. In addition, the Maricunga (BFS completed) lithium project is located just across the Chile border. Maricunga is billed as the highest grade, undeveloped lithium salar project in the Americas.
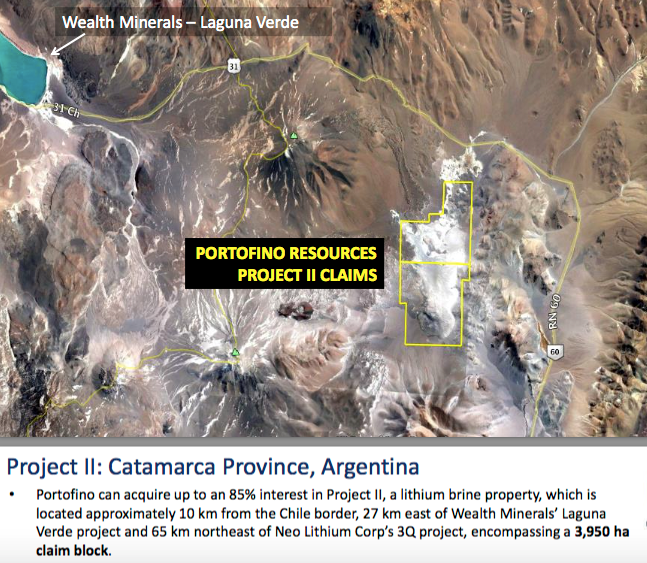
Are you in discussions with any potential strategic partners?
Yes, we are having preliminary discussions, off and on, with multiple interested parties. We would like to bring in a partner on one or more of our projects. However, there is no certainty that any agreements will be reached.
Please tell us more about your third project, Yergo.
Portofino has the right to acquire a 100% Interest in the 2,932 hectare Yergo lithium brine project. The property covers the entire Aparejos salar. Yergo is located approximately 15 km southeast of Neo Lithium Corp’s 3Q project. We completed an initial field exploration & sampling program consisting of surface & near-surface brine sampling & geological mapping. A total of 25 locations across the property were sampled. Samples have been shipped to a certified lab in Argentina. Results will be announced as soon as received.
You said that Yergo is ~15 km from Neo Lithium’s project. Neo just released a very favorable PFS. Does Yergo have anything in common with the 3Q?
Neo Lithium’s deposit is very high-grade with very low impurities. Our geological team just completed an initial sampling & mapping exploration program. We believe there are common characteristics. Once we have had a chance to review the results, we will be in a better position to comment further on commonalities.
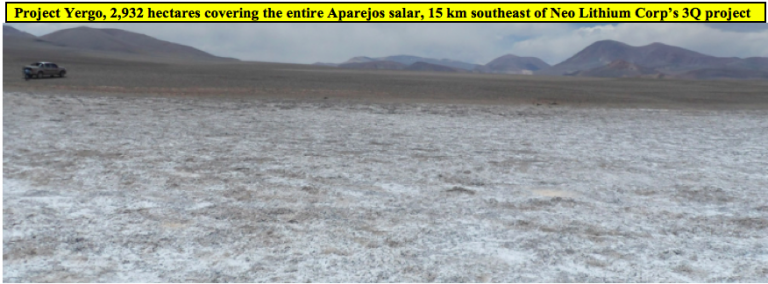
What excites you most about the Yergo project?
As mentioned, Yergo is close to Neo Lithium’s PFS-stage 3Q project, yet as far as we are aware, it had remained completely unexplored. Our geologists were quite upbeat after their visit and we are anxious to see the lab results of our initial sampling program.
Your 3 projects might be promising, but at 1,804 ha, 3,950 ha & 2,932 ha, are they large enough to host sizable resources?
Our Hombre Muerto West property is relatively small, about 1,800 hectares, but could still host a sizable resource subject to ultimate grade/basin determination. However, it would make sense to consolidate our project with another in the same salar. Our other 2 projects are big enough, and in each case we control the entire salar. The advanced-stage, well regarded Maricunga project in Chile is approx. 4,000 hectares– so comparable from that perspective to both Yergo and Project II.
Why should readers consider buying shares of Portofino Resources?
Lithium stocks are out of favor, but select stocks have moved off their lows. We have just 24 M shares outstanding and a modest market value of ~C$2M. Our 3 projects are located in close proximity to advanced-stage & producing lithium companies. Near-surface sampling at Hombre Muerto West returned some very positive results. Depending on the weather, we hope to start drilling in coming months. We have 2 exploration programs underway, the other being Yergo, so readers can expect news on both projects. We believe there’s significant upside potential in the share price.
April 12, 2019
Peter Epstein
Disclosures: The content of this interview is for information only. Readers fully understand and agree that nothing contained herein, written by Peter Epstein of Epstein Research [ER], (together, [ER]) about Portofino Resources, including but not limited to, commentary, opinions, views, assumptions, reported facts, calculations, etc. is not to be considered implicit or explicit investment advice. Nothing contained herein is a recommendation or solicitation to buy or sell any security. [ER] is not responsible under any circumstances for investment actions taken by the reader. [ER] has never been, and is not currently, a registered or licensed financial advisor or broker/dealer, investment advisor, stockbroker, trader, money manager, compliance or legal officer, and does not perform market making activities. [ER] is not directly employed by any company, group, organization, party or person. The shares of Portofino Resources are highly speculative, not suitable for all investors. Readers understand and agree that investments in small cap stocks can result in a 100% loss of invested funds. It is assumed and agreed upon by readers that they will consult with their own licensed or registered financial advisors before making any investment decisions.
At the time this article was posted, Peter Epstein owned shares of Portofino Resources and Portofino was an advertiser on [ER]. Readers understand and agree that they must conduct their own due diligence above and beyond reading this article. While the author believes he’s diligent in screening out companies that, for any reasons whatsoever, are unattractive investment opportunities, he cannot guarantee that his efforts will (or have been) successful. [ER] is not responsible for any perceived, or actual, errors including, but not limited to, commentary, opinions, views, assumptions, reported facts & financial calculations, or for the completeness of this article or future content. [ER] is not expected or required to subsequently follow or cover events & news, or write about any particular company or topic. [ER] is not an expert in any company, industry sector or investment topic.
There are more than a handful of things I can cite as leading indicators for the Gold price.
Ratios such as Gold against the stock market and Gold against foreign currencies are generally good leading indicators. The gold stocks and Silver can function as leading indicators at times.
The yield curve and bonds can also be leading indicators.
But there is one thing I’ve never mentioned, nor written about. It makes sense in the current context though. That’s Platinum.
Platinum has a brief but clear history as a leading indicator for Gold.
Platinum outperformed and led Gold higher immediately after the two most recent major lows: 1985 and 1999-2001.
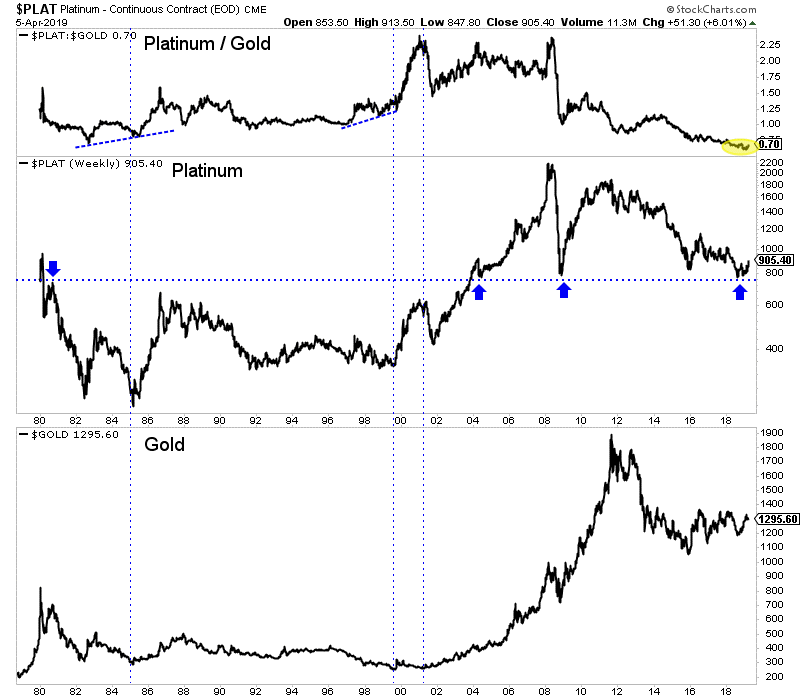
We also want to note the 1966-1968 period when Platinum tripled in price. Silver doubled and Gold of course was still fixed in price. In any event, Platinum’s huge move in the late 1960s was a leading indicator for Gold’s forthcoming surge.
Since the February highs Platinum has made a higher high while Gold has corrected. Platinum looks like it has a reasonable shot to make a new 52-week high this year while Gold would need to fight through the wall of resistance to make a new 52-week high.
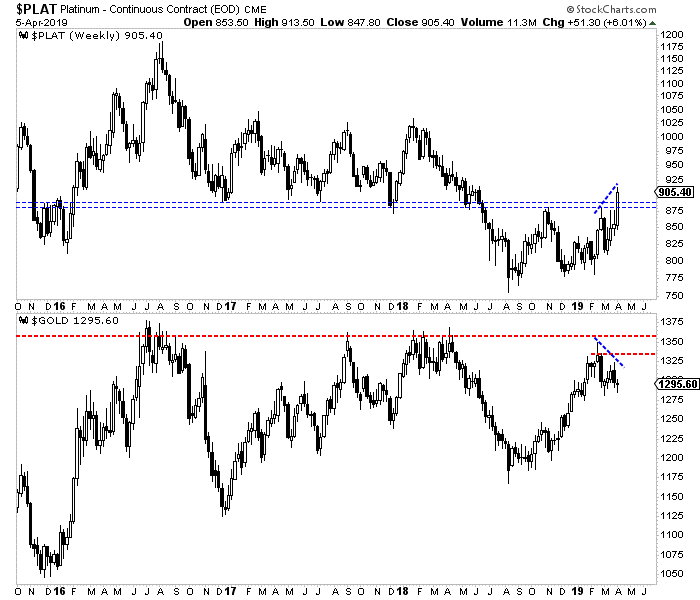
According to BMG Group, a study by Wainright Economics showed that Platinum is the leading indicator of inflation. While Gold and Silver lead by a year, Platinum leads by 16 months.
Whatever the reason, history is clear. Around major bottoms in precious metals, Platinum tends to outperform and lead Gold. Since February Platinum has strongly outperformed Gold while registering an important positive divergence.
We will certainly keep abreast of the other leading indicators such as relative performance of the miners, Fed policy, a steepening yield curve and precious metals performance against the stock market. We will also keep an eye on Platinum as continued outperformance would be a strongly bullish signal for Gold for 2020 and beyond.
The weeks and months ahead should continue to be an especially opportune time to position yourself in this sector. To learn what stocks we are buying and have 3x to 5x potential, consider learning more about our premium service.
April 11, 2019
Jordan Roy-Byrne
- Chinese economic growth is probably the main driver of both physical gold demand and the global bull market in stocks.
- Please click here now. I’m invested in China through ETFs, bank stocks, and… gold!
- With the possible exception of HSBC, most analysts in the West appear to be underestimating the resilience of a billion Chinese citizens working maniacally in the private sector.
- I’ll go even further than HSBC and predict that Chinese GDP growth could re-touch the 7% area if a trade deal is announced.
- Please click here now. Double-click to enlarge. The FXI-NYSE Chinese stock market ETF is breaking out of a powerful inverse H&S bottom pattern. The technical action fits with the growing GDP fundamentals, and key Chinese gold jewellery stocks are racing to fresh highs for the year.
- My guswinger.com leveraged ETF swing trade service focuses on YINN-NYSE for Chinese stock market action. YINN is a triple-leveraged ETF. Its price should soar if even a fraction of the positive Chinese growth scenario laid out by HSBC and myself comes to pass.
- Please click here now. Double-click to enlarge. While gold is doing extremely well so far in the weak demand season, a trade deal and/or a Chinese GDP surge could end this weak season earlier than usual.
- Most big bank analysts see gold at $1400 or higher within 12 months. That $1400 price would turn many gold miners into gargantuan cash cows.
- Mining stock dividends would soar and make global money managers embrace the sector in a much more consistent way than they have in the past.
- Please click here now. If Chinese growth can reach the 7% area, Indian growth should reach 8%. India’s central bank has started its own gold buy program and all the silly government attacks on the Indian gold sector have ended.
- Most gold analysts look for signs of a weakening global economy to propel gold higher. In contrast, I look for signs of strength in the private sector and signs of weakness in the US government sector. Both are present now.
- The U.S. government is a walking tombstone. Its debt cannot be paid. It’s a gargantuan glutton that is clearly out of control. The government and its central bank recklessly smash savers by demanding ultra-low rates and QE. It does so because its own grotesque appetite for borrowed money is insatiable.
- Interestingly, Trump has just nominated gold standard enthusiast Herman Cain as a potential Fed governor. Trump says that Herman “gets it”.
- Does Trump mean Herman understands that only a gold standard can end the insane growth of the U.S. government?
- I think so. The current bottom line for gold is that all Chindian growth lights are green and all U.S. government debt lights are red. This is the perfect environment for creating rallies in the gold price that are sustained.
- Please click here now. Double-click to enlarge. The price action of the TLT-NYSE bond market ETF supports my theme of strength in global stock markets and gold, and weakness in bonds.
- Sometimes gold rallies when interest rates decline and sometimes it rallies when they rise. If there’s enough fear in either scenario, gold will rally strongly.
- Gold soared in 2009 after rates were dramatically lowered with QE and fear of system collapse was rampant.
- Gold soared in 1979 as rates went ballistic and fear of hyperinflation was rampant.
- Libertarians are obviously eager to watch the U.S. government incinerate in a rocketing rates bond market fireball, but I think the coming swoon in bond prices will be more mundane.
- Simply put, the U.S. government debt fireball lies ahead, but in the medium-term gold is likely to rally to $1400 mostly because of the fundamentals of strong Chinese growth.
- Please click here now. Double-click to enlarge this solid-looking GDX chart.
- I’ve been adamant that the weak season sideways action for GDX and associated miners won’t end until there’s a Friday close of $23 or better.
- Will this be the week that it happens? Well, it feels imminent and the good news for investors is that the symmetrical triangle now in play for GDX has an upside price target of about $26!
Special Offer For Website Readers: Please send me an Email to freereports4@gracelandupdates.com and I’ll send you my free “The Golden Surge!” report. I highlight eight key gold and silver miners with similar technical patterns to GDX that can stage much bigger rallies as GDX breaks out to upside!
Stewart Thomson
Graceland Updates
Written between 4am-7am. 5-6 issues per week. Emailed at approx 9am daily.
Email:
Risks, Disclaimers, Legal
Stewart Thomson is no longer an investment advisor. The information provided by Stewart and Graceland Updates is for general information purposes only. Before taking any action on any investment, it is imperative that you consult with multiple properly licensed, experienced and qualified investment advisors and get numerous opinions before taking any action. Your minimum risk on any investment in the world is: 100% loss of all your money. You may be taking or preparing to take leveraged positions in investments and not know it, exposing yourself to unlimited risks. This is highly concerning if you are an investor in any derivatives products. There is an approx $700 trillion OTC Derivatives Iceberg with a tiny portion written off officially. The bottom line:
Are You Prepared?
The gold miners’ stocks are still marching, grinding higher on balance in a solid upleg. While interest in this sector has faded since late February, it is nicely set up for a strong rally. After consolidating high and establishing a sturdy base, the gold miners are likely to soon report greatly-improved first-quarter results. Couple that with gold itself powering higher, and the slumbering gold stocks should surge substantially.
The gold stocks are mired in something of a psychological limbo these days. They aren’t exactly out of favor, but there’s little enthusiasm for this sector. Investors and speculators have largely lost interest for technical, sentimental, and fundamental reasons. It’s been 6 weeks since this gold-stock upleg surged to material new highs. The major gold miners have been mostly grinding sideways since, consolidating and basing.
Contributing heavily to traders’ apathy is gold’s own price action in that recent span. Gold overwhelmingly drives gold-mining profits, making these stocks leveraged plays on gold. Gold’s own latest upleg high of $1341 came back in mid-February right before gold stocks topped. Over the next 12 trading days gold fell 4.1% to $1285 during its usual pre-spring-rally-pullback period. Slumps invariably sap traders’ enthusiasm.
Gold’s seasonal spring rally launched right on schedule after that. By late March this metal had gained back 2/3rds of its pullback losses. The gold stocks surged right back up to challenge their late-February highs on that, but couldn’t break out decisively. Then gold rolled over again during these last couple weeks, revisiting those pre-spring-rally lows. That spooked gold-stock traders, so they sold in sympathy.
Gold’s problem is the great complacency and euphoria spewing forth from the massive rally in the general stock markets. Largely in Q4, the flagship S&P 500 broad-market stock index (SPX) plunged 19.8% from an all-time record peak to deep near-bear lows. But since then it has soared 22.2% higher in what looks like a monster bear-market rally. The SPX has regained an incredible 9/10ths of its severe-correction loss!
Gold is the ultimate portfolio diversifier, tending to rally when stock markets fall. Gold investment demand surges as traders rush to diversify stock-dominated portfolios. December was a key case in point, as gold powered 4.9% higher while the SPX plunged 9.2%. But complacency mushrooms after stock markets rally strongly, and prudent money management is quickly forgotten. So capital inflows into gold wither again.
While sideways-at-best technicals and deteriorating sentiment are the main reasons this gold-stock upleg has stalled, fundamentals played a role too. The major gold miners of the leading gold-stock investment vehicle, the GDX VanEck Vectors Gold Miners ETF, reported their Q4’18 operating and financial results between early February to mid-March. And they proved fairly lackluster due to lower prevailing gold prices.
Yet despite these considerable headwinds, the gold stocks are still marching higher on balance. This chart looks at GDX over the past several years or so. Despite the apathy traders feel, this young gold-stock upleg remains solid. The gold miners’ stocks are still gradually grinding higher in a well-defined uptrend channel. They are well-positioned to surge on any good news, which is likely right around the corner.
While indifference reigns in this small contrarian sector today, that’s actually a major improvement! Back in early September GDX plunged to a deep 2.6-year secular low. Gold stocks had just been crushed on cascading selling as stop losses were sequentially tripped. That brutal forced capitulation was the direct result of gold getting hammered by all-time-record gold-futures short selling. This sector was loathed then.
Those extreme gold-stock lows weren’t fundamentally righteous, so a big mean-reversion rebound higher was inevitable. That very week in my essay I argued “The technicals and sentiment spawned by capitulations are so extreme they usually birth massive uplegs and entire bull markets.” As contrarians we aggressively bought gold stocks and recommended our newsletter subscribers load up near those lows.
The gold stocks indeed bounced and started recovering, gradually fleshing out the solid uptrend channel in this chart. GDX rallied to cross multiple major technical milestones. A simultaneous triple breakout above three major resistance zones was soon followed by a major Golden Cross buy signal. Triggered by a 50-day moving average climbing back above a 200dma after a major low, these herald big runs higher.
GDX rallied 33.0% over 5.3 months, regaining recent years’ large consolidation trend between $21 support and $25 resistance. At its recent highs of $23.36 on February 20th and $23.35 on March 26th, GDX edged into the upper half of this range for the first time in 12.6 months! The best gold-stock levels in over a year were something to celebrate, technical proof things are changing in this long-neglected sector.
Even better, GDX leveraged gold’s own gains over this upleg-to-date span by 2.8x. That’s strong, on the high side of the usual historical 2x-to-3x range. Gold-stock gains hadn’t outpaced gold’s to such a degree in years, yet again showing this gold-stock upleg is impressive and robust. GDX’s recent high consolidation was just a normal and healthy mid-upleg drift entirely within its uptrend channel, nothing to fear.
Uplegs naturally flow and ebb, surging two steps higher before slumping one step back. This rhythm is essential to keep sentiment balanced, which helps maximize uplegs’ ultimate durations and gains. Once gold stocks blast higher fast enough to rekindle greed, that has to be bled away by subsequent selloffs or drifts. Without these retreats, too much buying too fast burns out uplegs prematurely truncating their potential.
So technically the major gold stocks are looking a lot better today than most traders give them credit for. The consolidating pullback since late February has done its work brilliantly, heavily dampening sentiment while gold-stock prices remain relatively close to upleg highs. Without this critical perspective, it’s not too surprising traders are so indifferent. But enthusiasm can return fast with the right catalyst, and some are coming.
Without any doubt gold stocks will catch a strong bid when gold’s spring rally resumes. In December as gold rallied 4.9% while the stock markets burned, GDX blasted 10.5% higher. In late January gold surged 3.1% higher in a week, fueling GDX soaring 10.7% in that short span! All gold-stock traders really care about is gold, and rightly so. Once gold gets moving again, the gold stocks are going to surge sharply higher.
There are two big catalysts that could start pushing gold considerably higher any day now. Gold-futures speculators drive much of gold’s short-term price action, and closely watch the US dollar’s fortunes for trading cues. The US Dollar Index (USDX) hit a major 20.5-month high in early March, and is likely to roll over soon. The Fed just kneecapped the US dollar by slashing its rate-hike outlook and prematurely killing QT!
Any meaningful dollar selling will drive big gold-futures buying, pushing the yellow metal higher. A good example of this just happened in mid-March. After hitting that major high, the USDX retreated 1.8% over the next couple weeks or so. Gold bottomed the very day the dollar topped, then rallied 2.2% in that span on gold-futures buying. GDX amplified that with a solid 3.9% advance. Gold stocks rally on a weaker dollar.
The US stock markets are way overextended and overvalued, also ready to roll over imminently. This week the monster likely-bear rally in the SPX had carried it back within just 2.0% of late September’s all-time record peak! But such lofty levels aren’t fundamentally-justified. The 500 elite SPX stocks left March trading at average trailing-twelve-month price-to earnings ratios way up at 26.4x, near bubble territory.
And even the Wall Street perma-bulls universally expect SPX earnings growth to be flat at best in 2019. This is a colossal slowdown from 2018’s 20%+ driven by Republicans’ massive corporate tax cuts. Very-expensive valuations aren’t sustainable without surging profits. As the general stock markets start selling off again, investors will resume returning to gold. Their capital inflows will drive its price higher, boosting the miners.
A great proxy for gold investment demand is the physical gold bullion held in trust for shareholders of the world’s largest and dominant gold ETF, the GLD SPDR Gold Shares. Back in early October with the SPX still just under record highs and complacency extreme, GLD’s holdings fell to a deep 2.6-year secular low. They started climbing again the very day the SPX first plunged, as American stock investors remembered gold.
Their big differential-buying pressure on GLD’s shares drove its holdings up 12.8% to 823.9 metric tons by late January. That helped push gold 8.9% higher over that span, which GDX leveraged with a nice 17.8% gain. Gold buying, whether from gold-futures speculators watching a flagging USDX or American stock investors worried about a rolling-over SPX, will push its price higher. That will bring traders back to gold stocks.
Gold’s upleg resuming is the key to reigniting gold stocks’ own upleg. But the major gold miners’ nearing Q1’19 earnings season should provide further fundamental justification for big gold-stock buying. Odds are their results will show big improvements over Q4’18, which should catch investors’ and speculators’ attention and entice them back. The main reason is higher prevailing gold prices really boosting earnings.
Every quarter I dive deeply into the major gold miners’ latest fundamentals. Several weeks ago I looked at the just-reported Q4’18 results from the top 34 GDX components. Those were lackluster, with lower production, higher costs, and lower prevailing gold prices. While gold averaged $1228 per ounce in Q4, the major gold miners’ average all-in sustaining costs rose to $889 per ounce. Profits were the difference at $339.
Q1 is going to look far better, which most gold-stock traders likely haven’t figured out yet given the apathy for this drifting sector. Thanks to the SPX’s severe near-bear correction largely in Q4, resurgent gold investment demand catapulted it a major 6.2% higher quarter-on-quarter to average over $1303 in Q1. The considerably-higher prevailing gold prices should combine with flat-to-lower AISCs to greatly boost earnings.
All-in sustaining costs generally don’t change much regardless of gold’s action. They are largely fixed as mines are being planned. Operating them generally requires similar levels of spending on infrastructure and employees quarter after quarter. Over the past 4 quarters, the GDX-top-34 gold miners’ AISCs have averaged $884, $856, $877, and $889 per ounce. That works out to a tight mean of $877, close to $875.
If the major gold miners produced gold last quarter at $877 per ounce, that implies $426 profits given the $1303 average prevailing gold prices in Q1. That would make for utterly-enormous 25.7% QoQ growth in gold-mining profits! Such massive earnings growth would really catch investors’ attention, especially with general stocks’ profits expected to be flat at best. Gold-stock fundamentals radically improve with higher gold.
And all this is happening during one of gold stocks’ strongest times of the year seasonally, their powerful spring rally. I explained this next chart in depth about a month ago in my latest spring-rally essay, and it’s important to remember. Gold stocks have powered sharply higher on average between mid-March to early June in modern bull-market years. We’re talking 12.2% average gains in the benchmark HUI gold-stock index!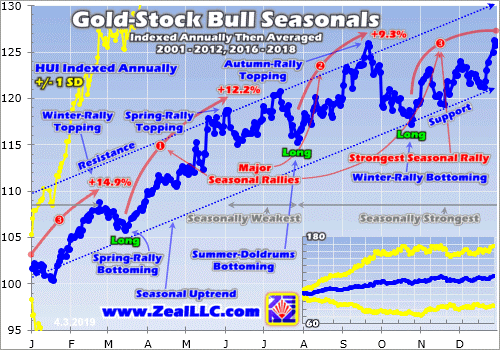
Not only is gold stocks’ spring rally underway, but it’s this sector’s second-strongest seasonal advance of the year. Even if much-stronger fundamentals weren’t likely, even if gold wasn’t due to continue powering higher on a weakening U.S. dollar and rolling-over stock markets, gold stocks tend to rally considerably in the spring. Greatly-improving earnings and stronger gold prices will really amplify this seasonal strength.
Strong seasonals act like tailwinds, boosting gold-stock uplegs fueled by improving technicals, sentiment, and fundamentals. When all these forces align, the gold-stock gains can be enormous. The last major spring rally happened in 2016, part of a monster gold-stock upleg where GDX skyrocketed 151.2% higher in just 6.4 months driven by a parallel strong gold upleg. GDX blasted 37.7% higher in that spring-rally span!
Although traders’ apathetic view on gold stocks in recent weeks is understandable, it isn’t justified at all. This sector has big potential to run much higher in the next couple months, which most traders aren’t yet ready for. The time to get deployed is of course before gold stocks surge higher again, when they can still be bought at relatively-low prices. This consolidation-drift window won’t last long, as gold is due to rally.
While investors and speculators can ride gold stocks’ next move higher in GDX, that is suboptimal. The largest gold miners dominating its weightings are really struggling with depleting production, retarding this entire ETF’s upside potential. Far-better gains will be won in the smaller mid-tier and junior gold miners. Plenty of them have superior fundamentals to the large majors, growing their outputs and driving down costs.
One of my core missions at Zeal is relentlessly studying the gold-stock world to uncover the stocks with superior fundamentals and upside potential. The trading books in both our popular weekly and monthly newsletters are currently full of these better gold and silver miners. Mostly added in recent months as gold stocks recovered from deep lows, our unrealized gains are already running as high as 66% this week!
To multiply your capital in the markets, you have to stay informed. Our newsletters are a great way, easy to read and affordable. They draw on my vast experience, knowledge, wisdom, and ongoing research to explain what’s going on in the markets, why, and how to trade them with specific stocks. As of Q4 we’ve recommended and realized 1076 newsletter stock trades since 2001, averaging annualized realized gains of +16.1%! That’s nearly double the long-term stock-market average. Subscribe today for just $12 per issue!
The bottom line is gold stocks are still marching higher despite the pall of apathy hanging over them. This upleg that excited traders back in February remains intact, with this sector simply pulling back within its uptrend. That has rebalanced sentiment, bleeding away greed. This basing has left gold stocks ready to rally to new upleg highs again, fueled by better gold prices greatly improving gold-mining fundamentals.
Gold-mining earnings are set to surge quarter-on-quarter due to gold’s own upleg powering higher. It too is on the verge of accelerating again as buyers return. A weaker U.S. dollar and rolling-over stock markets will motivate speculators and investors to buy gold again. And naturally the gold miners’ stocks will really leverage those gains like usual. Especially this time of year in the midst of their strong spring-rally season.
Adam Hamilton, CPA
April 9, 2019
Copyright 2000 – 2019 Zeal LLC (www.ZealLLC.com)
- There’s a time for gold stocks to rally… and a time for consolidation and retracement. Please click here now. We have joy, we have fun, we have gold price seasonality in the sun?
- To view seasonality on the daily gold chart, please click here now. Double-click to enlarge.
- The COMEX price of gold is determined mainly by commercial bank traders and hedge funds reacting to physical market supply versus demand. Currently, mine supply is relatively constant, central banks are net buyers, and the scrap market is stable.
- With supply essentially fixed, the seasonal ebb and flow of demand is mainly what moves the price.
- Roughly speaking, physical market demand strengthens from August until February and it weakens from February to August.
- It’s April now, so higher price enthusiasts need patience.
- Events related to the “fear trade” in the West can upset the seasonality apple cart, but a U.S.-China trade deal seems imminent, there is still some time left in the U.S. business cycle’s bull run, and the Fed’s recent actions are likely to reinvigorate stock buybacks.
- Unfortunately, in the short and medium term, there’s not much related to the Western fear trade that would “juice” gold ETF or COMEX contract demand enough to make up for the current seasonal physical market slackness.
- Trump is a business-oriented president, and the private sector in America is quite healthy. He’s supporting that health. In contrast, the government sector (in America and most of the Western world) is a horrifying mess.
- Trump, like his presidential predecessors, has lorded over a massive rise in government spending and debt. Unfortunately for Trump, he just happens to be president when the government’s ability to borrow ever-more money will soon meet a brick wall. Legendary hedge fund manager Ray Dalio believes the government may have only two years of “sand in the hourglass” before the demand for U.S. T-bonds fails to match the supply.
- I’ve suggested the U.S. government could stagger forwards for another 3-4 years before a bond market supernova event occurs. Regardless, the bottom line is that the next financial markets meltdown is set to be a government crisis much more than a private sector crisis. The government’s dollar is like a corporation’s stock, and it will burn as its bond market burns.
- I’ve also predicted that unlike the late 1930s crisis that was followed by U.S. war with Germany, Japan, and Italy, this crisis could cause a war within America, pitting the rich against the poor. It could get quite ugly, especially for citizens with no gold.
- An institutional gold buying frenzy would occur in even the mildest version of this projected scenario. A collapse of the U.S. bond market would smash other Western government bond markets too.
- In a government bond market crisis, all roads lead to gold!
- Also, QE doesn’t work in this type of crisis, because it’s no longer a booster shot for private sector stocks, businesses, and bonds.
- In 2008-2014, QE was mostly deflationary. When it’s used again, it will be used to fill a demand gap for government bonds. In that situation, QE is highly inflationary and could even become “hyperinflationary”.
- Please click here now. Double-click to enlarge this GDX chart. The weak demand season for gold has only been underway since February, so patience is required.
- Regardless, the price action of GDX and its leading component stocks has been impressive. Most of the strong season gains are holding and the price action is essentially sideways now.
- More “bump and grind” trading is expected but the gold mining stocks market is generally very healthy.
- How should investors deal with the weak demand season for gold in regards to GDX and gold stocks in general? Well, for one possible solution, please click here now. Double-click to enlarge this hourly bars swing trades chart for GDX.
- My guswinger.com trade alert service can help investors ease the weak season doldrums. I use triple-leveraged ETFs like NUGT, JNUG, DUST, & JDST… so nobody gets bored! I also take all the trades myself, but only after I send them by cell phone text and email to all the happy subscribers.
- I also recommend items like bitcoin (which is up about 15% this morning), and I’m introducing bond market trades for my main gracelandupdates.com newsletter. That’s partly to get everyone ready for the coming U.S. government bond market supernova explosion. It’s also to help investors understand the more mundane bond market price drivers so they get modestly and consistently richer while waiting for “the big bang”.
- Please click here now. Double-click to enlarge. TLT-NYSE is a bond market ETF. The next signal will be a sell, which means interest rates will rise in the short term. That’s likely because institutional investors see a U.S.-China trade deal as imminent, and so they are moving money from bonds to stocks.
- Because investors are taking more risk now, fear trade demand for gold is softening at a time when love trade demand is seasonally soft. This is just short-term noise. A bond market supernova event lies ahead. During normal times, higher rates are usually mildly negative for gold. During extraordinary times featuring a U.S. government bond market wipeout, rates soar but an institutional buying frenzy means that gold market investors need to prepare for vastly higher prices!
Special Offer For Website Readers: Please send me an Email to freereports4@gracelandupdates.com and I’ll send you my free “Riding The Range!” GDXJ and SILJ report. I highlight how to play the weak season range for these ETFs and for six exciting junior miners!
Stewart Thomson
Graceland Updates
Email:
Stewart Thomson is a retired Merrill Lynch broker. Stewart writes the Graceland Updates daily between 4am-7am. They are sent out around 8am-9am. The newsletter is attractively priced and the format is a unique numbered point form. Giving clarity of each point and saving valuable reading time.
Risks, Disclaimers, Legal
Stewart Thomson is no longer an investment advisor. The information provided by Stewart and Graceland Updates is for general information purposes only. Before taking any action on any investment, it is imperative that you consult with multiple properly licensed, experienced and qualified investment advisors and get numerous opinions before taking any action. Your minimum risk on any investment in the world is: 100% loss of all your money. You may be taking or preparing to take leveraged positions in investments and not know it, exposing yourself to unlimited risks. This is highly concerning if you are an investor in any derivatives products. There is an approx $700 trillion OTC Derivatives Iceberg with a tiny portion written off officially. The bottom line:
Are You Prepared?
Stop me if you’ve heard this before. Precious Metals disappointed again.
The miners were leading the metals but the metals broke down from bear flag patterns and that took the miners lower, suggesting an interim top is in place.
The technicals suggest weakness could be ahead for the sector but the fundamentals are finally turning bullish.
Before we get to fundamentals, let’s look at the technicals. The weekly candle chart of GDX and GDXJ is below.
After last week’s failure to break weekly resistance, GDX now has resistance at $23 and GDXJ has resistance at $34.
The near-term trend is probably lower but if the Fed is going to cut rates later this year, I’d expect the miners to eventually make a higher low which could also look like the right shoulder of an irregular head and shoulders bottoming pattern.
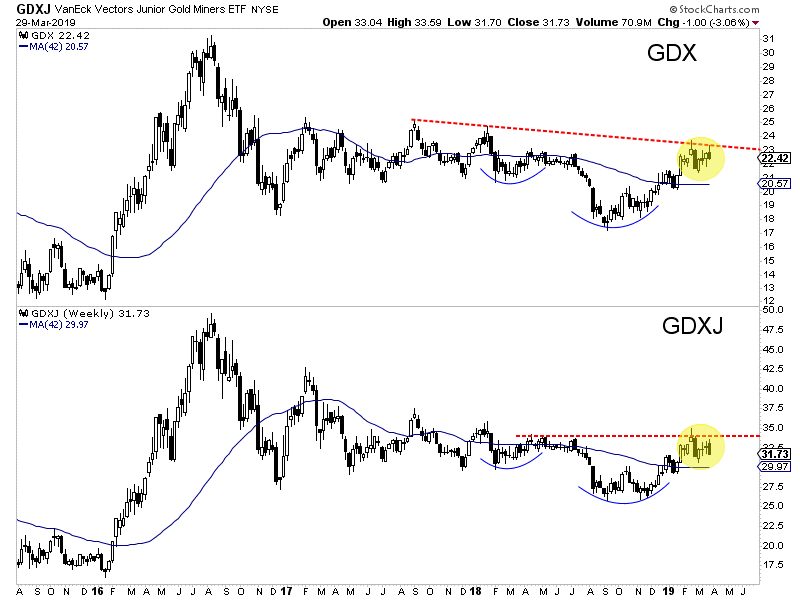
As we noted last week, it wasn’t until after the first rate cut (in the previous two occurrences) that precious metals began to outperform.
The chart below shows the pattern that leads to strong performance in gold stocks. The 2-year yield starts to decline, the Fed pauses, the yield curve steepens, the Fed cuts and then gold stocks perform.
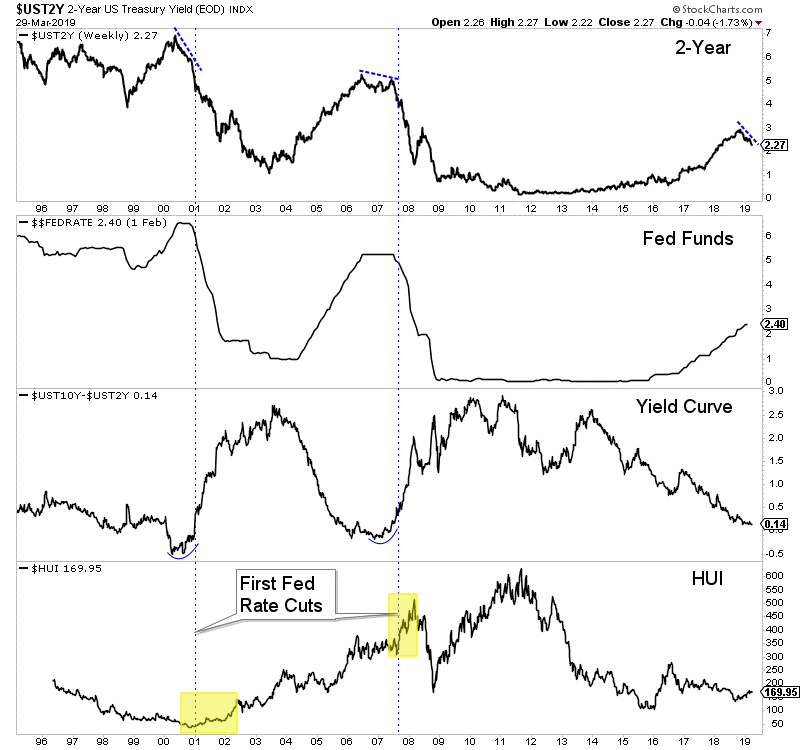
With the current context and history, we can make the case that gold stocks and Gold will not officially move into a bull market until the Fed makes its first rate cut. Fed funds futures are now essentially discounting a rate cut by December and showing nearly a 30% chance of two rate cuts by January 2020.
Bonds are overbought (and yields are oversold) and so these markets could see a counter trend move which would align with weakness in precious metals.
However, precious metals bulls should not be dissuaded by weakness as a rate cut is likely coming within the next 12 months and probably sooner. The weeks and months ahead could prove to be an especially opportune time to position in advance of the first cut and a confirmed new bull market in gold stocks. To learn what stocks we are buying and think have 3x to 5x potential, consider learning more about our premium service.
April 3, 2019
Jordan Roy-Byrne
The market for natural resources remains subdued, but there are pockets of strength. In the Uranium sector, Energy Fuels, IsoEnergy & Appia Energy are up an average of ~150% from their respective 52-week lows. In Copper, Trilogy Metals & Pacific Booker are up an average of ~250%. Good things are happening, but not in Cobalt, at least not yet.
Could This Pure-Play, North American Cobalt Junior Shine Again?
However, when natural resource stocks gather steam, other sectors will join the party, and select Cobalt names will be invited. That doesn’t mean they all will, many companies are broken beyond repair. Last year there were over 100 Cobalt juniors listed in North America alone. Most are still-listed, but many can’t raise a penny to move projects forward. I believe there are fewer than 10 Cobalt names worth looking at.
One of 2017’s blue chip Cobalt juniors that I think has ample room for upside (again) this year is First Cobalt Corp. (TSX-V: FCC) / (OTCQX: FTSSF) / (ASX: FCC). The Company just raised C$1.6 M. Sell-side analysts peg the stock price in a range of C$0.70 to C$1.00. Yet, the current price is C$0.145. Without going into the analyst’s methodologies, (I have not seen the reports), I can see why they’re bullish. But before continuing, we need to discuss the pink elephant in the room – Cobalt prices – you may have noticed that they are down quite a bit.
But, What About the Cobalt Price?
That’s a big problem, but only for readers who believe that Cobalt will remain below US$15/lb. If one does not believe the price will rebound, then First Cobalt Corp. is not the stock for you. I’m not suggesting the price will soon soar, but a near doubling in the price to US$25/lb. in the next year could propel the best positioned companies higher, perhaps a lot higher. The price was > US$40/lb. < 12 months ago, and at US$25/lb. < 3 months ago.
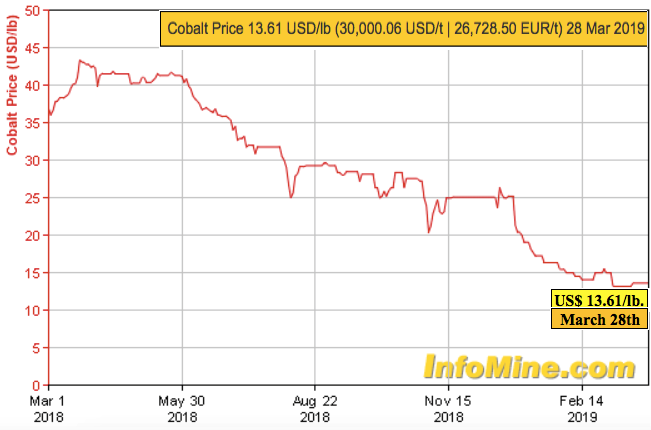
For those fearing that Cobalt is being engineered out of Electric Vehicle batteries due to high cost and/or security of supply concerns, they are only partially correct. I defer to industry experts Benchmark Mineral Intelligence. In February Simon Moores said, “As the energy storage revolution continues to pick up pace, Cobalt demand is set to rise 4 times by 2028.” That would be a 15% CAGR. The 8.1.1 chemistry is Nickel-Manganese-Cobalt in the ratio of 8:1:1.
Experts That I Trust See Strong Cobalt Demand Through 2028
Cobalt was designated a strategic mineral in the U.S. and in many other countries. I believe it will remain in strong demand, and that North American sources will be highly sought after. There’s growing discussion about the 2021 & 2022 EV model years being a global tipping point. Security of supply dictates that Cobalt needs to be locked up by end users well before then. The U.S. is not low on Cobalt supply…. it has NO domestic Cobalt supply!
In addition to controlling ~45% of the past-producing Cobalt, Ontario, Cobalt-Silver camp, First Cobalt owns 100% of a fully-permitted, primary Cobalt Refinery. It can produce Cobalt Sulphate or Metallic Cobalt products and is the only one of its kind in North America. Management believes it could be up and running in 18-24 months.
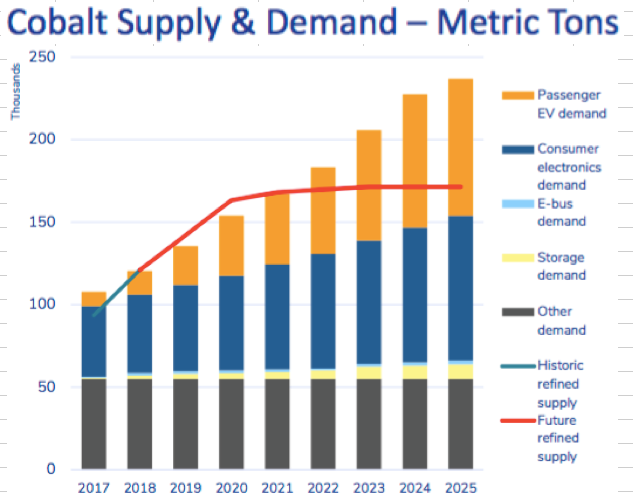
Very Few Cobalt Juniors Have Hard Assets, like a Permitted Cobalt Refinery
Mining services firm Hatch estimated the Refinery’s replacement value at US$ 100M = C$ 133M. That figure does not include the time value of money, the 4-6 years it might take to get a new refinery designed, permitted, funded, constructed & commissioned. Compare that to the Company’s Enterprise Value [market cap + debt – cash] of ~C$43M. The estimated replacement value of the Refinery alone is 3 times First Cobalt’s entire Enterprise Value! There are few options outside of China to produce Cobalt Sulfate for the battery market, and management says there’s no other near-term refining prospect in North America.
How much revenue could the Refinery generate? At the Company’s base case of 1,000 tonnes/yr., at US$20/lb., that’s roughly US$44M = ~C$59M in revenue. Energy Fuels, an established uranium / vanadium producer, trades at 11.8x trailing 12-month revenue. SQM, a large lithium producer, trades at 4.8x. Bushveld Minerals, a vanadium player, trades at 6.2x, Katanga Mining, a Copper-Cobalt producer with operations in the DRC, trades at 6.4x. Those companies average ~7x trailing revenue. All have refineries or processing facilities. I’m not saying that First Cobalt will or should trade at 7x revenue. However, one can see the potential value of owned & operated hard assets.
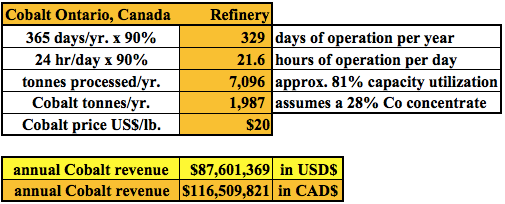
In the bare bones analysis above, I estimate what revenue the Refinery could generate operating 90% of the days in a year and 90% of the hours in a day. Combined, that’s 81% annual capacity utilization. I assume a 28% Cobalt concentrate feedstock, and a 90% recovery of Cobalt. At a price of US$20/lb., annualized gross revenue would be ~C$117M. At US$25/lb. it would be ~C$146M, and at US$30/lb. gross revenue would be ~C$175M. Although US$30/lb. Cobalt seems high today, it might not be in 2 years. As mentioned, the price was > US$40/lb. less than 12 months ago. However, to be clear, there’s no guarantee of a meaningful rebound in price.
I fear that investors are treating the estimated replacement value of the Refinery like they would the Net Present Value (“NPV“) of a mining project. That would be a mistake. The estimated value of a hard asset is more reliable than the NPV of a project, especially if the NPV comes from a PEA or PFS. Management says the Refinery can be monetized (cash flowing) in 18-24 months. By definition, a NPV is the present value of future cash flows stretching out decades.
First Cobalt’s Refinery Has Estimated Replacement Value of US$100M
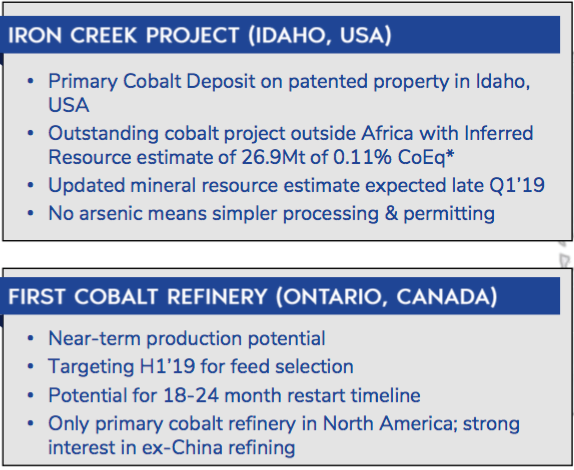
First Cobalt is trading at ~0.33x the estimated replacement value of the Refinery alone. That means investors today get the Company’s flagship project in the U.S. for free, plus 50 past-producing mine sites in Cobalt, Ontario, with a large margin for error embedded in the estimated value of the Refinery.
There’s considerable risk for mining projects at PEA or PFS-stage. First Cobalt’s Refinery simply does not carry that kind of risk. Management needs to arrange funding to get it into production, that’s the primary risk. And, a higher Cobalt price would be nice. However, unlike for mining projects, the Company does not need to raise hundreds of millions of dollars. It needs ~US$25M (includes a 30% contingency). That funding should be achievable through a combination of debt, equity, streaming/royalty financing, and/or selling a portion of the asset.
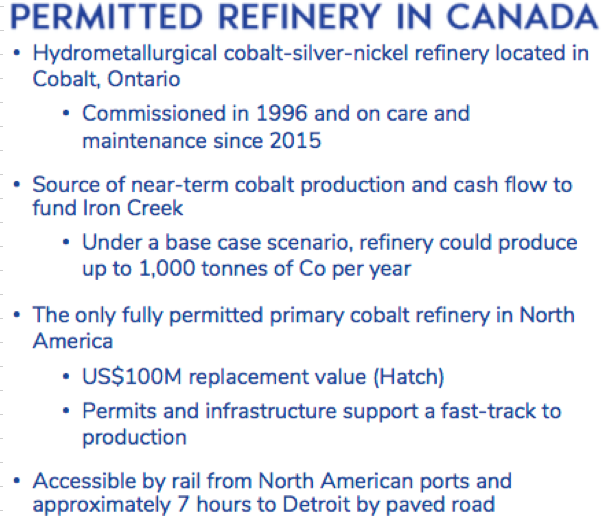
U.S. Project Iron Creek has 45M lbs. Cobalt + 175M lbs. Copper, With Substantial Upside
Nearly 1,000 words in and I haven’t discussed First Cobalt’s flagship project, Iron Creek in Idaho (USA). There are very few primary Cobalt projects in the world. This one has a resource (26.9 M tonnes) that will be upsized by up to 50% (my guess only) this quarter. The existing resource contains an estimated 45M pounds Cobalt + 175M pounds Copper. Importantly, there’s no arsenic, which means simpler processing & permitting. The grade is low, so I asked CEO Trent Mell about that. His response,
“One can certainly point to some high-grade Cobalt drill results that have been released over the past couple of years, but these are typically vein-style deposits that struggle to hold together in resource modeling. In other words, grade is worthless without sufficient tonnage. By contrast, there are a number of Australian Nickel-Cobalt deposits that have the tonnage but lower grades than we have at Iron Creek.”
The rule of law, plus strong access to infrastructure, plus superior proximity to U.S. markets, make Iron Creek a desirable project compared to the dozens of projects & mines in Africa, a continent that accounts for up to 75% of global supply. Sourcing Cobalt from North America is becoming more important by the day. It will be interesting to see the size of the new resource and how much larger still the resource could become next year.
Iron Creek remains open in all directions. That suggests the possibility of a much larger resource. If the Company could double the size, that would greatly enhance the indicative economics of a PEA or PFS. In addition, CEO Trent Mell has mentioned the potential contribution from Copper. He said that up to one third of Iron Creek’s revenue could come from Copper. That would be a tremendous credit against the primary Cobalt production costs. I’m a big fan of Copper, the world cannot have an energy revolution (clean/green renewable energy sources), or the electrification of passenger & commercial transportation, or the building & rebuilding of critical infrastructure, without Copper.
Conclusion
I said that there are 10 or fewer Cobalt juniors worth looking at. First Cobalt (TSX-V: FCC) / (OTCQX: FTSSF) / (ASX: FCC) is high on the list. It has a lot of boxes checked, but at the same time, is still relatively early-stage. So, there’s high return potential, with commensurate high risk. As more boxes get checked, like the upcoming resource update at Iron Creek, ongoing metallurgical testing, lining up feedstock & funding sources for the Refinery…. this de-risking should get noticed by the market. That, and the estimated value of the Refinery being 3 times larger than the Company’s entire Enterprise Value, suggest today’s share price could be an attractive entry point.
{latest Press Releases}
Disclosures: The content of this article is for information only. Readers fully understand and agree that nothing contained herein, written by Peter Epstein of Epstein Research [ER], (together, [ER]) about First Cobalt Corp., including but not limited to, commentary, opinions, views, assumptions, reported facts, calculations, etc. is not to be considered implicit or explicit investment advice. Nothing contained herein is a recommendation or solicitation to buy or sell any security. [ER] is not responsible under any circumstances for investment actions taken by the reader. [ER] has never been, and is not currently, a registered or licensed financial advisor or broker/dealer, investment advisor, stockbroker, trader, money manager, compliance or legal officer, and does not perform market making activities. [ER] is not directly employed by any company, group, organization, party or person. The shares of First Cobalt Corp. are highly speculative, not suitable for all investors. Readers understand and agree that investments in small cap stocks can result in a 100% loss of invested funds. It is assumed and agreed upon by readers that they will consult with their own licensed or registered financial advisors before making any investment decisions.
At the time this article was posted, Peter Epstein owned shares of First Cobalt Corp. and the Company was an advertiser on [ER]. Readers understand and agree that they must conduct their own due diligence above and beyond reading this article. While the author believes he’s diligent in screening out companies that, for any reasons whatsoever, are unattractive investment opportunities, he cannot guarantee that his efforts will (or have been) successful. [ER] is not responsible for any perceived, or actual, errors including, but not limited to, commentary, opinions, views, assumptions, reported facts & financial calculations, or for the completeness of this article or future content. [ER] is not expected or required to subsequently follow or cover events & news, or write about any particular company or topic. [ER] is not an expert in any company, industry sector or investment topic.
The major silver miners have rallied higher on balance in recent months, enjoying a young upleg. That’s a welcome change after they suffered a miserable 2018. Times are tough for silver miners, since silver’s prices have languished near extreme lows relative to gold. That has forced many traditional silver miners to increasingly diversify into gold. The major silver miners’ recently-released Q4’18 results illuminate their struggles.
Four times a year publicly-traded companies release treasure troves of valuable information in the form of quarterly reports. Required by the U.S. Securities and Exchange Commission, these 10-Qs and 10-Ks contain the best fundamental data available to traders. They dispel all the sentiment distortions inevitably surrounding prevailing stock-price levels, revealing corporations’ underlying hard fundamental realities.
While 10-Qs with filing deadlines of 40 days after quarter-ends are required for normal quarters, 10-K annual reports are instead mandated after quarters ending fiscal years. Most silver miners logically run their accounting on calendar years, so they issue 10-Ks after Q4s. Since these annual reports are larger and must be audited by independent CPAs, their filing deadlines are extended to 60 days after quarter-ends.
The definitive list of major silver-mining stocks to analyze comes from the world’s most-popular silver-stock investment vehicle, the SIL Global X Silver Miners ETF. Launched way back in April 2010, it has maintained a big first-mover advantage. SIL’s net assets were running $362m in mid-March near the end of Q4’s earnings season, 6.1x greater than its next-biggest competitor’s. SIL is the leading silver-stock benchmark.
In mid-March SIL included 21 component stocks, which are weighted somewhat proportionally to their market capitalizations. This list includes the world’s largest silver miners, including the biggest primary ones. Every quarter I dive into the latest operating and financial results from SIL’s top 17 companies. That’s simply an arbitrary number that fits neatly into the table below, but still a commanding sample.
As of mid-March these major silver miners accounted for fully 97.7% of SIL’s total weighting. In Q4’18 they collectively mined 75.5m ounces of silver. The latest comprehensive data available for global silver supply and demand came from the Silver Institute in April 2018. That covered 2017, when world silver mine production totaled 852.1m ounces. That equates to a run rate around 213.0m ounces per quarter.
Assuming that mining pace persisted to Q4’18, SIL’s top 17 silver miners were responsible for about 35% of world production. That’s relatively high considering just 28% of 2017’s global silver output came from primary silver mines! 36% came from lead/zinc mines, 23% from copper, and 12% from gold. 7/10ths of all silver produced is merely an other-metals-mining byproduct. Primary silver mines and miners are fairly rare.
Scarce silver-heavy deposits are required to support primary silver mines, where over half their revenue comes from silver. They are increasingly difficult to discover and ever-more expensive to develop. And silver’s challenging economics of recent years argue against miners even pursuing it. So even traditional major silver miners have shifted their investment focus into actively diversifying into far-more-profitable gold.
Silver price levels are best measured relative to prevailing gold prices, which overwhelmingly drive silver price action. Q4’18 saw the worst Silver/Gold Ratio witnessed in nearly a quarter century! The SGR collapsed to 86.3x in late November, an extreme 23.8-year secular low. The raw silver price fell under $14 in mid-November, a major 2.8-year low. With such a rotten silver environment, silver miners had to struggle.
The largest primary silver miners dominating SIL’s ranks are scattered around the world. 11 of the top 17 mainly trade in US stock markets, 3 in the United Kingdom, and 1 each in South Korea, Mexico, and Peru. SIL’s geopolitical diversity is good for investors, but makes it difficult to analyze and compare the biggest silver miners’ results. Financial-reporting requirements vary considerably from country to country.
In the U.K., companies report in half-year increments instead of quarterly. Some silver miners still publish quarterly updates, but their data is limited. In cases where half-year data is all that was made available, I split it in half for a Q4 approximation. Canada has quarterly reporting, but the deadlines are looser than in the States. Some Canadian miners trading in the U.S. really drag their feet in getting quarterly results out.
The big silver companies in South Korea, Mexico, and Peru present other problems. Their reporting is naturally done in their own languages, which I can’t read. Some release limited information in English, but even those translations can be difficult to interpret due to differing accounting standards and focuses. It’s definitely challenging bringing all the quarterly data together for the diverse SIL-top-17 silver miners.
But analyzing them in the aggregate is essential to understand how they are faring. So each quarter I wade through all available operational and financial reports and dump the data into a big spreadsheet for analysis. Some highlights make it into this table. Blank fields mean a company hadn’t reported that data by mid-March, as Q4’s earnings season wound down. Some of SIL’s components report in gold-centric terms.
The first couple columns of this table show each SIL component’s symbol and weighting within this ETF as of mid-March. While most of these stocks trade on US exchanges, some symbols are listings from companies’ primary foreign stock exchanges. That’s followed by each miner’s Q4’18 silver production in ounces, along with its absolute year-over-year change. Next comes this same quarter’s gold production.
Nearly all the major silver miners in SIL also produce significant-to-large amounts of gold! That’s truly a double-edged sword. While gold really stabilizes and boosts silver miners’ cash flows, it also retards their stocks’ sensitivity to silver itself. So the next column reveals how pure these elite silver miners are, approximating their percentages of Q4’18 revenues actually derived from silver. This is calculated one of two ways.
The large majority of these top SIL silver miners reported total Q4 revenues. Quarterly silver production multiplied by silver’s average price in Q4 can be divided by these sales to yield an accurate relative-purity gauge. When Q4 sales weren’t reported, I estimated them by adding silver sales to gold sales based on their production and average quarterly prices. But that’s less optimal, as it ignores any base-metals byproducts.
Next comes the major silver miners’ most-important fundamental data for investors, cash costs and all-in sustaining costs per ounce mined. The latter directly drives profitability which ultimately determines stock prices. These key costs are also followed by YoY changes. Last but not least the annual changes are shown in operating cash flows generated and hard GAAP earnings, with a couple exceptions necessary.
Percentage changes aren’t relevant or meaningful if data shifted from positive to negative or vice versa, or if derived from two negative numbers. So in those cases I included raw underlying data rather than weird or misleading percentage changes. This whole dataset together offers a fantastic high-level read on how the major silver miners are faring fundamentally as an industry. They definitely struggled in Q4.
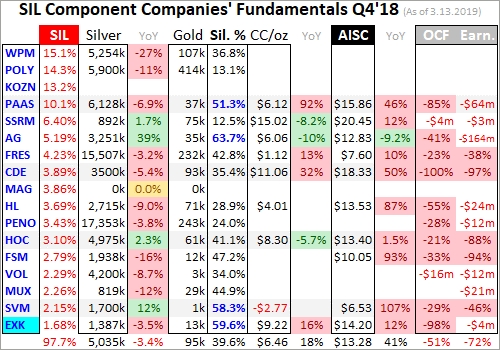
SIL’s performance certainly reflects the challenges of profitably mining silver when its price languishes so darned cheap. In 2018 SIL plunged 23.3%, amplifying silver’s own 8.6% loss by 2.7x. Silver’s weakest prices relative to gold in almost a quarter century wreaked havoc on silver-mining sentiment. Investors didn’t want anything to do with silver miners, and their own managements seemed almost as bearish.
In Q4’18 silver’s average price dropped 12.9% YoY to just $14.53. That was disproportionally worse than gold, which saw its average price decline 3.8% YoY. Such deep lows exacerbated the pall of despair that is plaguing the silver-mining industry. While production decisions aren’t made quarter by quarter, it sure felt like the seriously-weak silver prices were choking off output. Production is the lifeblood of silver miners.
The SIL top 17’s collective silver production fell 3.9% YoY in Q4’18 to 75.5m ounces. Interestingly that’s right in line with what the major gold miners of GDX experienced that quarter, a 4%ish YoY slide when adjusted for mega-mergers. The major silver miners could be experiencing a peak-gold-like decline in their silver production. Peak silver isn’t discussed as much, but world silver mine output has been shrinking.
According to the Silver Institute’s latest annual World Silver Survey current to 2017, world silver mined supply peaked at 895.1m ounces in 2015. It nosed over a slight 0.7% in 2016, but accelerated sharply to another 4.1% drop in 2017. So the SIL top 17’s output contraction in Q4’18 is just continuing this trend. Silver mining has been starved of capital since 2013, when silver plummeted 35.6% on a 27.9% gold collapse!
Silver-mining stocks have been something of a pariah to even contrarian investors for much of the time since then. That’s left their prices largely drifting at relatively-low levels, making it more difficult to obtain financing to expand operations. Investors haven’t been interested in silver-stock shares, leaving miners wary of issuing more to raise capital with stock prices so low. That can really dilute existing shareholders.
With the major silver miners unable or unwilling to invest in developing new silver mines and expansions to offset their depleting output, it has to decline. 11 of the 15 top SIL components reporting Q4’18 silver production mined fewer ounces than in Q4’17. All 15 together averaged silver output shrinkage of 3.4% YoY. That’s a sharp contrast to these same miners’ gold production, which grew an average of 7.9% YoY.
In overall total terms, the SIL top 17’s 1.4m ounces of gold mined in Q4’18 still slipped 1.5% YoY. But with total silver production sliding more than gold, the major silver miners’ long ongoing diversification into the yellow metal continued. At the bombed-out silver prices of recent years, the economics of gold mining are way superior to silver mining. The traditional major silver miners are painfully aware of this and acting on it.
Silver mining is as capital-intensive as gold mining, requiring similar large expenses to plan, permit, and construct new mines, mills, and expansions. It needs similar fleets of heavy excavators and haul trucks to dig and move the silver-bearing ore. Similar levels of employees are necessary to run silver mines. But silver generates much-lower cash flows than gold due its lower price. Silver miners have been forced to adapt.
The major silver miners continued their trend of diversifying into gold at silver’s expense in Q4’18. SIL’s largest component Wheaton Precious Metals was a great example of this. It used to be known as Silver Wheaton, a pure silver-streaming play. Back in May 2017 it changed its name and symbol to reflect the fact it would increasingly diversify into gold. In Q2’17 WPM streamed 7,192k and 80k ounces of silver and gold.
Back then fully 61.9% of WPM’s sales still came from silver, qualifying it as a primary “miner”. Fast-forward to Q4’18 and WPM’s silver output plunged 27.1% YoY to 5,254k ounces! But its gold mined rose 10.5% YoY to 107k ounces. That pushed the implied percentage of WPM’s revenues down to just 36.8% silver, way below the 50% primary threshold. Like it or not, the silver-mining industry is increasingly turning yellow.
This strategic shift is good and bad. The major silver miners’ growing proportion of gold output is helping these companies weather this long dark winter in silver prices. But lower percentages of sales generated from silver leaves their stock prices and SIL less responsive to silver price moves. Silver stocks’ leverage to silver is the main reason investors buy them and their ETFs. Their shift into gold is really degrading that.
In Q4’18 the top 17 SIL silver miners averaged just 39.6% of their sales from silver. Only Pan American Silver, First Majestic Silver, Silvercorp Metals, and Endeavour Silver qualified as primary silver miners with over half their revenues from the white metal. While still low, that 39.6% average of SIL was actually considerably better than Q4’17’s 36.0% despite the ongoing transition into gold. But that’s not a trend shift.
In Q4’17 SIL’s components included Tahoe Resources, which was bought out by Pan American Silver in mid-November. Tahoe owned what was once the world’s largest silver mine, Escobal in Guatemala. It produced 5,700k ounces in Q1’17! But Guatemala’s government shut it down after a frivolous lawsuit by anti-mining activists. I last discussed the whole Tahoe saga in depth in my Q3’18 essay on silver miners’ results.
By Q4’17 Escobal’s production had dropped to zero, leaving Tahoe’s silver purity at 0.0%. That dragged down the SIL top 17’s average, leaving it artificially low. But Pan American buying Tahoe for both its gold production and hopes of convincing Guatemala to allow Escobal to reopen killed Tahoe’s stock and purged it from SIL’s ranks. Endeavour Silver edged into the top 17 to take its place, with 59.6% of sales from silver.
If Tahoe’s silver purity is excluded from Q4’17’s overall calculation while Endeavour is added, SIL would have averaged 39.9%. So in comparable terms Q4’18’s 39.6% remains a declining trend. Primary silver miners continue to get rarer, they may even be a dying breed. That has forced SIL’s managers to really scrape the bottom of the barrel to find components to fill their ETF. That’s what happened with Korea Zinc.
This is no silver miner, but a base-metals smelter! In mid-March it commanded a hefty 13.2% weighting in SIL, over 1/8th the total. I’ve searched and searched, but can’t find English financial reports for this company. But in 2017 it reported smelting 66.2m ounces of silver, a 16.6m quarterly pace. I bet there’s not a single SIL investor looking for base-metals-smelting exposure! Global X really ought to remove it entirely.
The capital allocated to Korea Zinc could be spread across the remaining SIL components proportionally, reallocating and modestly upping their weightings. But the fact Korea Zinc even ever made it into SIL is a testament to how rarified the ranks of major silver miners have become. That won’t reverse unless silver mean reverts dramatically higher relative to gold and remains at much-better price levels for years on end.
With SIL-top-17 silver production sliding 3.9% YoY in Q4’18, the per-ounce mining costs should’ve risen proportionally. Silver-mining costs are largely fixed quarter after quarter, with actual mining requiring the same levels of infrastructure, equipment, and employees. So the lower production, the fewer ounces to spread mining’s big fixed costs across. SIL’s major silver miners indeed reported far-higher costs last quarter.
There are two major ways to measure silver-mining costs, classic cash costs per ounce and the superior all-in sustaining costs. Both are useful metrics. Cash costs are the acid test of silver-miner survivability in lower-silver-price environments, revealing the worst-case silver levels necessary to keep the mines running. All-in sustaining costs show where silver needs to trade to maintain current mining tempos indefinitely.
Cash costs naturally encompass all cash expenses necessary to produce each ounce of silver, including all direct production costs, mine-level administration, smelting, refining, transport, regulatory, royalty, and tax expenses. In Q4’18 these SIL-top-17 silver miners reported cash costs averaging $6.46 per ounce. While that surged 37.0% YoY, it still remains far below prevailing prices. Silver miners face no existential threat.
The major silver miners’ average cash costs vary considerably quarter-to-quarter, partially depending on whether or not Silvercorp Metals happens to be in the top 17 or not. This Canadian company mining in China has negative cash costs due to massive byproduct credits from lead and zinc. So over the past couple years, SIL-top-17 average cash costs have swung wildly ranging all the way from $3.95 to $6.75.
Way more important than cash costs are the far-superior all-in sustaining costs. They were introduced by the World Gold Council in June 2013 to give investors a much-better understanding of what it really costs to maintain silver mines as ongoing concerns. AISCs include all direct cash costs, but then add on everything else that is necessary to maintain and replenish operations at current silver-production levels.
These additional expenses include exploration for new silver to mine to replace depleting deposits, mine-development and construction expenses, remediation, and mine reclamation. They also include the corporate-level administration expenses necessary to oversee silver mines. All-in sustaining costs are the most-important silver-mining cost metric by far for investors, revealing silver miners’ true operating profitability.
The SIL-top-17 silver miners reported average AISCs of $13.28 in Q4’18, surging 31.0% higher YoY! That is troubling, climbing vexingly close to silver’s latest major secular low of $13.99 in mid-November. While Q1’19’s average silver price of $15.55 so far is much better, these profit margins are still tight for a long-struggling industry. Thankfully the major silver miners’ cost structure is better than that number implies.
The highest AISCs by far in Q4 came from SSR Mining, which was formerly known as Silver Standard Resources. They climbed another 11.7% YoY to nosebleed levels of $20.45 per ounce! But that’s not a normal situation. SSRM too is shifting into gold, gradually winding down its old Pirquitas silver mine. As it depletes, there are fewer ounces to spread its fixed costs of mining across which drives up per-ounce costs.
Excluding SSRM, the rest of the SIL top 17 reporting AISCs in Q4’18 averaged a more-reasonable $12.48 per ounce. And these major silver miners providing AISC outlooks for 2019 projected similar levels near $12.70. This is still on the high side, as the SIL top 17’s AISCs ran $10.14, $10.92, $10.93, and $13.53 in the preceding four quarters. But $12.48 is still profitable even with silver seriously languishing relative to gold.
Silver-mining profits really leverage higher silver prices, and big earnings growth attracts in investors to bid up stock prices. In Q4’18 silver averaged $14.53 per ounce. At the SIL top 17’s average AISCs ex-SSRM of $12.48, that implies the major silver miners as an industry were earning profits of $2.05 per ounce. Those are going to grow majorly this quarter. The almost-over Q1’19 has seen silver average $15.55.
With Q4’s AISCs among the highest silver miners have reported in years, they could very well decline in Q1. But assume they remain stable near $12.48. That implies the major silver miners earned about $3.07 per ounce in Q1. A mere 7.0% quarter-on-quarter silver rally could catapult silver-mining profits a massive 49.8% higher QoQ! This awesome profits leverage to silver is why silver stocks amplify silver’s upside.
Of course the greater a silver miner’s exposure to silver, the more its stock will surge as silver advances. First Majestic Silver had the highest silver purity in Q4 at 63.7% of its revenues derived from silver. Thus AG’s stock should thrive with higher silver prices. But SSR Mining’s mere 12.5% silver purity pretty much leaves silver irrelevant. As SSRM is overwhelmingly a primary gold miner, higher silver won’t move the needle.
So investors who want classic silver-stock exposure to leverage silver uplegs need to be smart about how they deploy capital. While buying SIL is easy, it is dominated by primary gold miners. And who on earth wants over 1/8th of their investment wasted in a giant base-metals smelter? The greatest gains in future silver uplegs will come in the stocks with the most silver exposure. They are what investors need to own.
Despite slowing silver production and their ongoing diversification into gold, the major silver miners still remain well-positioned to see huge profits growth as silver marches higher. Especially the primary ones. But with silver hammered to major secular lows in Q4’18, the accounting results of the SIL-top-17 silver miners were quite weak. 3.9%-lower production combined with 12.9%-lower average silver prices wasn’t pretty.
The following accounting comparisons exclude SIL’s largest component WPM. For some reason it waits until the end of March to report Q4 results, which is incredibly disrespectful to its shareholders. Q4 data is getting stale with Q1 ending. There’s no excuse to delay reporting with modern automated accounting systems gathering all data in real-time. For workflow reasons I had to write this essay before WPM reported.
Ex-WPM, the SIL top 17 sold $3.4b worth of metals in Q4’18, which was down 10.9% YoY. Given lower silver production and much-lower silver prices that was relatively good. But cash flows generated from operations collapsed 52.5% YoY to $444m in Q4. That means less capital available to finance mine expansions and new mine builds. Overall corporate treasuries at these companies fell 33.0% YoY to $2.6b.
Surprisingly the hard-GAAP-earnings picture actually improved over Q4’17, though still remained weak. Excluding WPM, the SIL-top-17 silver miners lost $202m in Q4’18. That cut in half Q4’17’s total losses of $412m. But both quarters’ accounting profits were skewed by big non-cash impairment charges. When lower-silver-price forecasts reduce economic reserves at mines, those perceived losses must be recognized.
AG wrote off $168m of its mines’ carrying value on its books in Q4’18 due to lower reserves driven by lower metals prices. The grades within individual ore bodies vary widely. Silver that is economic to mine at $20 might not be worth extracting at $15, so companies have to cut their reserves and flush those non-cash losses through their income statements. PAAS reported a smaller $28m impairment charge as well.
Together these two $196m writedowns alone accounted for 97% of the major silver miners’ Q4 losses. But even without them most of the other SIL top 17 still reported mild-to-moderate GAAP losses with the silver prices so darned low. The comparable Q4’17 results had big writedowns too, primarily $547m by Volcan to meet new accounting standards demanded by another company that bought 55% of its stock.
While the major gold miners had no excuse for their huge impairment charges in Q4’18 since gold was stable last year, silver miners did since silver was hammered. As silver mean reverts higher with gold and outpaces its rallying, the major silver miners’ GAAP profits will improve radically. That will attract in a lot more investors, especially to the primary silver miners. Those capital inflows ought to drive massive gains.
Silver’s last major upleg erupted in essentially the first half of 2016, when silver soared 50.2% higher on a parallel 29.9% gold upleg. SIL blasted 247.8% higher in just 6.9 months, a heck of a gain for major silver stocks. But the purer primary silver miners did far better. The purest major silver miner First Majestic’s stock was a moonshot, skyrocketing a staggering 633.9% higher in that same short span! SIL’s gains are muted.
The key takeaway here is avoid SIL. The world’s leading silver-stock ETF is increasingly burdened with primary gold miners with insufficient silver exposure. And having over 1/8th of your capital allocated to silver miners squandered in Korea Zinc is sheer madness! If you want to leverage silver’s coming huge mean reversion higher relative to gold, it’s far better to deploy in smaller purer primary silver miners alone.
One of my core missions at Zeal is relentlessly studying the silver-stock world to uncover the stocks with superior fundamentals and upside potential. The trading books in both our popular weekly and monthly newsletters are currently full of these better gold and silver miners. Mostly added in recent months as these stocks recovered from deep lows, our unrealized gains are already running as high as 87% this week!
If you want to multiply your capital in the markets, you have to stay informed. Our newsletters are a great way, easy to read and affordable. They draw on my vast experience, knowledge, wisdom, and ongoing research to explain what’s going on in the markets, why, and how to trade them with specific stocks. As of Q4 we’ve recommended and realized 1076 newsletter stock trades since 2001, averaging annualized realized gains of +16.1%! That’s nearly double the long-term stock-market average. Subscribe today for just $12 per issue!
The bottom line is the major silver miners are struggling. With silver falling to nearly a quarter-century low relative to gold in Q4, the miners’ results were naturally weak. Mining costs surged as production kept waning, reflecting the ongoing trend of major silver miners increasingly diversifying into gold. But silver-mining profits are still primed to explode higher as silver continues climbing in its young upleg with gold.
There aren’t enough major primary silver miners left to flesh out their own ETF, which is probably why SIL is dominated by gold miners. While it will rally with silver amplifying its gains, SIL’s upside potential is just dwarfed by the remaining purer silver stocks. Investors will be far-better rewarded buying them instead of settling for a watered-down silver-miners ETF. Their stocks will really surge as silver continues recovering.
Adam Hamilton, CPA
April 1, 2019
Copyright 2000 – 2019 Zeal LLC (www.ZealLLC.com)
If you would like to receive our free newsletter via email, simply enter your email address below & click subscribe.
 Follow us on Twitter
 Become our facebook fan
CONNECT WITH US
Tweets
Tweet with hash tag #miningfeeds or @miningfeeds and your tweets will be displayed across this site.
MOST ACTIVE MINING STOCKS
Daily Gainers
 CMC Metals Ltd. CMC Metals Ltd. |
CMB.V | +900.00% |
 Eden Energy Ltd Eden Energy Ltd |
EDE.AX | +200.00% |
| GoviEx Uranium Inc. |
GXU.V | +42.86% |
| Eagle Nickel Ltd. |
ENL.AX | +41.67% |
| Citigold Corp. Limited |
CTO.AX | +33.33% |
| Mount Burgess Mining NL |
MTB.AX | +33.33% |
| Exalt Resources Limited |
ERD.AX | +31.94% |
| Casa Minerals Inc. |
CASA.V | +30.00% |
| Cariboo Rose Resources Ltd |
CRB.V | +28.57% |
| Belmont Resources Inc. |
BEA.V | +28.57% |


