
- Is gold finally due to swoon or can it continue to rally?
- The naysayers point to overbought conditions on the weekly charts, COT reports showing a mammoth short position held by the commercial traders, and the upcoming stock market “crash season”.
- The bulls point to a peaking US business cycle, inflationary and growth-destructive tariffs, a tight job market, an increasingly dovish Fed, strong central bank buying, de-dollarization, out of control government spending and debt, and Chinese investors buying more gold instead of investing in their weak stock market.
- Please click here now. Double-click to enlarge this awesome weekly gold chart.
- In the big picture, both fundamentally and technically, the bulls clearly have not just the edge, but a mighty wind at their backs.
- What about the short-term picture? Well, please click here now. Double-click to enlarge this daily gold chart. Even in the short-term, I give the edge to the bulls!
- There’s a rectangular drift in play, and per Edwards & Magee (writers of the technical analysis “bible”), rectangles have roughly a 67% chance of consolidating the existing trend, which is up.
- Even if the price were to reverse on a disappointing Fed announcement, there’s great intermediate time frame support at $1360-$1275.
- Institutional money managers are only going to become more enthusiastic about gold, silver, and the miners as the business cycle matures and the Fed becomes more dovish. Any pullback in the gold price now will be bought by their very strong hands.
- What about the stock market? If there’s a crash in September or October, would gold stocks suffer?
- Well, the CDNX index (where the “ultra-junior” miners trade) fell with the Dow during last year’s crash season swoon, but gold and most senior miners blasted higher!
- Please click here now. Double-click to enlarge this spectacular GDX versus US stock market ratio chart.
- From a performance perspective, gold stocks look poised to “destroy” the US stock market.
- A massive inverse H&S bottom breakout is in play.
- Please click here now. Double-click to enlarge this gold versus Nasdaq ETF chart (QQQ).
- In 2011 the dollar began breaking out from a huge base pattern against the yen. Gold began to break down from a huge double top pattern against the Nasdaq. This told me a general risk-on theme was emerging and I suggested investors sell some gold and put the proceeds into the stock market.
- Now, the opposite situation is beginning to take shape and investors should consider allocating some capital from the equity markets to gold, silver, and the miners now…
- And with bigger size when there’s a breakout over 9 on the weekly gold versus Nasdaq chart.
- Please click here now. Double-click to enlarge this GDX swing trade chart. I don’t see any reason for gold stock investors to be nervous, but for those who are, my swing trade service at https://guswinger.com/ is designed to wash those worries away.
- Investors get solid performance and low drawdowns trading NUGT/DUST and SQQQ/TQQQ. I’ve introduced text alerts to investor cell phones as an optional means of sending the trade alerts to busy business people who like the swing trade action.
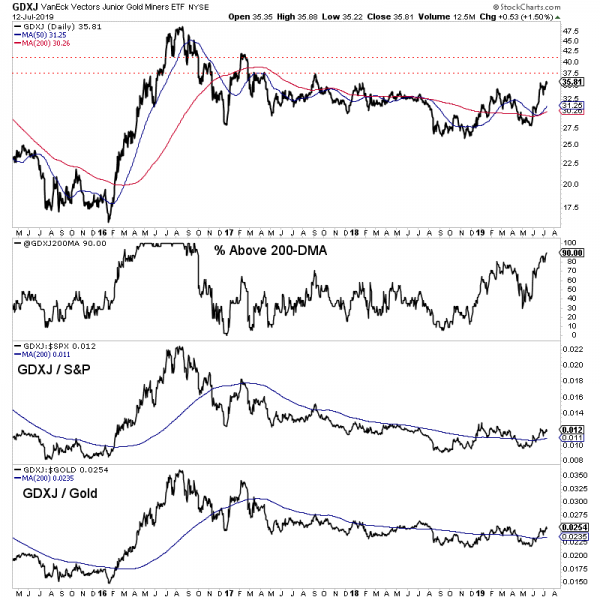
- Please click here now. Double-click to enlarge this GDXJ chart. The GDXJ ETF is called a “junior miners” ETF, but in my professional opinion, it’s really more of an intermediate producer ETF now.
- The current price action is truly exhilarating! An inverse H&S bottom and a marvellous bull pennant pattern both target the $45 price area. The $35-$36 zone is outstanding support.
- Aggressive gamblers can “step up to the JNUG plate” and buy the JNUG ETF. It’s a a triple-leveraged version of GDXJ.
- Whether JNUG, GDXJ, or individual component stocks of the ETFs are used, buyers of size can place a stoploss order under the pennant low to mitigate “Fed Day” announcement risk. Modest-size buyers don’t need stoploss orders. Just buy and prepare to watch GDXJ and its component stocks fly!
Special Offer For Website Readers: Please send me an Email to freereports4@gracelandupdates.com and I’ll send you my free report. “Wave My Golden Flags!” report. I highlight ten of the sweetest gold stocks staging massive bull flag and pennant action on the daily charts. I outline key tactics for investors who are ready to get richer!
Thanks
Stewart Thomson
Graceland Updates
Email:
Stewart Thomson is a retired Merrill Lynch broker. Stewart writes the Graceland Updates daily between 4am-7am. They are sent out around 8am-9am. The newsletter is attractively priced and the format is a unique numbered point form. Giving clarity of each point and saving valuable reading time.
Risks, Disclaimers, Legal
Stewart Thomson is no longer an investment advisor. The information provided by Stewart and Graceland Updates is for general information purposes only. Before taking any action on any investment, it is imperative that you consult with multiple properly licensed, experienced and qualified investment advisors and get numerous opinions before taking any action. Your minimum risk on any investment in the world is: 100% loss of all your money. You may be taking or preparing to take leveraged positions in investments and not know it, exposing yourself to unlimited risks. This is highly concerning if you are an investor in any derivatives products. There is an approx $700 trillion OTC Derivatives Iceberg with a tiny portion written off officially. The bottom line:
Are You Prepared?
The precious metals sector appears to have started a correction.
It was roaring higher until natural resistance kicked in and the U.S. Dollar grinded its way higher, towards its 2019 high. Factor in the Fed decision this week and it has created a natural “buy the rumor, sell the news” event.
We cannot know for certain what the Federal Reserve will do or even more importantly, how the market will react. But we can take note of key levels in these markets.
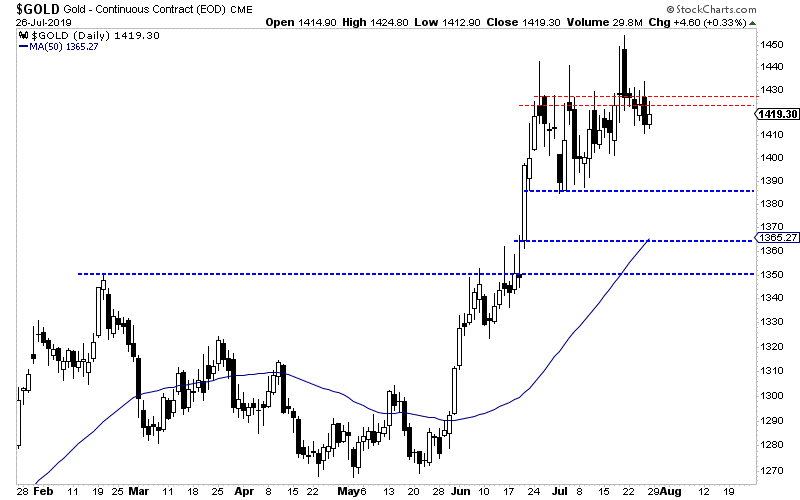
Gold has held above $1400/oz but has been unable to break past resistance at $1420-$1425/oz. A retest of $1385/oz is quite possible and so is a test of $1365/oz.
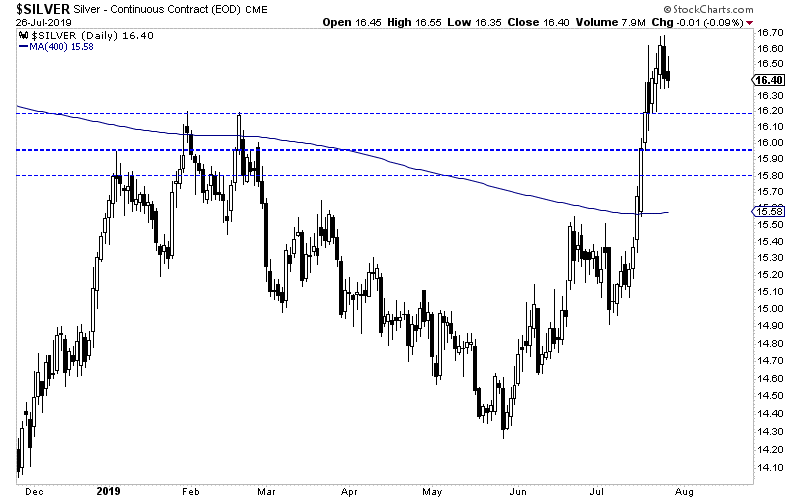
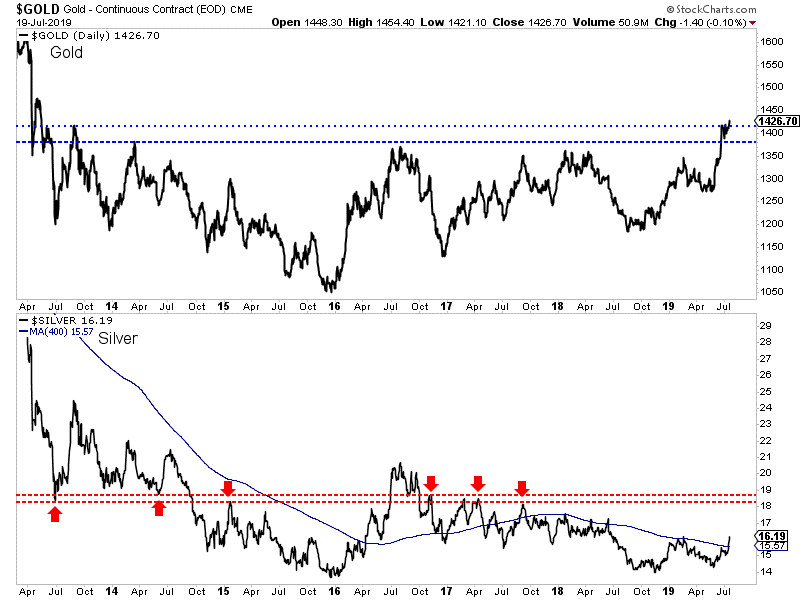
Silver has outperformed Gold since it broke above its 400-day moving average, which provided strong resistance dating back to the end of 2017.
Silver encountered resistance at $16.60-$16.70/oz and could test initial support at $16.20/oz. Below that is strong support at $15.95/oz.
Turning to the gold stocks, we find a clear setup between support and resistance.
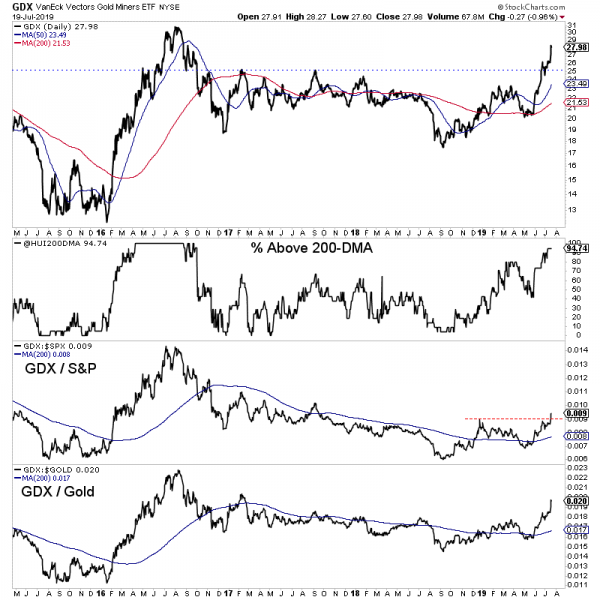
GDX, the ETF for large gold producers has resistance at $28 but good support above $25.00, which was previous resistance for nearly three years. Look for initial support around $26.00.
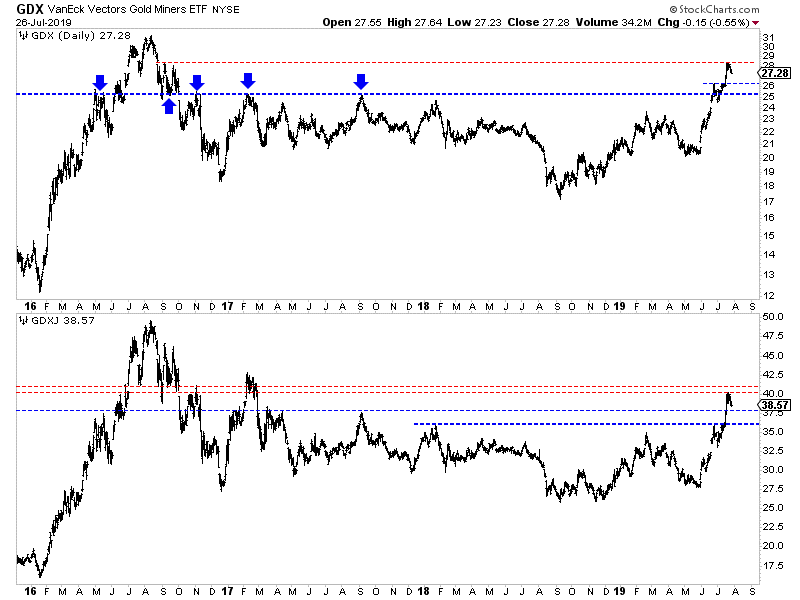
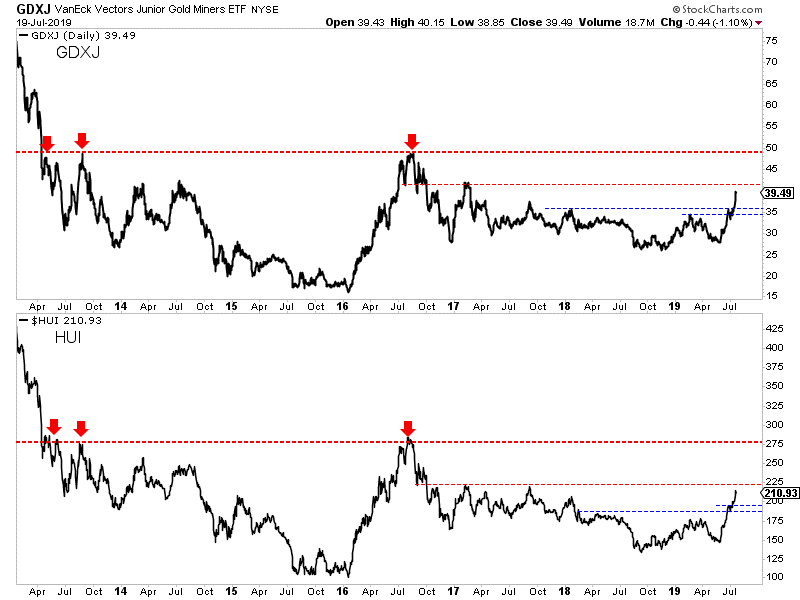
GDXJ, the ETF for the “senior” junior companies, faces resistance at $40-$41. It has initial support around $37.50 with strong support at $36.00.
Regardless of what the Fed does or says, my expectation is precious metals will test these levels and ultimately hold them. The Fed and global central banks want to ease policy and this figures to be more than a one-off.
Precious metals became overbought and a correction is in order.
Investors who smartly positioned in recent months should continue to hold their winners. If the sector continues to correct then look to be a buyer at the aforementioned support levels.
Look to focus your capital on fresh opportunities and value plays that are not very overbought or extended. To learn the stocks we own and intend to buy on this weakness that have 3x to 5x potential, consider learning more about our premium service.
Jordan Roy-Byrne CMT, MFTA
July 30, 2019
Silver has blasted higher in the last couple weeks, far outperforming gold. This is certainly noteworthy, as silver has stunk up the precious-metals joint for years. This deeply-out-of-favor metal may be embarking on a sea-change sentiment shift, finally returning to amplifying gold’s upside. Silver is not only radically undervalued relative to gold, but investors are aggressively buying. Silver’s upside potential is massive.
Silver’s performance in recent years has been brutally bad, repelling all but the most fanatical contrarians. Historically silver prices have been mostly driven by gold, with the white metal amplifying moves in the yellow metal. Silver has generally leveraged gold by at least 2x in the past. And rarely silver skyrockets as higher prices and bullish sentiment feed on themselves in powerful virtuous circles fueling huge gains.
Silver’s legendary upside is largely the result of it being such a tiny market. Silver’s leading fundamental authority is the Silver Institute. In its latest World Silver Survey covering 2018, it reported that total world demand ran 1033.5m ounces last year. That was worth a mere $16.2b at 2018’s average silver prices, a rounding error in markets terms. That was just 1/11th the size of last year’s world gold demand worth $179.4b!
So when investors grow interested in silver again and start deploying capital, relatively-small inflows in absolute terms catapult silver far higher. This classic dynamic last worked in 2016. In roughly the first half of that year, silver rocketed 50.2% on the parallel 29.9% maiden upleg of this current gold bull. That made for 1.7x upside leverage to gold, remaining on the weaker side historically but still well worth riding.
Through gold suffered a severe correction in the second half of 2016, it still ended that year 8.5% higher. Silver’s 15.1% gain amplified that by 1.8x. The secret to gaming silver is it tends to act like a sentiment gauge for gold. When gold is relatively high and has been rallying, traders start assuming that will persist. And that’s when they want to buy silver. The white metal thrives mostly only when gold psychology is bullish.
In 2017 and 2018 gold fell deeper out of favor. The yellow metal wasn’t performing poorly, but it couldn’t break out to new bull-market highs. And contrarian investing was dying, with stock markets levitating to endless new record highs on hopes for big tax cuts soon and extreme Fed dovishness. With gold apathy stellar, silver didn’t stand a chance. Silver sentiment and thus price performance is totally controlled by gold.
Even though gold rallied a strong 13.2% in 2017, silver lagged at mere 6.4% gains. That 0.5x leverage to gold was terrible. The longer silver underperformed, the more traders capitulated on it and walked away. 2018 was even worse. Though gold only drifted 1.6% lower, silver plunged 8.6% making for horrendous 5.5x downside leverage. Silver wasn’t worth the big additional risk of its serious volatility compared to gold.
Thankfully silver’s dire fortunes started to change in early 2019, when I wrote my original essay on Silver Outperforming Gold. But unfortunately that was short-lived, as silver is slaved to gold. In mid-February the young gold upleg stalled out and reversed lower, after failing to break out to new bull-market highs. That kneecapped silver’s budding outperformance streak, casting it back to the underperformance wasteland.
By June 19th, silver was back to its recent miserable form. It was down 2.1% year-to-date despite gold enjoying a respectable 6.1% YTD rally. While we were taking advantage of the hellish sentiment to buy and recommend fundamentally-superior silver-mining stocks at crazy-low prices in our newsletters, it was hard to write about silver. Virtually no one was the least bit interested, with suffocating apathy universal.
But silver started awakening from its bearish haze on June 20th, kicked in the butt by an extraordinary watershed event. That day gold finally surged to its first new bull-market high since way back in early July 2016, when this bull’s maiden upleg peaked! Gold’s $1389 close was also its highest in 5.8 years, starting to unleash powerful new-high psychology. In the 5 weeks since, that has increasingly infected silver.
Silver didn’t respond immediately to gold’s decisive bull-market breakout. On breakout day it stuck to its languid ways, only rallying 1.8% on a major 2.1% gold up day. The silver price action actually stayed relatively weak for the next several weeks. By July 11th gold was 3.4% higher from the day before that major breakout, while silver slumped 0.3% lower. But something interesting was brewing behind the scenes.
Silver investment demand is notoriously difficult to monitor. The best fundamental data available for this white metal is again from the Silver Institute’s World Silver Survey. But as awesome as that is, it is only published once per year. There is a high-resolution proxy for silver investment demand available daily though, the physical-silver-bullion holdings of the world’s largest and dominant silver exchange-traded fund.
That is the American SLV iShares Silver Trust, which has a huge first-mover advantage after launching way back in April 2006. As of the end of 2018, the Silver Institute’s data showed SLV commanded fully 49% of all the silver held by all the world’s silver ETFs! SLV’s holdings are published daily, and when they climb it reveals American stock-market capital flowing into silver. This dynamic is important to understand.
SLV’s mission is to track the silver price, giving stock traders full silver exposure. But the SLV-share supply and demand is independent of silver’s own. If stock traders are buying SLV shares faster than silver itself is being bought, SLV’s price will decouple from silver’s to the upside. SLV’s managers prevent this by shunting that excess share demand back into physical silver itself. The mechanics are simple in concept.
When SLV prices are being bid up faster than silver, new SLV shares are issued to absorb that differential demand. The capital raised from selling those shares is then used to buy more physical silver bullion. This enables SLV to act as a conduit for stock-market capital to flow into and out of silver itself. When SLV shares are sold faster than silver, this process reverses. SLV holdings reveal silver investment trends!
While silver was drifting sideways to lower in the first half of July and looking unimpressive, American stock investors were starting to buy SLV. Between July 2nd and 9th, SLV enjoyed daily holdings builds averaging 0.7% in 4 out of 5 trading days! At the same time the leading gold ETF’s holdings, which is of course the GLD SPDR Gold Shares, were mostly draws. Silver was attracting investors while gold wasn’t.
With gold consolidating high and largely holding over $1400, precious-metals sentiment was improving. After long ignoring gold and silver, investors were starting to take another look. Silver had not only really lagged gold’s breakout rally since mid-June, but it was radically undervalued compared to its dominant primary driver gold. We’ll explore that shortly. So smart contrarians were starting to shift back into silver.
This didn’t first become evident in silver’s price action until July 15th, just a couple weeks ago. That day silver rallied 1.2% despite gold only edging 0.1% higher. That was peculiar and out of character for silver in recent years, so it could’ve been an anomaly. But it proved otherwise. As of this Wednesday’s data cutoff for this essay, silver has outperformed gold in a major way for 8 trading days in a row! That’s incredible.
On the 16th silver climbed 0.9% while gold fell 0.9%. On the 17th and 18th silver surged 2.6% and 2.3% on 1.5% and 1.4% gold up days. The 19th saw silver only retreat 0.7% as gold dropped 1.4%. Then on the 22nd and 23rd silver rallied 1.0% and 0.2% despite gold’s 0.1% and 0.5% declines. This Wednesday the 24th saw silver climb 1.1% outpacing gold’s 0.6%. Such a strong outperformance streak is important.
Thus in the past couple weeks or so, silver has blasted 9.7% higher despite a mere 1.3% gold rally! That makes for epic 7.4x upside leverage, the kind silver enthusiasts dream about. This outperformance stretch is even more impressive because it was driven by big capital inflows into SLV by American stock investors returning to silver. As of this Wednesday SLV saw strong holdings builds for 6 trading days in a row.
That started with a monster 2.6% SLV build on the 17th, which proved the biggest seen by far since way back in January 2013! Gold largely holding over $1400 rekindled American stock investors’ interest in silver in a way not seen in 6.5 years. Over the next 5 trading days ending Wednesday, SLV’s holdings grew another 0.8%, 1.0%, 2.6%, 0.5%, and 0.5%. This silver-investment-buying streak is pretty amazing.
While silver’s outperformance of gold has exploded only in the last couple weeks, it has totally changed how silver looks since gold’s decisive bull-market breakout on June 20th. As of Wednesday, silver has now rallied 9.3% over that 24-trading-day span compared to gold’s 4.8% gain. That’s right back up to that historical 2.0x-upside-leverage norm. SLV’s holdings enjoyed 13 build days, 11 flat days, and 0 draw days.
They have catapulted SLV’s holdings 12.6% higher since the day before gold’s breakout. Via this leading ETF, American stock investors are now holding 1/8th more silver in absolute-ounces terms in just 5 weeks. Over this same span GLD’s holdings only climbed 7.6%. And it only saw 8 holdings-build days, 5 flat days, and a whopping 11 draw days. Something special, major, and likely pivotal is underway in silver!
Nevertheless, silver remains in an ugly place compared to gold. YTD as of this Wednesday, silver was just up 7.1% compared to gold’s 11.1%. Gold’s $1445 upleg-to-date high achieved on July 18th was its best level seen in 6.2 years. Silver’s own upleg-to-date high of $16.55 this Wednesday was merely a 1.1-year one. So though silver has started to outperform gold again, it has a long way to go to look impressive.
There’s no sugarcoating it, the carnage in silver in recent years has been catastrophic. Thanos himself couldn’t have done worse with a fully-stoned Infinity Gauntlet! While there were a half-dozen silver charts I considered sharing this week, this one is the most telling. It shows the Silver/Gold Ratio over the past decade-and-a-half or so. This SGR is the best measure of whether silver prices are relatively high or low.
The SGR simply divides the daily silver close by the daily gold close, but yields hard-to-parse decimals like 0.0116 this Wednesday. So I prefer to use an inverted-axis Gold/Silver Ratio instead, which is the same thing but offers easier-to-understand numbers like 86.1 mid-week. Silver prices had almost never been lower relative to gold in modern history before recent weeks! Silver is climbing out of a stygian abyss.
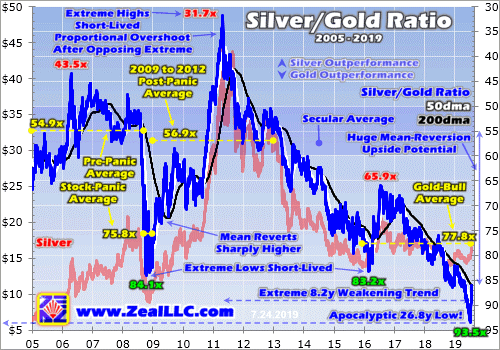
Back in mid-June just before gold’s decisive bull-market breakout changed everything, the SGR had fallen to an absurd 90.4x. In other words it took 90.4 ounces of silver to equal the value of a single ounce of gold. That was wildly out of whack with historical precedent. From 2005 to just before 2008’s first stock panic in a century, the SGR averaged 54.9x. From 2009 to 2012 after that panic, it averaged a similar 56.9x.
The SGR had generally meandered in the mid-50s for decades, so miners had long used 55.0x as the leading proxy for calculating silver-equivalent or gold-equivalent ounces. The SGR also experienced great cycles, long secular periods of silver outperformance where the SGR generally fell followed by multi-year spans of silver underperformance where the SGR rose on balance. SGR extremes were short-lived.
As gold surged over this past month, the SGR spiraled higher still to a mind-boggling 93.5x on July 5th. That was an apocalyptic 26.8-year low, the worst silver levels relative to gold since October 1992. That is longer than the average investing lifespan of today’s traders, over a quarter century! And 93.5x isn’t much better than the worst SGR since 1970, 100.3x seen briefly in February 1991. Silver has just been slaughtered.
For an incredible 8.2 years the SGR had been rising on balance, showing chronic underperformance relative to gold. This secular cycle is far-overdue to turn, and after extreme lows historically silver has spent years mean reverting higher relative to gold. 2008’s extraordinary stock panic offers a fantastic recent example of how greatly silver can soar after being battered down to extreme lows relative to gold.
Back in November 2008 in that most-extreme market-fear event seen in our lifetimes, the SGR was crushed to 84.1x. Silver was radically undervalued relative to gold, investors wanted nothing to do with it. Such a great disconnect between silver and gold wasn’t sustainable given their relative market sizes and the ratio at which they are mined. So over the next 2.4 years into April 2011, silver skyrocketed 442.9% higher!
After SGR extremes silver doesn’t just revert to the mean, but overshoots proportionally towards the opposite extreme. The SGR fell as low as 31.7x when that silver bull peaked over $48 per ounce. Odds are the SGR will again overshoot and at least return to the 40s before silver’s next bull fully runs it course. With silver not far off its lowest levels compared to gold in modern times in early July, it has vast room to soar.
Gold’s current bull market was born in mid-December 2015, and is what has driven silver higher during gold-bull uplegs. Since then, the SGR has averaged just 77.8x. That is actually higher than during that wild stock-panic span in late 2008, incredibly extreme! Over the past several weeks or so, the SGR has already started mean reverting falling as low as 86.1x this week. Silver’s upside potential from here is epic.
At $1400 gold and this miserable gold-bull-average 77.8x SGR, silver would need to trade at $18.00. That’s another 9% higher from this week’s levels. But again mean reversions off extremes don’t just stop at the averages, but keep going like a pendulum. That yields an SGR target of 62.1x, implying $22.56 silver at $1400 gold. Silver would have to power another 36% higher to regain those still-pathetic SGR levels.
If gold’s young secular bull persists for years to come as it ought to based on historic precedent, silver is going to climb far higher greatly lowering the SGR. If it just mean reverts back to that longstanding 55.0x average with no overshoot, that means $25.45 silver at $1400 gold. These SGR-mean-reversion-and-overshoot silver-price targets grow far bigger at higher prevailing gold prices and proportional-overshoot SGR lows.
The point of all this is silver is so radically undervalued compared to its primary driver gold that it needs to soar vastly higher to reestablish normal relationships. While silver’s outperformance over the past couple weeks is impressive, it hardly even registers coming off such extreme lows. Digging out of such a deep hole relative to gold, silver needs to rally higher on balance for many months or even years to come!
While investment buying including via silver ETFs like SLV will be the primary driver, silver futures will also play a big role. A couple weeks ago I wrote about gold’s high short-term selloff risk due to how the gold-futures speculators are now positioned, with excessively-bullish bets that are actually very bearish over the near term. A healthy gold pullback or correction would certainly drag silver down with it for a spell.
The most-bullish situation possible for gold- and silver-futures is for speculators to be all-out long upside bets and all-in short downside bets. That leaves them nothing to do but buy. That is 0% longs and 100% shorts. In the latest weekly Commitments of Traders report, specs’ gold-futures bets were running 75% on the long side and 10% on the short side up into their entire bull-market trading ranges. That’s really bearish.
By bull-to-date precedent, gold-futures speculators had room to sell 347.4k contracts but only room to buy 80.5k. That made for an ominous 4.3x ratio of potential selling outweighing potential buying. I bring this up because speculators’ silver-futures positioning was nowhere near as menacing. They are running 66% on the long side and 44% on the short side up into their gold-bull-market trading ranges, much less bearish.
Speculators had room to sell 97.4k silver-futures contracts and buy 65.8k in the latest CoT report, for a way-more-moderate 1.5x ratio of potential selling to potential buying. The takeaway here is silver has a lot more near-term futures-buying-driven upside potential than gold does. Together silver investment buying and silver-futures buying are powerful forces to catapult silver higher. But it all depends on gold.
If gold continues to consolidate high above or near $1400, that will foster the bullish sentiment necessary for silver buying to persist. New-high psychology driving gold investment buying could make this happen. But if something spooks the gold-futures speculators, they have massive room to sell which would quickly cascade and hammer gold lower. That would suck in silver, driving both into healthy short-term corrections.
But once speculators’ excessively-bullish gold-futures bets normalize, gold and silver should be off to the races again with silver really outperforming. So any material weakness should be used to aggressively accumulate physical silver bullion, SLV shares, and stocks of fundamentally-superior silver miners. Their upside potential trounces silver’s because their profits growth really amplifies higher prevailing silver prices.
Again silver soared 50.2% higher in largely the first half of 2016. The leading SIL Global X Silver Miners ETF rocketed a colossal 247.8% higher in essentially that same span! That made for huge 4.9x leverage to silver’s gains. Every quarter I analyze the fundamentals of the major silver miners of SIL, with the latest essay covering Q1’19 results. Now is the time to do your homework before silver really starts running again.
To multiply your capital in the markets, you have to trade like a contrarian. That means buying low when few others are willing, so you can later sell high when few others can. In recent months well before gold’s breakout, we recommended buying many fundamentally-superior gold and silver miners in our popular weekly and monthly newsletters. Mid-week our unrealized silver-stock gains already ran as high as 113.8%!
To profitably trade high-potential gold and silver stocks, you need to stay informed about broader market cycles that drive them. Our newsletters are a great way, easy to read and affordable. They draw on my vast experience, knowledge, wisdom, and ongoing research to explain what’s going on in the markets, why, and how to trade them with specific stocks. Subscribe today and take advantage of our 20%-off summer-doldrums sale! The biggest gains are won by traders diligently staying abreast, always learning.
The bottom line is silver really started outperforming gold again in the last couple weeks. Silver surged dramatically on heavy investment buying, as evidenced by big differential SLV-share demand. This looks like a sea-change sentiment shift getting underway in silver, especially after it was crushed to its lowest levels relative to gold in well over a quarter century. Silver is long overdue to mean revert vastly higher.
Silver effectively acts like a gold sentiment gauge, with investment demand dependent on gold’s fortunes. The longer gold consolidates high or grinds higher, the more silver will be bought. Coming out of such radically-undervalued levels, silver’s future bull-market upside should greatly exceed gold’s. But silver will also get sucked into periodic gold corrections, which can be used as lower entry points to add silver positions.
Adam Hamilton, CPA
July 29, 2019
Copyright 2000 – 2019 Zeal LLC (www.ZealLLC.com)
- At McDonald’s restaurant, customers can “supersize” their food orders. Can gold supersize its awesome 2019 price action?
- Well, please click here now: https://gracelandjuniors.com/wordpress/wp-content/uploads/2019/07/2019jul23gold1.png Double-click to enlarge.
- The technical action on this gold chart is spectacular!
- Gold has formed a massive pennant formation. There’s no guarantee that it plays out, but if it does the technical target is in the $1560 area.
- A $1560 gold price would turn most gold producers into gargantuan cash cows, and the near-vertical rally already in play in silver would likely become a textbook barn burner.
- Please click here now: https://gracelandjuniors.com/wordpress/wp-content/uploads/2019/07/2019jul23si1.png Double-click to enlarge. A pattern like a double bottom is now in play on the weekly silver chart.
- This pattern suggests the silver rally is just getting started and a breakout over the neckline would target the $18.50 area.
- The Western fear trade for gold is now the “price driver in play” for all the precious metals upside action, but the love trade is also providing solid and consistent support for the market.
- Interestingly, the Indian government tariff taxes of 12.5% have effectively revalued the price of the vast hoards of gold held by Indian citizens by 12.5%.
- In America, real interest rates continue to decline as the business cycle peaks. Any uptick in inflation could create an institutional “feeding frenzy” in gold stocks and silver stocks.
- Please click here now: https://gracelandjuniors.com/wordpress/wp-content/uploads/2019/07/2019jul23realrates1.png Many bond market analysts believe that rate cuts from the Fed could accelerate the issuance of negative-rate bonds… dramatically!
- Please click here now: https://gracelandjuniors.com/wordpress/wp-content/uploads/2019/07/2019jul23gold2.png Double-click to enlarge. Some gold analysts worry about the “large” commercial short position in gold on the COMEX, but I predicted years ago that when gold broke out of the bull continuation pattern… the commercial short position could rise to millions of contracts, with the price still going higher!
- That’s because there are so many institutional money managers getting involved with gold now. The bottom line: Cash pays nothing and has no upside, and a surge in inflation would destroy the bond market and potentially topple the US government.
- In this environment, institutional stock market investors are embracing gold and gold stocks. They are beginning to embrace silver too. Because silver is such a small market, even modest institutional buying is producing vertical price action!
- Another positive aspect to the arrival of institutional investors in gold, silver, and the miners may be of interest to conspiracy buffs who believe in price manipulation.
- I say that because institutional investors have in-house investigators who monitor the market action. They are quick to alert regulators when market trades don’t make sense.
- Whether serious gold price manipulation existed in the past is probably unknowable, but there’s no question that the current market feels “cleaner” and more stable than it did when hedge funds dominated the market.
- The SPDR fund (GLD-NYSE) is now at 825 tons, and the SLV-NYSE silver fund is now at 11,070 tons. Institutions are buying steadily.
- What happens if the Fed disappoints at next week’s key meeting? What happens if there’s no rate cut? Well, since 2014 I’ve talked about all Fed actions being positive for gold.
- Gold rallied on QT and rate hikes and the stock market tanked because of the safe haven bid. Gold also rallied on the recent Fed pause… much more than the stock market did!
- The bottom line: If the Fed doesn’t cut rates at next week’s key meeting the stock market will crash and gold will cash a huge safe haven bid. Everything the Fed does is now win-win for gold.
- Please click here now: https://gracelandjuniors.com/wordpress/wp-content/uploads/2019/07/2019jul23gdx1.png Double-click to enlarge this fabulous GDX chart. I coined the term “flagification” to describe a market so powerful that numerous bull flags appear in succession. That’s happening with GDX and many gold miners now.
- For a look at the important weekly chart for GDX, please click here now: https://gracelandjuniors.com/wordpress/wp-content/uploads/2019/07/2019jul23gdx2.png Double-click to enlarge. If the bull flag on the daily chart plays out, GDX is going to my $30-$32 target zone, and to $37-$40 if the “supersize” bull pennant on the gold bullion chart activates.
- The breakout above $26 on the weekly chart has turned the entire $23-$26 area into a massive support zone, so any failure or churning in the flag/pennant formations is little more than an annoying bearish fly that should soon be swatted away by a growing army of excited institutional buyers.
ttps://gracelandjuniors.com
Special Offer For Website Readers: Please send me an Email to freereports4@gracelandupdates.com and I’ll send you my free “Protecting The Profits!” report. I highlight the tactics used by top investors in the 1970s gold market to protect their profits after massive rallies in gold stocks and I apply those tactics to eight key stocks now!Graceland Updates
Stewart Thomson
Graceland Updates
Email:
Stewart Thomson is a retired Merrill Lynch broker. Stewart writes the Graceland Updates daily between 4am-7am. They are sent out around 8am-9am. The newsletter is attractively priced and the format is a unique numbered point form. Giving clarity of each point and saving valuable reading time.
Risks, Disclaimers, Legal
Stewart Thomson is no longer an investment advisor. The information provided by Stewart and Graceland Updates is for general information purposes only. Before taking any action on any investment, it is imperative that you consult with multiple properly licensed, experienced and qualified investment advisors and get numerous opinions before taking any action. Your minimum risk on any investment in the world is: 100% loss of all your money. You may be taking or preparing to take leveraged positions in investments and not know it, exposing yourself to unlimited risks. This is highly concerning if you are an investor in any derivatives products. There is an approx $700 trillion OTC Derivatives Iceberg with a tiny portion written off officially. The bottom line:
Are You Prepared?
It was a huge week for the gold stocks. GDX gained nearly 7% while GDXJ surged over 10%.
Gold hit $1450/oz after Thursday before selling off Friday. Silver met the same fate on Friday but managed to close the week up over 6% and at a new 52-week high.
Let’s take a look at the current technicals.
Gold closed the week just below $1427/oz. If it remains above $1420-$1425, then it is likely to trend towards $1475/oz, which is the only resistance between $1425 and $1525.
If Gold trades back below $1420 then there is a risk it could test $1380 again.
Silver has taken out resistance at its 400-day moving average in convincing fashion but needs to surpass its February 2019 high. Its next major resistance target is the mid $18s.
Turning to the stocks, we start with GDX which is closing in on its 2016 high. Should Gold trend towards $1475/oz then GDX would likely retest that 2016 high at $31.
Breadth remains strong and so too is GDX’ relative strength. GDX relative to the S&P made a 21-month high and relative to Gold made a 2-year high.
Both GDXJ (juniors) and the HUI (miners only) still have room to go before reaching their 2016 highs.
In fact, both are facing some immediate overhead resistance. For GDXJ which closed at $39.50, that resistance is at $40-$41. For HUI which closed at 211, that resistance is at 220.
The support levels are $36 for GDXJ and 195 for the HUI.
If Gold and Silver maintain current levels, then the immediate bias remains higher and GDX could soon test its 2016 high.
GDXJ and HUI have roughly 30% upside to their 2016 highs. Such a move probably requires a move in Gold to at least $1525/oz.
However, if Friday was the start of a correction then GDX could test $26 and GDXJ could test $36.
For investors in the juniors and seniors, continue to hold winners. If the sector corrects, then look to take advantage of that weakness. If metals and shares maintain these levels then focus your capital on fresh opportunities and value plays that are not overbought or extended. To learn the stocks we own and intend to buy that have 3x to 5x potential, consider learning more about our premium service.
By Jordan Roy-Byrne CMT, MFTA
July 23, 2019
The gold miners’ stocks continue to rally on balance, after a major upside breakout extended their strong upleg. That’s driving mounting interest in this recently-forsaken sector. With the latest quarterly earnings season underway, traders will soon enjoy big fundamental updates from the gold miners. They are likely to report good Q2 results, with improving operational performances supporting further stock-price gains.
Four times a year publicly-traded companies release treasure troves of valuable information in the form of quarterly reports. Companies trading in the States are required to file 10-Qs with the US Securities and Exchange Commission by 40 calendar days after quarter-ends. The gold miners generally release their quarterly reports in the latter half of that window. So Q2’19’s will arrive between late July to mid-August.
After spending decades intensely studying and actively trading this contrarian sector, there’s no gold-stock data I look forward to more than the miners’ quarterly financial and operational reports. They offer a true and clear snapshot of what’s really going on, shattering the misconceptions bred by ever-shifting winds of sentiment. Nearly all fundamental analysis is based off the data gold miners provide in quarterlies.
So for many years I’ve delved deeply into gold miners’ quarterly results. They are the dominant source of information I use to winnow down the universe of gold stocks to the fundamentally-superior ones with the greatest upside potential. Every quarter after their latest earnings season ends, I research and write essays discussing the newest results from the major gold miners, mid-tier gold miners, and silver miners.
Q2’19’s full analyses are coming starting in mid-August once that 40-day post-quarter reporting deadline has passed. But before that I eagerly dive into individual companies’ results as they’re reported, since there’s so much to digest. Even earlier soon after a quarter ends, I start thinking about what gold miners’ latest quarterly results are likely to show collectively. Their aggregate trends can be somewhat predicted.
In high-level fundamental terms, gold mining is a simple business. These companies painstakingly wrest gold from the bowels of the Earth, then generally sell all they can produce at prevailing market prices. So their profits are effectively the difference between current gold levels and operating costs. The former is easy to calculate once a quarter ends, and the latter can be reasonably estimated for this sector as a whole.
Gold’s dramatic bull-market breakout a month ago and high consolidation since have greatly improved sector psychology. But gold’s big surge came late in Q2, minimizing its full-quarter impact. The early quarter was rough, with gold slumping to a new year-to-date low near $1271 in early May. The average gold prices in April, May, and June were $1286, $1284, and $1361. Gold was mostly sucking wind last quarter.
Thus Q2’19’s overall average gold price of $1309 was just a meager 0.4% better than Q1’s $1303. So the gold miners’ latest quarterly results aren’t going to get much help from gold’s young surge. That will really change in the current Q3 if gold can hold these high levels. With Q3 about 1/5th over, gold has averaged an awesome $1407 so far! So the higher-gold boost to gold-stock earnings is coming, but not in Q2.
Gold stocks really leverage higher gold prices because their mining costs are largely fixed. Quarter after quarter mining operations generally require the same levels of infrastructure, equipment, and employees. The vast majority of any gold mine’s future cost structure is actually determined during its planning phase, when engineers decide which ore to mine, how to excavate it, and how to process it to recover the gold.
Every quarter after results I analyze the all-in-sustaining costs reported by the world’s gold miners. These are the best measure of what it really costs to produce an ounce of gold. Over the past four quarters, the major gold miners of the leading GDX VanEck Vectors Gold Miners ETF reported average AISCs of $856, $877, $889, and $893. That in turn yields a trailing-four-quarter mean of $879 per ounce, a key cost metric.
With $1309 average gold in Q2’19 and AISCs likely near $879, that implies the large gold miners as an industry likely earned $430 per ounce last quarter. That’s actually a decent improvement considering the flat quarterly gold prices. Though gold averaged a similar $1303 in Q1, the GDX miners’ average AISCs that quarter came in a bit higher at $893. That implied $410 profits, which Q2 results should easily exceed.
$430 is up 4.9% quarter-on-quarter despite the relatively-flat average gold price! This is really impressive sequential profits growth relative to the broader stock markets, where earnings are stalling out. But if that is all we could hope for, I would’ve written on a different topic this week. The gold miners’ Q2’19 earnings are likely to well exceed expectations for an entirely-different reason, portending even-higher gold-stock prices.
Most traders assume gold miners produce their yellow metal at fairly-steady rates year-round. That sure makes sense given how capital-intensive gold mining is, how individual mines’ capacities and throughputs to process ore are fixed, and how expanding mines’ outputs takes years of construction. But surprisingly global gold mine production actually varies considerably quarter-to-quarter! This should really boost Q2 earnings.
The best global gold fundamental data is published by the World Gold Council, also on a quarterly basis. These Gold Demand Trends reports are essential reading for all gold-stock speculators and investors, as these miners are ultimately just leveraged plays on gold. The latest GDT covering Q1’19 was released in early May, with Q2’s due out in early August. One key number GDTs report is world gold mine production.
That happened to run 852.4 metric tons in Q1, nearly a third of which came from the major gold miners of GDX. Analyzing global gold mine production each quarter since 2010 reveals some fascinating quarter-to-quarter output trends. Over the last 37 quarters, calendar Q1s have seen gold mined average a sharp 7.2% QoQ plunge from the immediately-preceding calendar Q4s! Not a single Q1 saw sequential output growth.
From 2010 to 2019 Q1 gold mined fell 7.2%, 6.9%, 7.6%, 11.2%, 8.8%, 3.3%, 8.7%, 5.7%, and 5.6% from the respective Q4s. These drops and their uniformity across radically-different gold-price environments is stunning. For some reason the world’s gold mines suffer universal declines in their outputs early in calendar years. Why? This curious industrywide Q1 production slump results from an interplay of several factors.
Most gold miners run their accounting on calendar years. So early in new years they have new capital budgets to spend on maintaining and enhancing their existing operations. If they temporarily shut down their mills for repairs or minor upgrades, Q1s are usually when they do it. Weather plays a role too, as the majority of the world’s gold mines are in the northern hemisphere with the majority of the world’s land masses.
Winter creates operational challenges for gold mines, ranging from extreme cold to heavy snow or rains depending on their latitudes and elevations. So in addition to short planned shutdowns to work on infrastructure, adverse weather can impair operational efficiencies. But the main reason global gold-mine outputs plunge in Q1s is due to ore-grade-management decisions made by mine managers to maximize bonuses.
Gold deposits are not homogeneous, ore grades vary widely within them. So managers must choose which ore to mine, when to run it through their mills, and how to mix it with ores from other locations. The mills that crush the gold-bearing rock into small-enough chunks to recover the metal have fixed capacities in tonnage-per-day terms. So the less gold contained in the ore processed, the less gold the mines recover.
Mine managers often choose to dig through lower-grade ores, or run lower-grade ores through their mills, in Q1s. They save the higher-grade ores for later in calendar years. They often claim these decisions are related to early-year capital budgets being spent to improve outputs later in years. But there’s probably more to it, since this happens so universally across the world’s gold mines. Incentives have to play a role.
Gold-mine managers are often partially compensated based on how their stock prices are faring. This is usually a big factor in annual bonuses calculated near year-ends. These bonuses are the most-variable part of compensation, and can greatly boost income. After long years of study and talking with some of these guys, I’m convinced they choose to take any gold-output hits early in years to engineer strong finishes.
Q1 results are reported by mid-Mays, a long way out from year-ends. That’s the least-beneficial time in bonus terms for strong output to boost stock prices. Q2 results released by mid-Augusts and Q3 results published by mid-Novembers are far-more important. So mine managers feed their fixed-capacity mills better-grade ore mixes in Q2s and Q3s, after early-year maintenance is finished and summer weather is favorable.
Thus in calendar Q2s since 2010, global gold mine output according to the World Gold Council surged an average of 5.4% sequentially from Q1s! Over the past 9 years Q2s have seen huge QoQ global-output gains of 6.7%, 7.7%, 6.3%, 7.1%, 6.1%, 5.7%, 0.7%, 4.9%, and 3.4%. There has not been a single down Q2 in this span despite wildly-different gold-price environments. Such uniformity reveals deliberate planning.
Over roughly the past decade, world gold mine production has averaged -7.2% QoQ in Q1s, +5.4% in Q2s, another hefty +5.3% in Q3s, then just +0.5% in Q4s. That Q4 stalling is pretty telling too, as those Q4 results are typically released by mid-Marches which doesn’t affect annual bonuses when those quarters were underway. The gold miners contrive their best output reporting from late Julies to mid-Novembers!
So in these upcoming Q2’19 results, the gold miners are likely to report production about 5% higher than Q1’s! That big sequential output boost really increases overall corporate earnings. And it has another key benefit of reducing all-in sustaining costs. AISCs are calculated by spreading the costs of gold mining across all ounces produced. So the more gold mined, the lower the unit costs of producing it that quarter.
A year ago in Q2’18, the GDX gold miners’ average AISCs dropped a big 3.2% sequentially from the prior quarter’s to $856 per ounce. So it is certainly reasonable to expect Q2’19’s AISCs to retreat 3% or so from Q1’s $893, which yields $866 per ounce. Subtract that from Q2’19’s average gold price of $1309, and it yields likely earnings of $443 per ounce. That is 8.0% higher quarter-on-quarter from Q1’s results!
That’s conservative too. As detailed in my essay on the GDX gold miners’ Q1’19 results, that quarter’s average AISCs were skewed higher by a single anomalous outlier. That company expects costs to greatly retreat in Q2. Excluding it, the GDX gold miners averaged considerably-lower $874 AISCs in Q1. A 3% reduction to that on higher Q2 output leaves an excellent $848 AISC target, implying big $461 profits!
That represents a major 12.4% quarter-on-quarter surge, which should excite traders anytime. And with gold-stock sentiment already growing far more bullish thanks to gold’s bull-market breakout, there’s a good chance Q2 earnings’ positive psychological impact will be amplified. As long as gold hangs in there and doesn’t sell off, the gold miners’ stocks have real potential to rally considerably on good Q2 results.
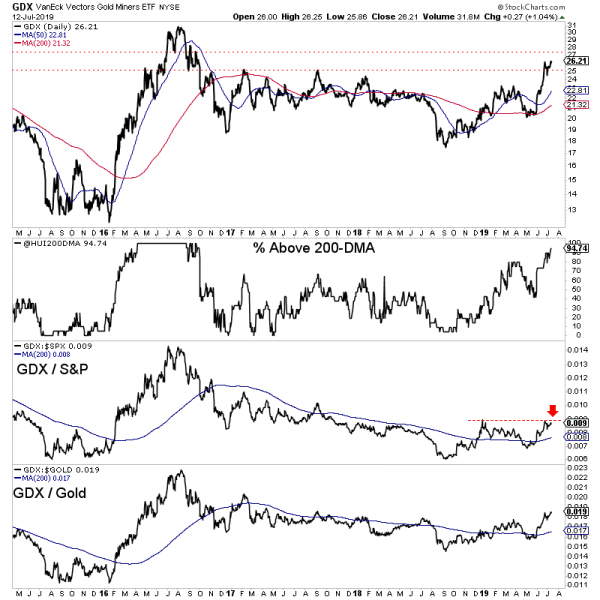
A couple charts offer some quick perspective. Gold’s breakout drove a major decisive upside breakout in gold stocks too as measured by their leading GDX benchmark. That dominant ETF is rendered in blue here, superimposed over its key technical lines. As of the Wednesday data cutoff for this essay, GDX had powered 54.2% higher in 10.2 months in its upleg to date. But gold-stock prices still remain relatively low.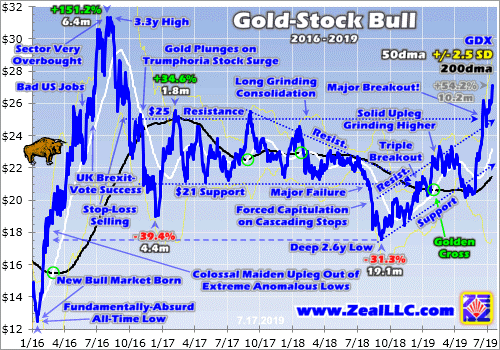
Mid-week GDX hit $27.09 on close, its best levels in 2.8 years. But that remains well below gold stocks’ bull-to-date peak of $31.32 in early August 2016. The gold stocks ought to at least exceed those levels, which is another 15.6% higher from here. Good Q2 results interpreted through the lens of increasing sector bullishness should be enough to fuel a bull-market breakout. Gold argues for higher gold-stock levels.
Back in mid-2016 when GDX peaked at $31.32, gold merely hit $1365 at best. That was just after a quarter when the GDX gold miners’ AISCs averaged $886 per ounce. Gold was considerably higher this week, hitting $1425. And it has averaged $1408 for nearly a month since its bull-market breakout. So the higher prevailing gold prices this summer, and lower AISCs, should support much-higher gold-stock prices.
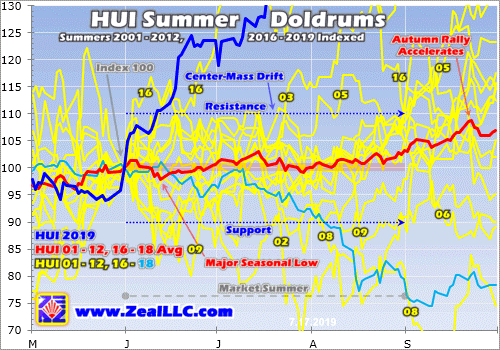
Showing just how strong gold stocks are and how unique today’s situation is, this last chart looks at gold stocks’ average performances in modern bull-market summers. I explained this indexed chart in depth in an essay on gold summer doldrums a couple weeks ago. The yellow lines show where the older HUI gold-stock index traded in past modern gold-bull-market summers, and the red line averages them together.
This year’s action is rendered in dark blue, revealing gold stocks’ best summer by far since 2016 after this gold bull’s massive maiden upleg! In the middle of this week the HUI rocketed 32.3% higher summer-to-date, literally off this seasonal chart I’ve gradually built up over the years. If there was ever a summer where gold stocks could punch out to new bull highs, this one is it. Their upside momentum is incredibly strong.
All this gold-stock bullishness aside, it is always wise to be wary when everyone else is getting excited. The potential for gold stocks to surge to new bull highs on good Q2 results is totally dependent on what gold does over the coming 6 weeks or so. While gold has shown awesome resilience in consolidating high and mostly holding $1400 over the past month, the gold selloff risk is high due to gold-futures positioning.
I wrote a whole essay last week explaining this in depth. In a nutshell, gold-futures speculators dominate short-term gold price action. Their current bets on gold are excessively-bullish, warning that their capital firepower to buy gold is nearing exhaustion. They are effectively all-in on long upside bets, and all-out on short downside bets. That leaves them vast room to sell hard on the right catalyst, pushing gold sharply lower.
There’s a chance new-high psychology can ignite enough investor gold buying to overpower and absorb any spec gold-futures selling. But realize gold-stock fortunes are still slaved to gold as always. Gold has to stay high to support new gold-stock highs. If gold materially falters and slumps into a healthy pullback or correction within an ongoing bull, the gold stocks will follow it lower regardless of how good Q2 results prove.
Buying high on strong upside momentum is always tempting, as that’s when traders feel the best about any sector. Bullishness and capital inflows soar as stocks power higher. But over time far-larger gains are won by instead buying low, adding positions when sectors are out of favor. The later you buy gold stocks in any upleg, the smaller their potential gains and the higher the odds a major selloff is looming.
To multiply your capital in the markets, you have to trade like a contrarian. That means buying low when few others are willing, so you can later sell high when few others can. In recent months well before gold’s breakout, we recommended buying many fundamentally-superior gold and silver miners in our popular weekly and monthly newsletters. Mid-week their unrealized gains ran as high as 123.9%, 123.5%, and 116.5%!
To profitably trade high-potential gold stocks, you need to stay informed about the broader market cycles that drive them. Our newsletters are a great way, easy to read and affordable. They draw on my vast experience, knowledge, wisdom, and ongoing research to explain what’s going on in the markets, why, and how to trade them with specific stocks. Subscribe today and take advantage of our 20%-off summer-doldrums sale! The biggest gains are won by traders diligently staying abreast so they can ride entire uplegs.
The bottom line is the gold miners’ just-starting Q2’19 earnings season should prove impressive. That’s no thanks to gold, as its awesome bull-market breakout came too late last quarter to push its average price significantly higher. But the gold miners are still likely to collectively report sharply-higher Q2 output, which is normal after Q1’s deep production slump. That will also naturally lead to proportionally-lower costs.
Growing production combined with lower costs at slightly-higher gold prices should yield big profits growth for the gold miners. Their Q2 results will be more closely watched and better received since psychology is shifting much more bullish in this sector. That should fuel big gold-stock buying as long as gold holds up. The yellow metal has proven resilient so far, but faces an ominous overhang of gold-futures selling pressure.
Adam Hamilton, CPA
July 22, 2019
Copyright 2000 – 2019 Zeal LLC (www.ZealLLC.com)
- It’s the ultimate “no-brainer” that serious American GDP growth (in the 6% range or higher) can only happen by eliminating the PIT (personal income tax) for the middle class.
- QE and low interest rates incentivize pathetic levels of debt-oriented GDP growth while incentivizing the government to get more reckless with the money that is borrowed and extorted from citizens as taxes.
- Elimination of the PIT would instantly turn the debt-bombed middle class of America into a “savings and purchasing power machine”.
- With higher rates and elimination of the PIT, government would be forced to shrink, banks would eagerly loan out the savings to mainstream business, and the middle class would consume with savings rather than credit card debt.
- The bad news: The PIT won’t be eliminated, and government worship of debt, QE, low rates, and extortion is not going away.
- The good news: That means the gold price is going higher!
- To view the key buy and sell levels for gold, please click here now. Double click to enlarge.
- Gold investors should be eager buyers of gold, silver, and the miners in the $1390 gold price area or on a breakout above $1440.
- Please click here now. Double-click to enlarge this key weekly gold chart.
- The most likely scenario for gold now is a rally towards $1500-$1523, followed by a significant pullback that will probably look a lot like the late 2009 pullback.
- What actually happens is almost certainly going to depend on the actions and statements from the Fed at the July 31 meeting.
- If the Fed isn’t as dovish as expected, gold could pullback towards $1320 quite quickly. A half point cut and a dovish outlook could produce a dramatic “target overshoot” for gold. A surge to $1750 would be quite realistic in that situation.
- Whatever happens, $1390, $1360, and $1320 are all key buy zones and $1440, $1500, and $1750 are all decent profit booking targets.
- Please click here now. Double-click to enlarge this daily silver chart. Like Rodney Dangerfield, silver doesn’t get much respect, but that’s because inflation has yet to really surge.
- Having said that, the silver chart is beginning to look quite bullish. A breakout from an inverse H&S bottom pattern has occurred, and the pullback was flag-like.
- The target of both the flag and the H&S pattern is the $16.50 area highs of February.
- From a risk-reward perspective, silver is beginning to look superior to the US stock market.
- Please click here now. Double-click to enlarge this swing trade chart.
- Swing trade enthusiasts can get in on the leveraged ETF action for gold stocks and the Nasdaq with my guswinger.com service. We are also carrying a massive Barrick position. Signals are available by email (and cell phone text for traders with US cell phone numbers).
- For an analytical look at the GDX daily chart, please click here now. Double-click to enlarge. I use a 24hour chart for GDX. On this chart, a surge above $26.45 would be a fresh buy signal not just for GDX, but for most intermediate and senior gold producers.
- Please click here now. Double-click to enlarge this silver stocks ETF chart.
- Note the recent superior performance of the silver miners compared to silver bullion.
- There is an H&S bull continuation pattern forming on the chart and I believe that pattern makes an “upside blast” to my $34 target price zone highly likely.
- The bottom line for gold and silver stocks: The action is solid, and the action is now!
Special Offer For Website Readers: Please send me an Email to freereports4@gracelandupdates.com and I’ll send you my free “Ultimate Gold Market Portfolio” report. I highlight tactics to assemble a pure performance portfolio of global metal miners, with key action points for each holding!
Stewart Thomson
Graceland Updates
Email:
Stewart Thomson is a retired Merrill Lynch broker. Stewart writes the Graceland Updates daily between 4am-7am. They are sent out around 8am-9am. The newsletter is attractively priced and the format is a unique numbered point form. Giving clarity of each point and saving valuable reading time.
Risks, Disclaimers, Legal
Stewart Thomson is no longer an investment advisor. The information provided by Stewart and Graceland Updates is for general information purposes only. Before taking any action on any investment, it is imperative that you consult with multiple properly licensed, experienced and qualified investment advisors and get numerous opinions before taking any action. Your minimum risk on any investment in the world is: 100% loss of all your money. You may be taking or preparing to take leveraged positions in investments and not know it, exposing yourself to unlimited risks. This is highly concerning if you are an investor in any derivatives products. There is an approx $700 trillion OTC Derivatives Iceberg with a tiny portion written off officially. The bottom line:
Are You Prepared?
Gold and gold stocks especially continue to shrug off bits and pieces of bad news.
No escalation in the trade war? The selloff lasted one day and the sector rebounded strongly the following day.
Strong headline jobs number? Again, the weakness was a buying opportunity.
This past week there was more.
The June CPI report came in hotter than expected, which could mitigate the degree the Fed eases in the future. Also, bond yields in the US have risen the entire week.
No dice.
Gold closed the week at $1412/oz while the gold stocks closed just inches from new highs on the daily charts.
Turning to the technicals of the gold stocks, we see both underlying and relative strength.
Nearly 95% of the large miners closed above the 200-day moving average. Meanwhile GDX relative to both the S&P 500 and Gold is above a rising 200-day moving average. The GDX to Gold ratio is at a 2-year high while the GDX to S&P 500 ratio is very close to a new 52-week high.
GDXJ is lagging GDX a bit but it is coming around.
90% of the ETF closed above the 200-day moving average. That is the highest reading in nearly three years.
GDXJ relative to the S&P and Gold has turned bullish and is holding above upward sloping 200-day moving averages.
The immediate upside targets for GDX and GDXJ are GDX $27.50 and GDXJ $37.50. The next level of targets would be GDX $30 and GDXJ $41.
Gold has endured some selling in the $1420-$1425/oz range but has remained bid around $1400/oz. A daily close above $1420/oz would remove much of the resistance from here to the low $1500s.
For investors in the juniors and seniors, continue to hold your winners and focus your capital on fresh opportunities and value plays that could move with the next leg higher. To learn which stocks we own and intend to buy that have 3x to 5x potential, consider learning more about our premium service.
Gold surged dramatically in recent weeks, powering higher to a decisive bull-market breakout. Gold’s first major secular highs in years have really improved sentiment, with bullishness mounting. But gold-futures buying fuel is largely exhausted, after the colossal amount expended to catapult gold back over $1400. That leaves this metal at high risk of suffering a major selloff, a healthy correction in an ongoing bull market.
Even the most-powerful bull markets flow and ebb, taking two steps forward before one step back. Gold is certainly no exception. At best in late June, its current bull extended to modest 35.4% gains over 3.5 years. Those weren’t linear, the path to gold’s recent breakout high was quite volatile. It included a 29.9% upleg, a 17.3% correction, a 20.4% upleg, a 13.6% correction, and today’s upleg running 21.2% at best.
This alternating repeating bull-market pattern is simple, uplegs are inevitably followed by material selloffs often extending into correction territory. Periodic corrections are essential to keep bulls healthy, working off the excessive greed that builds as uplegs peak. That risks sucking in too much capital too soon, prematurely burning out bulls. Corrections rebalance sentiment, bleeding away greed to extend bulls’ longevity.
Even though they are inevitable, normal corrections stress out the majority of traders. The selling taints their psychology and clouds their perspectives of longer-terms trends in play. They fret bulls are dying, and sell out too early and too low. Instead corrections should be embraced, as they offer the greatest opportunities to buy relatively low within ongoing bulls! Entering near correction lows amplifies gains.
While gold’s current bull clocked in at 35.4% total in late June, its three major uplegs added up to much-larger 71.5% gains. Traders had the potential to more than double gold’s headline gains by attempting to buy relatively low later in corrections and sell relatively high later in uplegs! Although impossible to game bull-market swings’ major lows and highs precisely in real-time, trading near them really boosts capital growth.
The reason gold faces high risk for its next major selloff today is speculators’ current positioning in gold futures. Unfortunately spec gold-futures trading has a wildly-disproportional influence over short-term gold price levels. The dominant reason is the extreme leverage inherent in gold futures, which greatly multiplies that capital’s impact on gold prices. This unfair reality has sorely vexed the gold market for decades.
When a normal investor buys gold outright, $1 of capital exerts $1 of buying pressure on the gold price. That’s the way markets are supposed to work. That can be extended with margin in the stock markets, which has had a hard legal limit of 2.0x since 1974. $1 of capital using maximum margin to buy shares in the leading GLD SPDR Gold Shares gold ETF can exert $2 of buying pressure on gold. That’s still reasonable.
But gold-futures trading is way out in its own extreme realm. Each gold-futures contract controls 100 troy ounces of gold. At this Wednesday’s data cutoff for this essay, gold closed at $1417. So each contract wields gold worth $141,700. An investor would have to put up $141,700 to control that much gold, or $70,850 using stock-market-legal-limit leverage on GLD shares. Futures speculators only need $4,000!
That’s no typo, this week the CME Group only requires traders to have $4,000 cash in their accounts for each gold-futures contract they want to trade. That is absurd, enabling extreme maximum leverage of 35.4x! That means a fully-margined gold-futures speculator can exert $35 of buying or selling pressure on gold with each $1 deployed. That temporarily outguns investors, even though they have vastly more capital.
The Federal Reserve has capped stock-market leverage at 2.0x for 45 years because extreme leverage has extreme risks. At 35.4x, a mere 2.8% gold move against speculators’ gold-futures bets would wipe out 100% of their capital risked! This constant threat of ruin forces these traders’ focus to an ultra-myopic short-term span, days or weeks at most. All they can do is ride gold’s immediate momentum, piling on.
As if arbitrarily declaring $1 of gold-futures capital should have up to 35x the influence on gold prices as $1 invested outright isn’t ridiculous enough, it gets worse. Unscrupulous traders can wield gold futures’ extreme leverage like a weapon to manipulate gold prices at key technical and sentimental junctures. One way is spoofing, slamming the market with huge gold-futures orders that are canceled before being executed.
This is not theoretical. In late June the U.S. Department of Justice levied $25m of criminal fines on Merrill Lynch Commodities for this very behavior! And that’s just the tip of the iceberg for gold futures’ extreme leverage being abused to defraud normal investors. This seriously needs to be legally capped at vastly-lower levels. The DoJ’s actual press release did a great job explaining how gold-futures spoofing works.
“…beginning by at least 2008 and continuing through 2014, precious metals traders employed by MLCI schemed to deceive other market participants by injecting materially false and misleading information into the precious metals futures market. They did so by placing fraudulent orders for precious metals futures contracts that, at the time the traders placed the orders, they intended to cancel before execution.”
“In doing so, the traders intended to “spoof” or manipulate the market by creating the false impression of increased supply or demand and, in turn, to fraudulently induce other market participants to buy and to sell futures contracts at quantities, prices and times that they otherwise likely would not have done so. Over the relevant period, the traders placed thousands of fraudulent orders.” These crooks should be in prison!
Compounding gold futures’ gold-price impact, the American gold-futures price is gold’s global reference one. So gold-futures trading moving the gold price heavily influences and sometimes totally controls the entire gold market’s psychology! Investors are motivated to buy and sell gold outright based on what is happening in gold futures. It’s impossible to understand and game gold without closely watching futures.
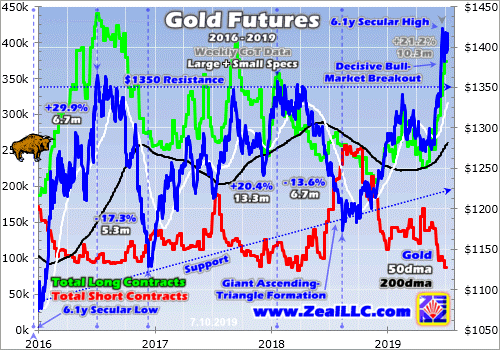
I had to break my chart into two parts today, lest it get too busy to parse. These superimpose gold’s price through its current bull market over speculators’ gold-futures positioning. Reported weekly by the CFTC in its famous Commitments of Traders reports, specs’ long contracts or upside bets on gold are shown in green while their short contracts or downside bets are rendered in red. They usually dominate gold action.
The wildly-disproportional influence on gold prices by speculators’ gold-futures trading is critical for all investors to understand. Let’s start with this gold bull itself, the cadence of its uplegs and corrections. Its maiden upleg erupted in mid-December 2015 out of deep 6.1-year secular lows in gold, and ultimately blasted up 29.9% in 6.7 months by early July 2016. Major selloffs inevitably follow major uplegs in any bull.
So gold plunged 17.3% over 5.3 months into mid-December 2016 in a severe correction. That was way bigger than normal, greatly exacerbated by Trump’s surprise election victory in early November that year. With Republicans controlling the presidency and both chambers of Congress, stock markets soared on hopes for big tax cuts soon. That crushed gold demand, as fully 5/8ths of that correction came after the election!
While ugly, gold remained in a bull market since that massive selloff didn’t cross the -20% threshold for a new bear market. Gold quickly rebounded from those deep lows and gradually powered to another nice bull-market upleg, up 20.4% over 13.3 months leading into late January 2018. This gold bull’s second major upleg was followed by its second major correction, a 13.6% drop over 6.7 months by mid-August 2018.
That birthed today’s third major upleg, which had extended to 21.2% at best over 10.3 months by late June. This past month saw gold get exciting again after decisively breaking out of its years-long giant ascending-triangle technical formation to surge to major new bull-market and secular highs. This bull’s pattern has been upleg, correction, upleg, correction, upleg. What comes next in this series is obvious.
Gold is at high risk for another major selloff, potentially a full-blown correction over 10% again, because of speculators’ gold-futures positioning. This next chart illuminates what the specs were doing during each of this gold bull’s uplegs and corrections including today’s newest one. These hyper-leveraged traders with their outsized impact on gold prices have effectively exhausted their near-term buying, threatening big selling!
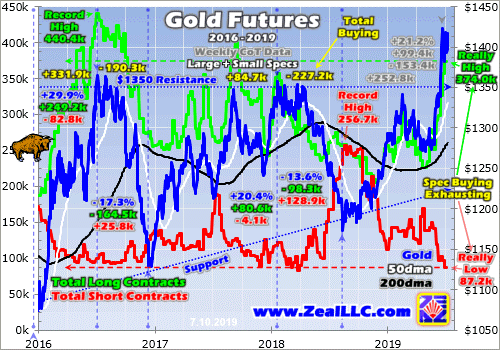
This gold bull’s initial upleg in largely the first half of 2016 was massive, the biggest in this bull so far at 29.9%. That was partially fueled by gold-futures speculators buying a staggering 249.2k long contracts and buying to cover another 82.8k short ones! There are two kinds of buying and two kinds of selling in gold futures, and each set has the same price impact on gold. Thus they can be lumped together for analysis.
Specs can buy new gold-futures contracts to establish long positions, the normal way to buy. But they also buy to cover and close previously-established short positions. The upward pressure on gold from buying longs and covering shorts is identical. On the selling side they can sell their own existing longs, or effectively borrow gold-futures contracts they don’t own to short sell them. Both types hit gold the same way.
Speculators’ total gold-futures buying in this gold bull’s first upleg ran a mind-boggling 331.9k contracts! That’s the equivalent of 1032.4 metric tons of gold. For comparison, total global gold investment demand in the first half of 2016 ran 1091.6t per the World Gold Council’s latest fundamental data. That epic spec long buying catapulted their total upside bets to an all-time-record high of 440.4k contracts as that upleg peaked!
Keep these numbers in mind. This gold bull’s greatest upleg soared 29.9% higher on 331.9k contracts of total buying by gold-futures speculators. That forced their total longs to their highest levels ever seen of 440.4k contracts. As I’ll discuss shortly, today’s latest gold upleg is skating ever closer to those extreme levels. The ice gets pretty thin in that rarefied air of likely gold-futures buying being essentially exhausted.
This gold bull’s first major correction was largely driven by specs reversing that huge long build in largely the second half of 2016. Note the green spec-longs line above collapsed symmetrically to its massive surge in the preceding upleg. Specs dumped 164.5k long contracts and short sold 25.8k more over that severe correction’s exact span. That adds up to 190.3k contracts of total selling, the equivalent of 592.0t.
During gold-bull uplegs the green spec-longs line rises while the red spec-shorts line falls. Then in following corrections that reverses, the green line falling while the red one rises. Gold-futures buying and selling is heavily driving these major bull-market cycles in gold, and that’s not going to change until regulators wake up and radically curtail gold futures’ extreme inherent leverage. Gold’s second upleg straddled 2017.
That was somewhat peculiar, as the spec gold-futures long buying of 80.6k contracts and short covering of 4.1k only totaled 84.7k. That wasn’t much considering gold’s strong 20.4% upleg gains. But realize that gold upleg effectively topped much earlier in early September 2017. Its later upleg peak was marginal. As gold challenged its $1350 bull-market resistance, total spec longs soared as high as 400.1k contracts!
This gold bull’s second correction mostly unfolded during the first half of 2018, and was a textbook-perfect example of heavy spec gold-futures selling. Their green longs line plunged by 98.3k contracts, while their red shorts line rocketed an enormous 128.9k contracts higher. That correction bottomed last August as total spec shorts soared to their own all-time-record high of 256.7k contracts! That portended the next upleg.
Back in early September, I wrote an essay on the “Record Gold/Silver Shorts!”. Published when gold still languished way down at $1196, I concluded then “gold and silver soon soared on short-covering buying following all past episodes of excessive and record short selling. There’s nothing more bullish for gold and silver than extreme shorts! … Record futures shorts are the best gold and silver buy signals available.”
Speculators’ collective gold-futures positions provide both excellent buy signals near major gold lows and excellent sell signals near major gold highs. Smart contrarians get really bullish on gold when specs are really bearish as evidenced by relatively-low longs and relatively-high shorts. And it is just as prudent to get short-term bearish on gold when specs are excessively bullish with relatively-high longs and -low shorts.
This is exactly the situation we’re in today, and it’s growing ominously extreme. This gold bull’s third upleg powered 21.2% higher at best so far as of late June, propelling this metal to a new 6.1-year secular high of $1423. This awesome decisive-bull-breakout upleg was again fueled by enormous gold-futures buying by speculators. They added 99.4k long contracts, while buying to cover a staggering 153.4k short ones!
That adds up to total buying of 252.8k contracts as of gold’s latest peak in late June, or the equivalent of 786.3 metric tons of gold! That’s relevant because it is already 76% of the total gold-futures buying that unfolded during this gold bull’s huge maiden upleg in early 2016. Back then popular gold psychology was waxing really bullish, fostering that extreme gold-futures buying. Getting that high again today is a tall order.
The current gold-futures picture is even worse. While gold hit its latest interim high in late June, the gold-futures speculators kept on buying since. The weekly CoT reports are published late Friday afternoons current to the preceding Tuesdays. So the latest data available this week is current to last Tuesday July 2nd. That saw still more big spec buying, they added another 16.5k longs and covered another 10.2k shorts.
That extends this upleg’s total spec long buying to 115.9k contracts and short covering to 163.6k, making for a larger 279.5k total. Thus today’s upleg has already seen speculators buy 84% of the gold-futures contracts that they did during early 2016’s massive maiden upleg! That doesn’t leave much room to keep on adding more longs and covering more shorts to propel gold to major news highs in the coming weeks.
As of last Tuesday, total spec longs were already way up in nosebleed territory at 374.0k contracts! Out of the last 1070 CoT weeks since early 1999, only 2.2% saw spec longs higher. And that is getting closer to their all-time-record high of 440.4k in early July 2016. While they could conceivably go higher, that’s a hard ceiling until proven otherwise. Gold-futures speculators and their capital are finite, relatively small.
Out of all the world’s traders, only a tiny fraction are willing to run extreme 35x leverage and risk ruin on being slightly wrong on gold’s near-term direction. New gold highs really don’t mint sizable numbers of new gold-futures speculators either, as the risks are so crazy. And this small pool of gold-futures traders really don’t control much capital compared to broader markets. They’d be irrelevant without their extreme leverage.
So at some point gold-futures buying pressure literally exhausts itself. All the specs who want to be long gold have already bought in, expending all their available capital firepower. We can’t know in advance if it will happen at 375k longs, 400k, 425k, or 450k, but odds are it will be somewhere around there. Once the specs are all-in, all they can do is sell to start unwinding their excessively-bullish bets. That will hammer gold.
This relatively-young gold bull has seen three prior episodes where specs liquidated high longs, as seen in the falling green line above. Those were during this bull’s two corrections and a milder pullback in late 2018. Gold fell sharply each time, and this next episode of major spec long selling won’t prove different. At their latest 374.0k levels, spec longs are really high today with little room to buy and tons of room to sell!
The near-term gold risk is compounded by the fact spec shorts are also really low, just 87.2k contracts as of the last CoT report. That’s just a hair over the lowest levels of this entire bull market, 82.5k seen in late March 2018. So spec short-covering buying isn’t likely to go much lower, and in any case has a hard limit as these downside bets get closer to zero. Like spec long buying, spec short covering is largely exhausted.
Total spec gold-futures longs approaching bull-market and all-time-record highs, coupled with total spec gold-futures shorts just over bull-market lows, is very bearish for gold over the near-term! Remember by necessity these guys are short-term momentum followers, their extreme leverage will slaughter them if they are on the wrong side of gold for long. When gold noses over, their selling will intensify and cascade.
It certainly has the potential to snowball forcing another correction-grade gold selloff over 10%, which equates to a demoralizing sub-$1281 gold price. We might get lucky, the bullish new-high psychology could retard gold-futures selling. If the normalization of specs’ gold-futures bets is very slow, gold could see a milder pullback largely consolidating high. But we can’t bet on that based on all the bull-market precedent.
The greatest hope of gold evading a big selloff on gold-futures selling is investors returning in a big way. They control vastly more capital than the gold-futures speculators, so when they are buying aggressively that can easily absorb and overpower any gold-futures selling. But while new-high psychology has spawned some investment buying, it has only been sporadic so far with euphoric US stock markets near record highs.
Meanwhile traders should prepare for the next major gold selloff, possibly this gold bull’s third correction. That means tightening trailing stop losses on existing long positions in gold and the stocks of its miners. On stoppings, cash should be accumulated and not redeployed. It is simply too risky to add material new long positions in gold and gold stocks until speculators’ extreme gold-futures positioning considerably normalizes.
To multiply your capital in the markets, you have to trade like a contrarian. That means buying low when few others are willing, so you can later sell high when few others can. In recent months well before gold’s breakout, we recommended buying many fundamentally-superior gold and silver miners in our popular weekly and monthly newsletters. This week their unrealized gains ran as high as 112.8%, 105.0%, and 95.2%!
You need to stay informed about gold cycles and gold-futures positioning to profitably trade the high-potential gold stocks. Our newsletters are a great way, easy to read and affordable. They draw on my vast experience, knowledge, wisdom, and ongoing research to explain what’s going on in the markets, why, and how to trade them with specific stocks. Subscribe today and take advantage of our 20%-off summer-doldrums sale! Then you’ll be ready to buy back in relatively low for gold’s next major upleg.
The bottom line is gold is at high risk for a major selloff today. Speculators’ gold-futures positioning has grown excessively-bullish, leaving their buying firepower largely exhausted. That leaves vast room for big selling to snowball on the right catalyst. This bull’s prior episodes where specs had similar really-high longs and really-low shorts heralded major gold corrections. Extreme bets must eventually be normalized.
Such corrections are normal and healthy within ongoing bull markets, rebalancing sentiment to ensure longer lives with greater ultimate gains. These corrections should be embraced, as they yield the very best opportunities to buy relatively low within powerful bulls. Gold’s current bull is likely to run for years yet, so gird yourself for a major selloff and be ready to buy back in aggressively once it has largely run its course.
Adam Hamilton, CPA
July 15, 2019
Copyright 2000 – 2019 Zeal LLC (www.ZealLLC.com)
- While some gold stocks (the South Africans in particular) continue to rally, bullion and most miners are staging a classic pullback after a major upside breakout.
- Please click here now. Double-click to enlarge this important monthly gold chart. The bottom line:
- Breakouts are fun. Pullbacks are not!
- My advice to investors: Wait for the pain. Wait for emotional pain to begin before pressing the buy button on a pullback.
- Please click here now. Double-click to enlarge. I’ve highlighted key support zones on this daily gold chart, and the bottom line is this:
- The current pullback could end near $1380, $1360, or it could become quite a bit deeper before finally ending in the $1330-$1250 price zone.
- I don’t believe most gold investors are really prepared to handle a deeper pullback. Nervous investors should buy put options, not so much as a financial hedge but as an emotional hedge.
- A financial hedge is not required at this point in the U.S. business cycle, but any pullback can be emotionally troublesome. Investors need to do whatever it takes to handle the change in sentiment.
- Please click here now. Double-click to enlarge. On this daily gold chart, note the large uptrend channel and Fibonacci retracement lines from the 2018 August low.
- A “power uptrend” line has snapped and gold has only corrected down to the 76% retracement line area. A deeper correction is normal and healthy after the huge surge in the price after the monthly chart bull continuation breakout.
- Please click here now. Double-click to enlarge this dollar versus yen chart.
- The gold and the yen are risk-off currencies. The upside breakout in the dollar against the yen doesn’t guarantee a deeper correction for gold, but it does make it very likely.
- What are the fundamentals behind the gold price pullback and strength in the dollar against the yen?
- For the answer to that question, please click here now. I believe that both stock market and gold investors are over-estimating the Fed’s dovishness.
- Most institutional money managers are predicting a series of rate cuts and more QE from the Fed, but that’s not what the Fed’s dot plot or its chairman are indicating lies ahead.
- Friday’s U.S. employment report was strong and Trump has seemingly finally realized that his tariff tax tantrums are doing nothing but harm to global stock markets.
- In this situation, it’s very hard to see the Fed doing anything at the July 31 meeting other than a single quarter point “insurance” cut.
- While Poland’s central bank just bought almost 100 tons of physical gold, this is likely a “one-off” purchase and India’s fresh gold import tax hike came on the same day as the strong U.S. jobs report.
- The tax hike caught bullish analysts by surprise and adds to short-term pressure on the gold price.
- Investor tactics? Well, amateur investors should generally wait for a $100/ounce gold price sale before buying gold or silver. From the $1442 area highs, that would make the $1342 area a solid entry point. There’s not much else to do on the buy side until there is a $100/ounce price sale. It’s really that simple!
- Please click here now. Double-click to enlarge this weekly GDX chart. I called the $23-$18 price zone an important accumulation zone for investors.
- Those who took my strong buy recommendation can sell a small portion of their position now, but I recommend holding at least 70% of the position for an upside journey into my first target zone of $30-$32.
- I would not do any serious selling until GDX arrives in my second target zone of $38-$40. The main driver of a rally to that target zone will be a concerning rise in inflation that occurs as US corporate earnings and GDP growth continue to soften. The bottom line: Fed doesn’t need to cut nominal rates to make real rates fall in that situation. All it needs to do is…nothing! That’s because a rise in inflation with no change in nominal rates is a cut in real rates.
- The bottom line: I expect an institutional money manager stampede into GDX and key individual miners will occur later this year as stagflation rises to essentially become… a Grim Reaper made of gold!
Special Offer For Website Readers: Please send me an Email to freereports4@gracelandupdates.com and I’ll send you my free “Junior Champions In The Pullback Zone!” report. I highlight key junior miners that seem immune to the current gold price pullback and silver price gulag. They are blasting to fresh highs and I provide investors with key tactics to play the upside action!
Stewart Thomson
Graceland Updates
Email:
Stewart Thomson is a retired Merrill Lynch broker. Stewart writes the Graceland Updates daily between 4am-7am. They are sent out around 8am-9am. The newsletter is attractively priced and the format is a unique numbered point form. Giving clarity of each point and saving valuable reading time.
Risks, Disclaimers, Legal
Stewart Thomson is no longer an investment advisor. The information provided by Stewart and Graceland Updates is for general information purposes only. Before taking any action on any investment, it is imperative that you consult with multiple properly licensed, experienced and qualified investment advisors and get numerous opinions before taking any action. Your minimum risk on any investment in the world is: 100% loss of all your money. You may be taking or preparing to take leveraged positions in investments and not know it, exposing yourself to unlimited risks. This is highly concerning if you are an investor in any derivatives products. There is an approx $700 trillion OTC Derivatives Iceberg with a tiny portion written off officially. The bottom line:
Are You Prepared?
First Vanadium Corp. (TSX-V: FVAN) / (OTCQX: FVANF) has been under pressure, along with hundreds of battery metal juniors and the underlying metals including vanadium, cobalt, lithium. Even vanadium giant Largo Resources is down 61% from its 52-week high. Yet, if one believes in vanadium, it’s hard to ignore First Vanadium’s shares at C$0.44, down 78%! The pro forma Enterprise Value [market cap + debt – cash] is just US$12.8M. The Company has C$1.9M in cash.
Yet, even at current vanadium pentoxide (“V2O5“) prices, the in-situ value of the Indicated-only portion (303 million pounds) of the Company’s estimated resource is ~US$2.5 billion. Management believes it has the largest high-grade primary vanadium resource in North America.
There has been a lot of weeping and gnashing of teeth over the V2O5 (China) price falling from a 2019 high of US$17.6 to its current US$8.2 per pound. But, as the saying goes, the cure to low prices is…. low prices. Few new projects make sense at today’s levels. I believe that V2O5 (China) between US$10-US$15 per pound might be a sweet spot, good for both producers and end users.
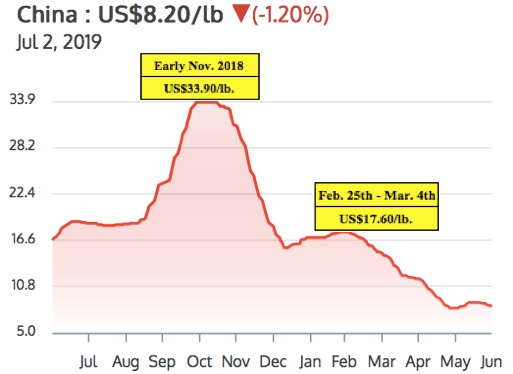
Steel companies can afford to pay higher prices for V2O5, but grid-scale, Vanadium Redox Flow Battery (“VRBs“) Energy Storage Systems (outside of China) might need prices below US$10/lb. to go mainstream. Importantly though, VRB plant costs are coming down. Vincent Sprenkle, a lead researcher at the U.S. Department of Energy’s Pacific Northwest National Laboratory, (“PNNL“) recently said, “VRB costs could be lowered by another 50%.” That would be very bullish for vanadium prices, it would allow for widespread adoption of VRBs even with V2O5 prices above US$10/lb.
First Vanadium has a sizable resource, a good grade, in a great jurisdiction. A Preliminary Economic Assessment (“PEA”) is expected by year end. The following interview of Paul Cowley, P.Geo., President, CEO & Director of First Vanadium, was conducted by phone & email between June 24th & July 2nd.
Please tell us about yourself and your team.
I’m an exploration geologist with 40 years’ experience in the discovery & evaluation of mineral deposits around the world. About half of my career was with a Major, BHP Minerals. I was involved in leading the team in the Canadian arctic that made 4 gold deposit discoveries that generated about 6 million ounces of gold. I also worked at Escondida and BHP’s Ekati diamond mine during their exploration days.
I’m a senior guy, but I’m the youngest of our group. The others have even more years of experience. We have two mining engineers that held mine general manager positions of very significant mines at Majors. We have four metallurgists that have worked for Majors, in senior roles. We have a construction engineer who’s built 20 mines in North & South America, he’s currently building Lundin’s mine in Ecuador.
What do you make of the recent volatility in the vanadium price?
Since early March 2019 the vanadium price has taken an unexpected turn lower. Prices are not responding to the bigger picture demand and supply imbalance. Chinese steel plants did not recharge their vanadium inventories in this period, as many expected they would, putting pressure on traders to liquidate at undercutting prices, but they will have to restock. The U.S.-China trade wars, and some shortfall of enforcement of new Chinese rebar standards, appear to have exacerbated the situation in the short term.
It’s our view that the fundamentals of demand in global steel applications will outstrip supply and should push vanadium prices higher again in the second half of the year, and beyond. Adding to the demand side is the exciting boom in solar & wind projects, all of which require battery storage. This is happening on so many levels around the world that we expect to see the vanadium battery carve out a healthy market share in this expanding renewable space. Some are calling the 2020’s, the Solar Decade.
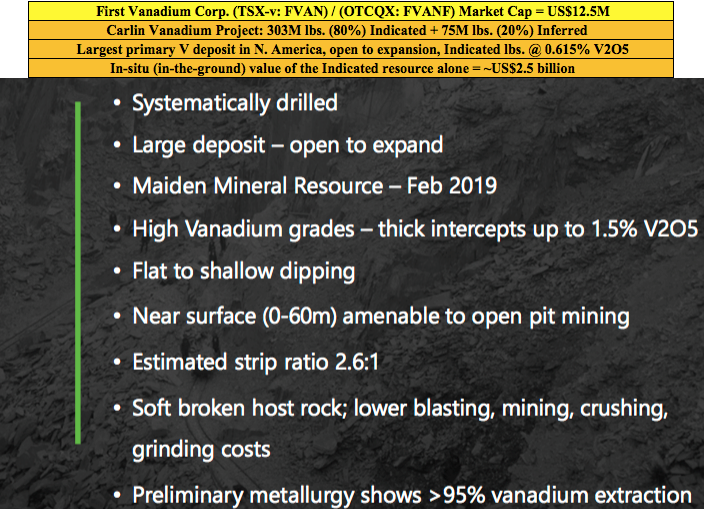
Please explain the significance of the historical data you recently received, that extended the strike length by 300 meters to the south.
It means more potential than we had expected. From our drilling, the deposit appears to be open to expansion in several areas, but we did not expect the deposit to be open to the south. The newly acquired data demonstrates a 15% strike length increase to the south and it’s still open in that direction. This is exciting news as this data was not included in the resource estimate we put out in February.
You already have a 303 million pound vanadium resource (in-situ value of ~US$2.5 billion) in the Indicated category alone. Does the resource need to get any bigger?
That’s a good question. But it needs to be answered through an economic study. In our view, the resource is sizable. It’s currently the largest, highest-grade primary vanadium resource in North America. Our immediate priority is to demonstrate potential economic viability with what we have, knowing that we believe we could always make it bigger if and when we need to.
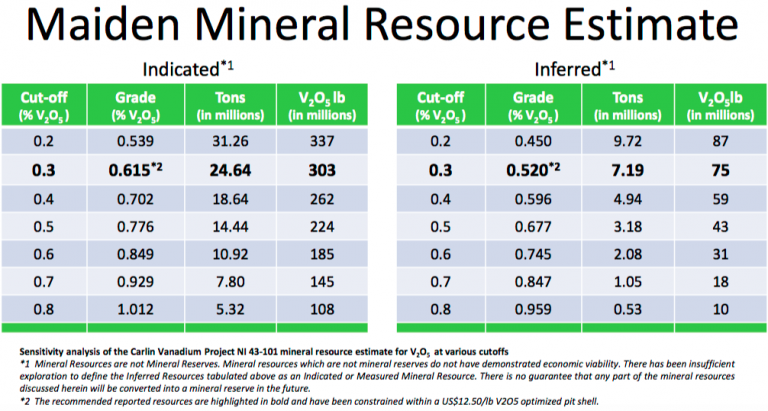
Several readers may assume that First Vanadium will need an expensive roaster in its operating flow sheet. What are your latest thoughts?
Not true. The path we are on with our metallurgical flow sheet does not include, or require, a roaster.
Although Nevada is the #1 global mining jurisdiction in the latest Fraser Institute Mining Survey, some complain that it takes a long time to get permits. What does your team expect in this regard?
In general, in the U.S. that is true, but not in Nevada. Nevada has a responsible review and process, but it’s a mining state. And, even more so for us now that vanadium is on the critical minerals list. The U.S. has unveiled its strategy in an effort to rebuild struggling domestic supply chains for metals & minerals it deems “critical” to the country’s manufacturing & defense sectors. Recently this was reiterated when President Trump & Prime Minister Trudeau announced a plan for the U.S. & Canada to collaborate on critical minerals.
What are the latest developments on the metallurgical front?
We continue to make strides on the metallurgical front. In April we announced an average of 95% vanadium extraction from the rock across the deposit, into solution. We do not know what ultimate recoveries will look like just yet, but we are making good progress. And, we’re making strides in the area of pre-concentration, with the aim to reduce the plant size, which would lower the capital intensity of the project.
What are First Vanadium’s plans for a Preliminary Economic Assessment (“PEA”)? Might that be a 1H 2020 event?
No, we think that we can move faster, our aim is to initiate a PEA in the 3rd quarter, with results to be reported before the end of the year.
Why should readers consider buying shares of First Vanadium?
I see very good value and upside; an exceptional senior technical team, a good share structure and a great project. We now have C$1.9 million in cash with the recent private placement closing, and 42.4 million shares. Our share price now is where it was at the beginning of 2018! Yet, we have delivered two successful drill campaigns, a mineral resource with considerably higher grades, and more metal in the ground than our historical resource, and 80% (303 million pounds) of it is in the Indicated category.
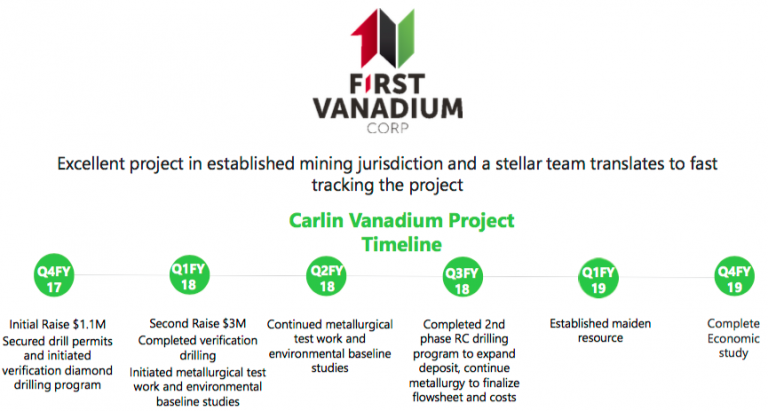
That, plus positive metallurgical test work and environmental baseline studies to advance permitting. If one is bullish on the vanadium price, currently at US$8.20/lb., then First Vanadium’s (TSX-V: FVAN) / (OTCQX: FVANF) project in the #1 of 84 ranked global jurisdiction of Nevada should be high on the list of projects to consider investing in.
Thank you Paul, very interesting and timely commentary on the vanadium market and on First Vanadium. I look forward to seeing a PEA later this year!
Peter Epstein
Epstein Research
July 9, 2019
Disclosures: The content of this interview is for information only. Readers fully understand and agree that nothing contained herein, written by Peter Epstein of Epstein Research [ER], (together, [ER]) about First Vanadium Corp., including, but not limited to, commentary, opinions, views, assumptions, reported facts, calculations, etc. is not to be considered implicit or explicit investment advice. Nothing contained herein is a recommendation or solicitation to buy or sell any security. [ER] is not responsible under any circumstances for investment actions taken by the reader. [ER] has never been, and is not currently, a registered or licensed financial advisor or broker/dealer, investment advisor, stockbroker, trader, money manager, compliance or legal officer, and does not perform market making activities. [ER] is not directly employed by any company, group, organization, party or person. The shares of First Vanadium Corp. are highly speculative, not suitable for all investors. Readers understand and agree that investments in small cap stocks can result in a 100% loss of invested funds. It is assumed and agreed upon by readers that they will consult with their own licensed or registered financial advisors before making any investment decisions.
At the time this article was posted, Peter Epstein owned no shares of First Vanadium Corp. and the Company was an advertiser on [ER].
Readers understand and agree that they must conduct their own due diligence above and beyond reading this article. While the author believes he’s diligent in screening out companies that, for any reasons, are unattractive investment opportunities, he cannot guarantee that his efforts will (or have been) successful. [ER] is not responsible for any perceived, or actual, errors including, but not limited to, commentary, opinions, views, assumptions, reported facts, financial calculations, etc., or for the completeness of this interview or future content. [ER] is not expected or required to subsequently follow or cover events & news, or write about any particular company. [ER] is not an expert in any company, industry sector or investment topic.
Gold’s incredible strength this summer is very unusual, as early summers are the weakest times of the year seasonally for gold, silver, and their miners’ stocks. With traders’ attention diverted to vacations and summer fun, interest in and demand for precious metals normally wane. So this entire sector tends to suffer a seasonal lull, along with the general markets. This June’s bull-market breakout is a momentous anomaly.
This doldrums term is very apt for gold’s usual summer predicament. It describes a zone in the world’s oceans surrounding the equator. There hot air is constantly rising, creating long-lived low-pressure areas. They are often calm, with little or no prevailing winds. History is full of accounts of sailing ships getting trapped in this zone for days or weeks, unable to make headway. The doldrums were murder on ships’ morale.
Crews had no idea when the winds would pick up again, while they continued burning through their limited stores of food and drink. Without moving air, the stifling heat and humidity were suffocating on these ships long before air conditioning. Misery and boredom were extreme, leading to fights breaking out and occasional mutinies. Being trapped in the doldrums was viewed with dread, it was a very trying experience.
Gold investors can somewhat relate. Like clockwork nearly every summer, gold starts drifting listlessly sideways. It often can’t make significant progress no matter what the trends looked like heading into June, July, and August. As the days and weeks slowly pass, sentiment deteriorates markedly. Patience is gradually exhausted, supplanted with deep frustration. Plenty of traders capitulate, abandoning ship.
Thus after decades of trading gold, silver, and their miners’ stocks, I’ve come to call this time of year the summer doldrums. Junes and Julies in particular are usually desolate sentiment wastelands for precious metals, totally devoid of recurring seasonal demand surges. Unlike much of the rest of the year, these summer months simply lack any major income-cycle or cultural drivers of outsized gold investment demand.
The vast majority of the world’s investors and speculators live in the northern hemisphere, so markets take a back seat to the great joys of summer. Traders take advantage of the long sunny days and kids being out of school to go on extended vacations, hang out with friends, and enjoy life. And when they aren’t paying much attention to the markets, naturally they aren’t allocating much new capital to gold.
Given gold’s dull summer action historically, it is never wise to expect too much from it this time of year. Summer rallies can happen, but they aren’t common. So expectations need to be tempered, especially in Junes and Julies. That early-1990s Gin Blossoms song “Hey Jealousy” comes to mind, declaring “If you don’t expect too much from me, you might not be let down.” The markets are ultimately an expectations game.
Quantifying gold’s summer seasonal tendencies during bull markets requires all relevant years’ price action to be recast in perfectly-comparable percentage terms. That is accomplished by individually indexing each calendar year’s gold price to its last close before market summers, which is May’s final trading day. That is set at 100, then all gold-price action each summer is recalculated off that common indexed baseline.
So gold trading at an indexed level of 105 simply means it has rallied 5% from May’s final close, while 95 shows it is down 5%. This methodology renders all bull-market-year gold summers in like terms. That’s necessary since gold’s price range has been so vast, from $257 in April 2001 to $1894 in August 2011. That span encompassed gold’s last secular bull, which enjoyed a colossal 638.2% gain over those 10.4 years!
Obviously 2001 to 2011 were certainly bull years. 2012 was technically one too, despite gold suffering a major correction following that powerful bull run. At worst that year, gold fell 18.8% from its 2011 peak. That was not quite enough to enter formal bear territory at a 20%+ drop. But 2013 to 2015 were definitely brutal bear years, which need to be excluded since gold behaves very differently in bull and bear markets.
In early 2013 the Fed’s wildly-unprecedented open-ended QE3 campaign ramped to full speed, radically distorting the markets. Stock markets levitated on the Fed’s implied backstopping, slaughtering demand for alternative investments led by gold. So in Q2’13 alone, gold plummeted 22.8% which proved its worst quarter in an astounding 93 years! Gold’s bear continued until the Fed started hiking rates again in late 2015.
The day after that first rate hike in 9.5 years in mid-December 2015, gold plunged to a major 6.1-year secular low. Then it surged out of that irrational rate-hike scare, formally crossing the +20% new-bull threshold in early March 2016. Ever since, gold has remained in this current bull. At worst in December 2016 after gold was crushed on the post-election Trumphoria stock-market surge, it had only corrected 17.3%.
So the bull-market years for gold in modern history ran from 2001 to 2012, skipped the intervening bear-market years of 2013 to 2015, then resumed in 2016 to 2019. Thus these are the years most relevant to understanding gold’s typical summer-doldrums performance, which is necessary for managing your own expectations this time of year. This spilled-spaghetti mess of a chart is fairly simple and easy to understand.
The yellow lines show gold’s individual-year summer price action indexed from each May’s final close for all years from 2001 to 2012 and 2016 to 2017. 2018’s is rendered in light blue. Together these establish gold’s summer trading range. All those past bull-market years’ individual indexes are averaged together in the red line, revealing gold’s central summer tendency. 2019’s indexed action is superimposed in dark blue.
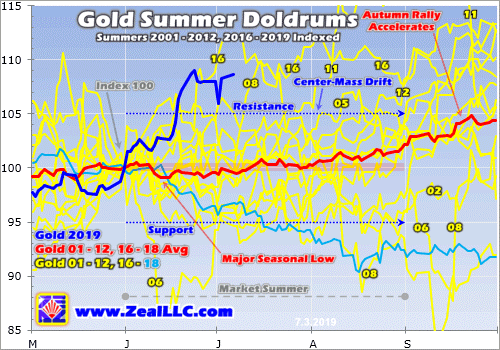
While there are outlier years, gold generally drifts listlessly in the summer doldrums much like a sailing ship trapped near the equator. The center-mass drift trend is crystal-clear in this chart. The vast majority of the time in June, July, and August, gold simply meanders between +/-5% from May’s final close. This year that equated to a probable summer range between $1240 to $1370. Gold tends to stay well within trend.
Obviously this year has proven a huge exception to that normal summer rule, with gold rocketing higher to a major bull-market breakout! Gold blasted to its best early-summer performance ever seen in all modern bull-market years. Comparing this current summer’s dark-blue line to past years’ price action certainly drives home how unique, exceptional, and special gold’s breakout surge to major new secular highs has been.
Still, understanding gold’s typical behavior this time of year is important for traders. Sentiment isn’t only determined by outcome, but by the interplay between outcome and expectations. If gold rallies 5% but you expected 10% gains, you will be disappointed and grow discouraged and bearish. But if gold rallies that same 5% and you expected no gains, you’ll be excited and get optimistic and bullish. Expectations are key.
History has proven it is wise not to expect too much from gold in these lazy market summers, particularly Junes and Julies. Occasionally gold still manages to stage a summer rally, like this year’s monster. But most of the time gold doesn’t veer materially from its usual summer-drift trading range, where it is often adrift like a classic tall ship. With range breakouts either way uncommon, there’s often little to get excited about.
In this chart I labeled some of the outlying years where gold burst out of its usual summer-drift trend, both to the upside and downside. But these exciting summers are atypical, and can’t be expected very often. Most of the time gold grinds sideways on balance not far from its May close. Traders not armed with this critical knowledge often wax bearish during gold’s summer doldrums and exit in frustration, a real mistake.
Gold’s summer-doldrums lull marks the best time of the year seasonally to deploy capital, to buy low at a time when few others are willing. Gold enjoys powerful seasonal rallies that start in Augusts and run until the following Mays! These are fueled by outsized investment demand driven by a series of major income-cycle and cultural factors from around the world. Summer is when investors should be bullish, not bearish.
The red average indexed line above encompassing 2001 to 2012 and 2016 to 2018 reveals gold’s true underlying summer trend in bull-market years. Technically gold’s major seasonal low arrives relatively early in summers, mid-June. On average through all these modern bull-market years, gold slumped 0.9% between May’s close and that summer nadir. But seasonally that’s still on the early side to deploy capital.
Check out the yellow indexed lines in this chart. They tend to cluster closer to flatlined in mid-June than through all of July. The only reason gold’s seasonal low appears in mid-June mathematically is a single extreme-outlier year, 2006. The spring seasonal rally was epic that year, gold rocketed 33.4% higher to a dazzling new bull high of $720 in just 2.0 months between mid-March to mid-May! That was incredible.
Extreme euphoria had catapulted gold an astounding 38.9% above its 200-day moving average, radically overbought by any standard. That was way too far too fast to be sustainable, so after that gold had to pay the piper in a sharp mean-reversion overshoot. So over the next month or so into mid-June, gold’s overheated price plummeted 21.9%! That crazy outlier is the only reason gold’s major summer low isn’t later.
There were 15 bull-market years from 2001 to 2012 and 2016 to 2018. That is a big-enough sample to smooth out the trend, but not large enough to prevent extreme deviations from skewing it a bit. Gold sees a series of marginally-higher lows in late June, early July, and even late July. In this dataset they came in 0.0%, 0.3%, and 0.8% higher than mid-June’s initial low. And that last late-July one arrives over 6 weeks later.
So generally there’s no hurry to deploy capital right at that initial mid-June seasonal low. Gold tends to drift nearly flatlined over the next several weeks into early July, trying traders’ patience. Buying within a few trading days of the US Independence Day holiday seems to have the best odds of catching gold near its summer-doldrums lows. Investment capital inflows usually begin ramping back up after that as traders return.
On average in these modern bull-market years, gold slipped 0.4% in Junes before rallying 0.7% in Julies. After July’s initial lazy summer week, gold tends to gradually start clawing its way back higher again. But this is so subtle that Julies often still feel summer-doldrumsy. By the final trading day in July, gold is still only 0.3% higher than its May close kicking off summers. That’s too small to restore damaged sentiment.
Since gold exited May 2019 at $1305, an average 0.3% rally by July’s end would put it at $1309. That’s hardly enough to generate excitement after two psychologically-grating months of drifting. But the best times to deploy any investment capital are when no one else wants to so prices are low. Gold’s summer doldrums come to swift ends in Augusts, which saw hefty average gains of 1.9% in these bull-market years!
And that’s just the start of gold’s major autumn seasonal rally, which has averaged strong 5.7% gains between mid-Junes to late Septembers. That is driven by Asian gold demand coming back online, first post-harvest-surplus buying and later Indian-wedding-season buying. June is the worst of gold’s summer doldrums, and the first half of July is when to buy back in. It’s important to be fully deployed before August.
These gold summer doldrums driven by investors pulling back from the markets to enjoy their vacation season don’t exist in a vacuum. Gold’s fortunes drive the entire precious-metals complex, including both silver and the stocks of the gold and silver miners. These are effectively leveraged plays on gold, so the summer doldrums in them mirror and exaggerate gold’s own. Check out this same chart type applied to silver.
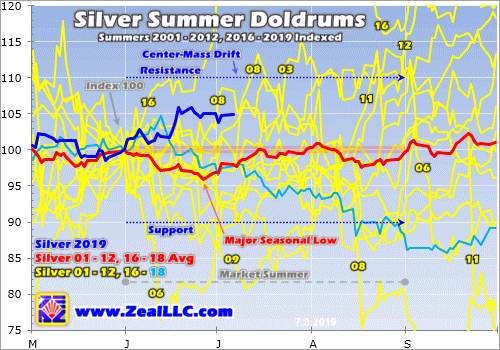
Since silver is much more volatile than gold, naturally its summer-doldrums-drift trading range is wider. The great majority of the time, silver meanders between +/-10% from its final May close. That came in at $14.56 this year, implying a summer-2019 silver trading range between $13.10 to $16.02. While silver suffered that extreme June-2006 selling anomaly too, its major seasonal low arrives a couple weeks after gold’s.
Given gold’s spectacular bull-market-breakout surge last month, silver’s summer performance this year has been utterly dismal. Normally silver amplifies gold upside by at least 2x. But silver has been bombed out and languishing for so long that investors and speculators still want nothing to do with it. Silver often acts as a gold sentiment gauge, and gold hasn’t been over $1400 long enough yet to shift psychology to bullish.
On average in these same gold-bull-market years of 2001 to 2012 and 2016 to 2018, silver dropped 4.1% between May’s close and late June. That is much deeper than gold’s 0.9% seasonal slump, which isn’t surprising given silver’s leverage to gold. Silver’s summer performances are also much lumpier than gold’s. Junes see average silver losses of 3.2%, but those are more than erased in strong rebounds in Julies.
Silver’s big 3.6% average rally in Julies amplifies gold’s gains by an impressive 5.1x! But unfortunately silver hasn’t been able to maintain that seasonal momentum, with Augusts averaging a modest decline of 0.7%. Overall from the end of May to the end of August, silver’s summer-doldrums performance tends to drift lower. Silver averaged a 0.4% full-summer loss, way behind gold’s 2.2% gain through June, July, and August.
That means silver sentiment this time of year is often worse than gold’s, which is already plenty bearish. The summer doldrums are more challenging for silver than gold. Being in the newsletter business for a couple decades now, I’ve heard from countless discouraged investors over the summers. While I haven’t tracked this, it sure feels like silver investors have been disproportionally represented in that feedback.
Since gold is silver’s primary driver, this white metal is stuck in the same dull drifting boat as gold in the market summers. Silver usually leverages whatever is happening in gold, both good and bad. But again the brunt of silver’s summer weakness is borne in Junes. Fully expecting this seasonal weakness and rolling with the punches helps prevent getting disheartened, which in turn can lead to irrationally selling low.
The gold miners’ stocks are also hostage to gold’s summer doldrums. This last chart applies this same methodology to the flagship HUI gold-stock index, which mostly closely mirrors that leading GDX VanEck Vectors Gold Miners ETF. The major gold stocks tend to amplify gold’s gains and losses by 2x to 3x, so it is not surprising that the HUI’s summer-doldrums-drift trading range is also twice as wide as gold’s own.
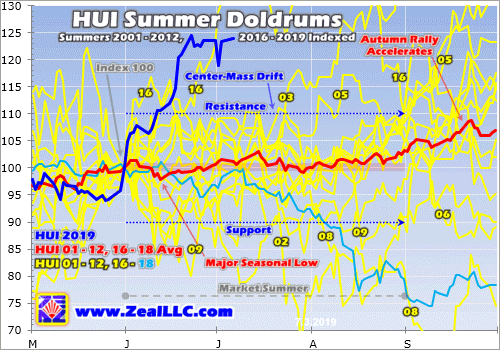
The gold miners’ stocks share silver’s center-mass summer drift running +/-10% from May’s close. This year the HUI entered the summer doldrums at 157.1, implying a June, July, and August trading range of 141.4 to 172.8. While gold stocks’ GDX ETF is too young to do long-term seasonal analysis on, in GDX terms this summer range translates to $19.43 to $23.75 this year. That’s based off a May 31st close of $21.59.
Thanks to gold’s dazzling bull-market breakout, gold stocks have defied these weak summer seasonals this year to soar to their own major decisive breakout! This high-potential contrarian sector has enjoyed its best early-summer performance ever witnessed in gold’s modern bull-market years. While I hope this incredible outperformance persists, the summer doldrums could still reassert themselves if gold retreats.
Like gold, the gold stocks’ major summer seasonal low arrives in mid-June. On average in these gold-bull-market years of 2001 to 2012 and 2016 to 2018, by then the HUI had slid 2.1% from its May close. Then gold stocks tended to more than fully rebound by the end of June, making for an average 0.6% gain that month. But there is no follow-through in July, where the gold stocks averaged a modest 0.5% loss.
Overall between the end of May and the end of July, which encompasses the dark heart of the summer doldrums, the HUI proved dead flat on average. Again two solid months of grinding sideways on balance is hard for traders to stomach, especially if they’re not aware of the summer-doldrums drift. The key to surviving it with minimum psychological angst is to fully expect it. Managing expectations in markets is essential!
But also like gold, the big payoff for weathering the gold-stock summer starts in August. With gold’s major autumn rally getting underway, the gold stocks as measured by the HUI amplify it with good average gains of 3.1% in Augusts! And that’s only the start of gold stocks’ parallel autumn rally with gold’s, which has averaged 9.3% gains from late Julies to late Septembers. Gold-stock upside resumes in late summers.
Like much in life, withstanding the precious-metals summer doldrums is less challenging if you know they’re coming. While outlying years happen, they aren’t common. So the only safe bet to make is expecting gold, silver, and the stocks of their miners to languish in Junes and Julies. Then when these drifts again come to pass, you won’t be surprised and won’t get too bearish. That will protect you from selling low.
The precious-metals sector radically bucked its seasonal-slump trend this year, surging to a record start. Gold began blasting higher on May’s final trading day, and that sharp rally carried into early June. New trade-war tariff threats were ramping up market fears, driving the US stock markets to selloff lows following late April’s all-time record highs. So traders remembered diversifying with gold and flocked back to it.
In mid-June gold’s gains accelerated after the Fed reversed its future-rate outlook from hiking back to cutting. That propelled gold to its first new bull-market highs in 3.0 years, with it surging to a 5.8-year secular high on that late-June breakout day. That momentum fed on itself and carried gold back over $1400 for the first time since early September 2013. Those awesome $1400+ levels have mostly held since.
The gold miners’ stocks naturally leveraged gold’s gains, enjoying their own epic early-summer action. The precious-metals sector is doing wildly better than last summer, when gold rolled over in mid-June on a sharp US dollar rally. Hyper-leveraged gold-futures speculators watch the dollar’s fortunes for trading cues. Hopefully gold’s huge early-summer gains can hold, and it consolidates sideways in coming weeks.
Gold’s massive and exceptional June rally was mostly fueled by speculators buying enormous quantities of gold futures. That has largely exhausted their available capital firepower, and left their collective bets on gold exceedingly bullish. These positions must be partially unwound with selling, which forces gold into a high consolidation at best and a sharp selloff at worst. So gold isn’t out of the summer-doldrums woods yet.
The inevitable coming gold-futures selling could be largely offset by investment buying. Investors are radically underinvested in gold after the second-largest and first-longest stock bull in US history, giving them big room to buy to reestablish normal portfolio allocations. Since they love chasing winners, gold’s powerful new-high psychology is starting to attract them back. Their return could dwarf gold-futures selling.
Given gold’s long-established lackluster summer-doldrums performance record, it is probably not prudent to chase this rally with gold-futures speculators effectively all-in longs and all-out shorts. But the metal and its miners’ stocks can be accumulated aggressively on any significant weakness. All portfolios need a 10% allocation in gold and gold stocks! Far-more upside is coming after recent overboughtness is worked off.
One of my core missions at Zeal is relentlessly studying the gold-stock world to uncover the stocks with superior fundamentals and upside potential. The trading books in both our popular weekly and monthly newsletters are currently full of these better gold and silver miners. Mostly added in recent months as gold stocks recovered from selloffs, their unrealized gains were already running as high as +105% this week!
If you want to multiply your capital in the markets, you have to stay informed. Our newsletters are a great way, easy to read and affordable. They draw on my vast experience, knowledge, wisdom, and ongoing research to explain what’s going on in the markets, why, and how to trade them with specific stocks. As of Q1 we’ve recommended and realized 1089 newsletter stock trades since 2001, averaging annualized realized gains of +15.8%! That’s nearly double the long-term stock-market average. Subscribe today and take advantage of our 20%-off summer-doldrums sale!
The bottom line is gold, silver, and their miners’ stocks usually drift listlessly during market summers. As investors shift their focus from markets to vacations, capital inflows wane. Junes and Julies in particular are simply devoid of the big recurring gold-investment-demand surges seen during much of the rest of the year, leaving them weak. Investors need to expect lackluster sideways action on balance this time of year.
This summer has proven an epic exception, with gold rocketing to its first major bull-market breakout in years! That has catapulted both the metal and its miners’ stocks to their best early-summer performances in gold’s modern bull-market years. But the summer doldrums could still reassert themselves as specs’ excessively-bullish gold-futures bets are bled off. So enjoy these big anomalous gains, but remain wary.
Adam Hamilton, CPA
July 8, 2019
Copyright 2000 – 2019 Zeal LLC (www.ZealLLC.com)
- Major fundamental processes and events create the large chart patterns seen on the monthly charts. It’s important for gold and stock market investors to stay focused on the big picture, both technically and fundamentally.
- To view the big technical picture for gold, please click here now. Double-click to enlarge.
- Since 2001, my proprietary weekly chart signals system has only generated five buy signals for gold bullion. Note the similarity of the latest one with the 2009 signal.
- The current signal happens with India just days away (July 5) from a possible gold tariff tax cut as part of its new budget, and the July 31 Fed meeting only a month away.
- I’ve put the odds of a gold tariff tax cut at about 50%. To view key news related to the US business cycle, please click here now. The Dow gave back most of its early morning gain yesterday, after rising on the news that Trump would temporarily halt his tariff tax bombing runs on the stock markets, corporations, and working class of America.
- Over the long term, the only way for conservative governments to compete with handouts-focused liberals at the voting polls is with working class tax cuts. By refusing to cut income taxes for America’s working class, Trump risks losing the 2020 election.
- He is now rumoured to be considering a capital gain tax cut (for stock market elitists) instead of an income tax cut for the poor. That’s going to drive more blue-collar voters towards the democrats.
- With US corporate earnings and America’s working class now looking a lot like drowning passengers on the Titanic, gold is the obvious “choice of champions”.
- To view another key big picture chart for this mighty asset, please click here now. Double-click to enlarge.
- After a major upside breakout from an enormous bullish chart pattern, a pullback is expected and normal. The bigger the chart pattern is, the bigger the pullback can be.
- Gold could easily pull back to the $1320-$1250 price zone before roaring on towards my $1550 and $2000 price targets. That shouldn’t bother investors because this type of pullback action is typical after a major breakout.
- Regardless, a shallow pullback would obviously be preferred by most gold market investors and that’s also a realistic scenario.
- Please click here now. Double-click to enlarge. There is a bull flag in play on the daily gold chart.
- A cut in India’s gold tariff tax on Friday would be the likely catalyst for an upside breakout from the flag pattern. If there is no cut, a deeper correction would likely ensue. In that scenario, gold would probably pull back to at least $1360, but more likely to $1320-$1250 by the July 31 Fed meet.
- Please click here now. There’s a lot of talk about the gold versus silver ratio right now. Silver investors should exercise caution before racing in to buy silver just based on the level of the ratio. Here’s why:
- If Trump blows the 2020 election, America could quickly become a socialist state. Stock markets would incinerate and silver (an industrial metal) could fall further against gold on the ratio chart until inflation became obvious.
- Also, the monsoon season in India isn’t going well. It’s a mini-disaster now, and it could soon become a full disaster. If the crop harvest is horrific, Indian farmers won’t have additional money to buy physical silver bullion.
- They will likely just buy the gold they need to meet their needs for religious festivals and weddings. That will put even more upside pressure on the gold/silver ratio.
- U.S. corn crops are also in trouble. The crop situation in both India and America is significant. It could produce food inflation, especially if the democrats win the U.S. election. Regardless, silver investors should wait for inflation to appear rather than try to anticipate it.
- The 80 area on the ratio chart could be support now. Silver can do well against the dollar, but investors should wait for silver to break down from the green uptrend channel I’ve highlighted on the chart before getting too excited about… silver versus gold.
- Silver and mining stocks should be part of an overall allocation to the gold asset class. Amateur stock market investors need to be careful about trying to outperform the Dow with their own growth stocks portfolio. Growth stocks should be part of a US stock market portfolio. They are not a replacement for the Dow.
- Likewise, gold market investors should be careful about owning only silver or mining stocks with the belief they will outperform gold bullion over the long run. That’s unlikely to happen. A well-diversified gold asset class portfolio includes bullion, ETFs, and individual miners. Simply put, to stand tall, own it all!
- Please click here now. Double-click to enlarge this spectacular GDX chart. Note the bullish pennant formation in play. GDX has barely retraced any of its recent near-vertical blast to the upside. The 50% Fibonacci line sits at about $23.20. Gold stock accumulators need to get toes in the water as this pullback plays out. Why? Well, perhaps because history favours the bold!
- America could descend into a permanent socialist and stagflationary quagmire after the next election. This, while India’s first “semi-sane” finance minister in years could cut the gold import tax within just days. She is highly unlikely to unveil any new policy that is negative for gold. It’s obvious that for the world’s greatest asset and the companies that mine it, all major fundamental and technical lights are green!
Special Offer For Website Readers: Please send me an Email to freereports4@gracelandupdates.com and I’ll send you my free “The Bold Go For The Gold!” report. I highlight outperforming miners in the gold price pullback zone, with key buy and sell points for eight of them!
Stewart Thomson
Graceland Updates
Stewart Thomson is a retired Merrill Lynch broker. Stewart writes the Graceland Updates daily between 4am-7am. They are sent out around 8am-9am. The newsletter is attractively priced and the format is a unique numbered point form. Giving clarity of each point and saving valuable reading time.
Risks, Disclaimers, Legal
Stewart Thomson is no longer an investment advisor. The information provided by Stewart and Graceland Updates is for general information purposes only. Before taking any action on any investment, it is imperative that you consult with multiple properly licensed, experienced and qualified investment advisors and get numerous opinions before taking any action. Your minimum risk on any investment in the world is: 100% loss of all your money. You may be taking or preparing to take leveraged positions in investments and not know it, exposing yourself to unlimited risks. This is highly concerning if you are an investor in any derivatives products. There is an approx $700 trillion OTC Derivatives Iceberg with a tiny portion written off officially. The bottom line:
Are You Prepared?
Gold closed the month of June and the quarter above $1400/oz, holding the majority of its recent gains. That does not necessitate continued strength but it is a good sign.
The technicals and fundamentals are finally in place for Gold.
It is outperforming all major currencies and the Federal Reserve is weeks away from beginning a new cycle of rate cuts. The U.S. Dollar has lost its uptrend.
The near-term outlook is very strong but if the Federal Reserve cuts rates three or four times and Gold strongly outperforms the stock market then this move can go to $1900/oz.
But let’s focus and the here and now.
This breakout in Gold potentially has quite a bit of room to run.
The weekly chart below shows how there is very little resistance from $1420/oz to the low $1500s. Moreover, there are strong measured upside targets of $1600/oz to $1700/oz.
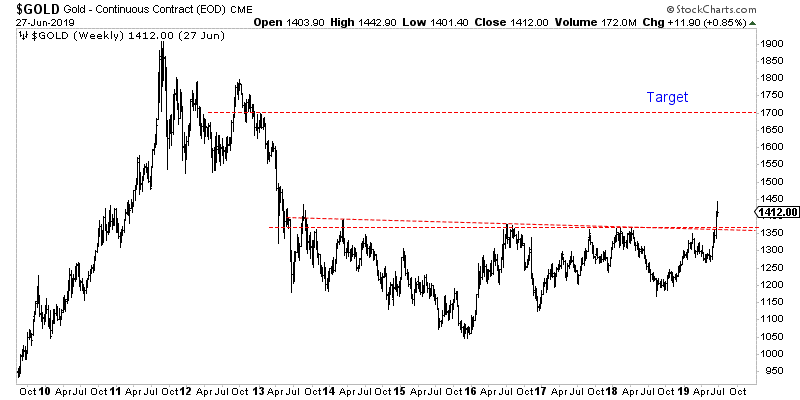
If Gold is going to trend higher towards $1600-$1700/oz, then the gold stocks are going to run much higher.
GDX is trading below $26. A break past $30-$31, would trigger a measured upside target of almost $50.
GDXJ is lagging both Gold and GDX but we know it can catch up quite quickly. First is needs to reach resistance at $50. A clean break past $50 triggers an upside target of ~$83.
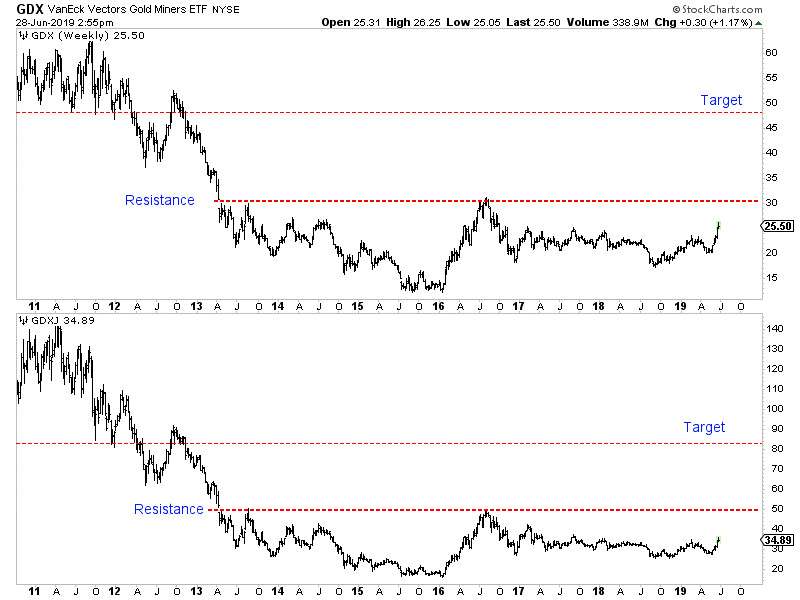
If the Fed does cut rates three or four times and either the greenback cracks more or Gold outperforms the stock market then Gold should be able to reach the $1700/oz target. If only one of those things happen then it still has a good shot to hit $1550/oz.
If the breakout gains traction then the gold stocks, which have strongly outperformed in recent weeks will continue to outperform. That is how these type of moves work.
As we noted last week, be wary of over anticipating a correction. Bull moves tend to remain overbought with overly bullish sentiment. The perfect entry point is behind us.
That being said if Gold does snap back to $1370-$1380/oz for a retest then that would be the time to put more capital work and aggressively so if you missed the last move. To learn which stocks we own and intend to buy that have 3x to 5x potential, consider learning more about our premium service.
Jordan Roy-Byrne CMT, MFTA
July 2, 2019
If you would like to receive our free newsletter via email, simply enter your email address below & click subscribe.
 Follow us on Twitter
 Become our facebook fan
CONNECT WITH US
Tweets
Tweet with hash tag #miningfeeds or @miningfeeds and your tweets will be displayed across this site.
MOST ACTIVE MINING STOCKS
Daily Gainers
 CMC Metals Ltd. CMC Metals Ltd. |
CMB.V | +900.00% |
 Eden Energy Ltd Eden Energy Ltd |
EDE.AX | +200.00% |
| GoviEx Uranium Inc. |
GXU.V | +42.86% |
| Eagle Nickel Ltd. |
ENL.AX | +41.67% |
| Citigold Corp. Limited |
CTO.AX | +33.33% |
| Mount Burgess Mining NL |
MTB.AX | +33.33% |
| Exalt Resources Limited |
ERD.AX | +31.94% |
| Casa Minerals Inc. |
CASA.V | +30.00% |
| Cariboo Rose Resources Ltd |
CRB.V | +28.57% |
| Belmont Resources Inc. |
BEA.V | +28.57% |


