
- The GOAU ETF continues to showcase the most impressive technical action in the entire precious metals ETF sector.
- Please click here now. Double-click to enlarge. A bull wedge breakout with a pickup in volume is in play.
- Gold has been reacting negatively ahead of recent FOMC meetings, and that’s the case this week.
- The pullback offers a decent entry point for GOAU enthusiasts. Investors who want additional performance can consider buying four or five of the component stocks instead of the ETF. There are solid seniors and juniors to choose from.
- My recommendation is to own both the ETF and some component stocks.
- Please click here now. Double-click to enlarge this Chinese stock market chart.
- The US business cycle has been dramatically extended by QE, ultra-low interest rates, and government debt-oriented spending.
- Mainstream money managers have high hopes for a US-China trade deal. I think my view is more realistic; the imminent “trade deal” is really just a tariff tax lock, but it provides enough stability for corporate boards to do some planning.
- Also, I expect the PBOC to provide additional stimulus if there is a tariffs lock deal, and that’s enough for money managers.
- They will drive global stock markets higher without much change in GDP growth.
- At this late stage of the business cycle, wise investors begin watching for signs of inflation.
- The low rates and QE have fuelled government debt and spending worship. Both gold and stock markets could rally higher… while GDP growth stagnates and government debt continues to spike higher.
- Major bank economists generally expect the Fed to cut rates tomorrow and then pause for an extended period. Does the Fed anticipate a late cycle rise in inflation?
- I think so, and I think the Fed will not hike rates as that rise takes place. The US election is getting closer and Trump is likely to announce some vote-grabbing spending that puts the government deeper in debt.
- If elected, the democrats would quickly act to make the Trump government’s entire debt ramp-up look like a peanut play.
- A Fed that doesn’t hike in the face of an inflation uptick and government debt spike is a dovish Fed.
- Please click here now. Double-click to enlarge. Silver is another asset that looks technically impressive.
- There is wedging and bullish triangle action all over the chart.
- Please click here now. Double-click to enlarge. Gold has an ascending triangle in play. A two-day close over $1521 in the cash market is required to launch a rally back to the $1566 area highs.
- Gold is well-positioned fundamentally. If Trump fails to get a tariff tax lock deal and the Fed doesn’t accommodate him with a December rate cut, the US stock market could begin tanking in January…
- Just as the Chinese New Year “power buying” season for gold begins! Gold would get a huge safe-haven bid in that scenario. If he gets a deal, inflation pressures already beginning in China are likely to be exported to America.
- A global markets rally would add to those pressures and gold (but especially silver) would surge higher. It’s win-win for gold in the medium and long term, and in the short term it’s time to buy.
- Most money managers view QE as having outlived its usefulness for economic growth. It can still pump up stock markets, but in the next major downturn, QE is likely to become more of an inflationary force than deflationary.
- Please click here now. Double-click to enlarge. When gold declined to the $1228 support zone in 2013, I called it a major buy, but I also warned investors that patience was required, as gold would trade sideways for many years before surging higher. That’s exactly what happened. Now, gold is at the $1500 area resistance zone. Patience was required then and it is required now… but this time the patience needed can be measured in months rather than years!
Gold has stalled out, drifting sideways to lower for nearly a couple months now. Traders are becoming more frustrated its preceding powerful rally has failed to resume. That is inexorably eroding this past summer’s bullish psychology. Corrective phases to rebalance sentiment are normal and healthy after strong uplegs. Gold had grown too overbought, exhausting traders’ near-term buying firepower in the process.
Bull markets are simply an alternating series of uplegs and corrections. Visualize the core bull-market trend as a rising straight line, and uplegs and corrections are like a sine wave oscillating around it. Prices power to new bull highs in uplegs, surging well above trend. That generates much greed, sucking in all available capital. Both speculators and investors interested in buying anytime soon pile in near bull highs.
That overdone buying late in uplegs necessitates corrections. They drag prices lower long enough to bleed off toppings’ excessive greed. The selling they spawn generates fear, eventually resetting traders’ buying potential and paving the way for the next upleg. The duration of corrections depends on how fast they can rebalance sentiment. They run on a continuum between big and quick to slow and drawn-out.
Gold’s last major interim high was 7 weeks ago, $1554 on September 4th. That followed a strong upleg, where gold powered 32.4% higher over 12.6 months. And like most uplegs, a large fraction of its gains accrued disproportionately in its final months. During the last 1/5th of this upleg which ran from gold’s decisive bull-market breakout in late June until its early-September peak, over half of its entire gains were seen!
That self-feeding buying frenzy last summer catapulted gold to extremely-overbought levels. The bigger and faster price gains, the greater the odds unsustainable overboughtness will result. After decades of study, my favorite indicator for quantifying overboughtness is where prices trade relative to their trailing 200-day moving averages. I developed a trading system around this over 15 years ago, called Relativity.
By early September gold had rocketed so far so fast that its price divided by its 200dma yielded a relative multiple of 1.166x. In other words, gold’s price had stretched 16.6% above its 200dma. That was the most-extreme seen in 8.0 years, since September 2011 right after gold’s last secular bull peaked! The current bull’s maiden upleg topped in early July 2016 after gold clocked a couple daily closes exceeding 1.15x.
What happened next wasn’t pretty, extreme overboughtness isn’t to be trifled with. Over the next 4.2 months into late 2011, gold plunged 18.3% in a severe correction that would later prove the start of a new bear market. And after that mid-2016 episode, gold dropped a similar 17.3% during the following 5.3 months. There are many more examples of major gold selloffs emerging out of extreme overboughtness.
It is such an ominous short-term omen because of how prices, sentiment, and buying firepower interact. Prices can only blast higher too far too fast when popular greed grows excessive. Big rallies breed greed, motivating traders to buy aggressively to chase the mounting gains. So they swiftly throw all the money they are willing to risk at that market. While that does quickly bid prices higher, it rapidly exhausts buyers’ capital.
The upward price velocity of uplegs is a direct function of how much buying speculators and investors are doing. The more they rush to buy, the more capital they throw at a hot market, the faster they expend their available buying firepower. Once that is tapped out and dries up, only sellers remain. Uplegs fail and roll over into corrections once all available buyers are essentially fully deployed. That just happened in gold.
The gold price has two dominant primary drivers, speculators’ collective gold-futures trading and investors’ investment demand. I discussed the former in depth in mid-September soon after gold’s latest peak, warning of a very-bearish gold-futures-selling overhang. Then a couple weeks ago I wrote on the fragile gold investment demand. Today’s essay melds these research threads to try and help frustrated traders.
Gold-futures trading overwhelmingly drives gold’s short-term price action for two reasons. Gold futures allow extreme leverage, greatly multiplying their capital’s collective impact on gold. And the resulting price happens to be the world’s reference one, which heavily colors gold’s overall psychology. Without a doubt the biggest mistake most traders of gold, silver, and their miners’ stocks make is not watching gold futures.
Most traders buy gold or gold ETFs outright, with each dollar deployed exerting that same amount of price pressure on gold. But gold-futures speculators punch way above their weight, giving them wildly-outsized influence on gold prices. This week each 100-troy-ounce gold-futures contact controlling $150,000 worth of gold at $1500 only required a maintenance margin of $4,500. That enables extreme leverage up to 33.3x!
So fully-margined gold-futures speculators can effectively multiply their capital’s price impact on gold up to 33x when buying and selling. Each dollar they deploy has the same price impetus as thirty-three dollars invested outright. Running extreme leverage is hyper-risky, as gold merely moving 3.0% against a position at 33.3x leverage will obliterate 100% of the capital risked! This necessitates an ultra-short-term focus.
While investors have time horizons measured in years, and normal speculators in months, gold-futures speculators are forced to think in terms of days or weeks at most. Their extreme leverage doesn’t give them the luxury of riding multi-month trends. All they can care about is what the gold price is doing and likely to do in the immediate future. This myopic focus renders most normal gold analysis irrelevant to them.
This chart superimposes gold over speculators’ total gold-futures long and short contracts, which are published weekly in the CFTC’s famous Commitments of Traders reports. Their longs or upside bets on gold are drawn in green, and shorts or downside bets in red. Note how gold’s price throughout this entire bull has closely mirrored what the gold-futures speculators as a herd are doing! That will continue to hold true.
In gold-futures trading, there are two ways to both buy and sell. Speculators can buy gold futures to add new longs, or buy to cover and close existing shorts. And they can sell to exit current longs, or sell to open new shorts. The gold price impact of buying and selling gold futures is identical whether it is done to open new or close current positions. Gold-futures buying and selling always drives gold’s uplegs and corrections.
Gold’s strong 32.4% upleg that peaked in early September was mostly fueled by specs adding 172.9k long contracts and buying to cover another 157.5k short ones. That added up to a huge 330.4k contracts of total spec gold-futures buying between mid-August 2018 to early-September 2019. That made for the equivalent of 1027.6 metric tons of gold buying! Keep that in mind to compare with investment buying later.
Note in this chart that this latest upleg’s strongest gold advances occurred when gold-futures specs were aggressively buying longs and covering shorts. This is evident in a rapidly-rising green line and a fast-falling red one. Conversely when specs’ positioning was stable, gold flatlined. And when they started selling, gold was dragged lower. Gold is hostage to specs’ gold-futures trading thanks to its extreme leverage.
I’ve actively traded for decades now, earning my fortune in the markets. In all that time, I’ve never once used margin. I think it is crazy. There is plenty of risk and great rewards to be won without taking on the wildly-amplified additional risks leverage entails. The large majority of speculators and investors share the same opinion on this. The fraction of traders willing to run 10x, 20x, 30x+ leverage is very small.
So both the pool of available gold-futures speculators and the collective capital they command is finite. Eventually their buying firepower gets exhausted, leaving them nothing to do but sell. While we can’t know exactly when that happens in real-time, we can certainly game the odds it is close. Both total spec gold-futures longs and shorts have carved trading ranges over the decades. These help define extremes.
As of the latest CoT week ending last Tuesday, speculators held 382.4k gold-futures long contracts and 94.2k short ones. These are really high and really low historically, suggesting there’s not much room to buy and drive gold higher. But there’s vast room to sell and pummel gold lower. The main reason that gold stalled since early September is speculators had exhausted their buying firepower on both sides of the trade.
Their total long contracts hit 433.0k and 431.0k in late August and early September, and bounced slightly higher in late September to 433.9k. These are extreme levels by any measure, the 2nd, 3rd, and 4th highest seen out off all 1085 CoT weeks since early 1999 in gold’s modern era! They were only eclipsed by early July 2016’s all-time-record high 440.4k, which again preceded a monster 17.3% gold correction.
In this chart it is crystal-clear that gold stalled out exactly when specs stopped buying gold-futures longs. With their positioning so excessively-bullish and extreme, that left a massive gold-futures-selling overhang threatening gold. Gold hasn’t corrected hard yet, only drifting modestly sideways to lower, because these guys haven’t been scared into selling en masse. But that could still happen anytime with the right catalyst hitting.
In this latest CoT week, total spec longs remained way up in the 97th percentile of all CoT weeks. There is far more likely to be major selling than big buying from here. Anything over 350k contracts is worrying, and that happens to coincide with about the 94th percentile. For 17 CoT weeks in a row now, total spec longs have been above 350k. They averaged a lofty 396.6k over that recent span, or the 98th percentile!
These recent persistent extreme spec-long levels are eerily reminiscent of mid-2016. This gold bull’s maiden upleg peaked then after rocketed 29.9% higher in just 6.7 months. Spec gold-futures longs remained above 350k continuously for 17 CoT weeks, averaging 409.8k or almost the 99th percentile of all modern CoT weeks. Spec longs can remain excessively-high for some time, but eventually they must normalize.
And that was seriously painful for traders ignoring the gold-futures situation, as gold again plunged 17.3% over the next 5.3 months. The major gold miners’ stocks amplified that downside by 2x to 3x like usual, with the leading GDX VanEck Vectors Gold Miners ETF plummeting 39.4% in roughly that same span! It doesn’t pay to buy gold and gold stocks high once speculators’ gold-futures buying nears exhaustion levels.
Compounding gold’s near-term downside risks, total spec shorts are near major lows. Back in late August they sunk to a deep 4.5-year low, and extended that slightly to a 4.6-year one just 3 CoT weeks ago. In this latest CoT week they were trading just 8% up into their gold-bull-market trading range since mid-December 2015. That compares to spec longs running 77% up into their own, after hitting 97% in late September.
As is apparent in this chart, spec shorts have an effective floor. No matter what gold does, there are always traders betting it will fall lower. Today’s spec shorts remain right near those bull-market lows, so there is little room left to buy to cover additional shorts. Instead there is vast room to add new shorts to pile on to gold’s downside momentum driven by specs dumping longs when the right catalyst inevitably arrives.
Considered from this bull’s extremes, in this latest CoT week speculators had room to add 57.9k longs and buy to cover another 14.5k shorts. That adds up to 72.5k contracts of potential buying. But they had room to sell 195.7k longs and short sell another 162.6k. That makes for 358.2k contracts of potential near-term selling. With room for selling outweighing room for buying by 4.9x, it’s hard to be bullish on gold.
Gold stalled out because these gold-dominating traders exhausted their buying in early September. And gold is going to struggle until those excessively-bullish bets are normalized by selling longs and adding shorts. Gold will remain saddled with serious downside risks until spec longs and shorts mean revert. I don’t like it either, and am eager for gold’s next upleg. But with this spec positioning, we have to stay wary.
The secondary reason gold has stalled out is identifiable investment inflows have disappeared as gold’s futures-fueled upleg peaked and started drifting lower. This next chart looks at this gold bull compared to the physical gold bullion held in trust by the world’s leading and dominant GLD SPDR Gold Shares gold ETF. It publishes its holdings daily, making them the best high-resolution proxy for gold investment demand.
While successful investment requires buying low then later selling high, gold investors love to buy high. They get most excited about gold when it is surging, succumbing to greed to pile in to ride that upside momentum. Differential buying of GLD shares during gold’s recent 32.4% upleg forced this ETF to add 122.5 metric tons to its holdings. That was less than 1/8th of spec gold-futures buying during that span!
New-high psychology is a powerful motivating force for investors to buy, and fueled a massive 131.8t GLD build in the 2.5 months between gold’s decisive bull-market breakout in late June and its early-September peak! That was actually bigger than GLD’s build over this entire upleg, since this ETF’s holdings slumped even lower in June than when gold’s upleg was born. American stock investors were buying big.
But once gold’s new highs ceased as gold-futures speculators’ buying firepower exhausted, so did the outsized gold investment demand soon after. With US stock markets hovering near all-time-record highs, investors feel little need to prudently diversify their stock-heavy portfolios. They aren’t worried about any material stock-market selloffs, so the only reason they flooded into gold recently was to ride the momentum.
That’s why this recent gold-investment-demand surge is quite fragile. As long as US stock markets don’t plunge, gold investors will flee when gold rolls over on the inevitable spec gold-futures selling coming. American stock investors in particular will dump GLD shares faster than gold is being sold, forcing this ETF’s managers to sell gold bullion exacerbating gold’s selloff. Gold’s momentum-dependent demand isn’t durable.
Again mid-2016’s precedent is ominous. Investors poured into gold early that year as this gold bull’s strong maiden upleg soared higher. And investors were mostly content to remain in gold as long as its price stayed near highs. But once gold turned south materially on gold-futures selling, investors rushed for the exits as evident in GLD’s holdings. The result was that miserable 17.3% gold correction in late 2016.
Every day I get e-mails from subscribers wondering why I’m not buying gold stocks right now. And my answer is simple. Why buy now if odds heavily favor materially-lower gold prices in the near future? The major gold stocks leverage gold corrections by 2x to 3x, so if gold corrects 10% GDX is going to fall 20% to 30%. At worst so far in late September, gold had merely retreated 5.2% from its early-September peak.
Successful trading isn’t about doing what you want to do, but what you ought to do. While you won’t win every time, the goal is to only trade big when the odds are most in your favor. A poker player who bets big holding a hand with just two pairs isn’t brave, but a fool. The smart ones won’t throw all-in unless they are holding something strong like a full house or four-of-a-kind. Probabilities need to offer high chances of success.
And the current still-overbought gold-price levels, still-excessively-bullish speculator positioning in gold futures, and momentum-driven gold investment make for high odds gold’s correction is not over. Few are taking it seriously so far because it has looked like a benign high consolidation. But until specs’ lopsided gold-futures bets mean revert to more-normal levels, it is highly likely gold faces more sizable selling soon.
Gold’s powerful upleg stalled out a couple months ago for major reasons, so as long as they persist there is no reason to expect this bull’s next upleg to start marching. We can’t change the markets, so it is futile to fight them and counterproductive to worry about what they are doing. When corrections are likely, the best course is to patiently wait them out in cash to preserve capital and boost buying power at their bottoms.
To multiply your capital in the markets, you have to trade like a contrarian. That means buying low when few others are willing, so you can later sell high when few others can. In the first half of 2019 well before gold stocks soared higher, we recommended buying many fundamentally-superior gold and silver miners in our popular weekly and monthly newsletters. We later realized big gains including 109.7%, 105.8%, and 103.0%!
To profitably trade gold stocks, you need to stay informed about gold’s major drivers and their likely near-term impacts. Our newsletters are a great way, easy to read and affordable. They draw on my vast experience, knowledge, wisdom, and ongoing research to explain what’s going on in the markets, why, and how to trade them with specific stocks. Subscribe today and take advantage of our 20%-off sale! Get onboard now so you can mirror our coming trades for gold’s next upleg after this correction largely passes.
The bottom line is gold’s strong summer advance stalled out for good reasons. Gold surged to super-overbought levels, sucking in all available near-term buying. Gold-futures speculators’ bets became so excessively-bullish that they exhausted all their capital firepower. And once gold’s advance flagged, the momentum-driven gold investment demand withered too. Gold won’t rally materially until all this is rectified.
Speculators’ collective gold-futures bets can stay extreme for some time, but sooner or later a catalyst hits forcing them to start normalizing. The radical leverage inherent in that market makes selloffs self-feeding. Gold, silver, and the stocks of their miners are going to remain precarious with serious downside risks until that necessary gold-futures selling comes to pass. Jumping the gun on buying will be punished.
If investors bring proper tactics to the table, gold price reactions can be exhilarating.
- Please click here now. Double-click to enlarge this GDX daily chart.
- There’s nothing more satisfying than buying a market near a low and selling near a high.
- The key to doing that is buying near a previous low, either with very small size or with a stoploss just under that low.
- In the case of GDX, the time is now to seize one such opportunity.
- Purchases of GDX (or individual miners) made now offer great potential reward with minimal real risk, if investors follow the trade size and stoploss rules.
- If GDX declines under the $26 area low, odds are high that the $23-$24 support zone gets tested. If GDX holds above $26, odds are high that it rallies back to the $30-$31 area highs.
- An uptrend is defined as a pattern of higher highs and higher lows. In an uptrend, buying lows doesn’t work consistently. That’s because the price of the asset is constantly rising and rarely tests the lows.
- In contrast, a downtrend/reaction is defined as a series of lower highs and lower lows. It’s just a matter of time before the price fails to break one of the lows and the uptrend resumes.
- Please click here now. Double-click to enlarge this daily gold chart.
- I recommend buying near the $1465 low, either with small size or with bigger size and a stoploss just under that low. From here, gold is likely to either decline to the $1400 area lows or rally back towards $1566.
- As stated, gold market reactions don’t have to be negative events for investors. They can be exciting!
- I believe gold bugs are a special breed of person, with a natural zest for life. With the right tactics, that zest can be maintained during all market action, whether it is up, down or sideways.
- Please click here now. Double-click to enlarge this US stock market chart.
- The same exhilarating tactics used at gold market reaction lows can be applied at US stock market highs.
- My suggestion: Short the US stock market (Dow, SP500, or Nasdaq) near the recent highs, and place stoploss just above those highs. The bottom line: October is the most dangerous month of the year for the US stock market, and it’s not over yet!
- Please click here now. Goldman analysts note a very concerning drop in stock buybacks.
- Corporate CFOs are concerned about the economic outlook and are cutting spending. Also, leading American socialists like Bernie Sanders have proposed limiting or even banning the buybacks.
- These buybacks have been the lifeblood of the market. Whether this is a final top for the US stock market is unknown, but I will suggest that now is the time to begin taking professional market action to profit when it happens.
- Investors who are uncomfortable shorting the market can purchase a “bear ETF” near the market highs. A tight stoploss makes the trade risk minimal.
- Please click here now. Double-click to enlarge. The buy zones like gold $1465 and $1400 are for “heavy hitters”. By that, I mean that the opportunities are big, but they don’t happen very often. Patience is required.
- For traders who want more action, my www.guswinger.com mellow and aggressive trade signals service may be the answer. Keying off the GDX chart, we are almost always in NUGT or DUST and JNUG or JDST. I run a tight ship, and when the next big run happens, the profits should be immense.
- Please click here now. If the next phrase in America’s trade war involves isolating China from the US dollar SWIFT money transfer system, I would expect the dollar to go into freefall and gold to stage a parabolic rise to $3000/ounce.
- I don’t think that happens, but continued de-dollarization is almost 100% certain, and that’s positive for gold. Simply put, in 2020 I expect gold stocks to continue where they leave off in 2019; as the best performing asset class in the world!
For silver, all roads probably lead to the $22-$25 area. For gold, all roads likely lead to $1600-$1800. There could be significant bumps in these roads, probably involving time more than price.
2. Please [ https://gracelandupdates.com/wordpress/wp-content/uploads/2019/10/2019oct15si1.png | click here now ] . Double-click to enlarge this silver chart.
3. Silver looks stronger than gold, but gold is also looking very solid, from both a fundamental and technical perspective.
4. Whether silver breaks out from the bull wedge now or a bit later really doesn’t matter.
5. My recommendation to silver price enthusiasts is to get in on the action right now and buy more on any further price softness which may or may not happen.
6. Please [ https://gracelandupdates.com/wordpress/wp-content/uploads/2019/10/2019oct15gold2.png | click here now ] . Double-click to enlarge this daily gold chart.
7. It’s been my firm contention that rather than roar higher or melt lower, gold is poised to consolidate with sideway action.
8. The $1465 support zone is acting like a sponge more than a trampoline or trap door, and that’s positive.
9. While the Western fear trade gets the most attention from gold market fundamentalists, it’s like the hare while the love trade is the turtle. In the long term, it could be the love trade that drives and sustains gold at prices that currently seem almost unimaginable.
10. Please [ https://gracelandupdates.com/wordpress/wp-content/uploads/2019/10/2019oct15gold1.png | click here now ] . One of my predictions has been that Dubai (the city of gold) will ultimately become the world’s main centre of price discovery.
11. Dubai jewellers estimate the world’s annual demand for gold jewellery at more than 2000 tons, and they project solid growth for the long-term.
12. Mine supply is stagnant and central banks don’t appear interested in selling gold. India’s RBI has recently joined the central bank “ buy club ” with modest accumulation.
13. On the demand side, Dubai’s new gold policy can help make the $1400-$1500 zone into a real floor.
14. The “ lower for longer ” approach to interest rates in the West is another floor building theme.
15. Also, the US-China trade deal appears to be more of a tariff taxes lock than an actual trade deal, and I’ve predicted these tariff taxes will be here for at least the next decade.
16. What about the retail investor? Well, please [ https://gracelandupdates.com/wordpress/wp-content/uploads/2019/10/2019oct15gold3.png | click here now ] . Standard Chartered Bank’s heavyweight analyst Suki Cooper is highly respected in the institutional investor community.
17. She predicts the stock market is likely to swoon in 2020, and retail investors will seek refuge in gold as that happens.
18. I’ve also been adamant that in any stock market sell-off, gold will be a better safe-haven that T-bonds.
19. Most money managers believe QE and rate cuts have waned as tools to boost economic growth, but they can still help to cushion a stock market meltdown.
20. When the Fed rolled out QE and rate cuts in 2008, T-bonds still paid some interest. Money managers are concerned that the Treasury will join other central banks and begin offering negative rate bonds to investors.
21. Negative rate bonds issued by a US government that refuses to cut spending and debt are not a safe-haven… and they could be a time bomb! Institutional concern about negative rate bond issuance is clearly an important driver of gold demand that could be “ here to stay ”.
22. Please [ https://gracelandupdates.com/wordpress/wp-content/uploads/2019/10/2019oct15gdx1.png | click here now ] . Double-click to enlarge this GDX chart.
23. GDX doesn’t look at good as silver or gold bullion, but please [ https://gracelandupdates.com/wordpress/wp-content/uploads/2019/10/2019oct15goau1.png | click here now ] . Double-click to enlarge. The GOAU ETF sports a beautiful bull wedge pattern!
24. Whether there’s a bit more “ bump and grind ” action within the wedge should be not be a concern for investors. The focus should be on the bull wedge itself, because it suggests a move to and through the $18 area highs will be the next big event.
As the correction in gold stocks continues and as it’s likely to endure for the time being, we take a step back and share some tips for selecting individual junior gold companies.
The current correction may provide the last chance to buy before the bull market in Gold is confirmed and capital pours into the junior sector and pushes up prices.
Here are three of our best tips to help you spot the big winners before the crowd.
Production Growth
With regards to junior producers, the most important variable to screen for is production growth. The market loves growth and in the mining business if you aren’t growing, you’re literally dying (albeit slowly).
The production growth has to be organic. It cannot be growth just for the sake of growth. If the growth occurs at the expense of the capital structure then it’s not real growth. In essence, it’s more fat.
Recently, some of the best performing junior producers have seen their growth or growth potential, turbo-charged by exploration success. A new discovery can accelerate a producer’s organic growth.
Kirkland Lake’s exploration success at Fosterville is the best example. There are a few other examples but not that many.
The junior mining industry has had a very difficult time over the past 8 years so there aren’t too many examples of juniors with strong production growth profiles.
However, if Gold confirms its recent breakout by holding above $1370-$1400/oz, then more companies would have an easier time growing production.
Small Deposits or Discoveries with Upside Potential
With regards to junior explorers, I prefer to screen for companies that already have a defined value or small discovery, but with significant expansion potential.
Big discoveries don’t happen in an instant. They start as small discoveries and then get much larger. The odds of a small or medium-sized discovery growing considerably are better than starting out from nothing but only a few drill holes.
If the timeline of a discovery is akin to a wave then we want to try and “ride the wave.”
Something the Industry Wants
Generally, the industry wants 2-3M oz Au deposits with good margins and production potential of at least 100K oz Au/yr. If something is smaller but has strong economics, it will be coveted but just not by the majors.
For the most part, grade and recovery will determine the economics. Thus, in most cases low grade deposits and small deposits (without sufficient exploration upside) should be avoided.
Ultimately, if a deposit or operating mine has enough size and margin potential with no fatal flaws, then it could be something the industry wants.
Keep an eye on the companies that have performed well recently (and fit this criteria) but are correcting now while digesting their recent gains. The best time to buy the leaders is during a sector correction.
Also, use this time to tweak your portfolio and err on the side of buying quality at a discount. To learn the stocks we own and intend to buy that have 3x to 5x potential, consider learning more about our premium service.
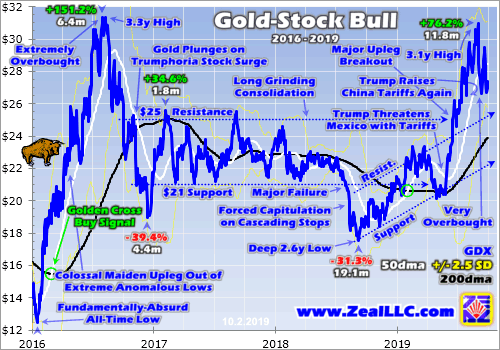
The gold miners’ stocks are correcting. They’ve been sliding and drifting lower on balance since their powerful recent upleg peaked a month ago. Corrections are normal and healthy in ongoing bull markets, rebalancing sentiment to pave the way for the next upleg. They also offer the best buy-low opportunities seen inside secular uptrends. Deploying capital in gold stocks after corrections multiplies wealth-building potential.
While most people dread corrections, battle-hardened speculators and investors embrace them. They make prices oscillate around their bull-market uptrends, greatly expanding their overall travel. The more price movement, the more potential upside to ride. Today’s gold-stock bull proves this. Consider it in terms of the most-popular gold-stock benchmark and trading vehicle, the GDX VanEck Vectors Gold Miners ETF.
This gold-stock bull was born in mid-January 2016, from the depths of despair after a secular gold bear. Over the next 6.4 months, GDX skyrocketed 151.2% higher in an epic maiden upleg! That initial early-August-2016 peak has yet to be eclipsed, but GDX came within 1.2% as this latest upleg peaked in early-September 2019. So the maximum potential gains by buying and holding this entire bull are still 151.2%.
But it has actually enjoyed 3 separate uplegs, that initial 151.2%, a small 34.6% into early 2017, and the 76.2% one that peaked a month ago. Add these together, and the maximum potential gains from swing trading this bull’s uplegs and corrections are 262.0%. That’s over 1.7x better! Of course timing the exact bottoms and tops is impossible, so let’s lop off a quarter of that potential. That still leaves 196.5% versus 113.4%.
Speculators buying within 1/8th or so of correction bottomings and selling within about 1/8th of upleg toppings can generate far-bigger gains than buy-and-hold investors. That’s an achievable goal, as there are plenty of technical and sentimental indicators revealing when these key upleg-correction reversals are likely happening in real-time. Gold stocks are a volatile sector, so we may as well harness that in our favor.
This first chart provides perspective on this gold-stock bull through the lens of GDX. Its major upleg-and-correction swings so far are noted. Since gold overwhelmingly drives gold miners’ profits and thus gold-stock price action, gold-stock cycles are generally considered in gold terms. Despite their huge uplegs and brutal corrections, gold-stock bulls persist as long as gold’s own do. And gold’s bull is alive and well today.
Price movements are driven by the collective trading of all market participants. And their individual buy-and-sell decisions are heavily influenced by how they feel, or sentiment. The ethereal and unquantifiable greed and fear of the herd are what define when gold-stock uplegs and corrections run out of momentum and reverse. And there are plenty of signs when those key junctures for multiplying wealth are probably nearing.
Since this essay is on the current gold-stock correction, I’m going to focus on the topping side. Uplegs are ultimately constrained, they have finite amounts of buying power available to drive them. There are only so many speculators and investors interested in gold stocks at any given time, and they all have limited capital. So once their buying firepower is expended, which coincides with peak greed, uplegs top then fail.
While the whole mission of trading is buying low then selling high, our natural human instinct is to do the exact opposite. It’s hard buying gold stocks low late in corrections, as everyone is bearish on them and assumes the downside momentum will persist indefinitely. So after an initial short-covering spike, most of early uplegs tend to be gradual. Gold stocks have to rally sufficiently to convince skeptical traders to return.
But the higher gold stocks climb, the better they look and the more excited traders get. The faster gold stocks rally, the more capital traders deploy. The more they buy, the faster gold stocks climb. This powerful virtuous circle directly fueled by greed often drives prices sharply higher heading into the ends of uplegs. Eventually everyone interesting in buying anytime soon has already bought, so buying potential is exhausted.
The main technical indicator warning that gold-stock uplegs are likely peaking is how overextended GDX stretches. Measuring this empirically requires some kind of baseline, but it can’t be static since prevailing gold-stock price levels are always changing. My favorite has long been the 200-day moving average. With nearly 10 months of trading days feeding into it, it only changes gradually yet still slowly follows prices.
GDX’s 200dma is rendered in black in this chart. Note above that both of this bull’s major uplegs saw GDX soar far above its 200dma. Those were signs of overboughtness, that too much capital was flooding into gold stocks too quickly to be sustainable. The faster and more exciting gains after a long and strong upleg, the greater the odds they will soon run out of steam. They rapidly suck in all near-future buying potential.
Well over a decade ago I developed a trading system based on how stretched prices were relative to their own 200dmas, called Relativity Trading. It simply divides a price by its 200dma yielding a multiple. Over time in trending bull markets these form horizontal trading ranges, with distinctive topping and bottoming zones. Since I started analyzing this years before GDX was even born, I use the older HUI gold-stock index.
GDX’s latest upleg peaked at $30.95 on September 4th. A couple days later I published an essay warning “Gold Stocks Very Overbought” explaining why and the implications in depth. On that peaking day, GDX had soared way up to 1.341x its 200dma. For most gold-stock bull-market uplegs, seeing index prices stretched 30%+ above their 200dmas is a big warning sign. It means prices have run too far too fast.
Sentiment extremes always coincide with price extremes, since how traders feel is totally dependent on how prices are faring. When uplegs are topping, telltale emotions run rampant. Widespread greed mixes with exuberance, complacency, and even euphoria. When gold-stock prices are topping, traders as a herd are totally convinced the gold miners are on the verge of surging much higher. It is funny to watch.
Buying low then selling high requires being contrarian, actively fighting the crowd to do the opposite. But being contrarian requires so much hard training and emotional discipline that few bother painfully forging that mindset. So most traders, and most analysts and market commentators, just follow the momentum. They are most excited and eager to buy when prices are high, when popular greed infects their market outlooks.
While you can easily figure out when prices stretch really far over their 200dmas, sentiment isn’t directly measurable. But it can be inferred by paying attention to your own emotions and those of other traders and analysts. If prices have rallied long and far and you are really excited and bullish, you are getting greedy. If you are buying gold stocks when it feels good and validating, odds are you are buying late and high.
When gold-stock uplegs are topping, the widespread bullish sentiment becomes evident in the financial media. Most of the time this small contrarian sector is totally ignored. So when you see professionals on CNBC and Bloomberg appear much more often waxing bullish on the gold miners’ stocks, that’s a major warning sign. Financial television is very useful because it reflects and reveals prevailing sentiment!
Most gold-stock speculators and investors also follow some commentators, as not everyone can or wants to spend all day everyday studying the markets. Usefulness derived from market analysis is dependent on how a particular analyst thinks. Are they a herd-follower momentum trader or a contrarian? You need to figure that out before you trade on anyone’s advice. A little homework will clarify how they tend to think.
Look at what your commentator was predicting in real-time at known past major gold-stock toppings and bottomings. In early August 2016 and early September 2016 as gold-stock euphoria reigned, did they call for big additional gains? Or did they warn of an imminent correction. Contrarians are even rarer publicly since being in this camp draws mockery. Traders hate hearing when their beloved uptrends are ending!
So between how you feel about gold stocks, how professionals interviewed in the financial media feel, and how your favorite commentators feel, you can get a good idea of prevailing sentiment. Chances are if you are excited about buying gold stocks, much of the driving upleg has already run its course. The time to buy is when it feels miserable, after gold stocks have fallen so far that they seem hopeless again.
As a newsletter guy for the past couple decades now, I have an additional sentiment-revealing conduit that is super-valuable. I’m constantly e-mailed feedback and questions from subscribers. They grow excited about gold stocks when uplegs are topping, and depressed when corrections are bottoming. It is not just a collective thing, but even individuals. Certain people have written me periodically for years on end.
They’ve proven great contrary indicators. Like clockwork they are very bullish and excited when gold stocks are topping, and really bearish and disheartened when gold stocks are bottoming. If you happen to be fortunate enough to talk with someone regularly who also trades this sector, you can get a similar read by asking them where they think it is going. Unless they are hardened contrarians, do the opposite!
When technicals get really overbought and sentiment really greedy, it’s definitely time to be wary. But I still generally don’t sell high. Gold stocks are a volatile sector that can really surprise to the upside at times. So instead of selling outright and trying to catch an inherently-unpredictable precise top, instead I just ratchet up my trailing-stop-loss percentages. Tighter stops lock in more profits when prices reverse.
In early September gold stocks were very stretched technically, with GDX far above its 200dma baseline. And everywhere you looked, traders and analysts were wildly bullish on gold miners’ prospects. Those were all the hallmarks of an upleg peaking before a major correction. But a more-obscure indicator really caught my attention. It was how speculators were collectively positioned in gold futures, which is crucial.
I wrote a whole essay explaining this in depth in mid-September, titled “Gold-Futures-Selling Overhang”. Gold stocks are essentially leveraged plays on gold, since it utterly dominates their earnings power. And the primary short-term gold driver is how gold-futures specs are betting. Like most gold-stock traders, they are momentum followers and not contrarians. So they grow really bullish when gold itself is topping.
This exuberant sentiment manifests itself on both sides of the gold-futures trade, longs and shorts. When these traders expect gold to keep rallying after a strong upleg, their long upside bets are very high. They also radically curtail their short-selling downside bets. These guys always bet wrong when uplegs are topping, and the extreme leverage inherent in gold-futures trading means they can’t afford to be wrong for long.
Gold stocks follow gold, which is mostly driven by speculators’ gold-futures trading. Thus whenever I’m assessing the likelihood of a major gold-stock upleg topping, I carefully consider specs’ positioning. If their collective bets are normal, longs and shorts both in the middle of their gold-bull-market ranges, then the odds of gold and thus gold-stock corrections are much lower. But when bets are extreme, watch out below.
This last chart looks at speculators’ total long and short contracts held in gold futures, which are published weekly. Long upside bets are rendered in green, and short downside bets in red. The higher longs, and the lower shorts, the more bullish gold-futures speculators. And that is more bearish for gold and gold stocks over the near term! A month ago this chart heavily influenced my warning on gold-stock overboughtness.
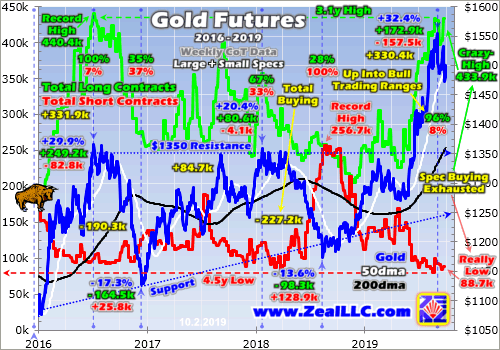
In early September as gold stocks stretched far above GDX’s 200dma and bullishness was universal, the gold-futures specs’ total longs were nearing an all-time record high! At the same time their shorts were very low. On September 3rd specs’ total longs and shorts were running 96% and 8% up into their gold-bull-market trading ranges since mid-December 2015. These guys were effectively all-in longs and all-out shorts!
Like gold-stock traders, gold-futures traders’ capital is finite. They buy aggressively in gold uplegs, which drives them higher. But eventually they’ve deployed all the capital they are able to wield, which leaves no more buying firepower left. At that point all they can do is sell when the right news catalyst hits sooner or later. That selling soon snowballs due to the crazy leverage, unleashing gold and gold-stock corrections.
With gold-futures speculators’ potential buying nearly tapped out in early September, gold wasn’t likely to go much higher but had high odds of selling off. And that would drag the gold stocks with it. The major gold miners that dominate GDX’s weightings tend to amplify underlying moves in gold by 2x to 3x. So when that inevitable gold-futures selling hit, it was going to hammer gold stocks particularly hard like usual.
Fast-forward to today, and spec gold-futures positioning is a key reason why gold stocks are suffering a correction now. The latest report on speculators’ collective gold-futures bets last Tuesday revealed their total longs and shorts are still running 97% and 5% up into their gold-bull-market trading ranges! That is close to the most-bearish-possible for gold of 100% and 0%, guaranteeing big gold-futures selling was coming.
And indeed we saw a lot of it over the week since. After peaking at $30.95 in early September yielding a 76.2% upleg gain over 11.8 months, GDX plunged 13.9% to $26.64 over the next couple weeks. That was beyond that classic 10% correction threshold for stock markets, although gold stocks are so volatile their definition should be wider. Then GDX rebounded fast, surging 10.7% higher to $29.49 on September 24th.
While early September’s sharp gold-stock selloff caught traders’ attention, that bounce rally rekindled lots of complacency. It’s fitting that secondary gold-stock topping hit the same day specs’ latest gold-futures positioning was so extreme. Gold fell sharply from there, dragging the gold stocks down with it. By the end of September, GDX had plunged another 13.7% to $26.71. Lower highs were forming a correction downtrend.
Still, at worst GDX was only down 13.9% correction-to-date. That’s nothing yet by gold-stock-correction standards. Today’s gold-stock bull has seen two prior corrections, a massive 39.4% into late 2016 and an also-ugly 31.3% into late-summer 2018. Both of these were excessive, exacerbated by market anomalies heading into their climaxes. But their 35.4% average losses illustrate how serious these get.
Bull-market corrections most often bounce at 200dmas, and GDX’s was running $23.90 as of the middle of this week. That would make for a 22.8% total correction. But since GDX’s price remains well above that 200dma, it is gradually rising. So it will be somewhat higher by the time GDX is forced back down to it by specs’ gold-futures selling. Another way to game the potential gold-stock downside is to look at gold.
Gold’s parallel bull that’s driving this gold-stock one also experienced those same two corrections so far, which ran 17.3% and 13.6%. That averages 15.5%. But again those were excessive, made way worse by some extreme market events that aren’t going to repeat. Gold should see a milder and more-normal bull-market correction this time around, somewhere in the 6%-to-12% range. GDX will amplify that by 2x to 3x.
That implies a gold-stock correction of 12% to 36%, for a 24% midpoint. 25% is reasonable, and right in line with past-bull-market precedent. During gold stocks’ last mighty secular bull across the entire 2000s decade, the average major gold-stock correction per the HUI was 26.1%. That excludes 2008’s wildly-anomalous stock-panic selloff, but covers fully 12 other corrections. Around 25% is par for the course.
That implies a GDX downside target around $23.21, another 15.3% lower from this week’s levels. It is interesting that gold stocks’ weakest seasonals of the year from late September to late October align with this as well. Last week I wrote a whole essay “Gold-Stock Red October” explaining why this is the case. Everything is lined up for considerable sector weakness in the coming weeks. Traders need to be ready.
Corrections are just a sentiment thing, a rebalancing to bleed off the excessive greed surrounding upleg toppings. The buying opportunity after this one will be really important, as gold miners’ fundamentals are rapidly improving with higher prevailing gold prices. In the just-finished third quarter, average gold prices soared a stupendous 12.6% higher quarter-on-quarter! So gold miners’ earnings must have exploded.
After every quarterly earnings season, I analyze the collective results of the GDX gold miners. In Q2’19, their average all-in sustaining costs ran $895 per ounce. That yielded sector profits of $414 per ounce at Q2’s $1309 average gold price. Assuming AISCs are flat in Q3, when they are actually likely to fall, those earnings soared to $579 at last quarter’s $1474 average gold price. That’s up an incredible 39.8% QoQ!
So gold miners’ upcoming releases of Q3 results between late October to mid-November are going to look fantastic. As long as gold’s own selloff is waning, this great fundamental news may cap the worst of gold stocks’ correction in time terms. Gold stocks’ powerful recent surge on gold’s decisive bull-market breakout caught traders’ attention, and the bottoming of this underway correction will be the time to buy big.
To multiply your capital in the markets, you have to trade like a contrarian. That means buying low when few others are willing, so you can later sell high when few others can. In the first half of 2019 well before gold stocks soared higher, we recommended buying many fundamentally-superior gold and silver miners in our popular weekly and monthly newsletters. We later realized big gains including 109.7%, 105.8%, and 103.0%!
To profitably trade gold stocks, you need to stay informed about gold’s major drivers and their likely near-term impacts. Our newsletters are a great way, easy to read and affordable. They draw on my vast experience, knowledge, wisdom, and ongoing research to explain what’s going on in the markets, why, and how to trade them with specific stocks. Subscribe today and take advantage of our 20%-off sale! Get onboard now so you can mirror our coming trades for gold’s next upleg after this correction largely passes.
The bottom line is a gold-stock correction is underway. The major gold miners have been grinding lower and sideways for a month now, after becoming very overbought technically. That major warning sign of upleg toppings was accompanied by exuberant popular sentiment. On top of that, speculators’ gold-futures positioning was and is again excessively bullish, signaling major gold selling is inevitable soon.
Corrections should be embraced, not dreaded. They are normal and healthy in bull markets, existing to bleed off excessive greed and restore sentiment balance. These selloffs offer the best opportunities to buy relatively low within ongoing bulls. Traders need to watch for them, prepare for them with stops, and hold off on redeploying stopped capital until they’ve run their courses. Then jump back in to ride the next upleg!
If you would like to receive our free newsletter via email, simply enter your email address below & click subscribe.
 Follow us on Twitter
 Become our facebook fan
CONNECT WITH US
Tweets
Tweet with hash tag #miningfeeds or @miningfeeds and your tweets will be displayed across this site.
MOST ACTIVE MINING STOCKS
Daily Gainers
 CMC Metals Ltd. CMC Metals Ltd. |
CMB.V | +900.00% |
 Eden Energy Ltd Eden Energy Ltd |
EDE.AX | +200.00% |
| GoviEx Uranium Inc. |
GXU.V | +42.86% |
| Eagle Nickel Ltd. |
ENL.AX | +41.67% |
| Citigold Corp. Limited |
CTO.AX | +33.33% |
| Mount Burgess Mining NL |
MTB.AX | +33.33% |
| Exalt Resources Limited |
ERD.AX | +31.94% |
| Casa Minerals Inc. |
CASA.V | +30.00% |
| Cariboo Rose Resources Ltd |
CRB.V | +28.57% |
| Belmont Resources Inc. |
BEA.V | +28.57% |


