
The silver miners are finally enjoying higher prevailing silver prices, a great boon for this sector. Silver surged this past summer after gold’s first new bull-market highs in several years rekindled enthusiasm for precious metals. The long-neglected silver stocks rallied strongly with their metal. Their recently-reported Q3’19 results reveal whether those gains are justified, and how much fundamentals improved on higher silver.
Four times a year publicly-traded companies release treasure troves of valuable information in the form of quarterly reports. Required by the US Securities and Exchange Commission, these 10-Qs and 10-Ks contain the best fundamental data available to traders. They dispel all the sentiment distortions inevitably surrounding prevailing stock-price levels, revealing corporations’ underlying hard fundamental realities.
The definitive list of major silver-mining stocks to analyze comes from the world’s most-popular silver-stock investment vehicle, the SIL Global X Silver Miners ETF. Launched way back in April 2010, it has maintained a big first-mover advantage. SIL’s net assets ran $515m in mid-November near the end of Q3’s earnings season, 4.6x greater than its next-biggest competitor’s. SIL is the leading silver-stock benchmark.
In mid-November SIL included 25 component stocks, which are weighted somewhat proportionally to their market capitalizations. This list contains the world’s largest silver miners, including the biggest primary ones. Every quarter I dive into the latest operating and financial results from SIL’s top 17 companies. That’s simply an arbitrary number that fits neatly into the table below, but still a commanding sample.
As of mid-November these major silver miners accounted for fully 93.9% of SIL’s total weighting. In Q3’19 they collectively mined 72.2m ounces of silver. The latest comprehensive data available for global silver supply and demand came from the Silver Institute in April 2019. That covered 2018, when world silver mine production totaled 855.7m ounces. That equates to a run rate around 213.9m per quarter.
Assuming that mining pace persisted in Q3’19, SIL’s top 17 silver miners were responsible for about 34% of world production. That’s fairly high considering just 26% of 2018’s global silver output was produced at primary silver mines! 38% came from lead/zinc mines, 23% from copper, and 12% from gold. Nearly 3/4ths of all silver produced worldwide is just a byproduct. Primary silver mines and miners are quite rare.
Scarce silver-heavy deposits are required to support primary silver mines, where over half their revenue comes from silver. They are increasingly difficult to discover and ever more expensive to develop. And silver’s challenging economics of recent years argue against miners even pursuing it. So even traditional major silver miners have shifted their investment focus into actively diversifying into far-more-profitable gold.
Silver price levels are best measured relative to prevailing gold prices, which overwhelmingly drive silver price action. In early July the Silver/Gold Ratio continued collapsing to its worst levels witnessed in 26.8 years, since October 1992! Those secular extremes of the worst silver price levels in over a quarter century sure added to the misery racking this once-proud sector. So silver’s recent upleg is a godsend.
The largest silver miners dominating SIL’s ranks are scattered around the world. 11 of the top 17 mainly trade in US stock markets, 3 in the United Kingdom, and 1 each in South Korea, Mexico, and Canada. SIL’s geopolitical diversity is good for investors, but makes it difficult to analyze and compare the biggest silver miners’ results. Financial-reporting requirements vary considerably from country to country.
In the UK companies report in half-year increments instead of quarterly. Some silver miners still publish quarterly updates, but their data is limited. In cases where half-year data is all that was made available, I split it in half for a Q3 approximation. Canada has quarterly reporting, but the deadlines are looser than in the States. Some Canadian miners really drag their feet, delaying their quarterlies right up to legal limits.
The big silver companies in South Korea and Mexico present other problems. Their reporting is naturally done in their own languages, which I can’t decipher. Some release limited information in English, but even those translations can be difficult to interpret due to differing accounting standards and focuses. It is definitely challenging bringing all the quarterly data together for these diverse SIL-top-17 silver miners.
But analyzing them in the aggregate is essential to understand how they are faring. So each quarter I wade through all available operational and financial reports and dump the data into a big spreadsheet for analysis. Some highlights make it into this table. Blank fields mean a company hadn’t reported that data by mid-November, as Q3’s earnings season ended. Some of SIL’s components report in gold-centric terms.
The first couple columns of this table show each SIL component’s symbol and weighting within this ETF as of mid-November. While most of these stocks trade on US exchanges, some symbols are listings from companies’ primary foreign stock exchanges. That’s followed by each miner’s Q3’19 silver production in ounces, along with its absolute year-over-year change. Next comes this same quarter’s gold production.
Nearly all the major silver miners in SIL also produce significant-to-large amounts of gold! That’s truly a double-edged sword. While gold really stabilizes and boosts silver miners’ cash flows, it also retards their stocks’ sensitivity to silver itself. So the next column reveals how pure these elite silver miners are, approximating their percentages of Q3’19 revenues actually derived from silver. This is calculated one of two ways.
The large majority of these SIL silver miners reported total Q3 revenues. Quarterly silver production multiplied by silver’s average price in Q3 can be divided by these sales to yield an accurate relative-purity gauge. When Q3 sales weren’t reported, I estimated them by adding silver sales to gold sales based on their production and average quarterly prices. But that’s less optimal, as it ignores any base-metals byproducts.
Next comes the major silver miners’ most-important fundamental data for investors, cash costs and all-in sustaining costs per ounce mined. The latter directly drive profitability which ultimately determines stock prices. These key costs are also followed by YoY changes. Last but not least the annual changes are shown in operating cash flows generated and hard GAAP earnings, with a couple exceptions necessary.
Percentage changes aren’t relevant or meaningful if data shifted from positive to negative or vice versa, or if derived from two negative numbers. So in those cases I included raw underlying data rather than weird or misleading percentage changes. Companies with symbols highlighted in light-blue have newly climbed into the elite ranks of SIL’s top 17 over this past year. This entire dataset together is quite valuable.
It offers a fantastic high-level read on how the major silver miners are faring fundamentally as an industry and individually. Q3’19’s higher prevailing silver prices thanks to gold’s bull-breakout rally greatly improved silver miners’ fundamentals. Their revenues and earnings surged higher, despite lower silver production as they continue diversifying into gold. Their stock prices aren’t reflecting huge earnings-growth potential.
Silver’s Q3’19 performance was interesting, looking impressive on the surface while also disappointing. Between late May and early September, silver blasted 36.6% higher. That amplified gold’s big 21.5% gain in that span by 1.7x. Silver peaked the same day gold did in early September, soaring 28.1% Q3-to-date! But silver also slumped with gold into quarter-end, rallying 11.2% in Q3 proper which trounced gold.
That was 2.5x gold’s 4.4% Q3 advance, excellent silver leverage to gold. But since silver’s recent surge began near those extreme quarter-century-plus lows relative to gold, its gains were more muted. Q3’19’s average silver price of $16.97 was only 13.4% better than Q3’18’s average. Meanwhile the average gold price soared 21.7% YoY last quarter. So silver miners’ fundamental boost considerably lagged the gold miners’.
And the silver miners desperately needed higher metal prices much more than the gold miners. In late May nearing Q3, SIL slumped to a miserable 3.3-year secular low. Meanwhile the leading GDX gold-stock ETF had merely retreated to a 4.4-month low in early May. Silver acts like a gold sentiment gauge, only rallying materially when traders expect higher gold prices. When they don’t, silver seriously languishes.
And when silver is down and out, the silver miners’ stocks are all but abandoned. That bearish psychology takes some time to reverse, as reflected in SIL’s performance. While this leading silver-stock ETF surged 46.6% higher between late May to early September, that was a measly 1.3x silver’s own advance. The major silver miners need to amplify silver uplegs by 2x to 3x to be worth the big additional risks they bear.
Despite the silver stocks’ strong summer rally, much residual pessimism remained. After SIL surged 20.2% quarter-to-date by that early-September peak, it plunged 12.8% into quarter-end. That left this key silver-stock benchmark with a poor 4.8% gain in Q3 proper. That was absolutely terrible, running just 0.4x silver’s own Q3’19 rally! So the silver-stock-price performance last quarter was relatively weak.
But the silver miners’ recently-released Q3’19 results prove the silver stocks should’ve enjoyed much-bigger gains. They enjoyed a massive fundamental boost from the higher prevailing silver prices, despite this metal not performing as well as it ought to compared to gold. That gives the silver miners’ stocks big upside potential once traders figure this out, as current silver-stock levels don’t yet reflect higher silver prices.
Since production is the lifeblood of silver mining, that’s the best place to start in analyzing how the major silver miners fared in Q3. The SIL-top-17 silver miners again collectively produced 72.2m ounces of silver last quarter, which was actually down 4.4% YoY. Meanwhile their total gold output surged 11.9% higher YoY to 1,619k ounces. That was the highest SIL-top-17 gold output in the 14 quarters I’ve done this research!
The major silver miners continued their long-term trend of increasingly diversifying into gold. As silver wasted away in recent years, its bombed-out prices heavily impaired silver mines’ ability to generate operating cash flows and profits. The silver miners were forced to adapt, and shifted their focus and capital into adding gold production rather than boosting silver output. The major silver miners are yellowing.
Silver mining is as capital-intensive as gold mining, requiring similar large expenses to plan, permit, and construct new mines, mills, and expansions. It needs similar fleets of heavy excavators and haul trucks to dig and move the silver-bearing ore. Similar levels of employees are necessary to run silver mines. But at recent years’ average precious-metals prices, silver mines generate far lower returns than gold mines.
So even longtime traditional silver miners have reallocated much of their capital investments into growing gold mined, at silver’s expense. According to the Silver Institute’s latest World Silver Survey, 2018 was the third year in a row of waning global silver mine production. The mined-silver-supply shrinkage is even accelerating, running 0.0% in 2016, 1.8% in 2017, and 2.4% in 2018! Peak silver could really be upon us.
Over this past year Pan American Silver has most exemplified the traditional major silver miners moving into gold. Back in mid-November 2018, PAAS acquired troubled silver miner Tahoe Resources. Tahoe had owned what was once the world’s largest primary silver mine, Escobal in Guatemala. That behemoth produced 5.7m ounces of silver in Q1’17, the last quarter before that country’s government unjustly shut it down.
That was in response to a frivolous lawsuit brought against Guatemala’s mining regulator, not Tahoe or Escobal, for a trivial bureaucratic misstep! Pan American hoped to work through all the red tape to win approval to restart that huge silver mine. But the real prize in that fire-sale buyout was Tahoe’s gold production from other mines. Q3’19 is only the second quarter that acquisition is fully reflected in PAAS’s results.
While its silver output climbed a solid 6.6% YoY to 6.7m ounces, Pan American’s gold production soared 256.8% YoY to 150k ounces! Interestingly that huge jump in PAAS’s gold accounted for nearly 2/3rds of the total gold increase across the entire SIL-top-17 silver miners. PAAS is forecasting full-year-2019 production of 575k ounces of gold, which makes it a sizable mid-tier gold miner, and 25.8m ounces of silver.
Last quarter only 32.1% of Pan American’s revenues came from silver, so its days as a primary silver miner running over 50% are long gone. I wonder if Pan American Silver will follow in Wheaton Precious Metals’ footsteps and change its name and symbol to reflect its new gold-dominated future. Prior to May 2017 WPM, SIL’s largest component, used to be a pure silver-streaming play known as Silver Wheaton.
SIL’s second-largest component in mid-November was the Russian-founded but UK-listed Polymetal. In Q3’19 its silver output plunged 19.4% YoY to 5.4m ounces, yet its gold production surged 12.9% YoY to hit a massive 402k ounces. That annualizes to way over 1m ounces per year, making POLY a major gold miner. Last quarter just 14.0% of its sales were derived from silver, the lowest silver purity in the SIL top 17.
Other elite SIL-component silver miners had gold output rising faster than silver production, like Coeur Mining. Its 3.5% YoY silver-production growth in Q3 was dwarfed by its 14.1% YoY gold-production growth. Unfortunately the major primary silver miners are a dying breed, since the economics of silver mining are far inferior to gold mining. SIL’s managers can’t even find enough silver miners to fill out their ETF.
Inexplicably Korea Zinc remains SIL’s third-largest component, which is a base-metals smelter that has nothing to do with silver mining! While its financial reporting in English is atrocious, it smelted about 64.0m ounces of silver in 2018 which approximated roughly 17% of its full-year revenue. It ought to be kicked out of SIL posthaste, as its presence and big 1/11th weighting really retards SIL’s sensitivity to silver.
Global X was really scraping the bottom of the barrel to include a company like Korea Zinc in SIL. I’m sure there’s not a single SIL investor who wants base-metals-smelting exposure in what is advertised as a “Silver Miners ETF”. The weighting and capital wasted in Korea Zinc should be reallocated and spread proportionally across the other SIL stocks. The ranks of major silver miners are becoming more rarefied.
Despite their shifting-into-gold trend, the SIL-top-17 silver miners averaged 40.4% of their sales from silver in Q3’19! That was a big improvement over Q3’18’s 36.9%, and SIL’s highest overall silver purity since Q4’16. I was certainly surprised to see that given silver’s relative underperformance compared to gold in Q3, and the SIL top 17’s lower silver production. But higher silver prices really boosted silver revenues.
SIL’s upper ranks still include just 3 primary silver miners, with their silver-purity percentages highlighted in blue in this table. They are First Majestic Silver at 82.6%, Silvercorp Metals at 64.4%, and Fortuna Silver Mines at 53.6%. The individual stocks of these silver-centric miners will be far more responsive to silver prices than SIL as a whole. Despite their inclusion, SIL essentially remains another gold miners’ ETF.
With SIL-top-17 silver production sliding 4.4% YoY in Q3’19, the per-ounce mining costs should’ve risen proportionally. Silver-mining costs are largely fixed quarter after quarter, with actual mining requiring the same levels of infrastructure, equipment, and employees. So the lower production, the fewer ounces to spread mining’s big fixed costs across. Yet impressively the SIL-top-17 silver miners’ costs fell sharply in Q3.
There are two major ways to measure silver-mining costs, classic cash costs per ounce and the superior all-in sustaining costs. Both are useful metrics. Cash costs are the acid test of silver-miner survivability in lower-silver-price environments, revealing the worst-case silver levels necessary to keep the mines running. All-in sustaining costs show where silver needs to trade to maintain current mining tempos indefinitely.
Cash costs naturally encompass all cash expenses necessary to produce each ounce of silver, including all direct production costs, mine-level administration, smelting, refining, transport, regulatory, royalty, and tax expenses. In Q3’19 these SIL-top-17 silver miners reported cash costs averaging $6.61 per ounce, up a trivial 0.5% YoY. SVM was a major contributor, reporting negative cash costs due to big byproduct credits.
Way more important than cash costs are the far-superior all-in sustaining costs. They were introduced by the World Gold Council in June 2013 to give investors a much-better understanding of what it really costs to maintain silver mines as ongoing concerns. AISCs include all direct cash costs, but then add on everything else that is necessary to maintain and replenish operations at current silver-production levels.
These additional expenses include exploration for new silver to mine to replace depleting deposits, mine-development and construction expenses, remediation, and mine reclamation. They also include the corporate-level administration expenses necessary to oversee silver mines. All-in sustaining costs are the most-important silver-mining cost metric by far for investors, revealing silver miners’ true operating profitability.
The SIL-top-17 silver miners reporting AISCs in Q3’19 averaged just $10.74 per ounce, which was down a massive 20.6% YoY! That was really impressive considering their waning silver production. SVM’s huge byproduct credits again played a role, driving super-low best-in-sector AISCs of only $4.15. But most of the other major silver miners also saw sharply-lower AISCs last quarter, including SSR Mining.
SSRM’s 16.7%-lower AISCs compared to Q3’18 were a big factor in the SIL top 17’s plunging AISCs, as that came from anomalously-high levels. SSR Mining was winding down an old silver mine a year ago, leading to soaring unit costs as production dwindled. But last December SSRM spun up a new silver mine near that old mine site, and is trucking the ore to its existing processing facilities. So silver output soared.
That is forcing SSRM’s high AISCs back down, really improving the SIL-top-17 average. Interestingly if SSRM’s new silver mine hadn’t come online, the SIL top 17’s total silver output would’ve declined 5.9% YoY. Lower AISCs are good news anytime, but greatly boost the implied profitability of major silver miners when silver itself is rallying. Silver’s $16.97 average price in Q3’19 made for hefty profit margins.
That less the SIL top 17’s average $10.74 AISCs yielded big earnings of $6.23 per ounce. That was up a stupendous 335.7% YoY compared to Q3’18’s mere $1.43! Silver averaged just $14.96 in that year-ago comparable quarter, while SIL-top-17 average AISCs were much higher at $13.53. The sequential profits growth from Q2’19 was epic too, soaring 84.9% QoQ from implied profit margins of $3.37 before silver surged.
This incredible gargantuan earnings growth among the major silver miners certainly isn’t anywhere near yet reflected in their stock prices. So the silver stocks have to soar far higher during their metal’s next upleg, which will again be driven by gold. Even though silver’s advance straddling Q3’19 lagged gold’s relatively, the combination of higher prevailing silver prices and lower costs was still a potent earnings multiplier.
Q3’s 13.4%-higher average silver prices and 20.6%-lower SIL-top-17 average all-in sustaining costs were certainly reflected in the hard accounting numbers too. These elite silver miners’ collective sales jumped 21.1% YoY to $3,289m last quarter. That generated operating cash flows of $771m, which was down 7.1% YoY. Mexico’s Industrias Peñoles was solely responsible, with OCFs collapsing 46.9% YoY or $258m!
Still the SIL top 17’s total cash hoard grew 5.9% YoY to $2,561m. And the hard GAAP earnings were radically better as implied by that big spread between prevailing silver prices and AISCs. These SIL-top-17 miners’ total profits ran $66m in Q3’19, compared to a $243m loss in the year-ago comparable quarter. So these higher prevailing silver prices are indeed turning things around for the long-stressed silver miners.
While the silver miners’ stocks have massive pent-up rallying to do to reflect these radically-improving fundamentals, that’s not going to happen until gold’s correction runs its course. Silver rarely advances materially if gold isn’t powering higher in its own upleg. But once gold turns north decisively and gives the green light to silver, the silver stocks should catch really-strong bids. Unfortunately SIL isn’t the way to play them.
While it is the world’s leading “Silver Miners ETF”, it is increasingly burdened with primary gold miners with waning silver exposure. The smaller the fractions of revenues miners derive from silver, the less responsive their stock prices are to silver-price moves. And having 1/11th of SIL’s capital squandered in Korea Zinc is madness. It’s far better to avoid SIL and deploy capital in smaller purer primary silver miners.
Silver’s previous major upleg erupted in essentially H1’16, when silver soared 50.2% higher on a parallel 29.9% gold upleg. SIL blasted 247.8% higher in just 6.9 months, a heck of a gain for major silver stocks. But the purer primary silver miners did far better. The purest major silver miner First Majestic’s stock was a moonshot, skyrocketing a staggering 633.9% higher in that same short span! SIL’s gains are relatively muted.
To multiply your capital in the markets, you have to trade like a contrarian. That means buying low when few others are willing, so you can later sell high when few others can. In the first half of 2019 well before silver stocks surged higher, we recommended buying many fundamentally-superior gold and silver miners in our popular weekly and monthly newsletters. We later realized big gains including 109.7%, 105.8%, and 103.0%!
To profitably trade high-potential precious-metals stocks, you need to stay informed about the broader market cycles that drive gold. Our newsletters are a great way, easy to read and affordable. They draw on my vast experience, knowledge, wisdom, and ongoing research to explain what’s going on in the markets, why, and how to trade them with specific stocks. Subscribe today and take advantage of our 20%-off sale! Get onboard now to mirror our coming trades for the next upleg after gold’s correction largely passes.
The bottom line is the major silver miners had an incredible Q3, despite silver’s anemic rally straddling that quarter compared to gold’s. The higher prevailing silver prices combined with lower costs still worked wonders for silver miners’ profitability, both implied as an industry and actual per GAAP earnings. That drove radical fundamental improvements in the silver miners, even as they continued diversifying into gold.
But silver’s recent upleg was truncated way before silver-stock prices really started to reflect the miners’ wildly-better fundamentals. That portends big outsized silver-stock gains during silver’s next upleg. As long as prevailing silver prices continue advancing on balance with gold’s secular bull, the silver miners are going to keep looking better and better fundamentally. Their upside potential is massive, well worth riding.
The precious metals sector remains in a correction. The miners have shown some positive signs but are not ready to move yet because the metals likely have more correction ahead.
Technical support levels can provide us with low risk buy opportunities but combine that with sentiment data and we increase our odds of success.
One reason why the sector is stuck in a correction is because the net speculative position in Gold remains stubbornly high at 44% of open interest. Following interim peaks in the 2000s, the net speculative position usually fell to 30% and even 20% at times before Gold began its next impulsive advance.
We anticipate Gold will test $1400 and perhaps lower and that will clear out some of the specs.

Other sentiment data for Gold is more encouraging.
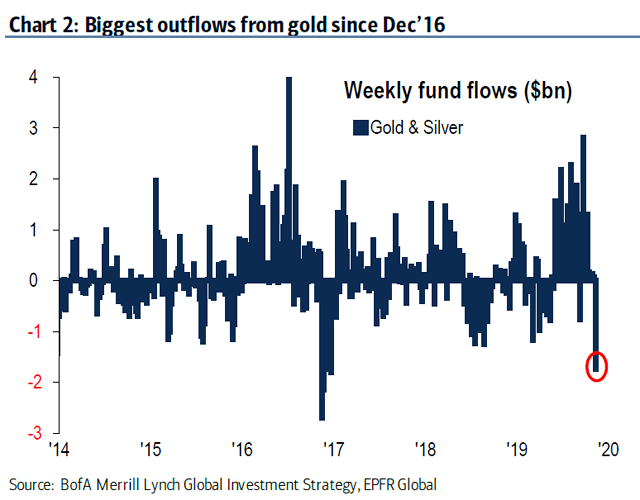
As of mid November, outflows in GLD reached their highest level since the December 2016 low. Judging from the outflows around the previous lows, Gold likely needs a few more weeks of outflows to signal a bottom.
As we noted here over three months ago, the 21-day daily sentiment index (DSI) like the net speculative position often declines to and below 30% during corrections within bull markets. Last I checked, the 21-day DSI was 38.5%. It has decreased from a whopping 84% but still has more room to fall.
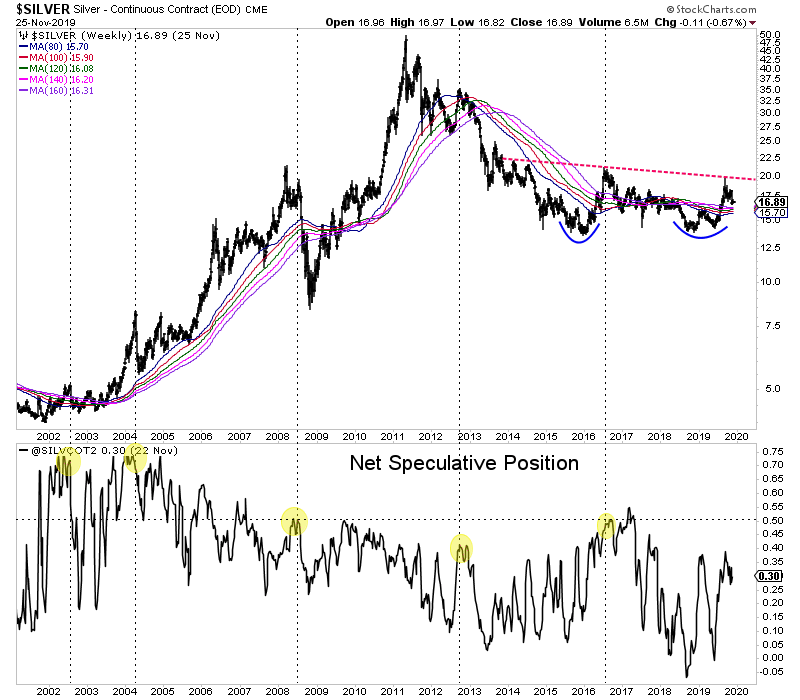
Turning to Silver, we note a current net speculative position of 30% of open interest which is below previous peaks of 40% and 50%. During corrections within the bull market of the 2000s, Silver’s net speculative position often bottomed around 25%.
Elsewhere, the 21-day DSI for Silver is currently 63% which is stubbornly high. While Silver’s net speculative position isn’t extended, its DSI is.
Essentially, both the technicals and sentiment suggest the path of least resistance for Gold and Silver is lower.
We are looking at downside targets of $1400 and lower in Gold and roughly $16.00 for Silver. Should the metals test those levels, then sentiment indicators would reach more encouraging levels that could finally favor the bulls.
If and when that occurs, it could create excellent buying opportunities across the sector. Some juniors could bottom sooner while some could bottom around the end of tax loss selling.
The mid-tier gold miners just reported their results for a phenomenal gold quarter. In Q3’19 this metal surged after its first bull-market breakout in years, driving much-higher prevailing prices. That should’ve led to soaring profits for these mid-tiers in the sweet spot for stock-price upside potential. Last quarter’s results are the most important this sector has seen in a long time, a key fundamental test for gold miners.
Four times a year publicly-traded companies release treasure troves of valuable information in the form of quarterly reports. Required by the US Securities and Exchange Commission, these 10-Qs and 10-Ks contain the best fundamental data available to traders. They dispel all the sentiment distortions inevitably surrounding prevailing stock-price levels, revealing corporations’ underlying hard fundamental realities.
The global nature of the gold-mining industry complicates efforts to gather this important data. Many mid-tier gold miners trade in Australia, Canada, Mexico, the United Kingdom, and other countries with quite-different reporting requirements. These include half-year reporting rather than quarterly, long 90-day filing deadlines after fiscal year-ends, and very-dissimilar presentations of operating and financial results.
The definitive list of mid-tier gold miners to analyze comes from the GDXJ VanEck Vectors Junior Gold Miners ETF. Despite its misleading name, GDXJ is totally dominated by mid-tier gold miners and not juniors. GDXJ is the world’s second-largest gold-stock ETF, with $4.8b of net assets this week. That is only behind its big-brother GDX VanEck Vectors Gold Miners ETF that includes the major gold miners.
Major gold miners are those that produce over 1m ounces of gold annually. The mid-tier gold miners are smaller, producing between 300k to 1m ounces each year. Below 300k is the junior realm. Translated into quarterly terms, majors mine 250k+ ounces, mid-tiers 75k to 250k, and juniors less than 75k. GDXJ was originally launched as a real junior-gold-stock ETF as its name implies, but it was forced to change its mission.
Gold stocks soared in price and popularity in the first half of 2016, ignited by a new bull market in gold. The metal itself awoke from deep secular lows and soared 29.9% higher in just 6.7 months. GDXJ and GDX skyrocketed 202.5% and 151.2% higher in roughly that same span, greatly leveraging gold’s gains! As capital flooded into GDXJ to own junior miners, this ETF risked running afoul of Canadian securities laws.
Canada is the center of the junior-gold universe, where most juniors trade. Once any investor including an ETF buys up a 20%+ stake in a Canadian stock, it is legally deemed a takeover offer. This may have been relevant to a single corporate buyer amassing 20%+, but GDXJ’s legions of investors certainly weren’t trying to take over small gold miners. GDXJ diversified away from juniors to comply with that archaic rule.
Smaller juniors by market capitalization were abandoned entirely, cutting them off from the sizable flows of ETF capital. Larger juniors were kept, but with their weightings within GDXJ greatly demoted. Most of its ranks were filled with mid-tier gold miners, as well as a handful of smaller majors. That was frustrating, but ultimately beneficial. Mid-tier gold miners are in the sweet spot for stock-price appreciation potential!
For years major gold miners have struggled with declining production, they can’t find or buy enough new gold to offset their depletion. And the stock-price inertia from their large market capitalizations is hard to overcome. The mid-tiers can and are boosting their gold outputs, which fuels growth in operating cash flows and profitability. With much-lower market caps, capital inflows drive their stock prices higher much faster.
Every quarter I dive into the latest results from the top 34 GDXJ components. That’s simply an arbitrary number that fits neatly into the tables below, but a commanding sample. These companies represented 82.7% of GDXJ’s total weighting this week, even though it contained a whopping 72 stocks! 5 of the top 34 were majors mining 250k+ ounces, 23 mid-tiers at 75k to 250k, 5 “juniors” under 75k, and 1 explorer with zero.
These majors accounted for 20.2% of GDXJ’s total weighting, and really have no place in a “Junior Gold Miners ETF” when they could instead be exclusively in GDX. These mid-tiers weighed in at 53.6% of GDXJ. The “juniors” among the top 34 represented just 6.9% of GDXJ’s total. But only 1 of them at a mere 1.0% of GDXJ is a true junior, meaning it derives over half its revenues from actually mining gold.
The rest include 2 primary silver miners, a gold-royalty company, and a gold streamer. GDXJ is actually a full-on mid-tier gold miners ETF, with considerable major and tiny junior exposure. Traders must realize it is not a junior-gold investment vehicle as advertised. GDXJ also has major overlap with GDX. Fully 29 of these top 34 GDXJ gold miners are included in GDX too, with 24 of them also among GDX’s top 34 stocks.
The GDXJ top 34 accounting for 82.7% of its total weighting also represent 37.8% of GDX’s own total weighting! The GDXJ top 34 mostly clustered between the 10th- to 40th-highest weightings in GDX. Thus nearly 5/6ths of GDXJ is made up by over 3/8ths of GDX. But GDXJ is far superior, excluding the large gold majors struggling with production growth. GDXJ gives higher weightings to better mid-tier miners.
The average Q3’19 gold production among GDXJ’s top 34 was 158k ounces, a bit over half as big as the GDX top 34’s 303k average. Despite these two ETFs’ extensive common holdings, GDXJ is increasingly outperforming GDX. GDXJ holds many of the world’s best mid-tier gold miners with big upside potential as gold’s own bull continues powering higher. Thus it is important to analyze GDXJ miners’ latest results.
So after each quarterly earnings season I wade through all available operational and financial reports and dump key data into a big spreadsheet for analysis. Some highlights make it into these tables. Any blank fields mean a company hadn’t reported that data as of this Wednesday. The first couple columns show each GDXJ component’s symbol and weighting within this ETF as of this week. Not all are US symbols.
19 of the GDXJ top 34 primarily trade in the US, 5 in Australia, 8 in Canada, and 1 each in Mexico and the UK. Those symbols are listings from companies’ foreign stock exchanges. That’s followed by each gold miner’s Q3’19 production in ounces, which is mostly in pure-gold terms excluding byproducts often found in gold ore like silver and base metals. Then production’s absolute year-over-year change from Q3’18 is shown.
Next comes gold miners’ most-important fundamental data for investors, cash costs and all-in sustaining costs per ounce mined. The latter directly drive profitability which ultimately determines stock prices. These key costs are also followed by YoY changes. Last but not least the annual changes are shown in operating cash flows generated, hard GAAP earnings, revenues, and cash on hand with a couple exceptions.
Percentage changes aren’t relevant or meaningful if data shifted from positive to negative or vice versa, or if derived from two negative numbers. So in those cases I included raw underlying data rather than weird or misleading percentage changes. In cases where foreign GDXJ components only released half-year data, I used that and split it in half where appropriate. That offers a decent approximation of Q3 results.
Symbols highlighted in light-blue newly climbed into the ranks of GDXJ’s top 34 over this past year. And symbols highlighted in yellow show the scarce GDXJ-top-34 components that aren’t also in GDX. If both conditions are true, blue-yellow checkerboarding is used. Production bold-faced in blue shows any rare junior gold miners in GDXJ’s higher ranks, under 75k ounces quarterly with over half of sales from gold mining.
This whole valuable dataset compared with past quarters offers a fantastic high-level read on how mid-tier gold miners are faring fundamentally as an industry. Their Q3 proved awesome, with gold’s much-higher prevailing prices radically improving the mid-tiers’ fundamentals. Revenues, operating cash flows, and earnings all soared. The mid-tier gold miners’ stock prices certainly don’t yet reflect that huge improvement.
After 14 quarters in a row advancing this challenging research thread, I continue to be amazed at how much GDXJ’s top 34 holdings remain in flux. Changes at the bottom of this range are understandable, as GDXJ’s rankings are largely market-capitalization-weighted. So as mid-tier gold miners’ relative sizes change with their stock prices, better-performing stocks advance into the top 34 knocking out the laggards.
Eldorado Gold, Silvercorp Metals, and Wesdome Gold are all examples of this normal index evolution. Between the ends of Q3’18 to Q3’19, their stock prices soared 76.6%, 57.5%, and 68.6% higher! Big gains like that are why the mid-tier and junior gold miners are so alluring. But GDXJ’s managers are still manually shuffling larger stocks higher up in their ETF’s ranks, trying to figure out which gold majors to include.
That’s unfortunate, as they don’t need any. There are plenty of mid-tier gold miners out there to spread GDXJ’s weightings across without pushing into Canadian ownership limits. The newest big additions in this past year came in Q4’18, when GDXJ added Kinross Gold and Buenaventura. Kinross is one of the best major gold miners, well outperforming its peers. Yet it does expect to mine 2.5m ounces of gold in 2019.
But how such a large gold miner can lead a “Junior Gold Miners ETF” is beyond me. Kinross is way into major-dom, not barely a major with 1m+ ounces of annual production. On the bright side, Kinross is far superior to AngloGold Ashanti which was among GDXJ’s highest-weighted components a year ago in Q3’18. It produced a staggering 851k ounces that quarter, making it one of the world’s largest gold miners.
Buenaventura and Industrias Peñoles are solid mid-tier additions, producing 122k and 218k ounces of gold last quarter even though they are better known as major silver miners. Q3’19 was the latter’s first quarter included in GDXJ. But burdening a strong list of mid-tier gold miners with the struggling South African majors is utterly baffling. Sibanye Gold, Gold Fields, and Harmony Gold have no place to be in this ETF.
They mined 287k, 523k, and 361k ounces of gold in Q3’19, all well into major-gold-miner territory over 250k ounces quarterly. And their sizable collective 11.4% weighting in GDXJ is a serious burden for its shareholders. The South African majors’ operational performances are terrible, with their very-old and very-deep mines being among the world’s highest-cost producers. Government issues exacerbate that.
South Africa’s government is absurdly-corrupt, and is always attacking the miners and their owners. This is not only squeezing out more taxes and perpetually expanding a crushing regulatory burden. Officials in that once-proud country are arbitrarily shifting mine ownership based on skin color, an openly-racist policy hostile to foreign shareholders. I wouldn’t invest in South African gold miners if they were the last on Earth.
They are really retarding GDXJ’s potential. In Q3 SBGL, GFI, and HMY averaged 390k ounces of gold mined. That compares to 134k for the rest of the GDXJ top 34. These South African majors’ cash costs and all-in sustaining costs averaged $1112 and $1194 last quarter. Those were a staggering 63.1% and 27.8% higher than the rest of the GDXJ top 34’s averages! GDXJ’s managers really need to replace them.
Production has always been the lifeblood of the gold-mining industry. Gold miners have no control over prevailing gold prices, their product sells for whatever the markets offer. Thus growing production is the only manageable way to boost revenues, leading to amplified gains in operating cash flows and profits. Higher production generates more capital to invest in expanding existing mines and building or buying new ones.
Thus gold-stock investors have long prized production growth above everything else, as it is inexorably linked to company growth and thus stock-price-appreciation potential. In Q3’19 these GDXJ-top-34 gold miners collectively produced 5.2m ounces of gold, up a solid 2.7% YoY. The mid-tier production growth was actually far stronger than that though, which was masked by those three ugly South African majors.
Their average production declined 4.5% YoY in Q3, but the rest of the GDXJ top 34 averaged awesome 21.1% YoY growth! But even with those albatrosses around GDXJ’s neck, the overall 2.7% absolute growth from Q3’18 was quite good. Last week I analyzed the Q3’19 performances of GDXJ’s big-brother GDX top-34-component gold miners. Their collective production actually slumped 1.5% YoY absolutely.
According to the World Gold Council’s comprehensive quarterly data on global gold supply and demand, overall world gold mined drifted 0.6% lower YoY in Q3’19. The majors dominating GDX fared worse than that, while the mid-tiers of GDXJ did way better even despite those South African majors. The mid-tiers have cornered the market on gold production growth, again granting them superior stock-price upside potential.
The GDXJ mid-tiers were able to enjoy strong production growth because this ETF isn’t burdened with many struggling major gold miners that dominate GDX. GDXJ’s components start at the 10th-highest weighting in GDX. The 9 above Kinross averaged colossal Q3 production of 585k ounces, which is 3.7x bigger than the GDXJ top 34’s average! Gold mining’s inherent geological limitations make it very difficult to scale.
The more gold miners produce, the harder it is to even keep up with relentless depletion let alone grow their output consistently. Large economically-viable gold deposits are getting increasingly difficult to find and ever-more-expensive to develop, with low-hanging fruit long since exploited. But with much-smaller production bases, mine expansions and new mine builds generate big output growth for mid-tier golds.
The majors don’t only face that large-base growth problem with their production scales, but also with their stocks’ market capitalizations. The GDXJ top 34 companies’ averaged $2.4b in the middle of this week, compared to $6.3b in the GDX top 34 when I analyzed their Q3 results last week. With the mid-tiers generally around a third as big as the majors, their stock prices have much less inertia restraining them.
The mid-tier gold miners continue to prove all-important production growth is achievable off smaller bases. With a handful of mines or less to operate, mid-tiers can focus on expanding them or building a new mine to boost their output beyond depletion. But the majors are increasingly failing to do this from the super-high production bases they operate at. As long as majors are struggling, it is prudent to avoid them.
And Q3’19 was a fantastic quarter to be a fundamentally-superior gold miner, with gold’s average price soaring 21.7% YoY to $1474! While gold only rallied 4.4% within Q3 proper, it had blasted up 10.2% quarter-to-date by early September. That’s when gold’s best upleg of this current secular bull peaked at a 32.4% gain over 12.6 months. Gold crested with gold-futures speculators’ buying firepower exhausting.
GDXJ’s parallel upleg ran 61.6% over 11.8 months, peaking on the same early-September day as gold. GDXJ had soared 22.3% QTD at that point, although its subsequent correction with gold in Q3’s waning weeks bashed GDXJ back to a mere 3.7% gain during Q3 proper. That is really poor, even lagging gold’s advance. But the mid-tiers’ Q3’19 results proved they are wildly undervalued relative to prevailing gold levels!
The difference between gold prices and mining costs fuels profitability for gold miners, and Q3’s spread was the biggest and best seen in years. Gold-mining costs are largely fixed quarter after quarter, with production generally requiring the same levels of infrastructure, equipment, and employees. These big fixed costs are largely determined during mine-planning stages, and don’t change much with gold prices.
That’s when engineers and geologists decide which gold-bearing ores to mine, how to dig to them, and how to recover their gold. The ongoing mining costs are spread across quarterly production, making gold output and unit costs usually inversely proportional. The richer the gold ores fed through fixed-capacity mills, the more gold produced. The more gold mined, the more ounces to bear those big fixed costs.
There are two major ways to measure gold-mining costs, classic cash costs per ounce and the superior all-in sustaining costs per ounce. Both are useful metrics. Cash costs are the acid test of gold-miner survivability in lower-gold-price environments, revealing the worst-case gold levels necessary to keep the mines running. All-in sustaining costs show where gold needs to trade to maintain current mining tempos indefinitely.
Cash costs naturally encompass all cash expenses necessary to produce each ounce of gold, including all direct production costs, mine-level administration, smelting, refining, transport, regulatory, royalty, and tax expenses. In Q3’19 these top-34-GDXJ-component gold miners that reported cash costs averaged $713 per ounce. That actually rose a sharp 7.5% YoY, and was worse than the GDX-top-34 majors’ $679 mean.
But Sibanye Gold, Gold Fields, and Harmony Gold were solely to blame. Again these troubled South African gold majors reported crazy average cash costs of $1112 in Q3, 63.1% higher than the rest of the GDXJ top 34’s $682 average! Both cash-cost measures are within the past 13 quarters’ range of $612 to $730. With cash costs so far below prevailing gold prices, obviously mid-tiers face no existential threat.
Way more important than cash costs are the far-superior all-in sustaining costs. They were introduced by the World Gold Council in June 2013 to give investors a much-better understanding of what it really costs to maintain gold mines as ongoing concerns. AISCs include all direct cash costs, but then add on everything else that is necessary to maintain and replenish operations at current gold-production levels.
These additional expenses include exploration for new gold to mine to replace depleting deposits, mine-development and construction expenses, remediation, and mine reclamation. They also include the corporate-level administration expenses necessary to oversee gold mines. All-in sustaining costs are the most-important gold-mining cost metric by far for investors, revealing companies’ true operating profitability.
The GDXJ-top-34 average AISCs also defied rising production to surge 5.8% higher YoY to $963 per ounce. That is on the high side, and worse than the GDX majors’ $910 average. But it is still within the past 13 quarters’ range of $855 to $1002. And again those South African majors skewed that way higher, with their $1194 average AISCs being 27.8% higher compared to the rest of the GDX top 34’s $935 average!
But $963 is still fantastic with current prevailing gold prices. The GDXJ mid-tiers’ implied profitability last quarter is gold’s $1474 average price less their $963 average all-in sustaining costs. That makes for fat profit margins of $511 per ounce. A year earlier in Q3’18, gold averaged just $1211 while GDXJ-top-34 AISCs ran $911 for $300-per-ounce profits. Thus the GDXJ miners’ implied earnings rocketed 70.3% YoY!
That’s excellent 3.2x profits leverage to the 21.7% YoY increase in the average gold price from Q3’18 to Q3’19! And the sequential explosion in profits from Q2’19 is even more extreme. That quarter gold was averaging $1309 with GDXJ AISCs of $941. That made for $368 of implied earnings, meaning Q3’19 saw epic 38.9% quarter-on-quarter growth! This is incredible absolutely, but even more so relatively this year.
Overall US corporate profits have actually been shrinking, leading to increasing fears that an earnings recession is underway. The 500 elite companies of the flagship US S&P 500 stock index likely saw their overall profits decline 2.4% YoY in Q3. So the enormous earnings growth the gold miners are enjoying stands out even more. Investors ought to seek out their best-in-stock-markets fundamental performances.
And the mid-tiers’ powerful earnings growth is likely to continue. Even though gold is now in a necessary and healthy bull-market correction following that big latest upleg, it has averaged $1487 so far in Q4’19. That’s even higher than that $1474 Q3 average! With over half of Q4 over, gold’s average price is going to remain elevated even as it grinds lower. That portends massive mid-tier earnings growth persisting in Q4.
The hard GAAP accounting numbers of the GDXJ-top-34 mid-tier gold miners confirm their fundamentals radically improved in Q3. Their total revenues rocketed 76.8% higher YoY to $7.2b, which is amazing top-line growth. Much of this has to do with the new additions of Kinross, Buenaventura, and Peñoles though. The giant South African company they replaced, AngloGold, didn’t bother reporting sales in Q3’18.
But even excluding these new additions entirely, without subtracting Q3’18 sales from gold miners no longer in the GDXJ top 34, total revenues still surged 22.5% YoY. That makes sense with 21.7%-higher average gold prices and 2.7%-higher total gold production. All that revenue led to exploding operating-cash-flow generation, with GDXJ-top-34 OCFs rocketing a similar 79.2% higher YoY to $2.3b in Q3’19.
Even excluding KGC, BVN, and PENO again, OCFs still surged 35.7% YoY. That boosted the GDXJ-top-34 mid-tiers’ total cash in their treasuries by 7.5% to $5.8b. They spend a lot on expanding production, as their 21.1% average output growth without those infernal South Africa majors testifies to. The much-higher prevailing gold prices indeed worked wonders for the mid-tier gold miners’ fundamentals as a sector.
On the bottom-line GAAP-profits front, the GDXJ top 34’s total earnings of $189m in Q3’19 were vastly better than their $379m overall loss in Q3’18. Excluding those new additions, the comparison is similar at +$161m last quarter versus the same -$379m a year earlier. But gold-mining earnings across this sector sometimes have large one-off non-cash items that are flushed through income statements, obscuring comparisons.
The biggest example is large impairment charges when lower gold prices make mines or deposits look like they’re worth less, and subsequent reversals when gold heads higher again. Other one-off items include gains and losses on selling existing mines, as well as hedges. So as I wade through the GDXJ mid-tiers’ quarterly income statements reported to regulators, I look for any big unusual items and record them.
Q3’19’s biggest ones among the GDXJ top 34 included Yamana Gold enjoying a $273m gain on selling a mine and Centerra Gold writing off $231m due to water-supply problems at one of its mines. Adjusting for all these, the GDXJ top 34’s overall profits were closer to $265m in Q3’19. Making similar adjustments in the comparable Q3’18 pared that loss to $1m. The mid-tiers’ core earnings growth last quarter was still massive!
Despite all that, GDXJ’s average price of $38.81 in Q3’19 was only 30.8% higher than Q3’18’s. The mid-tier gold miners’ stock prices certainly aren’t yet reflecting the radical fundamental improvements driven by these higher prevailing gold prices. They will eventually, but not until gold’s own next upleg gives the green light for traders to pile back into gold stocks. Their next upleg should prove an enormous catch-up one.
Even with those vexing South African majors, GDXJ remains the easiest way to ride it. But the gains to be won in the better fundamentally-superior mid-tier gold miners will dwarf that of this ETF. Again GDXJ rallied 61.6% over 11.8 months ending in early September. But one its fast-improving components, Torex Gold, saw its stock price rocket 171.6% higher in roughly that same span! Good stock picking trounces GDXJ.
To multiply your capital in the markets, you have to trade like a contrarian. That means buying low when few others are willing, so you can later sell high when few others can. In the first half of 2019 well before gold stocks soared higher, we recommended buying many fundamentally-superior gold and silver miners in our popular weekly and monthly newsletters. We later realized big gains including 109.7%, 105.8%, and 103.0%!
To profitably trade high-potential gold stocks, you need to stay informed about the broader market cycles that drive gold. Our newsletters are a great way, easy to read and affordable. They draw on my vast experience, knowledge, wisdom, and ongoing research to explain what’s going on in the markets, why, and how to trade them with specific stocks. Subscribe today and take advantage of our 20%-off sale! Get onboard now so you can mirror our coming trades for gold’s next upleg after this correction largely passes.
The bottom line is the mid-tier gold miners reported awesome results in Q3, directly driven by its much-higher prevailing gold prices. The mid-tiers had far-better output growth than the majors, which fueled soaring revenues, operating cash flows, and earnings. And implied earnings growth continues to look massive with gold largely holding at these better prices. The mid-tiers’ fundamentals should keep improving.
The mid-tier gold miners’ stock prices have greatly lagged their radically-better results. Their recent upleg was truncated prematurely by gold peaking. But once gold’s next major upleg gets underway after its healthy correction runs its course, the mid-tier gold stocks have a lot of catching up to do. Their coming upleg should prove really outsized as they are bid much higher to better reflect fantastic fundamentals.
- Top US politicians describe the US economy as the “mightiest of all time”.
- Please click here now. Houston, we have a problem! The next tariff tax deadline is now only about three weeks away.
- While Trump’s diehard fans may want him to hike these taxes again if China doesn’t “play ball”, massive FOREX liquidity flows suggest that the world’s biggest money managers are becoming extremely concerned about the level of risk in the US economy.
- Please click here now. Double-click to enlarge. American GDP growth has literally incinerated (from what I predicted would be a 5% peak as the tariff taxes were launched), and this dollar versus yen chart shows a massive bear wedge pattern in play.
- That bear wedge is ominous. It suggests giant bank FOREX traders believe something is about to go badly wrong with the US economy… more wrong than the horrific sub 1% GDP growth in play now!
- Trump’s initial platform of tax cuts, law and order, and deregulation was awesome. It created surging markets (both gold and stocks), a positive vibe for citizens, and solid GDP growth.
- That platform has been replaced with macabre QE and negative rates worship, turning a blind eye to a skyrocketing deficit, and a crazed attempt to boost growth with tariff taxes… and it’s all happening as the world de-dollarizes at an ever-faster rate.
- Stagflation is emerging, and some economists are forecasting that in 2020 corporate earnings and revenue growth will both come in at the sub 3% marker. Debt would surge in that scenario.
- While the economy wallows in a tariff tax and debt quagmire, stock market investors have been repeatedly saved by the Fed.
- Top earners pay 50% capital gains tax, which arguably makes the government the main beneficiary of upside stock market action. This is, quite frankly, insane.
- The alternative, a democrat administration, would be even worse news for most people with stakes in America.
- It’s unknown how Jay Powell would respond to a fresh hike in tariffs in December. He might cut rates and do more “QE that is not QE”, but what if he doesn’t?
- Please click here now. Double-click to enlarge. The bottom line is that it doesn’t look good for America and most of the West, and that’s why there’s a massive launch pad pattern in play on the weekly gold chart.
- I’ve dubbed that pattern as “Michelangelo”, because it’s so enormous and technically aesthetic.
- My base scenario for 2020 is that the US economy muddles along, Trump doesn’t launch any more significant tariff taxes, and the Fed is likely to step in and keep the stock market boats afloat if they start sinking again.
- My base scenario sees gold and related items again outperform all other major asset classes in 2020, but with the bull wedge pattern on the weekly chart becoming more of a gentle reactive drift.
- I give that scenario 70% odds, leaving a 30% chance that in three weeks Trump hikes tariffs, Powell does nothing, the stock market crashes, and gold stages a vertical blast towards $1900.
- In that more dire scenario, there would be a breakout from the bull wedge, and gold would stun most investors with the intensity of its upside price action.
- Whichever scenario prevails, gold and related assets are the most important place to be invested, for maximum upside action.
- Please click here now. Double-click to enlarge. In the short-term, I’m looking for gold to stage a double bottoming event, and that could mark the end of the current reaction.
- What happens with tariff taxes in the next three weeks will likely determine whether gold moves down to significant support at $1397 and bottoms there, or bottoms at current $1465 support.
- A move above $1566 for bullion is probably the biggest game changer for gold and silver stocks since the 1970s. It turns many miners into cash cows and probably unleashes a frenzy of stock buybacks and takeovers.
- Please click here now. Double-click to enlarge. The weekly gold bullion chart is aesthetic, but so is this short-term GDX chart. A bull wedge pattern is in play and a breakout seems imminent. The reaction has been orderly, and now there’s a buy signal in play on my 14,7,7 series Stochastics oscillator.
- Please click here now. Double-click to enlarge. A breakout from the bull wedge on the GDX daily chart likely drives a breakout over $30 on the weekly chart. That opens the door to a mighty surge into my $52 target zone!
Copper’s Demand – It is In Everything We Use and Difficult to Substitute
Anything with an on/off switch uses copper. Our homes, infrastructure and electronics all
require copper as a critical input. Its traditional uses are now amplified with new forms of
electrification which include not only electric vehicles, but the infrastructure needed for solar and wind power generation and storage. Copper is a versatile metal whose conductivity, low cost and difficulty to substitute makes the red metal so integral to business that its price is considered an indicator of economic growth.
Copper’s Short Term Obstacle: US – China Trade War
As a counter measure to China’s aggressive growth plans, the US Trade Representative has
implemented tariffs on certain Chinese imports in 2018, and even accused China of theft of intellectual property. China retaliated by implementing its own tariffs, and this was the start of an on-going trade war—ultimately stunting copper demand as China is the worlds largest consumer.
Impact on Price
The trade war has slowed down Chinese copper demand, keeping copper prices low
(currently ~$2.60/lb). Long-term price will heal once the trade dispute is settled or an
agreement is made.
The Return of Demand & Copper’s Wealth Effect
China is responsible for over 50% of global demand in the form of infrastructure, construction, manufacturing and electrification. A key factor in increasing global copper demand is the global wealth effect and population growth. As populations and GDP per capita continue to grow in developing nations, copper demand will increase in lockstep.
Made in China 2025, China 2035 and China 2049
China’s growth plans are underpinned by copper. Its ‘Made in China 2025’ 10-year goal is to transform the country into the leader for ten high-tech industries, including electric vehicles and technology. The plan focuses on China’s domestic companies becoming self-sufficient and developing core components with the government supporting acquiring the ‘know-how’ (intellectual property) for developing such technology. By 2035, China plans to compete with the world’s manufacturing powers on all fronts, and by 2049 China aims to become the world leader. Ambitious as the plan is, China has set clear goals and as such has been voraciously acquiring the raw materials to achieve their objectives.
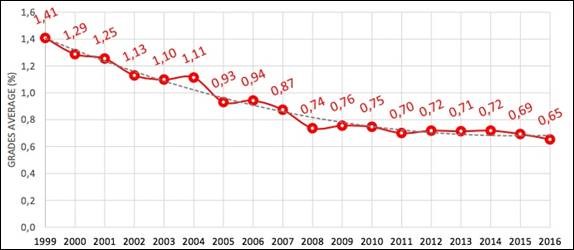
Supply-side Headwinds: Old, Degrading Mines in Risky Jurisdictions
Grades from copper mines in Chile, who in 2018 produced 28% of the world’s copper, are in steep decline and face drastically increased capital expenditures due to the need for
desalination plants, to use sea water as their water source. Furthermore, new large scale
copper mines take decades to become operational and the location of expected future supply in the pipeline remain in high risk jurisdictions.
Copper is Cyclical
Over the past 20 years, copper price has fallen below $1.50/lb during the 2008-2009
recession and has risen to over $3.50/lb multiple times (2005, 2006, 2007, 2010, 2012) and has even reached the $4.00/lb mark in 2010-2011. The current dip in copper prices
provide for an entry opportunity. Long-term fundamentals and structural issues continue
to point towards increasing copper demand coming from China and other developing nations. The world needs secure, established copper supply to meet the demand.
Incentive Pricing
An price of ~$3.20/lb is needed to incentivize development of new copper mines. This price can be higher based on specific government goals. For example, a price of $4.00/lb is
needed to meet the UK government mandated decarbonisation targets by 20301. Under a
more extreme scenario, to achieve complete decarbonisation by 2025 (“Greta Scenario” , a
copper price of ~$9.10/lb is required. Copper is key in decarbonisation. Wind and Solar
energy use anywhere from 3 to 15 times the copper per unit compared to fossil fuels.
Similarly, electric vehicles use anywhere from 4 to 16 times the copper than a traditional
internal combustion engine.
Nearly 50% of Supply at Risk
Apart from Latin America, other large copper producers are in Africa (i.e. Zambia, Democratic Republic of Congo), Indonesia and Russia, accounting for a total of 45% of global production.

These jurisdictions have political and economic risks, including resource nationalization,
implementing increased royalties and overall operational uncertainty. Furthermore, majority of future copper supply is expected to remain focused on these high-risk jurisdictions.
The Perfect Place for a Copper Mine: Quebec, Canada
If you could select the most ideal location for a copper deposit, you’d want it Quebec. Then, you’d want it right beside a highway, a railroad and with access to power supply. Power Ore’s Opemiska checks each of these boxes and is off to a fantastic start with its drill program with twelve 100 metre copper and gold mineralized intervals near surface including several headline drill holes:
Power Ore’s Opemiska Copper Mine Complex is in an easily accessible location where
capital costs can be 2.5x lower for producing mines, and operating costs 60% lower2 as
opposed to more typical remote locations. Opemiska is easily accessible via paved highway
which significantly reduces exploration, development and operating costs.
– Article written by CEO Stephen Stewart of Power Ore Inc.
The gold miners’ stocks have surged in 2019, blasting higher after gold’s first bull-market breakout seen in several years. That powerful summer rally left them really overbought, necessitating a correction to rebalance exuberant sentiment. That grinding consolidation lower has set them up nicely for their winter rally, this sector’s seasonally-strongest time of the year. These seasonal tailwinds will amplify their next upleg.
Seasonality is the tendency for prices to exhibit recurring patterns at certain times during the calendar year. While seasonality doesn’t drive price action, it quantifies annually-repeating behavior driven by sentiment, technicals, and fundamentals. We humans are creatures of habit and herd, which naturally colors our trading decisions. The calendar year’s passage affects the timing and intensity of buying and selling.
Gold stocks exhibit strong seasonality because their price action mirrors that of their dominant primary driver, gold. Gold’s seasonality generally isn’t driven by supply fluctuations like grown commodities see, as its mined supply remains relatively steady year-round. Instead gold’s major seasonality is demand-driven, with global investment demand varying considerably depending on the time in the calendar year.
This gold seasonality is fueled by well-known income-cycle and cultural drivers of outsized gold demand from around the world. And the biggest seasonal surge of all is just getting underway heading into winter. As the Indian-wedding-season gold-jewelry buying that normally drives this metal’s big autumn rally winds down, the Western holiday season ramps up. The holiday spirit puts everyone in the mood to spend money.
Men splurge on vast amounts of gold jewelry for Christmas gifts for their wives, girlfriends, daughters, and mothers. The holidays are also a big engagement season, with Christmas Eve and New Year’s Eve being two of the biggest proposal nights of the year. Between a third to a half of the entire annual sales of jewelry retailers come in November and December! And jewelry historically dominates overall gold demand.
According to the World Gold Council’s latest data, between 2014 to 2018 jewelry accounted for fully 58%, 57%, 47%, 53%, and 51% of total annual global gold demand. That averages out to 53%, which is far bigger than investment demand. During those same last 5 years, that weighed in at just 20%, 22%, 37%, 30%, and 26% to average 27% of the world total. Jewelry is nearly twice as large as investment demand!
That frenzied Western jewelry buying heading into winter shifts to pure investment demand after year-end. That’s when Western investors figure out how much surplus income they earned during the prior year after bonuses and taxes. Some of this is plowed into gold in January, driving it higher. Finally the big winter gold rally climaxes in late February on major Chinese New Year gold buying flaring up in Asia.
So during its bull-market years, gold has always tended to enjoy major winter rallies driven by these sequential episodes of outsized demand. Naturally the gold stocks follow gold higher, amplifying its gains due to their great profits leverage to the gold price. Today gold stocks are now once again heading into their strongest seasonal rally of the year, driven by this annually-recurring robust winter gold demand.
Since it is gold’s own demand-driven seasonality that fuels gold stocks’ seasonality, that’s logically the best place to start to understand what’s likely coming. Price action is very different between bull and bear years, and gold remains in a younger bull market. After falling to a 6.1-year secular low in mid-December 2015 as the Fed kicked off its latest rate-hike cycle, gold powered 29.9% higher over the next 6.7 months.
Crossing the +20% threshold in March 2016 confirmed a new bull market was underway. Gold corrected after that sharp initial upleg, but normal healthy selling was greatly exacerbated after Trump’s surprise election win. Investors fled gold to chase the taxphoria stock-market surge. Gold’s correction cascaded to monstrous proportions, hitting -17.3% in mid-December 2016. But that remained shy of a new bear’s -20%.
Gold rebounded sharply from those anomalous severe-correction lows, nearly fully recovering by early September 2017. But gold failed to break out to new bull-market highs, then and several times after. That left gold’s bull increasingly doubted, until June 2019. Then gold surged to a major decisive breakout confirming its bull remains alive and well! Its total gains grew to 47.8% in early September, still small for gold.
Gold’s last mighty bull market ran from April 2001 to August 2011, where it soared 638.2% higher! And while gold consolidated high in 2012, that was technically a bull year too since gold just slid 18.8% at worst from its bull-market peak. Gold didn’t enter formal bear-market territory until April 2013, thanks to the crazy stock-market levitation driven by extreme distortions from the Fed’s QE3 bond monetizations.
So the bull-market years for gold in modern history ran from 2001 to 2012, skipped the intervening bear-market years of 2013 to 2015, then resumed in 2016 to 2019. Thus these are the years most relevant to understanding gold’s typical seasonal performance throughout the calendar year. We’re interested in bull-market seasonality, because gold remains in its younger bull today and bear-market action is quite dissimilar.
Prevailing gold prices varied radically throughout these modern bull-market years, running between $257 when gold’s last secular bull was born to $1894 when it peaked a decade later. All these years along with gold’s latest bull since 2016 have to first be rendered in like-percentage terms in order to make them perfectly comparable. Only then can they be averaged together to distill out gold’s bull-market seasonality.
That’s accomplished by individually indexing each calendar year’s gold price action to its final close of the preceding year, which is recast at 100. Then all gold price action of the following year is calculated off that common indexed baseline, normalizing all years regardless of price levels. So gold trading at an indexed level of 105 simply means it has rallied 5% from the prior year’s close, while 95 shows it’s down 5%.
This chart averages the individually-indexed full-year gold performances in those bull-market years from 2001 to 2012 and 2016 to 2018. 2019 isn’t included yet since it remains a work in progress. This bull-market-seasonality methodology reveals that gold’s strongest seasonal rally by far is its winter one which tends to start in late October. That portends big gains in coming months from correction-depressed gold stocks.
During these modern bull-market years, gold has enjoyed a pronounced and strong seasonal uptrend. This whole concept of seasonality relies on blending many years together, smoothing away outliers to reveal underlying core tendencies. On average by year-ends, gold has powered 14.8% higher from the prior-year-final-close 100 baseline! And the majority of these major gains accrue during the winter rally.
On average gold’s winter rally starts powering higher in late October, right after the seasonal correction following gold’s autumn rally. This major winter-rally bottoming has technically averaged out to arrive on that month’s 16th trading day, which was October 22nd this year. But gold’s powerful bull-breakout rally left it with an extreme gold-futures-selling overhang, which sure ramps up the odds its bottoming will be delayed.
Seasonality defines mere tendencies over long spans, not primary drivers. And seasonals often exhibit mean-reversion patterns after major price moves. That may moderate some of gold’s early-winter-rally potential this year. Gold’s autumn rally naturally comes before its winter rally, running from mid-June to late September in these modern bull-market years. These autumn rallies have averaged modest 5.7% gains.
But late this past June soon after that seasonal rally started, gold achieved that glorious decisive bull-market breakout. That radically improved psychology, unleashing a deluge of new buying from both gold-futures speculators and normal gold investors. So over that usual autumn-rally span, gold surged 13.6% higher this year! That’s 2.4x the seasonal average, major outsized gains, which may have pulled forward buying.
After its autumn rally, gold suffers a seasonal correction running from late September to late October. It is the most severe of all gold’s seasonal corrections, dragging this metal down from its seasonal uptrend’s overhead-resistance line back to its lower support. That pre-winter-rally seasonal correction has run 1.9% on average. This year gold fell a worse-than-normal 2.8% in that span, part of a larger 5.2% pullback.
That still left gold entering its seasonally-strongest span at higher levels than normal, 1.080x its 200-day moving average this year! Over the past 5 years, at that late-October seasonal bottoming gold was only trading at a tight average of 0.987x its 200dma. So gold being much higher than usual heading into its strongest season may retard its coming winter-rally gains. But they could still prove large on pure sentiment.
Rather than buying low like they are supposed to, investors instead love buying high. They love chasing winners, throwing more capital at them the higher they run. Gold’s powerful summer surge this year has left investors far more excited about and bullish on gold than they were in all recent late Octobers. So gold’s self-reinforcing new-high psychology could really unleash a much-larger-than-normal winter rally.
Whether gold’s coming seasonal gains prove smaller or bigger than usual, its strong season is still well worth riding. It starts with November, which has seen big average gold gains of 2.7% from 2001 to 2012 and 2016 to 2018. That makes for gold’s second-strongest month of the calendar year! After that surge gold tends to consolidate high in December, which has averaged comparatively-unimpressive 1.0% gains.
But then comes January, which enjoys major gold demand after investors figure out how much surplus income they generated the prior year. January’s average 3.1% gains are the largest seen out of all the calendar months! That momentum coasts into February, which is no slouch either averaging 1.9% gains. Gold’s 4.1-month-long winter rally is the only seasonal one commanding a cluster of big-gold-rally months.
So late October to late February is when gold enjoys peak seasonal tailwinds. This can really amplify gold’s gains if it is already heading higher for sentimental, technical, or fundamental reasons. After gold’s powerful decisive-bull-breakout surge this past summer, investors are more excited about gold than they’ve been in years. So the alluring new-high psychology could unleash sentiment-fueled momentum buying.
The bigger gold’s winter rally, the better the gold miners’ stocks will perform during this same coming seasonally-strong timeframe. The gold stocks enjoy powerful sentimental and fundamental boosts when gold rallies consistently. Higher gold prices turn trader sentiment bullish on its miners, motivating them to deploy capital which forces gold-stock prices higher. That bullish psychology is fundamentally justified this year.
Gold-mining profits really amplify underlying gold gains. The higher gold prices flow directly through to bottom lines, as production costs are largely fixed when mines are being planned. Gold miners’ profits leverage to gold is really important to understand, illuminating why gold stocks are the best way to ride gold’s major seasonal rallies. The gold miners’ earnings should explode higher on gold’s breakout surge!
The leading gold-stock investment vehicle is the GDX VanEck Vectors Gold Miners ETF. It includes the world’s biggest and best major gold miners. Every quarter I analyze the latest operational and financial results from GDX’s elite gold stocks. While this current Q3’19 earnings season is well underway, it won’t be finished until mid-November. So the latest full results available are still Q2’19’s, which proved strong.
That quarter the GDX gold miners reported average all-in sustaining costs of $895 per ounce. That was much lower than gold’s average price of $1309, yielding industry profits of $414 per ounce. But gold’s breakout-surge-fueled upleg catapulted its prices radically higher in the recently-finished Q3’19. That left the average gold price a stupendous 12.6% higher quarter-on-quarter near $1474! That’s a massive jump.
These much-higher prevailing gold prices greatly amplify gold-mining earnings. The major gold miners’ AISCs don’t change much quarter-to-quarter regardless of prevailing gold prices. They averaged a tight $889 over the last 4 quarters. Assuming that holds in Q3, GDX’s major gold miners’ profits have likely skyrocketed 41.3% QoQ! Much-higher gold prices make huge gold-stock gains fundamentally-righteous.
A big gold-stock winter rally is certainly justified this year after gold’s bull-breakout surge. This next chart applies this same seasonal methodology to the traditional HUI NYSE Arca Gold BUGS Index. We can’t use GDX here since its price history is insufficient, it was only born in May 2006. But since GDX and the HUI hold most major gold miners in common, they closely mirror each other. Gold stocks see big winter rallies.
During these same modern gold-bull-market years of 2001 to 2012 and 2016 to 2018, the gold stocks as measured by the HUI enjoyed average gains of 14.9% between late October to late February. That also makes the gold stocks’ winter rally their largest seasonal one of the year, besting both the spring rally’s 12.2% gain and autumn rally’s 9.3% upside. Gold stocks enjoy their best cluster of strong monthly rallies now.
The monthly performances underlying these calendar-year seasonals are easier to understand if gold-stock seasonality is instead sliced into months. This next chart does just that, offering a more-granular perspective on seasonality. Each calendar month in these same modern bull-market years is individually indexed to 100 as of the previous month’s final close, then all like months’ indexes are averaged together.
From 2001 to 2012 and 2016 to 2018, the major gold stocks averaged strong 4.1% gains in Novembers. That ranks it as the third-best calendar month of the year for gold miners. Their drop off in December is much milder than gold’s too, as that month still enjoys good 2.9% average gains. Then January picks up quite dramatically with a 3.8% average surge, while February’s 4.2% is the second best of the calendar year!
Gold stocks’ winter rally is unique in not seeing any significant weakness within its span, unlike both the spring and autumn rallies which suffer sizable mid-run pullbacks. There’s been no better time seasonally to be heavily deployed in gold stocks in these modern bull-market years than this late-October-to-late-February winter-rally span. Gold stocks’ collective performance in coming months largely depends on gold’s.
The more gold rallies, the more bullish speculators and investors will grow on its miners’ stocks. And the more capital they will deploy, bidding gold-stock prices higher. If gold’s powerful autumn rally pulled forward too much buying, lower winter-rally gold gains will certainly weigh on gold stocks’ upside. But if new-high psychology flourishes in gold driving it considerably higher, the gold stocks will certainly soar again.
Their recent massive autumn-rally surge highlights how fast they can rocket with gold rallying materially. Between mid-June to late September, the major gold stocks per the HUI blasted 28.4% higher. That is 3.1x better than gold stocks’ average autumn rally, a really-strong run. Despite that surge they still have real potential to see those outsized gains continuing during their coming winter rally, for multiple reasons.
Fundamentally last quarter and the current Q4’19 are almost certain to see the gold miners enjoying their best earnings in years, both in absolute and growth terms. That’s going to validate traders’ decisions to allocate capital to this high-flying sector. Despite gold’s healthy bull-market correction, so far in Q4 its high $1494 average price still rivals Q3’s $1474. Much-higher gold-mining profits will fuel big investment demand.
In addition the gold stocks remain really undervalued relative to gold, the dominant driver of their profits. A quick proxy for this is found in the GDX/GLD Ratio, the daily close in GDX divided by the daily close in the leading GLD SPDR Gold Shares gold ETF. This GGR hit 0.211x in early September as the latest gold-stock upleg peaked, which was a 2.5-year high. At worst by mid-October the GGR slumped back to 0.188x.
Since this gold-stock bull was born in mid-January 2016, its average GGR has run 0.187x. But when gold is rallying consistently on balance and gold-stock traders wax bullish, gold stocks tend to shoot way higher relative to gold. In the summer of 2016 when gold stocks were last in favor, the GGR averaged 0.244x. To regain that GDX would have to rally about 25% from late-October levels, assuming gold is just flat.
And the GGR was much higher in the past when gold-stock psychology was much better. Between GDX’s birth in May 2006 and August 2008 before gold stocks were ravaged in the first stock panic in a century, the GGR averaged 0.583x. From 2009 to 2012, the normal post-panic period before extreme Fed QE distortions started gutting gold, the GGR’s mean was 0.381x. Recent years’ low levels are an anomaly.
The gold miners’ stocks still have vast lost ground to regain relative to gold. That will gradually come as long as this gold bull continues powering higher on balance in the years ahead. The GGR needs to mean revert dramatically higher, arguing for better-than-normal gold-stock upside whenever gold rallies. That includes in its seasonal winter rally this year. New-high psychology could spawn outsized gold-stock buying.
Regardless of how it plays out over these next 4 months, gold and its miners’ stocks are now entering their seasonally-strongest span of the year. So once gold’s own indicators including speculators’ gold-futures positioning and gold’s overboughtness levels give the green light, traders should aggressively add fundamentally-superior gold and silver miners. Their stock prices are likely to rally strongly by late February.
The key to riding any gold-stock bull to multiplying your fortune is staying informed, both about broader markets and individual stocks. That’s long been our specialty at Zeal. My decades of experience both intensely studying the markets and actively trading them as a contrarian is priceless and impossible to replicate. I share my vast experience, knowledge, wisdom, and ongoing research through our popular newsletters.
Published weekly and monthly, they explain what’s going on in the markets, why, and how to trade them with specific stocks. They are a great way to stay abreast, easy to read and affordable. Walking the contrarian walk is very profitable. As of Q3, we’ve recommended and realized 1142 newsletter stock trades since 2001. Their average annualized realized gains including all losers is +18.6%! That’s more than double the long-term stock-market average. Subscribe today and take advantage of our 20%-off sale!
The bottom line is gold stocks are just entering their seasonally-strongest period of the year. Their big winter rally is fueled by gold’s own, which is driven first by outsized demand from holiday jewelry buying and later new-year investment buying. So both the metal and its miners’ stocks have strong tendencies to rally between late October to late February in bull-market years. It’s the best calendar span to own gold stocks!
This year’s dawning winter rally has great upside potential despite the big recent surges in gold and its miners’ stocks. Gold’s decisive bull-market breakout left traders way more excited about this sector than they’ve been in years. The resulting bullish new-high psychology should feed on itself leading to growing capital inflows. Gold stocks still have a long way up to go to normalize relative to higher prevailing gold prices.
If you would like to receive our free newsletter via email, simply enter your email address below & click subscribe.
 Follow us on Twitter
 Become our facebook fan
CONNECT WITH US
Tweets
Tweet with hash tag #miningfeeds or @miningfeeds and your tweets will be displayed across this site.
MOST ACTIVE MINING STOCKS
Daily Gainers
 CMC Metals Ltd. CMC Metals Ltd. |
CMB.V | +900.00% |
 Eden Energy Ltd Eden Energy Ltd |
EDE.AX | +200.00% |
| GoviEx Uranium Inc. |
GXU.V | +42.86% |
| Eagle Nickel Ltd. |
ENL.AX | +41.67% |
| Citigold Corp. Limited |
CTO.AX | +33.33% |
| Mount Burgess Mining NL |
MTB.AX | +33.33% |
| Exalt Resources Limited |
ERD.AX | +31.94% |
| Casa Minerals Inc. |
CASA.V | +30.00% |
| Cariboo Rose Resources Ltd |
CRB.V | +28.57% |
| Belmont Resources Inc. |
BEA.V | +28.57% |


