
- The amount of debt in both China and the United States is horrifying and it continues to grow.
- Debt growth is worshipped by millions of people who think it is a cure rather than a disease.
- Please click here now. Until the trade war began, the Chinese government was pressuring the country’s private sector to reduce debt.
- The government did stimulate modestly when Trump threw his “tariff tax tantrum”, but rating services like Moody’s and Fitch are concerned about the potential for defaults that could drag the global economy down into a crisis.
- In 2019, corporate bond defaults in China have surged to almost ten times 2014 levels!
- The bottom line: There’s a price to pay when a country, company, or person embraces a debt mentality and then “gets real” and attempts to deleverage.
- The good news is that the Chinese government has at least acknowledged the dangers of debt worship. ln the United States, that hasn’t happened… and it won’t happen unless there is a disaster.
- The US government promotes extreme debt as marvellous. Trump calls an economy that can’t even hold the 2% GDP growth marker without QE and near-negative rates… “the mightiest of all time”. This is 100% propaganda.
- The US government wants even lower rates and even more QE, so it can go even deeper in debt, and companies can do more debt-oriented stock buybacks to keep the stock market “poster boy” looking good.
- QE and artificially low rates in a high debt environment create full unemployment, but minimal GDP and wage growth.
- Essentially, the citizens become dreary rats on a treadmill while the government tells them they are winning the gold medal in the Olympics.
- Not surprisingly, banks do well. That’s because even though mortgage rates are near zero, houses are ridiculously expensive, so the total mortgage payments to the banks are decent.
- What’s the difference between a 2% mortgage on a million-dollar home today and a 6% mortgage on a $50,000 home of the past? The answer for today is: More profits for the banks and more debt for the homeowner!
- Elderly savers are also victims of global government and corporate debt worship. Their savings account income has been wiped out by government and central bank obsession with QE and negative rates. They get to wave “The government is makin’ me great!” flags in the air, but when all the flag waving is done, the have no income to put food on their table.
- The democrats aren’t any more interested in higher rates or QT than the republicans. The democrat plan of action is also for more debt and more spending, but it includes more taxes too. This can’t end well… or can it?
- Please click here now. Double-click to enlarge. It ends well… for gold!
- In the short term, a small drifting rectangle within a large bull wedge is stopping the next leg of the rally from getting underway.
- I predicted gold would bottom in Mid-November and it did, but the next rally won’t officially begin until gold trades above the supply lines of both the rectangle and the bull wedge.
- A daily close of $1495 on this February gold contract chart would do that.
- Please click here now. Double-click to enlarge. Silver stocks are the best performers of the entire precious metals sector right now and they bottomed back in mid-October.
- Note the fabulous technical action around the Keltner lines. These lines act like banks on a river.
- A market is defined as strong when rallies burst above the Keltner supply line and reactions either don’t penetrate the demand line or they end near the dotted middle line.
- That’s the case with the SIL ETF now, and many individual miners look even better! Given that silver bullion has been swooning, the price action of silver miners is outrageously bullish.
- The next rally in bullion (which now seems imminent) should create incredible upside price action for most of the precious metals miners!
The gold miners’ stocks have largely been consolidating high following last summer’s powerful upleg. That resilience has left sentiment relatively bullish, with traders mostly expecting this sector to soon start surging again. But the jury is still out on whether gold stocks will be lucky enough to evade a bigger correction. Major downside risks still abound, primarily in gold which dominates gold-stock price trends.
The reversal in gold-stock fortunes this year has been radical. This is readily evident in their leading benchmark, the GDX VanEck Vectors Gold Miners ETF. Comprised of the world’s largest gold miners, GDX is this sector’s most-popular trading vehicle. The gold miners weren’t faring well for most of the first half of 2019, with GDX down 4.4% year-to-date in early May. Traders wanted nothing to do with gold stocks.
That sector slump reflected a lack of enthusiasm for gold, which was down 0.9% YTD. The gold stocks are effectively leveraged plays on gold, as their earnings really amplify changes in prevailing gold levels. But as May ended, some surprising news started sparking life back into the moribund gold realm. Trump threatened to impose big tariffs on Mexico until it stopped illegal immigration across the US southern border.
While he later stood down, it was unprecedented to use tariffs as a hardline negotiating tactic for non-trade issues. So gold caught a nervous safe-haven bid. Over the next several weeks it rallied 5.5%, which GDX amplified by 2.8x with a 15.6% surge in that span. That tracked perfectly with the major gold stocks’ normal leverage to material gold moves of 2x to 3x, which leads to outsized gains in gold uplegs.
By mid-June, gold was flirting with its first breakout to new bull-market highs in 3.0 years. Then top Fed officials collectively shifted their future rate outlook from hiking to cutting, killing a years-old tightening cycle. That big dovish shift hammered the US dollar igniting huge gold-futures buying, which catapulted gold to that long-awaited bull breakout. Traders flocked back to gold stocks to ride their metal’s surge higher.
That strong upside momentum built on itself, with buying begetting buying as speculators and investors alike love chasing winners. By early September, gold had blasted another 14.3% higher in 2.5 months! That fueled a strong 29.0% GDX surge in that short span, making for 2.0x upside leverage to gold. But such fast gains left the metal and its miners’ stocks really overbought, far above their 200-day moving averages.
I warned about that just days earlier in our monthly newsletter. “Gold is overextended, due for a healthy bull-market correction over the near-term. Its technicals are way too overbought, and its sentiment way too greedy. Too many buyers have flooded in too quickly, exhausting gold’s near-term upside potential. My best guess is a 6%-to-12% gold selloff, which the major gold stocks will leverage like usual by 2x to 3x.”
Bull markets are alternating series of uplegs and corrections, climbing two steps higher before falling one step back. Corrections are necessary to keep bulls healthy, rebalancing sentiment after preceding uplegs. Greed, enthusiasm, and even euphoria grow too extreme after major uplegs. Those need to be bled away and largely reversed to fear, apathy, and despair before the next upleg can start powering higher.
Gold’s bull-breakout surge capped a larger 32.4% upleg that unfolded over 12.6 months, the biggest of its 4.0-year-old secular bull so far. That pushed gold to a mighty 6.4-year secular high! And GDX’s strong parallel rally climaxed a major 76.2% upleg that ran over 11.8 months. This leading sector ETF peaked at its own 3.1-year high. So both the metal and its miners’ stocks were certainly due for breathers after such runs.
Indeed that’s exactly what happened since, as this GDX gold-stock-bull chart reveals. Gold stocks have drifted lower on balance since early September, largely consolidating high. The all-important question today is whether they can keep grinding sideways until gold’s next major upleg gets underway, or if they still have considerable downside left. While most traders assume the former, the risks of the latter remain high.
Consolidations and corrections exist on the same sentiment-rebalancing continuum, both bleeding away excessive greed common after major interim highs. The speed that greed is nullified is dependent on both how far prices fall and how long that takes. Since consolidations are much shallower, they have to last much longer to normalize gold-stock psychology. Deeper corrections are more painful, doing that faster.
Since mid-September soon after these gold and gold-stock corrections started, for the most part GDX has meandered in a trading range between $26 to $28. That is relatively strong compared to gold, which is why so much residual greed remains in this sector. Traders rightfully view that gold-stock resilience as a sign of strength. But early high consolidations can still fail, rolling over into larger corrections later.
Characteristics of the latter are already evident in recent months’ gold-stock action, with major miners carving a series of lower highs. That’s compressing GDX between two key resistance lines, the newer sharply-downward-sloping correction one and the older upward-sloping bull-market-upleg one. This will soon force a technical breakout one way or the other, extending or killing this recent high consolidation.
While GDX also initially saw some lower lows in this correction, they have flatlined over the past couple months. GDX sunk to $26.19 in mid-October, and challenged that two more times hitting $26.23 on close in early November and $26.20 in late November. But technically the worst of this gold-stock correction is still current to mid-October, down 15.4% over 1.3 months. Interestingly that’s reasonable relative to gold.
The yellow metal’s own correction has retreated 6.4% at worst so far as of late November, which means GDX is showing normal 2.4x downside leverage. That’s right in the middle of that historical 2x-to-3x range. If gold doesn’t fall any farther, the gold stocks should be able to continue consolidating high. But if gold’s own correction isn’t over, further selling could drag the gold stocks considerably lower in coming months.
Before we get to gold, GDX’s correction so far is very mild and brief according to its own historical standards. Today’s correction is actually this secular gold stock bull’s third. The first clocked in at 39.4% over 4.4 months in largely the second half of 2016, utterly brutal. The second took way longer, but ended at a similar serious 31.3% loss accruing over 19.1 months. Together they averaged 35.4% over 11.8 months.
The precedent for big gold-stock corrections runs way farther back though. Gold stocks’ last secular bull straddling the birth of GDX ran for 10.8 years between November 2000 to September 2011. The older HUI NYSE Arca Gold BUGs index sector benchmark skyrocketed 1664.4% higher in that span! Those gains came across a dozen major uplegs, which were naturally followed by an equal dozen major corrections.
Even excluding 2008’s first-in-a-century stock panic which was an anomalously-extreme one, the other 11 averaged 26.1% HUI losses over 2.8 months. So the current gold stock correction’s 15.4% in 1.3 months is exceedingly small and short by sector standards. This small contrarian sector has a reputation for being wildly volatile for a reason. A mere 15% correction after a massive 76% upleg would certainly be a first.
If you look at all 14 previous corrections in these latest couple secular gold-stock bulls, every single one of them also had another telltale characteristic. They all at least fell back to, and usually considerably under, the major gold stocks’ 200-day moving averages per the HUI and GDX. That technical baseline is key support within ongoing bull markets. GDX plunged far below its 200dma in this bull’s first two corrections.
One way to quantify GDX’s level relative to its 200dma is by dividing this ETF’s daily closes by that moving average. That forms a construct I call the relative GDX, or rGDX. When this bull’s first correction bottomed in mid-December 2016, GDX was trading at just 0.767x its 200dma. At its second correction’s nadir hit in mid-September 2018, the rGDX fell to 0.801x. GDX plunged over 20%+ under its 200dma on average!
Yet at worst so far in today’s third bull-market correction, GDX has merely slumped to 1.047x its 200dma. 5% above that baseline hardly seems correction-bottoming-worthy, and if that held it would mark another first in modern gold-stock history. This gold-stock selloff seems way too shallow and short-lived relative to what this sector has done in the past. That makes me wary after long decades trading gold stocks.
Gold stocks’ resilience in the last couple months resulted from residual greed, because they haven’t sold off deep enough or long enough yet to rebalance sentiment. That has really skewed another excellent indicator that flags major correction bottomings. That’s the ratio between the gold stocks and the price of gold which drives them. It is usually expressed as the HUI/Gold Ratio, because of that index’s long history.
Since the major gold stocks amplify gold’s swings by 2x to 3x, the HGR normally crests right as major gold uplegs are peaking. Back on September 4th as gold, the HUI, and GDX all hit their latest interim highs capping their last uplegs, the HGR ran 0.152x. As gold stocks’ leverage is a double-edged sword, it works to the downside too. So gold stocks look the worst relative to gold when gold corrections bottom.
That manifests itself in low HGR reads. Yet at gold’s most-recent correction low in late November, the HGR was only 0.143x. That was much higher than the HGR’s low ebb during this correction of 0.134x in mid-October. And the gold stocks have well outperformed gold since, with the HGR regaining its gold-upleg-peak levels of 0.152x twice so far in December! That’s incredibly-unusual behavior for gold stocks.
Since mid-October, gold-stock traders have been betting gold’s correction is largely over. Yet they were wrong, as gold slumped to new correction lows in early and late November. At some point this greed-fueled disconnect has to be resolved. Either gold needs to rally and decisively break out of its correction downtrend, or the gold stocks need to fall to reestablish normal downside leverage. Something has to give.
The ultimate arbiter of what’s coming for gold stocks is what happens with gold. If gold’s own correction has bottomed, the gold stocks will likely get away with consolidating high and not seeing major new lows before their next upleg. But unfortunately it looks like gold’s correction isn’t over yet, which I explained in depth in last week’s essay. Gold-stock speculators and investors really need to pay attention to gold’s situation.
Without rehashing everything, gold is the dominant primary driver of gold-stock fortunes. And how gold-futures speculators are collectively trading is the dominant primary driver of gold. They wield outsized influence on gold price levels due to the extreme leverage inherent in gold-futures trading, and the fact that the resulting gold-futures price is gold’s world reference one. Specs’ current gold-futures bets are ominous.
This updated chart superimposes gold over specs’ total long contracts in green and total shorts in red. Gold corrections within secular bulls are driven by spec selling, both dumping longs and adding shorts. But so far in gold’s current correction, they haven’t done much of either yet! Thus these gold-dominating traders have vast room to sell but little room to buy, implying gold’s own near-term downside risks remain high.
This gold bull’s first couple corrections following major uplegs were driven by speculator selling. Gold fell with spec long contracts and new shorting, or falling green and rising red lines. Incidentally this essential normalization of specs’ aggregate gold-futures bets fueled far-bigger gold corrections, 17.3% over 5.3 months and 13.6% over 6.7 months. That averaged 15.5% in 6.0 months, far bigger than today’s correction.
Remember gold has merely retreated 6.4% over 2.8 months at worst so far. That is almost certain to grow considerably as gold-futures speculators sell down their super-high longs and ramp their super-low shorts. Both need to mean revert back much closer to normal levels. In this latest week of reporting for spec positioning, their total longs and shorts were running 85% and 1% up into their gold-bull trading ranges.
That’s perilously close to the most-bearish-possible-for-gold 100% longs and 0% shorts, which signals buying exhaustion leaving nothing but potential selling. If total spec longs’ and shorts’ gold-bull trading ranges are considered, these traders now have room to sell 392.8k contracts on both sides of the trade. That is a staggering 10.1x larger than their room to buy of 38.9k! Gold still faces massive potential selling.
The specific catalyst doesn’t matter, one always arises eventually when spec gold-futures positioning hits extremes. Vast selling has to occur before gold is out of the woods in this correction. Total spec longs are way up in their 98th percentile of all weeks since early 1999, while total spec shorts are just 2.1% over their recent gold-bull-to-date lows. Big gold-futures selling is inevitable to normalize these extreme bets!
And mark my words, when gold is pummeled to new correction lows on heavy gold-futures selling the gold stocks will amplify those losses. Again the major gold stocks’ historical leverage to gold is 2x to 3x. So if the total gold correction extends to a still-modest 10%, GDX should be down 20% to 30% from its early-September peak. That works out to GDX $24.76 to $21.67, another 11% to 22% lower from this week!
And the potential near-term gold-stock downside could be even worse. Gold just enjoyed its biggest upleg of this bull, and corrections tend to be proportional. So another 15% gold correction, actually just in line with this bull’s average, certainly isn’t out of the question. If gold’s total selloff extends to 15% again, the major gold stocks will drop 30% to 45% in total. That would hammer GDX down to $21.67 to $17.02!
That’s a soul-crushing 22% to 39% below this week’s levels. While I doubt gold or the gold stocks will drop that far, their near-term downside risks remain considerable. It just seems prudent to be wary here until gold-futures speculators’ positions normalize. Until they do, gold and thus the gold stocks face way-larger-than-normal selloff potential. These corrections won’t decisively bottom until that largely passes.
The core mission of trading is multiplying wealth by buying low then later selling high. Practically that means aggressively adding gold stocks late in corrections, and then ratcheting up stop losses to harvest those big gains late in uplegs. Today the odds certainly don’t favor one of those major buy-low points being upon us. Neither the gold nor gold-stock corrections look mature yet, indicators aren’t signaling bottomings.
To multiply your capital in the markets, you have to trade like a contrarian. That means buying low when few others are willing, so you can later sell high when few others can. In the first half of 2019 well before gold stocks soared higher, we recommended buying many fundamentally-superior gold and silver miners in our popular weekly and monthly newsletters. We later realized big gains including 109.7%, 105.8%, and 103.0%!
To profitably trade high-potential gold stocks, you need to stay informed about what’s driving broader gold cycles. Our newsletters are a great way, easy to read and affordable. They draw on my vast experience, knowledge, wisdom, and ongoing research to explain what’s going on in the markets, why, and how to trade them with specific stocks. Subscribe today and take advantage of our 20%-off sale! Get onboard now so you can mirror our coming trades for gold’s next upleg after this correction largely passes.
The bottom line is this gold-stock correction still looks young. This sector’s selloff so far has been both shallow and short, way milder than historical precedent. These minor losses have failed to rebalance sentiment, leaving lots of residual greed. That still has to be eradicated, which is the reason bull-market corrections exist in the first place. The major correction-bottoming indicators all imply more downside coming.
Ultimately gold stocks are going to follow gold like usual, amplifying its big moves. Gold’s own correction hasn’t run its course either. Speculators’ gold-futures bets remain excessively bullish, leaving room for massive selling to normalize those positions. That will likely force gold and thus its miners’ stocks considerably lower. The resulting real correction bottomings will be the major buying op before gold’s next bull upleg.
Vancouver-based, Solaris Resources Inc., announced the appointment of former star research analyst, Daniel Earle, as President and CEO on November 7, 2019. The company is reportedly advancing a portfolio of exploration projects in the Americas.
Mr. Earle has more than 17 years of experience in the mining industry and capital markets, but rose to prominence as a Bay Street analyst known for making prophetic calls on exploration and development projects that came ahead of or against consensus opinion.
During his time on the Street, he recommended a long string of companies that went on to be acquired by larger companies, including Aquiline, Comaplex, Andean, Ventana Gold, Extorre, Augusta, Osisko, Lake Shore Gold, Exeter, NewCastle, Richmont Mines, Arizona Mining, Detour Gold and Continental Gold, as well as predicting some notable shortfalls and failures.
“I’m excited to begin this new phase of my career,” Earle commented. “I’m honored to have the opportunity to lead a company that I think will quickly establish itself as the “go to” name in copper/gold exploration. I expect to rapidly grow our high-grade Warintza discovery in Ecuador once we start drilling, as well as, a pipeline of other grassroots exploration projects that were selected by our founder, David Lowell.
David Lowell is arguably the most successful exploration geologist of all time. He invented the Porphyry Copper Model itself and then made over a dozen major copper and gold discoveries spanning a 50-year career, including our Warintza Project in Ecuador and, what is by far the world’s largest copper mine, La Escondida, which accounts for approximately 5% of the world’s copper supply and is worth a reputed $30 billion on its own.
Other discoveries he is famous for include Kalamazoo, Vekol Hills, Bajo Alumbrera, which he played a significant role in, the JA Deposit, Casa Grande West, Lepanto Far Southeast, Zaldivar, San Cristobal, Maria Rosa, Leonor, Los Calatos, Pierina, and the Mirador mine, which is to the south of our Warintza Project and was put into commercial production earlier this year.”
In November, Solaris also appointed Jacqueline Wagenaar as Vice President of Investor Relations. An award-winning investor relations executive, Wagenaar brings extensive capital markets experience with publicly traded companies, most recently leading investor relations at a gold mining company for the last 10 years.
Solaris Resources
Solaris Resources is a publicly reporting company that is considering a potential stock exchange listing in 2020. The company was spun out of Equinox Gold Corp., which is a multi-mine producer that aspires to reach the lofty goal of one million ounces of annual gold production that would place it among the senior gold producers. The founder, and Hall of Fame mining entrepreneur, Ross Beaty, has mused that he expects its 32% ownership stake in Solaris to eventually offset the debt his company has accumulated acquiring and building three mines.
Other notable large investors in Solaris include Richard Warke – famous for the sale of its monstrous Taylor Project via Arizona Mining for $2.1 billion last year, Augusta Resource for $667 million in 2014 and Ventana Gold for $1.5 billion in 2011 – and Swedish mining tycoon, Lukas Lundin, of Lundin Gold, Lundin Mining, Lundin Petroleum, and so on.
In November, Solaris Resources closed a C$5.6 million non-brokered private placement financing, issuing 14,121,000 units at a price of $0.40 per units. Each unit consisted of one common share of the company and one-half of a common share purchase warrant of the company, with each warrant entitling holders to acquire one common share at a price of $0.60 per share for a period of three years.
Although Solaris Resources’ shares are not currently listed on a designed stock exchange, the company is recognized as a “public corporation” by Canada Revenue Agency and is a “reporting issuer” under Canadian securities legislation. and continues to comply with its continuous disclosure obligations including issuing press releases and financial reports.
 All the signs are pointing in favour of a slow and steady uptick in the price of gold. Consolidation in the gold price has been taking place since November, after a multi-month period of price gains in August and September. Heading into mid-December, the price of gold is hovering around the $1,470 mark, with a 6-month performance (USD) of 10.20%, or $136.40. Over the past 1 year, gold has advanced by 19.05%, or $235.90 per ounce.
As the world’s favourite safe-haven commodity, gold tends to shine when uncertainty hits the markets. The stellar performance of the yellow metal is surprising, given the strong returns being generated on the Dow Jones Industrial Average, NASDAQ composite index, S&P 500 index, and the Russell 2000. Consider the exchange traded fund, SPDR Dow Jones Industrial Average ETF Trust has a year-to-date trailing return of 22.82% – a phenomenal year for stocks once again.
 Yet, gold has held its own amid a firestorm of frenzied activity on US stock markets. It is particularly notable therefore that the London Bullion Market Association (LBMA) reported on Monday, 2 December that the August holdings of gold in London’s vault amounted to 8,028 metric tonnes, at a value of $394.5 billion. This is the highest level ever, corresponding with the record-high price achieved by gold bullion in August 2019 when it was trading over $1,550.
While the gold price has tapered off marginally since then, it is still bullish. Equally significant is the August value of silver held in London’s vaults at $21.1 billion, with 35,636 metric tons of the precious metal. The LBMA wrote that all of this volume translated into 1,187,881 bars of silver and 642,277 bars of gold. The precious metals are overseen by 7 custodians, including the Bank of England (BOE) as well as board members of the LBMA.
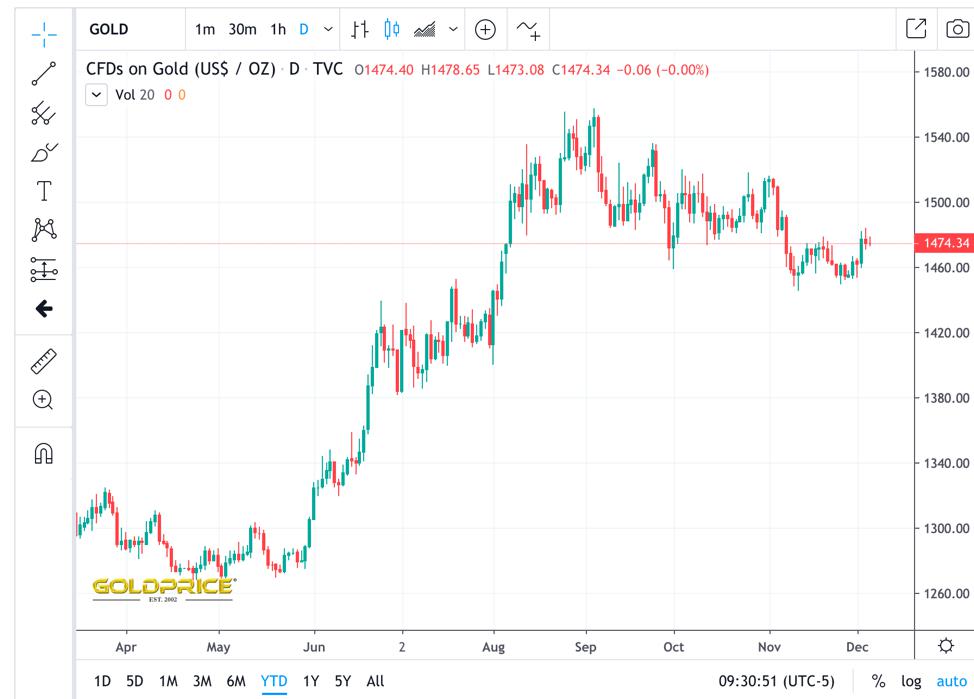
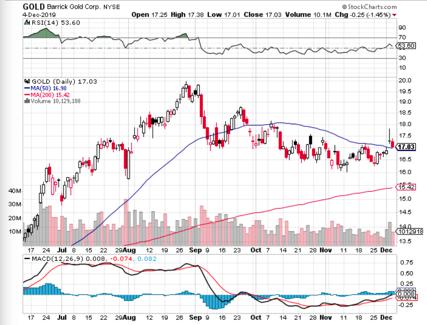
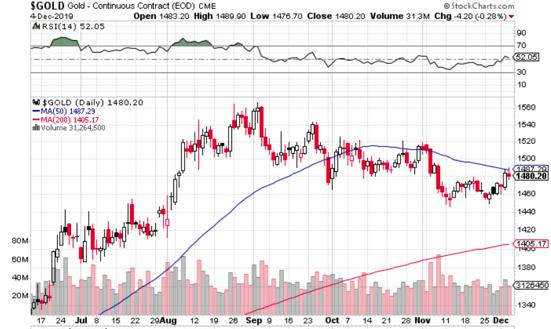
Charts for gold stocks at Barrick Gold Corporation are clearly reflective of these strongly bullish trends, with stock prices rising in June, July, August and September, and then consolidating from October to the present. Equally important are continuous contracts for gold which remain bullish, despite a slight tapering of expectations heading into the final stretch of 2019. As can be seen from the aforementioned charts, the price of gold has risen well above its 200-day moving average, and is converging towards the 50-day moving average price which was boosted by its August performance.
Gold is one of the most traded commodities in the world, particularly at a time when tensions between the US and China vis-a-vis trade wars are brewing, North Korea is posturing, and the USD is fluctuating. When we add in Bollinger Bands (an excellent technical indicator for determining price movements) it is clear that a constriction has taken place around the prevailing gold price, and gold is now priced near the upper band of the Bollinger Bands ($1487.69 for gold continuous contract EOD – CME), but not yet above it. If the price of gold rises above the upper band, this indicates that it is overbought and a correction to the downside will follow.
It is worth noting that the gold price performance percentage annual change in 2019 is the best it has been since the end of 2010. In the years immediately following the global financial crisis, gold enjoyed stellar performance of 23.4% gains in 2009, 29.5% gains in 2010, and just 10.1% gains in 2011. In the following years (2012 – 2018) the performance of gold has been lacklustre, largely due to a roaring stock market. The current year’s performance of 15.3% is notable, and likely to hold until 2019 closes out.
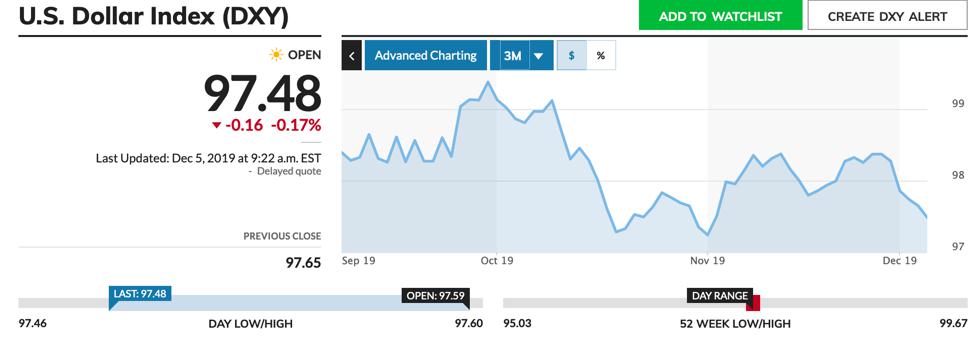
The LBMA was bullish for August, but by the time October rolled around, gold values declined by 15.7% over September, with an average settlement amount of 5,087 ounces for each transfer. In October for example, the London Bullion Market Association (LBMA) reported that there were 1,113 daily transfers, down 33.9% over September. US dollar strength is also an important factor as gold is a dollar-denominated asset. When the USD is strong, foreign buyers of gold have to spend more per unit of their currency for gold. This weakens demand. The DXY indicates a slight weakening of the USD (-0.94% over 3 months), which is helping the gold price to rally.
- While some analysts are getting a bit negative in their outlook for gold, the physical market is getting stronger and that’s very good news for investors.
- Please click here now. I predicted that Indian jewellers would step into the market in the $1465 area, and that has obviously occurred.
- Given the onerous import duty, November demand in the official market was outstanding. Black (free) market demand was also likely very strong.
- Please click here now. Double-click to enlarge. There’s a beautiful double bottom pattern in play on this short-term gold chart.
- Investor sentiment collapsed on the second low and that’s “textbook” action for this type of bullish pattern.
- Please click here now. Double-click to enlarge. Bond market charts look very similar to gold market charts right now.
- A move above 160 on the T-bond chart would add some serious “mojo” to gold, and I’m predicting that it happens soon.
- In the late 1920s, Herb “I’m a Tariff Tax Man” Hoover’s tariff tax tantrum resulted in the election of Roosevelt (FDR), who was a vile gold hater and socialist. After confiscating their gold, FDR happily sent 400,000 soldiers to die in various wars.
- Donald Trump is gambling that his tariff tax tantrum won’t result in the 2020 election of another crazed socialist, like Warren, Sanders, or Ocasio, but I wonder if he’s aware of the potentially dire consequences of his actions.
- It’s a huge gamble to take. His tax cuts produced surging GDP and surging global stock markets. More tax cuts were a “no-brainer”, but instead he’s risking it all with these tariff taxes. From a risk versus reward perspective, there’s very little potential reward and enormous risk.
- Please click here now. Double-click to enlarge this ominous dollar versus yen chart.
- FOREX traders are obviously concerned about the possibility that the US government’s endless waves of GDP-destructive tariff taxes result in the election of an unstable socialist government.
- While gold forms a double bottom and Indian dealers buy aggressively, the dollar has formed a double top within a very bearish wedge pattern.
- A breakdown from the top pattern would likely be accompanied by a crashing stock market and soaring gold, soaring silver, and soaring gold stocks!
- Please click here now. Double-click to enlarge. Many individual miners are currently roaring to fresh highs for the year, and this GDX Advance-Decline chart showcases the action.
- Please click here now. Double-click to enlarge this superb short-term GDX chart.
- I’m predicting an imminent upside breakout from the double-bottom pattern, and it could happen today!
- With India back on the buy and US manufacturing in recession, the stock market is on very shaky ground.
- The Fed is pumping out “QE that is not QE”, and Trump may need to ramp up government spending and debt to counter the negative effects of his tariff taxes, if he wants to get re-elected.
- Monday’s COT report shows the commercial traders reducing short positions significantly, which I expected given the obvious surge in Indian demand.
- All my proprietary weekly chart signals are now in buy mode for gold and for the GDX/GOAU ETFs. Short-term traders can use my https://guswinger.com signals to take NUGT and DUST signals… to ride the gravy train on the next big run for gold!
- History rhymes more than it repeats, and I suggested that gold’s reaction was more likely to bottom in mid-November than December this year.
- The exact low for gold was November 12.
- Seasonality and charts are created by liquidity flows in the physical market and on the COMEX. The bottom line for gold: Good times are here, and great times are near!
If you would like to receive our free newsletter via email, simply enter your email address below & click subscribe.
 Follow us on Twitter
 Become our facebook fan
CONNECT WITH US
Tweets
Tweet with hash tag #miningfeeds or @miningfeeds and your tweets will be displayed across this site.
MOST ACTIVE MINING STOCKS
Daily Gainers
 CMC Metals Ltd. CMC Metals Ltd. |
CMB.V | +900.00% |
 Eden Energy Ltd Eden Energy Ltd |
EDE.AX | +200.00% |
| GoviEx Uranium Inc. |
GXU.V | +42.86% |
| Eagle Nickel Ltd. |
ENL.AX | +41.67% |
| Citigold Corp. Limited |
CTO.AX | +33.33% |
| Mount Burgess Mining NL |
MTB.AX | +33.33% |
| Exalt Resources Limited |
ERD.AX | +31.94% |
| Casa Minerals Inc. |
CASA.V | +30.00% |
| Cariboo Rose Resources Ltd |
CRB.V | +28.57% |
| Belmont Resources Inc. |
BEA.V | +28.57% |


