
At the time of writing, Gold is up for the second week in a row, trading around the $1,745 level, which has acted as an important resistance level since mid-April. Rebounding Covid-19 infection rates and recent mitigated macroeconomic figures have sent the markets into risk-averse mode, which have sent Gold’s price higher.
Most investors are now wondering if Gold will have enough bullish momentum to continue rising and break above $1,745 towards the $1,800 level, which it hasn’t reached since September 2012.
When you buy gold, it’s always good to understand what factors influence the price. One of the most important things to remember about Gold is that it acts as a ‘safe-haven’ asset in times of economic uncertainty and higher market volatility. In addition, Gold is often considered to be an inflationary hedge.
Let’s see how today’s macroeconomic situation might help push Gold’s price even higher.Investors might keep rushing into Gold due to coronavirus disruption and global growth uncertainty
While many parts of the world, such as the US and Europe, are reopening their economies, there are increasing worries that the coronavirus might be making a resurgence, impacting global market sentiment. Some multinationals have decided to close their shops once more, after having just reopened them.
For example – Apple, faced with these rising risks, decided last Friday to re-close some of its shops in US states where there has been a resurgence of Covid-19 cases. The company shut 11 stores in Florida, North Carolina, South Carolina, and Arizona, declared CNBC.
“Due to current Covid-19 conditions in some of the communities we serve, we are temporarily closing stores in these areas. We take this step with an abundance of caution as we closely monitor the situation and we look forward to having our teams and customers back as soon as possible,” explains the company.
During these uncertain times, investors adopt a more conservative investment approach, investing in safer assets like Gold, which can better protect their investments against market volatility, and potential risks linked to the trajectory of inflation, which is on the rise due to heavy monetary stimulus packages implemented by various governments.
Continued monetary and fiscal support from the Fed and the US Congress will impact the value of the USD
As Gold is often considered to be an inflation hedge, this means that it is seen as a protection tool against the purchasing power risk. The value of Gold increases when the purchasing power of the American dollar declines, which is what happens when the Fed and the US Congress implement stimulus programs that produce more money – the more US dollars that are circulating throughout the economy, the less the value that each of these dollars holds.
Inflation measures the rise of the general price level of goods and services in a country. When inflation increases, the purchasing power of every dollar you own (or any other fiat currency) decreases accordingly. As Gold cannot be printed like banknotes, it retains its value, acting as a store of value that everyone has confidence in. Hence why it’s seen as a ‘safe-haven’ asset that investors flock to in times of uncertainty. Goldman Sachs raised its 12-month forecast on Gold to $2,000 an ounce
The popular American multinational investment bank, Goldman Sachs, raised its Gold price estimates:
- Its 3-month Gold price went from $1,600 per ounce to $1,800 per ounce ;
- Its 6-month Gold price forecast went from $1,650 to $1,900 ;
- Its 12-month Gold price estimates from $1,800 to $2,000.
“Gold investment demand tends to grow into the early stage of the economic recovery, driven by continued debasement concerns and lower real rates. […] Simultaneously, we see a material comeback from consumer demand by emerging markets boosted by easing of lockdowns and a weaker dollar,” analysts at Goldman Sachs wrote in a note.
Many factors impact the price of Gold. Among the most important are monetary and fiscal policies (and their impact on inflation), the fluctuation of the USD, as well as the level of demand for Gold throughout the world.
As Gold is considered a safe-haven asset, it is highly probable that its price will keep rising within this uncertain environment surrounding the coronavirus, as there are still many concerns regarding the duration of the pandemic, the short and long term economic costs, and the lengths various governments will have to go to in order to keep their respective economies afloat.
If the price of Gold follows the Goldman Sachs forecasts, it should soon break above the $1,745 level. Gold could therefore still provide great investment opportunities for those wanting to maximise returns, given the unprecedented monetary stimulus packages implemented throughout the world.
WOW. What a three months it’s been. Things appear to be relatively better now, but I was very worried. At its worst, four major U.S. stock market indexes were down an average of 37.5% from all-time highs set in February. I feared stocks would keep falling and that copper might trade under US$1.50/lb. for a long, long time. Luckily, that scenario did not play out.
I don’t know if we’re out of the woods yet, but copper is up nearly 20% from its March low. Perhaps analysts realizing that long-term demand for EVs has remained intact breathed some life back into Dr. Copper? Look no further than Tesla’s sky-high valuation (US$190 billion) for proof of concept!
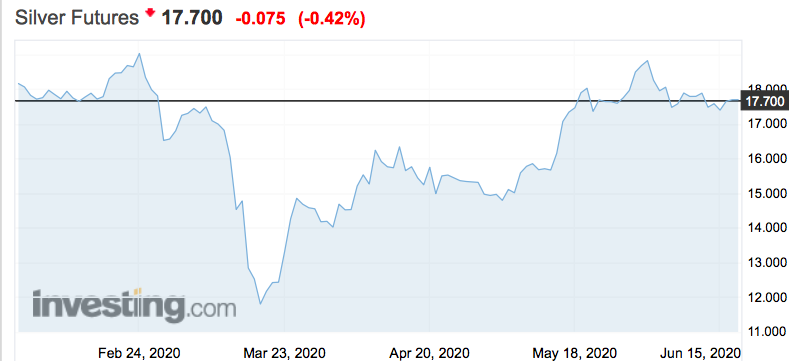
Silver, although trailing behind gold, is up, so no worries there. I never claim to have any keen insights on commodity prices, but this time may be different. So much new debt and money printing, with no end in sight…. So much uncertainty from COVID-19…. Precious metals are in a bull market that could be epic & long-lasting. Silver frequently outperforms gold in bull markets, that means there’s a lot of catching up to do.
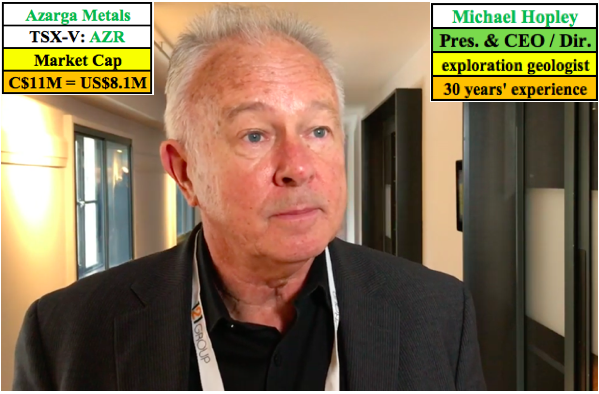
With this in mind, I revisited my favorite Russian copper-silver play Azarga Metals (TSX-V: AZR) by interviewing its President & CEO Michael Hopley. We had a wide-ranging conversation in which a key takeaway is that, A LOT IS HAPPENING at the company!
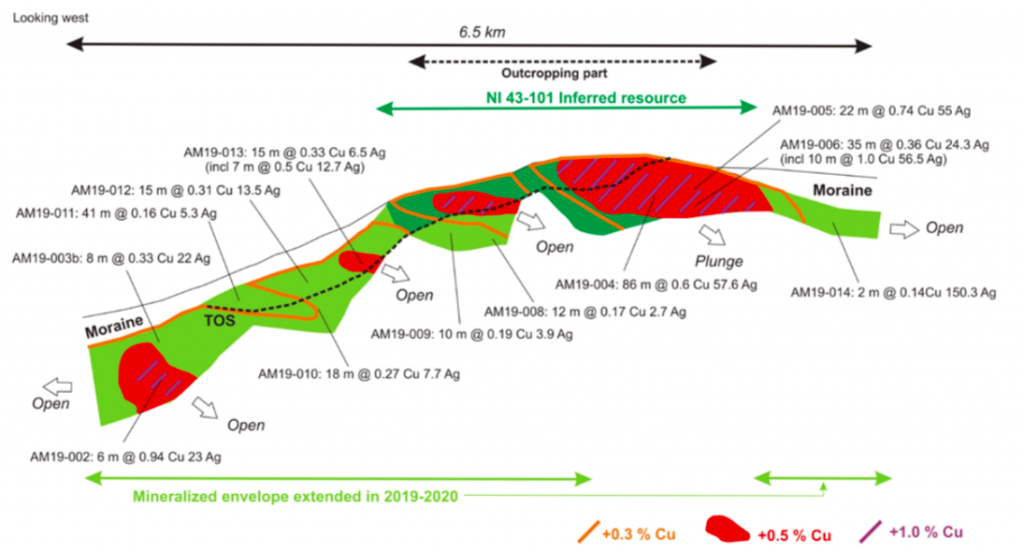
Impressive drill results & favorable metallurgical testing data was released, and a new resource will be out in a few weeks. If the resource estimate is strong, management might commission an optimized PEA. Mr. Hopley could not tell me much regarding the parameters, but in a prior press release management stated that its mineralized strike length had increased from 3.4 to 6.5 km (+91%), and that the overall grade has not changed much.
The current resource is 62M tonnes. Given a 91% strike extension, I would not be surprised to see 90M or 100M tonnes, which could result in an Indicated & Inferred resource approaching two billion copper equiv. pounds. Several near-term catalysts could be impactful and the Company is well funded. Please continue reading to learn more about Azarga Metals and its investment thesis.
Michael, please tell us how you landed as CEO of Azarga Metals.
For almost 20 years I’ve been part of management or on the Board of predecessor companies to Azarga Metals. The Company acquired its flagship Unkur property in 2016 and successfully explored it later that year and in 2017-18. However, due to perceived geopolitical risks, and a difficult funding environment, the project has not advanced as rapidly as we would have liked.
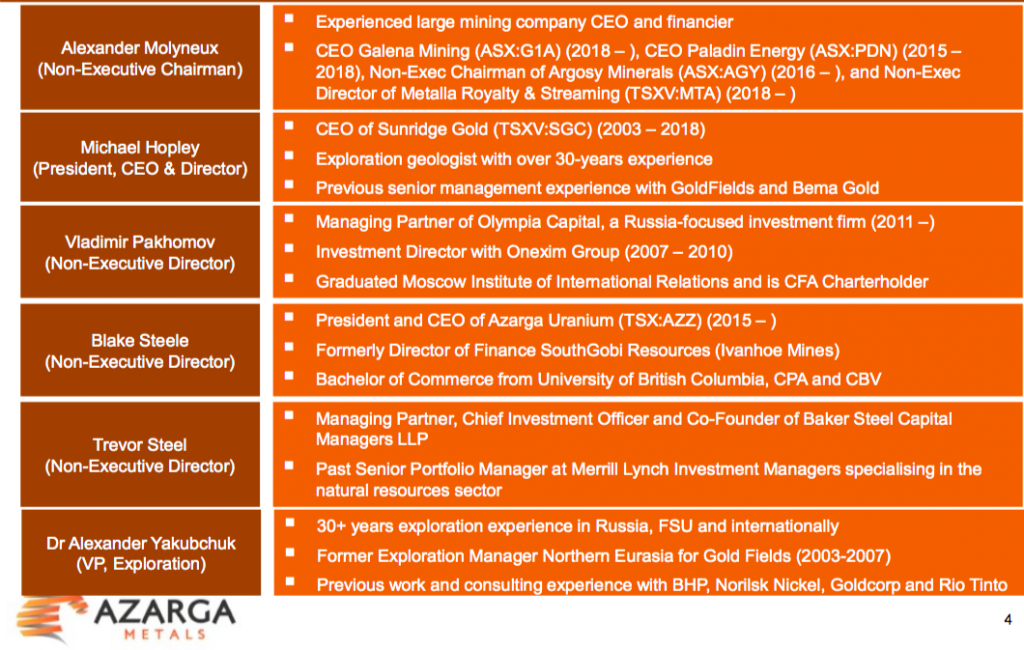
Since 2018, management has turned over, our new team {see team bios above} is very well suited for the specific tasks at hand. When we received a significant financing package from Baker Steel early last year, I was invited to come out of retirement to be President & CEO. As a director it was obvious to me that Unkur had serious potential to be a world-class copper-silver project, so I accepted.
Can you describe in greater detail Azarga’s 100%-owned Unkur Copper-Silver project?
Yes, Unkur is located in eastern Russia (Siberia), ~400 km north of the Chinese border. China is by far the largest consumer of copper & silver. My team believes that Unkur hosts a discovery of global significance, with district-scale potential. It’s ~35 km from the giant Udokan copper project that reportedly contains > 55 billion pounds of copper. The geological setting & possible scale of our project is similar to Udokan. Russian company Baikal Mining is building it and it’s scheduled to start production in 2022.
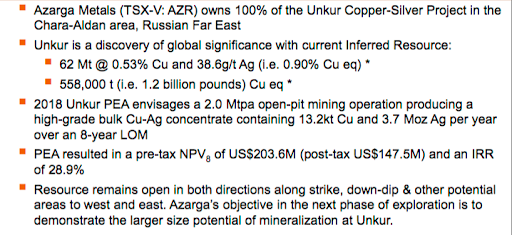
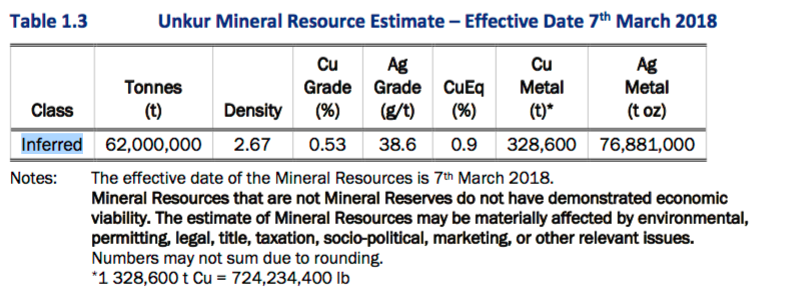
After completion of the first modern exploration in 2016-2018, we reported a NI 43-101 compliant Inferred resource of 62M tonnes @ 0.53% Cu + 38.6g/t Ag, equivalent to 558,000 tonnes (1.2 billion pounds) copper equiv. (“Cu Eq.“) at an attractive grade of 0.90%. That’s ~US$52/t (~C$71/t) in-situ rock… that’s mineralized rock in the ground. The resource remains open in both directions along strike & at depth.
On April 9th, Azarga Metals announced drill results. Two assays stood out. The best had a 22-m interval of 0.74% Cu & 55 g/t Ag. What do these results mean for the Unkur story?
This exciting result was from drill hole AM19-005, an in-fill hole drilled to test a higher-grade area north of our current resource. The intercept extended our high-grade envelope further north and deeper compared to the model we used to estimate our existing resource. Select recent drill results over a 6.5 km strike length {shown below}, are encouraging, especially as the project remains open in both directions along strike, and at depth.
As a frame of reference, the 22-m interval you mentioned equates to ~US$74/t (C$100/t) in-situ value. And, that intercept included a shorter interval of 9 m of 1.34% Cu + 99.4 g/t Ag, an in-situ value of C$181/t. To be clear, those two values are not indicative of the overall deposit. Still, if our metallurgy holds up, C$71/t rock (before recoveries) could be economic under the conditions, the right mine plan.
Speaking of metallurgy, please explain your latest results on that front.
Good question, this is important news. Previous metallurgical tests used only oxidized material from a surface outcrop. These new tests were on both oxidized & sulphide material taken from deeper parts of the Unkur deposit. Recoveries were up to 92% Cu and up to 88% Ag in our sulphide material, using conventional flotation.
The oxide results were as high as 96.4% Cu in an acid leach and up to 96.7% silver in a cyanide leach. Importantly, we think that a standard 30% Cu concentrate will be achievable, making it easy to sell to refiners. We believe this was a good outcome, especially for preliminary-stage testing. We think there’s a reasonable chance that we could use heap leaching to treat our oxide material.
Early last year, Azarga received a US$3M investment commitment from Baker Steel Resources Trust. How did that investment unfold?
Over the past several years it has been difficult for junior exploration companies to raise cash. Baker Steel took the view that among hundreds of risky companies destined for failure, there will always be some with projects of considerable merit. Azarg’s Unkur project stood out to them, a true vote of confidence.
Unkur’s resource estimate is 62M tonnes @ 0.53% Cu, plus 38.6 g/t Ag. That’s a 0.90% Cu Eq. grade (~1.2 billion pounds Cu Eq.). How deep is the mineralization?
Mineralization at Unkur has been drilled to ~350 meters’ depth, but remains open at depth and in both directions along strike. A new resource estimate by SRK is coming out in 2 or 3 weeks. While I can’t say what that new resource might look like, I can reiterate what we said in a May 11th press release, namely that recent drilling had extended the mineralized strike length by 90% from 3.4 to 6.5 km.
Your 2018 PEA delivered promising financial metrics. Might Azarga be able to extend the 8-yr. mine life?
Yes, the existing PEA contemplates mining ~25% of our existing resource, or meaningfully less than 25% of our new resource estimate. We’re looking to announce a significant increase in the resource size in the next 2 or 3 weeks. If the resource expansion is strong, then we would look to extend the mine life.
Instead of an 8-year mine life with throughput of 2.0M tonnes/yr., perhaps we could increase it to 3.0M or 3.5M tonnes/yr. and extend mine life by a few years. I’m not saying we can get there from our upcoming resource update alone, we have to study the new numbers. But, if we can increase annual production, and possibly extend mine life, without a major increase in cap-ex, the impact on NPV, IRR & payback period could be quite favorable.
What are the biggest risk factors of the Azarga story?
Aside from metals’ pricing, there are two primary concerns. Increased political tensions between Russia and the west, and the speed at which the world’s use / investment in copper & silver returns to normal after the impact of COVID-19.
I find it encouraging that the Cu price fell to ~US$2.10/lb. in mid-March, but has since recovered to ~US2.56/lb. Global automakers seem to have maintained fairly aggressive Electric Vehicle rollout plans, a promising sign for copper demand. Due to its industrial + investment / safe-haven attraction, silver futures touched US$11.80/oz., but have since rebounded to US$17.70/oz. (+50%).
Why should readers consider buying Azarga Metals?
Azarga is one of the few juniors that’s well funded. We’re able to move the Unkur project forward with drill results, metallurgical testing, a new resource calculation in coming weeks and hopefully a new PEA in 6-9 months.
Our Chairman Alex Molyneux is based in Asia and is well connected. He’s also highly experienced in investment finance / M&A. Russian investors, as well as global sovereign wealth funds, are looking to diversify away from oil, gas & coal. Silver, and especially copper, are critical, green energy, high-tech metals of the future.
Thank you Michael for this timely update. I can honestly report that few other metals & mining juniors are doing much during this pandemic. I look forward to seeing your updated resource estimate in coming weeks.
Disclosures: The content of this article is for information only. Readers fully understand and agree that nothing contained herein, written by Peter Epstein of Epstein Research [ER], (together, [ER]) about Azarga Metals, including but not limited to, commentary, opinions, views, assumptions, reported facts, calculations, etc. is not to be considered implicit or explicit investment advice. Nothing herein is a recommendation or solicitation to buy or sell any security. [ER] is not responsible under any circumstances for investment actions taken by the reader. [ER] has never been, and is not currently, a registered or licensed financial advisor or broker/dealer, investment advisor, stockbroker, trader, money manager, compliance or legal officer, and does not perform market making activities. [ER] is not directly employed by any company, group, organization, party or person. The shares of Azarga Metals are highly speculative, not suitable for all investors. Readers understand and agree that investments in small cap stocks can result in a 100% loss of invested funds. It is assumed and agreed upon by readers that they will consult with their own licensed or registered financial advisors before making any investment decisions.
At the time this article was posted, Azarga Metals was an advertiser on [ER] and Peter Epstein owned shares in the Company.
Readers understand and agree that they must conduct their own due diligence above and beyond reading this article. While the author believes he’s diligent in screening out companies that, for any reasons whatsoever, are unattractive investment opportunities, he cannot guarantee that his efforts will (or have been) successful. [ER] is not responsible for any perceived, or actual, errors including, but not limited to, commentary, opinions, views, assumptions, reported facts & financial calculations, or for the completeness of this article or future content. [ER] is not expected or required to subsequently follow or cover events & news, or write about any particular company or topic. [ER] is not an expert in any company, industry sector or investment topic.
Gold investment demand remains strong, buoying the yellow metal and its miners’ stocks. Investors have continued actively diversifying into gold despite soaring stock markets and weaker summer seasonals. The Fed’s extreme money printing fueling these precarious stock-market heights is perilously inflationary, making upping gold portfolio allocations essential. This ongoing capital shift is likely to keep pushing gold higher.
The dominant driver of gold’s major price trends is investment demand. While it isn’t the largest demand category, it varies greatly depending on global-financial-market conditions. The best global gold supply-and-demand data is only published quarterly by the venerable World Gold Council, in its must-read Gold Demand Trends reports. They highlight the big volatility inherent in gold investment demand in recent years.
From 2015 to 2019, jewelry demand averaged 51.2% of overall gold demand. But the biggest jewelry year out of the last 5 was only 1.2x the smallest one in tonnage-demand terms. Investment demand only averaged 29.0% of overall gold demand in 2015 to 2019, yet the difference between the best and worst years in this span was 1.7x. The WGC’s latest GDT on Q1’20 again proved how important investment is.
Last quarter was extremely volatile for gold since it got sucked into mid-March’s stock-panic capitulation. But even after that roller-coaster ride, gold still managed a 4.0% gain in Q1. Global gold demand per the WGC only edged up 1.2% year-over-year to 1083.8 metric tons. That was despite jewelry demand plummeting 38.9% YoY to 325.8t, as the world’s largest market China was mostly locked down for COVID-19!
Gold’s largest demand category cratering would’ve gutted its price if investment demand hadn’t soared 79.6% YoY to 539.6t. The 239.1t more gold investors bought in Q1’20 compared to Q1’19 more than offset the 207.6t collapse in jewelry. And investors weren’t buying traditional bars and coins, with their demand drooping 6.2% YoY. All gold’s investment-capital inflows in Q1 came in gold exchange-traded funds.
Physically-backed gold ETFs tracking prevailing gold prices trade in major stock markets around the world. When stock investors buy gold-ETF shares faster than gold itself is being bought, their share prices will decouple from gold to the upside failing their tracking mission. To prevent that, ETF managers must shunt excess gold-ETF-share demand directly into physical gold bullion itself to equalize capital flows.
They do this daily by issuing enough new gold-ETF-shares to absorb any differential demand. Then they use the resulting proceeds to buy more physical gold bullion for their funds. So when gold-ETF holdings are rising, it reveals stock-market capital is flowing into gold. Global ETF gold demand skyrocketed an enormous 594.5% YoY in Q1’20 to 298.0t! That’s the only reason gold prices have surged instead of collapsed.
With ETFs increasingly dominating the world gold market, every quarter the WGC ranks the physically-backed ones. The two largest by far are the American GLD SPDR Gold Shares and the IAU iShares Gold Trust. At the end of Q1, their total gold bullion held in trust for shareholders represented 30.4% and 12.3% of all the gold held by all the world’s gold ETFs! The next-largest German competitor was just 6.6%.
Launched way back in November 2004 by the World Gold Council, GLD has maintained a strong first-mover advantage ever since. I’ve been analyzing its daily-reported holdings for years, as GLD capital flows alone have often driven nearly all of gold’s price moves in volatile quarters. While IAU only came a bit later in January 2005, it has always struggled under GLD’s shadow. That’s despite a major advantage.
GLD’s managers charge 0.40% of their ETF’s total holdings each year to pay all the expenses necessary to keep GLD running. IAU’s expense ratio is considerably smaller at 0.25%, which is a big difference for institutional money managers deploying billions. That, along with IAU’s total gold bullion running about 4/10ths of GLD’s, is contributing to faster growth in this upstart competitor. IAU could eventually catch GLD.
So analysis of the huge American stock-market capital flows into and out of gold ideally would include GLD’s holdings plus IAU’s. Unfortunately I don’t have IAU’s full daily holdings history since January 2005, which I’ve been searching for. I’m offering a free one-year subscription to our weekly newsletter, worth $679, to the first person who provides me that verified full dataset. IAU’s holdings are getting increasingly important.
But for now GLD’s physical-gold-bullion holdings still remain the best-available daily proxy for global gold investment demand. This chart superimposes them over gold prices during this secular bull. Note that major gold uplegs and corrections are generally highly correlated with American stock-investor capital flowing into and out of GLD shares. Gold investment has proven very strong since March’s crazy stock panic.
Gold investment demand was solid early this year before that stock panic. It first flared on geopolitical fears over the US-Iran conflict briefly going kinetic in early January, and later on the mounting COVID-19 worries and resulting stock-market selling. By March 9th, GLD’s holdings had climbed 7.9% or 70.5t year-to-date. That helped push gold 10.4% higher before the stock panic’s fear maelstrom sucked in everything.
Nothing scares investors more than stock panics, which are technically 20%+ collapses in leading stock benchmarks in 2 weeks or less. They so greatly terrify traders that they rush to sell everything to flee to cash, even gold. During the previous October 2008 stock panic, gold plunged 16.7% over 21 trading days when the flagship US S&P 500 stock index (SPX) plummeted 30.0%! Gold isn’t immune to extreme fear.
As the SPX started sliding in late February 2020, gold initially enjoyed safe-haven buying. From the day the SPX peaked at an all-time high until March 9th, gold rallied 4.0% to $1675 despite the SPX plunging 18.9%. But once that stock-panic threshold was crossed, the gold baby was thrown out with the stock bathwater. Over the next 8 trading days as the SPX plunged another 12.3%, gold dropped 12.1% in sympathy.
A major driver of that was American stock investors fleeing GLD shares. In roughly that same span, they dumped GLD much faster than gold was being sold. That forced a 5.8% or 55.6t holdings draw, which of course amplifies gold’s stock-panic selloff. Gold-ETF managers have to sop up excess supply by buying back ETF shares, and they raise the proceeds to finance this by selling off some of their physical gold bullion.
But just two trading days after gold bottomed in mid-March when its sharp V-bounce started becoming apparent, traders flocked back to GLD. They’ve been aggressively deploying capital in gold through this leading and dominant gold ETF ever since. As this chart shows, GLD’s holdings have rocketed vertically since gold’s stock-panic lows. That’s similar to what transpired after that last stock panic in October 2008.
In early April soon after this latest government-economic-lockdown stock panic, I wrote about the soaring gold investment demand. I included a chart showing what happened to gold prices and GLD’s holdings after gold’s previous late-2008 stock-panic nadir. Over the following 2.8 years, gold blasted 166.5% higher fueled by a massive 71.5% or 535.5t GLD-holdings build! Stock panics stoke gold investment for years.
So American stock traders flooding into gold again after March 2020’s panic shouldn’t be surprising. Since its March 19th stock-panic low of $1472, gold has already surged 18.7% higher at best by its latest interim high of $1748 on May 20th. GLD’s major 20.6% or 190.1t holdings build during that span is the main reason why! The WGC’s next GDT on gold’s Q2’20 fundamentals will likely reveal continuing ETF dominance.
And American stock investors didn’t stop buying GLD shares when gold stalled last month for a healthy high consolidation since. Their differential GLD-share buying persisted into early June, which is usually a weak time seasonally for gold investment demand. Between March 20th to June 3rd, GLD’s holdings rocketed up 24.8% or 225.2t! That’s already over triple this ETF’s entire holdings build during all of Q1.
And this gold investment demand has been very consistent. In that 51-trading-day span, GLD enjoyed fully 36 holdings-build days averaging 0.6% each. That’s getting to sizable, on the way to 1.0%+ which I consider large for any given trading day. And there were only 4 holdings-draw days averaging trivial 0.1% declines. Gold investment buying has not only been strong, but persistent in the wake of this stock panic.
The crushing wealth declines in stock panics are devastating psychologically, scarring investors for years after those extraordinary events. They shock investors into remembering prudent portfolio diversification is wise, that being all-in stocks is way too risky. Gold plays a critical role in diversifying since it is a rare asset not highly correlated with stock markets. Gold tends to rally when stocks weaken or are expected to.
So for decades now I’ve argued that every investor always needs a 10%-to-20% gold allocation in their portfolios! It acts like insurance, stabilizing wealth by offsetting losses during stock bears or other major selloffs. And there’s no greater wake-up call to the inherent riskiness of stock markets than panic-grade plummetings. Investors tend to return to gold for years after stock panics rapidly decimate their wealth.
From February 19th to March 23rd, the SPX cratered 33.9%! Investors won’t soon forget forfeiting over a third of their wealth in just over a month. And American stock investors held virtually no gold before that brutal psychological shock. An excellent gold-investment-level proxy is the ratio between the total value of GLD’s holdings to the collective market capitalizations of the 500 elite stocks of that flagship S&P 500 index.
As the SPX reached its last all-time-record high in mid-February before the stock panic, GLD’s holdings were only worth 0.16% of the SPX companies! That implies American stock investors were running gold exposure around 1/6th of one percent. While this particular ratio will never get up to 10% or 20%, it sure reveals the radical underinvestment in gold. It will take huge sustained buying to even reach 1%, 2%, or 3%.
Since those stock-panic lows the SPX has skyrocketed 44.5% higher at best as of this week, which is just 4.5% under mid-February’s record peak. Yet gold investment demand remained strong even during this huge rebound rally, which is acting exactly like a monster bear-market rally. The driver fueling this gigantic surge is a major reason investors are still flocking to gold despite the stock euphoria, epic Fed money printing.
Federal Reserve officials panicked in mid-March as the stock markets plummeted. They feared the powerful negative wealth effect from cratering markets would plunge the US into a full-on depression. Thus they frantically unleashed a radically-unprecedented deluge of freshly-conjured money. From mid-March to early June, the Fed’s balance sheet skyrocketed an insane 66.2% or $2,853.3b higher in just 12 weeks!
This is far beyond anything ever witnessed in US history, as close to hyper-inflation as the Fed has ever dared get. This vast flood of new fiat dollars is being directly injected into the US economy via the huge stimulus bills Congress passed. The original CARES Act alone that became law in late March weighed in at $2,125b! This flood of money is competing for shrinking pools of goods and services, bidding up prices.
Even if the stock panic hadn’t happened, there’s probably never been a more important time to invest in gold than when the Fed’s printing presses are spinning out of control. 2/3rds more dollars evoked out of thin air in just 2.8 months are going to have a colossal inflationary impact in coming years. That mind-boggling and exceedingly-risky monetary inflation is a major driver behind investors shifting into gold.
So gold investment demand is likely to remain strong on balance even during gold’s summer doldrums, normally the weakest time of the year for gold demand. Gold tends to drift in Junes, Julies, and Augusts as they usually don’t have sufficient catalysts to drive outsized demand. But boy summer 2020 is sure a huge exception to that rule! Gold investment was strong last summer too after gold’s bull-market breakout.
In late June 2019, gold finally achieved its first new bull-market high in several years. That drummed up investor interest, resulting in gold surging 16.7% between the ends of May and August. Like usual that was fueled by big capital inflows into GLD’s shares, this ETF enjoyed a big 18.2% or 135.1t holdings build last summer! That again showed gold investment demand can be strong in summers with a solid catalyst.
Given the COVID-19 stock panic’s devastating psychological impact, the resulting far-beyond-extreme record Fed money printing, and the strong momentum in gold and gold investment, odds are this summer will again buck the normal weak seasonals. And if these Fed-goosed stock markets roll over hard as they ought to given the horrendous economic data and corporate earnings, gold will quickly grow way more popular.
Interestingly the main beneficiary of gold investment demand isn’t the metal itself, but the stocks of its miners. Just last week I wrote an essay explaining how their post-stock-panic upleg was still healthy, which traders were increasingly doubting due to a correction-grade selloff. Gold stocks have bounced back sharply since, as is evident in their leading GDX VanEck Vectors Gold Miners ETF in this updated chart.
While gold has rallied 18.7% at best out of its deep stock-panic lows, the major gold stocks have dwarfed that. At best GDX skyrocketed 95.8% higher from mid-March to mid-May! That makes for awesome 5.1x upside leverage to gold. And as I explained in my essay last week, the gold stocks still have lots of room to run technically and fundamentally. Fully 2/3rds of that big post-panic upleg was just a mean-reversion rebound.
While gold stocks bear too many additional risks to usurp gold’s ultimate-portfolio-diversifier crown, they are great to own when gold is powering higher on strong investment demand. The major gold stocks of GDX more than quadrupled after that last stock panic in late 2008, soaring 307.0% higher over the next 2.9 years. So if you expect strong gold investment demand to continue in coming years, own gold stocks!
Gold and its miners also power higher during stock-market bears when everything else is burning. Gold stocks aren’t a replacement for prudently maintaining that 10%-to-20% gold portfolio allocation. But they are a great place to park additional capital during extended episodes of weakening stock markets. The major gold stocks tend to amplify gold’s upside by 2x to 3x, building wealth instead of just preserving it in cash.
At Zeal we started aggressively buying and recommending fundamentally-superior gold and silver miners in our weekly and monthly subscription newsletters back in mid-March right after the stock-panic lows. We’ve been layering into new positions ever since, with unrealized gains already growing huge. Today our trading books are full of these fundamentally-thriving gold and silver miners that aren’t done running yet.
To profitably trade high-potential gold stocks, you need to stay informed about the broader market cycles that drive gold. Our newsletters are a great way, easy to read and affordable. They draw on my vast experience, knowledge, wisdom, and ongoing research to explain what’s going on in the markets, why, and how to trade them with specific stocks. Subscribe today and take advantage of our 20%-off sale! Seize this gold-stock consolidation to mirror our many winning trades before this major upleg runs again.
The bottom line is gold investment demand remains strong. Ever since the stock panic, American stock investors have continued shifting capital into GLD shares on balance. GLD’s holdings have long proven the best daily proxy for global gold investment demand. Investors are returning to gold with a vengeance after March’s stock panic violently reminded them that stock-market cycles still exist despite Fed money printing.
And that has gone ballistic since the stock panic, with the panicking Fed ramping dollar supplies by 2/3rds in a few months! This biggest and most-extreme monetary inflation in US history by far makes investing in gold more essential than ever. So gold investment demand is likely to remain strong in coming months, and soar as these lofty Fed-goosed stock markets roll over. That portends massive additional gold-stock gains.
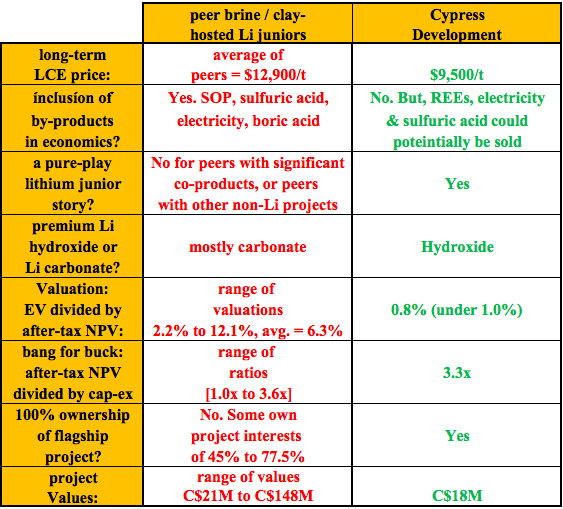
Cypress Development Corp. (TSX-V: CYP) (OTCQB: CYDVF) (Frankfurt: C1Z1) owns 100% of a giant, leachable, lithium-bearing claystone-hosted resource, the Clayton Valley Lithium Project (“CVLP“), adjacent to Albemarle Corp.’s Silver Peak brine operations in Nevada. The Company has an Enterprise Value (“EV“) {market cap + debt – cash} of C$17.5 million.
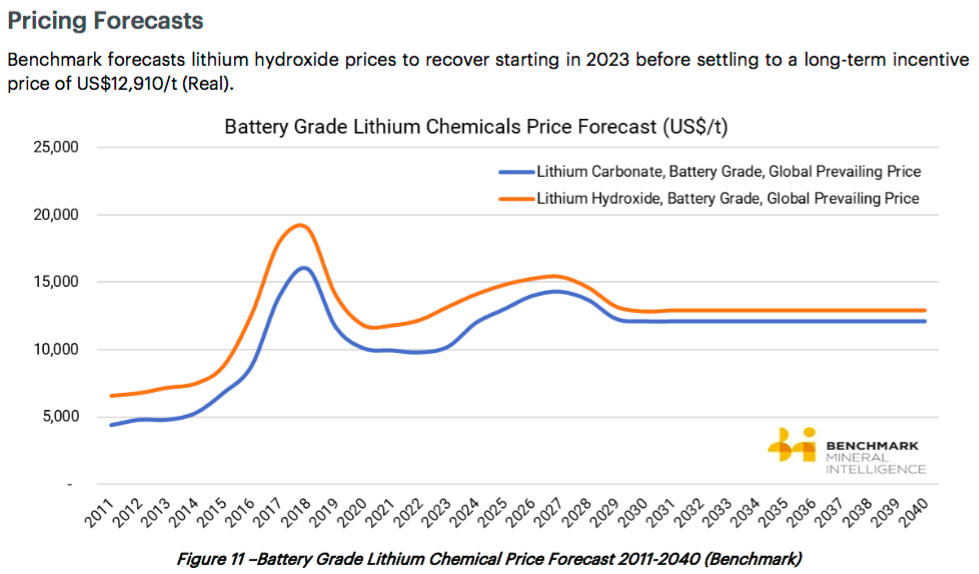
On May 19th, management delivered a highly-anticipated press release summarizing its Pre-Feasibility Study (“PFS“) on the CVLP. Let me start by saying…. It was worth the wait. Cypress adopted a low long-term price of US$9,500/tonne (“t“) of Lithium Carbonate Equiv. (“LCE“). The price used in a dozen other brine or clay-hosted (sedimentary) project reports (PEA, PFS or DFS) in the past three years ranged from US$11,000 to US$13,950/t and averaged US$12,558/t.
Cypress Development Corp. PFS a high-quality, serious report
Admittedly, lithium prices have been falling since 2018, but peer Nevada lithium + boric acid project developer ioneer ltd. announced, (20 days before Cypress), a Definitive Feasibility Study (“DFS“) with a US$13,200/t LCE price assumption.
Hard rock juniors are pursuing lithium hydroxide, but brine projects have lithium carbonate in their plans. Cypress plans to make battery-quality lithium hydroxide. In Cypress’ PFS, nameplate capacity is 27,400 tonnes LCE/yr. However, it takes less lithium to manufacture hydroxide than to make carbonate. If the CVLP project were to deliver 100% hydroxide, it would be operating at an average of 31,141 tonnes /yr.
Some investors might be wondering why management didn’t use a higher long-term lithium price. I believe there are two reasons. First, that’s not how CEO Bill Willoughby rolls. Dr. Willoughby is a PhD in Mine Engineering & Metallurgy, making him the polar opposite of a Vancouver promoter, and the best choice imaginable to be leading Cypress.
Second, I suspect that Cypress is in talks with entities led by serious engineers, metallurgists & experienced mining experts like Dr. Willoughby. A detailed, highly accurate PFS was called for. Please note, management has never revealed to me a name of anyone they’ve spoken with in the past or presently.
Cypress is very attractive in peer comparisons & in valuation
Unlike peers, Cypress did not incorporate by-/co-products in the economics. By contrast, Lithium Americas’ Thacker Pass project includes 11% of gross annual revenue from the sale of excess electricity & sulfuric acid. Cypress might also have excess sulfuric acid to monetize, but management did not use it in the model.
Rare Earth Elements (“REEs“) [scandium, dysprosium & neodymium] are present at the CVLP, but zero credit was ascribed to these potential cash flows. If recoverable, the un-discounted value of the REEs is in the hundreds of millions. REEs will be studied and reported on in the Definitive Feasibility Study (“DFS“).
By-/co-products are included in the economics of some peer company projects. I mentioned Thacker Pass (electricity + sulfuric acid). Bacanora proposes to produce potassium sulfate (“SOP“) alongside lithium carbonate.
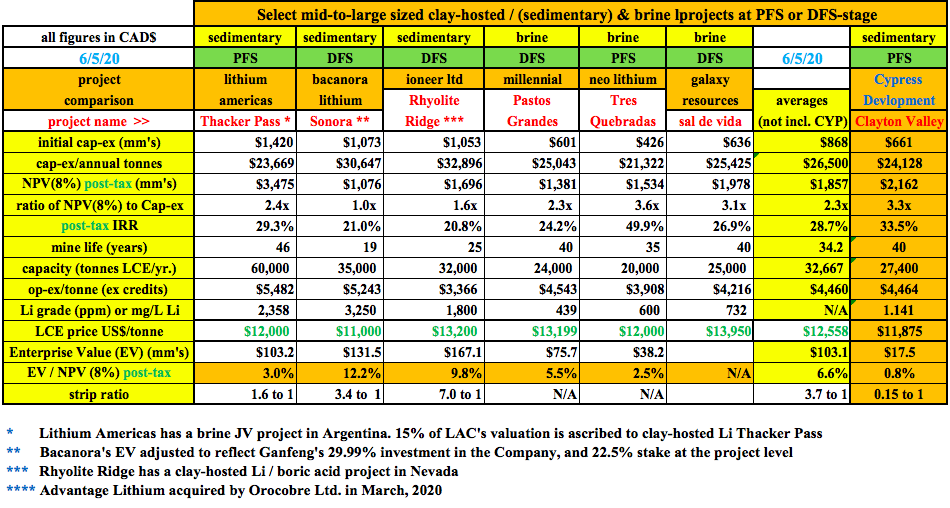
In order to more accurately compare projects, I adjusted the lithium price assumption in the CVLP PFS. Taking the midpoint between the base case of $9,500/t and the “upside” case of US$14,250/t, I interpolated key metrics at an implied LCE price of US$11,875/t, (5% lower than US$12,558/t peer average).
Cypress’ PFS compares quite well to the projects shown below. The average cap-ex was C$874M vs. C$661M for CYP.V, capital intensity; C$26,500/t vs. C$24,128/t for CYP.V, ratio of after-tax NPV(8%) to upfront capital; 2.3x vs. 3.3x for CYP.V., and IRR; 28.7% vs. 33.5% for CYP.V.
Again, these comparisons were done with a US$11,875/t price for Cypress. One last thing, the CVLP has a strip ratio of just 0.15 to 1. The other sedimentary projects have strip ratios ranging from 1.6 to 7.0 to 1, averaging 3.7 to 1.
Is Cypress a takeover candidate?
Could Tesla be looking at acquiring Cypress? With an EV of C$224.4B (12,824 times that of Cypress) it could easily afford to. However, I have no idea if Tesla is interested. I imagine that a few auto and/or Li-ion battery makers are kicking the tires. More importantly, I suspect that lithium & specialty chemicals giant Albemarle Corp. will be carefully reviewing the PFS.
Why would a C$15 billion company like Albemarle care about tiny Cypress? Simple. In a much larger company’s hands, the CVLP would be worth a lot more than C$17.5 million. A larger company could comfortably afford the initial cap-ex of C$661M. Financially strong players can borrow at low interest rates.
With substantial financial wherewithal and unrivaled, decades-long, expertise in specialty chemicals & lithium — Albemarle could bring a sedimentary project, one adjoining its own Silver Peak brine operations, to fruition faster than Cypress ever could. Silver Peak has been in operation since the mid-1960s. Assuming its current 6,000 tonnes LCE/yr. capacity, Albemarle says it has ~20 years of remaining mine life.
Think about the synergies that could be gained by adding the CVLP to Albemarle’s neighboring lithium complex. Silver Peak has all manner of industrial / chemical property, plant & equipment, and of course — lithium processing facilities. Equally important, it has 50+ years of expert knowledge & experience with lithium compounds and local / State permitting.
Adding 27,400 tonnes/yr. LCE (or 31,141 tonnes/yr. hydroxide) to Albemarle’s 6,000 tonnes LCE/yr. would move the needle for Albemarle. Cypress does not include EBITDA in the summary press release of its PFS, but the op-ex is US$3,329/t. So, at an interpolated lithium price of US$11,875/t, the operating margin before taxes would be $8,546/t.
Therefore, 31,141 tonnes hydroxide, multiplied by a US$8,546/t operating margin, equates to ~C$346 million in cash flow/yr. Compare that C$346 million to Albemarle’s trailing 12-month EBITDA of C$1.235 billion. All else equal, Albemarle’s EBITDA margin could jump from 27.1% to ~31.3% by acquiring Cypress. Can these two companies find a way to combine resources?
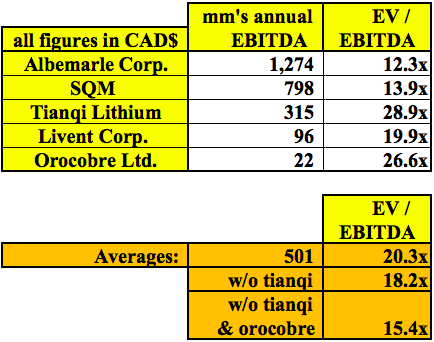
There are not that many lithium producers (of meaningful quantities), and SQM & Albemarle are not pure-play lithium investments. In the chart above, I show that EV/EBITDA multiples are fairly strong even with lithium prices at less than half 2018’s highs. Although there’s still a lot or execution risk, imagine what a potential cash flow stream of C$346 million/yr. for 40 years might be worth? A 15.4x multiple times C$346 million = C$5.3 billion. Discounting that figure back six years (from 2026) at a 20% discount factor, it’s still C1.78 billion.
Next Steps
The authors of the PFS recommend additional testing & studies be done in the areas of processing, mining, permitting & infrastructure. Further work is needed to confirm the flow sheet and determine recovery & reagent consumptions. A confirmation of the process & equipment in the leaching & filtration functions is sought and there’s further work to do to enhance solid-liquid separation to further reduce acid consumption.
Management must determine if there is any lithium or acid losses in the processing plant design and optimize lithium solution handling. Another important step will be to assess the economic viability of potassium, magnesium, REEs or other elements.
Drilling / limited test-mining is required to obtain material for metallurgical testing. Regarding permitting, a field program will be necessary to determine if any protected species of plants or animals are present, and to gather environmental & other data to prepare a mine Plan of Operations.
Finally, infrastructure — Feasibility-level designs for the mine, plant & tailings storage areas can now begin. A better understanding of power & water supply is needed. These are big ticket items that need to be sorted out over the next 12-18 months, before a DFS can be completed.
Capital will have to be raised to fund a pilot plant, various reports & studies and a DFS. Importantly, funding need not come solely from equity raises. I suspect that a farm out or JV is possible as soon as this year. Management is confident that these and other critical factors can be addressed. Readers should remember that first commercial production is probably not until 2025, there’s plenty of time to address any challenges.
CONCLUSION
There are simply not that many 25,000+ tonne/yr. lithium hydroxide projects in the world at PFS-stage or more advanced, that could be in production in 2025, or perhaps 2024 if a company like Albemarle were to get involved.
Once car & battery makers see lithium projects get acquired, or have their production capacities tied up by off-take agreements away from them, there might be a rush of M&A activity. Cypress Development Corp. (TSX-V: CYP) (OTCQB: CYDVF) (Frankfurt: C1Z1), with a world-class project in a world-class location, an EV of just C$17.5 million and a project with cap-ex < US$500 million, is a company that should be high on the lists of prospective suitors.
Disclosures: The content of this article is for information only. Readers fully understand and agree that nothing contained herein, written by Peter Epstein of Epstein Research [ER], (together, [ER]) about Cypress Development Corp., including but not limited to, commentary, opinions, views, assumptions, reported facts, calculations, etc. is not to be considered implicit or explicit investment advice. Nothing contained herein is a recommendation or solicitation to buy or sell any security. [ER] is not responsible under any circumstances for investment actions taken by the reader. [ER] has never been, and is not currently, a registered or licensed financial advisor or broker/dealer, investment advisor, stockbroker, trader, money manager, compliance or legal officer, and does not perform market making activities. [ER] is not directly employed by any company, group, organization, party or person. The shares of Cypress Development Corp. are highly speculative, not suitable for all investors. Readers understand and agree that investments in small cap stocks can result in a 100% loss of invested funds. It is assumed and agreed upon by readers that they will consult with their own licensed or registered financial advisors before making any investment decisions.
At the time this article was posted, Cypress Development Corp. was an advertiser on [ER] and Peter Epstein owned shares in the Company.
Readers understand and agree that they must conduct their own due diligence above and beyond reading this article. While the author believes he’s diligent in screening out companies that, for any reasons whatsoever, are unattractive investment opportunities, he cannot guarantee that his efforts will (or have been) successful. [ER] is not responsible for any perceived, or actual, errors including, but not limited to, commentary, opinions, views, assumptions, reported facts & financial calculations, or for the completeness of this article or future content. [ER] is not expected or required to subsequently follow or cover events & news, or write about any particular company or topic. [ER] is not an expert in any company, industry sector or investment topic.
If you would like to receive our free newsletter via email, simply enter your email address below & click subscribe.
 Follow us on Twitter
 Become our facebook fan
CONNECT WITH US
Tweets
Tweet with hash tag #miningfeeds or @miningfeeds and your tweets will be displayed across this site.
MOST ACTIVE MINING STOCKS
Daily Gainers
 CMC Metals Ltd. CMC Metals Ltd. |
CMB.V | +900.00% |
 Eden Energy Ltd Eden Energy Ltd |
EDE.AX | +200.00% |
| GoviEx Uranium Inc. |
GXU.V | +42.86% |
| Eagle Nickel Ltd. |
ENL.AX | +41.67% |
| Citigold Corp. Limited |
CTO.AX | +33.33% |
| Mount Burgess Mining NL |
MTB.AX | +33.33% |
| Exalt Resources Limited |
ERD.AX | +31.94% |
| Casa Minerals Inc. |
CASA.V | +30.00% |
| Cariboo Rose Resources Ltd |
CRB.V | +28.57% |
| Belmont Resources Inc. |
BEA.V | +28.57% |


