
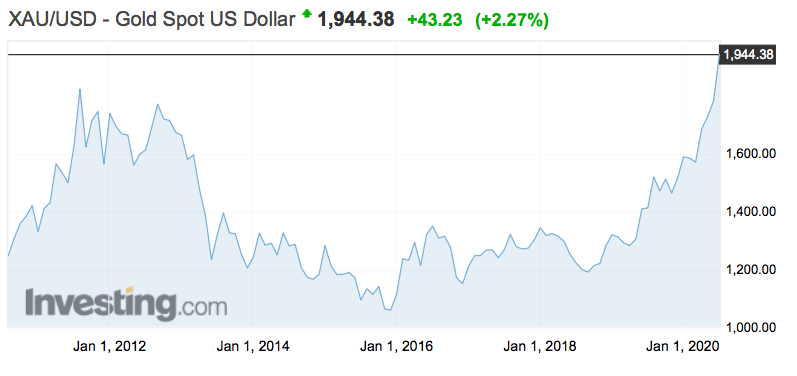
In every article / interview I’ve done on a gold or silver junior in the past three months, I’ve remarked, somewhat breathlessly, on how strong prices are. Yet, prices keep moving higher! Gold at US$1,944/oz. (an all-time high in US$) is up +39% from its 52-week low of US$1,401/oz., Silver at US$24.33/oz. is up 102% from its mid-March COVID-19 low!
VanGold Mining (TSX-V: VGLD) / (OTCQB: VGLDF) is a silver-gold story benefiting from this apparent precious metals bull market, but more importantly from the potential to generate two years+ of steady free cash flow starting in about 6-9 months. Monetizing historical stockpiles is as much as most readers may know about VanGold, but there’s so much more to this story….
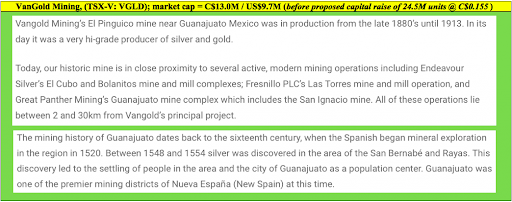
In a prior article I mentioned the possibility of C$15 to C$27M in total cash flow, over 24-30 months, from toll-milling surface & underground (“u/g“) stockpiles. At today’s spot prices, my rough estimate increases to C$23M to C$35M. Anything above C$15M would be a great outcome for a company with a market cap of C$13.0M = US$9.7M. {Note: market cap is before a recently announced private placement of 24.5M units @ C$0.155/unit}
While free cash flow from harvesting stockpiles would greatly reduce the need for future equity raises, better still is the tremendous exploration & near-term production potential. High-grade ore in and around historical u/g workings is low-hanging fruit that could payoff for years to come.
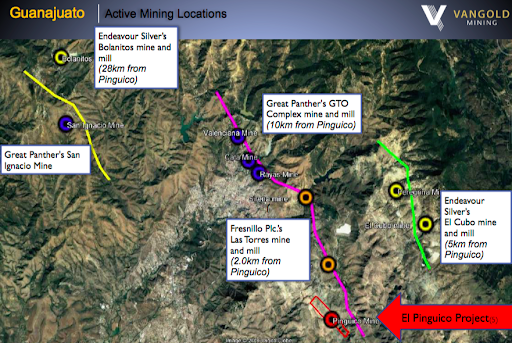
Finally, there’s a decent chance that the entire region’s blockbuster vein, the Mother Vein, passes through VanGold’s property at depth with (possibly) very wide stopes & high grades. The Company needs to drill to test that theory, so stay tuned. Please continue reading to find out what CEO James Anderson has been up to that has everyone so damn excited.
Please explain what VanGold learned from shipping & toll-milling 1,039 tonnes of ore from its surface stockpile of approx. 175k tonnes.
Many things really. Regarding gold & silver recoveries, some people thought our surface material, exposed to the elements for nearly 110 years, would not float in a floatation mill due to oxidation. We proved those folks wrong with +75% recoveries for gold & +60% for silver. (we have ideas about how to get better Ag recoveries). For a first test through a mill, we are very happy with these results.
The head grade of 1.23 g/t Au Eq. on 1,039 tonnes of surface material passed through the mill was almost exactly what we expected. That gives us confidence in our other grade assumptions — especially for the u/g stockpile — which we believe is about three times higher than the surface stockpile, roughly 3.6 g/t Au Eq. In 1959, the Mexican Geological Survey estimated a meaningfully higher grade. So, there might be some upside here.
Perhaps most important, we learned a great deal about the economics of sending material to a local mill. Actually knowing all the component costs of shipping & processing gives you great confidence to plan for the future. We ended up producing 18 ounces of gold & 930 ounces of silver, a small start, but an important first step along our journey.
After your current capital raise, VanGold will have about $5M in cash. And, you hope to have significant monthly cash flow, for 24-30 months, targeted to start in 1H 2021. Why do you need so much cash?
First, I want to thank our shareholders, many of whom investing for a second or third time, for giving us money to pursue this exciting project. Re-entering & refurbishing the 110-year old mine will no doubt come with surprises, both good & bad.
We’re now confident that we will have ample funds to deal with anything unexpected as we assess the bottom of the u/g stockpile and access the #7 or Sangria adit level. Although delayed for 10 days due to COVID-19, that work is expected to start next week. Meanwhile, computer modeling of the deposit in anticipation of an underground drill program is ongoing.
Regarding VanGold’s two stockpiles, please explain the logistics of monetizing these assets?
With regard to the surface stockpile, it could not be easier. A front end loader will shovel material into 20-tonne trucks for delivery to a local mill. With regard to the u/g stockpile, there are several additional steps. First, we need to clear the bottom of the El Pinguico shaft and sample the bottom of the u/g stockpile.
As established by VanGold’s trenching (to NI 43-101 standards), the top of the stockpile grades about 3.6 g/t Au Eq. We plan to further establish & confirm that grade by sampling the bottom. We are carefully studying options to either refurbish the El Pinguico shaft or the Sangria adit, to 21st century safety standards, to bring the u/g material to surface. Finally, let me emphasize this point, we need to establish a medium-term contract with a mill to process our material.
We’re optimistic on this front, I mean we did successfully negotiate & fulfill a contact for 1,039 tonnes in May. There are four mills between 2 to 28 km from our property. We think we will be able to strike a deal with one of them. Still, until we sign a contract, that remains a risk factor.
How soon before you might deliver a PEA / PFS? Or, given that you’ve done trial mining & toll-milling on 1,039 tonnes of ore, do you need to spend the time & capital on these reports?
That’s a good question. Frankly, we hope to skip over much of the cult of report writing and simply transition from shipping our stockpiled material (over 24-30 months, targeted to start 1H 2021) into adding in higher grade in-situ, newly mined material.
El Pinguico is usually described as a silver-gold project. Do you know what the mix is between the two metals?
Well, the u/g stockpile grades 1.66 g/t gold + 167 g/t silver, a 100 to 1 silver to gold ratio. If the stockpile is indicative of surrounding areas, which we believe it probably is, then for each ounce of gold, there’s likely to be about 100 ounces of silver. In terms of in-situ metal value, at spot prices (US$1,944/oz. gold / US$24.33/oz. silver), 56% of the economics would come from silver, and 44% from gold.
The u/g stockpile grades ~3.6 g/t gold equiv. Yet, historical mining, drill records and u/g sampling indicate much higher grades. Why is the stockpile grade much lower?
In any u/g operation, mining consistent tonnage facilitates the smooth procession of the overall mine plan. Mining widths & grades vary, as does the time it takes to mine a specified amount of ore on any given day or week. Therefore, miners keep a running stockpile of lower-grade ore to supplement the high-grade material sent to the mill. We believe our u/g stockpile is just that, partially diluted high-grade ore that never made it out of the mine when operations ended in 1913.
You’ve spoken about the possibility of the Mother Vein crossing your property. If it does, what might that mean for the scope of the project?
We are nearly certain the Veta Madre or ‘Mother Vein’ crosses our property at depth. The structure is regional in size, having a surface expression over 25-30 km. Meanwhile, we know that Fresnillo PLC mined the Veta Madre to within 250m of our property border.
What we don’t know is how well mineralized the Veta Madre will be on our property, or whether the El Pinguico vein structures, which host all the high-grade silver & gold mined on our property 110 years ago, intersects with that larger structure. If there’s a meaningful intersection, it will be an extraordinarily compelling drill target!
Are there nearby properties or mining assets to consider acquiring or otherwise gaining control of?
Yes, we certainly have some ideas about that, but I really can’t say more at this time. There is an important balance for VanGold regarding staying focused on the work we have ahead at El Pinguico, and yet maintaining our eyes on the horizon too. We’re keenly watching for new opportunities within the 450-year old Guanajuato mining camp.
The gold price has breached US$1,900/oz., and silver has doubled to US$24+/oz. since mid-March! Sentiment for precious metal juniors is quite buoyant. What could go wrong?
Sentiment could hardly be better right now. That usually marks at least an interim top for precious metals. We saw a modest pause last week in some of the sector’s strongest performing juniors. Preparing for that inevitable pull back, and taking advantage of it when it does occur, is certainly one of VanGold Mining’s (TSX-V: VGLD) / (OTCQB: VGLDF) top goals. That’s one of the reasons why we’re raising cash now, better safe than sorry.
Thank you James, I think we covered a lot of ground here. I will be watching VanGold for updates. I would wish you good luck on your capital raise, but I doubt you need it. Stay safe and healthy.
Disclosures / disclaimers: The content of this interview is for information only. Readers fully understand and agree that nothing contained herein, written by Peter Epstein of Epstein Research [ER], (together, [ER]) about Vangold Mining, including but not limited to, commentary, opinions, views, assumptions, reported facts, calculations, etc. is to be considered implicit or explicit investment advice. Nothing contained herein is a recommendation or solicitation to buy or sell any security. [ER] is not responsible for investment actions taken by the reader. [ER] has never been, and is not currently, a registered or licensed financial advisor or broker/dealer, investment advisor, stockbroker, trader, money manager, compliance or legal officer, and does not perform market making activities. [ER] is not directly employed by any company, group, organization, party or person. The shares of Vangold Mining are highly speculative, not suitable for all investors. Readers understand and agree that investments in small cap stocks can result in a 100% loss of invested funds. It is assumed and agreed upon by readers that they will consult with their own licensed or registered financial advisors before making any investment decisions.
At the time this article was posted, Peter Epstein owned stock & warrants in Vangold Mining, and the Company was an advertiser on [ER].
While the author believes he’s diligent in screening out companies that, for any reasons whatsoever, are unattractive investment opportunities, he cannot guarantee that his efforts will (or have been) successful. [ER] is not responsible for any perceived, or actual, errors including, but not limited to, commentary, opinions, views, assumptions, reported facts & financial calculations, or for the completeness of this article or future content. [ER] is not expected or required to subsequently follow or cover any specific events or news, or write about any particular company or topic. [ER] is not an expert in any company, industry sector or investment topic.
- Gold has arrived at significant resistance in the $1900-$2000 zone. Investors need a solid plan of action to deal with the intense volatility that is currently enveloping the market.
- Please click here now. Double-click to enlarge this December futures gold chart.
- In 2011, a key futures contract traded at about $2000. That’s a significant round number, and the gold price is now recoiling from that same $2000 price zone.
- Please click here now. Double-click to enlarge. Basis this popular August contract, gold made a new high, as it did in the spot (cash) market.
- Gold tends to react violently at round numbers like $500, $1000, and $2000. When gold makes its way to $3000, more “price violence” should be expected. What about tactics for today, at $2000?
- Well, nervous investors can buy put options on gold, silver, and mining stocks. That’s the simplest way to protect a portfolio from a big drawdown. It’s a lot like buying fire insurance for a house. It doesn’t cost a lot, but there’s a lot of protection for a modest outlay of capital.
- Not all investors are worried, and those looking to buy can wait for a deeper correction, a fresh high… or just take the plunge and buy this morning’s dip!
- Please click here now. Double-click to enlarge this GDX “staircase” chart.
- The important pattern of higher highs and higher lows is intact. Dip buyers could buy right now or wait for just above the $40 area, with an optional stoploss at $40.
- As long as gold trades at $1800 or higher, I expect GDX will ultimately make a new all-time high.
- That’s because the miners have re-invented themselves as shareholder-friendly cash cows, and lots of money managers want in on the action!
- What about silver? Please click here now. Double-click to enlarge.
- Silver was rising in a narrow channel and surged out of the channel. I suggested the surge would reach my $26 target price, and it did.
- Like $2000 for gold, $26 is significant resistance for silver.
- While a pause is likely, the good news is that a bigger channel is now in play. A move above $26 likely sees silver rise to my next target price of $35.
- Please click here now. Double-click to enlarge this important SIL ETF chart.
- SIL is poised to stage a breakout from a gargantuan box pattern that covers the price zone between $15 and $50.
- Like $2000 for gold, $50 is a round number for SIL, and a reaction is expected. A breakout over $50 would launch SIL toward my $85 target zone, which is also the all-time high for this ETF.
- The pause for gold, silver, and the miners right now is both technical and fundamental. From a fundamental perspective, most of the bad Corona news is priced into the market, and nothing important has happened in geopolitics to “juice” the 2021-2025 war cycle.
- The disgusting government debt growth continues unabated, but there are no fresh surprises at the present time.
- Gold was crushed in 2013 by the Indian government’s relentless import duty hikes. Indian demand then was enormous, and the loss of it devastated the market.
- In contrast, Indian demand in the official market is almost negligible right now, and the current monsoon season has been superb. Farmers are expecting the best harvest in many years.
- The current pullback/consolidation in the gold price should see them take decent buy-side action in the physical market, especially if it lasts for several weeks.
- In a nutshell, the $2000 area produced a significant reaction in the gold price in 2011-2013. Today, gold has a solid technical and fundamental floor at about $1800. Reactions in the price are quite orderly and can be bought with confidence!
Silver investment demand is exploding in recent months, skyrocketing higher in wildly-unprecedented fashion! That has catapulted silver sharply higher since mid-March’s COVID-19-lockdown stock panic. Accelerating even in this usually-weak summer season, the massive capital inflows deluging into silver show no signs of abating. This is very bullish for silver, yet most traders remain unaware it is happening.
While silver prices are fairly-widely followed, the data revealing the underlying fundamentals driving this metal is sparse. The best silver global supply-and-demand data is only published once a year by the venerable Silver Institute in its outstanding World Silver Surveys. The latest covering 2019 was released in April, and is essential reading for all traders interested in silver. One key trend is very relevant to today.
Last year global silver demand edged up an ever-so-slight 0.4% to 991.8m ounces worldwide. Every demand category fell except for two, net physical investment and net investment in exchange-traded funds. The former rose a respectable 12.3% to 186.1m ounces. It makes sense investors’ interest in silver should grow with its price climbing 15.3% in 2019. That translated into far faster growth in silver ETFs.
Global demand for physical silver bullion held in trust for the shareholders of these trading vehicles shot up from -22.3m ounces in 2018 to +81.7m in 2019! That was an all-time-record high. Stock investors are increasingly getting silver exposure through ETFs, which are quick, easy, and cheap to both trade and own. The Silver Institute tracks the world’s silver ETFs, and one behemoth utterly dominates that space.
As 2020 dawned, the American SLV iShares Silver Trust held 362.6m ounces of silver on behalf of its shareholders. That commanded an enormous 49.8% of all the silver owned by all the world’s silver ETFs! Launched way back in April 2006, SLV pioneered silver ETFs and has maintained an insurmountable lead since. SLV is in a league of its own, with its next-biggest competitor trading in Switzerland running just 11.4%.
Following SLV is exceedingly important for speculators and investors alike, since it acts as a direct conduit for the vast pools of American stock-market capital to slosh into and out of silver. That happening in a big way really moves silver prices. SLV’s managers publish its physical-silver-bullion holdings daily, offering a high-resolution near-real-time read on silver investment demand! And they’ve been skyrocketing.
In an opaque silver world where comprehensive investment data is only available once a year in those World Silver Surveys, SLV’s daily holdings as a proxy for investment demand are invaluable. Watching how they are trending gives great insights into why silver prices are moving and which direction they are likely heading. Yet only a small fraction of traders interested in silver seem to regularly watch SLV’s holdings.
Before we delve into silver’s exploding investment demand they reveal, realize how unusually-strong silver’s price action has been. This chart updated from my summer-doldrums essay a couple weeks ago compares silver’s current performance to how it has fared in past market summers in modern gold-bull years. Gold dominates silver psychology, making gold’s fortunes silver’s primary driver most of the time.
These lines are individual summers’ silver price action indexed to its final May closes of those particular years. The red line averages together silver’s performances from the summers of 2001 to 2012 and 2016 to 2019. Note that silver’s seasonal tendency is to drift sideways during market summers, which tend to be devoid of recurring investment-demand spikes. The blue line is summer 2020’s indexed silver price action.
During the first half of June, silver was largely drifting lower tracking its normal summer trend. But in the second half of June and especially July, silver has surged dramatically decoupling from its usual weak seasonals this time of year. What’s fueling silver’s outsized counter-seasonal gains over the past month or so, and is it sustainable? The answer to the first question is definitely exploding silver investment demand!
SLV’s skyrocketing holdings since mid-March’s stock panic have been mind-blowing. Given SLV’s size and dominance of the silver-ETF world, they are the best daily proxy for global silver investment demand. Understanding why is important. The iShares Silver Trust’s mission is to mirror the silver price, to give American stock traders easy portfolio exposure to silver. Tracking ETFs only succeed acting as capital conduits.
The supply and demand for SLV shares is independent from silver’s own. So if stock traders are buying SLV shares faster than silver itself is being bought, SLV’s share price risks decoupling from silver’s to the upside. The only way to prevent this ETF from failing its tracking mission is to shunt excess SLV-share demand directly into physical silver. That equalizes the demand differential between this ETF and the metal.
Mechanically this is accomplished by SLV’s managers issuing sufficient new shares to absorb all excess SLV demand. Then the capital raised from those share sales is immediately used to buy physical silver bullion that same day. SLV acts like a channel for American stock-market capital to flow into the global silver market. Differential SLV-share buying forcing holdings builds reveals rising silver investment demand.
SLV’s capital pipeline between the stock markets and silver naturally works the other way too. When American stock traders sell SLV shares faster than silver is being sold, this ETF’s price will disconnect from silver’s to the downside. SLV’s managers have to avert this by buying back enough SLV shares to absorb the excess supply. They raise the capital to do this by selling some of SLV’s silver-bullion holdings.
So if SLV’s holdings are rising, stock-market capital is flowing into the world silver market. If they are falling, it is flowing back out. With that in mind, the following chart is one of the most stunning in the wake of mid-March’s stock panic. American stock traders, both speculators and investors, have been flooding into silver via SLV shares at a really-unprecedented pace! Thus silver has bucked its summer doldrums.
Here SLV’s daily holdings are superimposed over silver’s daily prices during its secular bull which started marching in mid-December 2015. While silver has technically shifted from bull to bear within this span, its secular moves are usually defined by gold’s. Since silver sentiment heavily depends on what gold is doing, silver often acts like a leveraged play on gold. Silver’s volatility comes from its very-small market.
Again that World Silver Survey reported total global silver demand in 2019 ran 991.8m ounces. At silver’s average price of $16.18 last year, that was worth $16.0b. That’s a rounding error compared to the stock markets and even gold. According to the World Gold Council, global gold demand clocked in at 4,368.3 metric tons in 2019. At gold’s $1394 average price last year, that implies a vastly-larger market size of $195.8b.
So with the world silver market being about 1/12th the size of gold’s, any given amount of capital flowing into silver should yield about 12x the silver-price impact as it would have in gold! Traders generally get far more bang for their buck in SLV than they would in the major gold ETFs dominated by the GLD SPDR Gold Shares. While I closely follow SLV’s holdings every trading day, what they’ve just done still amazes me.
As of the middle of this week, SLV held a stupendous 516.1m ounces of physical silver bullion in trust for its shareholders! That is by far an all-time-record high, dwarfing everything ever seen prior to this past month or so. Since mid-June alone, the dreary heart of silver’s summer doldrums, SLV’s holdings have soared 9.1% or 43.2m ounces. American stock traders are pouring into silver like never before in SLV’s history.
And that’s saying a lot. Back in spring 2011, silver soared parabolic in one of the violent crazy-lucrative manias this metal is famous for. In just 6.2 months into late April, silver skyrocketed 109.1% to $48.43 per ounce! Days before that euphoric peak, SLV’s holdings blasted to a then-record 366.2m ounces. They didn’t edge above that towering record again until 5.5 years later in October 2016 early in today’s bull.
Then silver fell back out of favor over the next few years as gold’s own young secular bull stalled out and consolidated high. By February 2019, SLV’s holdings had slumped to a deep 6.8-year secular low of 306.9m ounces. American stock investors just weren’t interested in silver. Not only was it languishing in the $15s, but it hadn’t made any new bull-market progress since August 2016. Silver was dead money, forgotten.
But investors quickly returned last summer when gold finally broke above years-old resistance to carve major new bull-market highs. American stock traders flocked back to SLV shares to ride silver’s strong upside momentum, buying them much faster than silver was being bought. So SLV’s holdings surged as high as 388.2m ounces in late August 2019, a new record. But in context it was merely a marginal one.
SLV’s holdings had only risen 6.0% over the 8.4 years since silver went parabolic challenging $50, fueling great popular interest in this metal. And once silver’s upside momentum flagged last autumn, so too did traders’ interest in owning SLV shares. They were sold faster than silver on balance into mid-March’s COVID-19-lockdown-spawned stock panic, forcing SLV’s managers to sell silver bullion to sop up excess supply.
That stock panic was brutal for silver. After trading as high as $18.62 in late February, silver was crushed to a 35.8% loss over the next few weeks. Collapsing to $11.96 at its stock-panic nadir, that was a near-crash. Silver’s worst two-trading-day loss leading into that abysmal low was 18.9%, a little shy of the formal crash threshold of 20%+ in 2 trading days or less. SLV’s holdings slumped as low as 353.2m ounces.
But interestingly contrarian bargain hunters jumped in just a day before silver bottomed. One day after silver’s worst day of the panic, March 16th which saw silver plummet 12.8%, SLV’s holdings blasted up 3.4% to 365.2m ounces! With American stock traders starting to aggressively buy SLV again, that implied silver’s terrible stock-panic selloff was ending. And indeed silver soon started V-bouncing violently higher.
Over the next 6 trading days into late March, silver soared 20.6%. That was fueled by a massive 5.7% or 21.1m-ounce SLV-holdings build in that initial post-panic span. That catapulted SLV’s holdings to their first new record high after the panic, 391.9m ounces. Later by mid-April, silver would mean revert 30.6% higher. Stock traders buying SLV shares was the major driver, SLV’s holdings soared 10.6% or 39.4m ounces!
Silver stalled out for the next several weeks after that, and SLV’s holdings drifted sideways. But as silver started rallying again into mid-May, stock-market capital resumed pouring into silver via that SLV conduit. During May alone, SLV’s holdings blasted 12.2% or 50.4m ounces higher to hit 9 new record highs out of 20 trading days! I was surprised when they first crossed 400m in early April, so late May’s 463.3m was astounding.
Silver investment demand typically dries up in June, the summer doldrums when traders pull back from the markets to enjoy vacations. But American stock traders continued flocking to silver this year, driving SLV’s holdings up another 7.5% or 34.7m ounces last month. That was really impressive since silver only climbed 2.1%, rather pathetic compared to May’s huge 19.2% surge. Investors kept buying without silver rallying!
That unusual counter-seasonal strong investment demand continued into July. The trading day before the US Independence Day holiday, which usually makes for the lightest-volume trading week of the year for broader markets, SLV’s holdings crested 500m ounces for the first time ever! And that sizable July 2nd 0.8% build to 502.0m ounces happened on a day silver slumped 0.4%. Investors still wanted silver.
That was even more remarkable because silver had had little fanfare to that point. While it did V-bounce to mean revert out of that stock panic, silver had yet to regain pre-panic highs. As late as July 7th, silver had yet to close over late February’s peak. Silver still languished 1.9% lower, despite gold already being 8.3% over its own. Silver was greatly underperforming gold, which its price usually amplifies by 2x to 3x.
But investors still kept flooding in. As of this Wednesday’s data cutoff for this essay, SLV’s holdings had surged another 3.6% or 18.1m ounces month-to-date in July. During this past month, SLV’s holdings hit new all-time-record highs on half of all trading days! I’ve been intensely watching, analyzing, and trading silver and its miners’ stocks for over a couple decades, and I’ve never seen anything like that. It’s amazing.
Overall since its stock-panic nadir, silver has soared 62.6% in 3.9 months as of the middle of this week. That is actually 2.8x gold’s 22.0% post-panic upleg in that same span, on the high side of silver’s normal outperformance band. Driving silver’s big gains was the massive investment demand as evident in SLV’s holdings. They skyrocketed 39.2% or 145.2m ounces higher in that span, an unprecedented vertical blast!
As I’ve marveled at these colossal capital inflows into silver in recent months, I’ve wondered who is doing that buying. I’ve been worried it was the Robinhooders. Robinhood is a phone app that millennials use for stock trading. Funded by selling order-flow data to high-frequency-trading firms that can front run what Robinhood users are doing, Robinhood’s stock trading is commission-free. So millennials totally love it.
Plenty of surveys have shown they are plowing their government stimulus money from the CARES Act into trading speculative stocks. A big fraction of the one-time helicopter-money payments, the employment checks financed by PPP loans, and the $600-per-week federal unemployment bonuses have been shifted into Robinhood for stock trading. Robinhooders move as a herd, quickly bidding up then crashing stocks.
If they are behind the massive SLV-share buying, it probably isn’t sustainable. These speculators have a euphoric get-rich-quick mindset, and rapidly move on to the next big momentum play once upside flags. Interestingly Robinhood publishes data on how many of its users hold specific stocks. Before the stock panic, only about 8k owned SLV. While that has soared since, it only just crossed above 15k this week.
7k more Robinhooders wouldn’t move the needle in SLV. The average trading-account balance there is reported to run between $1k to $5k, which is nothing even compared to silver. So with 15k Robinhooders now holding SLV, the amount of capital they have deployed in it likely remains trivial. For comparison, their 10th-largest holding this week is Tesla with 484k users owning it. 942k now own Ford on its new Bronco.
The huge SLV buying isn’t coming from millennials chasing shiny new things, but from normal investors. While there’s no way to tell yet, I suspect institutional investors have led the charge into SLV rather than individuals. The reason is the differential SLV-share demand forcing that near-vertical holdings build has been highly consistent and disciplined. It has happened whether silver is rising, falling, or grinding sideways.
Individual traders tend to rush into silver only when it is surging to new highs to capture attention. Out of the 34 trading days since the stock panic where SLV’s holdings hit new record highs, silver only climbed to new post-panic bests on 11 of them. Whoever is migrating into silver is doing so strategically, slowly amassing big positions while ignoring sentiment swings driven by silver’s volatile price action. This has to be funds!
There’s anecdotal evidence supporting that. In my line of work, I have CNBC and Bloomberg on all day everyday in my office. I can unmute and listen to the interviews of fund managers when I’m working on spreadsheets and charts. Even before SLV holdings’ vertical explosion became this apparent, I heard a surprisingly number of fund managers say they were bullish on silver due to the Fed’s epic money printing.
They also cited silver’s rampant undervaluation relative to gold. My last essay on that came in early May, and I need to update that thread. In a nutshell for today, mid-week silver at $19.45 traded at just 1/93rd the price of gold. It took 93.1 ounces of silver to equal the value of a single ounce of gold. That hit an apocalyptic all-time-record low for silver of 124.1x during the stock panic, and averaged 81.1x in this silver bull.
If fund managers are waiting for silver to mean revert higher and overshoot relative to gold, they aren’t going away anytime soon. The historical average Silver/Gold Ratio is closer to 55x. At $1800 gold, that implies silver challenging $33! The funds aggressively adding silver positions will likely stay in and ride them for some time to come. And their buying forcing silver higher will attract in more traders in a virtuous circle.
The biggest beneficiary of higher silver prices is the stocks of its miners. The more of their quarterly sales derived from silver, and the better their fundamentals, the greater their upside leverage to silver. As an example, the purest silver miner with the highest percentage of revenues from silver in Q1’20 has seen its stock skyrocket 186.7% higher since mid-March! We recommended it low in our newsletters back in early April.
At Zeal we started aggressively buying and recommending fundamentally-superior gold and silver miners in our weekly and monthly subscription newsletters back in mid-March right after the stock-panic lows. We’ve been layering into new positions ever since, with unrealized gains already growing as big as +138%! Our trading books are full of these fundamentally-thriving gold and silver miners that aren’t done running.
To profitably trade high-potential gold and silver stocks, you need to stay informed about what’s driving gold and silver. Our newsletters are a great way, easy to read and affordable. They draw on my vast experience, knowledge, wisdom, and ongoing research to explain what’s going on in the markets, why, and how to trade them with specific stocks. Subscribe today and take advantage of our 20%-off sale! Analyzing little-followed-but-essential indicators like SLV’s holdings can greatly improve trading success.
The bottom line is silver investment demand is exploding. American stock traders have flooded into SLV shares in recent months, vastly upping their silver portfolio exposure via the world’s dominant silver ETF. This silver buying has proven incredibly persistent, continuing even when silver weakens. That implies it is funds strategically building silver positions, on expectations for much-higher silver prices coming ahead.
The resulting enormous SLV-holdings builds are unprecedented, forcing them vertical to smash through many new record highs. That is unleashing a powerful virtuous circle for silver, with investment buying driving silver higher attracting in even more investors. Silver still has a long runway higher to mean revert back up to historic norms relative to gold. And the Fed’s epic monetary inflation should keep demand high.
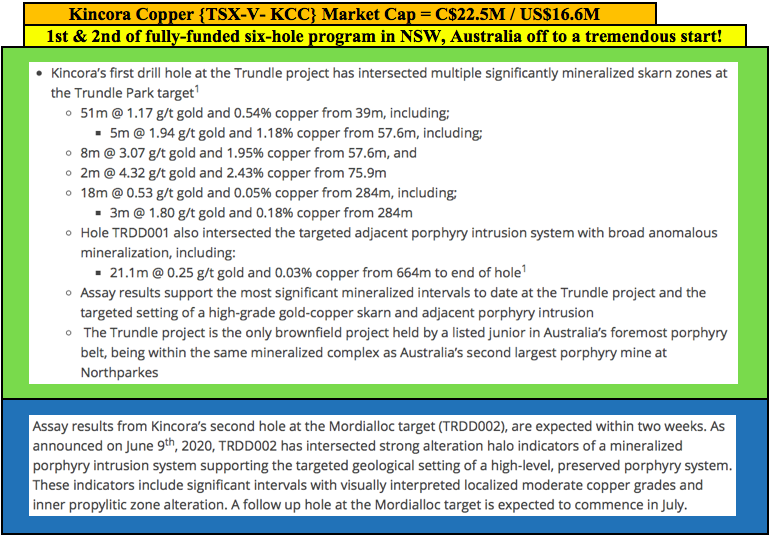
Investors in Kincora Copper (TSX-V: KCC) have had to be patient in allowing management to explore for really big prizes in Mongolia & New South Wales, Australia. This week we learned that it was well worth the wait. On July 6th, the Company announced an excellent drill result intersecting multiple mineralized skarn zones at its Trundle Park target in Australia’s foremost porphyry region. {see July corporate presentation}
The results are noteworthy for at least three reasons; there’s considerable near-surface, high-grade mineralization, as the first of six holes, even better assays could follow (leveraging knowledge gained from this result), and further evidence of an adjacent porphyry system was found.
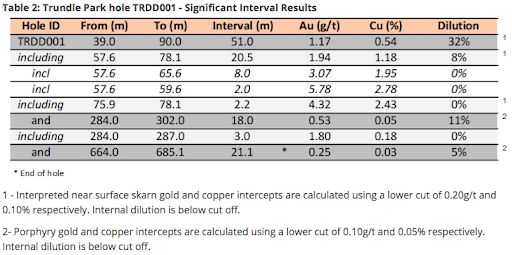
By far the best mineralization is from (39m to 90m) depth. This 51m interval hit 1.17 g/t Au + 0.54% Cu. Included in the 51m is one meter, from 57.6m, of 10.4 g/t Gold (“Au“) + 4.4% Copper (“Cu“). See image below.
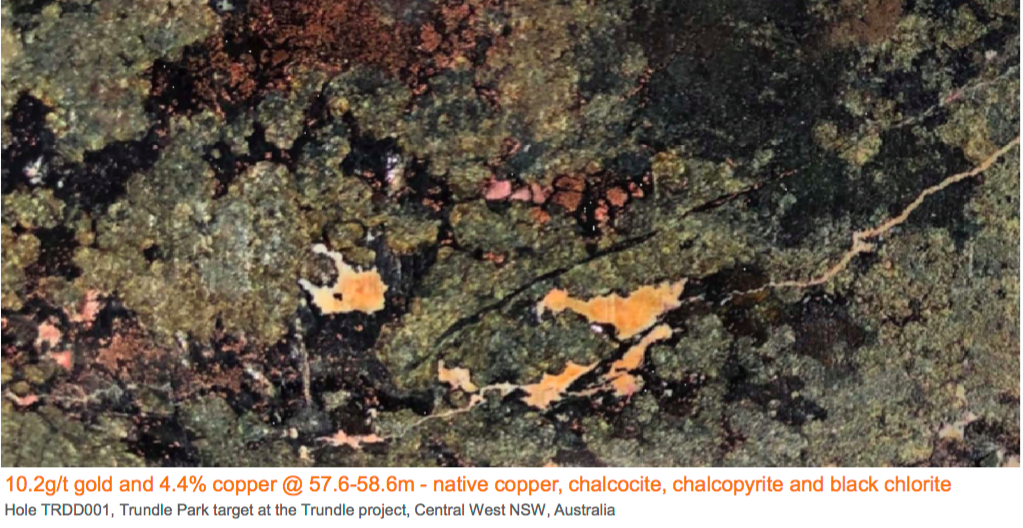
51m, less than 90m deep — very good grades + a porphyry teaser at depth
At current gold & copper prices of US$1,793/oz. & US$2.78/lb., this is an in-situ rock value of ~US$100 = ~C$135.5/tonne. In gold terms, it’s 1.75 g/t Au equiv. In copper terms, 1.64% Cu Equiv. Note, these strong grades will not be indicative of the overall deposit. However, this hole suggests the potential for a nearer-term, standalone open pit.
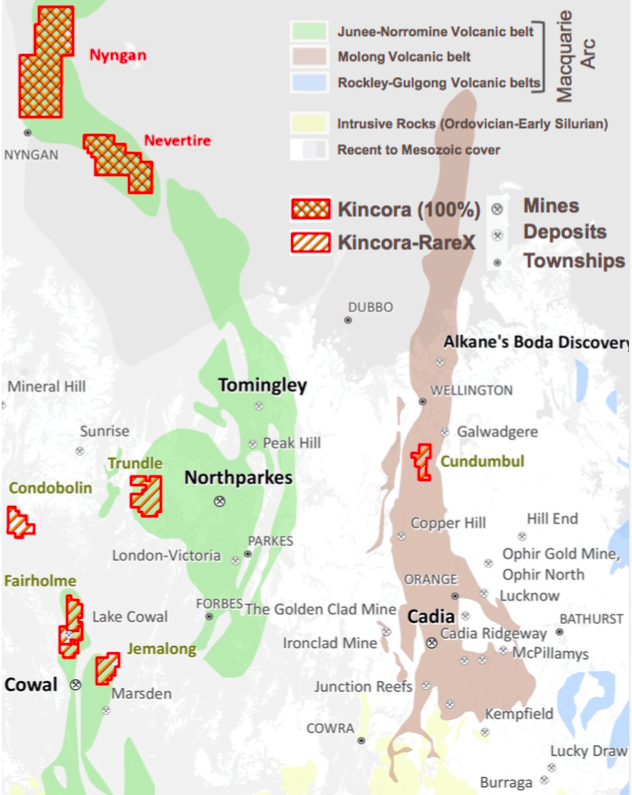
That’s the sexy part of the assay, the hole also intersected a targeted adjacent “porphyry intrusion system” with broad anomalous mineralization. This assay delivered the most significant intervals to date. Management notes that Trundle is the only brownfield project held by a listed junior in Australia’s foremost porphyry district, the Lachlan Fold Belt (“LFB“).
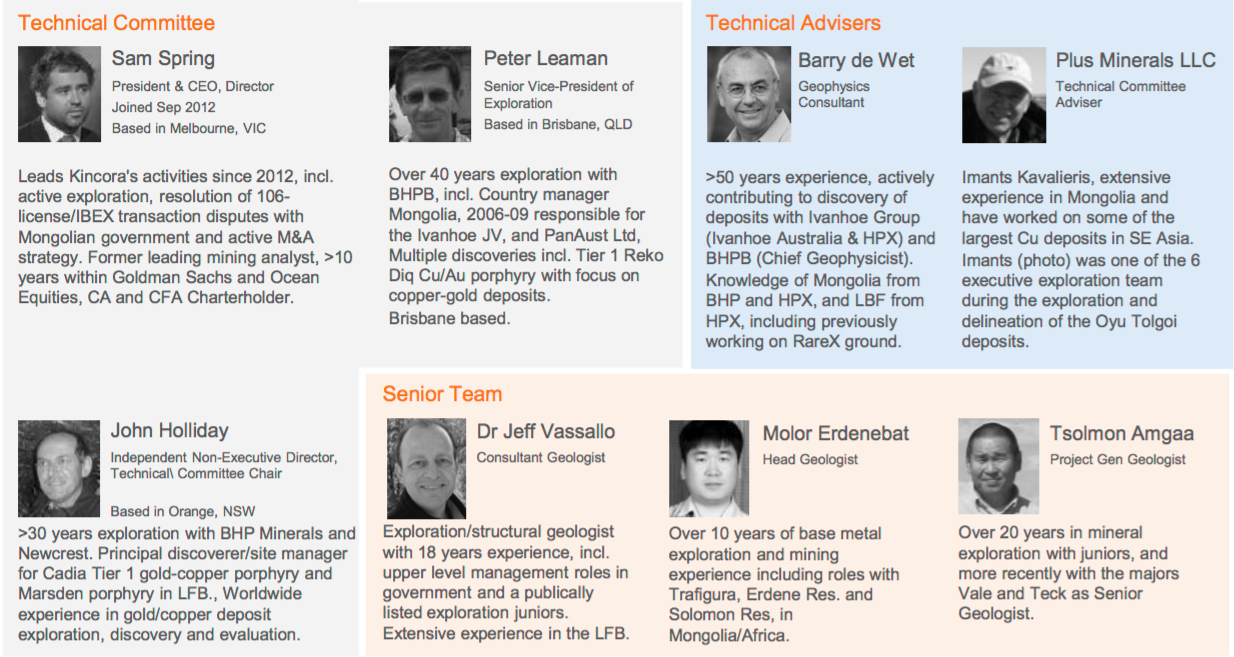
John Holliday, Technical Committee Chair, & Peter Leaman, Senior VP of Exploration commented,
“We are extremely pleased & excited by the results of this first hole. It’s not often one sees such high grades near surface within a porphyry environment. Assay results prove previously announced visual interpretations of multiple zones of significant gold & copper mineralization. This supports the skarn being a standalone target at depths & intervals often mined by open cut & underground methods….
“…. These results from this first hole at the Trundle target, plus visual indications from the second hole 8.5 km north at the Mordialloc target, are very encouraging. The Trundle project appears to sit within the interpreted Northparkes Intrusive Complex, placing Kincora in a unique global setting as the only listed junior exploring a large system in a brownfield field setting.”
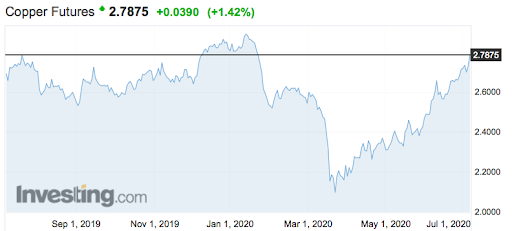
BREAKING: Dr. Copper, “reports of my death are greatly exaggerated“
The timing of the press release could hardly be better. Copper has bounced back strongly from US$2.10/lb. in mid-March to US$2.78/lb., +32%. Dr. Copper has spoken loud & clear. He/she believes that, even if temporarily slowed, the global electric transportation & green energy revolutions are alive and well.
Dr. Copper is leaning towards a V-shaped recovery. Others seem to agree, look no further then Tesla’s > C$300 Billion valuation for evidence of market sentiment on electric vehicles!
In addition to copper’s irreplaceable role in electric transportation & renewables, copper demand will increase if/when the world’s major economies embark on infrastructure massive spending sprees. Giant infrastructure builds / rebuilds (bridges, tunnels, airports, stadiums, etc.) are highly copper-intensive.
Even if copper demand is tepid, the supply response to the pandemic has been dramatic. Reduced production from countries such as Chile, (where per-capita COVID-19 cases are among the worst in the world), Peru, the DRC and others, will last several more quarters. Chile is by far the largest producer, larger than the next three copper-producing countries combined in 2019.
It took three paragraphs to sound off on copper, but just one on gold. For years’ gold bugs have pointed to fiat currencies, deficit spending, debt issuance, money printing, imminent inflation, etc. — pushing gold to US$5k or US$10k/oz., “next year!!” Next year has finally arrived. I’m not predicting US$5k+/oz. anytime soon, but gold fundamentals are as strong as ever. Bull markets in precious metals last years, not months. Gold is up 31% from its US$1,368/oz. low of March.
A single hole, but a tonne of de-risking as exploration models validated
Turning back to this hole at Trundle, the first of two each at three targets in an ongoing 3,800m program. This single assay delivered meaningful de-risking of the Kincora story. Positive visual inspection of the core was verified by strong results that largely confirmed the team’s targeted geological model & exploration strategy. This is critical, because a fear investors have with junior miners is that even talented management teams will run out of money before finding anything promising.
That risk has been moderately reduced, (but not eliminated). If results from hole #2 at the Mordialloc target, 8.5 km north of hole #1, are as good or better, Kincora’s valuation might look undervalued compared to peers such as Magmatic Resources, Sky Minerals and Stavely Minerals that have an average market cap of ~C$80M vs. ~C$25M for Kincora.
To be clear, none of these companies measure up to Alkane Resources’ C$700M market cap, but one cannot rule anything out at this early stage. So far, just two winners of six holes, but we now know there’s smoke at Trundle. Will any of the next four holes find fire?
Let’s take a step back to revisit the bigger picture. High-grade, near-surface skarn mineralization is exciting, but the pot of gold/copper at the end of the rainbow is one or more porphyry deposits. Results from the first hole, and anticipated results from hole #2, represent a meaningful step closer to the pot of gold/copper.
Director John Holliday has said on the record that he thinks after Alkane’s Boda project, Kincora has the best porphyry play in the district. Likewise, CEO Sam Spring believes Kincora is the leading pure-play porphyry explorer in Australia’s LFB. Make no mistake, they’re biased!
Still, unlike many junior gold / copper districts around the world, there are relatively few juniors active in the area. I mentioned three, there are about a dozen with meaningful flagship projects in the region. By contrast, Canada’s Golden Triangle has three dozen, or more.
Readers are invited to view Kincora’s July corporate presentation. On pages 29 & 30, management places their drill result into context. While the first drill hole at Trundle did not contain the highest grades or widest intercepts, its high-grade mineralized zones are closer to surface than some peers. AND, THIS IS JUST THE FIRST HOLE!
The skarn & porphyry intrusion system setting intersected is common among large porphyry systems. For example, in the Macquarie Arc, the Big & Little Cadia skarns at Cadia were important to the discovery of multiple adjacent “causative intrusions & deposits” that make up the largest porphyry system in Australia. Kincora’s strategy is to drill to depths at which porphyries at Cadia, Northparkes, Cowal & Boda are situated.
Management, Board & Technical Team — Now the hard part….
The management, Board, technical team & advisers share in this initial exploration success. But, where does this leave the Company? I think the considerable strength of Kincora’s team will be amplified in coming months as it leverages the valuable knowledge gained from the first six holes. Kincora found smoke at Trundle, it’s now trying to locate the porphyry fire.
CEO Spring provided me with this exclusive quote,
“What we intersected near-surface in hole #1 is a skarn. What we’re testing for in hole #2, and at the bottom of hole #1, is a porphyry (the presumed source of mineralization in the skarn). At the Mordialloc target, hole #2, we don’t see a skarn – we knew that, only a porphyry was the target. What we intersected in hole #2 suggests that we’re closer to the core of a porphyry system (which if you hit can easily be a company maker) than in hole #1, without yet hitting it.”
While some investors are rightfully congratulating the team, I suggest that their jobs have only just begun. Now that we know there’s PROBABLY something meaningful (although not necessarily economic) at Trundle, the pressure is on to advance the project efficiently & cost-effectively. This is where tremendous experience & skill sets come into play. In looking at the bios, we have Mr. McRae with nearly 30 years’ at Rio Tinto Pres. & CEO of three of Rio’s segments.
Mr. Lehman has > 40 years’ experience, mostly with BHP, including Tier 1 discoveries under his belt. He’s a world-renown expert in copper & gold deposits. Mr. Holliday, based in NSW, has > 30 years’ with BHP & Newcrest. A principal discoverer of the world-class Cadia copper-gold porphyry in NSW. Very few, if any, are better suited to lead Kincora’s technical team.
CEO Sam Spring has been a senior exec at Kincora for eight years. Prior he held a number of positions including lead mining / metals analyst at Goldman Sachs & various roles evaluating, advising or negotiating M&A activities in multiple jurisdictions. Readers are encouraged to also review the bios of other highly talented contributors above & below. This is a group who have done this before; discovered, developed, permitted, constructed, funded & commissioned mines.

I doubt Kincora is going to ride this horse across the finish line, but the experts working on Trundle, and Kincora’s other high profile targets in NSW, understand exactly what potential acquirers are looking for. They’ve created vast shareholder wealth in past endeavors. With continued successes they’re on track to potentially deliver another exciting outcome for Kincora Copper’s (TSX-V: KCC) stakeholders.
Disclosures: The content of this article is for information only. Readers fully understand and agree that nothing contained herein, written by Peter Epstein of Epstein Research [ER], (together, [ER]) about Kincora Copper, including but not limited to, commentary, opinions, views, assumptions, reported facts, calculations, etc. is not to be considered implicit or explicit investment advice. Nothing contained herein is a recommendation or solicitation to buy or sell any security. [ER] is not responsible under any circumstances for investment actions taken by the reader. [ER] has never been, and is not currently, a registered or licensed financial advisor or broker/dealer, investment advisor, stockbroker, trader, money manager, compliance or legal officer, and does not perform market making activities. [ER] is not directly employed by any company, group, organization, party or person. The shares of Kincora Copper are highly speculative, not suitable for all investors. Readers understand and agree that investments in small cap stocks can result in a 100% loss of invested funds. It is assumed and agreed upon by readers that they will consult with their own licensed or registered financial advisors before making any investment decisions.
At the time this article was posted, Kincora Copper was an advertiser on [ER] and Peter Epstein owned shares in the Company.
Readers understand and agree that they must conduct their own due diligence above and beyond reading this article. While the author believes he’s diligent in screening out companies that, for any reasons whatsoever, are unattractive investment opportunities, he cannot guarantee that his efforts will (or have been) successful. [ER] is not responsible for any perceived, or actual, errors including, but not limited to, commentary, opinions, views, assumptions, reported facts & financial calculations, or for the completeness of this article or future content. [ER] is not expected or required to subsequently follow or cover events & news, or write about any particular company or topic. [ER] is not an expert in any company, industry sector or investment topic.
Gold, silver, and their miners’ stocks suffer their weakest seasonals of the year in early summers. With traders’ attention normally diverted to vacations and summer fun, interest in and demand for precious metals usually wane. Without outsized investment demand, gold tends to drift sideways dragging silver and miners’ stocks with it. Feared as the summer doldrums, sometimes unusual catalysts short-circuit them.
This doldrums term is very apt for gold’s summer predicament. It describes a zone in the world’s oceans surrounding the equator. There hot air is constantly rising, creating long-lived low-pressure areas. They are often calm, with little or no prevailing winds. History is full of accounts of sailing ships getting trapped in this zone for days or weeks, unable to make headway. The doldrums were murder on ships’ morale.
Crews had no idea when the winds would pick up again, while they continued burning through their limited stores of food and drink. Without moving air, the stifling heat and humidity were suffocating on these ships long before air conditioning. Misery and boredom were extreme, leading to fights breaking out and occasional mutinies. Being trapped in the doldrums was viewed with dread, it was a very trying experience.
Gold investors can somewhat relate. Like clockwork heading into most summers, gold starts drifting listlessly sideways. It often can’t make significant progress no matter what trends looked like heading into June, July, and August. As the days and weeks slowly pass, sentiment deteriorates markedly. Patience is gradually exhausted, supplanted with deep frustration. Plenty of traders capitulate, abandoning ship.
June and Julies in particular are often desolate sentiment wastelands for the precious metals, devoid of recurring seasonal demand surges. Unlike most of the rest of the year, the summer months simply lack any major income-cycle or cultural drivers of outsized gold investment demand. Summer 2019 proved an exception on a major gold-bull breakout, and summer 2020 is looking like another on extreme Fed money printing.
Quantifying gold’s summer seasonal tendencies during bull markets requires all relevant years’ price action to be recast in perfectly-comparable percentage terms. That is accomplished by individually indexing each calendar year’s gold price to its last close before market summers, which is May’s final trading day. That is set at 100, then all gold-price action each summer is recalculated off that common indexed baseline.
So gold trading at an indexed level of 105 simply means it has rallied 5% from May’s final close, while 95 shows it is down 5%. This methodology renders all bull-market-year gold summers in like terms. That’s necessary since gold’s price range has been so vast, from $257 in April 2001 to $1894 in August 2011. That span encompassed gold’s last secular bull, which enjoyed a colossal 638.2% gain over those 10.4 years!
While that mighty gold bull ran from 2001 to 2011, 2012 was technically a bull year too since a 20%+ drop back into formal bear territory wasn’t yet seen. That finally came in Q2’13, where gold plummeted 22.8% in its worst quarterly performance in 93 years. The Fed’s unprecedented open-ended QE3 campaign was ramping to full speed, levitating stock markets which slaughtered demand for alternative investments led by gold.
The resulting gold-bear years ran from 2013 to 2015, which need to be excluded since gold behaves very differently in bull and bear markets. That ultimately pounded gold to a 6.1-year secular low in December 2015, which helped birth today’s gold bull. It has gradually powered higher on balance ever since, never suffering any bull-slaying 20%+ selloffs. So 2016 to 2020 have proven gold-bull years to add into this analysis.
When all gold’s summer price action from these modern gold-bull years is individually indexed and thrown into a single chart, this spilled-spaghetti mess is the result. 2001 to 2012 and 2016 to 2018 are rendered in yellow. Last summer’s action is shown in light blue for easier comparison with this summer. Seeing all this perfectly-comparable indexed summer price action at once reveals gold’s center-mass-drift tendency.
These summer seasonals are further refined by averaging together all 16 of these gold-bull years into the red line. Finally gold’s summer-to-date action this year is superimposed over everything else in dark blue, showing how gold is performing compared to its seasonal mean. So far in summer 2020 gold has been meandering roughly in line with seasonal expectations, although a couple big catalysts could change that.
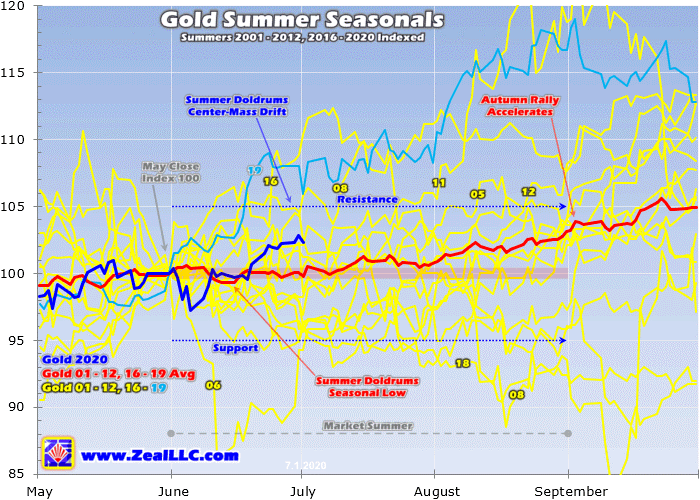
While there are outlier years, gold generally drifts listlessly in the summer doldrums much like a sailing ship trapped near the equator. The center-mass-drift trend is crystal-clear in this chart. The vast majority of the time in June, July, and August, gold simply meanders between +/-5% from May’s final close. This year that equates to a probable summer range between $1645 to $1818. Gold tends to remain within trend.
Interestingly “gold summer doldrums” is increasingly a misnomer as more gold-bull years slowly reshape the seasonal average. Gold’s summer seasonal low statistically has been gradually pushed all the way back to mid-June. On June’s 11th trading day, which translated to June 15th this summer, gold has tended to carve its summer seasonal low. The worst of gold’s weak seasonals pass quickly in early summers!
At that mid-June nadir, gold has only been down an average of 0.7% from May’s close. From there this metal actually tends to start climbing again into July and especially August. In average indexed terms, gold has tended to eke out 0.1% gains in Junes. They’re the real doldrums. Gold’s momentum starts building to 0.7% gains in Julies, then really accelerates into summer-ends with hefty 2.3% gains in Augusts!
Between that average seasonal low in mid-June and the end of August, gold has averaged impressive 3.8% summer rallies in these modern bull-market years. The summer doldrums have been compressed into a shorter time frame by a couple outlier years in today’s secular gold bull. They are its maiden 2016 summer and last summer. Those gold outperformances prove that catalysts can fuel counter-seasonal demand.
Summer 2016 was this gold bull’s first, where gold enjoyed strong upside price momentum and bullish psychology heading into the summer doldrums. Investors love chasing winners, and kept on piling into gold as it carved major new secular highs. By early July, gold had soared 12.3% summer-to-date! But that left gold super-overbought so those gains faded, yet this metal still surged 7.7% in that whole summer.
Gold bucked the summer doldrums in 2016 because gold investment demand was exceptionally strong. Several weeks ago I wrote an essay explaining why the best daily proxy for global gold investment is the physical-gold-bullion holdings of the leading and dominant American GLD SPDR Gold Shares gold ETF. When stock investors are flooding into gold via GLD shares chasing momentum, their buying forces gold higher.
Gold blasted up 12.3% from the end of May into early July 2016 because American stock investors were buying GLD shares much faster than gold itself was being bought. Their differential demand forced GLD’s holdings 13.1% higher in roughly that same early-summer span. Out of 24 summer trading days into early July, 18 saw GLD-holdings builds averaging a sizable 0.7% each! Investment capital was pouring in.
Gold ETFs like GLD and the American IAU iShares Gold Trust, the second-largest gold ETF in the world after GLD, are designed to track the gold price. This is only achievable if they shunt all excess ETF-share demand and supply into the underlying world gold market. When gold-ETF shares are being bought faster than gold, ETF-share prices threaten to decouple from gold to the upside and fail their tracking mission.
So gold-ETF managers must offset excess demand by issuing enough new gold-ETF shares. Then they use the proceeds from these sales to buy more physical gold bullion to hold in trust for their shareholders. So when gold-ETF holdings are rising, it shows stock-market capital is flowing into gold. While that is unusual during market summers, it does happen if gold enjoys a sufficient catalyst to attract investors’ interest.
Summer 2019 proved another great example of this. After that initial investment-fueled bull-market peak in early-July 2016, gold failed to climb to more new bull-market highs for several years. But late last June, gold finally managed its next decisive bull-market breakout after dovish Fed interest-rate projections hammered the US dollar. The resulting new gold-bull highs really excited investors, who piled in to chase the upside.
So last summer as the light-blue line shows, gold rocketed 16.7% higher in one of its best performances out of all gold-bull summers! Investors flooded into gold because it was rallying fast, enticing in even more investment capital in an awesome virtuous circle of buying. Again summer 2019’s counter-seasonal gold investment demand was evident in GLD’s holdings. They soared a massive 18.2% higher last summer!
And gold’s upside potential this summer is far greater than normal due to this same momentum-chasing investment phenomenon. Gold investment soared after mid-March’s stunning stock panic on the dire economic impact of governments’ draconian lockdowns to slow the spread of COVID-19. That drove gold to major new bull-market highs challenging $1750 by late May. So investors piled in to ride gold’s big gains.
The major gold ETFs continued to enjoy strong differential share demand in June, with GLD and IAU seeing major holdings builds of 5.0% and 3.2% last month! That came during one of gold’s weakest months seasonally, and is likely to grow as gold strengthens in July and August. Gold being driven to new highs by investment demand is self-feeding, the higher gold rallies the more investors want to buy to participate.
And it’s not just the rapidly-improving seasonals in July and August that bode well for gold. This summer has a couple of unusual catalysts which ought to spawn outsized investment demand. The first and most-important is the Fed’s radically-unprecedented extreme monetary inflation unleashed to goose stock markets out of their deep panic lows. The Fed feared the resulting negative wealth effect would spawn a depression.
So between mid-March to early June, the Fed’s balance sheet skyrocketed 66.2% higher in just 2.8 months! That blasted the US-dollar supply an astounding $2,853.3b higher. With 2/3rds more dollars just conjured out of thin air to bid up prevailing price levels on shrinking pools of goods and services, there’s never been a more-important time to own gold. Prudent investors are buying with that inflation tsunami hitting.
Gold investment demand also surges when stock markets are weakening or expected to weaken. Gold is the ultimate portfolio diversifier since it is negatively correlated with material stock selloffs. So as what looks like a monster bear rally in US stocks driven by the Fed’s near-hyperinflation inevitably rolls over, gold investment demand should strengthen considerably. Gold has a very-bullish setup in this summer of 2020!
For many years I’ve thrown in silver and the gold miners’ stocks in my gold-summer-doldrums analyses. Gold’s fortunes drive the entire precious-metals complex. Silver and precious-metals miners’ stocks are effectively leveraged plays on gold. Their summer behavior mirrors and amplifies whatever is happening in gold. So if gold enjoys outsized gains this summer, silver and their miners’ stocks ought to do even better.
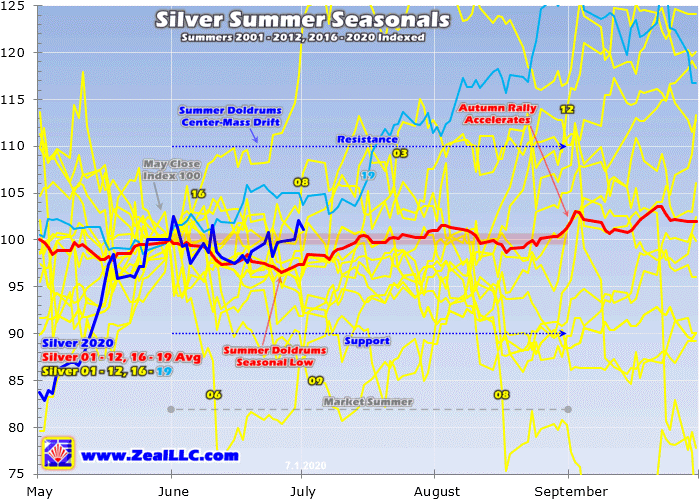
This silver-summer-seasonals methodology is the same as gold’s, showing how it has fared during gold’s modern bull-market years. With a far-smaller global market, silver is much-more volatile than gold. So its center-mass summer drift is wider, running +/-10% from May’s final close. That implies a summer range between $16.04 to $19.60 this year. But silver’s summer seasonals have proven weaker overall than gold’s.
Silver’s summer-doldrums seasonal low tends to arrive a couple weeks after gold’s in late June. That is averaging June’s 20th trading day, which translated to June 26th this year. And that saw silver being down 3.5% summer-to-date, much worse than gold’s 0.7% average droop at its own summer seasonal low. Silver’s overall seasonal performance in market summers is considerably worse than gold’s too.
On average in 2001 to 2012 and 2016 to 2019, silver merely edged up 1.3% between the end of May to the end of August. That is dwarfed by gold’s far-superior 3.1%! Silver’s big relative underperformance in summers is likely sentiment-related. Investors usually don’t flock to silver unless gold itself is running in an exciting and noticeable way. And gold’s average gradual summer rallies don’t usually rise to that standard.
When gold enjoyed outsized summer surges like in those summers of 2016 and 2019, silver responded with great 16.8% and 25.8% summer rallies! But when gold just grinds modestly higher like summer 2017’s 4.2% gain, that doesn’t garner enough investor attention for silver to amplify its upside. That year the white metal lagged with a little 1.4% summer gain. Silver needs big gold uplegs to entice major capital inflows.
Thankfully the gold stocks aren’t so picky, tending to leverage gold’s summer gains whether they prove big and outsized or small and uninspiring. For gold-stock summer seasonals, I’m using the older HUI gold-stock index which closely mirrors the GDX VanEck Vectors Gold Miners ETF more popular today. Since GDX was only launched in May 2006, it has insufficient price history to match these modern gold-bull years.
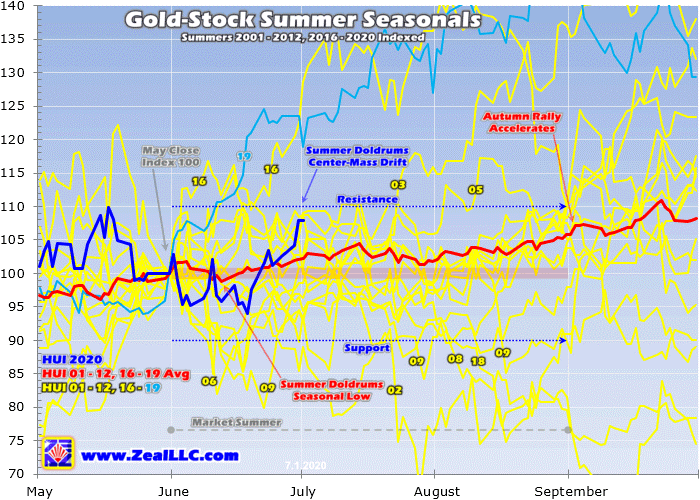
This same summer-seasonality methodology applied to the HUI shows gold stocks track and amplify gold’s fortunes far better than silver. The more-volatile gold stocks also have a wider center-mass-drift summer trading range of +/-10% from May’s final close. In HUI terms that runs from 246.0 to 300.7 this year. Applied to GDX, that equates to a likely summer-2020 trading range running from $30.89 to $37.75.
Interestingly gold stocks’ average summer-doldrums low is on June’s 10th trading day, which shook out to June 12th this year. That is right in line with gold’s own summer seasonal low. The gold stocks per the HUI tend to slump 1.3% by then from May’s close, which amplifies gold’s early-summer weakness by 1.9x. The major gold stocks of the HUI and GDX generally tend to leverage material gold moves by 2x to 3x.
On average from 2001 to 2012 and 2016 to 2019, the gold stocks have rallied 2.0% in Junes, slumped 0.3% in Julies, and then finished summers strong with big 4.0% surges in Augusts. This compares to +0.1%, +0.7%, and +2.3% for gold in these same market-summer months. Overall from the end of May to the end of August, the HUI has averaged 5.8% summer gains. That’s again 1.9x gold’s 3.1% mean rally.
Like silver to a lesser extent, the gold stocks fare best during market summers when gold is surging fast enough to generate excitement. That entices traders enjoying summers’ many pleasures back to markets to buy in and chase those gains. During gold’s outperforming summers of 2016 and 2019 driven by that strong investment demand, the HUI rallied 10.1% and a massive 45.3% on gold’s 7.7% and 16.7% gains!
That made for 1.3x and 2.7x upside leverage to gold in those summers of 2016 and 2019. The latter is excellent, showing how important it is to own gold miners when gold is enjoying counter-seasonal strong summer investment demand. The former is only light because gold and thus gold stocks peaked in mid-summer 2016 before slumping into its end. By early August 2016, the HUI had soared 41.4% summer-to-date!
That made for far-more-impressive 3.4x amplification of gold’s summer surge by its miners’ stocks. The gold stocks have generally performed fairly well during modern gold-bull summers. They’ve enjoyed a solid average summer rally seasonally, but surge dramatically when gold is being bid higher by strong investment demand. So the gold summer doldrums usually don’t live up to their fearsome reputation.
These weak gold seasonals don’t encompass entire market summers, but have been compressed into early Junes on average. From those mid-month seasonal lows, gold and the gold stocks tend to start marching higher into summer-ends leading into their big autumn rallies. Silver isn’t as responsive, but still follows this seasonal pattern to a lesser extent. Summer seasonal weakness in precious metals is usually modest.
And summer 2020 has good potential for outsized gold gains again. Following March 2020’s brutal stock panic and subsequent crazy-extreme Fed money printing, gold investment demand proved very strong leading into summer. And it has remained strong through its first third, or June. So it’s probably a decent time to add to positions in fundamentally-superior gold and silver miners’ stocks if you aren’t sufficiently deployed.
At Zeal we started aggressively buying and recommending fundamentally-superior gold and silver miners in our weekly and monthly subscription newsletters back in mid-March right after the stock-panic lows. We’ve been layering into new positions ever since, with unrealized gains already growing huge. Today our trading books are full of these fundamentally-thriving gold and silver miners that aren’t done running yet.
To profitably trade high-potential gold stocks, you need to stay informed about the broader market cycles that drive gold. Our newsletters are a great way, easy to read and affordable. They draw on my vast experience, knowledge, wisdom, and ongoing research to explain what’s going on in the markets, why, and how to trade them with specific stocks. Subscribe today and take advantage of our 20%-off sale! Use this typical summer lull to mirror our many winning trades before gold stocks start surging again.
The bottom line is the gold summer doldrums in modern bull years have usually proven much milder than feared. The seasonal weakness tends to be compressed into early June, with gold and its miners’ stocks carving summer lows in mid-June on average. From there gold and gold stocks usually rally on balance in July and August, with gains really accelerating into summer-end. That’s heading into gold’s big autumn rally.
And summer 2020 has excellent potential to see outsized gold gains on big counter-seasonal investment demand. Gold’s strong upside momentum to major new secular highs in the wake of March’s stock panic has generated major investment-capital inflows. And investors are likely to keep buying on balance with the Fed’s near-hyperinflation and resulting precarious stock-market extremes. That’s really bullish for gold.
Adam Hamilton, CPA
July 2, 2020
Copyright 2000 – 2020 Zeal LLC (www.ZealLLC.com)
If you would like to receive our free newsletter via email, simply enter your email address below & click subscribe.
 Follow us on Twitter
 Become our facebook fan
CONNECT WITH US
Tweets
Tweet with hash tag #miningfeeds or @miningfeeds and your tweets will be displayed across this site.
MOST ACTIVE MINING STOCKS
Daily Gainers
 CMC Metals Ltd. CMC Metals Ltd. |
CMB.V | +900.00% |
 Eden Energy Ltd Eden Energy Ltd |
EDE.AX | +200.00% |
| GoviEx Uranium Inc. |
GXU.V | +42.86% |
| Eagle Nickel Ltd. |
ENL.AX | +41.67% |
| Citigold Corp. Limited |
CTO.AX | +33.33% |
| Mount Burgess Mining NL |
MTB.AX | +33.33% |
| Exalt Resources Limited |
ERD.AX | +31.94% |
| Casa Minerals Inc. |
CASA.V | +30.00% |
| Cariboo Rose Resources Ltd |
CRB.V | +28.57% |
| Belmont Resources Inc. |
BEA.V | +28.57% |


