
The silver miners’ stocks have had a roller-coaster ride of a year, getting sucked into March’s stock panic before skyrocketing out in a massive upleg. While much-higher prevailing silver prices radically improve silver-stock fundamentals, Q2’s national economic lockdowns to fight COVID-19 wreaked havoc on this sector. The silver miners’ latest quarterly results recently released revealed unprecedented challenges.
The silver-stock realm is tiny, as there aren’t many major silver miners in the world. Only a handful are primary silver producers, companies deriving over half their revenues from silver. So in mid-August as silver miners finished reporting their latest Q2’20 operational and financial results, this sector’s leading benchmark and trading vehicle only held $1.1b in net assets. It is the SIL Global X Silver Miners ETF.
2020’s silver-stock price action has proven neck-snappingly violent. In just several weeks into mid-March, SIL plummeted 43.8% as silver got entangled in that government-lockdown-spawned stock panic. That climaxed in a full-blown crash, with SIL cratering 27.4% in the final couple trading days alone! Silver and its miners’ stocks were extraordinarily out of favor, an exceptional buying opportunity for contrarian traders.
Silver ferociously V-bounced out of those extreme stock-panic lows, sending silver stocks stratospheric. Over the next 4.8 months into early August, SIL skyrocketed 176.9% higher! While any sector nearly tripling in such a short period of time is incredible, the silver stocks were actually underperforming. The metal they mine blasted 142.8% higher during that span, so SIL’s upside leverage was quite weak at 1.2x.
In late July, silver started shooting parabolic as stock traders flooded into its leading SLV ETF. That left silver exceedingly overbought, so a correction was necessary to bleed off the euphoria and rebalance sentiment. That started with a bang, silver cratering 15.2% in a single trading day! That hammered SIL 13.1% lower by mid-August, silver stocks entered their own correction as their Q2 results were being released.
And they sure weren’t going to be pretty! Last quarter’s national-economic-lockdown orders to slow the spread of COVID-19 hit major silver-producing countries disproportionally hard. According to the latest comprehensive data from the venerable Silver Institute, the world’s top two silver-mining jurisdictions are Mexico and Peru. In 2019 they accounted for 23% and 16% of the total global mined silver output, 4/10ths!
Unlike the Silver Institute which only publishes global silver supply-and-demand numbers annually, the World Gold Council updates its best-available gold fundamental data quarterly. In its Q2 Gold Demand Trends report, WGC analysts revealed the stunning magnitude of the countrywide lockdowns officials imposed on Mexico and Peru. Their gold production plummeted a catastrophic 62% and 45% YoY in Q2!
Mining in Mexico was suspended for a jaw-dropping 60 days last quarter! And with that leading silver-producing country being the primary mining destination for American and Canadian silver miners, their forced production hits were colossal. Adding to Q2’s unprecedented operational challenges, silver prices were relatively anemic. While silver did soar 30.7% in Q2 proper, its quarterly average price merely rose 9.9% YoY.
That way underperformed the enormous 30.9% gain in average gold prices from Q2’19 to Q2’20! The recent parabolic fireworks in silver didn’t start until mid-July after quarter-end. Of that gargantuan 142.8% silver upleg after the stock panic, only 1/4th happened during Q2. With silver averaging just $16.36 last quarter, I started my usual deep dive into the major silver miners’ latest results with plenty of trepidation
This was my 17th quarter in a row analyzing how the world’s biggest and best silver miners are faring fundamentally. While SIL included 27 component stocks in mid-August as Q2’s earnings season was wrapping up, I limited my research to its top 15 holdings. They commanded a dominant 90.8% of SIL’s total weighting. These silver giants mostly trade on stock exchanges in the US, UK, Canada, and Mexico.
That makes amassing their quarterly data somewhat challenging, with reporting varying considerably in different countries and companies. In cases where half-year data was all that was offered, I split it in half to approximate Q2 results. The highlights of all those quarterly reports are included in this table. Stock symbols are listings from companies’ primary exchanges, with the majority of the SIL top 15’s outside the US.
That’s preceded by their ranking changes in terms of SIL weightings between Q2’19 to Q2’20. And it is followed by these major silver miners’ current SIL weightings as the Q2 earnings season concluded in mid-August. Then each company’s quarterly silver and gold production in ounces is shown, followed by their year-over-year changes from Q2’19. Their silver output can be used to gauge relative silver purity.
The higher their percentage of quarterly revenues derived from silver production, the more responsive miners’ stock prices are to silver price action. The next column shows this metric of silver-centricness. It is mostly calculated by multiplying companies’ quarterly silver outputs by silver’s average price in Q2, then dividing those results by quarterly revenues. When sales aren’t reported, this can instead be approximated.
For half-year-reporting silver miners where Q2 was an interim quarter, those implied silver revenues can be divided by implied gold-plus-silver sales. But that method is inferior since it excludes base-metals byproducts. According to the Silver Institute, only 29% of all the silver mined worldwide in 2019 came from primary silver mines. 32% was a byproduct from mining lead and zinc, with another 23% from copper.
The rare primary silver miners’ silver-purity percentages are highlighted in blue. Their stock prices often show the highest leverage to silver. That is followed by cash costs per ounce and all-in sustaining costs per ounce, along with their year-over-year changes. They reveal how much it costs the SIL-top-15 silver miners to blast their metal loose from the earth and process it. Finally comes quarterly revenues and profits.
Blank data fields mean a company hadn’t reported that particular data by mid-August as Q2’s earnings season was ending. And percentage changes aren’t included if they would either be misleading or not meaningful. The main examples are comparing two negative numbers and when data shifts from positive to negative or vice versa over this past year. As feared given Q2’s lockdown environment, operations were ugly!
Together the SIL-top-15 silver miners only produced 53.9m ounces of silver last quarter. That was the lowest by far in the 17 quarters I’ve been working on this research thread, collapsing 26.0% YoY! The major silver miners naturally have big exposure in Mexico and Peru, where governments forced national lockdowns to combat COVID-19. Those sweeping orders included the usually-remote silver miners.
Some of these major silver miners pushed hard for exemptions, as their operations are highly pandemic-resistant. Silver mines are usually way out in the mountains, with access limited and tightly controlled. The silver miners quickly implemented mitigation efforts to detect any infected workers and quarantine them. Forcing silver mines into care and maintenance made little sense economically or epidemiologically.
First Majestic Silver, which SIL includes through its Canadian listing FR, operates exclusively in Mexico where the lockdowns persisted for 2/3rds of Q2. Early last quarter this company had already “been working with local and state officials, industry task force groups and other mining companies to make the case to the Federal Government that mining, especially silver mining, is essential and critical to the medical industry”.
But those efforts to persuade the Mexican government to reopen the mines mostly proved unsuccessful. First Majestic’s silver output plummeted 42.6% YoY with its Mexican operations arbitrarily mothballed! Other SIL-top-15 silver miners saw similar collapses in their output from Mexico, including Pan American Silver. Its overall Q2 silver production cratered 56.9% YoY, because of its mining operations in Mexico and Peru.
31% and 43% of this company’s 2019 sales came from those countries, so their long national lockdowns slammed its production. In its Q2 report Pan American warned, “The global COVID-19 pandemic had a significant impact on Q2 results, with all our Latin American operations placed in care and maintenance mode for periods of time during the quarter.” Buenaventura, Peru’s largest gold miner, fared even worse.
Its silver production crashed 63.9% YoY in Q2 due to its Peruvian mining concentration! That country declared an extended State of Emergency, crushing the miners operating there. There has been a huge global silver-supply impact from governments’ draconian overreactions to COVID-19. Those severe supply constraints imposed by decree likely contributed to silver’s parabolic surge to extreme overboughtness.
Rather troublingly in Mexico, some large politically-connected miners appeared more equal than others in apparently being largely exempted from the lockdowns. The Mexican Fresnillo is the world’s largest silver miner, producing about 1/16th of the total global output in 2019. Despite extensive operations in Mexico, somehow its silver output only slipped 5.7% YoY! That seems impossible with 2/3rds of Q2 locked down.
That company reported “Production at our underground mines was relatively unaffected by COVID-19 in 2Q20” and “Production at our underground mines remains broadly in line with plan, despite a reduction in the number of workers on site. The impact on our open pit gold mines has been greater, as mining activities had to cease for around six weeks, although processing continued.” Did Fresnillo get a special deal?
Mexico has long been notorious for rampant government corruption, and such a giant mining company has to have high-level political connections. Another Mexican mining giant, Industrias Penoles which spun off Fresnillo back in May 2008, also reported a mere 4.6% YoY decline in silver output last quarter. That stable production through the lockdown orders sure seems suspicious given other miners’ collapsing output.
The SIL top 15’s gold output wasn’t slammed as hard as silver in Q2, falling 17.8% YoY to hit 1.2m ounces. That was also a new low out of the last 17 quarters. Gold production was more resilient than silver output partially because these companies’ gold mines generally aren’t quite as concentrated in Mexico and Peru as their silver operations. But it also reflects the traditional silver miners’ ongoing shift into gold.
Recent years’ prevailing gold and silver prices have made the former much more profitable to mine, so the SIL top 15 have long been shifting more resources into expanding gold production. I’ve analyzed this in much detail in past essays on major silver miners’ quarterly results. The COVID-19 disruptions aren’t likely to accelerate that strategic change, but they did drive the major silver miners’ silver purity to new lows.
Last quarter the SIL top 15 only averaged 34.5% of their quarterly revenues from silver, the lowest levels in at least 17 quarters. The only major primary silver miners left are First Majestic with 86.0% of its Q2 sales from silver and Silvercorp Metals at 65.6%. The former’s silver purity is abnormally high because its gold production plunged even more than silver in Q2. As output resumes, that should return near Q1’s 61.5%.
While COVID-19 national lockdowns ravaged Q2 silver output, thankfully those heavy-handed reactions to this pandemic have largely ended. Governments started realizing the economic, social, political, and health damage from garroting their economies is vastly worse than anything COVID-19 could do. So they are unlikely to order more blanket lockdowns in the future, instead narrowly targeting any to outbreak areas.
A common theme in the SIL top 15’s Q2 reports is that most of their silver mines started ramping back up before Q2 ended. So that staggering production hit is likely an isolated anomaly limited to Q2. While Q3 output may be marginally weaker with some mines not yet running full-speed for the entire quarter, odds are Q4 will be back to normal. Thus major silver miners’ fundamentals should radically improve going forward.
In silver mining, output and costs are inversely proportional. The more silver mined, the more ounces to spread this industry’s big fixed costs across. Those generally don’t change much from quarter to quarter regardless of prevailing silver prices. Quarter after quarter individual mines require the same levels of infrastructure, equipment, and employees to feed their fixed-capacity mills. So lower outputs mean higher unit costs.
And that doesn’t even include all the new costs for managing this pandemic, something the silver miners have never had to do. Testing for the virus, quarantining the afflicted, and relentlessly social distancing and cleaning to limit its spread all require more resources and people. So silver-mining operating costs had to increase with these many new COVID-19 burdens, completely independent from silver production.
Cash costs are the classic measure of silver-mining costs, including all cash expenses necessary to mine each ounce of silver. But they are misleading as a true cost measure, excluding the big capital needed to explore for silver deposits and build mines. So cash costs are best viewed as survivability acid-test levels for the major silver miners. They illuminate the minimum silver prices necessary to keep the mines running.
In Q2’20 the SIL-top-15 major silver miners reported average cash costs of $7.53, which merely climbed 9.5% YoY. That wasn’t even the top of the 17-quarter range running from $5.67 to $7.97. So despite all those government-imposed operating restrictions, cash costs didn’t soar proportionally with the cratering silver output. And silver miners face no existential threat with silver averaging an impressive $23.44 so far in Q3!
All-in sustaining costs are far superior than cash costs, and were introduced by the World Gold Council in June 2013. They add on to cash costs everything else that is necessary to maintain and replenish silver-mining operations at current output tempos. AISCs give a much-better understanding of what it really costs to keep silver mines as ongoing concerns, and reveal the major silver miners’ true operating profitability.
Incredibly the elite silver miners did such a good job holding the line on costs that Q2’s collapsing output didn’t lead to proportionally-higher AISCs. The SIL top 15 reporting these averaged only $12.21 last quarter, merely up 6.1% YoY! That was amazingly in the lower half of their 17-quarter range running from $10.63 to $15.36. With silver again averaging $16.36 in Q2, that implies sector profitability of $4.15 per ounce.
Astoundingly that actually grew a healthy 23.1% YoY from Q2’19’s earnings! That is certainly unexpected given the COVID-19 lockdowns gutting these miners’ silver and gold production. But quarterly average silver and gold prices climbing about 10% and 31% YoY really helped. And some companies shrewdly delayed selling some of their silver mined in Q1, when the panic crushed silver to deep 10.9-year secular lows.
They deferred those silver sales into Q2, when silver rebounded strongly to much-higher prices. So the SIL top 15’s financial results were nowhere near as bad as their cratering silver production suggested. And that industry implied profitability should improve dramatically in coming quarters. Silver production levels recovering, stable-to-lower AISCs, and much-higher prevailing silver prices should drive soaring earnings.
Again silver has averaged a lofty $23.44 so far in Q3. Assuming SIL-top-15 AISCs retreat modestly this quarter back to their past-year average of $11.90, that implies the major silver miners could be earning an enormous $11.54 per ounce in this current quarter. That would catapult Q3’20 profits a whopping 85.2% higher YoY! The major silver miners’ fundamental trough hit and passed last quarter with the lockdowns.
On the hard financial-results front under Generally Accepted Accounting Principles reported to securities regulators, or their foreign equivalents, the major silver miners reported a much-better Q2 financially than their operating results implied. The SIL top 15’s total revenues only fell 10.3% YoY to $3.2b, much better than 26%-lower silver and 18%-lower gold output indicated thanks to Q2’s higher precious-metals prices.
Again last quarter’s $16.36 average silver prices were 9.9% better than Q2’19’s, and gold’s record $1714 average soared a massive 30.9% YoY. As the major silver miners’ silver and gold outputs rebound, their revenues are going to blast higher. Last quarter’s collective earnings from the SIL top 15 added up to a fairly-small $69m. But that was still much better than the $120m total loss they reported a year earlier in Q2’19.
Operating-cash-flow generation proved strong in Q2’20, bucking the operational weakness to soar 46.4% YoY to $815m. That helped the major silver miners grow their collective cash hoards by 32.0% to $3.1b. With the unprecedented challenges plaguing this industry last quarter, the SIL top 15’s financial results proved incredibly resilient. That shows this sector has a strong fundamental foundation for big future upside.
Given governments’ heavy-handed extended lockdowns in major silver-producing countries, Q2’20 could’ve been a disaster for the silver miners. Having a quarter to half of their output shuttered was an unprecedented operational shock! Yet the SIL top 15 still reported solid financial results as higher silver prices and much-higher gold prices helped offset some of the adverse impacts of that shut-in production.
The silver miners have huge earnings-growth potential at the higher prevailing silver prices seen in Q3. As their silver production normalizes with the universal lockdowns behind us, big additional gains are sure fundamentally justified in the silver stocks. Despite SIL skyrocketing 176.9% in its first post-panic upleg, this bull’s next upleg is likely to prove big too. But silver stocks first have to bleed off extreme overboughtness.
All bull markets naturally flow then ebb, taking two steps forward before retreating one step back. Their price action gradually meanders around uptrends. This normal upleg-correction pattern keeps sentiment balanced, extending bull markets’ longevity. And it is a huge boon for traders, offering excellent mid-bull opportunities to buy relatively low before later selling relatively high. That greatly expands bulls’ potential gains!
At Zeal we started aggressively buying and recommending fundamentally-superior gold and silver miners in our weekly and monthly subscription newsletters back in mid-March right after the stock-panic lows. We layered into dozens of stock positions before this sector grew too overbought, which were stopped out recently at huge realized gains running as high as +199%! Our subscribers multiplied their wealth within months.
To profitably trade high-potential gold and silver stocks, you need to understand their fundamentals and stay informed about what’s driving gold. Our newsletters are a great way, easy to read and affordable. They draw on my vast experience, knowledge, wisdom, and ongoing research to explain what’s going on in the markets, why, and how to trade them with specific stocks. Subscribe today and take advantage of our 20%-off sale! Corrections are the time to do your silver-stock homework, preparing to redeploy as they pass.
The bottom line is major silver miners suffered an exceedingly-challenging Q2. Extended national lockdown orders in major silver-producing countries slashed many silver miners’ outputs by a quarter to a half! Yet these companies still managed to keep production costs in check. Higher prevailing silver and gold prices offset a big chunk of that, driving surprisingly-solid Q2 financial results given these crazy circumstances.
The silver miners were quick to restart operations once the lockdowns passed, and are ramping outputs back to full-speed. That should lower costs, which along with much-higher silver prices should greatly amplify profits going forward. So big additional silver-stock gains are fully justified fundamentally. This sector just has to work off its overboughtness first, through a healthy sentiment-rebalancing correction.
Adam Hamilton, CPA
August 28, 2020
Copyright 2000 – 2020 Zeal LLC (www.ZealLLC.com)
The mid-tier gold miners in this sector’s sweet spot for upside potential have had a spectacular run since March’s stock panic! That catapulted them to extremely-overbought levels, necessitating a correction to rebalance sentiment. The mid-tiers’ just-reported Q2’20 operational and financial results reveal whether those big gains were fundamentally-righteous, and whether more major upside is likely in coming months.
Mid-tier gold miners produce between 300k to 1m ounces of gold annually, more than smaller juniors but less than larger majors. Mid-tiers are far less risky than juniors, and amplify gold’s uplegs much more than majors. Their unique mix of sizable diversified gold production, material output-growth potential, and smaller market capitalizations is ideal for outsized gains. They are the best gold stocks for traders to own.
Ironically the leading mid-tier gold-stock benchmark and trading vehicle is the misleadingly-named GDXJ VanEck Vectors Junior Gold Miners ETF. It has evolved to be dominated by mid-tiers, miners yielding quarterly gold output of 75k to 250k ounces. GDXJ actually holds few true juniors, which only account for a small fraction of its total weighting. The mid-tier gold miners have enjoyed outstanding performance this year.
But it sure hasn’t come easy, as usual in the super-volatile gold-stock realm. By late February 2020, this popular ETF had climbed 6.4% year-to-date. But then heavy general-stock-market selling erupted, which snowballed into a rare full-blown panic. That spawned an epic maelstrom of fear that sucked in gold and thus its miners’ stocks. Over the next few weeks into mid-March, GDXJ collapsed 50.7% climaxing in a crash!
But those extreme gold-stock lows were fundamentally-absurd given the high prevailing gold prices. So we started aggressively buying and recommending gold stocks in our subscription newsletters. Those were mostly mid-tiers with superior fundamentals, which are the sweet spot for upside potential during major gold uplegs. And the resulting gains out of that wild stock-panic anomaly indeed proved massive.
Over the next 4.8 months into early August, GDXJ skyrocketed a spectacular 188.9% higher! Hardened contrarians who bought in early and low had the opportunity to nearly triple their capital in stocks, which is very unusual in such a short span of time. But the mid-tiers’ blistering run blasted GDXJ to exceedingly-overbought levels. This ETF was stretched 1.534x above its 200dma when it carved its latest interim high!
Extremely-stretched technicals which always spawn extremely-lopsided sentiment never last long. GDXJ soon started correcting out of that euphoric peak, plunging 13.8% in just 4 trading days! Corrections are healthy and necessary within ongoing bull markets to rebalance sentiment, eradicating excessive greed and euphoria. GDXJ remained up 30.6% YTD even after that. Do mid-tiers’ Q2’20 results justify such gains?
Last quarter was a strange one for the gold miners, with powerful bullish and bearish forces warring. Its average gold price of $1714 was the best on record, rocketing 30.9% YoY from Q2’19’s average! Gold-mining profits really amplify higher prevailing gold prices. But many gold miners around the world were forced to shutter for weeks or months on end by governments’ draconian national lockdowns to slow COVID-19.
So many gold miners couldn’t fully capitalize on the phenomenal windfall of the highest quarterly gold prices ever seen. That called into question whether GDXJ’s huge 76.4% gain in Q2 proper, over half of its colossal post-panic upleg, was fundamentally-justified. So I couldn’t wait to see how the mid-tier gold miners actually fared operationally and financially last quarter, whether shutdowns or high gold prevailed.
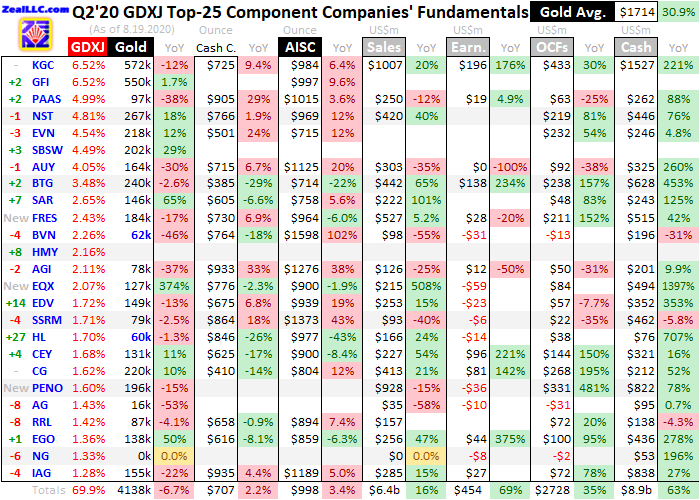
I’ve painstakingly analyzed the mid-tier gold miners’ latest results for 17 quarters in a row now. While GDXJ included a ridiculously-bloated 79 component stocks this week, I limited my analysis to its top 25 holdings. They collectively accounted for 69.9% of its total weighting, certainly a commanding sample. These larger GDXJ stocks include some of the best-performing gold and silver miners in the world.
The GDXJ top 25 trade in the US, Australia, the UK, Canada, and Mexico, making amassing this data somewhat challenging. There are different financial-reporting requirements around the globe, and even within the same country miners report different data in different ways. In the few cases where half-year results were all that was offered, they were split in half to approximate what those companies did in Q2.
This table summarizes the Q2’20 operational and financial highlights from the GDXJ top 25. These mid-tier gold miners’ symbols are listed, some of which are from their primary foreign stock exchanges. That is preceded by their ranking changes in terms of GDXJ weightings from Q2’19. Then their current weightings as of this week follow those stock symbols. GDXJ essentially ranks components by market capitalizations.
So relative ranking changes help illuminate outperformers and underperformers over the past year. That data is followed by each miner’s Q2’20 gold production in ounces, and its year-over-year change from Q2’19’s results. Then comes cash costs per ounce and all-in sustaining costs per ounce along with their YoY changes, revealing how much it costs these mid-tiers to wrest their gold from the bowels of the earth.
Next quarterly revenues, earnings, operating cash flows generated, and cash on hand are listed along with their YoY changes. Blank data fields mean companies hadn’t reported that particular data as of the middle of this week. Blank percentage fields indicate those changes would either be misleading or not meaningful, from comparing two negative numbers or when data shifts from positive to negative and vice versa.
Because of that epic tug-of-war between record-high average gold prices and COVID-19 shutdown orders plaguing mines, the mid-tier gold miners have never seen a quarter like Q2’20. But they still generated relatively-strong operational results despite many mines hobbled by decree. And their financial results proved outstanding with gold prices so darned high. This sector’s massive gains were fundamentally righteous!
While GDXJ is the highest-performing gold-stock ETF out of the larger popular ones, it is certainly no longer a junior-gold-stock ETF as advertised. Only two of the GDXJ-top-25 components qualified as junior golds, deriving over half their quarterly revenues from sub-75k-ounce gold output! Their production last quarter is highlighted in blue, and both these companies have long been better known for silver mining.
Rather unusually, the GDXJ top 25 included three new components last quarter. These included Mexican silver-mining giants Fresnillo and Industrias Penoles. The former is the largest silver miner in the world, producing 13.6m ounces in Q2 alone! That catapulted these mid-tiers’ silver output 120.0% higher YoY to 41.7m ounces. But neither company is a primary silver miner, it accounted for 42% and 27% of their Q2 sales.
They added to the mid-tier gold miners dominating GDXJ’s ranks. Together the GDXJ top 25 collectively produced 4.1m ounces of gold in Q2’20. That was down 6.7% YoY from Q2’19, reflecting the impact of the various government-imposed national economic lockdowns to slow the spread of COVID-19. While that sounds like a big production hit, it is actually surprisingly mild. Mid-tiers’ output well outperformed their peers’.
In last week’s essay I analyzed the quarterly results from the top 25 components of the GDX major-gold-miners ETF. Their total production actually plunged 11.0% YoY to 7.6m ounces, considerably worse than the GDXJ top 25. And the World Gold Council reported that overall global mine output collapsed 10.0% YoY in Q2 to 25.0m ounces. So the GDXJ top 25 were well ahead only seeing their total output fall 6.7%.
And that production decline is considerably overstated, because of Harmony Gold. It is the only GDXJ-top-25 miner that hadn’t reported Q2 gold output as of the middle of this week. Largely focused in South Africa, that government’s COVID-19 lockdowns hit its miners hard. Underground gold mining was totally suspended from late March to early May, when it was permitted to resume at 50% capacity until early June.
Then full operations could spin back up. But surface mining was largely exempted from the lockdowns, with operations running at close to 100% capacity throughout those months. Because of Q2’s massive disruptions, South Africa’s securities regulator extended Q2 reporting deadlines. Harmony’s fiscal year ends Q2, and full-year results including last quarter have to be audited. They are delayed at least a month.
While it is ridiculous this company didn’t report preliminary Q2 gold production, it did mention its “South African operations managed to achieve up to 75% of planned production during the last quarter of the financial year”. A year earlier in Q2’19, Harmony’s gold output ran 357k ounces. 3/4ths of that works out to 268k, but 2/3rds is a more-conservative assumption since this company also mines gold in Papua New Guinea.
If Harmony produced 238k ounces of gold in Q2, that would boost the GDXJ top 25’s total output closer to 4.4m. Amazingly that would only be down 1.3% YoY, radically better performance than the major gold miners! And interestingly the GDXJ top 25 are mostly a subset of the GDX-top-25 gold miners, excluding the latter’s eight largest components. Fully 17 of the GDXJ-top-25 companies are also GDX-top-25 ones.
The GDXJ-top-25 gold miners in this table account for both 69.9% of GDXJ’s total weighting and 30.9% of GDX’s total weighting. But GDXJ throwing out the world’s largest gold miners, and weighting the smaller mid-tiers more heavily, drives its big outperformance. During that post-panic upleg where GDXJ skyrocketed 188.9% higher, GDX’s comparable 134.1% surge was much smaller. Mid-tiers trounce the majors.
The major gold miners are simply too big to grow fast, both in gold-output and market-capitalization terms. The top 8 GDX components that GDXJ doesn’t include averaged 570k ounces of gold production in Q2. And their average market capitalization in the middle of last week ran $30.5b. That compares to 180k and $5.2b for the GDXJ top 25. Coming from much-smaller bases, growth comes much easier for mid-tiers.
These sweet-spot gold miners usually have a few mines, so adding another one really boosts their gold output. Yet the majors are so big that mine expansions, builds, and acquisitions can’t even keep up with depletion. They almost never show the output growth traders prize above everything else. And the stock prices of smaller companies in market-cap terms are much more responsive to capital inflows than larger ones.
The GDXJ top 25’s stable production was even more impressive considering the impacts of lockdowns for some of its components. Pan American Silver, which is GDXJ’s third-largest weighting this week, is an excellent example. Despite its name, it is now overwhelmingly a primary gold miner with only 18% of Q2 revenues coming from silver. PAAS’s Q2 gold production plummeted 37.5% YoY, among the worst in GDXJ.
That was solely because Pan American had the misfortune of being heavily concentrated in countries with some of the most-draconian national economic lockdowns. Those include Peru and Mexico, where nearly 3/4ths of PAAS’s 2019 revenues came from. Other GDXJ-top-25 components with huge plummetings in Q2 outputs YoY, including Buenaventura and First Majestic Silver, also do their mining in these countries.
Normally such sharp output drops would cause serious concerns, since production is the lifeblood of this industry. The more gold miners produce, the greater their profits supporting higher future stock-price levels. But profits leverage to gold works both ways, so when output falls future earnings potential drops dramatically. Thankfully those COVID-19 disruptions were temporary, quickly reversing as lockdowns lifted.
Most of the affected mid-tiers reported operating tempos at shuttered mines were back up nearing full speed by the end of Q2. So the GDXJ top 25’s gold production should rebound sharply in Q3, surging back up near or even above normal levels as miners rush to make up for lost output. Q2’20’s widespread national lockdowns shuttering gold mines likely won’t be repeated, they proved far too costly for those countries.
Any future lockdowns are likely to be narrowly targeted to COVID-19 outbreak areas, which will be much less damaging economically, socially, politically, and medically. And regional flare-ups of this virus aren’t likely to affect gold mines much. They are usually remote out in the mountains, and have limited highly-controlled access so workers can be screened. The worst of COVID-19’s gold-mining impact has likely passed.
In gold mining, output and costs are inversely proportional. The more gold mined, the more ounces to spread this industry’s big fixed costs across. Those generally don’t change much from quarter to quarter regardless of prevailing gold prices. Individual mines require the same levels of infrastructure, equipment, and employees to feed their fixed-capacity mills quarter after quarter. So lower outputs mean higher unit costs.
And that doesn’t even include all the new costs for managing this pandemic, something the gold miners have never had to do. Testing for the virus, quarantining the afflicted, and relentlessly social distancing and cleaning to limit its spread all require more resources and people. So gold-mining operating costs had to increase with these many new COVID-19 burdens, completely independent from gold production.
Cash costs are the classic measure of gold-mining costs, including all cash expenses necessary to mine each ounce of gold. But they are misleading as a true cost measure, excluding the big capital needed to explore for gold deposits and build mines. So cash costs are best viewed as survivability acid-test levels for the mid-tier gold miners. They illuminate the minimum gold prices necessary to keep the mines running.
The GDXJ top 25 reported average cash costs of $707 in Q2, which merely edged up 2.2% YoY. That was on the higher side of their 17-quarter range from $608 to $749, but still super-low relative to high prevailing gold prices. Obviously with gold enjoying that record quarterly average price of $1714 in Q2, the mid-tiers faced no existential threat. Cash costs are really only relevant when gold plumbs secular lows.
All-in sustaining costs are far superior than cash costs, and were introduced by the World Gold Council in June 2013. They add on to cash costs everything else that is necessary to maintain and replenish gold-mining operations at current output tempos. AISCs give a much-better understanding of what it really costs to maintain gold mines as ongoing concerns, and reveal the mid-tier gold miners’ true operating profitability.
The GDXJ top 25 reporting AISCs averaged $998 per ounce last quarter, which only climbed 3.4% YoY. And that was skewed high by that Peruvian gold and silver miner Buenaventura. Peru’s heavy-handed lockdown nearly slashed BVN’s gold output in half, doubling its AISCs to an extreme anomalous high way up at $1598! Excluding that crazy outlier, the rest of the GDXJ top 25 averaged lower $966 AISCs in Q2.
Both reads were lower than the last 17 quarters’ highest GDXJ-top-25 average AISC of $1016. That hit in Q1’20 as COVID-19 lockdowns began. Even including BVN, the mid-tiers’ 3.4% YoY increase in AISCs was far better than the GDX-top-25 majors seeing their own average AISCs shoot 13.1% higher YoY! The mid-tiers holding the line on costs despite all the pandemic challenges made for spectacular profitability.
The best quick proxy for sector gold-mining earnings is calculated by subtracting quarterly average AISCs from quarterly average gold prices. $1714 less $998 yields GDXJ-top-25 implied earnings of $717 per ounce last quarter! That skyrocketed an astounding 108.2% YoY from the $344 profits this metric implied a year earlier in Q2’19. Those massive mid-tier gold-mining profits were the highest yet seen by far in this bull.
With implied profits more than doubling, GDXJ’s huge 76.4% Q2’20 gain seems modest. It was certainly justified by the vastly-improved fundamentals that much-higher gold prices drive. And super-bullishly for mid-tier gold miners’ stock prices going forward, their earnings power continues to soar. The underway Q3 which is more than halfway over has already seen gold average a dazzling new all-time-record $1899!
But like gold stocks, gold is extremely overbought and really needs to correct to rebalance sentiment. Yet even if it falls sharply enough to drag Q3’s average price down to $1825, that still dwarfs Q2’s $1714 average. And the GDXJ top 25’s AISCs aren’t likely to change much from their four-quarter average now running $984. That’s conservative, higher output with shut-in production rebounding should push AISCs lower.
These cautious and sober Q3 projections yield potential GDXJ-top-25 earnings of $841 per ounce this quarter. That would keep soaring another 61% YoY from Q3’19’s levels! And that’s nothing new. During the last four reported quarters ending in Q2, mid-tier gold-mining profits per this sector proxy soared 65%, 72%, 66%, and 108% YoY! With sustained earnings growth like this, traders should be flocking in to the mid-tiers.
Their hard financial results reported to securities regulators, under Generally Accepted Accounting Principles or their foreign equivalents, proved outstanding in Q2 despite the operational challenges from governments’ lockdowns. The GDXJ top 25’s total revenues grew 15.7% YoY to $6.4b. And those are actually really understated, because of that financial-reporting delay authorized by South Africa’s regulators.
When I did this same analysis a year ago for Q2’19, the major South African gold miners Gold Fields and Harmony Gold had fully reported. If their year-ago revenues are backed out, the GDX top 25 saw Q2’20 sales rocket 46.3% higher YoY. The mid-tiers’ bottom-line accounting earnings soared 68.6% higher YoY to $454m, massive growth in line with that implied-earnings proxy! Again GDXJ’s 76.4% Q2 gain was righteous.
Excluding the South African gold miners’ Q2’19 profits doesn’t materially change that, they proved a wash last year. But it does affect operating cash flows. The GDXJ top 25 saw total OCFs surge 34.9% YoY to $2.7b. But without the prior-year OCFs reported on time by GFI and HMY, that comparison blasts way up to +57.9% YoY. That high OCF generation helped boost GDXJ-top-25 treasuries by 63.1% YoY to $8.9b.
Without that pair of South African miners, cash soared 83.4% YoY. Given the unprecedented uncertainty gold miners face from governments’ draconian overreactions to COVID-19, they also tapped lines of credit to maintain ample liquidity to weather any operational storms. That $8.9b in cash among the GDXJ top 25 was the highest by far in the 17 quarters I’ve been doing this analysis. Mid-tiers are ready for more lockdowns.
But that lockdown threat is fading fast as governments realize garroting their own economies is a cure far more damaging than the COVID-19 disease. So as gold miners’ lockdown fears wane, they will be flush with cash to expand their outputs. The coming year will likely see plenty of announcements of big mine expansions, new mine builds, and mergers and acquisitions. That will generate lots of sector interest!
Overall Q2’20 proved really strong for the mid-tier gold miners. While they did face mine shutterings from governments’ national lockdowns, their collective output only shrunk modestly. That far outperformed the big drops from the major gold miners. Holding gold production relatively stable combined with the record average gold prices in Q2 to drive outstanding financial results. The mid-tiers remain gold stocks’ sweet spot!
Given the enormous earnings these higher prevailing gold prices are generating at mid-tier gold miners, additional massive gains in their secular bull are certainly fundamentally-justified. Even though GDXJ just enjoyed that huge 188.9% post-stock-panic upleg, this gold-stock bull’s next upleg is likely to prove really big too. But we first have to get through healthy gold and gold-stock corrections following extreme overboughtness.
All bull markets naturally flow then ebb, taking two steps forward before retreating one step back. Their price action gradually meanders around uptrends. This normal upleg-correction pattern keeps sentiment balanced, extending bull markets’ longevity. And it is a huge boon for traders, offering excellent mid-bull opportunities to buy relatively low before later selling relatively high. That greatly expands bulls’ potential gains!
At Zeal we started aggressively buying and recommending fundamentally-superior gold and silver miners in our weekly and monthly subscription newsletters back in mid-March right after the stock-panic lows. We layered into dozens of new positions before gold stocks grew too overbought, which were stopped out recently at huge realized gains running as high as +199%! Our subscribers multiplied their wealth within months.
To profitably trade high-potential gold stocks, you not only need to understand their fundamentals but stay informed about what’s driving gold. Our newsletters are a great way, easy to read and affordable. They draw on my vast experience, knowledge, wisdom, and ongoing research to explain what’s going on in the markets, why, and how to trade them with specific stocks. Subscribe today and take advantage of our 20%-off sale! Corrections are the time to do your gold-stock homework, preparing to redeploy as they pass.
The bottom line is the mid-tier gold miners reported outstanding Q2 results. While COVID-19 lockdowns did affect their operations, their output shrinkage was much smaller than their larger peers’. That resulted in smaller cost increases, fueling enormous earnings growth in both sector-implied and hard-accounting terms. Revenues, operating cash flows generated, and treasury cash also all soared dramatically last quarter.
With the mid-tiers rolling in liquidity, they will likely invest billions in boosting their production as lockdown fears fade in coming quarters. And Q3 is shaping up to be another quarter seeing massive profits upside. With national lockdowns over, gold output is rebounding pushing costs lower. That along with much-higher-still record average gold prices shows big additional gold-stock gains remain fundamentally justified.
Note: Subsequent to the publishing of this article, management announced a modest C$2M equity capital raise.
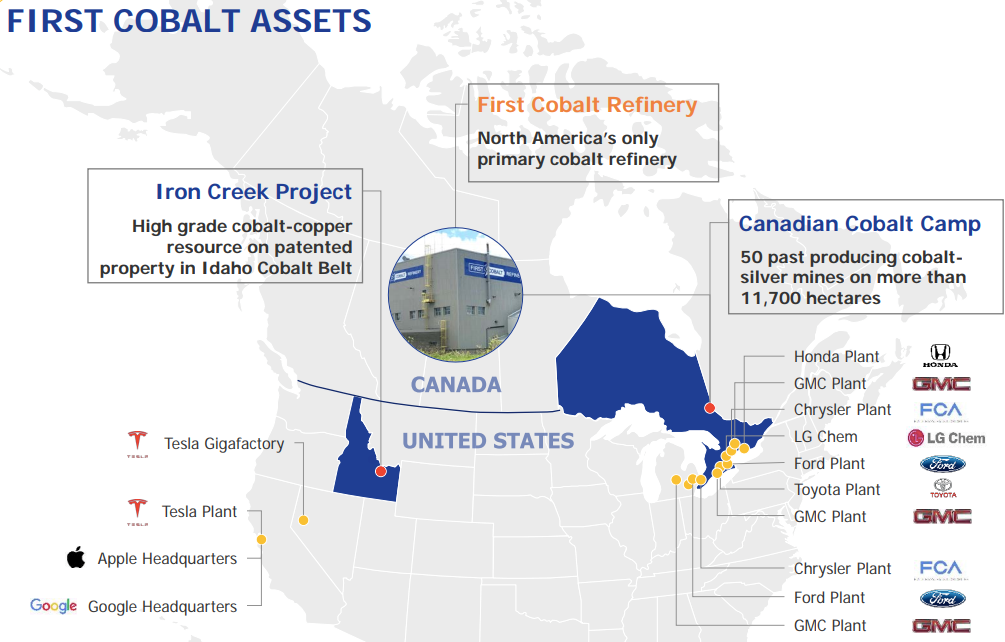
First Cobalt Corp. (TSX-V: FCC) / (OTCQX: FTSSF) / (GERMANY: 18P) announced a strategic review of its considerable silver prospects in Canada. Management & investors have been so laser-focused on restarting their 100%-owned cobalt refinery (with Glencore’s help) that the +133% gain!! {from $12 to $28/troy ounce} in silver since the COVID-19-induced mid-March low has caught many by surprise.
Management very candidly stated that it’s considering spinouts, divestitures, farm outs & JVs of most or all of its silver assets. There are a number of possibilities as to how this might unfold. It seems like a very prudent strategy, sell the hot commodity (silver) and hold the metal that might have greater upside from today’s levels.
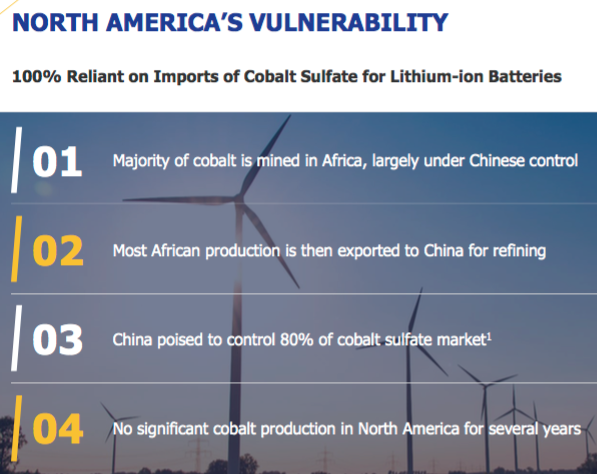
Depressed Cobalt prices are widely expected to double by 2022. Will silver double to $56/oz.? I don’t know. More about silver in a moment, but first an update on cobalt fundamentals.
Precious metals have soared; could cobalt be the next metal to shine?
According to Fitch Solutions, cobalt production in the DRC, the world’s largest producer, is expected to decline by 25% this year, mostly from the ongoing idling of Glencore’s Mutanda copper-cobalt mine in November, 2019 (planned shutdown for 2 years). Mutanda accounted for a quarter of the DRC’s output last year.
Unlike most copper-cobalt mines, which are heavily skewed towards copper, Mutanda is evenly split between the two metals. This makes the prevailing cobalt price much more important. I doubt the mine would incur the large amount of time & expense required to reopen at a cobalt price below $20/lb.
Cobalt prices are two weeks into a modest recovery, up from ~$14 to ~$15/lb. While nothing to write home about — certainly nothing like silver — could this be the start of something bigger? Again, I don’t know.
However, I continue to observe global announcements of giant countrywide infrastructure programs, many centered on the electrification of transportation, which is cobalt-intensive.
Silver is up +133% from its mid-March low of $12/lb.
Returning to silver, management assures me that the Company will not be dumping assets. It’s a seller’s market, interested parties are approaching First Cobalt unsolicited. Having said that, if some cash does come through the door later this year, that would lessen the need for new equity capital.
Even by monetizing a portion of the silver assets, management can potentially mark-to-market the remaining assets, thereby participating in silver’s bull market run.
Trent Mell, First Cobalt President & CEO, commented,
“Silver has more than doubled (+133%) from its March lows due to avid investor interest in precious metals. We have several high-grade silver targets that are not receiving value in our asset portfolio given our focus on cobalt. The Cobalt Camp includes some of the highest-grade historic silver mines in Canada and First Cobalt has demonstrated that potential for new silver discoveries exists beyond historically mined areas.“
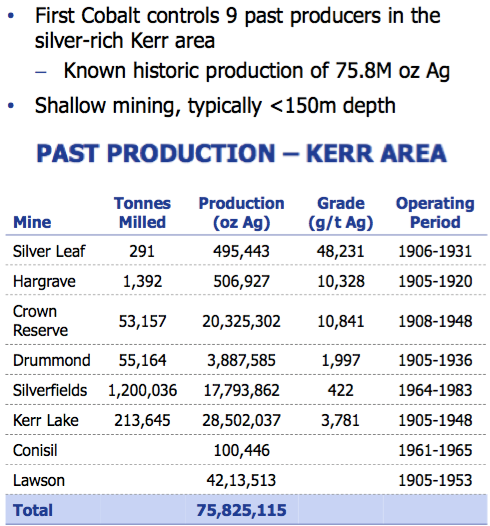
“Due to unsolicited expressions of interest, we have started a review of non-core silver assets. The Kerr Lake area is a prime example given that First Cobalt has combined eight adjacent historic mines that produced 50M ounces more than 60 years ago. We may seek to divest of silver-rich assets or JV them if terms are attractive.“
First Cobalt — largest property portfolio (11,700+ ha) in Silver-Cobalt camp
Management states that the Company holds the largest land package in the historic Silver-Cobalt mining camp, hosting > 50 past-producing mines. Total output was > 600M ounces of silver + 50M pounds of cobalt between 1903-1989.
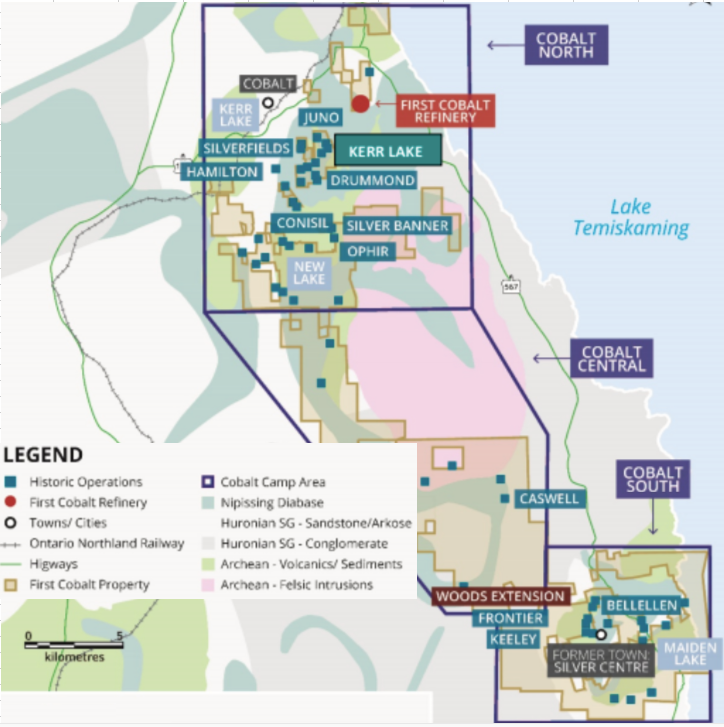
First Cobalt has amassed a 11,700+ hectare, patented land & mineral claims footprint. The next largest land owner in the district, (~7,800 hectares), is Canada Cobalt Silver Works, a company with a market cap of C$56M.
Not only does First Cobalt have a dominant land position, it has the only district-scale 3D geological model. The model was developed from historic maps & data, new geophysical surveys, historical & new diamond drilling. The mineralized zones that have been found are mostly below 150m depth.
Nearby, Teck Resources mined to a depth of 300 m, and produced > 17M ounces of silver, ending in 1989. And, in the southern portion of the Silver-Cobalt Camp, new zones of mineralization were intersected outside of the historic Frontier & Keeley mine areas, that produced > 19M ounces of silver. Exceptionally high-grade vein-style mineralization, mined at up to 185 oz./t silver (5,200 g/t).
The Company completed a $10 million exploration program including historic data compilation, bedrock mapping, prospecting, geophysical surveys and > 30,000m of drilling across 14 separate sites. Some of the best silver intercepts were found in the Kerr Lake area, which encompasses eight historic silver mines that produced > 50M ounces of silver + 900,000 pounds of cobalt.
First Cobalt’s drill results, > 30,000 meters, show serious high-grade Ag!
Management is not cherry-picking one or two strong intervals, there’s a lot of high-grade silver across First Cobalt’s extensive property package. The following intervals were mentioned in today’s press release. “Ag” = Silver & “Co” = Cobalt.
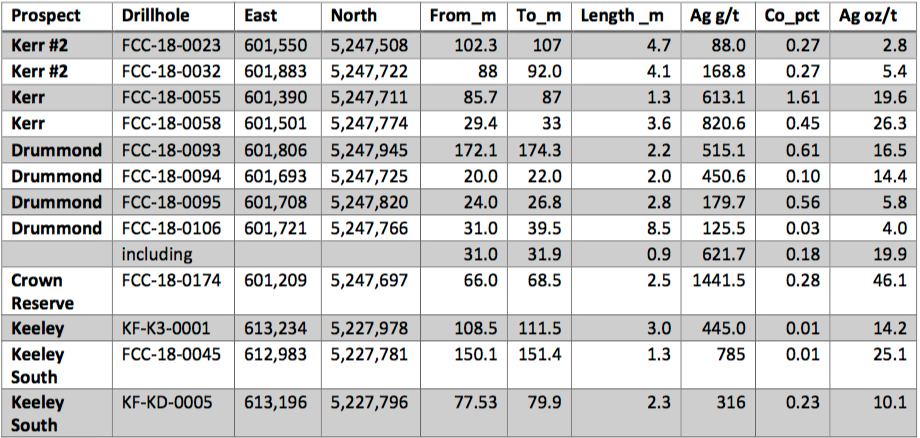
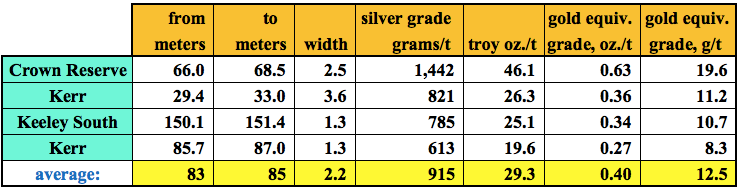
The highest-grade of 1,441 g/t silver equates to 46 troy oz./t, with an in-situ value of $1,295/t. That’s 19.6 g/t gold equiv., and it’s all near-surface!
The average grade of the four best intervals shown below is 915 g/t silver = 12.5 g/t gold equiv., at an average depth of 84 meters. Note, these high grades are not indicative of what the overall grade of these zones might be.
In looking at pre-PEA silver juniors, they trade at an average of about US$1.50 per ounce in the ground. If an experienced, well-funded company were to take over First Cobalt’s silver interests, could it delineate tens of millions of ounces? I think so.
In the right hands, 20M ounces could be worth ~C$40M, 30M ounces, ~C$60M. Even more if the silver rally continues. To be clear, this wouldn’t happen overnight, it would take a few years of active drilling, possibly by multiple operators.
As good as I believe the cobalt refinery / Glencore story is, adding high-grade silver optionality to the mix is quite compelling. Although I believe the cobalt price will eventually rebound, (it possibly has started a move back to $18-$20/lb.) silver is very strong right now. The spot price is up more than +50% in the past month alone.
Starting the process of monetizing silver assets (only upon attractive terms) is a great idea. Not only has the price soared, but increased attention from larger junior players and — importantly, new investors — can only lead to good things.
Finally, although not explicitly mentioned, there’s a growing number of small to mid-sized royalty & streaming companies that could be interested in working with First Cobalt on developing its ample silver resources.
These days, royalty / streaming companies are enjoying sky-high valuations in the market. The average multiples of trailing 12-month EV/Rev & EV/EBITDA of the largest players is 26x & 40x.
100%-owned cobalt refinery worth twice the Company’s market cap!
When metals / minerals prices soar, (recently it’s been gold, silver, palladium, perhaps soon uranium, cobalt, copper); refineries go up in value as well. It takes years to plan, permit, fund & construct a new mill and permit / construct a new tailings facility.
Due to scarcity, as the only permitted cobalt mill in N. America, First Cobalt’s facility in Ontario is increasing in value by the month. I believe that First Cobalt’s 100%-owned refinery is worth at least twice the Company’s market cap. of C$54M. {Hatch estimated its replacement value US$78M in 2012}
If the value of First Cobalt’s silver assets can be unlocked, each C$10M is worth about 20% in the Company’s current valuation. So, C$20M of [realized + unrealized] value would be worth 40% of the current market cap. That’s a really nice pickup for zero cost.
Investors looking for new ways to play precious metals can now have a look here. Readers are no doubt aware that dozens & dozens of silver / gold juniors have soared by 500% or more from 52-week lows. {74 of 391 gold companies I’m watching on YahooFinance are up 500%+}. First Cobalt has plenty of room to run.
Readers should consider taking a few minutes to revisit the First Cobalt (TSX-V: FCC) / (OTCQX: FTSSF) / (GR: 18P) story. Cobalt will have its day in the sun again. Silver is a tremendous gift, and the Company’s 100%-owned cobalt refinery is already very valuable. It’s an increasingly attractive hard asset that should be throwing off meaningful free cash flow within 18 months.
Disclosures: The content of this article is for information only. Readers fully understand and agree that nothing contained herein, written by Peter Epstein of Epstein Research [ER], (together, [ER]) about First Cobalt Corp., including but not limited to, commentary, opinions, views, assumptions, reported facts, calculations, etc. is to be considered implicit or explicit investment advice. Nothing contained herein is a recommendation or solicitation to buy or sell any security. [ER] is not responsible for investment actions taken by the reader. [ER] has never been, and is not currently, a registered or licensed financial advisor or broker/dealer, investment advisor, stockbroker, trader, money manager, compliance or legal officer, and does not perform market making activities. [ER] is not directly employed by any company, group, organization, party or person. The shares of First Cobalt Corp. are highly speculative, not suitable for all investors. Readers understand and agree that investments in small cap stocks can result in a 100% loss of invested funds. It is assumed and agreed upon by readers that they will consult with their own licensed or registered financial advisors before making any investment decisions.
At the time this interview was posted, Peter Epstein owned shares of First Cobalt Corp., and the Company was an advertiser on [ER]
While the author believes he’s diligent in screening out companies that, for any reasons whatsoever, are unattractive investment opportunities, he cannot guarantee that his efforts will (or have been) successful. [ER] is not responsible for any perceived, or actual, errors including, but not limited to, commentary, opinions, views, assumptions, reported facts & financial calculations, or for the completeness of this article or future content. [ER] is not expected or required to subsequently follow or cover any specific events or news, or write about any particular company or topic. [ER] is not an expert in any company, industry sector or investment topic.
The US stock-market action last quarter was dumbfounding. Big US stocks rocketed higher despite this global pandemic ravaging the US economy, which collapsed by a third in annualized terms! That makes understanding their fundamentals more important than ever. The winding-down Q2’20 earnings season reveals whether those massive stock-price gains were actually justified by underlying corporate profits.
Last quarter proved this country’s worst in history economically, with US GDP crashing at a brutal 32.9% full-year pace! 3/4ths of that plummeting was driven by personal consumption cratering. Tens of millions of Americans were receiving unemployment payments. When spending wanes, corporate earnings have to follow. Consumer spending dominates the US economy, driving about 7/10ths of all economic activity.
Americans pulled in their horns in Q2, both due to draconian government lockdown orders and serious COVID-19 fears. The uncertainty this pandemic and governments’ heavy-handed reactions to it caused are off-the-charts extreme, radically unprecedented in our lifetimes. Yet the flagship US S&P 500 stock index (SPX) still magically soared 20.0% in Q2’20! This disconnect between markets and the economy is epic.
Some of those colossal gains are explainable by the preceding stock panic. From mid-February’s pre-pandemic all-time-record peak to the end of Q1, the SPX plunged 23.7%. Big mean-reversion bounces are normal and expected after those exceedingly-rare extreme selling events. Far more important was the Fed’s astounding record money printing in Q2, a desperate attempt to stave off a full-blown depression.
The Fed reports its balance-sheet levels weekly. From their last weekly read in Q1 to their final in Q2, the Fed’s balance-sheet skyrocketed 34.8% or $1,828.0b higher! That is crazy-extreme, as close to hyper-inflation as this 106-year-old central bank has ever dared tread. Quantitative easing, which is quite literally conjuring money ex nihilo to use to buy and thus monetize bonds, is a powerful stock-market levitator.
As of the middle of this week, these trillions of dollars the Fed blasted into the system have pushed the SPX back up within just 1.7% of new record highs! Can the big US stocks’ fundamentals possibly justify trading at levels last seen before this pandemic severely hobbled this country? That logically seems like quite a stretch, with entire major industries being slowly strangled by radical changes in consumption habits.
All investors need to care how big US stocks are faring, as some combination of them dominate almost all portfolios. The leading SPX ETFs are wildly popular, led by the gargantuan SPY SPDR S&P 500 ETF, IVV iShares Core S&P 500 ETF, and VOO Vanguard S&P 500 ETF. These colossal investment vehicles commanded a staggering $292.5b, $208.3b, and $156.3b in assets this week! Their market footprint is vast.
Their top 25 components effectively are the US stock markets, accounting for a stunningly-top-heavy 41.8% of the total weighting of the entire S&P 500! So every quarter I wade through the latest quarterly results of these behemoths, to see how they are actually faring fundamentally. Given the unprecedented chaos slamming the economy in Q2’20, there’s probably never been a more important quarter to analyze.
This table outlines key fundamentals of the 25 largest companies in the US stock markets. Their stock symbols are preceded by how their rankings within the SPX shifted in the year since the end of Q2’19. After the symbols these companies’ actual percentage weightings within the S&P 500 at the end of Q2’20 are shown, along with their market capitalizations in billions back when that reporting quarter was ending.
Their market caps, as well as all their other fundamental data, are followed by year-over-year changes from the ends of Q2’19 to Q2’20. Looking at market-cap changes offers a purer read on companies’ values than stock-price changes, normalizing out some manipulative effects of corporate stock buybacks. They are done to artificially boost share prices and earnings per share, maximizing executives’ compensation.
Quarterly revenues, overall corporate profits, earnings per share, trailing-twelve-month price-to-earnings ratios as of quarter-end, dividends paid, and operating cash flows generated are shown. These key data are also followed by YoY changes. Blank fields mean a company hadn’t reported that particular data as of this week. Warren Buffett’s Berkshire Hathaway is the main culprit here, it hasn’t released Q2 results yet.
That’s not unusual, Berkshire usually reports on one of the first couple Saturdays in the second month after quarter-ends. Some companies have goofy fiscal quarters offset from calendar ones, making them harder to compare with peers. Adobe’s quarters end one month before calendar ones, while Walmart, Home Depot, NVIDIA, and Cisco have quarters running one month after. So their latest quarters are included.
Percentage changes are left blank if they are misleading or not meaningful, primarily when data shifted from positive to negative or vice versa between Q2’19 to Q2’20. In a quarter where the S&P 500 itself climbed 5.4% YoY, its top 25 companies’ results were fascinating and ominous. Excluding those market-darling mega-cap tech stocks everyone loves, the biggest and best US companies are generally struggling.
The capital deluging into so-called stay-at-home stocks benefitting from this pandemic is sure evident in the ranking shuffling among the SPX top 25. The big US stocks with the largest relative market-cap gains propelling them up the S&P 500 ladder were these kinds of companies. With people spending far more time at home, home-improvement projects had a higher priority driving Home Depot up through the ranks.
People working from home and kids doing school at home required lots of upgraded technology, which included Intel’s central processors and NVIDIA’s graphics processors. A far higher proportion of shopping done at home catapulted PayPal way higher, and with far fewer opportunities for entertainment Netflix naturally saw a big surge. This pandemic has radically changed how we are living and spending money.
The flood of Fed-spawned capital goosing stock markets concentrated in these elite top 25 companies of the S&P 500. They again commanded an immense 41.8% of the entire SPX’s weighting! That was the highest I’ve seen in the 12 quarters doing this research thread. And based on longer SPX datasets, this top-heavy weighting is the most-concentrated on record! Fewer stocks are carrying the entire markets higher.
The SPX top 25’s $11.3t total market capitalization surged 14.8% YoY, dwarfing those 5.4% gains in the S&P 500 itself from the ends of Q1’19 to Q1’20. And these latter broad-market gains were largely driven by those big US stocks’ ones. So these lofty stock markets sure wouldn’t have looked anywhere near as good without all that capital rushing into big US stocks. If they materially falter, the SPX is in serious trouble!
On the Q2’20 corporate-results front, that gigantic Berkshire Hathaway is the largest US company after the beloved mega-cap tech juggernauts. Berkshire owns lots of businesses which collectively put up big numbers. Since Berkshire’s Q2’20 results haven’t been released yet as this essay is published, we need to exclude Berkshire’s Q2’19 ones when comparing the totals. So all those are recast as ex-Berkshire.
The gaping bifurcation between the mega-cap techs and the rest of the big US stocks continued to widen last quarter. Apple, Microsoft, Amazon, Alphabet, and Facebook fortunately happened to be major beneficiaries of the stay-at-home trend to minimize potential COVID-19 exposure. Apple device sales surged dramatically as people replaced aging technology to make work and school at home more efficient.
Microsoft, Amazon, and Alphabet really benefitted from businesses massively accelerating their shift to moving computing needs into the cloud. The more people work from home, the more important having secure professionally-managed servers accessible from anywhere becomes. And with shopping shifting abruptly out of potentially-contaminated meatspace into the virtual world, Amazon’s sales just skyrocketed.
Facebook saw engagement rise too. People stuck at home really needed to connect with friends and peers like never before, and struggling businesses really needed to get their ads seen. It is stunning how the same elite mega-cap techs that dominated the stock markets before this pandemic are seeing some of the biggest benefits from it. So it’s more important than ever to break out the Big Five techs’ results.
On the revenues front, the top 25 SPX companies saw their sales drop 9.6% YoY in Q2’20 excluding Berkshire. That portends much-lower earnings, since corporate profits leverage revenue trends in both directions. Without those mega-cap techs, the big US stocks’ revenues situation looks far worse. The huge pandemic tech spending catapulted the Big Five’s Q2 revenues an astounding 17.8% higher YoY!
But the next 20 largest S&P 500 companies saw their total Q2 sales collapse 19.3% YoY. And these cover a broad array of industries. Going deeper into the SPX below the top 25, other data indicates the revenues situation is even worse. If sales don’t bounce back strongly in Q3 and Q4, corporate earnings are going to take a big hit regardless of how the Big Five fare. And the pandemic’s dire economic impacts linger.
Indeed the SPX top 25’s earnings reflected and amplified their sales trends last quarter. This entire elite group of big US stocks saw total profits fall 16.6% YoY ex-Berkshire. But again the divide between the Big Five mega-cap techs and everything else was enormous. Apple, Microsoft, Amazon, Alphabet, and Facebook enjoyed collective earnings rising 3.7% YoY. That’s a heck of an achievement in this environment.
But the rest of the top 25 saw their total profits collapse 28.4% YoY last quarter! There’s no way their stock prices should’ve rallied given such weak underlying fundamentals. Ultimately stock prices have to gravitate towards reasonable multiples of companies’ earnings. Extreme Fed money printing can short circuit that necessary fundamental connection for a season, but eventually profits determine stock prices.
Ominously the SPX top 25’s trailing-twelve-month price-to-earnings ratios soared dramatically higher by the end of Q2’20, even before its weak profits were reported. Together these elite companies averaged trading at a dangerous 39.1x earnings! For the past century and a quarter historical fair value for stock markets has run near 14x, and twice that at 28x is where formal bubble territory begins. We’re far beyond that!
Wall Street makes tens of billions gathering assets and charging commissions on them. The professional money managers are paid based off percentages of capital they are running. So they always have huge financial incentives to keep people fully invested no matter what, risks be damned. These guys will never recommend selling, no matter how overvalued and close to imminent bear markets stock prices are getting!
They’ve long used a ridiculous fiction called forward earnings to rationalize excessive valuations. Classic trailing-twelve-month P/Es look at the last four reported quarters of actual hard GAAP earnings compared to prevailing stock prices. There is no guess work in that. But when those valuations grow dangerous, the Wall Street analysts switch to talking forward earnings. Those are based on estimates of the next four quarters.
That conceit is totally fake, no one can predict what’s going to happen in earnings over the coming year. The shocking events of Q2’20, which would’ve seemed utterly impossible to all of us back in January, prove that in spades. And forward-earnings estimates have forever proven far too optimistic as a whole. An investment industry that needs to keep people fully invested perpetually paints the future as rose-tinted.
So with valuations at bubble extremes even in the Big Five mega-cap techs, analysts have pushed this forward-P/E farce to ludicrous degrees. Over the past few months, they have started proclaiming that big US stocks are undervalued based on blended 2021 and 2022 earnings! They brazenly assume the post-COVID-19 world is going to quickly return to pre-pandemic levels of economic activity. That isn’t too likely.
Wall Street’s effective censorship of even discussing legitimate trailing-twelve-month P/Es is only going to worsen as corporate earnings fall. Asset gatherers and commission takers can’t admit stock markets are dangerously overvalued, which portends a major bear market to force stock prices lower long enough for underlying corporate profits to catch up. But it is foolish to ignore the warning signs of excessively-valued stocks.
We don’t have to exclude Berkshire Hathaway from the dividend comparison since it doesn’t pay them. It is ironic Warren Buffett loves and praises other companies paying dividends, but has steadfastly refused to pay them to his own shareholders! Overall SPX-top-25 dividends paid in Q2’20 fell 15.5% YoY. That is mostly due to a different mix of companies though, as stay-at-home stocks displaced bigger dividend payers.
Only Apple and Microsoft pay dividends among the mega-cap techs, and those climbed 5.2% YoY in Q2. The rest of the SPX top 25 actually saw their total dividends collapse 20.0% YoY. Companies with falling revenues and earnings can borrow money to maintain dividend levels for a while, but ultimately dividends must be supported by profitability. So we’re likely going to see a big wave of dividend cuts in the near future.
Operating-cash-flow generation was the one brighter spot among the big US stocks last quarter. Their OCFs surged 13.5% YoY excluding Berkshire and the volatile mega-banks. That came mostly from stay-at-home companies doing booming business in Q2 contrary to the shrinking economy. The Big Five techs saw 26.4% YoY growth in OCFs, while the rest of the top 25 only managed a comparatively-weak 4.6% gain.
But all the big US stocks were hoarding cash like crazy, trying to increase their flexibility and strength to weather these dark times. The SPX top 25’s total treasuries soared 24.1% YoY to $779.5b excluding Berkshire! That’s a vast pile of money to keep operations running even as business slows for many if not most sectors. The Big Five’s cash piles only grew 9.3% YoY, but they accounted for 5/8ths of the SPX top 25’s total.
The scramble for cash was most evident in the next 20 largest US companies after the mega-cap techs. They frantically grew their cash balances 58.6% higher YoY! Plenty of this came from new borrowing including tapping lines of credit. The SPX-top-25 mix also played a role, with more cash-rich companies climbing into the ranks booting out cash-poorer ones. But there’s definitely a concerted effort to build up cash.
So the big US stocks’ Q2’20 fundamentals were generally quite weak. While the market-darling mega-cap techs did great as stay-at-home demand massively boosted their revenues, most of the rest of the elite stocks suffered. This insane pandemic environment does not bode well for corporate earnings outside of the handful of obvious winners. And Wall Street’s oft-hyped V-out economic recovery is a total fantasy.
Tens of millions of Americans are still out of work. The trillions of dollars of federal stimulus authorized by the CARES Act has largely run out. Q2 would’ve looked very different on the economic and earnings fronts had that vast money not deluged into the system. That included the $600-per-week federal bonus payments on top of state unemployment, which expired last week and Congress can’t agree to renew them.
Entire industries dependent on gathering people together in bigger groups are failing before our eyes. Airlines, cruise ships, sports, concerts, and restaurants are stuck in an unthinkable nightmare. Together those industries employed tens of millions of Americans who are really going to struggle to find jobs. And if they aren’t making money, they sure aren’t going to be spending to buy products the SPX companies offer.
Ominously the Fed’s epic money printing that catapulted the S&P 500 higher in Q2 stalled out in mid-June. Ever since then the Fed’s balance sheet has drifted sideways to lower. That greatly compromises the odds that these Fed-goosed stock markets can keep levitating near record highs with falling corporate earnings and bubble valuations. The reckoning is still coming, stock prices have to reflect economic reality.
That is going to have to take the form of a long-overdue major bear market. These subtly begin way up near euphoric highs where everyone is convinced the party will go on forever. Bears are cunning and devious initially, taking their sweet time to keep people fully invested despite dangerous valuations. That eventually inflicts the most pain possible on the greatest number of traders before bears return to hibernation.
The classic bear-market strategy is selling stocks and holding cash. If a bear market cuts stocks in half, holding cash through it doubles purchasing power so twice as many shares can be bought back once it runs its course. But cash not only doesn’t appreciate, its value is rapidly being eroded at a wildly-unprecedented pace from the Fed’s colossal panicked money printing. The world is being flooded with new dollars!
Thus a far-superior strategy is to weather this overdue and necessary stock bear in gold and the stocks of its miners. Gold tends to power higher on balance in strong bulls after stock panics, and there is nothing more bullish for gold than astounding currency debasement. That has really helped fuel the recent gold rush, leaving gold and its miners’ stocks extremely overbought. But they should be added aggressively in selloffs.
At Zeal we started aggressively buying and recommending fundamentally-superior gold and silver stocks in our popular weekly and monthly newsletters back in mid-March after gold got sucked into the stock panic. Their absolute unrealized gains were running as high as +205% this week! As of the end of Q1, all 1149 newsletter stock trades recommended since 2001 have averaged annualized realized gains of +18.7%.
That’s more than double the long-term stock-market average, driven by a studied contrarian approach. That’s why our newsletters have been blessed with much success over the decades. They draw on my vast experience, knowledge, wisdom, and ongoing research to explain what’s going on in the markets, why, and how to trade them with specific stocks. Subscribe today to see our current trades and enjoy 20% off!
The bottom line is big US stocks’ just-reported Q2’20 results revealed plunging sales and profits. The only bastion of strength was the mega-cap techs, which saw exceptional stay-at-home demand for their goods and services. Even before those generally-weak Q2 earnings came out, valuations were already up deep into dangerous stock-bubble territory. These stock markets have radically disconnected from reality.
The Fed’s trillions of dollars of money printing in just a few months drove this epic anomaly. But that has since stalled, ramping the odds a major reckoning is nearing to hammer stock prices low enough to again reasonably reflect underlying corporate earnings. Sales and profits aren’t going to rebound quickly with this pandemic still raging. Stock prices have a long ways to fall to manifest this darker COVID-19 economy.
Adam Hamilton, CP
August 7, 2020
Copyright 2000 – 2020 Zeal LLC (www.ZealLLC.com)
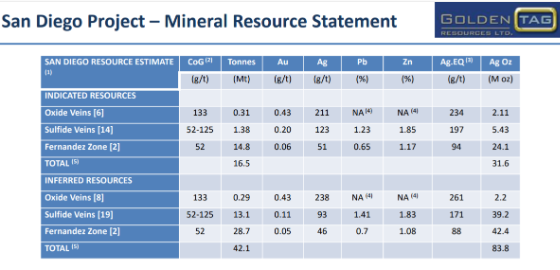
Twenty kilometres from a major four lane highway lies one of the largest undeveloped silver assets with an established resource of 115 million ounces of silver and 1.5 billion pounds of zinc, Golden Tag Minerals’ (TSX-V: GOG) wholly owned San Diego Silver Project.
Golden Tag has been preparing for stronger silver prices since 2019 in order to follow up on a resource outlined by a 2013 resource estimate. A new team at Golden Tag is accelerating its plans to appreciate and expand the large silver-zinc-lead deposit left lying in the desert for seven years.
The company recently announced a $5.6-million financing with Eric Sprott, his third financing in the company in under a year, in order to grow and define the known resources.
The San Diego Silver Project is located in the Velardeña Mining District in the Mexican State of Durango. The 92-hectare property lies 75 kilometres southwest of the city Torreon in sight of Golden Minerals (TSX: AUMN) San Juana Mine and 14 kilometres from Peñoles’ (BMV: PE & OLES) Santa Maria Mine.
A 2013 resource estimate concluded that there is potential to increase the size of the resource. The mineralization at the property is hinting at something bigger at depth and the company has sought the guidance of a geologist who has a knack for discovery at depth.
After seven years, the story of the San Diego Silver project continues, but with every good story, it is best to revisit the beginning.
History Lesson
In 2005, Golden Tag entered into a joint-venture agreement with ECU Silver Mining, now Golden Minerals, to earn a 50-per-cent interest in the San Diego Property. Golden Tag earned the 50-per-cent interest by 2008. The company acquired the remaining 50 percent in July 2016, a 2-per-cent net smelter return remains on the property payable to Golden Minerals.
Golden Tag acquired an established resource of 115 million ounces of silver and 1.5 billion pounds of zinc. There are two primary types of silver-lead-zinc mineralization at San Diego: veins and bulk zones.
- Veins: a thin sheet of mineralized rock that is one to two meters thick which typically contains higher-grade ore. There are over 20 veins of interest at the San Diego property.
- Bulk Zones: a large area containing mineralization. These types of zones contain lower grade material consistent over a large area. Mining costs are lower than for narrow veins. There is one bulk zone on the property – the Fernandez Zone.
The San Diego property was identified by narrow high-grade silver veins at a surface outcrop and shallow historic underground workings on oxidized veins. Early exploration drilling showed these veins extended beneath the oxide zones with several high-grade Ag-Pb-Zn sulfide veins at depths greater than 400 metres.
Drilling in 2011 and 2012 revealed widening vein zones below 500 metres, in some cases to more than 20 metres. This drilling also identified broader mineralized zones.
The 2013 resource estimate was completed by SGS using 59 drill holes amounting to 32,96 metres and reported over 115 million ounces of silver and 1.5 billion pounds of zinc in the resource estimate.
Table 1: Estimated Indicated Mineral Resources, San Diego Project, SGS March 2013
In addition to having a historical resource in place, San Diego already has estimated recovery rates. Most juniors do not complete these types of studies but it was roughly calculated using assumptions from the Valaradeña mine 12 kilometres away.
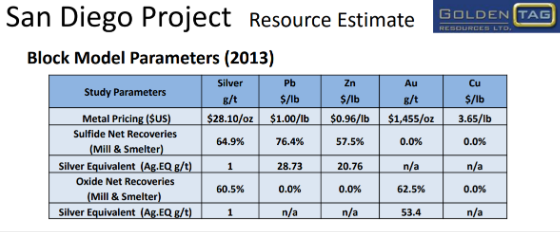
These recoveries are not representative of the geology at the San Diego site. Every poly-metallic operation is unique and any metallurgical work should be tailored to the specific project. Golden Tag could reconsider these recoveries as more drill core comes out of the ground.
After the 2013 Resource the company was put on care and maintenance, and not another drill program was proposed until 2019.
Recognizing Opportunity: Golden Tag’s Team Reigniting San Diego
In September of 2019, Chad Williams became chairman of the board. Mr. Williams is the founder of Red Cloud Klondike Strike, a brokerage specializing in the junior mining sector. It was only nine days later that the company raised $1.5-million with participation from Eric Sprott.
The company then signed a five-year agreement with Ejudi San Diego, a Mexican communal governance committee, to conduct exploration work at San Diego.
The company completed an environmental impact assessment and filed an application for a permit with Mexico’s environmental agency, SEMARNAT, to drill up to 21 holes. The permit was approved on March 13, 2020 and granted two and a half years to complete the work.
Soon after this, another financing of $1.125 million with Sprott’s participation was closed on June 18, 2020, followed by another one of $5.6 million on July 28.
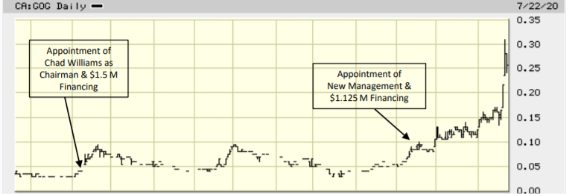
The company has built a strong foundation on past results and since September 2019 it has seen its share price rise.
The story of San Diego is restarting and drill results are just around the corner. Golden Tag Resources is fully permitted, fully funded with a proven resource ready for more exploration, and should be finally appreciated.
An initial 2,000-meter drill program comprising eight holes has been planned to test the near-surface continuity of mineralization encountered during prior drill programs in two target areas, the Trovador and Arroyo zones. However, the improved market conditions and increased financing should support a larger exploration program.
One key appointment that will help provide exploration insight is David Rigg. Mr. Rigg was the former President of Alexis Minerals now QMX Gold Corp. (TSX-V: QMX) and Exploration Manager for Agnico Eagle (TSX: AEM). He contributed to the discovery of the Musselwhite Mine in Ontario, Goldex, LaRonde and Lac Herbin Mines in Québec and was part of the original San Diego Deposit in Mexico.
Growing A Resource: Exploration Potential
According to the 2013 resource estimate by SGS Canada – resources could potentially be expanded by 20 to 50 million tonnes grading from 100 to 150 g/t Aq.Eq. from existing structures, as well as lateral and depth extensions.
The bulk of the resources in the mineral resource estimate come from the Fernandez zone, showing room to add significant ounces but there are other targets on the property that show the potential for high grade headline results.
There are four primary zones that show the greatest potential and make the most sense as exploration targets on the San Diego Property.
4 Key Exploration Zones:
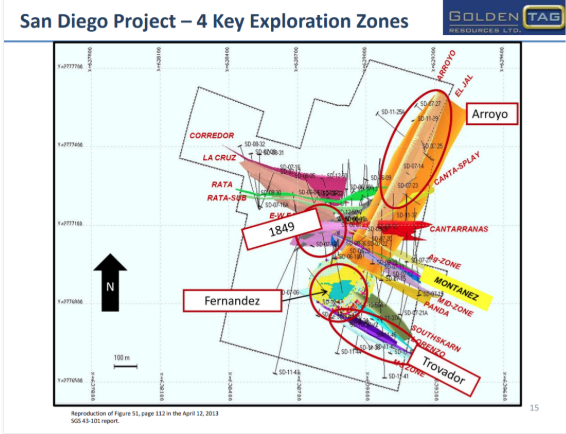
Fernandez
The Fernandez Zone offers a way to add more ounces to the resource. Drill results indicate bulk mining potential and it opens up to the west, which needs to be defined with more exploration.

The top of this was interpreted by SGS in 2013 at a vertical depth of 450 meters below surface, but no drilling has been conducted in this area to verify the upward extent of the zone. As a result, potential exists in extending known mineralization in the zone upwards from the interpreted 450 m vertical depth towards the surface.
This zone represents the core value underlying the San Diego Property. The authors of the 2013 Resource Estimate recommended that a Preliminary Economic Assessment “PEA” be completed to measure the economic impact along with the higher grade veins.
Travador
The Trovador Zone target lies in a 400 x 400 meter area between indicated resources located 150 metres below surface close to the historical workings, and above inferred resources estimated in 2013 at depth.
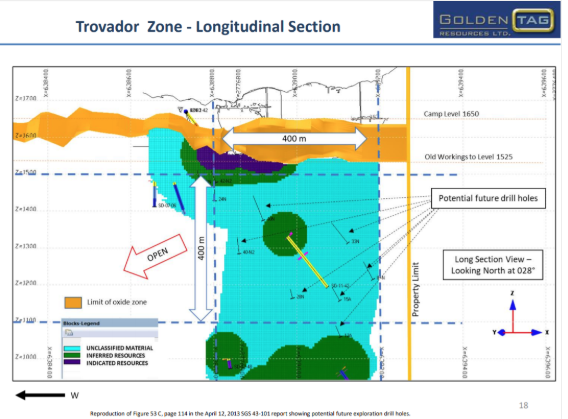
Potential exists to test this zone over 400 meters, down to a vertical range of 400 meters through drilling targeted between the historical mine workings at the 1525 Level and the inferred resources estimated by SGS in 2013 at 1100 Level, 550 m below surface.
There is a large amount of material defined as unclassified which typically means there is evidence of mineralization but there has not been sufficient work to make it compliant with modern reporting standards.
1849
The 1849 Target lies at the intersection of the East-West Fault Zone and Western Contact Zone. The target area lies within the 250 vertical meters between holes SD-12-49 and SD-07-18 and along the 350 meter up-dip extension to the surface. Further drilling will be required to confirm the potential for a “chimney” type structure at the intersection of these two sub-vertical zones.
Arroyo
Discovered in 2007 in hole SD-07-27 (166 g/t Ag over 4.60 m, including 776 g/t Ag over 0.6 m with 1.55% Cu), the Arroyo Zone has been traced over a strike length of 525 meters from the surface to shallow depths with few, widely spaced drill holes from previous programs. It contains near surface, higher-grade Ag dominant oxide and sulfide mineralization. The presence of this oxide zone right below surface should be further tested.
In Summary:
- Existing large silver resource
- One ounce of silver per share pre-financing
- Excellent shareholder base with Eric Sprott
- New management team & board of directors:
- Previous team had the company dormant for 7 years
- Well situated in Mexico within a prolific mining camp, continuously for 100 plus years
- Ample exploration potential with numerous targets indicating additional resources and potential for high grade results
About Golden Tag Resources:
Golden Tag Resources Ltd. is a junior exploration company exploring for high-grade silver deposits. The Company holds a 100% interest, subject to a 2% NSR, in the San Diego property in Durango State, Mexico. The San Diego property is located within the prolific Velardeña Mining District, the site of several mines having produced silver, zinc, lead, and gold over the past century. For more information regarding the San Diego property please visit our website at www.goldentag.ca. Golden Tag has no debt and cash balances of approximately $2.1 million.
Disclaimer:
*The author of this article was compensated for the creation of this article in cash, no options. The author picked up shares in the public market, ranging from prices of 29 cents to 30 cents on July 30, 2020. This article is meant to serve informational and marketing purposes only and not a technical report and does not constitute a buy recommendation. As always, please do your own diligence.
If you would like to receive our free newsletter via email, simply enter your email address below & click subscribe.
 Follow us on Twitter
 Become our facebook fan
CONNECT WITH US
Tweets
Tweet with hash tag #miningfeeds or @miningfeeds and your tweets will be displayed across this site.
MOST ACTIVE MINING STOCKS
Daily Gainers
 CMC Metals Ltd. CMC Metals Ltd. |
CMB.V | +900.00% |
 Eden Energy Ltd Eden Energy Ltd |
EDE.AX | +200.00% |
| GoviEx Uranium Inc. |
GXU.V | +42.86% |
| Eagle Nickel Ltd. |
ENL.AX | +41.67% |
| Citigold Corp. Limited |
CTO.AX | +33.33% |
| Mount Burgess Mining NL |
MTB.AX | +33.33% |
| Exalt Resources Limited |
ERD.AX | +31.94% |
| Casa Minerals Inc. |
CASA.V | +30.00% |
| Cariboo Rose Resources Ltd |
CRB.V | +28.57% |
| Belmont Resources Inc. |
BEA.V | +28.57% |


