
The gold miners’ stocks have just been hammered, plunging to new correction lows. That shattered their indexes’ 50-day moving averages, pounding nails in the coffin of this sector’s recent high consolidation. This necessary correction probably isn’t over yet. It is still small and short compared to this bull market’s precedent, the gold stocks are nowhere near oversold, and they are heading into a seasonal-plunge month.
Seeing the gold stocks rolling over into a correction shouldn’t surprise anyone. They enjoyed a great run, as evident in their leading and dominant sector benchmark the GDX VanEck Vectors Gold Miners ETF. From mid-March’s pandemic stock-panic lows to early August, GDX rocketed 134.1% higher in just 4.8 months! That powerful and fast upleg left gold stocks seriously overbought, necessitating a correction.
That healthy process to rebalance stretched technicals and greedy sentiment began right away. In the first four trading days after GDX peaked at $44.48 in early August, this ETF plunged 12.2%. The major gold stocks of GDX mirror and amplify gold, which overwhelmingly drives their earnings. So the gold-stock selling ceased with gold’s own sharp selloff. Gold had shot parabolic to extraordinarily-overbought levels.
But gold’s nascent correction quickly lost momentum, so this metal started drifting sideways in a high consolidation. The gold stocks followed, with GDX meandering between about $40 to $43 for over 5 weeks beginning in mid-August. That truncated gold-stock correction morphing into a much-less-painful high consolidation bred much complacency. Traders mostly assumed the gold-stock selloff had already passed.
That was premature and risky, as I wrote in an essay a few weeks ago arguing that gold stocks were still in correction mode. My contrarian conclusion then was “…with gold stocks remaining very overbought technically, and greed still elevated after an insufficient selloff, a resurgent correction is likely. That could easily extend to 25% in GDX, another 20% lower from this week’s levels.” That has started to come to pass.
GDX plunged sharply this week, falling 3.7% Monday and another 6.3% Wednesday! That first drop just shattered this leading gold-stock benchmark’s 50-day moving average, which is the highest-probability support zone for high consolidations. Once 50dmas decisively fail, selling tends to compound as technical damage mounts. The next stop after 50dmas is 200dmas, and GDX’s was way down at $33.15 this week.
Revisiting GDX’s 200dma today would make for a 25% gold-stock correction, much more in line with bull-to-date precedent. That seems probable given the technical situation in gold. In last week’s essay I dug into gold’s overboughtness risk. The gold stocks will keep correcting as long as gold does, with GDX very likely to leverage gold’s downside by 2x to 3x like usual. The fat lady has yet to sing on gold’s own selloff.
Neither gold nor its miners’ stocks are likely to decisively bottom, paving the way for their next big uplegs, until their recent overboughtness is worked off. That can be measured by comparing GDX’s daily closes with their underlying 200dma. Dividing the former by the latter yields a construct I call the Relative GDX, or rGDX for short. Considering gold-stock price levels relative to their 200dmas yields great timing insights.
This Relativity Trading system I developed well over a decade ago shows that relative multiples like this rGDX often form horizontal ranges over time. Gold-stock uplegs within ongoing bull markets tend to peak at similar levels relative to GDX’s 200dma. And the subsequent rebalancing corrections also tend to bounce at similar rGDX levels. Gold stocks can be very profitably traded within this Relativity trend channel.
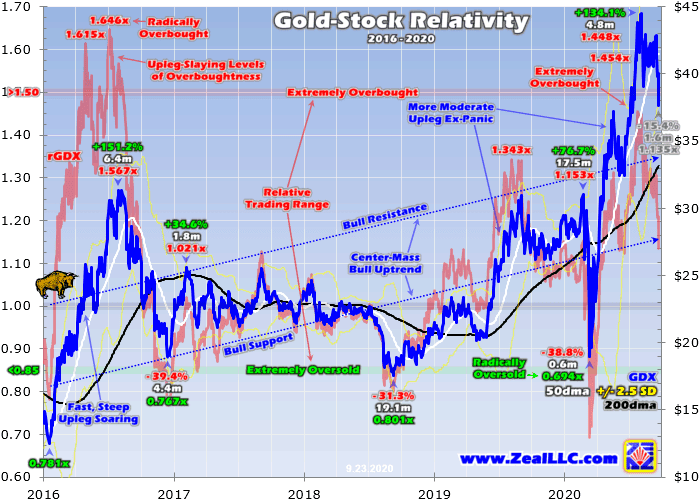
These Relativity trading ranges are defined based off the past 5 calendar years of data. That yields rGDX major support and resistance at 0.85x and 1.50x. In other words, during this gold-stock bull this sector’s leading benchmark mostly traveled within 85% to 150% of its 200-day moving average. The former is the time to buy relatively low before a major upleg, while the latter is the time to sell relatively high as it peaks.
This latest massive post-stock-panic upleg was born at radically-oversold levels way down at 0.694x GDX’s 200dma! Because of that anomalously-extreme oversoldness, we backed up the truck to heavily deploy in fundamentally-superior gold and silver miners in the aftermath of that rare stock panic. These specific trades filled our subscription newsletters, recommended to the people who keep us in business.
I publicly wrote about the coming incredible gold-stock opportunities in that post-panic upleg in March and April. On March 20th in an essay on mid-tier gold miners’ latest quarterly results, I concluded gold stocks had “epic potential to mean revert radically higher as fear fades and gold recovers, yielding huge gains to early contrarians.” GDX was still trading at $20.55 the day that essay was published, not far off its panic lows.
On April 3rd I analyzed gold stocks’ crash and V-bounce in another essay. With GDX still trading under $25, I wrote “All this argues that a major new gold-stock upleg is getting underway, portending big gains coming! Gold supports this outlook too.” Those radically-oversold stock-panic rGDX lows were a key reason gold stocks’ prospects were so darned bullish then. Indeed GDX rocketed 134.1% higher over 4.8 months.
Our dozens of gold-stock positions soared to huge unrealized gains. As long as gold stocks didn’t grow too overbought, we could keep riding their powerful upleg higher with loose trailing stop losses. But starting in late July, GDX’s overboughtness was mounting. The rGDX surged as high as 1.454x then, indicating that gold stocks had run too far too fast to be sustainable. That was challenging 1.50x upper resistance.
Gold stocks’ own levels relative to their 200-day moving averages aren’t the only consideration for gaming toppings after major uplegs. Gold itself, which is again this sector’s dominant primary driver, was hitting far-more-extreme overboughtness levels per its own Relativity metric. And when gold inevitably turned south, so would its miners’ stocks. So we prudently took precautions to lock in more of our massive gains.
When a Relativity trading indicator nears extremely-overbought upper resistance, it is time to ratchet up trailing-stop-loss percentages. Early in new gold-stock uplegs following corrections, we don’t want to get whipsawed out of young trades prematurely before those uplegs near harvest. So looser stop losses are wise. Given the wild volatility inherent in this small contrarian sector, I generally start with 25% trailing stops.
It takes rare serious-selloff circumstances to trip those, they are kind of like catastrophe insurance. But as uplegs mature and gains mount, those stop-loss percentages are tightened as the rGDX marches ever higher. This time around I started ratcheting up our trailing stops in late July as the rGDX shot over 1.35x. If gold stocks are moving normally, those stops are tightened in 5% increments like from 25% to 20% to 15%.
Some uplegs give enough time to ratchet all the way to 5% trailing, but this latest one was moving fast with gold shooting parabolic. So we were able to get to 10% near the end of July, locking in more of our fat unrealized gains. When gold and thus gold stocks started rolling over, the vast majority of those were automatically mechanically cashed out as realized gains. This discipline helps maximize upleg winnings.
Practically, it is impossible to precisely call correction bottomings and upleg toppings in real-time. Buying relatively low is done when fear reigns and it feels miserable to redeploy in a bombed-out sector. But later selling relatively high is much more challenging since greed and euphoria can carry uplegs deeper into extreme overboughtness before they fail and give up their ghosts. That makes selling outright a gamble.
But ratcheting up trailing stops allows gold-stock traders to stay deployed as long as possible when this sector’s uplegs are peaking. No sell decisions are necessary, as these mechanical stops maximize the potential realized gains. We don’t need to exit until selloffs force our hands. Today’s gold-stock correction was definitely predictable and anticipated, as serious overboughtness per the rGDX always portends selloffs.
Major gold-stock corrections are inevitable after major gold-stock uplegs. Bull markets are an alternating series of uplegs followed by corrections. While it is foolish to stay long gold stocks in the latter absorbing serious losses, there are definitely ways to trade corrections. With all our huge upleg gains realized and safe in cash, I recommended a couple other types of trades to our newsletter subscribers to game that selloff.
They included leveraged inverse-gold-stock ETFs and gold-stock-ETF put options. These enjoy gains proportional to gold-stock losses during bull-market corrections. We still have these bearish gold-stock trades on our books, as this gold-stock correction likely isn’t over yet. That again becomes apparent first in prevailing rGDX levels. As of the middle of this week, that technical metric had only retreated to 1.135x.
While that isn’t seriously-overbought any more, again the rGDX trading range now runs between 0.85x to 1.50x. It is a long way down yet from 1.135x GDX’s 200dma to 0.85x! Today’s correction is the fourth of this gold-stock bull. The first three bottomed at far-lower rGDX levels averaging just 0.754x! Odds are today’s correction won’t plunge so deeply, as all those earlier ones had unique circumstances intensifying them.
But it is hard to imagine the gold stocks not at least returning to GDX’s 200dma after blasting higher in their second-biggest upleg of this bull. Again that would make for a 25.5% GDX correction this week, but GDX’s 200dma continues to gradually rise. Relativity charts effectively collapse 200dmas horizontal to 1.00x, and render all the price action meandering around them in perfectly-comparable percentage terms.
GDX is likely to keep selling off on balance until the rGDX returns to 1.00x. Bull-to-date precedent argues for a bigger gold-stock correction too. This bull’s first three corrections averaged hefty 36.5% GDX losses over 8.0 months each! As of the middle of this week, GDX’s current correction was merely 15.4% in just 1.6 months. That still seems much too small and short to effectively rebalance away greedy sentiment.
Another factor is coming into play which could accelerate gold-stock downside over the next month or so, seasonality. The gold stocks are on the verge of their biggest seasonal selloff of the year, which runs from late September to late October on average. This next chart is borrowed from my last essay on gold-stock seasonality from late July. It distills out gold-stock performance through modern bull-market years.
In gold those include 2001 to 2012, which was followed by a bear, and then 2016 to 2019. 2020 isn’t yet factored in since it remained a work in progress. The older HUI gold-stock index, which closely mirrors GDX since they include most of the same major gold miners, has to be used instead of GDX. Born in May 2006, GDX’s history is insufficient for long-term seasonal analysis. But it is interchangeable with the HUI.
All these gold-bull years’ price action is individually indexed off the previous year’s final close, which is recast at 100. That keeps gold-stock-price moves comparable in constant-percentage terms regardless of prevailing price levels. Then all these annual indexes are averaged together to reveal this sector’s seasonal tendencies. Now right as GDX is correcting, we are staring into this sector’s biggest seasonal selloff.
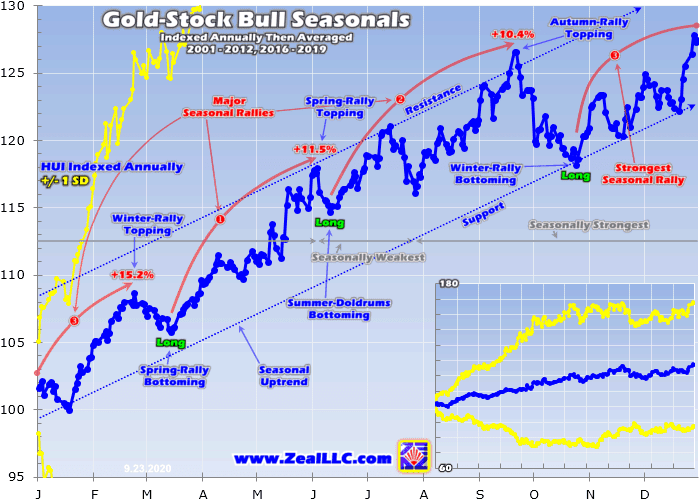
The gold stocks tend to suffer a sharp seasonal plunge from late September to late October, between their powerful autumn and winter seasonal rallies. The major gold stocks per the HUI tend to peak on September’s 14th trading day, which mapped to September 21st this year. Then they average a 6.6% retreat into October’s 19th trading day, which happens to be October 27th in 2020. That is a tough month.
While 6.6% may not sound like much, that dwarfs the HUI’s other two seasonal corrections averaging just 2.7% and 2.8% declines. And the averaging inherent in seasonality analysis really smoothes out the big drops. Seasonals prove strongest when they act as tailwinds for prevailing trends driven by technicals and sentiment. And the major gold stocks are certainly in correction mode entering this seasonal plunge.
So the overdue gold-stock selloff necessary to eradicate the serious overboughtness and widespread greed as this sector’s last major upleg peaked could very well largely run its course over the next month or so. The seasonal downside tailwinds could bring this correction to a head sooner than it otherwise might have played out. GDX will likely have to correct at least 25% before its next upleg can start marching.
If we get lucky with a mere 25% correction after such an enormous gold-stock upleg, that would make for another 10% or so lower during this coming seasonally-weak month. That is roughly in line with this bull’s precedent. The biggest wildcard is what happens in gold, which shares this sharp seasonal plunge from late September to late October. I discussed that front in last week’s essay on gold’s overboughtness risk.
As of the middle of this week, gold’s own correction deepened to 9.8% since its last upleg shot parabolic climaxing in early August. Again the major gold stocks of GDX tend to amplify material gold moves by 2x to 3x, implying a correction of 20% to 30% on a 10% gold one. But ominously gold still remained 8.5% above its 200dma this Wednesday! That key baseline is currently way down at $1714, still far lower from here.
A 200dma approach for gold’s correction would extend it to a serious 16.9% today! But with that 200dma constantly rising, a better estimate for a month from now might be 15%. If GDX leverages that kind of gold selloff by 2x to 3x, that implies a more-dire correction of 30% to 45%. 30% total is certainly possible in this seasonal plunge, but 45% is excessive. Remember this bull’s prior GDX corrections averaged 36.5%.
A 30% GDX correction would bash the major gold stocks back down to $31.14. If that comes to pass, so far the gold stocks have only seen half their correction. Odds are GDX will decisively bottom somewhere around 25% to 30% below early August’s major upleg peak. While painful for those trapped in it, this is really exciting as corrections yield the best buy-relatively-low opportunities seen within ongoing bull markets!
All bull markets naturally flow then ebb, taking two steps forward before retreating one step back. Their price action gradually meanders around uptrends. This normal upleg-correction pattern keeps sentiment balanced, extending bull markets’ longevity. And it is a huge boon for traders, offering excellent mid-bull opportunities to buy relatively low before later selling relatively high. That greatly expands bulls’ potential gains!
So I’m eagerly awaiting this correction’s bottoming to aggressively redeploy in fundamentally-superior gold and silver stocks at lower prices before their next major upleg gets underway. I’ll use this excellent rGDX indicator in concert with others to decide when high-probability-for-success buying opportunities are returning. Actively trading gold and gold-stock bulls requires study and discipline, but multiplies your wealth fast.
At Zeal we started aggressively buying and recommending fundamentally-superior gold and silver miners in our weekly and monthly subscription newsletters back in mid-March right after the stock-panic lows. We layered into dozens of new positions before gold stocks grew too overbought, which were stopped out recently at huge realized gains running as high as +199%! Our subscribers multiplied their wealth within months.
To profitably trade high-potential gold stocks, you need to stay informed about their technicals, sentiment, and fundamentals. And what is moving gold, their dominant primary driver. Our popular newsletters are a great way. They draw on my vast experience, knowledge, wisdom, and ongoing research to explain what’s going on in the markets, why, and how to trade them with specific stocks. Subscribe today and take advantage of our 20%-off sale! Corrections are the time to do your gold-stock homework, preparing to redeploy as they pass.
The bottom line is gold stocks are still correcting after soaring to seriously-overbought levels when their last upleg peaked in early August. The deceiving high consolidation after that failed decisively this week when GDX shattered its 50dma, proving this sector’s correction is alive and well. Only about 15% so far, it is likely to extend to 25% to 30% before overbought technicals are worked off and sentiment is rebalanced.
Seasonality is likely to exacerbate this necessary selling over the coming month, which is gold stocks’ biggest seasonal plunge of the year. These tailwinds pushing this sector lower in concert with normal correction dynamics could accelerate this selloff into finishing its vital mission sooner. That will be the time to aggressively redeploy in beaten-down gold stocks, buying great miners at relatively-low prices.
Adam Hamilton, CPA
September 25, 2020
Copyright 2000 – 2020 Zeal LLC (www.ZealLLC.com)
Gold Overboughtness Risk
Gold has been consolidating high since early August, when it rocketed parabolic on colossal gold-ETF demand. That 6-week-old sideways drift has worked off some greed and overboughtness, but plenty still remains. So gold isn’t out of the woods yet for this essential sentiment-rebalancing selloff. With residual overboughtness still extreme, gold faces considerable downside risk heading into its biggest seasonal selloff.
Across the financial markets, absolute price levels usually don’t matter much in technical and sentimental terms. Though they are important fundamentally. Supply and demand always converge to drive prices to sustainable levels, and over time traders come to accept them as normal. But how fast prices surged or plunged to current prevailing levels is exceedingly important, greatly affecting their short-term staying power.
The faster prices soar, the more excited traders grow about chasing that profitable upside momentum. As their greed flares and morphs into euphoria, they throw increasing amounts of capital at the fast-climbing prices. But such big and aggressive buying is never sustainable for long. Soon greed sucks in everyone interesting in buying anytime soon, exhausting their capital firepower. The price peaks leaving only sellers.
That spawns a necessary and healthy correction to rebalance sentiment and technicals. The greed and overboughtness driven by the frenzied buying into the crest have to be largely eradicated. That can either happen rapidly in sharp corrections or slowly through high consolidations. They need to hammer gold low enough, or hold it down long enough, to work off excessively-bullish sentiment and greatly-overextended technicals.
Fast corrections are far more beneficial to speculators, granting deeper buy-relatively-low opportunities sooner. Investors generally prefer longer high consolidations, as they are much less volatile spawning much less anxiety. Gold has definitely taken the latter route far, meandering sideways in a fairly-tight trading range since early August. But corrections can still emerge later in high consolidations, surprising many.
Gold is nearing a major seasonal juncture which really compounds its near-term downside risk. This metal’s biggest seasonal selloff of the year in modern bull-market years typically erupts between late September to late October. With gold still extremely overbought and greed quite high heading into this seasonally-weak span, the odds of gold’s high consolidation rolling over into a full-blown correction are mounting.
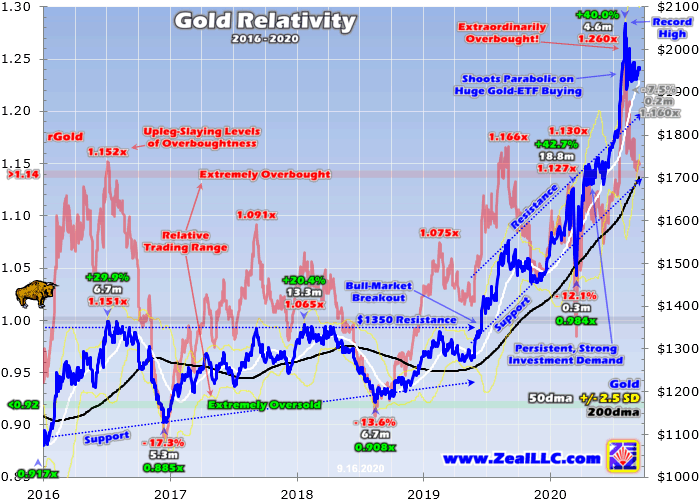
This first chart of gold’s price action in this secular bull shows how outsized this metal’s latest upleg grew. Gold’s technicals are superimposed over an overboughtness measure still flashing warnings despite the recent high consolidation since gold peaked, which I’ll explain shortly. While gold surging to new record highs is awesome, it rocketed up there too far too fast to be sustainable. That necessitated a rebalancing selloff.
Gold’s recent post-stock-panic upleg has proven incredibly strong. Back in March, gold got sucked into the rare stock panic fueled by governments’ heavy-handed lockdowns attempting to slow COVID-19’s spread. Stock panics’ epic fear temporarily infecting gold isn’t unusual. Traders get so scared they rush to dump almost everything. Their flight into cash catapults the safe-haven US dollar higher, unleashing gold selling.
Gold plummeted 12.1% in just 0.3 months into the dark heart of that stock panic, bottoming a couple trading days before the US stock markets. When the US dollar stopped rocketing higher, gold reversed hard and started surging. Big mean-reversion rallies are also normal after stock-panic pummelings, and gold’s was textbook-perfect in April, May, and June. It was rallying higher in a measured, sustainable fashion.
Up until mid-July, gold’s mean-reversion upleg remained in the strong uptrend that was established by this secular bull’s previous upleg leading into mid-March’s stock panic. Gold powered 42.7% higher over 18.8 months in that, proving this bull’s biggest and longest upleg. But in late July gold started shooting parabolic! It burst out of that stable uptrend to soar vertically, hitting a series of 9 new all-time-record highs.
That was fueled by stock traders rushing to buy huge amounts of gold-exchange-traded-fund shares, led by the world-dominating GLD SPDR Gold Shares. My popular essay last week detailed that incredible buying spree, which was interestingly led by young millennial traders. Hedge funds really amplified millennials’ gold-ETF trades, instantly front running them using computers to trade on real-time order-flow data!
So in just three weeks from mid-July to early August, gold soared an incredible 14.9% higher! As this chart shows, that was a vertical parabolic surge in the context of this bull market. That generated crazy levels of greed and euphoria, leaving gold universally loved and everyone wildly bullish on it. It catapulted gold to extraordinarily-overbought levels, challenging those that helped slay gold’s previous secular bull.
Overboughtness is a measure of how far and fast prices run compared to some underlying baseline. An ideal one is prices’ trailing 200-day moving averages. Since 200dmas gradually follow prices, they never become obsolete like static baselines as prevailing price levels change. And the heavy smoothing effect of 200dmas distills out volatility, leaving a great gradual dynamic baseline from which to compare price moves.
Well over a decade ago, I developed a trading system based on prices’ relationships with their 200dmas which I called Relativity Trading. It quantifies overboughtness and oversoldness by looking at price levels relative to their 200dmas, hence the name. When a price is divided by its 200dma, that yields a multiple in this case called Relative Gold or rGold. Charting these Relativity multiples over time often reveal trends.
Relativity charts collapse that all-important 200dma baseline to flat and horizontal at 1.00x, and recast all gold price action around it. That expresses how far gold has stretched either over or under its 200dma, in constant-percentage terms that are perfectly comparable over time regardless of the prevailing gold-price levels. In late July, I explained rGold in more depth in an essay warning about mounting gold overboughtness.
Relativity trading ranges are defined based on the past 5 calendar years of data, which translates into a gold trading range between 0.92x to 1.14x this metal’s 200dma. Anytime gold falls below 92% of its key 200dma, it is extremely oversold. And anytime gold surges above 114% of its 200dma, it is extremely overbought. This year gold faced no overboughtness extremes until millennial Robinhooders rushed in.
Heading into mid-March’s stock panic, gold only peaked at 1.127x its 200dma while rGold hit 1.130x at best. There’s no need to worry about extreme overboughtness until that metric exceeds 1.14x. While gold’s post-panic mean-reversion upleg was strong, it didn’t challenge that overboughtness warning zone until late July. Gold’s big-yet-orderly 23.4% surge in the 4.0 months out of the stock panic nadir didn’t get overextended.
By early July gold had rebounded and rallied far enough to stretch to 1.135x its 200dma. But that 1.14x threshold didn’t get crossed until late July. Once gold runs so far so fast that it extends more than 14% over its 200dma, a healthy rebalancing selloff is increasingly likely. But the momentum-chasing gold-ETF-share buying was so frenzied that gold kept on rocketing higher becoming ever-more overbought.
That culminated in an absolutely-stunning rGold read of 1.260x on August 6th when gold peaked at a dazzling new all-time-record high near $2062! It is exceedingly rare for gold to rocket so far so fast that it stretches 26% above its 200dma. The last time anything like that had been witnessed was way back in early September 2011, 8.9 years earlier. And that episode of extraordinary overboughtness didn’t end well.
Just a couple weeks before, gold’s last secular bull had crested at a then-all-time-record high of $1894. The epic greed and euphoria then catapulted rGold to an incredible 1.286x! But that super-extreme level of overboughtness would soon prove bull-slaying. Right when gold looked so shiny that everyone expected it to keep powering higher indefinitely, a secular bear was being stealthily born that proved devastating.
That would maul gold a massive 44.5% lower over the next 4.3 years! Extraordinary overboughtness is nothing to be trifled with. Yet odds are early August 2020’s similar rGold extreme of 1.260x won’t also kill today’s secular gold bull. Why? It is still quite small and young by secular-gold-bull standards, clocking in at a 96.2% gain over 4.6 years. Gold’s previous secular bull was vastly larger, soaring 638.2% across 10.4 years!
But epic overboughtness still caps gold-bull uplegs, making rebalancing selloffs necessary. While these can take the form of either fast corrections or slow consolidations, the more overbought gold gets the greater the odds of the former. An excellent example came in this gold bull’s maiden upleg that peaked in early July 2016 at 1.151x gold’s 200dma. That was extreme overboughtness above rGold’s 1.14x upper resistance.
Over the next 5.3 months gold plunged 17.3% in a serious correction! That not only worked off all the excessive greed and overboughtness when that upleg peaked in euphoria, but replaced them with fear and extreme oversoldness. This gold bull’s three previous corrections have averaged 14.3% over 4.1 months each. That is definitely deep enough and long enough to eradicate greed and restore balance.
Today’s correction following this gold bull’s fourth upleg hasn’t yet come anywhere close to conforming to that established precedent. Gold’s initial post-peak selloff was very sharp, with this metal plummeting a violent 7.5% in just 3 trading days or 0.2 months after early August’s peak! But that is still the full extent of gold’s rebalancing selloff, as it hasn’t returned to those lows on a closing basis since that flurry of selling.
Gold bounced at $1906 mere days after closing at $2062. But that nascent correction quickly stabilized into the tight high consolidation seen since, where gold has averaged $1952 since that last upleg crested. Is it reasonable to see gold’s smallest and shortest correction of this bull following its second-largest and sharpest-by-far upleg hitting overboughtness extremes? Probably not, with nothing close to being rebalanced.
That day gold’s correction seemingly climaxed with a brutal 5.9% daily plunge to $1906, rGold still closed way up at 1.160x. That’s not only above that 1.14x extreme-overboughtness threshold of its trading range, but still higher than that 1.151x peak of this gold bull’s first upleg. And gold’s overboughtness has not improved much since. The lowest this rGold multiple has been since early August is 1.143x in early September!
Including both its shooting-parabolic phase into early August and the high consolidation since, gold has continuously remained extremely overbought for over 8 consecutive weeks! That is why residual greed and bullishness remain so high. Enthusiasm for the yellow metal hasn’t waned much, with it still widely touted as a great trade and investment. Corrections don’t end until nearly everyone is down on gold again.
Every previous correction in this gold bull not only well exceeded 10%, but hammered gold back down well under its 200dma. So far in this current rebalancing selloff, gold hasn’t even hit formal correction territory and it remains way above that 200dma baseline. That implies the necessary gold selling hasn’t run its course yet. That is evident in gold’s driving gold-ETF capital flows which I discussed in last week’s essay.
While gold could grind sideways for many more months until bullish sentiment fades to bearish, and eventually converge with its 200dma, that’s not likely for many reasons. There are plenty of catalysts that could spark the overdue gold selloff. They include US stock markets surging again, the oversold US dollar rallying, millennial traders exiting their gold-ETF positions en masse, and how US elections play out.
But there’s another one I’ve been increasingly thinking about given the timing, seasonals. Gold is on the verge of falling into its biggest and sharpest seasonal selloff of the year. This next chart was taken from my last look at gold and gold-stock seasonals in late July. It distills out how gold has fared in modern gold-bull years. Each year is individually indexed to the prior year’s close, then these are averaged together.
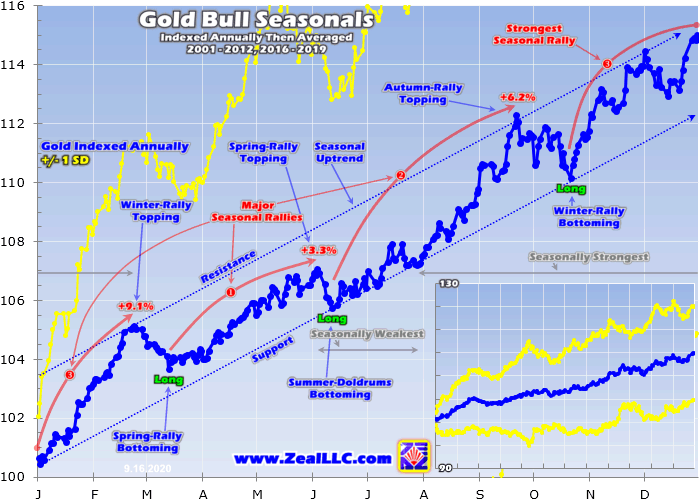
Gold has enjoyed a strong seasonal uptrend in its modern bull-market years of 2001 to 2012 and 2016 to 2019. 2020 isn’t included yet since this year remains a work in progress. Gold marches higher in three seasonal rallies, its autumn, winter, and spring ones. The autumn rally is the second-largest one, which averages 6.2% gains before topping in late September. That major seasonal peak happens right about now!
Gold crests on September’s 15th trading day on average, which translates to September 22nd this year. Gold’s recent autumn rally was prematurely truncated in early August when excessive buying exhausted itself. Gold’s high consolidation since has come in a seasonally-strong time. But between that autumn-rally peak and the dawn of gold’s winter rally, gold tends to correct sharply. That comes over the next month.
Between late September to late October, gold has retreated an average of 1.9% in these modern gold-bull years. That might not sound like much, but it is gold’s sharpest seasonal decline by far. Gold’s other two seasonal corrections into mid-March and early June average 1.4% and 1.2% retreats. And when gold needs to correct after it has run too far too fast, seasonal weakness way exceeds that heavily-smoothed average.
The still-necessary gold selling after early August’s extraordinary levels of overboughtness is far more likely to materialize in this seasonally-weak time. That seasonal lull is normally caused by Indian gold buying for festival season drying up before holiday buying starts spinning up in the western world. Both of these trends are likely to prove weaker than normal this year, exacerbating any technical gold selling.
Indians are shrewd price-conscious gold buyers, and rupee gold prices are still trading way up near recent lofty all-time-record highs. Indians are generally gold bargain hunters, not momentum chasers like American millennials. And with such deep economic scarring from governments’ economic lockdowns, jewelry buying has cratered this year. That might not recover anywhere near a normal holiday-buying season.
So if this recent high consolidation in gold is going to roll over into a full-blown correction, this coming seasonal-lull month is the time it is most likely to happen. And just like buying begot more buying into early August’s peak, selling will cascade. As soon as gold starts to break down technically, traders will increasingly sell. The more selling they do, the farther gold will fall. That will drive even more selling.
Key technical levels will exacerbate this vicious circle. Many technically-oriented traders including the hyper-leveraged gold-futures speculators closely watch gold’s 50-day moving average. That is running $1926 as of the middle of this week. A decisive close under there will spook traders. Next comes gold’s correction-to-date low of $1906 in mid-August, and then the psychologically-heavy $1900 big round number.
Once gold is pushed below those key technical levels, it is a long way down to gold’s 200dma following way below at $1703! If this necessary and healthy gold correction simply extends to this gold bull’s average of 14.3%, we’d be looking at a major bottoming far lower near $1767. Wherever that appears, it has to happen over a bigger and longer time frame than gold’s 7.5% selloff at worst so far over just 3 trading days.
The millennial Robinhooders and their hedge-fund imitators that flooded into gold-ETF shares at frenzied rates into early August are weak hands. They bought high in peak euphoria, so their losses will snowball fast as gold corrects. That could lead to massive symmetrical selling in gold-ETF shares, led by GLD and to a lesser extent the IAU iShares Gold Trust. Big differential gold-ETF-share selling would hammer gold.
Both speculators and investors should embrace these inevitable rebalancing corrections, as they yield the best mid-bull buying opportunities within ongoing bull markets. That is when to aggressively redeploy in gold, gold ETFs, gold-stock ETFs, and individual gold stocks with superior fundamentals. Bulls’ inexorable upleg-correction cycles are great boons for traders, greatly expanding potential gains to be won in those bulls!
At Zeal we started aggressively buying and recommending fundamentally-superior gold and silver miners in our weekly and monthly subscription newsletters back in mid-March right after the stock-panic lows. We layered into dozens of new positions before gold stocks grew too overbought, which were stopped out recently at huge realized gains running as high as +199%! Our subscribers multiplied their wealth within months.
To profitably trade high-potential gold stocks, you need to stay informed about what’s driving gold. Our popular newsletters are a great way, easy to read and affordable. They draw on my vast experience, knowledge, wisdom, and ongoing research to explain what’s going on in the markets, why, and how to trade them with specific stocks. Subscribe today and take advantage of our 20%-off sale! Corrections are the time to do your gold-stock homework, preparing to redeploy as they pass.
The bottom line is the persistent extreme overboughtness in gold remains a serious downside risk. After shooting parabolic into early August, the high consolidation since has yet to rebalance away excessive greed and extreme overboughtness. Yet that still has to happen before this gold bull’s next major upleg can start marching higher. After such a vertical upleg euphorically climaxing, a correction remains highly likely.
Gold’s technicals are still very stretched heading into its biggest seasonal pullback of the year, running over the next month or so. Any material selling could easily force gold to break below key technical levels not far under current prices. That would unleash both gold-futures and gold-ETF-share selling that could easily cascade. But the resulting overdue gold correction will create excellent mid-bull buying opportunities.
Adam Hamilton, CPA
September 18, 2020
Copyright 2000 – 2020 Zeal LLC (www.ZealLLC.com)
Caldas Gold (TSX-V: CGC, OTCQX: ALLXF) has raised ~$240 million (USD), looking to finance expansion at its Marmato gold mine in Colombia.
On July 29, 2020, the company announced a $50-million (USD) financing led by Canaccord and Scotiabank followed by a $110-million (USD) stream financing with Wheaton Precious Metals (TSX: WPM). Finally, the company closed an $83-million (USD) private placement.
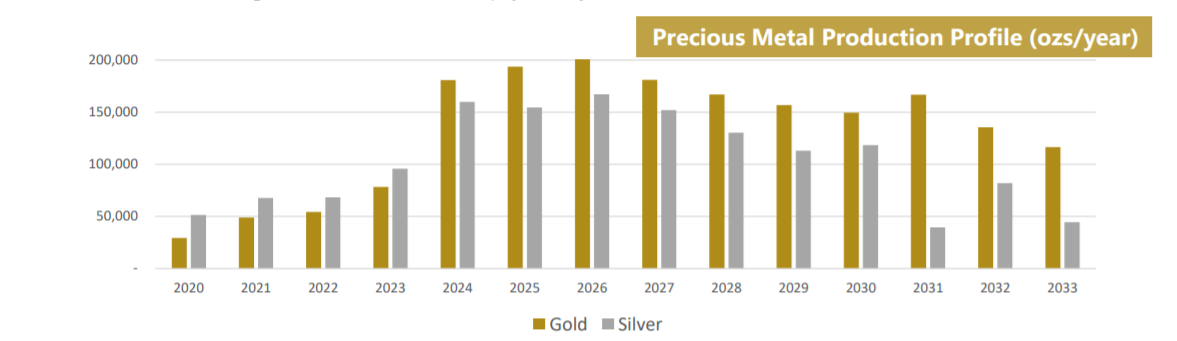
With execution of the Wheaton stream anticipated in the next couple of weeks, Caldas Gold will be fully funded to expand Caldas’ mining operations into the Marmato Deep Zone “MDZ”, massively increasing the gold and silver production profile of the Marmato mine.
The Marmato mine is located in the Department of Caldas, in the middle cauca belt that also is home to Zijin’s Buritica Gold Mine.
The Marmato Project: Expansion at Depth
The Marmato mine has been in operation since 1991 and has produced an average of ~24,000 ounces of gold annually over the last 10 years with 25,750 ounces of gold in 2019. However, exploration revealed there is more at depth to continue mining at depth to dramatically increase gold and silver production.
Acquired in 2011 with Gran Colombia’s merger with Medoro, the Marmato Project now will stand on its own as a spin-out of Gran Colombia Gold (TSX: GCM) in February 2020. Gran Colombia maintains a 57.5% equity interest in the company. In a telephone call, Serafino Iacono, president of Caldas, commented on the logic behind the new company.
“We decided to create a new company, mostly because of the history of Gran Colombia, we managed to have a large debt and bring it down. what we did not want to do was load Gran Colombia with a debt of $265 million to build out Marmato. I would rather own 60% of the project, then to go back to a company with debt. We now have a nice clean company, still own the project but without the debt, by losing 40% equity.”
According to the company’s most recent resource estai, Marmato hosts 6.6 million ounces of gold defined in the Zona Baja and exploration drilling is continuing to upgrade and expand the Deep Zone mineralization. The bulk of the resource estimate, 4,086,000 ounces, lies in the measured and indicated category with 2,172,000 ounces of gold in the inferred.
A Prefeasibility Study “PFS” confirmed the economic viability of the underground expansion of the Marmato project. At a gold price of $1,400 (USD) per ounce, total life-of-mine “LoM” undiscounted after-tax free cash flow from mining operations amounts to $770-million (USD).
After the initial capital costs of approximately $269.4-million (USD) for expansion into the Marmato Deep zone (MDZ), undiscounted after-tax project cash flow amounts to $500.6-million (USD).
At a 5-per-cent discount rate, the net present value of the total life of mine after-tax project cash flow amounts to $263.9-million (USD). Before financing, the project has a 20.1-per-cent after-tax internal rate of return and payback by 2026.
The company plans to improve and augment current mining operations over the next two years by focusing on two distinct zones in the Zona Baja, the Upper Zone and MDZ.
The company is looking to optimize mining in the Upper Zone and increase production from 1,200 tpd to 1,500 tpd. A total of 5.1 million tonnes to be processed over 13-year life with average LoM Au grade of 4.2 g/t resulting in 600,000 ounces of gold (32% of total) from the upper zone.
The remaining 68% of mined material will come from the MDZ. A Total of 14.6M tonnes processed over 10.5 years starting in mid-2023 at an average LoM Au grade of 2.9 g/t resulting in 1.3M ounces of gold.
(Source: Caldas Gold Presentation, Sept. 2020)
The production profile will ensure the Marmato mine will continue to contribute to the local economy.
Caldas Gold’s investment in Marmato will increase direct and indirect local jobs to 2,700 and add 900 construction jobs over the next three years in the Department of Caldas, Colombia.
Giving Orphans a Home: Exploration Potential North of the Border
The spin-out from Gran Colombia created a new company to give Marmato its own sparkle as its own company. Management is looking to further develop under appreciated assets that shine in their own right.
Announced in May 2020, Caldas Gold acquired the Juby project, from South American Resources “SARC”. Gran Colombia Gold invested $14 million into Caldas by private placement, to fund the acquisition.
The private company has an agreement to acquire the project from a Pan American Silver (TSX: PAAS; NYSE: PAAS) subsidiary Lake Shore Gold. Also part of the deal is a 25-per-cent interest in the Knight Joint Venture with Lake Shore, adjacent to Juby.
SARC will receive 20 million Caldas shares, and Caldas will also make the final payments on the projects to Lake Shore. Lake Shore is owed US$9.5 million to secure the 100-per-cent interest in Juby, with another US$500,000 required to close the Knight JV interest.
The project is located in the heart of a project in Ontario’s Abitibi greenstone belt 100 kilometres southeast of Timmins near the old Kerr-Addison Mine.
Juby is an advanced exploration-stage gold project, with 1.1 million indicated oz. gold contained in 26.6 million tonnes at 1.28 grams gold per tonne. Inferred resources add 2.9 million oz. gold in 96.2 million tonnes grading 0.94 gram gold.
When asked in telephone call about the reason behind the acquisition in Ontario, Iacono of Caldas stated:
“We were orphans for years, Marmato was an orphan project, we started looking at the Juby project because it was an orphan, we convinced them instead of a publicly listed company, still in Canada, Ontario, 8 hours from Toronto, Ontario. It is all about location, location, we believe that is has big potential, it is one of these projects, it is the last project on the last, it is a progression of a companies that own it, it never got the right attention, this is the perfect project, we are very knowledgeable about the project and hope to upgrade it to a development project by 2021.”
Caldas Gold also owns 100% of the Juby Project, an advanced exploration-stage gold project located within the Shining Tree area in the southern part of the Abitibi greenstone belt about 100 kilometres south-southeast of the Timmins gold camp.
The company currently has 77.5 million shares outstanding with a market capitalization of $230.2 million (CDN) as of Sept. 8, 2020. Shares in the company were trading at 2.97 on sept 8 with a 52-week high of $3 and a 52-week low of $1.30.
The gold miners’ stocks are mired in correction mode, which isn’t surprising after their mighty post-stock-panic upleg. Huge buying catapulting them higher left this sector extremely overbought. Corrections are normal and healthy after prices get too stretched technically. They eradicate upleg toppings’ excessive greed, rebalancing sentiment. That paves the way for bulls’ next uplegs, and offers great buying opportunities.
The most-popular gold-stock benchmark today is the GDX VanEck Vectors Gold Miners ETF. It includes the world’s biggest and best gold miners, dwarfing its peers in size. Launched way back in May 2006, GDX’s first-mover advantage has grown insurmountable. This ETF’s $17.9b in net assets this week are running 31.4x larger than its next biggest competitor’s in the 1x-long major-gold-miners-ETF space. GDX is king.
Gold stocks have a well-deserved reputation for excessive volatility, which is a key reason they are so alluring. When the stars align right for them, meaning a big and persistent gold upleg, their stock prices skyrocket! We just witnessed that in this sector’s enormous upleg following March’s COVID-19-lockdown-fueled stock panic. The subsequent gold-stock gains were among the largest out of all stock-market sectors.
As gold temporarily got sucked into that stock panic, GDX was pummeled to a deep low of just $19.00. Those radically-oversold conditions gave the gold stocks massive room to mean revert far higher. And that’s exactly what they did over the following 4.8 months into early August, where GDX rocketed a stupendous 134.1% higher! Contrarian traders who bought in soon after the stock panic multiplied their capital.
But such colossal gains in such a short span generated incredible greed, and left GDX way overextended technically. So over the next 4 trading days into mid-August, GDX corrected 12.2%. Since then it has been consolidating high, meandering in a tight trading range between that upleg top and initial correction low of $44.48 and $39.05. Until GDX powers to new bull-market highs, it technically remains in correction mode.
Many if not most traders hate these necessary selloffs after bull-market uplegs. Unlike powerful rallies to major new highs, corrections aren’t any fun. But they do offer the best opportunities to buy relatively low in ongoing bull markets. Bulls’ inevitable alternating series of uplegs followed by corrections also greatly expand their tradable gains. Correction bottomings are when to buy low before later selling high at upleg toppings.
Because GDX has spent the past 6 weeks or so mostly drifting in the low $40s, those levels increasingly feel normal. But they are actually quite high in the context of this 4.6-year-old gold-stock bull. This first chart shows the whole thing through the GDX lens. Gold stocks have run really far really fast thanks to that huge post-panic upleg! That’s a big reason why they stalled out in early August to start correcting.
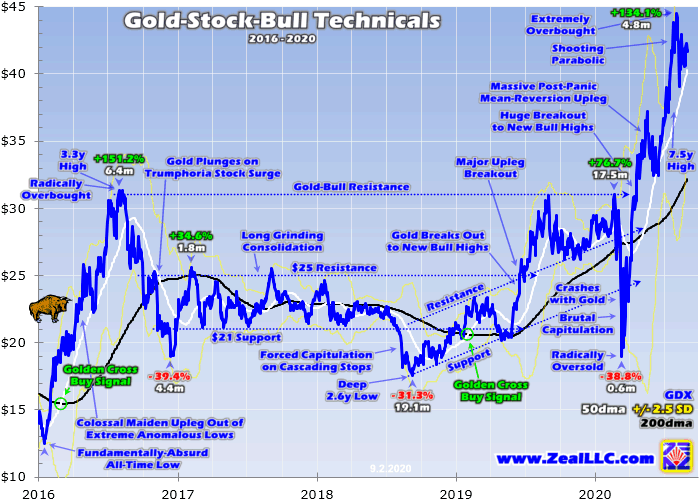
Relative to their bull market, the major gold stocks shot parabolic in recent months. The tail end of that gargantuan 134.1% upleg went vertical, leaving GDX extremely overbought at a 7.5-year secular high! This leading sector benchmark soared way above both its 200-day moving average and 50-day moving average, rendered in black and white here. There’s no doubt gold stocks are really stretched technically.
When any prices surge too far too fast, they stoke excessive popular greed. Traders rush in to chase the quick gains, expecting them to persist indefinitely. But pulling forward big buying rapidly exhausts traders’ available capital firepower. Soon everyone who wants to buy in anytime soon has already fully deployed their limited funds in the red-hot sector. Only sellers remain, and they soon overpower the dwindling buying.
The building selling momentum fuels corrections, which work off technical overboughtness while bleeding away excess greed. The gold-stock realm is like Texas, everything is bigger there! So corrections are as outsized as uplegs, making them nothing to be trifled with. Looking at the upleg-correction cycles so far in this secular gold-stock bull offers important insights into what is likely in our current young correction.
Gold stocks’ massive post-stock-panic soaring this year was this bull’s fourth upleg. All four averaged hefty 99.2% gains over 7.6 months. The first three uplegs were followed by corrections clocking in at a serious mean of 36.5% over 8.0 months. If today’s fourth correction rises to that bull-market precedent, it would batter GDX all the way back down to $28.24! That’s a heck of a long ways farther down from here.
But for a variety of reasons, the gold stocks probably won’t have to collapse so far this time around before adequately rebalancing sentiment. This gold-stock bull’s first three corrections were each dragged down to more-severe levels by unusual events. The first and largest one into late 2016 grew anomalously big after Trump’s surprise election win. Gold and gold stocks were shunned as stock markets surged on tax-cut hopes.
The second correction into late-summer 2018 was exacerbated by extreme speculator positioning in gold futures, driving rare cascading stop-loss selling. And of course the third one earlier this year was driven by a full-blown stock panic, which are normally only seen about once a century. Typical corrections in gold-stock bulls run closer to 20% to 30%, which we can call 25%. That’s much less painful than 37%.
Because of gold miners’ high inherent profits leverage to gold prices, gold-stock corrections tend to mirror and amplify gold’s own. The major gold stocks dominating GDX usually exaggerate gold’s own upleg-correction cycles by 2x to 3x. And of course gold is much less volatile than its miners’ stocks. So a normal 10% gold correction multiplied by 2x to 3x yields that same 20%-to-30% correction range, averaging 25%.
25% off of early August’s euphoric gold-stock peak would drag GDX down to $33.36. That is still way under this past month’s lower-$40s drift. Interestingly that would also push GDX back down near its 200-day moving average, which is running $32.15 as of the middle of this week. 200dmas happen to be the highest-probability bottoming zones technically for bull-market corrections without exacerbating factors.
A GDX 200dma approach today would likely signal the end of this necessary rebalancing correction. That is the ideal time to buy relatively low, aggressively redeploying in beaten-down gold stocks. While no one knows in advance how closely GDX will retreat to its 200dma, the closer it gets the better the odds this correction has largely run its course. Considering price levels compared to their 200dmas is a great trading tool.
I’ve been researching this key technical relationship for a couple decades now, and actively trading gold stocks based on it with great success. I call this method Relativity Trading, since it looks at gold-stock price levels relative to their 200dmas. This simple-yet-powerful relationship can be quantified by dividing GDX’s daily closes by their current 200dmas. That yields the Relative GDX indicator, or rGDX for short.
Charted over longer periods of time, this rGDX ratio forms horizontal trading ranges. They effectively reveal how overbought or oversold gold-stock prices are, which are the best times to sell high and buy low. This rGDX chart tracks this multiple during this gold-stock bull to date. Visualize Relativity charts as flattening out 200dmas to 1.00x, and recasting price action around that in comparable constant-percentage terms.
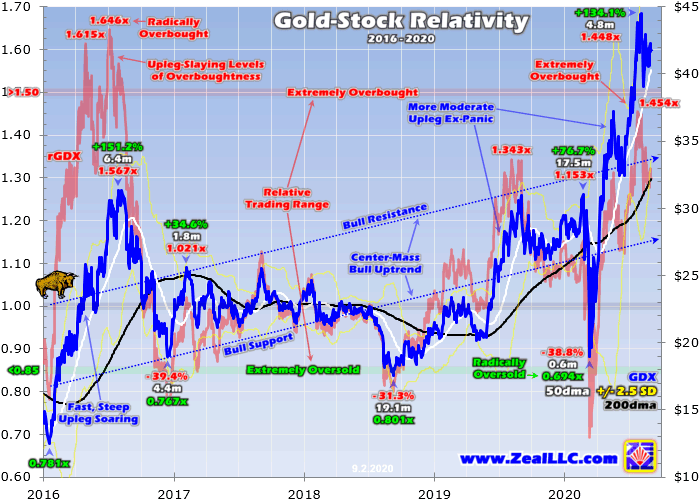
Relativity trading ranges are based off the past 5 calendar years’ price action. The Relative GDX has mostly meandered between 0.85x to 1.50x during this span, which coincides with this secular gold-stock bull. Gold stocks are extremely oversold when the rGDX falls under 0.85x. At mid-March’s stock-panic low, this metric plunged to a radically-oversold 0.694x! So we backed up the truck to aggressively buy then.
While our specific stock trades are only recommended to our paying newsletter subscribers graciously keeping us in business, I did flag that incredible buy-low opportunity publicly in a weekly essay in early April. Published on April 3rd when GDX was still under $25, I warned “All this argues that a major new gold-stock upleg is getting underway, portending big gains coming!” and “the gold stocks will power far higher.”
While extreme technicals and sentiment alone supported that bold contrarian call, so did gold miners’ amazing fundamentals. Higher prevailing gold prices guaranteed much-higher profits for the gold stocks, which indeed came to pass. Several weeks ago I did a deep quarterly dive into the actual Q2 operational and financial results of the major GDX gold miners. Sector-wide implied earnings soared 66.2% YoY last quarter!
But after GDX skyrocketed 134.1% in just 4.8 months out of those crazy stock-panic lows, that left gold stocks extremely overbought. That rGDX indicator stretched as high a 1.454x in late July, and was still way up at 1.448x when the major gold stocks crested in early August. In other words, GDX stretched a massive 45% over its 200-day moving average! That was challenging the 50%+ extremely-overbought levels.
Overboughtness is a short-term technical condition totally independent from underlying fundamentals that govern longer-term gold-stock fortunes. Once gold stocks run too far too fast exhausting all near-term buying potential, they need to correct no matter how profitable mining gold is. Excessive greed still needs to be bled away to rebalance sentiment. And excessively-extended technicals need to mean revert back to norms.
And that is exactly what has started happening in this sector over the past month since GDX peaked. The rGDX plunged as low as 1.259x in mid-August as GDX’s initial sharp 12.2% 4-trading-day selloff bottomed. Since then GDX has drifted around 31% above its 200dma, with the rGDX running 1.299x in the middle of this week. While way less overbought than 45%, 31% remains far above the correction-ending 0%.
Extreme overboughtness can be worked off two ways, correcting or consolidating. Gold stocks can either sell off fast enough to mean revert back near their 200dma, or they can drift sideways long enough for that 200dma to catch up. While investors prefer the lower volatility and milder selloffs of consolidations, faster corrections are much more beneficial to speculators. They usher in superior buy-low opportunities quicker.
While GDX did plunge into formal correction territory over 10% in those initial days after it crested in early August, the gold-stock price action since has been more consolidation-like. But consolidations can morph into corrections at any time, depending on what gold stocks’ dominant primary driver gold does. GDX can still easily slump into a bigger correction here, likely much closer to 25% than the mild 12% seen so far.
Gold’s own overboughtness relative to its 200dma in early August proved far more extreme than the gold stocks’. The rGold indicator soared to nosebleed heights of 1.260x, an 8.9-year high! The last time gold was so overextended technically was back in September 2011 soon after its previous secular bull had peaked. That extreme exhausted gold’s bull, birthing a bear that would crush it 44.5% lower in the next 4.3 years.
While gold’s current secular bull isn’t likely to fail yet for plenty of fundamental and sentimental reasons outside the scope of this essay, gold really needs to correct after such epic overboughtness! But at worst so far after peaking in early August, gold only dropped 7.5% in this selloff’s initial few trading days. It is hard to imagine it not falling into 10%+ correction territory given those crazy technical and sentimental extremes.
A 10% gold selloff would drag this metal back down near $1856, which is another 4.5% lower from where it was trading in the middle of this week. And if the gold stocks amplify gold’s losses by that usual 2x to 3x, that extends GDX’s correction near 25%. While seeing GDX back down near $33.36 is no big deal at all in gold-stock-bull context, that is still another 20.1% lower than its mid-week prevailing level of $41.76!
With the major gold stocks undeniably in a correction, why buy now if they are likely to drift or plunge still another 20% or so lower before it bottoms? Trading, both speculation and investment which only differ by time horizons, is all about buying low then later selling high. The best times to buy relatively low within ongoing bull markets is when corrections have largely run their courses. GDX is nowhere near that point yet.
GDX has to retreat closer to its 200dma, which will be evident in that rGDX indicator and normal charts. This leading gold-stock ETF doesn’t necessarily have to fully return to its 200-day moving average, but it has to get a heck of a lot closer than 30% above. Plenty of other factors will help determine when to resume pulling the trigger on buying fundamentally-superior gold stocks, which I discuss constantly in our newsletters.
But whenever and wherever this gold-stock correction bottoms, the gold miners’ fundamentals continue to strongly support another major bull-market upleg. Once sentiment is rebalanced and technicals are no longer stretched, gold stocks’ upside potential in the subsequent months is massive. So I’m really looking forward to redeploying hand over fist into excellent gold miners once the necessary green lights flash.
My recent essay on the GDX gold miners’ Q2 results dove deeply into their fundamentals. You ought to read that if you missed it a few weeks ago. But in a nutshell, here’s the current situation. With Q3’20 now 2/3rds over, gold has already averaged an all-time-record high $1910. Even if we assume gold corrects hard enough in the rest of Q3 to drag that average down to $1875, that is wildly profitable for gold miners.
Over the past four reported quarters, the GDX gold miners averaged all-in sustaining costs of $933 per ounce. AISCs are actually likely to fall in Q3 with gold output rebounding following Q2’s shrinkage from government-imposed national lockdowns. But at $1875 gold and $933 AISCs, the major gold miners are on track to earn a colossal $942 per ounce in this current quarter. That would surge 59.5% from Q3’19 levels!
So the gold stocks still have big bull-market gains to come after they weather this necessary and healthy correction. Even after that enormous 134.1% post-stock-panic upleg, additional massive upside is still fundamentally justified in this contrarian sector! Higher prevailing gold prices drive much-higher earnings for the gold miners, which ultimately support much-higher stock prices. Those come gradually over time in bulls.
All bull markets naturally flow then ebb, taking two steps forward before retreating one step back. Their price action gradually meanders around uptrends. This normal upleg-correction pattern keeps sentiment balanced, extending bull markets’ longevity. And it is a huge boon for traders, offering excellent mid-bull opportunities to buy relatively low before later selling relatively high. That greatly expands bulls’ potential gains!
At Zeal we started aggressively buying and recommending fundamentally-superior gold and silver miners in our weekly and monthly subscription newsletters back in mid-March right after the stock-panic lows. We layered into dozens of new positions before gold stocks grew too overbought, which were stopped out recently at huge realized gains running as high as +199%! Our subscribers multiplied their wealth within months.
To profitably trade high-potential gold stocks, you need to stay informed about their technicals, sentiment, and fundamentals. And what is moving gold, their dominant primary driver. Our popular newsletters are a great way. They draw on my vast experience, knowledge, wisdom, and ongoing research to explain what’s going on in the markets, why, and how to trade them with specific stocks. Subscribe today and take advantage of our 20%-off sale! Corrections are the time to do your gold-stock homework, preparing to redeploy as they pass.
The bottom line is gold stocks are in correction mode. They shot parabolic into early August, surging too far too fast exhausting the capital firepower available for near-term buying. Then they quickly plunged into a mild correction, which has morphed into a high consolidation since. But with gold stocks remaining very overbought technically, and greed still elevated after an insufficient selloff, a resurgent correction is likely.
That could easily extend to 25% in GDX, another 20% lower from this week’s levels. The depth of this necessary and healthy rebalancing selloff for gold stocks depends on what happens in gold. The larger gold’s own correction, the farther the amplifying gold stocks will drop. But bigger and faster is better for traders, yielding much-better buy-low opportunities sooner than if gold stocks instead keep drifting sideways.
- While most of the Corona news is “baked” into the gold price, when the dust settles, $2000-$2500 is likely to be the new floor.
- Please click here now. The $1000 floor for gold took time to establish and the process involved significant pain for gold price enthusiasts.
- Please click here now. Double-click to enlarge this short-term gold chart.
- Establishing a $2000 floor should create only minor investor discomfort… and many miners will continue to soar higher during the process!
- Gold rallied through the minor high near $1988 and is now likely to push through $2000 and challenge the minor high at $2025.
- Please click here now. It’s not just the US creep state (government and central bank) that is recklessly borrowing and printing vast amounts of fiat money.
- The Indian creep state refuses to cut the gold import tax but is always happy to borrow more fiat in the name of the taxpayers.
- Ominously, they are starting to mimic the madmen of the West and print it maniacally too.
- They call their debt ramp-up a “stimulus” for the mangled economy, but the debt will be permanent and serve as a platform for higher inflation.
- Speaking of inflation, please click here now. Warren Buffett recently bought into Barrick, and now he’s buying key Japanese stocks… in what appears to be another move to benefit from rising inflation.
- Banks can generate good profits in an inflationary environment, but only if rates go higher.
- That doesn’t look likely because the debt-obsessed US government could implode if rates rose even modestly.
- Warren likely senses something is different from the 1970s with this potential inflationary wave, so he’s wisely shunning banks and embracing commodity stocks.
- Please click here now. Double-click to enlarge my dollar versus yen aimless drift chart.
- Decades ago, the USDX was an important tool for gold analysts, and then it was dollar-yen that mattered. Now, almost all governments are borrowing and printing in a similar (and arguably criminal) manner.
- I’ve predicted that the yen would lose its safe-haven status. That’s happening now; gold is rising against the dollar while the yen goes nowhere against it.
- The most important chart for gold investors is now their home currency fiat versus gold chart.
- That’s because the world’s major fiat currencies have become macabre debt-oriented jokes. Governments are doing almost nothing but bragging about how they can borrow and print even more of this fiat “funny money”.
- The bottom line: Government debt worship is dangerous, disgusting, and great news for gold!
- Please click here now. Double-click to enlarge this magnificent GDX chart. A possible breakout from a beautiful symmetrical triangle is in play, with a $50 price target.
- Momentum players should get positioned on any further upside action and all investors should watch the $44 minor high.
- It can be argued from an Edwards & Magee chart analysis perspective… that a move above that price officially reinvigorates the uptrend.
- Please click here now. As expected, silver burst upside from the inverse head and shoulders bottom I highlighted on this chart… and now looks ready to test this year’s highs.
- Silver is a “must own” asset in an inflationary environment. Using both 1970s inflation and Fibonacci analysis, it’s my contention that if inflation surges as gold moves towards $3000, silver could rally to about $140. That’s a gold to silver ratio of about 20:1, akin to what was achieved at the peak of the action in 1980!
If you would like to receive our free newsletter via email, simply enter your email address below & click subscribe.
 Follow us on Twitter
 Become our facebook fan
CONNECT WITH US
Tweets
Tweet with hash tag #miningfeeds or @miningfeeds and your tweets will be displayed across this site.
MOST ACTIVE MINING STOCKS
Daily Gainers
 CMC Metals Ltd. CMC Metals Ltd. |
CMB.V | +900.00% |
 Eden Energy Ltd Eden Energy Ltd |
EDE.AX | +200.00% |
| GoviEx Uranium Inc. |
GXU.V | +42.86% |
| Eagle Nickel Ltd. |
ENL.AX | +41.67% |
| Citigold Corp. Limited |
CTO.AX | +33.33% |
| Mount Burgess Mining NL |
MTB.AX | +33.33% |
| Exalt Resources Limited |
ERD.AX | +31.94% |
| Casa Minerals Inc. |
CASA.V | +30.00% |
| Cariboo Rose Resources Ltd |
CRB.V | +28.57% |
| Belmont Resources Inc. |
BEA.V | +28.57% |


