
The gold miners’ stocks have mostly been correcting in recent months, after blasting higher with gold last summer. While this necessary and healthy selloff to rebalance sentiment likely isn’t over yet, this sector is entering its strongest seasonal rally of the year. That portends big gains in coming months as the next bull-market uplegs in gold and its miners’ stocks get underway. These seasonal tailwinds amplify upside.
Seasonality is the tendency for prices to exhibit recurring patterns at certain times during the calendar year. While seasonality doesn’t drive price action, it quantifies annually-repeating behavior driven by sentiment, technicals, and fundamentals. We humans are creatures of habit and herd, which naturally colors our trading decisions. The calendar year’s passage affects the timing and intensity of buying and selling.
Gold stocks exhibit strong seasonality because their price action mirrors that of their dominant primary driver, gold. Gold’s seasonality generally isn’t driven by supply fluctuations like grown commodities see, as its mined supply remains relatively steady year-round. Instead gold’s major seasonality is demand-driven, with global investment demand varying considerably depending on the time in the calendar year.
This gold seasonality is fueled by well-known income-cycle and cultural drivers of outsized gold demand from around the world. And the biggest seasonal surge of all is just getting underway heading into winter. As the Indian-wedding-season gold-jewelry buying that normally drives this metal’s big autumn rally winds down, the Western holiday season ramps up. The holiday spirit puts everyone in the mood to spend money.
Men splurge on vast amounts of gold jewelry for Christmas gifts for their wives, girlfriends, daughters, and mothers. The holidays are also a major engagement season, with Christmas Eve and New Year’s Eve being two of the biggest proposal nights of the year. Between a third to a half of the entire annual sales of jewelry retailers come in November and December! And jewelry historically dominates overall gold demand.
According to the World Gold Council, from 2015 to 2019 jewelry demand averaged 51% of gold’s overall global demand! That’s much larger than gold investment demand’s 29% share. And in this crazy 2020 dominated by the COVID-19 pandemic, holiday gold-jewelry buying could prove even bigger than normal. After cratering earlier this year during governments’ draconian national lockdowns, big catch-up buying is due.
The WGC publishes the best-available world gold fundamental data quarterly, and the latest report as I pen this essay is Q2’20’s. During the first half of this year, global gold-jewelry demand plummeted an astounding 46% year-over-year! That was wildly unprecedented, largely driven by pandemic mitigation measures in the jewelry-demand powerhouses of China and India. But as lockdowns pass, gold buying is normalizing.
From 2015 to 2019, fully a third of global jewelry demand came from China. In Q1’20 which proved the height of that country’s stay-at-home orders and general COVID-19 fear, jewelry demand collapsed 66% YoY. But in Q2’20 as the Chinese government lifted restrictions and claimed the virus was under control, jewelry demand improved considerably falling 36% YoY. The Chinese are resuming buying as normal life returns.
But the big holiday-season gold-jewelry splurge is more of a Western thing. Because of this pandemic, American gold-jewelry demand could explode in Q4’20 for a couple reasons. With the great majority of people spending far less on services including travel due to COVID-19 worries, sales of goods have been soaring. While a lot of Americans are struggling, plenty aren’t. So analysts expect a big Christmas season.
And learning to live with COVID-19 and governments’ heavy-handed responses to it has made 2020 the most stressful year of our lifetimes. Marriages have been under serious strain with work and school being shoehorned into homes and stress-relieving vacations cancelled. So legions of husbands are likely to buy their frazzled wives impressive gold jewelry this year. That holiday demand could prove exceptional.
The usual frenzied Western jewelry buying heading into Christmas shifts to pure investment demand after year-end. That’s when Western investors figure out how much surplus income they earned during the prior year after bonuses and taxes. Some of this is plowed into gold in January, driving it higher. Finally the big winter gold rally climaxes in late February on major Chinese New Year gold buying flaring up in Asia.
So during its bull-market years, gold has always tended to enjoy major winter rallies driven by these sequential episodes of outsized demand. Naturally the gold stocks follow gold higher, amplifying its gains due to their great profits leverage to the gold price. Today gold stocks are now once again heading into their strongest seasonal rally of the year, driven by this annually-recurring robust winter gold demand.
Since it is gold’s own demand-driven seasonality that fuels gold stocks’ seasonality, that’s logically the best place to start to understand what’s likely coming. Price action is very different between bull and bear years, and gold remains in a middle-aged bull market. After falling to a 6.1-year secular low in mid-December 2015 as the Fed kicked off its last rate-hike cycle, gold powered 29.9% higher over the next 6.7 months.
Crossing the +20% threshold in March 2016 confirmed a new bull market was underway. Gold corrected after that sharp initial upleg, but normal healthy selling was greatly exacerbated after Trump’s surprise election win. Investors fled gold to chase the taxphoria stock-market surge. Gold’s correction cascaded to serious proportions, hitting -17.3% in mid-December 2016. But that remained shy of a new bear’s -20%.
Gold rebounded sharply from those severe-correction lows, nearly fully recovering by early September 2017. But gold failed to break out to new bull-market highs, then and several times after. That left gold’s bull increasingly doubted, until June 2019. Then gold surged to a major decisive breakout confirming its bull remained alive and well! Its total gains grew to 96.2% over 4.6 years by early August 2020, still modest.
Gold’s last mighty bull market ran from April 2001 to August 2011, where it soared 638.2% higher! And while gold consolidated high in 2012, that was technically a bull year too since gold just slid 18.8% at worst from its bull-market peak. Gold didn’t enter formal bear-market territory until April 2013, thanks to the crazy stock-market levitation driven by extreme distortions from the Fed’s QE3 bond monetizations.
So the bull-market years for gold in modern history ran from 2001 to 2012, skipped the intervening bear-market years of 2013 to 2015, then resumed in 2016 to 2020. Thus these are the years most relevant to understanding gold’s typical seasonal performance throughout the calendar year. We’re interested in bull-market seasonality, because gold remains in its latest bull today and bear-market action is quite dissimilar.
Prevailing gold prices varied radically through these modern bull years, running between $257 when gold’s last secular bull was born to early August’s newest record high of $2062. All those long years with that great range of gold levels have to first be rendered in like-percentage terms in order to make them perfectly comparable. Only then can they be averaged together to distill out gold’s bull-market seasonality.
That’s accomplished by individually indexing each calendar year’s gold price action to its final close of the preceding year, which is recast at 100. Then all gold price action of the following year is calculated off that common indexed baseline, normalizing all years regardless of price levels. So gold trading at an indexed level of 105 simply means it has rallied 5% from the prior year’s close, while 95 shows it’s down 5%.
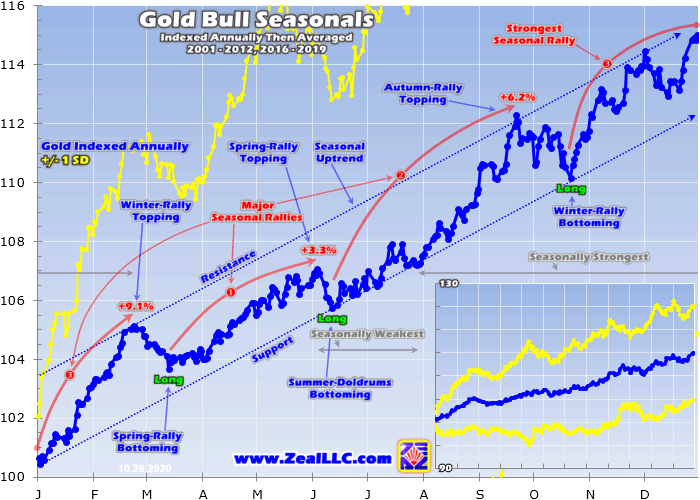
This chart averages the individually-indexed full-year gold performances in those bull-market years from 2001 to 2012 and 2016 to 2019. 2020 isn’t included yet since it remains a work in progress. This bull-market-seasonality methodology reveals that gold’s strongest seasonal rally by far is its winter one which tends to start in late October. That portends big gains in coming months from correction-depressed gold stocks.
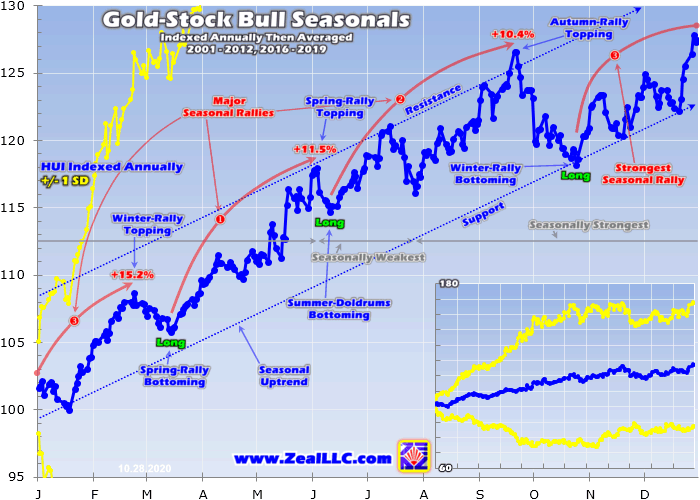
During these modern bull-market years, gold has enjoyed a strong and pronounced seasonal uptrend. From that prior-year-final-close 100 baseline, it has powered 15.0% higher on average by year-ends! These are major gains by any standard, especially averaged across 16 different years. The majority of these annual seasonal gains accrue during gold’s big winter rally, which tends to start in late October.
On average gold’s biggest seasonal selloff of the year following its autumn rally topping tends to bottom on that month’s 16th trading day. That happened to be October 22nd this year. From there gold surges 9.1% higher on average by late February. That big winter rally dwarfs the spring and autumn seasonal rallies which have averaged 3.3% and 6.2% gains. This winter-rally span is the best time to be long gold!
But seasonality comes with an important caveat, it can’t override gold’s primary drivers of sentiment, technicals, and fundamentals. They are the engines moving gold prices, while seasonals act more like prevailing winds boosting or hindering wherever gold is heading under its main locomotion. So this year’s strong winter-rally season could start later than normal after gold’s underway correction runs its course.
Gold shot parabolic last summer on extreme differential gold-ETF-share demand, which went missing in action after gold peaked losing its greed-stoking upside momentum. That left this metal extraordinarily overbought, necessitating a healthy correction to rebalance away euphoric sentiment and normalize super-stretched technicals. Exacerbating gold’s downside risk was a very-low US dollar, which needed to bounce.
A rapidly-strengthening US dollar unleashes major gold-futures selling by leveraged speculators. The resulting falling gold prices scare gold-ETF shareholders into dumping their own positions, amplifying the correction. With gold remaining well above its 200-day moving average which is major correction support, this process might not be over yet. So gold’s winter rally could be delayed until this rebalancing selloff ends.
That would compress gold’s winter rally into the later months of this span. On average in these modern gold-bull years of 2001 to 2012 and 2016 to 2019, gold has tended to climb 2.4% in Novembers, 1.1% in Decembers, 3.1% in Januaries, and 1.7% in Februaries. So even if these peak seasonal tailwinds are delayed a few weeks until gold’s correction finishes its important work, there’s still plenty of time for the winter rally.
Naturally the gold miners’ own seasonality is directly driven by gold’s. The leading gold-stock benchmark and trading vehicle is the GDX VanEck Vectors Gold Miners ETF. It tends to amplify material gold-price moves by 2x to 3x. If gold’s own winter rally sees a delayed start this year due to that healthy correction, so will the gold stocks’ winter rally. But they are still likely to see major gains compacted into a shorter time frame.
This next chart applies this same modern-gold-bull-year seasonality methodology to gold stocks. Since GDX was born later in May 2006, its price history is insufficient for longer-term studies. Thus the classic HUI gold-stock index is used instead. GDX and the HUI closely track each other, they are functionally interchangeable containing most of the same major gold stocks. Gold gains drive their big winter rally.
During these same modern gold-bull-market years of 2001 to 2012 and 2016 to 2019, the gold stocks as measured by the HUI enjoyed average gains of 15.2% between late October to late February. That also makes the gold stocks’ winter rally their largest seasonal one of the year, besting both the spring rally’s 11.5% gain and autumn rally’s 10.4% upside. Winter also sees gold stocks’ strongest cluster of monthly rallies.
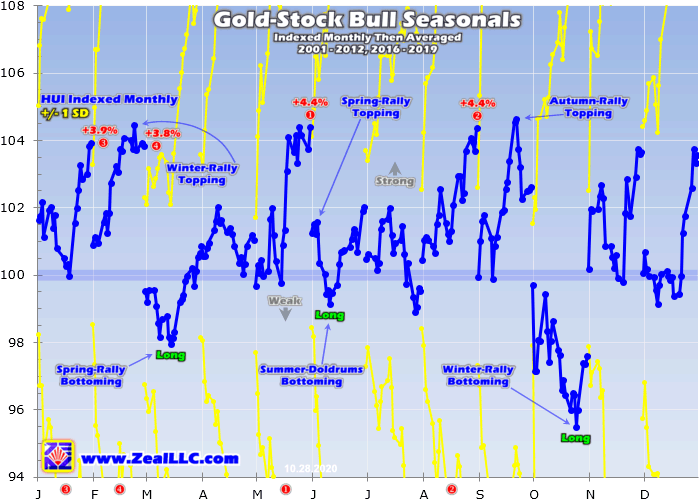
The monthly performances underlying these calendar-year seasonals are easier to understand if gold-stock seasonality is instead sliced into months. This next chart does just that, offering a more-granular perspective on seasonality. Each calendar month in these same modern bull-market years is individually indexed to 100 as of the previous month’s final close, then all like-months’ indexes are averaged together.
The major gold stocks have averaged impressive 3.7%, 3.6%, 3.9%, and 3.8% gains in Novembers, Decembers, Januaries, and Februaries! The latter couple months climaxing their strong winter rally rank as the 3rd and 4th best months of the year seasonally. So there is no more important time to be heavily long the gold miners. Even if the gold correction delays and compresses this winter rally, big gains are coming.
Gold stocks will naturally rally with the metal that overwhelmingly drives their profits when gold’s next bull-market upleg gets underway. Gold-stock corrections and uplegs mirror and amplify gold’s own, running parallel to them at an exaggerated scale. So whenever gold gets sufficiently oversold forcing sentiment to bearish-enough levels to wrap up this correction, gold stocks will bottom in sympathy. That’s when to buy big!
But it’s the gold miners’ wildly-bullish fundamentals that could supercharge their coming winter rally. The record prevailing gold prices this year have blasted gold-stock profits stratospheric, with earnings growth likely to continue soaring. When strong seasonal tailwinds line up with bullish sentiment, technicals, and fundamentals, seasonal rallies balloon to outsized proportions. That makes coming months’ potential huge.
The gold miners are currently reporting their Q3’20 operational and financial results, which are due by mid-November. They should collectively reveal epic profits growth, justifying far-higher gold-stock prices during gold’s next bull upleg. Right after every quarterly earnings season, I do a deep fundamental dive into how the major gold miners of GDX are faring as a whole. Their collective Q3 results should prove awesome.
Gold-mining profitability is driven by prevailing gold prices less all-in sustaining costs for producing that metal. Thanks to gold’s parabolic upleg peaking in early August, last quarter gold averaged an all-time-record high $1912. That soared 29.8% YoY from Q3’19’s levels! Gold-stock prices are highly leveraged to gold because the miners’ costs are largely fixed. They don’t change much regardless of prevailing gold prices.
Quarter after quarter individual gold mines generally require the same levels of infrastructure, equipment, and employees to feed their fixed-capacity mills with fresh gold-bearing ores. Thus higher gold prices like Q3’s usually directly translate into much-higher earnings. Over the past four reported quarters ending in Q2’20, the GDX major gold miners’ all-in sustaining costs averaged $933 per ounce. Q3’s will likely be lower.
In Q2’20 which was the peak quarter for national lockdowns to fight COVID-19, plenty of gold miners were forced to temporarily suspend operations. The resulting lower output left fewer ounces to spread the big fixed costs of gold mining across, catapulting GDX miners’ AISCs to $984. But with gold mines reopening in late Q2 and early Q3, and miners rushing to make up for lost ounces, Q3 should see lower unit costs.
But even if the past year’s $933 average holds, gold-mining earnings are soaring. Last quarter’s lofty $1912 average gold prices less conservative $933 AISCs imply the major gold miners earned a colossal $979 per ounce wresting their product from the bowels of the earth. That would make for stupendous stock-market-leading 66% year-over-year profits growth from Q3’19! And this isn’t some one-off anomaly.
During the last four reported quarters ending in Q2’20, the major gold miners of GDX saw their collective earnings soar 54%, 56%, 56%, and 66% YoY! That’s the big fundamental reason gold-stock prices have rocketed in 2019 and 2020. And with gold’s own bull market likely to keep marching higher on balance for years to come for all kinds of reasons, higher gold prices will continue to fuel outsized gold-miner profits growth.
So there’s a good chance gold stocks’ coming winter rally will be amplified as speculators and investors increasingly discover and marvel at the epic earnings numbers this sector is putting up. Seeing seasonal tailwinds aligning with sentiment, technicals, and fundamentals undergirds the strongest seasonal rallies. So once gold’s necessary correction runs its course, the gold-stock outlook remains incredibly bullish.
Gold-miner valuations remain really low relative to gold, so this sector has lots of lost ground to regain in coming years. And some of that is likely over the next four months which are gold stocks’ seasonally-strongest span of the year. So once gold’s own indicators flash green lights implying its correction is over, traders should aggressively add fundamentally-superior gold miners to ride this sector’s big winter rally.
At Zeal we started aggressively buying and recommending fundamentally-superior gold and silver miners in our weekly and monthly subscription newsletters back in mid-March right after the stock-panic lows. We layered into dozens of new positions before gold stocks grew too overbought, which were stopped out later at huge realized gains running as high as +199%! Our subscribers multiplied their wealth within months.
To profitably trade high-potential gold stocks, you need to stay informed about their technicals, sentiment, and fundamentals. And what is moving gold, their dominant primary driver. Our popular newsletters are a great way. They draw on my vast experience, knowledge, wisdom, and ongoing research to explain what’s going on in the markets, why, and how to trade them with specific stocks. Subscribe today and take advantage of our 20%-off sale! Corrections are the time to do your gold-stock homework, preparing to redeploy as they pass.
The bottom line is gold stocks are just entering their seasonally-strongest period of the year. Their big winter rally is fueled by gold’s own, which is driven first by outsized demand from holiday jewelry buying and later new-year investment buying. So both the metal and its miners’ stocks have strong tendencies to rally between late October to late February in bull-market years. It’s the best calendar span to own gold stocks!
This year’s dawning winter rally has great upside potential after the gold and gold-stock corrections run their courses. The gold miners’ fundamentals remain powerfully bullish, with earnings soaring on higher prevailing gold prices. The resulting low gold-stock valuations should attract lots of new investors to this contrarian sector as Q3’s spectacular results capture their attention. Seasonal tailwinds will amplify that upside.
Adam Hamilton, CPA
October 30, 2020
Copyright 2000 – 2020 Zeal LLC (www.ZealLLC.com)
Last year Scottie Resources (TSX-V: SCOT) / (OTCQB: SCTSF) discovered multiple high-grade, surface gold targets on its newly acquired Summit Lake claims and had exciting drill results on its Bow & Scottie Gold Mine properties.
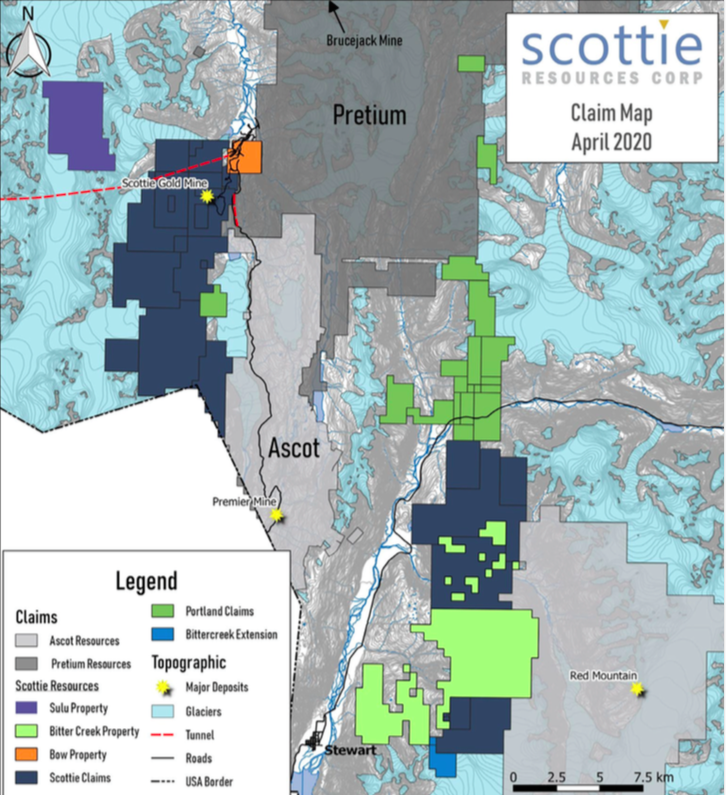
Scottie Resources has been a consolidator of claims in the Golden Triangle (“GT”) of northwestern B.C. Management has grown its footprint from ~400 hectares in 2017 to nearly 24,600 hectares spread across nine properties.
Based on the nature & locations of the mineralizing systems & major structures, management is working the nine properties as two contiguous blocks, the Scottie Gold Mine and Cambria projects.
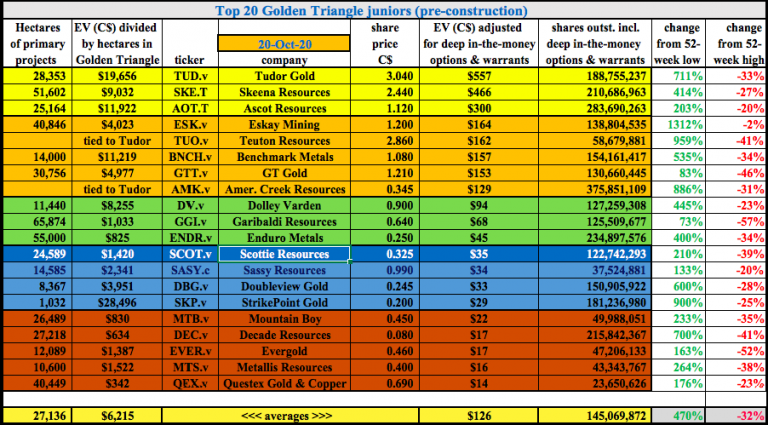
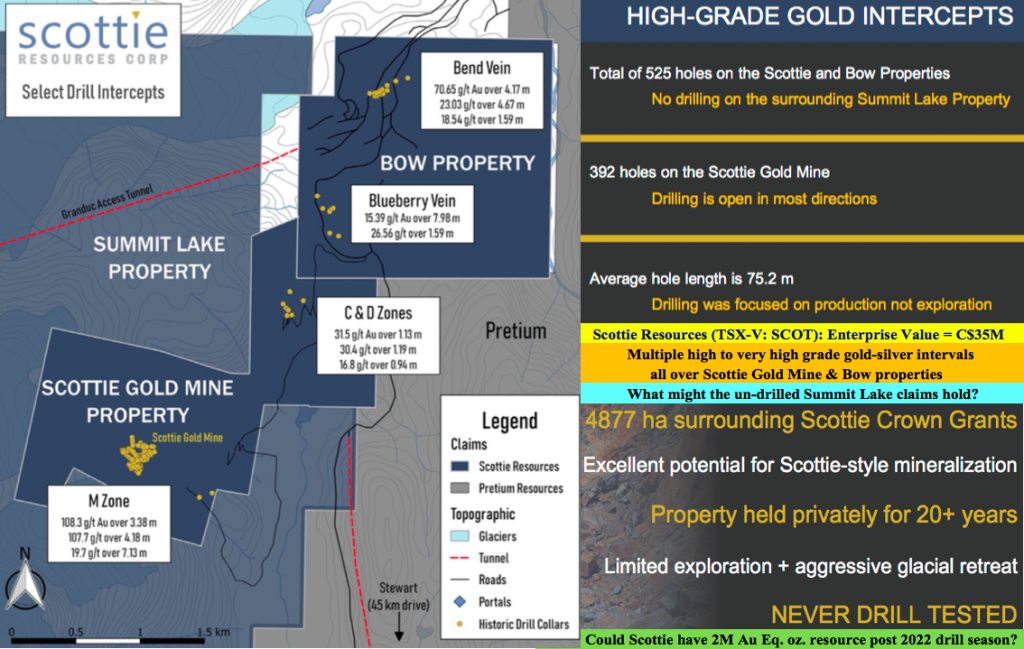
The Scottie Gold Mine project includes the Scottie Gold Mine, Bow, Summit Lake & Stock properties. Exploration on this 8,728-hectare contiguous block is focused on high-grade gold mineralization akin to the Company’s past-producing operation.
Bow saw modest drilling, but delivered notable hits like 73.3 g/t Au over 4.3m, incl. 152.5 g/t over 1.9m, on the Bend Vein, and 7.4 g/t Au over 34.8m, incl. 14.3 g/t over 14.0m, on the Blueberry Vein. The longest drill hole to date on the Scottie Gold Mine property returned an interval of 7.3 g/t Au over 25.0m, incl. 11.7 g/t over 11.0m.
This year, Scottie embarked on an ambitious drill program and recently reported seven assays, including a blockbuster intercept at the Scottie Gold mine project’s O-zone of 109.4 g/t gold + 32.4 g/t silver over 2.5 m.
Readers may recall that the Scottie Gold mine operated from 1981-85, and milled vein material averaging 16.2 g/t. New drill hole SR20-27 intercepted mineralization in a 30 m down plunge step-out from the nearest historical intercept in an open direction.
During the 2020 field season, Scottie completed a total of 7,040 m of diamond drilling – assays on 38 holes are pending. The O-Zone is the northern most of six parallel mineralized structures identified during operation of the past-producing Scottie Gold mine. It contained some of the highest grade intercepts, including 107 g/t gold over 4.2 m.
Importantly, new discoveries are likely and existing mineralized zones are expanding with each new drill hole. CEO Bradley Rourke commented,
“The 2020 drill results continue to intersect gold and silver mineralization. Drilling at Blueberry and the O-Zone continues to expand mineralization down dip and along strike beyond previous extents.”
Despite spectacular grades, the O-Zone area had seen no exploration drilling in nearly 35 years! Previous exploration work identified 13 gold-bearing veins on the project. Management sees significant potential from extensions at depth, additional zones along strike and in parallel mineralized structures.
Scottie’s valuation is attractive, and right in the sweet spot of GT peers. Companies like Pretium, Skeena Resources, Tudor Gold, Ascot Resources & GT Gold are much larger. I think any of these five are prospective acquirers of Scottie, especially Pretium & Ascot, both of whom share borders with the Company.
By the end of next year, Scottie will have the full results from two more drill seasons, putting it in position to deliver a maiden mineral resource estimate. In 2022 there could be a PEA.
In the past I’ve written articles and conducted CEO interviews Scottie Resources’ Brad Rourke. This time I interviewed VP Exploration Dr. Thomas Mumford, Ph.D., P.Geo. He and Mr. Rourke are two of the hardest working execs in the Golden Triangle. And, they both spend A LOT of time in bush, at drill sites — kicking rocks, boots on the ground.
Thomas, please describe how many meters & holes your team drilled this year, and on which properties or targets.
Total drilling this season totaled 7,040 m in 45 holes, so an average of 150 m per hole. Drilling was done on the Blueberry Vein, Bend Vein, numerous Scottie Gold Mine targets, Domino and the 6 oz. zone.
Results on 7 holes were released, 38 assays are pending. The best intercept from the initial batch of assays was 109 g/t gold over 2.5 meters.
Besides drilling, what other exploration was done this season?
We continued our successful 2019 surface mapping & sampling program in areas of significant glacial retreat. We flew a 627-line km airborne electromagnetic survey. We did a few induced polarization (IP) grids over select targets to test the ability of the survey to identify known mineralization and to use it to delineate future drill targets.
Given the substantial amount of drilling done this year, might you be able to deliver a maiden resource estimate after next year’s drilling? Which properties, or what percentage of Scottie’s total land package would a resource estimate cover?
The drilling we have been doing these past two seasons has all been exploration driven, targeting new discoveries and areas with the potential for substantial expansions. What we’re finding is that there are numerous areas with exciting grades and meaningful intercepts. Our aim at the moment is just to define pathways to try to prove up a multi-million-ounce deposit.
The past-producing Scottie Gold mine has some serious high-grade mineralization. However, how do you know that it hasn’t been mined out?
Mined out? Not at all! We continue to expand the areas of known mineralization into open and untested ground, and drilling continues to deliver exceptional results. Less than 100k ounces of gold were taken from the Scottie Gold mine.
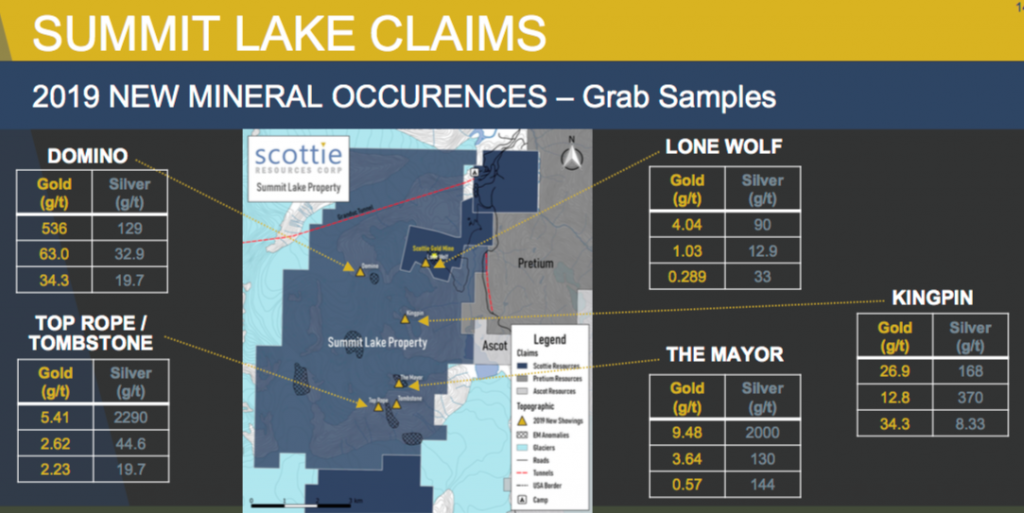
Furthermore, there’s plenty of room, on thousands of contiguous hectares, for new discoveries and to explore, sample & drill in and around historical underground workings. Last year we acquired the 4,877-hectare Summit Lake property that had been in private hands and barely explored for > 20 years.
Grab samples at Summit returned blockbuster gold & silver grades including 536 g/t Au, 63 g/t Au, 2,290 g/t Ag & 2,000 g/t Ag. A new discovery at Summit Lake, the Domino zone, delivered some of the best samples and was a meaningful part of this season’s exploration activities.
Please tell readers more about the Blueberry Vein.
The Blueberry Vein is located two km NE of the Scottie Gold Mine. Historic trenching & channel sampling include results of 103.9 g/t gold over 1.4 m and 203.8 g/t over 1.9 m. Despite high-grade surface samples and easy road access, the Blueberry Vein has seen limited drilling.
This promising target was significantly advanced during Scottie’s 2019 drill program when an interval grading 7.4 g/t gold over 34.8 m was intersected in a new splay of the main Blueberry Vein.
This new near-surface zone is much wider than indicated in previous exploration models, and expansion of it was a strong focus for us during this year’s drill program. Results from drilling and mapping of the area indicate that mineralization extends well past the historic Blueberry Vein, into the host rock.

Instead of the Blueberry Vein, we’re now calling it the Blueberry zone. A total 1,609 m in 11 holes were drilled into the Blueberry Zone during 2020.
Why should readers consider buying shares of Scottie Resources instead of one of the many other Golden Triangle names?
I can’t speak to relative value, but I can reiterate the attributes of our Scottie Gold project. It’s over 8,000 hectares in size, with proven high-grade drill holes in multiple places. Historical production had an average grade of 16.2 g/t gold. Our regional infrastructure is strong compared to some of the other northern Canadian or Alaskan jurisdictions.
We’re fairly close to Seabridge’s massive, advanced-stage KSM project and even closer to Pretium’s Brucejack mine and Ascot Resources‘ Premiere / Red Mountain project.
Over the years, 570 drill holes have been completed on our Scottie and Bow properties. We feel there remains significant potential for additional gold bearing zones at Scottie Gold at depth, along strike, and in parallel structures and Summit Lake is wide open. So, if your readers want high-grade gold & silver and new discovery potential, Scottie Resources is one to look at.
Thank you Thomas, very helpful. I agree that Scottie Resources (TSX-V: SCOT) / (OTCQB: SCTSF) has a lot going for it and can’t wait for drill results from the 38 pending holes.
Disclosures: The content of this article is for information only. Readers fully understand and agree that nothing contained herein, written by Peter Epstein of Epstein Research [ER], (together, [ER]) about Scottie Resources, including but not limited to, commentary, opinions, views, assumptions, reported facts, calculations, etc. is not to be considered implicit or explicit investment advice. Nothing contained herein is a recommendation or solicitation to buy or sell any security. [ER] is not responsible under any circumstances for investment actions taken by the reader. [ER] has never been, and is not currently, a registered or licensed financial advisor or broker/dealer, investment advisor, stockbroker, trader, money manager, compliance or legal officer, and does not perform market making activities. [ER] is not directly employed by any company, group, organization, party or person. The shares of Scottie Resources are highly speculative, not suitable for all investors. Readers understand and agree that investments in small cap stocks can result in a 100% loss of invested funds.
At the time this article/interview was originally posted, Peter Epstein owned no shares of Scottie Resources and the Company was an advertiser on [ER].
Readers should consider me biased in my view of the Company. Readers understand and agree that they must conduct their own due diligence above and beyond reading this interview. While the author believes he’s diligent in screening out companies that, for any reasons whatsoever, are unattractive investment opportunities, he cannot guarantee that his efforts will (or have been) successful. [ER] is not responsible for any perceived, or actual, errors including, but not limited to, commentary, opinions, views, assumptions, reported facts & financial calculations, or for the completeness of this interview or future content. [ER] is not expected or required to subsequently follow or cover events & news, or write about any particular company or topic. [ER] is not an expert in any company, industry sector or investment topic.
Today’s beaten-down US dollar is a major short-term risk for gold. For decades this yellow metal has often inversely mirrored the fortunes of the world’s reserve currency. Dollar trends are important trading cues for highly-leveraged gold-futures speculators, who wield outsized influence over gold prices. So an overdue mean-reversion rebound rally erupting in the US dollar will unleash serious gold selling pressure.
Gold has proven the ultimate universal global money for millennia now, and its US-dollar price American speculators and investors follow is simply these currencies’ exchange rate. So flowing and ebbing dollar levels directly impact prevailing gold prices. Gold generally tends to rally when the dollar weakens, then sell off when it strengthens again. The leading dollar benchmark reveals this powerful inverse correlation.
That is the venerable US Dollar Index, which was launched way back in March 1973. This USDX applies a weighted geometric mean to a basket of major world currencies to track the relative value of the US dollar. The Eurozone countries’ euro, Japan’s yen, and the United Kingdom’s pound sterling dominate the USDX commanding 57.6%, 13.6%, and 11.9% of its total weighting. Three other currencies round it out.
The USDX’s sometimes-domineering influence over gold prices has faded off traders’ radars in recent years. That’s because gold and the US dollar rallied simultaneously through most of 2019, leading many to assume that dollar-gold link was broken. But it merely went dormant, taking a back seat to another big gold driver. Gold was powering higher on massive inflows of stock-market capital through major gold ETFs.
The overwhelmingly-dominant ones are the GLD SPDR Gold Shares and IAU iShares Gold Trust. Just over a month ago I wrote a comprehensive essay analyzing this critical gold-moving dynamic. In times when stock-market capital is deluging into gold, this metal can indeed decouple from the US dollar because stock traders don’t care about it. They chase gold upside momentum, fueling virtuous circles of buying.
But much of the time stock traders aren’t frenziedly shunting vast amounts of money into gold via those major-gold-ETF conduits. In these more-normal conditions, speculators’ gold-futures trading dominates gold’s price action. The incredibly-dangerous leverage extremes these guys run force them to myopically trade very-short-term time horizons. Nothing motivates them to buy or sell gold futures more than dollar swings.
This first charts proves gold’s longstanding opposition to the US dollar’s fortunes remains alive and well. It superimposes gold’s price action during this secular bull over the US Dollar Index’s own along with some of its key technicals. Despite episodes when big differential gold-ETF-share buying worked to overwhelm and suppress the classic dollar-gold relationship, it has still greatly influenced this overall gold bull.
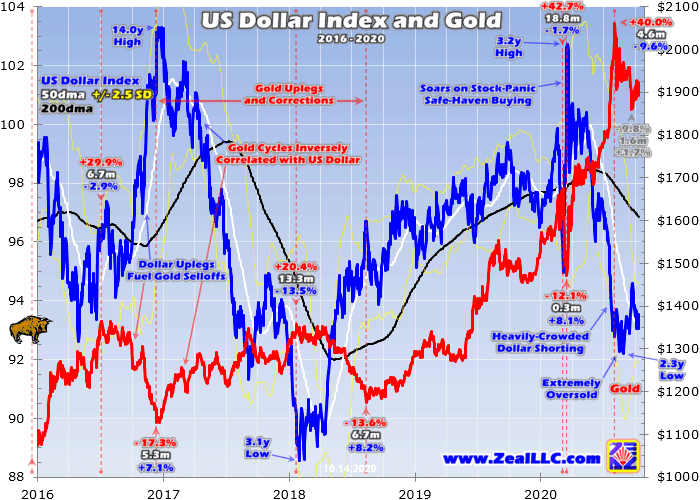
All secular bull markets are an alternating series of uplegs followed by corrections. This current gold bull has enjoyed four major uplegs and suffered three major corrections. And its fourth correction is underway today. That makes for eight separate bull segments so far, which are separated here by vertical red lines. In fully 7/8ths of these segments covering the large majority of this gold bull, gold inversely mirrored the USDX.
That happened to varying degrees, depending on how much capital stock traders were pumping into or out of physical gold bullion through those big gold ETFs. But major gold uplegs coincided with US Dollar Index downlegs, and major gold corrections unfolded on USDX rebound rallies. That’s why the current low US dollar is a serious short-term threat to gold. The USDX slumped to a 2.3-year low in late August.
But this year’s volatile US-dollar action began during mid-March’s brutal stock panic. That was spawned by governments’ draconian national lockdowns to attempt to slow the spread of COVID-19. Those fueled tremendous fear, traders had never seen anything like that. As stock markets plummeted, there was a stampede for the exits and a mad dash for cash. Save-haven US-dollar demand explodes during stock panics!
Before that ugly stock-market selloff cascaded into a full-blown panic, which is a 20%+ plummeting in two weeks or less, gold climbed to $1675 in early March. Not coincidentally that was the same day the USDX bottomed after plunging 4.9% over 12 trading days. Then as the stock selling intensified and the Fed panicked slamming rates back to zero, the oversold USDX rocketed higher in a stratospheric spike.
The red lines above segment gold uplegs and corrections, which don’t always precisely match the days the dollar tops and bottoms. But over the next 8 trading days as the USDX skyrocketed a stupendous 8.1% higher, gold cratered a horrendous 12.1%! When the US dollar is surging, gold-futures speculators rush to dump their long positions and pile on to the selling momentum with new shorts crushing gold.
While compressed into a lightspeed-fast timeframe, that third correction of this gold bull had the same strong-dollar driver as the first two. Back in late 2016, the first correction saw gold plunge 17.3% over 5.3 months partially on a sharp 7.1% USDX rally. That catapulted this leading US-dollar benchmark to a lofty 14.0-year secular high! Gold’s second correction shared this same catalyst of a big-and-fast US-dollar surge.
In roughly the first half of 2018, gold plunged 13.6% over 6.7 months on a sharp 8.2% USDX rally. A much-stronger US dollar has proven a serious short-term threat to gold during this bull, and remains one today. Those three earlier gold corrections averaged 14.3% losses over 4.1 months, which cascaded on the USDX soaring a tight average 7.8%. Those are mighty rallies by glacially-slow currency standards!
After its epic 2020-stock-panic surge, the US dollar was extremely overbought. So it immediately rolled over into a major downleg. That combined with huge differential gold-ETF-share demand is the reason gold was able to soar 40.0% higher over the next 4.6 months. Had the stock-panic-goosed USDX not collapsed 9.6%, gold’s last major upleg would’ve been much smaller. The US dollar’s fortunes still drive gold.
The USDX’s plummeting last summer was driven by heavily-crowded short selling in this world’s reserve currency. Professional traders piled on to the dollar-collapse bandwagon. Not only had the Fed slashed rates to zero killing yields in dollar-denominated US Treasuries, but US-government debt was soaring on trillions of dollars of pandemic-stimulus spending. So dumping the US dollar became fashionable and popular.
Gold started shooting parabolic in late July, soaring a colossal 13.5% higher in less than several weeks! Extreme gold-ETF-share buying was the primary driver. But also boosting gold was the USDX’s sharp 3.2% plunge over that same short span. Gold peaked at $2062 in early August the same day that this dollar benchmark slammed into its initial interim low. The next day’s dollar bounce kicked off gold’s selloff.
The former was short-lived, as the USDX soon tumbled to even-lower lows in late August. But with gold sentiment euphoric and gold technicals extraordinarily overbought, the stronger dollar had already done its damage. With gold’s upside momentum broken, the big differential gold-ETF-share buying in GLD and IAU mostly dried up. Gold consolidated high as the USDX drifted, then resumed selling off as the dollar bounced.
At worst by late September, gold’s selloff extended to 9.8% nearing formal correction territory starting at 10%. During that 1.6-month span, the USDX merely climbed 1.7%. But if you look at higher-resolution daily charts of gold and the US dollar since early August, these competing world currencies are almost moving in perfectly-opposed lockstep. As during this bull’s past corrections, gold is back at the mercy of the dollar.
Unfortunately that is really bearish for gold over the near-term. The battered and heavily-shorted USDX is still way down near major secular lows. That implies it has a lot more mean-reversion rallying left to do, fueled by both short-covering buying and momentum-chasing long buying. And any sustained US-dollar uptrend will force gold into a deeper correction more in line with its bull precedent. That’s a big risk for gold!
One way to quantify the US Dollar Index’s short-term upside potential is looking at where it has traded relative to its 200-day moving average during past gold corrections. Dividing the USDX’s daily close by its 200dma yields the Relative USDX or rUSDX. That is based on the same Relativity Trading principles I analyzed for gold in another essay a month ago. How high was the rUSDX when past gold corrections ended?
This gold bull’s first three corrections finally bottomed at rUSDX levels of 1.071x, 1.044x, and 1.049x. These average out to the US Dollar Index surging to 5.5% above its 200dma. Dollar mean-reversion rallies after major selloffs usually don’t end until considerably over that key technical baseline. But the highest the rUSDX has been since late August’s US dollar secular low is merely 0.974x in late September!
At best this leading US-dollar benchmark was still 2.6% under its 200dma, which is a far cry from that gold-correction-ending 5.5% over. And since the USDX has retreated again as of the middle of this week, it is back down to 3.6% under or a 0.964x rUSDX. The hammered US dollar has much farther to bounce yet before it mean reverts high enough to rebalance away oversold technicals and still-bearish sentiment.
Mean-reversion rebounds fueled by short covering don’t necessarily need a catalytic driver, but there are still plenty of potential ones for the USDX today. In recent weeks the US dollar has rallied in solid up days whenever the perceived odds wane of the US Congress agreeing on another big round of pandemic-stimulus spending. That moderates the ballistic trajectory of US debt growth, making the dollar look stabler.
The upcoming US-election results could fuel major dollar buying. They could change the way currency traders are gaming the likelihood of another big debt-financed government-spending binge. They could ignite stock-market selling fueling safe-haven demand for the US dollar. And remember that over 4/7ths of the USDX’s weighting is in the euro alone! So European events hitting the high euro could drive dollar buying.
The European Central Bank could force its rates even deeper into negative territory, or unleash vast new quantitative-easing bond monetizations weakening that currency. The Eurozone’s economic outlook could darken, making the US look relatively more attractive. COVID-19 infection rates in Europe could keep resurging, leading to more national-lockdown threats from those countries’ governments. Lots could happen.
Only time will tell how high the USDX’s overdue mean-reversion rebound rally will climb, but precedent suggests big dollar gains are likely. This gold bull’s past-few-corrections average rUSDX level of 1.055x when they bottomed implies a lofty 102.2 USDX based on its current 200dma this week. That is a huge 9.4% higher from today’s dollar levels, and would make for a total USDX rally of 10.9%! But I don’t expect that.
In recent years the USDX hasn’t soared back up over 102 without major surprises, including Trump’s stunning presidential victory four years ago and this year’s ultra-rare stock panic. Those shocks helped pull up the USDX’s average rally of 7.8% during this gold bull’s corrections. That average would imply a USDX topping around 99.4, 6.4% above this week’s levels and making for a 7.8% total mean reversion.
The bare-minimum USDX rally gold traders should look for is a 200dma approach, which is way smaller than gold-bull precedent. The USDX’s 200dma is running 96.9 in the middle of this week, though it continues to fall with the dollar so pummeled. Mean reverting back up to that 200dma now would require the USDX to surge another 3.7%, bringing its total rally off late-August lows to 5.1%. That’s troubling for gold.
Even this lowballed really-conservative dollar-bounce estimate suggests nearly 3/4ths of the dollar’s gains are still coming! And gold has behaved very poorly on recent bigger USDX up days. Gold’s sharp 1.9%, 2.2%, 1.5%, and 1.6% daily plunges that happened on September 21st, September 23rd, October 6th, and October 13th were driven by larger 0.7%, 0.4%, 0.3%, and 0.5% USDX up days! They are a real threat.
The reason is speculators’ current gold-futures positioning. These traders are still largely betting on more near-term gold upside, their outlook is quite bullish. So if the USDX surges, they have vast amounts of gold-futures contracts they will need to sell fast to shift their capital out of harm’s way. The crazy leverage inherent in gold-futures trading makes it exceedingly unforgiving. These guys can’t afford to be wrong for long.
Each gold-futures contract controls 100 troy ounces of gold, which is worth $190,000 at $1900 gold. Yet the margin requirements for buying or selling each contract are only running $10,500. That’s the amount of cash traders have to keep in their accounts. Thus traders can legally trade gold via futures at extreme 18.1x leverage! At that level a 5.5% gold-price move against futures bets would wipe out 100% of capital risked.
So if the USDX continues mean reverting higher and pressuring gold, major selling will be unleashed in gold futures exacerbating gold’s correction. This next chart shows specs’ total long and short contracts as reported weekly in the famous Commitments of Traders reports. Gold is superimposed on top, and specs’ total gold-futures buying and selling during each of this gold bull’s uplegs and corrections are noted.
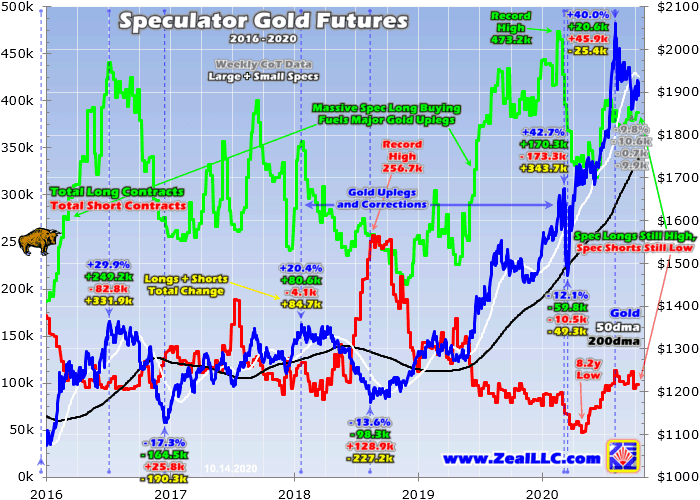
Compared to when this gold bull’s prior corrections bottomed, spec longs are still high and spec shorts are still low. In the latest-reported CoT week before this essay was published, which ended on Tuesday October 6th, total spec longs and shorts were running 387.4k and 99.0k contracts. As their green and red lines ominously reveal, big selling is still necessary before positioning nears prior gold-correction-ending levels.
As this gold bull’s first several corrections gave up their ghosts, total spec longs were running 275.8k, 258.2k, and 368.7k contracts. That third correction during March 2020’s stock panic was high since that selloff was so blisteringly fast. But these still average 300.9k contracts, which is 86.5k lower from current levels. That much selling is the equivalent of 269.0 metric tons of gold, a big slug that would crush gold lower.
Total spec shorts were running 126.0k, 250.8k, and 67.0k when this gold bull’s earlier corrections ended, averaging 147.9k. Specs would have to short sell another 48.9k contracts to get back up there, which is the equivalent of another 152.1t of gold. So gold now faces a menacing gold-futures-selling overhang exceeding 421t! That’s a lot of selling that could cascade if a stronger dollar scares these guys into fleeing.
Even if this oversold-USDX mean-reversion rally was the only near-term downside risk gold faced, it is certainly serious enough to demand caution. All of this gold bull’s prior corrections were driven by these periodic dollar surges, and today’s fourth one likely won’t prove any different. But that’s not the only big short-term risk factor plaguing gold. A couple of my recent essays analyzed some other ones to keep in mind.
This gold bull’s fourth correction likely hasn’t run its course yet, with gold overboughtness lingering and sentiment remaining way too bullish for a major bottoming. And the huge differential gold-ETF-share buying that catapulted gold’s last upleg higher has gone missing in action since upside momentum failed. As dollar-driven gold-futures selling forces gold lower, resulting big gold-ETF selling could amplify the downside.
Today’s low US dollar, which remains oversold and riddled with excessive popular bearishness, is just one of several big near-term risk factors for gold. So odds are there will be more selling to come in this gold correction. That implies better buy-relatively-low opportunities are still coming in gold, silver, and the stocks of their miners. The major gold stocks in particular tend to amplify gold corrections by 2x to 3x.
Both speculators and investors should embrace these inevitable rebalancing corrections, as they yield the best mid-bull buying opportunities within ongoing bull markets. That is when to aggressively redeploy in gold, gold ETFs, gold-stock ETFs, and individual gold stocks with superior fundamentals. Bulls’ inexorable upleg-correction cycles are great boons for traders, greatly expanding their potential gains to be won!
At Zeal we started aggressively buying and recommending fundamentally-superior gold and silver miners in our weekly and monthly subscription newsletters back in mid-March right after the stock-panic lows. We layered into dozens of new positions before gold stocks grew too overbought, which were stopped out later at huge realized gains running as high as +199%! Our subscribers multiplied their wealth within months.
To profitably trade high-potential gold stocks, you need to stay informed about what’s driving gold. Our popular newsletters are a great way, easy to read and affordable. They draw on my vast experience, knowledge, wisdom, and ongoing research to explain what’s going on in the markets, why, and how to trade them with specific stocks. Subscribe today and take advantage of our 20%-off sale! Corrections are the time to do your gold-stock homework, preparing to redeploy as they pass.
The bottom line is today’s low US-dollar levels are a serious near-term risk for gold. After the dollar’s past big selloffs, it has surged sharply higher in major mean-reversion rallies. When those unfolded during this secular gold bull, the yellow metal suffered major corrections. A rapidly-strengthening US dollar forces gold-futures speculators to aggressively dump their leveraged positions, which fuels snowballing gold selling.
With the US dollar so oversold and bearishness on it so universal, there are all kinds of potential catalysts to drive its overdue mean-reversion rally. They could come from the dollar side based on how pandemic stimulus and upcoming US elections play out. But economic weakness or health crises in Europe could also hit the euro boosting the US dollar. Gold remains at risk of further selling until the dollar normalizes.
Adam Hamilton, CPA
October 16, 2020
Copyright 2000 – 2020 Zeal LLC (www.ZealLLC.com)
Read today’s article on Canoe.com featuring top mining executive and Chairman of the Augusta Group of Companies, Richard Warke. The feature article looks at the past success of Warke, while shining a light on his current activities in the mining industry, including his leadership at Titan Mining Corp. and the recent controlling position he has taken at Vancouver-based Solaris Resources Inc.
Read the full story here.
After soaring in a powerful upleg, the gold miners’ stocks have been grinding lower for a couple months now. This ongoing correction is increasingly draining enthusiasm for this small contrarian sector, working to rebalance sentiment. Gold-stock price levels relative to gold suggest this necessary and healthy selloff hasn’t fully run its course yet. But once this passes, current valuations remain very bullish for the gold miners.
Unlike the vast majority of other industries, gold miners’ earnings are almost totally dependent on a single variable. That’s the price of gold. The profitability of excavating and selling gold directly levers prevailing gold prices. The costs of producing this metal are largely fixed, mostly determined during mine-planning stages when engineers decide which gold-bearing ores to mine, how to dig to them, and how to process them.
Because gold prices are dynamic while mining costs are effectively static, prevailing gold levels are the overwhelming driver of corporate profits. And these earnings compared with stock prices are the only ingredients in valuation analysis. The classic valuation metric is trailing-twelve-month price-to-earnings ratios, which are current stock prices divided by actual profits earned over the last four reported quarters.
Plenty of major gold miners’ stocks are very cheap per this classic measure! The popular GDX VanEck Vectors Gold Miners ETF is this sector’s leading benchmark and trading vehicle. Its components include all of the world’s biggest and best gold miners. Right after every quarterly earnings season, I do a deep fundamental dive into the elite GDX gold miners’ results. The latest covering Q2’20 was done in mid-August.
Using conventional TTM P/Es, plenty of massive gold miners were quite cheap. Newmont and Barrick Gold are GDX’s biggest and dominant components, which then commanded 13.0% and 12.1% of this ETF’s total weighting! As that last-reported earnings season wrapped up, they were trading at only 14.3x and 16.1x earnings. This week their valuations are even lower at 12.8x and 10.9x, making for big bargains.
Another major gold miner Kinross Gold sported a similar 13.2x P/E then, which has contracted to 12.0x now due to the subsequent gold-stock correction. There’s lots of undervaluation in the major gold stocks per normal price-to-earnings multiples. But given the gold-mining industry’s unique nature of profits being almost totally dependent on prevailing gold prices, other proxies better reflect gold-miner valuation levels.
One I’ve long used in my detailed quarterly analyses of gold-stock fundamentals compares average gold prices with miners’ average costs. In Q2’20 for example, the top 25 GDX gold miners reported average all-in sustaining costs of $984 per ounce. That’s what it cost them to both produce gold and replace that depletion. Deposits are expanded into new areas of gold-bearing ores to ensure gold output is sustainable.
Gold itself averaged a lofty $1714 per ounce in Q2, implying that sector profitability was running way up at $730 per ounce! That soared a stupendous 66.2% year-over-year from Q2’19’s $439, which resulted from much-lower $1309 average gold prices and $870 average AISCs. Gold-miner earnings leveraged gold’s 30.9% YoY gains by 2.1x, right in their normal historical range of 2x to 3x. Gold prices drive profitability.
And all gold-stock speculators and investors should be super-excited for the major gold miners’ upcoming Q3’20 results. These all-important fundamental reports are generally released between 3 to 6 weeks after quarter-ends. So I can’t wait to dig into this latest quarter in mid-November, as it is looking utterly spectacular. Gold averaged a dazzling record $1912 in this just-finished Q3, soaring 11.6% quarter-on-quarter!
Average all-in sustaining costs are likely to decline, as Q2’s were artificially-high due to all the disruptions from national lockdowns to slow the spread of COVID-19. Gold-mining operations were largely spun back up in late Q2 and early Q3. And the better mines’ production, the more ounces to spread their big fixed costs across. Thus increased gold output lowers AISCs, so Q3’s should retreat considerably from Q2’s high.
In Q3’19, the major GDX gold miners averaged $883 AISCs. Over the past four reported quarters ending in Q2’20, they averaged $933. So that’s as good of estimate as any for the upcoming Q3’20 results. That implies the gold miners earned an epic $979 per ounce last quarter! If proven true, gold-stock earnings yet again rocketed up 65.7% YoY. No other sector in the stock markets can rival such incredible profits growth.
Rising earnings naturally lower valuations. So once these Q3’20 numbers drop into the rolling totals from the latest four reported quarters, gold-stock P/E ratios will sink even farther. Unless prevailing gold-stock prices stage a dramatic rebound before mid-November, some major gold miners will see their TTM P/Es plunge into the single digits! That is deeply undervalued by any standard, and incredibly cheap for gold stocks.
Wading through dozens of gold miners’ quarterly results, and building big spreadsheets to analyze them over time, is challenging and tedious. And they can only be updated four times a year, which is a pretty-low-resolution read on gold-miner valuations. But there’s a great gold-stock-valuation proxy available in real-time. And it really helps traders better game gold-stock uplegs and corrections to time buying and selling.
It simply looks at the ratio between prevailing gold-stock and gold price levels. While there are various permutations, the most-relevant one today is the GDX/GLD Ratio. This GGR divides the daily close of that leading GDX gold-stock ETF by the daily close of the dominant GLD SPDR Gold Shares gold ETF. When charted and analyzed over time, this ratio reveals whether gold stocks are relatively cheap or expensive.
This GGR chart encompasses gold stocks’ entire secular bull since mid-January 2016. Between then and this sector’s latest interim peak in early August, GDX has soared 256.7% higher over 4.5 years. That amplified gold’s 87.7% gain in that same span by 2.9x, yet again confirming the major gold stocks’ great leverage to gold of 2x to 3x. Despite low gold-stock valuations, the GGR suggests their correction isn’t over yet.

While gold-miner valuations are undoubtedly very low, this GDX/GLD Ratio proxy for them indicates they are likely to head lower still. The GGR illuminates the swings in gold-stock valuations driven by their bull markets’ normal upleg-correction cycles. Gold-stock valuations relative to gold naturally rise in uplegs, then retreat in the inevitable subsequent corrections to rebalance sentiment. So tracking the GGR is essential.
GDX’s last major upleg that climaxed in early August was a monster, rocketing 134.1% higher in just 4.8 months after mid-March’s COVID-19-lockdown-fueled stock panic. That upleg was born in extreme gold-stock undervaluations relative to gold driven by that epic maelstrom of fear. When GDX bottomed in mid-March at just $19.00, the GGR had collapsed to just 0.133x! That was a brutal 4.1-year low in this metric.
In other words, GDX’s share price was trading at only 13.3% of GLD’s share price. Gold-stock prices hadn’t been lower compared to gold prices since early February 2016 right after this gold-stock bull was born! And massive mean reversions higher erupt out of extreme anomalous lows in the tight relationship between gold-stock and gold price levels. I wrote about this extensively during and just after that stock panic.
In my March 20th essay on mid-tier gold miners’ fundamentals when GDX was still way down at $20.55, I concluded at that time, “after this insane COVID-19 stock panic crashed this sector, these stocks are trading at some of their steepest discounts to current fundamentals ever! That gives them epic potential to mean revert radically higher as fear fades and gold recovers, yielding huge gains to early contrarians.”
We backed up the truck to aggressively deploy capital around those super-cheap and unsustainable lows, buying and recommending dozens of fundamentally-superior gold-stock and silver-stock trades to our newsletter subscribers who keep us in business. Those blossomed into massive realized gains as this latest gold-stock upleg matured, averaging over +80% absolute and +300% annualized when stopped out!
This is relevant today because gold-stock valuations per this GGR proxy were one of the screaming buy signals triggered by that stock panic. At a scary time when most gold-stock traders were selling low to flee this burning sector, gold stocks were so radically undervalued relative to gold that huge fast mean-reversion gains were very likely. This same fantastic timing tool is now warning gold stocks’ correction isn’t over.
Ahead of GDX cresting at $44.48 in early August, the GGR surged to a 4.0-year high of 0.241x. This gold-stock ETF was trading at 24.1% the price of the leading gold ETF. That level was very interesting because it was right where this gold-stock bull’s mighty maiden upleg failed in early August 2016. With huge gains of 151.2% even besting this latest upleg’s 134.1%, a correction was necessary to rebalance sentiment.
Bull-market uplegs in both gold stocks and gold require big capital inflows. As long as growing ranks of traders are actively deploying increasing amounts of money bidding the precious metals higher, uplegs can persist. But eventually their fast gains get so large that everyone interested in buying in anytime soon is already in. That peak greed marks upleg toppings, when near-term buying is exhausted leaving sellers in charge.
In August 2016 that point when major uplegs inevitably have to fail into rebalancing corrections hit as the GGR stretched to 0.244x. August 2020’s 0.241x peak GGR was right in line with that. With the gold stocks relatively high compared to gold after soaring in a massive upleg, they really needed to sell off to eradicate all the excessive greed at that major upleg topping. And that has indeed been happening since.
A month ago I wrote an essay on gold stocks being in correction mode, focusing on their lingering really-overbought technicals. I won’t rehash that still-valid analysis here, but looking at this sector instead from a valuation angle arrives at that same conclusion. At worst since early August, GDX has retreated 15.4% as of late September. That dragged the GGR as low as 0.215x, right about where it still traded this week at 0.216x.
The problem is these GGR levels aren’t low enough, and haven’t fallen far enough, to flag the likely end of this healthy correction. Today’s correction is the fourth of gold stocks’ secular bull. During their first three corrections following uplegs, the GGR retreated an average of 0.065x to bottom at an average of 0.155x. So far in our current correction, this GGR valuation proxy has only slid 0.026x to that 0.215x level.
So based on bull-to-date precedent, only about 40% of the expected gold-stock correction has happened compared to prevailing gold prices. And the GGR itself is still 39% above the tight average levels that marked correction bottoms birthing new uplegs earlier in this bull. Even if the GGR doesn’t retreat all the way back to 0.155x, it still needs to head much lower before the last upleg’s residual greed is vanquished.
Over time this GDX/GLD Ratio forms tradable trends, with gold-stock valuations relative to gold moving in sustained patterns. Since the deep gold-stock lows of September 2018, the GGR has been meandering higher on balance with the big exception of this year’s extreme stock-panic anomaly. The support line for that gold-stock-valuation uptrend is running just over 0.190x now. Another interesting level converges there.
Since gold stocks are so incredibly volatile, their bull and bear markets are often considered based on gold’s own. During the 4.8 years today’s secular gold bull has run, the GGR has averaged 0.190x. After this gold-stock bull’s second-largest upleg that enjoyed big and fast 134.1% gains, it’s hard to imagine the GGR not at least reverting back to that mean. The GGR revisiting 0.190x will be a more-favorable time to buy.
Because we humans aren’t very good at parsing small decimals, gold-stock valuations falling from 0.216x to 0.190x in GGR terms doesn’t sound like much. But it could mean considerably more downside before this correction gives up its ghost. The major gold stocks’ 2x-to-3x leverage to gold is a double-edged sword, working in both directions. So weaker gold prices forcing GLD lower will exacerbate this GDX selloff.
A few weeks ago I wrote an essay on gold’s own correction, which certainly wasn’t over due to festering overboughtness since its own parabolic early-August peak. That analysis revealed gold would likely have to correct back down to its 200-day moving average. While this critical technical support zone for bull-market corrections continues to rise, this week it is still way down near $1735. That’s another 8.1% lower!
Expressed in GLD-share-price terms, a 200dma approach implies $163.18. Applying that 0.190x GGR multiple to that yields a GDX-share-price downside target of $31.00. While still relatively high by this gold-stock bull’s standards, that is still another 19.2% lower from this week’s levels! So even if the major gold stocks bottom at higher valuations compared to gold, they could still have considerable selling to go.
Interestingly this correction scenario would extend GDX’s total selloff to 30.3%. That is more in line with this bull’s correction precedent averaging 36.5% losses. At any rate, buying gold stocks today won’t be prudent if they have another 10%-to-20% downside left in this correction. Patient gold-stock traders who watch valuations should have plenty of opportunities to add positions at lower prices in the near future.
As I discussed in another essay a couple weeks ago, the gold stocks are now in their biggest seasonal selloff of the year. That could exacerbate and compress their necessary correction over the next few weeks or so. This gold-stock selloff needs to run until greed and euphoria are eradicated. And plenty of these topping emotions lingered after gold stocks peaked, because they consolidated high for weeks after that.
But while this immediate GGR outlook is short-term bearish for gold stocks, from a longer perspective these valuation-proxy levels are wildly bullish for the gold miners! As secular bulls mature making both speculators and investors more comfortable with holding gold stocks, their price levels relative to gold climb on balance. So we can expect this GDX/GLD Ratio to continue rising way above this bull’s precedent.
The last secular gold-stock bull peaked when GDX hit $66.63 in September 2011. During the two years leading up to that climax, the GGR averaged 0.419x. That implies much-higher gold-stock prices are probable in coming years as more bull-market uplegs march higher. Imagine gold at $2250, a lowballed conservative outlook just 19.2% above this week’s levels. In GLD terms that works out to roughly $211.
At that 0.419x late-bull-average GGR, $211 GLD would catapult GDX up over $88 per share! That’s 131% higher than this week’s levels. So if you can weather a 30%ish correction psychologically, and be brave enough to buy back in low when most others are too scared to, you should be able to ride the major gold stocks’ third doubling-plus upleg of this bull. From a longer perspective, gold-stock valuations are cheap.
The key to multiplying your wealth in gold stocks is to trade with bull markets’ inevitable upleg-correction cycles instead of fighting them. Buy relatively low late in corrections, then sell relatively high late in uplegs! GGR levels help flag both key conditions. When considered along with other technical measures of oversoldness and overboughtness, this gold-stock valuation proxy is an excellent buy-sell timing tool.
At Zeal we started aggressively buying and recommending fundamentally-superior gold and silver miners in our weekly and monthly subscription newsletters back in mid-March right after the stock-panic lows. We layered into dozens of new positions before gold stocks grew too overbought, which were stopped out recently at huge realized gains running as high as +199%! Our subscribers multiplied their wealth within months.
To profitably trade high-potential gold stocks, you need to stay informed about their technicals, sentiment, and fundamentals. And what is moving gold, their dominant primary driver. Our popular newsletters are a great way. They draw on my vast experience, knowledge, wisdom, and ongoing research to explain what’s going on in the markets, why, and how to trade them with specific stocks. Subscribe today and take advantage of our 20%-off sale! Corrections are the time to do your gold-stock homework, preparing to redeploy as they pass.
The bottom line is gold-stock valuations remain low. These companies are earning profits hand over fist with such high prevailing gold prices, forcing down their conventional valuations. Huge stock-price gains in future uplegs are fully justified by the epic profits growth this contrarian sector is achieving. But before this gold-stock bull’s next major upleg, real-time gold-stock valuation proxies suggest this correction isn’t over yet.
Since their last monster upleg peaked in early August, the gold stocks still haven’t retreated far enough to rebalance sentiment. The leading gold-stock ETF hasn’t given up enough ground relative to prevailing gold prices to signal a high-probability correction-bottoming. Short-term valuation analysis implies major gold stocks still have another 10%-to-20% downside to go before their next big bull upleg can get underway.
Adam Hamilton, CPA
October 9, 2020
Copyright 2000 – 2020 Zeal LLC (www.ZealLLC.com)
Silver’s dazzling parabolic surge this summer was overwhelmingly driven by enormous silver-ETF-share buying. Led by momentum-chasing millennial traders, unprecedentedly-huge amounts of stock-market capital deluged into the dominant SLV iShares Silver Trust silver ETF. But since silver’s resulting lofty peak, silver-ETF-share selling has been mounting. An acceleration is a major downside risk for silver prices.
Silver has certainly lived up to its wildly-volatile reputation this year. Ahead of mid-March’s brutal stock panic driven by governments’ heavy-handed national lockdowns to slow the spread of COVID-19, silver was inconspicuously grinding higher. In late February before pandemic fears flared in the US, silver was running $18.62. But it was then soon sucked into the epic maelstrom of fear as stock markets cratered.
Outsized stock-market fear infecting silver is normal. Herd psychology has an unusually-strong influence on silver price levels. Traders rush to buy silver when they grow bullish and excited, catapulting its price far higher. But when they get bearish or worried for any reason, they drop silver like a bad habit forcing steep plunges. The global silver market is tiny, further amplifying the price impacts of material capital flows.
Over the next several weeks or so into mid-March, silver collapsed 35.8% to $11.96. That deep 10.9-year secular low utterly annihilated all bullish sentiment. And 4/9ths of that plummeting was compressed into just two trading days where silver collapsed 18.9%! That proved a near-crash, crowding the formal crash threshold of a 20%+ loss in two trading days or less. That stock panic totally rebooted silver psychology.
It left silver radically oversold, trading at just 0.704x its 200-day moving average. Anything under 0.90x is extremely oversold and unsustainable. Sub-$12 silver prices were fundamentally ridiculous as well. In Q1’20 hosting that rare stock panic, the world’s major silver miners reported average all-in sustaining costs of $13.45 per ounce. No commodity’s price can languish well below the world production cost for long.
Silver indeed started violently V-bouncing out of those crazy stock-panic lows. Its initial gains were big and fast, with silver blasting 19.4% higher in the first four trading days out of that deep nadir! After that silver’s post-stock-panic upleg throttled back into something much more sustainable. By early June silver had surged 52.8% over 2.5 months, hitting $18.27. Fully 95% of its stock-panic losses had been regained.
Silver stalled from there, consolidating high over the next five weeks into early July. It wasn’t overbought at all at that initial post-panic interim high, trading at just 1.081x its 200dma. Historically, extreme levels of silver overboughtness warning of imminent selloffs start at 1.25x. Silver’s strong post-panic gains to that point were fueled by heavy differential SLV-share buying. Understanding how silver ETFs work is essential.
The mission of silver exchange-traded funds is to track silver price action. But the supply and demand for ETF shares is independent from silver’s own, leading to constant imbalances that must be addressed. Excess ETF-share supply or demand relative to silver’s own must be directly shunted into the underlying global physical silver market. If that didn’t happen, silver-ETF-share prices would soon decouple from silver’s.
The American iShares Silver Trust overwhelmingly dominates the silver-ETF space. It pioneered silver ETFs, launching way back in April 2006. Its lead has grown insurmountable since. The world authority on silver’s fundamentals is the venerable Silver Institute. Once a year it publishes comprehensive data on global silver supply and demand in World Silver Survey reports. The most recent was released in April.
That covered 2019, where SLV exited holding 362.6m ounces of physical silver bullion in trust on behalf of its shareholders. The WSS declared that gave SLV a commanding 49.8% share of all the silver bullion held by all the world’s physically-backed silver ETFs! SLV has gobbled up half of the global silver-ETF market. The next-biggest competitor out of Switzerland only ranked at 11.4%. SLV is truly in a league of its own.
Silver-ETF-share buying and selling really moves silver prices at the margin because it is the most-volatile source of silver demand by far. Most silver usage is relatively stable year after year, as evident in the Silver Institute’s annual data. But silver-ETF silver demand is radically volatile. It swung from -22.3m ounces in 2018 to +81.7m in 2019, up to 8.2% of overall demand. The WSS forecast for 2020 is +120m or 12.5%.
And that pre-pandemic outlook for exploding silver-ETF-share demand is wildly understated in this crazy new world we find ourselves in. By mid-August, SLV’s holdings had skyrocketed to an astounding new all-time-record high of 581.0m ounces. That made for +218.4m ounces in silver-ETF demand from SLV alone year-to-date! That exploding SLV-share demand was off-the-charts unprecedented, utterly incredible.
SLV’s underlying physical-silver-bullion holdings are reported daily, and their trends reveal whether stock-market capital is flowing into or out of silver. When American stock traders buy SLV shares faster than silver itself is being bought, SLV-share prices threaten to decouple from silver to the upside. That would cause SLV to fail its silver-tracking mission. So SLV’s managers must step in to offset that excess demand.
In near-real-time, they sell enough new SLV shares to absorb the differential SLV-share demand beyond silver’s own. Then they immediately plow the money raised from those share sales into physical silver. So when SLV’s holdings are rising, stock-market capital is flowing into silver. That happened in spades since the stock panic, an unprecedented frantic rush to gain silver portfolio exposure via those SLV shares.
When American stock traders sell SLV shares faster than silver itself is being sold, SLV’s share price will disconnect from silver’s to the downside. SLV’s managers must avert this by buying back enough SLV shares to sop up that excess supply. They raise the capital necessary to do these buybacks by selling some of SLV’s physical silver bullion. So falling SLV holdings show stock-market capital flowing back out of silver.
This chart superimposes SLV’s holdings over silver’s price action during its secular bull, which started to run in mid-December 2015. Since silver is so exceedingly volatile, its bull and bear markets are often rendered off gold’s which is its dominant primary driver. Silver has never witnessed differential-ETF-share buying of the magnitude seen since the stock panic! The vertical explosion in SLV’s holdings is epic.
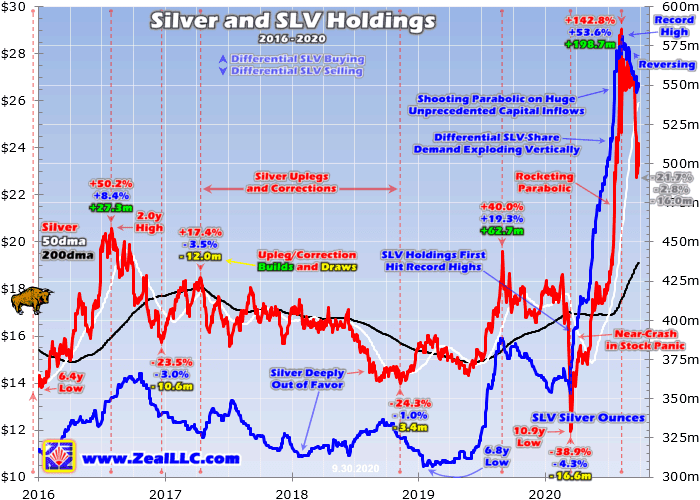
Interestingly silver’s plummeting into the stock panic didn’t spawn much differential SLV-share selling. Inside that 3-week span where silver cratered 35.8% into mid-March, SLV’s holdings merely fell 4.4% or 16.3m ounces at worst. Shrewd bargain-hunting traders started flooding into SLV again a couple trading days before silver’s nadir, so over its selloff’s exact span SLV’s holdings actually rose 2.0% or 7.4m ounces.
The heavy SLV buying accelerated dramatically from there. In late March just six trading days after silver bottomed, SLV’s holdings surged to their first new all-time-record high of 391.9m ounces. By the time SLV’s holdings crested in mid-August, 45 new record closes had been seen! At that initial silver interim high of $18.27 in early June, SLV’s holdings had blasted up 25.8% or 95.8m ounces during silver’s 52.8% rally.
Differential ETF-share buying certainly wasn’t the only financial-market source of silver demand as this metal mean reverted dramatically higher. Speculators were also flooding into silver futures, which sport big leverage really amplifying their silver-price impact. But American stock traders rushing into SLV shares were the primary source of capital chasing silver’s big gains to ride its strong momentum higher.
Interestingly when silver spent those five weeks consolidating high between early June to early July, the heavy differential SLV-share demand persisted. During that span where silver just ground sideways at best, SLV’s holdings surged another 8.0% or 37.2m ounces! The trading day before silver barely eked out its next new post-panic high, SLV’s holdings hit a momentous milestone first breaking above 500m ounces.
In March, April, May, and June SLV enjoyed major holdings builds of 27.5m, 17.6m, 50.4m, and 34.7m ounces. But that paled in comparison to July’s astounding monster 70.1m-ounce build! That is what started to force silver parabolic. Silver’s strong post-panic upleg had started to attract in an unusual new group of traders, millennials. They started aggressively piling into SLV shares to chase silver’s big momentum.
Millennials generally haven’t been big stock traders in the past. Being younger, as a group they mostly haven’t been able to generate the considerable surplus capital necessary to trade stock markets. But in one of the more-significant unforeseeable market consequences of this crazy pandemic, the millennials used it to start rushing into the markets en masse. This is so unbelievable you couldn’t make it up.
The majority of millennials mostly had service jobs, which of course were the most dramatically affected by governments’ draconian national lockdowns. So many millions of young people were laid off, suddenly finding themselves at home with nothing to do. But being unemployed during this pandemic proved quite lucrative for lower earners, thanks to the federal government’s gargantuan pandemic stimulus payments.
Millennials who had long struggled to save were suddenly making out like bandits. They got that one-time $1200 helicopter money. But the big score came in Paycheck Protection Program payments and the federal unemployment bonuses. For the first 2.5 months of being laid off, millennials who were employed by companies taking out PPP loans were paid in full. They were making normal wages with far-lower expenses.
And the millennials who filed for unemployment benefits sooner or later during the lockdowns received not only their state payments, but an extra $600 per week in bonuses Congress provided with the CARES Act. $2400 per month of free money is not trivial, annualizing to an extra $31,200 per year! Stuck in their apartments and super-bored, millennials watched the stock markets rocket higher out of March’s panic.
With big surpluses of cash and time for the first time in their lives, they decided they wanted to chase the blistering stock-market gains. So they literally transferred tens of billions, likely even hundreds, of their pandemic stimulus dollars to stock-trading accounts! The millennials themselves confirmed this through countless surveys, Internet postings, and anecdotal reporting. They started trading stocks for their first time.
Their brokerage of choice was one few older traders had yet heard of, the phone app Robinhood. This company pioneered commission-free stock trading, which was really appealing to usually-penny-pinching millennials. While Robinhood is private and doesn’t disclose its total users often, it has revealed that its userbase utterly skyrocketed this year. Millennials by the millions opened up and funded Robinhood accounts.
For years Robinhood published data on how many of its users owned specific stocks, including SLV. Up until mid-March’s stock panic, there was little interest in this dominant silver ETF. Millennials crave high-tech things like electric cars, device makers, and crypto currencies. Silver is pretty old-school and boring for them. Still from the stock panic into late June, Robinhood users owning SLV climbed from 7.7k to 14.1k.
Now 14k millennials trading SLV, with accounts averaging a few-thousand dollars each, is nothing. That wouldn’t move the needle even in the tiny silver market. But the thing that made Robinhooders’ collective trading market-moving was the way this brokerage makes money. Instead of charging commissions, it instead sells its users’ collective real-time order-flow data to high-frequency-trading firms and hedge funds.
Their computers instantly trade milliseconds ahead of the Robinhooders, front running the millennials’ herd buying and selling. The HFTs and hedgies were deploying orders of magnitude more capital than the Robinhooders had, so the millennials’ stock trades were being greatly amplified in real-time! They were the tail wagging the vastly-larger hedge-fund dog, effectively directing capital flows vastly beyond their own.
Robinhood’s user-positioning data was also seen as a great proxy for how millennials as a whole were trading across all brokerages. And they started warming to silver in early July, increasingly attracted to its strong upside price action. Gold surged back over $1800 in the first half of July, which helped catapult silver up 6.9% month-to-date by mid-July. The Robinhooders owning SLV were growing, hitting 15.0k at that point.
But silver really started captivating millennials on July 20th and 21st, when it surged up to first challenge and then smash through the psychologically-heavy $20 level. From that point on, Robinhooders owning SLV shares rocketed vertically. And orders of magnitude more fund capital followed, front running their trades. By August 10th when silver’s parabolic surge peaked at $29.04, 35.5k Robinhooders owned SLV shares.
So in essentially several weeks, millennial participation in the silver market skyrocketed 137% higher! That catapulted SLV’s holdings from 516.1m ounces on July 15th to 581.0m less than a month later. This chart above reveals how silver shooting parabolic was directly driven by the vertical explosion in SLV’s holdings. Millennials trading pandemic-stimulus money with hedge funds mirroring was the dominant driver.
By silver’s early-August peak, it had skyrocketed 142.8% higher in just 4.8 months! Over 60% of those massive upleg gains occurred in its final month alone, when Robinhooders flooded into SLV. During that silver-upleg span, SLV’s holdings soared a staggering 53.6% or 198.7m ounces! That magnitude of SLV-share demand is wildly unprecedented. Silver and silver ETFs had never before witnessed anything close.
Parabolic surges are never sustainable for long, as the capital firepower available for near-term buying soon exhausts itself. And indeed within days of silver’s parabolic peak, SLV’s holdings topped out at that incredible new all-time-record high of 581.0m ounces. Both silver and SLV’s holdings have fallen since, with silver’s abrupt loss of momentum increasingly driving SLV-share selling. This is a serious risk for silver.
After blasting stratospheric to hit 1.659x its 200-day moving average in early August, silver needed to see a major correction to rebalance away the extreme euphoria and extraordinarily-overbought technicals. That got off to a violent start, with silver nearly crashing again by plummeting 15.2% in the first trading day alone after its August peak! But silver quickly bounced, and stayed above that $24.64 close until late September.
During that subsequent high-consolidation period between correction lows, silver averaged $26.93. But SLV’s holdings have fallen rather sharply, almost symmetrically with their euphoric build into silver’s peak. By late September, SLV’s holdings had already fallen 6.2% or 35.9m ounces at worst. The big question now is whether SLV faces considerably-more differential selling, whether American stock traders will flee silver.
Unfortunately Robinhood actually ceased releasing its users’ collective positioning data within days of silver’s early-August peak. Robinhood was increasingly getting bad press, with that data cited to show that millennials were speculating recklessly with exceedingly-risky bets. They were doing ridiculously-foolish trades as a herd, piling in to chase upside momentum regardless of how terrible stocks happened to look.
Without that Robinhood data, we can’t know if millennials have largely unwound their big SLV bets or if they are mostly still in. I suspect the former, as these young traders quickly lose interest once momentum flags and some other shiny stock crops up. But regardless of who still owns SLV shares, this dominant silver-ETF’s holdings remain far above pre-parabolic norms. That suggests the risks of selling remain high.
Silver speculation is largely driven by gold’s fortunes, and gold itself faces big near-term downside risks as I’ve detailed in recent essays. Like silver, gold’s own summer surge was also largely fueled by huge differential gold-ETF-share buying. But that went missing in action after gold peaked, just like silver-ETF-share buying. So gold too has a massive overhang of potential gold-ETF-share selling that could hammer it lower.
Also like silver, gold consolidated high after early August’s lofty peak. That left it extremely overbought by its own secular bull’s standards, like silver. Gold is also in its biggest seasonal selloff between its large autumn and winter rallies. That normally drags silver lower too. With gold’s high consolidation just rolling over into a full-blown correction, silver will follow and amplify gold’s losses like usual. So caution is in order.
Before this silver bull’s next upleg can start marching higher, silver needs to see a healthy rebalancing selloff to bleed away euphoric sentiment and extremely-overbought technicals. And with SLV’s holdings so darned high, differential SLV-share selling will certainly exacerbate any significant silver selloff. With silver-ETF selling mounting, this necessary process is already underway. That could push silver much lower.
After rocketing parabolically, silver tends to correct hard back down to or even through its 200dma. As the black line on this chart shows, that is a heck of a long way lower from here. This week silver’s key 200dma baseline is still way down at $19.13! To re-converge would require a 34.1% correction, making for lots more pain. But that would lead to an excellent mid-bull opportunity to buy back in relatively low.
All bull markets naturally flow then ebb, taking two steps forward before retreating one step back. Their price action gradually meanders around uptrends. This normal upleg-correction pattern keeps sentiment balanced, extending bull markets’ longevity. And it is a huge boon for traders, greatly expanding bulls’ potential gains. Look to aggressively buy silver and its miners’ stocks as this silver correction runs its course.
At Zeal we started aggressively buying and recommending fundamentally-superior gold and silver miners in our weekly and monthly subscription newsletters back in mid-March right after the stock-panic lows. We layered into dozens of new positions before gold stocks grew too overbought, which were later stopped out at huge realized gains running as high as +199%! Our subscribers multiplied their wealth within months.
To profitably trade high-potential gold and silver stocks, you need to stay informed about what’s driving gold. Our popular newsletters are a great way, easy to read and affordable. They draw on my vast experience, knowledge, wisdom, and ongoing research to explain what’s going on in the markets, why, and how to trade them with specific stocks. Subscribe today and take advantage of our 20%-off sale! Corrections are the time to do your gold-stock and silver-stock homework, preparing to redeploy as they pass.
The bottom line is silver-ETF selling is mounting. Since silver’s parabolic surge driven by massive capital inflows from differential SLV-share buying peaked, this dominant silver ETF’s holdings have been falling on balance. That reveals American stock traders are exiting silver, selling SLV shares faster than silver is being sold. And with SLV’s holdings remaining spectacularly high, they could have much more yet to do.
This potential-silver-ETF-selling overhang is a big downside risk for silver. With silver’s high consolidation failing into a correction, downside momentum will accelerate. That will scare many SLV shareholders into dumping their positions, exacerbating silver’s selloff. This vicious circle of selling could cascade until silver’s sentiment and technicals are rebalanced. And that’s probably a long way down from current prices.
Adam Hamilton, CPA
October 2, 2020
Copyright 2000 – 2020 Zeal LLC (www.ZealLLC.com)
If you would like to receive our free newsletter via email, simply enter your email address below & click subscribe.
 Follow us on Twitter
 Become our facebook fan
CONNECT WITH US
Tweets
Tweet with hash tag #miningfeeds or @miningfeeds and your tweets will be displayed across this site.
MOST ACTIVE MINING STOCKS
Daily Gainers
 CMC Metals Ltd. CMC Metals Ltd. |
CMB.V | +900.00% |
 Eden Energy Ltd Eden Energy Ltd |
EDE.AX | +200.00% |
| GoviEx Uranium Inc. |
GXU.V | +42.86% |
| Eagle Nickel Ltd. |
ENL.AX | +41.67% |
| Citigold Corp. Limited |
CTO.AX | +33.33% |
| Mount Burgess Mining NL |
MTB.AX | +33.33% |
| Exalt Resources Limited |
ERD.AX | +31.94% |
| Casa Minerals Inc. |
CASA.V | +30.00% |
| Cariboo Rose Resources Ltd |
CRB.V | +28.57% |
| Belmont Resources Inc. |
BEA.V | +28.57% |


