
The silver miners’ stocks have been grinding lower on balance since early August in a healthy correction. This necessary rebalancing is achieving its mission of dampening enthusiasm, paving the way for this sector’s next bull upleg. Rebounding from governments’ COVID-19 lockdowns, operating and financial results improved dramatically in the recently-reported Q3. Better fundamentals justify more stock-price gains.
There aren’t many major silver miners in the world, and only a handful are primary silver producers that derive over half their revenues from silver. With such a small population, there are only a few silver-stock ETFs. The leading and dominant one is the SIL Global X Silver Miners ETF, which is this tiny sector’s best benchmark. But it only held $1.0b in net assets in mid-November at the end of Q3’20’s earnings season.
SIL’s super-volatile price action this year reflects the wild ride silver stocks have had. Over 4.8 months into early August, this ETF skyrocketed 176.9% higher out of mid-March’s stock panic! That left silver stocks extremely overbought, thus due for a correction to rebalance sentiment. And that is exactly what has happened since, with SIL’s total selloff extending to 23.5% at worst over 3.6 months so far by late November.
The silver miners’ stock prices naturally mirror and amplify the underlying moves in the metal they mine, which overwhelmingly drives their profitability. And silver in turn leverages gold’s fortunes, which is the white metal’s dominant primary driver. So silver’s ongoing correction won’t give up its ghost until gold’s does, and silver stocks’ next bull-market upleg is waiting on silver’s own. Silver miners are at the mercy of gold.
This yellow metal’s rebalancing selloff has matured, after making great strides in rebalancing sentiment since gold shot parabolic last summer. American stock traders’ heavy gold-ETF-share buying that fueled that powerful upleg has rolled over into serious selling in November. And the positioning of gold-futures speculators has been excessively-bullish, leaving a risky selling overhang for the oversold US dollar to trigger.
But even if these gold-driven silver and silver-stock corrections haven’t fully run their courses yet, traders need to stay abreast of the silver miners’ fundamentals. The stronger they are, the greater this sector’s upside potential in its next bull-market upleg. The silver miners’ recently-reported Q3’20 results showed huge fundamental improvements from the prior quarter, which suffered widespread national lockdowns.
This was my 18th quarter in a row analyzing how the world’s biggest and best silver miners are faring fundamentally. While SIL included 40 component stocks in mid-November as Q3’s earnings season was wrapping up, I limited my research to its top 15 holdings. They commanded a dominant 89.8% of SIL’s total weighting. These silver giants mostly trade on stock exchanges in the US, UK, Canada, and Mexico.
That makes amassing their quarterly data somewhat challenging, with reporting varying considerably in different countries and companies. Half-year reporting is common outside the US, and Q3s are off-cycle quarters seeing shorter updates. The highlights of all those reports are included in this table. Stock symbols are listings from companies’ primary exchanges, with the majority of the SIL top 15’s outside the US.
That’s preceded by their ranking changes in terms of SIL weightings between Q3’19 to Q3’20. And it is followed by these major silver miners’ current SIL weightings as the Q3 earnings season concluded in mid-November. Then each company’s quarterly silver and gold production in ounces is shown, followed by their year-over-year changes from Q3’19. Their silver output can be used to gauge relative silver purity.
The higher miners’ percentage of quarterly revenues derived from silver production, the more responsive their stock prices are to silver price action. The next column shows this metric of silver-centricness. It is mostly calculated by multiplying companies’ quarterly silver outputs by silver’s average price in Q3, then dividing those results by quarterly revenues. When sales aren’t reported, this can instead be approximated.
For half-year-reporting silver miners where Q3 was an interim quarter, those implied silver revenues can be divided by implied gold-plus-silver sales. But that method is inferior since it excludes base-metals byproducts. According to the Silver Institute, only 29% of all the silver mined worldwide in 2019 came from primary silver mines. 32% was a byproduct from mining lead and zinc, with another 23% from copper.
The rare primary silver miners’ silver-purity percentages are highlighted in blue. Their stock prices usually show the highest leverage to silver. That is followed by cash costs and all-in sustaining costs per ounce, along with their year-over-year changes. They reveal how much it costs the SIL-top-15 silver miners to blast their metal loose from the earth and process it. Finally comes quarterly revenues and hard GAAP profits.
Blank data fields mean a company hadn’t reported that particular data by mid-November as Q3’s earnings season was ending. And percentage changes aren’t included if they would be either misleading or not meaningful. The main examples are comparing two negative numbers and when data shifts from positive to negative or vice versa over this past year. These elite silver miners showed major improvements last quarter.
Production is the lifeblood of the silver-mining industry, and the SIL top 15’s collective output in Q3 was mixed. Together these major silver miners produced 61.4m ounces last quarter. Sequentially from the lockdown-plagued Q2’20, that was outstanding 13.7% quarter-on-quarter growth. When governments authorized shut-down silver mines to resume operations again, these companies were quick to spin back up.
Nevertheless, the national lockdowns’ serious impacts on global silver output lingered in Q3. That 61.4m ounces the SIL top 15 produced were still down a sharp 13.9% year-over-year from Q3’19! Outside of the preceding peak-lockdown quarter’s 26.0% YoY plummeting, that was the worst seen in all the years I’ve been working on this research thread. But that output was skewed low by the endless shuffling in SIL’s ranks.
A year ago in Q3’19, a British gold-and-silver miner called Hochschild Mining was this ETF’s 14th-biggest component stock. SIL essentially weights its holdings by silver stocks’ market capitalizations. But in mid-November, this company had slipped to 16th place. Replacing it was the non-producing Canadian silver explorer SilverCrest Metals. That pushed Hochschild’s 3,085k ounces produced in Q3’20 out of the SIL top 15.
Adding that back in yields total major-silver-miner output of 64.4m ounces last quarter, which is down a still-big-but-less-extreme 9.5% YoY. The elite silver miners are heavily concentrated in countries that suffered the longest lockdowns, which spilled into Q3. Those are Mexico and Peru, which accounted for 23% and 16% of 2019’s total global silver output per silver’s leading fundamental authority the Silver Institute.
The SIL-top-15 silver miners also continued to contend with COVID-19 beyond the lingering lockdowns. That includes implementing costly and disruptive measures to slow this virus’s spread, identify workers infected, and quarantine them. This led to widespread labor shortages, forcing many silver mines to operate with reduced staffing which is less efficient. Major silver miners’ quarterlies detailed some of the challenges…
“During Q3 2020, seven of Pan American’s nine operations were operating with limited workforce levels in order to accommodate COVID-19 related protocols. Two of the Company’s operations, Huaron and Morococha in Peru, were suspended for most of Q3 2020, having previously been returned to care and maintenance on July 20, 2020, because of an increase in workers testing positive for COVID-19.”
Pan American Silver’s Q3 report continued “The Company began gradually redeploying its workforce at these mines over the last two weeks of September after intensive health screenings and testing. Huaron and Morococha resumed operations at the end of Q3 2020.” In Q1’20 before the pandemic lockdowns, these two mines accounted for 22% of PAAS’s silver output. Mines being stuck offline really slams production.
First Majestic Silver, which SIL holds under its Canadian stock listing, had ongoing COVID-19 struggles last quarter too. “Worker availability is a challenge amidst the COVID-19 pandemic but has been gradually improving and is being mitigated by increasing the use of temporary workers and contractors to replace vulnerable workers.” That company said those employees accounted for 1/9th of its mine workforce.
Mexico’s Ministry of Health defines these as people at least 60 years old, or suffering from either pre-existing health conditions or compromised immune systems. First Majestic believes COVID-19 infections are such an ongoing threat to operations that it is “also in the process of constructing Polymerase Chain Reaction (“PCR”) laboratory test facilities on site at San Dimas and partnering with test labs at Santa Elena”!
So it is certainly not business as usual for the major silver miners, which are again concentrated in Mexico and Peru since they host the biggest silver deposits. In mid-November as Q3’s earnings season wrapped up, these two countries ranked 11th and 12th in the world in terms of cumulative cases of COVID-19 since testing started. In terms of COVID-19-attributed deaths they fared even worse, at 4th and 10th globally!
These major silver miners’ gold operations, some standalone mines and some byproducts from silver mines, are also largely located in these same countries. So it isn’t surprising that the SIL top 15’s total gold output in Q3’20 mirrored silver’s. The 1,355k ounces these miners produced surged 12.3% QoQ from Q2’20’s lockdown nadir, in line with silver’s 13.7%. But it fell 14.4% YoY from Q3’19, pacing silver’s 13.9%.
Again Hochschild Mining being edged out of the SIL top 15 played a role in this, as it produced 47.8k ounces of gold last quarter. Including it, the major silver miners’ overall gold output drop moderated a bit to 11.4% YoY. The silver miners’ operational struggles in Q3’20 were much worse than the major gold miners of their leading GDX ETF. The GDX top 25 actually saw their overall gold output grow 0.6% YoY in Q3!
Despite the major silver miners’ aggregate silver and gold production falling proportionally last quarter, their overall silver purity plunged considerably. The SIL top 15 averaged just 40.8% of their Q3 revenues from silver, down 11.3% from Q3’19’s 52.1%. That comparable quarter was a high-water mark though, the highest seen in the 18 quarters I’ve been doing this research. That entire span only averaged 38.8%.
Last quarter a relatively-high three silver miners out of the SIL top 15 qualified as primary ones deriving over half their sales from the white metal. They were First Majestic Silver at 61.2%, Fortuna Silver Mines at 62.2%, and Silvercorp Metals at 75.2%. These remain the most-leveraged stocks to silver uplegs, with the best potential to amplify their gains. Fundamentally-superior stocks far outperform deadweight-laden ETFs!
Remember that SIL soared 176.9% in its last mighty upleg between mid-March to early August. In this same short span, First Majestic, Fortuna, and Silvercorp saw their stock prices skyrocket 176.2%, 291.7%, and 278.8% higher! That averages out to 248.9% upleg gains, 1.4x better than SIL’s which these stocks also helped boost. These purest silver stocks far outperformed the other 12 major silver miners in the SIL top 15.
With the SIL top 15’s COVID-19-vexed silver output staying much lower than Q3’19’s levels, unit mining costs should’ve climbed. In silver mining, output and costs are inversely proportional. The more silver mined, the more ounces to spread this industry’s big fixed costs across. Those generally don’t change much from quarter to quarter, regardless of prevailing silver prices. That gives silver mining big leverage to silver.
Individual mines require the same levels of infrastructure, equipment, and employees to feed their fixed-capacity mills quarter after quarter. So lower outputs directly translate into higher unit costs. In Q3’19 in the idyllic pre-pandemic world, the SIL top 15’s cash costs and all-in sustaining costs had been running $6.61 and $10.74 per ounce. In Q3’20 those should’ve risen in proportion to the 13.9% shrinkage in silver output.
Cash costs are the classic measure of silver-mining costs, including all cash expenses necessary to mine each ounce of silver. But they are misleading as a true cost measure, excluding the big capital needed to explore for silver deposits and build mines. So cash costs are best viewed as survivability acid-test levels for the major silver miners. They illuminate the minimum silver prices necessary to keep the mines running.
The SIL top 15’s reported cash costs averaged $6.99 per ounce last quarter, indeed rising but only by 5.7% YoY. And those were actually skewed high by Peru’s Buenaventura, which suffered COVID-19-related disruptions to many of its operations. Its resulting brutal 40.4% YoY silver-output plunge caused cash costs to skyrocket 58.9% YoY to $18.69! Excluding that crazy-extreme outlier, the average drops to $5.53.
The negative cash costs reported by Silvercorp are righteous, resulting from huge byproduct credits from its major lead and zinc production. Those aren’t an anomaly, this company has reported negative cash costs for years. Its market capitalization usually leaves it around the cutoff for the SIL top 15 after any given earnings season. So whether or not SVM is included really affects the major silver miners’ overall average.
All-in sustaining costs are far superior than cash costs, and were introduced by the World Gold Council in June 2013. They add on to cash costs everything else that is necessary to maintain and replenish silver-mining operations at current output tempos. AISCs give a much-better understanding of what it really costs to run silver mines as ongoing concerns, and reveal the major silver miners’ true operating profitability.
Amazingly given their falling silver output, the SIL top 15 reported a big surprise last quarter on that front. Their average AISCs of just $9.62 per ounce not only shockingly fell 10.4% YoY, but were the lowest seen out of the last 18 quarters! The major silver miners did fantastic controlling costs, despite all the additional COVID-19-related expenses they are facing. Plunging AISCs at two companies were mostly responsible.
Pan American Silver saw its AISCs collapse 31.7% YoY, while SSR Mining’s dropped an even-greater 39.7%! These sharply-lower costs moved hugely counter to these miners’ serious 38.7% and 23.1% craterings in silver outputs last quarter. Buried deep in PAAS’s report, its sharp AISC plunge was attributed to inventory adjustments. Unfortunately that was a one-off anomaly related to COVID-19 production swings.
Pan American’s full-year-2020 guidance is forecasting AISCs at a midpoint or $11.50, almost double that super-low Q3 read! SSRM explained its own lower AISCs paradoxically arose from reduced costs due to lockdowns, not elaborating much. But it too warned that these low AISCs won’t last, guiding to this year’s averaging a much-higher $16.00. So overall SIL-top-15 AISCs are likely to climb back up near $12 or so.
But regardless of prevailing AISCs, far-higher silver prices radically improved the profitability of this small sector. Q3’20’s average silver price of $24.39 rocketed up 43.7% YoY, way outpacing gold’s own 29.8% gain! That was the highest quarter for silver since Q1’13, after which silver collapsed with gold on the Fed’s extreme QE3 levitating the stock markets. Silver languished for long years after that brutal thrashing.
Looking at the major silver miners’ average AISCs compared to average prevailing silver prices is a great proxy for industry profitability. And with impressively-high silver prices and super-low AISCs last quarter, unit earnings naturally exploded. The SIL top 15 enjoyed enormous profits of $14.77 per ounce, which soared a stupendous 137.2% YoY! Both metrics proved the best by far in the 18 quarters I’ve been doing this.
Over the previous 17 quarters before Q3’20, silver-mining profitability per this proxy averaged just $4.46. And the silver miners are almost certain to continue generating huge earnings in this currently underway Q4’20. By mid-November as Q3’s earnings season wrapped up, silver was still averaging $24.26 quarter-to-date. That’s right in line with Q3’s $24.39! And even if silver keeps correcting, prices should remain high.
While gold governs the extent of silver corrections, silver’s 200-day moving average is strong support for major bottomings. Mid-month that was running $20.17 and rising. If silver challenges that at some point before Q4 ends, it would still be hard to imagine this quarter’s average silver price falling under $22 or so. And if SIL-top-15 AISCs climb back up near $12, that implies major silver miners still earning $10 per ounce.
If these mid-quarter estimates are in the ballpark, these elite silver miners’ unit earnings would soar yet another 63.7% YoY in this current quarter! Unless silver craters which is incredibly unlikely, we shouldn’t see any scenarios where silver-mining earnings don’t remain really strong. The higher this sector’s profits and the more sustainable they are, the greater silver stocks’ upside potential during silver’s next upleg.
On the hard-financial-results front under Generally Accepted Accounting Principles reported to securities regulators, or their foreign equivalents, the major silver miners achieved a great quarter financially in Q3’20. The SIL top 15’s total revenues surged 18.6% YoY to $3.9b! The much-higher prevailing silver and gold prices easily overcame the COVID-19-hobbled lower production of these two precious metals.
In actual bottom-line accounting-earnings terms, these major silver miners collectively reported earning a very-strong $374m in profits! That skyrocketed 182.9% YoY from Q3’19’s total, confirming that silver mining is very lucrative at these relatively-high price levels. Both quarters’ earnings numbers came from normal ordinary operating results too, with no big non-cash charges or gains distorting these sector totals.
Naturally the high silver prices also fueled massive operating-cash-flow-generation growth. Q3’20’s total OCFs reported by the SIL-top-15 silver miners soared 82.0% YoY to almost $1.5b! That helped these companies grow their treasuries by 35.7% YoY to $3.4b. They will likely deploy a large fraction of this big windfall to help expand existing mines, upping their future production. That’s really bullish for silver-stock prices.
With the major silver stocks sporting such strong fundamentals in Q3 and almost certainly again in Q4, their next bull-market upleg has strong potential to balloon to more outsized gains. But first this sector has to weather this necessary and healthy in-progress correction, which is controlled by gold’s own. This is the time to do your silver-stock homework, crafting a buy list for the bargains to come as this selloff climaxes.
At Zeal we started aggressively buying and recommending fundamentally-superior gold and silver miners in our weekly and monthly subscription newsletters back in mid-March right after the stock-panic lows. We layered into dozens of new positions before silver stocks grew too overbought, which were stopped out later at huge realized gains running as high as +199%! Our subscribers multiplied their wealth within months.
To profitably trade high-potential gold and silver stocks, you need to stay informed about what’s driving gold. Our popular newsletters are a great way, easy to read and affordable. They draw on my vast experience, knowledge, wisdom, and ongoing research to explain what’s going on in the markets, why, and how to trade them with specific stocks. Subscribe today and take advantage of our 20%-off sale! We’ll redeploy aggressively in fundamentally-superior gold and silver stocks as this correction passes.
The bottom line is the major silver miners reported strong Q3 results. Their collective gold and silver outputs rebounded sharply from Q2’s lockdowns. But lingering COVID-19 impacts still left production considerably lower than the comparable prior-year quarter. Yet somehow the miners still managed to cut costs in that challenging environment, contributing to outstanding earnings in both unit and bottom-line terms.
The highest prevailing silver prices in the better part of a decade fueled big growth in profits, sales, and operating cash flows. And with silver remaining high despite being in a healthy correction, silver miners’ super-bullish trend of fast-improving fundamentals is likely to continue. That portends much-higher silver-stock prices as their metal’s next bull-market upleg gets underway. This silver-stock bull has lots of room to run.
This Chart Signals When Gold Stocks Will Explode
By Jordan Roy-Byrne CMT, MFTA
Gold Stocks remain in a correction, even if the October 29 lows continue to hold into December.
Corrections are a function of price and time, and often in this sector, a correction can continue in terms of time, well after a low in price is made. But I digress.
The most significant and most consistent moves to the upside usually occur after a crash or after a major breakout.
Gold and silver stocks made tremendous moves after the Covid crash and remain in position for tremendous upside moves over the quarters ahead.
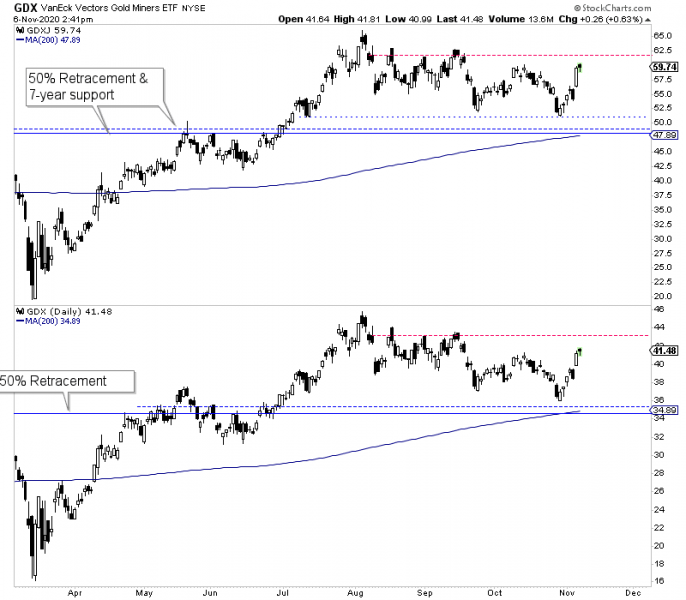
As you can see, the junior gold stocks (GDXJ and GOEX) are simply correcting and retesting their recent multi-year breakouts.
GDX already did so but on a smaller scale. It has less upside potential, while SIL (silver stocks) is consolidating before it attempts a major breakout.
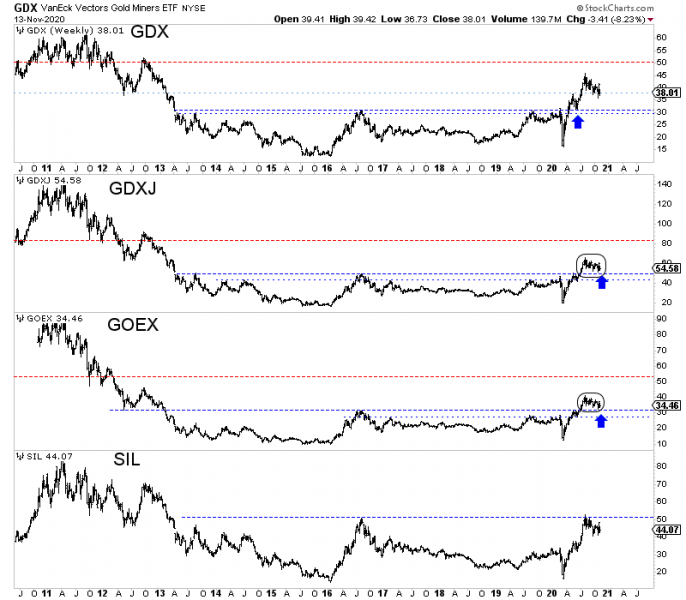
In short, when this correction is over, junior gold stocks have a good chance to run higher and higher towards the upside targets (red lines). Silver stocks (SIL) could breakout and run with a minimal retest in between.
The above charts are very bullish, but they do not answer my question of when.
To answer the question, consider the charts of GDX and GDXJ against Gold. These ratios have a great chance to break past the near 8-year resistance.
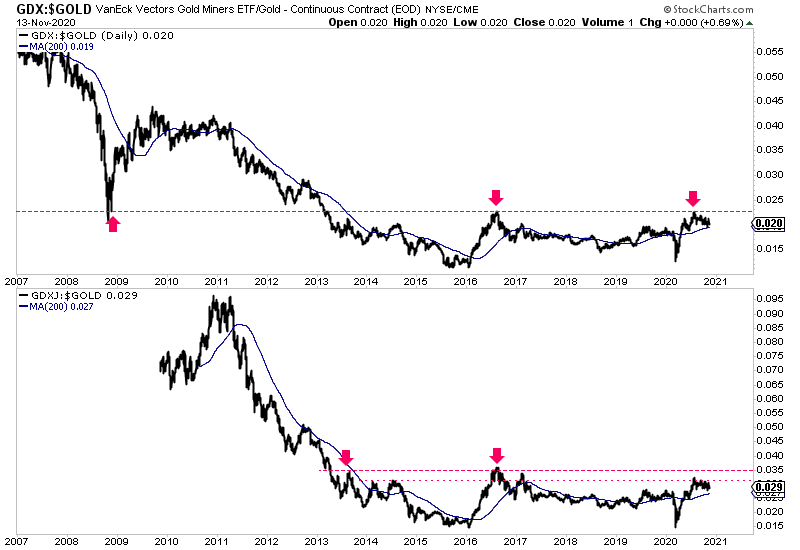
The GDXJ to Gold ratio, upon a break past its 2013 and 2016 highs, would have a measured upside target of 0.055, which is almost a double in the current ratio.
There will be a one-two punch of Gold breaking past $2,100/oz to new highs coupled with juniors (and all gold-stock indices) dramatically outperforming.
That is when momentum and speculation will explode. GDX will trend towards $100, and GDXJ will trend well past $100.
The good news is that the move of gold stocks breaking out against Gold has not even started.
There’s still time, and there’s plenty of quality juniors trading at reasonable valuations.
I don’t know when that move will start (probably sometime next year), but I do my best to keep subscribers abreast of developments every week.
In our premium service, we continue to focus on identifying and accumulating those stocks with significant upside potential over the next 12 to 24 months. To learn the stocks we own and intend to buy that have 3x to 5x potential, consider learning more about our premium service.
The major gold miners’ stocks have been grinding lower on balance for a few months now in a healthy correction. This necessary rebalancing is achieving its mission of dampening enthusiasm, paving the way for this contrarian sector’s next bull upleg. Rebounding from governments’ COVID-19 lockdowns, the gold miners reported strong operating and financial results last quarter that fully justify more bull-market gains.
The leading and dominant gold-stock benchmark and trading vehicle today is the GDX VanEck Vectors Gold Miners ETF. Launched way back in May 2006, GDX’s first-mover advantage has grown into an insurmountable lead. With $16.0b of net assets this week, GDX commands a staggering 32.9x more capital than its next-biggest 1x-long major-gold-miners-ETF competitor! GDX is really the only game in town.
GDX’s super-volatile price action this year reflects the wild ride gold stocks have had. Over 4.8 months into early August, this ETF rocketed 134.1% higher out of mid-March’s stock panic! That left gold stocks extremely overbought, thus due for a correction to rebalance sentiment. And that is exactly what has happened since, with GDX’s total selloff extending to 17.9% at worst over 2.8 months so far by late October.
That’s still really mild by gold-stock-correction standards, which I detailed in an essay a few weeks ago. The current correction is the fourth of this secular gold-stock bull. Its first three averaged serious GDX losses of 36.5% over 8.0 months! Gold stocks’ overwhelmingly-dominant primary driver is the fortunes of gold. The miners’ earnings that ultimately determine their stock prices really leverage gold’s price moves.
Gold stocks’ current correction has mirrored gold’s own, and this metal itself isn’t out of the correction woods yet. The American stock traders who fueled gold’s latest powerful upleg into early August have been largely missing in action since. Meanwhile speculators’ gold-futures positioning is still excessively-bullish. That leaves them lots of room to sell and hammer gold as the oversold US dollar mean reverts higher.
But even if the parallel gold and gold-stock corrections haven’t matured and climaxed yet, speculators and investors need to stay abreast on the major gold miners’ fundamentals. The stronger they are, the greater this sector’s upside potential in its next bull-market upleg. And the just-reported Q3’20 results from the world’s biggest gold miners proved super-impressive. They are thriving operationally and financially.
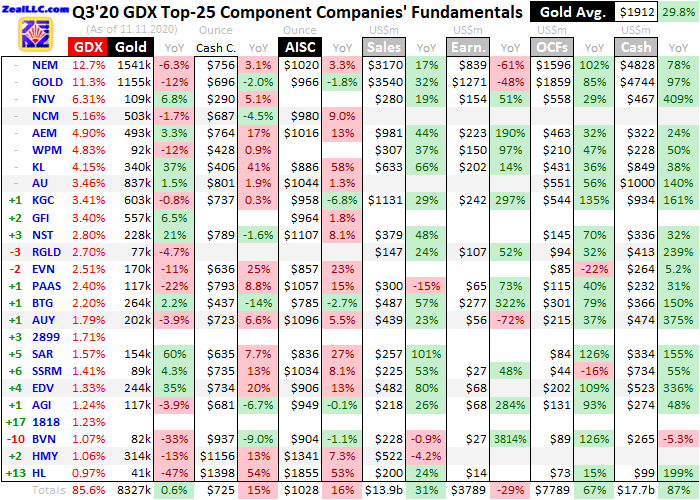
For 18 quarters in a row now, I’ve painstakingly analyzed the major gold miners’ latest quarterly results right after they are reported. While GDX contained a crazy 52 component stocks this week, I’m limiting my analysis to its top 25 holdings. These are the world’s biggest and best gold miners, which command a dominant 85.6% of GDX’s total weighting. The lion’s share of capital chasing gold stocks ends up in them.
These elite gold miners trade in the US, Australia, Canada, South Africa, and China, making amassing this data somewhat challenging. There are different financial-reporting requirements around the globe, and even within the same country miners report different data in different ways. Half-year reporting is common outside the US, and Q3s are off-cycle quarters. But most miners still give shorter quarterly updates.
This table summarizes the operational and financial highlights from the GDX top 25 in Q3’20. These elite gold miners’ symbols are listed, some of which are from their primary foreign stock exchanges. That is preceded by their ranking changes in terms of GDX weightings from Q3’19. Then their current weightings as of this week follow those stock symbols. This ETF essentially weights gold stocks by market capitalizations.
So relative ranking changes help illuminate outperformers and underperformers over this past year. That data is followed by each miner’s Q3’20 gold production in ounces, and its year-over-year change from Q3’19’s results. Then comes cash costs per ounce and all-in sustaining costs per ounce along with their YoY changes, revealing how much it costs these elite miners to wrest their gold from the bowels of the earth.
Next quarterly revenues, GAAP earnings, operating cash flows generated, and cash on hand are listed along with their YoY changes. Blank data fields mean companies hadn’t reported that particular data as of the middle of this week. Blank percentage fields indicate those changes would be either misleading or not meaningful, like comparing two negative numbers or data shifting from positive to negative and vice versa.
Sporting the highest average gold prices ever seen, last quarter promised to be a banner one for major gold miners. And they didn’t disappoint, with production rebounding strongly from lockdown-constrained Q2 levels. High gold prices and higher output fueled big revenues, earnings, operating-cash-flow, and treasury growth last quarter. The major gold miners’ fundamentals are looking the best they’ve ever been!
There was no shuffling among GDX’s largest 8 holdings over this past year, which together account for the majority of this ETF at 52.8% of its total weighting. There were only a handful of stocks which enjoyed sufficient market-cap gains since Q3’19 to climb into the ranks of GDX’s top 25 gold miners. They weighed in at 85.6% of GDX, which is normal concentration levels in line with recent years’ averages for this ETF.
Production is the lifeblood of the gold-mining industry, and these major gold miners enjoyed solid output growth last quarter. The 8.3m ounces they collectively produced in Q3’20 actually climbed a slight 0.6% YoY. That’s quite an achievement given all the challenging constraints imposed by governments’ orders to fight COVID-19. The GDX top 25’s quarterly reports were clear this pandemic is still impacting them.
Many gold mines around the world are operating with reduced staffing. As mine workers test positive for the virus, they must be quarantined. Those sick employees usually can’t be temporarily replaced. Gold mining is a highly-specialized industry already employing the experienced people globally. Mining sites are often remote, in rural areas with small labor pools. Healthy workers have to take up the slack from sick ones.
Most of the national lockdowns governments mandated to slow the spread of COVID-19 ended in Q2 or the initial weeks of Q3. With these forced shutterings lifted, the GDX top 25’s total gold output rebounded strongly last quarter. Sequentially quarter-on-quarter, these elite major gold miners’ output soared 10.2% from Q2 to Q3! They certainly didn’t let moss grow under their feet once they could resume operations.
And that 0.6% YoY output growth to 8.3m ounces mined was much better than global gold mining as a whole. The World Gold Council publishes the best-available worldwide gold fundamental supply-and-demand data quarterly. Its latest outstanding must-read Gold Demand Trends report from Q3’20 was released in late October. It revealed global gold-miner output actually fell a sharp 3.4% YoY last quarter!
So the GDX top 25 really outperformed their sector as a whole, ramping operations back up faster than many of their smaller peers. A larger acquisition and smaller merger also stuffed more gold production into the top 25 over this past year. The best major gold miner Kirkland Lake Gold bought Detour Gold earlier this year. And SSR Mining recently merged with Alacer Gold, growing into a bigger mid-tier producer.
But these newly-combined companies’ higher production was partially offset by a second Chinese gold miner surging into the rarefied GDX-top-25 ranks. Zhaojin Mining joined the larger Zijin Mining in this last quarter. These are the two companies above with numeric symbols, trading in Hong Kong. Every quarter for years now, I’ve looked for their operational and financial results in English. But neither company ever bothers.
GDX’s managers probably shouldn’t include these Chinese gold miners. Regardless of their size, they are far too opaque for American traders. Even professional Wall Street reports on their spartan quarterly results, coming from Chinese analysts working over there, don’t discuss output and costs! After spending decades wading through quarterly reports, I’m still shocked how useless Chinese reporting standards are.
Had Zhaojin not climbed into the GDX top 25’s ranks with its apparently-secret non-disclosed gold output, the year-over-year production gains of the major gold miners would’ve been even larger. Another factor pinching their aggregate output growth was substantial year-over-year declines seen by the two giants dominating this industry. Newmont and Barrick Gold account for fully 24.0% of GDX’s total weighting!
NEM and GOLD saw their colossal quarterly production levels fall 6.3% and 11.6% YoY in Q3’20, which really dragged down the gold majors’ total. Newmont attributed its production decline “due to ongoing Covid-related impacts at Yanacocha, Cerro Negro and Eleonore as the operations continued to ramp up in the third quarter from care and maintenance”. That makes sense with these first two mines in Peru and Argentina.
But the other mega-gold-miner Barrick didn’t even attempt to explain its sharp output drop. Instead it just blew smoke with misdirection, talking about meaningless “beating our earnings consensus”. Then its CEO claimed that “Barrick’s consistently strong performance since the merger has more than validated our belief that a combination of the best assets with the best people would deliver the best returns.” Really?
He was referring to Barrick’s acquisition of Randgold announced in September 2018. In February 2019 I wrote a whole essay analyzing why gold-stock mega-mergers are bad for investors. For years before that expensive $6.5b dilutive all-stock deal, Barrick had struggled with declining output as shown in a table in that essay. Barrick alone produced 1516k ounces in Q4’16, which had already shrunk to 1149k in Q3’18.
In that same last pre-merger quarter, Randgold’s output was 309k ounces. So these soon-to-be-merged major gold miners together produced 1458k before consummating their corporate marriage. In the just-reported Q3’20, this merged company’s output of 1155k was right back down to where Barrick had been before it bought Randgold! And this new Barrick enjoyed no rebound from Q2’20’s lockdown-driven 1149k.
In my mega-mergers-bad essay in February 2019 I warned, “Can bringing two rapidly-depleting major gold miners together magically make a stronger one? I doubt it. Barrick’s reported production will enjoy a big temporary boost for its first four quarters as a merged company, and then waning production will again be unmasked.” All Barrick shareholders got for their $6.5b was a single-year reprieve from inexorable depletion!
In Barrick’s just-released Q3’20 results, its full-year-2020 production guidance ran at a midpoint of 4800k ounces. That would be down 12.2% YoY from the 5465k ounces it mined in 2019. The biggest gains in gold-stock prices come from miners growing their outputs. That certainly isn’t Barrick despite grandiose claims of “consistently strong performance since the merger”. Which gold stocks traders own really matters.
While GDX is a good gold-stock trading vehicle, my beef with it for years now has been it has too much deadweight. Barrick is the leading example at 1/9th of this ETF’s total weighting. Major gold miners not able to consistently grow their output heavily retard the overall performance of GDX. The fundamentally-superior smaller mid-tier gold miners achieving growth enjoy stock-price gains trouncing those of this ETF.
With the GDX top 25’s gold production rebounding sharply from Q2’s lockdown nadir, I really expected to see lower unit mining costs. In gold mining, output and costs are inversely proportional. The more gold mined, the more ounces to spread this industry’s big fixed costs across. Those generally don’t change much from quarter to quarter, regardless of prevailing gold prices. That gives gold mining big leverage to gold.
Individual mines require the same levels of infrastructure, equipment, and employees to feed their fixed-capacity mills quarter after quarter. So higher outputs directly translate into lower unit costs. In Q2’20 during those widespread lockdowns, the GDX top 25’s cash costs and all-in sustaining costs surged to $646 and $984 per ounce. They should’ve fallen sharply in Q3 in proportion to that 10.2% QoQ output growth.
Cash costs are the classic measure of gold-mining costs, including all cash expenses necessary to mine each ounce of gold. But they are misleading as a true cost measure, excluding the big capital needed to explore for gold deposits and build mines. So cash costs are best viewed as survivability acid-test levels for the major gold miners. They illuminate the minimum gold prices necessary to keep the mines running.
These elite GDX-top-25 gold miners reported average cash costs of $725 in Q3, which soared a stunning 15.1% YoY! This not only defied the expected cost plunge on much-better production, but these proved the highest cash costs by far in the 18 quarters I’ve been doing this research. The previous high was just $658 in Q4’19. While cash costs aren’t too important, their counter-production surge was a bit concerning.
Some of this can be explained by all the extensive COVID-19 protocols the gold miners have to follow to prevent outbreaks in their workforces. But a bigger factor was two extreme outliers skewing this average higher. South Africa’s long-struggling Harmony Gold and the US’s Hecla Mining reported absurdly-high cash costs of $1156 and $1398 per ounce last quarter! Excluding them, the GDX-top-25 average fell to $667.
For many years now, the troubled South African majors have had to contend with hostile government regulations suffocating their businesses. And the deeper those old gold mines tunnel, the higher costs rise. Hecla took a page out of Barrick’s book on misdirection, not even acknowledging plummeting output and soaring costs in its latest quarterly report. Instead it touted “our strong operating performance”. Seriously?
All-in sustaining costs are far superior than cash costs, and were introduced by the World Gold Council in June 2013. They add on to cash costs everything else that is necessary to maintain and replenish gold-mining operations at current output tempos. AISCs give a much-better understanding of what it really costs to maintain gold mines as ongoing concerns, and reveal the major gold miners’ true operating profitability.
These GDX-top-25 gold miners suffered that same counter-production cost inflation in their AISCs. They soared a scary 16.4% YoY to hit $1028 per ounce! That was also the highest in the last 18 quarters, knocking out Q2’20’s $984. But again Harmony and Hecla were largely to blame, as they reported extreme outlying AISCs of $1341 and $1855! Excluding them, the rest of these elite majors averaged just $965.
That would still have been a hefty 9.2% YoY jump, but is much more reasonable. The major gold miners that did honorably address rising AISCs head-on in their quarterly reports generally cited lower ore grades at individual gold mines. Again the tonnage throughputs of mills grinding gold-bearing ores are fixed. So the less gold contained in that rock in any quarter, the fewer ounces produced and thus the higher unit costs.
Pan American Silver, which is now overwhelmingly a primary gold miner with this yellow metal accounting for 2/3rds of its Q3 revenues, had an interesting explanation. It reported that it had to replenish crushed-ore inventories sitting on heap-leach pads, which were “drawn down during the mine suspensions in Q2 of this year”. While I didn’t see that mentioned elsewhere, I suspect other gold miners were in that same boat.
But whether the major gold miners’ costs surged 16.4% or 9.2% YoY, they didn’t outpace the amazing gains in gold. Q3’20’s stellar $1912 average gold price was the highest ever witnessed, soaring 29.8% YoY! So the powerful gold-price gains in the wake of mid-March’s lockdown-fueled stock panic far more than offset these higher production costs. GDX-top-25 average AISCs are a great proxy for industry profitability.
Last quarter’s $1912 average gold less those unduly-skewed $1028 AISCs still yield incredibly-fat profits of $884 per ounce! That’s the highest by far in the years I’ve been working on this research thread, and almost certainly an all-time record. That soared an awesome 49.7% YoY from Q3’19 levels. While not as big of unit-earnings gains as I’d expected given higher production, that still trounced every other stock sector.
And Q3’s huge gold-miner profits growth wasn’t some one-off isolated anomaly, but the latest in a strong trend of soaring earnings. In the four quarters leading into Q3’20, the GDX top 25’s unit profits per this proxy blasted 53.5%, 56.0%, 55.5%, and 66.2% higher YoY! So Q3’s 49.7% growth was right in line with this precedent. The major gold miners’ fundamentals are super-strong with such high prevailing gold prices.
And those are lingering despite gold’s in-progress correction, portending big earnings growth in this half-finished Q4. Quarter-to-date, gold is still averaging an awesome $1901. And the gold miners themselves are predicting declining AISCs. Their average AISC guidance for full-year 2020 ran $1005 per ounce in midpoint terms in their latest quarterly reports. Achieving that would require Q4 AISCs under Q3’s $1028.
Including Q3’20, the last four reported quarters saw GDX-top-25 AISCs average $969. That is as good of estimate as any for Q4. And even if gold keeps correcting, it is unlikely this quarter’s average gold price will be dragged under $1850. So the major gold miners’ potential earnings per ounce in Q4’20 are still on track to hit $881, almost matching Q3’s $884. That would make for another massive 59.7% YoY gain!
On the hard-financial-results front under Generally Accepted Accounting Principles reported to securities regulators, or their foreign equivalents, the major gold miners achieved an amazing quarter financially. The GDX top 25’s total revenues surged 31.2% YoY to $13.9b! That outstanding top-line sales growth jibes with average gold prices soaring about 30% YoY while GDX-top-25 gold-mining output edged up 1%ish.
Those would’ve been the highest quarterly sales on record, but fell short because they don’t include Q3 revenues from most of the major Australian and South African gold miners. They again report half-years instead of quarters, and Q3 is an off quarter where they usually just offer operational results. If average gold prices remain high, the upcoming Q4 sales including all the half-year reporters will definitely hit a record.
In actual bottom-line accounting-earnings terms, these GDX-top-25 gold miners collectively reported an enormous $3.8b in profits! That doesn’t even include the half-year reporters. And the great majority of that huge number was ordinary earnings from normal gold-mining operations. In wading through all the quarterly income statements, I only saw a single $0.2b noncash gain from a reversal of an impairment charge.
Nevertheless these GAAP profits were still down 29.0% YoY, which sounds weak. But Q3’19 included staggering non-cash gains from a Nevada joint venture done by those behemoths Newmont and Barrick. They recorded epic $2.4b and $2.7b gains in that comparable quarter related to that big deal! These are one-time items that should be backed out. Without them alone, Q3’19’s GDX-top-25 earnings were less than $0.3b.
So the major gold miners’ hard accounting profits actually skyrocketed last quarter! The record prevailing gold prices were also reflected in huge operating-cash-flow-generation growth. The GDX top 25’s OCFs collectively totaled $7.8b in Q3’20, which soared 67.2% YoY! That dwarfs the last 18 quarters’ previous best of $5.3b in Q4’19. The major gold miners are spinning off cash hand over fist in this environment.
Those massive OCFs helped fuel an 87.1% YoY rocketing in the GDX top 25’s collective cash hoards, to a record $17.7b at the end of Q3! Almost all these elite major gold miners reported big jumps in their treasuries, regardless of whether their gold outputs rose or fell. These huge cash balances are going to be burning holes in managements’ pockets, likely unleashing a big new wave of mergers and acquisitions.
That’s not going to benefit the majors, which will be spending their billions to buy up smaller gold miners. The fundamentally-superior mid-tier and junior gold miners with consistently-growing production will be the stocks the majors fight over. They will have to offer big premiums to entice shareholders to sell. And the gold-mining realm is fairly small, so bidding wars are likely as majors spend their cash to offset their depletion.
With the major gold stocks sporting such awesomely-bullish fundamentals in Q3 and almost certainly Q4, their next bull-market upleg has strong potential to balloon to more outsized gains. But first this sector has to weather this necessary and healthy in-progress correction, which is controlled by gold’s own. This is the time to do your gold-stock homework, crafting a buy list for the bargains to come as this selloff climaxes.
At Zeal we started aggressively buying and recommending fundamentally-superior gold and silver miners in our weekly and monthly subscription newsletters back in mid-March right after the stock-panic lows. We layered into dozens of new positions before gold stocks grew too overbought, which were stopped out later at huge realized gains running as high as +199%! Our subscribers multiplied their wealth within months.
To profitably trade high-potential gold stocks, you need to stay informed about what’s driving gold. Our popular newsletters are a great way, easy to read and affordable. They draw on my vast experience, knowledge, wisdom, and ongoing research to explain what’s going on in the markets, why, and how to trade them with specific stocks. Subscribe today and take advantage of our 20%-off sale! We’ll redeploy aggressively in fundamentally-superior gold and silver stocks as this correction passes.
The bottom line is the major gold miners reported outstanding Q3 results! Their collective gold production not only rebounded sharply from Q2’s lockdowns, but even grew from the comparable prior-year quarter. That was much better performance than global gold miners as a whole. Yet production costs did rise on ongoing COVID-19 mitigation measures and lower ore grades, eroding some potential earnings growth.
But with record-high average gold prices, the major gold miners’ profits still rocketed higher in both unit and bottom-line terms. Their collective earnings from normal operations have never been stronger. And with soaring operating cash flows and treasuries, these flush majors are going to be looking to gobble up smaller gold miners. These amazing fundamentals justify much-higher stock prices after this correction ends.
Adam Hamilton, CPA
November 13, 2020
Copyright 2000 – 2020 Zeal LLC (www.ZealLLC.com)
First Cobalt Corp., substantial cash flow from cobalt refinery by late 2022
Note: unless indicated otherwise, all figures in US$.
This week’s news from Pfizer Inc. about a COVID-19 vaccine that’s (potentially) > 90% effective in preventing the virus is very bullish for the global economy. Stock markets around the world soared on the day of the announcement.
In the second half of 2021, global economic activity (GDP) could be back up to within 5% of pre-COVID-19 levels, helped in large part by massive fiscal stimulus packages.
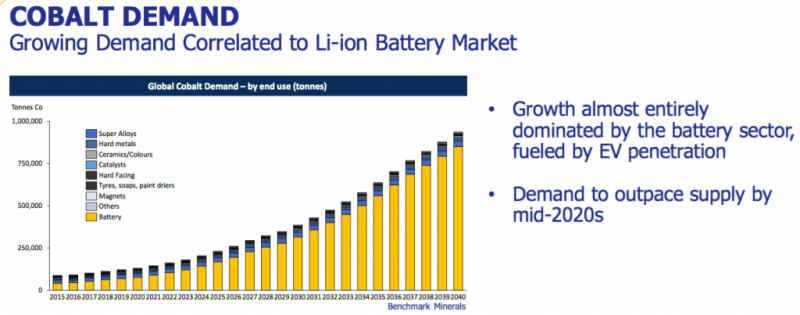
As the pandemic’s destructive impact abates, few industry sectors are better positioned to flourish than Electric Mobility — the electrification of all forms of consumer, passenger, industrial & commercial transportation. COVID-19 spurred several countries, most notably China, to stimulate weak economies with EV subsidies, rebates, tax breaks, etc.
As a result, sales have held up remarkably well. Global EV sales in September were up 91%, now accounting for roughly 1 in 20 new car sales. Chinese sales of EVs are growing even faster, expected to reach 1 in 5 by 2026. Chinese EV sales alone virtually assure strong demand for battery metals. Yet, Tesla is building new car, truck and battery operating facilities that by 2030 would reportedly require more lithium than the world’s entire (current) lithium production capacity.
Investors in some battery metal juniors poised to ride this wave are catching on. The top-10 performing lithium players are up between 262% – 1,280%, (average of 555%) from 52-week lows. The top five performing nickel juniors are up from ~400% to 650%.
By contrast, there are very few high-quality cobalt juniors. First Cobalt Corp. (TSX-V: FCC) / (OTCQX: FTSSF) might be the ONLY pure-play cobalt investment opportunity on the planet — with cobalt assets outside of Africa and China — cash flow starting in < 2 years, a market cap of > $10M and a primary stock listing in N. America.
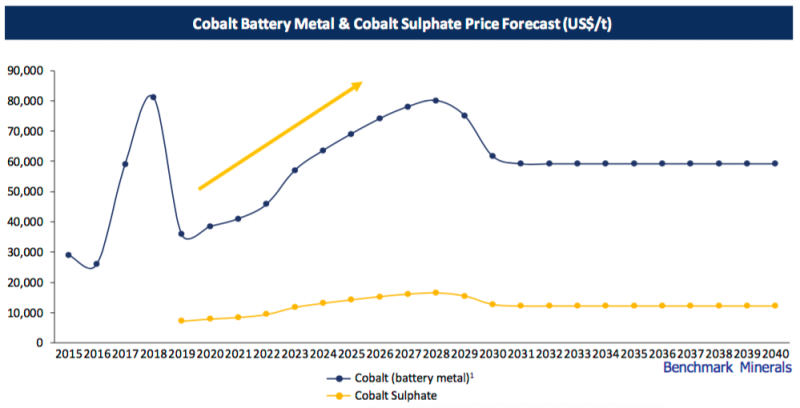
Both lithium & cobalt prices at or near 3-yr+ bottoms
I see no way in which First Cobalt’s share price would not move higher if cobalt prices rebound from current low levels. Battery metal experts like Benchmark Mineral Intelligence, Roskill, Adamas Intelligence, CRU, Wood Mackenzie, forecast a meaningful increase in the cobalt price by the mid-2020s from today’s level of ~$15.5/lb.
For example, Benchmark expects the price to rise steadily to ~$36/lb. in 2028, before falling to a long-term price assumption of $26.8/lb. from 2030 on. If the cobalt price does end up soaring, I think that First Cobalt’s valuation would rise even more.
Refurbishing & expanding First Cobalt’s refinery is underway and is expected to cost $60M. A substantial portion of this figure is expected to come from loans issued by a shortlisted group of 3-4 institutional investors. Some of the capital needed could come from Canadian government agencies / investment groups, possibly including grant(s).
Depending on how financing plans progress, I estimate that First Cobalt might need to come up with a total of $5-$15M in non-debt capital over the next 18-24 months. Some of that cash could come from the disposition of cobalt assets in Idaho (USA), or more likely from the sale of cobalt/silver properties in Ontario.
To be clear, there’s no immediate need for capital, and the maturity of the Company’s $5M loan from Glencore was recently extended until August 2022.
First Cobalt announces 97% recovery in bench-scale testing!
On November 10th, First Cobalt Corp. delivered an update on commercial contracts & metallurgical test work relating to its 100%-owned, permitted cobalt refinery in Ontario, Canada. Since August of 2019, Glencore plc has been assisting in the refurbishment of the refinery. According to the press release,
“First Cobalt and Glencore have agreed to discuss a long-term feed purchase contract rather than the tolling arrangement originally contemplated, providing First Cobalt greater leverage to the cobalt market by entering into offtake contracts with end users directly.”
In order to secure diversity of feedstock supply, First Cobalt will supplement feed provided by Glencore with other ethically-sourced cobalt. Trent Mell, President & CEO commented,
“The change in approach towards feed purchase contracts results in greater exposure to the cobalt market and potentially a greater share of project economics. With the decision to be a market purchaser of feedstock, rather than a toll refiner, the Company has resumed discussions with lenders and intends to move aggressively to advance its strategy. I am very appreciative of Glencore’s ongoing support and look forward to working towards completing a mutually agreeable cobalt hydroxide supply agreement for our refinery.”
Bench-scale testing of cobalt hydroxide feedstock from Glencore yielded recoveries above 97%, significantly higher than the 93% assumption in the Company’s May 2020 engineering study.
Pilot plant completion and submission of refinery permit amendments remain on track and discussions about government support are well advanced. Securing feedstock under long-term cobalt hydroxide purchase contracts, rather than via a tolling arrangement, gives First Cobalt shareholders greater leverage to an improving cobalt market.
Reading between the lines of this important press release
A source of comfort for some, and concern for others, has been Glencore’s major backing of First Cobalt’s refinery. Last year Glencore provided a huge vote of confidence in the asset. At the same time, some investors wondered if Glencore would have too much power over the refinery’s operations & economics.
Initially it was thought that Glencore would lend most of the investment capital needed to refurbish the refinery, provide most (or all) of the feedstock AND control most (or all) of the finished cobalt output.
However, in this week’s press release we learn that Glencore is stepping back a bit, allowing First Cobalt to take on more risk, but also more potential return. Glencore will not hold the lion’s share of the debt, instead debt will be spread among 2-4 institutional investors.
Glencore is no longer on the hook to provide up to 100% of the refinery’s feedstock. That requirement will now be prudently spread across a number of producers able to consistently supply ethically-sourced cobalt hydroxide. Finally, First Cobalt will control its cobalt off-take because it will be taking possession of the feedstock (not merely toll-milling it for others).
Albeit with more risk, First Cobalt could receive 2x the cash flow….

Make no mistake, these developments add significant logistical considerations and risks for CEO Trent Mell and his team. For instance, the Company will have much larger working capital needs if it has to buy its own feedstock.
Working with multiple industry players diversifies some risk, but will likely introduce other risks. Few companies have the financial resources of Glencore. However, if the pieces of the puzzle come together in 2022, shareholders will retain a much greater share of the economics.
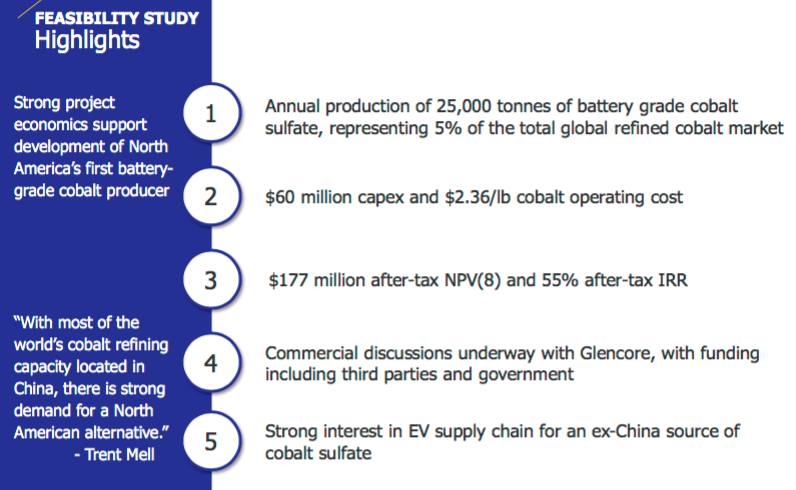
Readers may recall that at the project-level, annual pre-tax cash flow for toll-milling was estimated to be $41M at $25/lb. cobalt and an assumed recovery rate of 93%. At that same cobalt price and a 97% recovery, cash flow increases to about $48M/yr.
Importantly, with improvements in op-ex as detailed in this September press release, PLUS a higher recovery (97% vs. 93%), and with modest room for further enhancements, the same annual cash flow depicted in the May 2020 BFS from a $25/lb. cobalt price assumption might now be achievable at $22/lb.
If First Cobalt is not toll-milling ore for Glencore (or another party) then it gets to keep all (or substantially all) project-level pre-tax cash flow! I don’t know what portion of the economics Glencore was expected to get, but I think it was at least half.
Therefore, although there’s more risk associated with Glencore’s diminished role in the refinery restart, First Cobalt Corp.’s (TSX-V: FCC) / (OTCQX: FTSSF) shareholders could receive up to twice the cash flow they had been expecting, starting in about two years. Net, net I consider this to be a very favorable development, but I’m a risk-loving investor in small-cap metals / mining companies.
Disclosures: The content of this article is for information only. Readers fully understand and agree that nothing contained herein, written by Peter Epstein of Epstein Research [ER], (together, [ER]) about First Cobalt Corp., including but not limited to, commentary, opinions, views, assumptions, reported facts, calculations, etc. is to be considered implicit or explicit investment advice. Nothing contained herein is a recommendation or solicitation to buy or sell any security. [ER] is not responsible for investment actions taken by the reader. [ER] has never been, and is not currently, a registered or licensed financial advisor or broker/dealer, investment advisor, stockbroker, trader, money manager, compliance or legal officer, and does not perform market making activities. [ER] is not directly employed by any company, group, organization, party or person. The shares of First Cobalt Corp. are highly speculative, not suitable for all investors. Readers understand and agree that investments in small cap stocks can result in a 100% loss of invested funds. It is assumed and agreed upon by readers that they will consult with their own licensed or registered financial advisors before making any investment decisions.
At the time this interview was posted, Peter Epstein owned shares of First Cobalt Corp., and the Company was an advertiser on [ER].
While the author believes he’s diligent in screening out companies that, for any reasons whatsoever, are unattractive investment opportunities, he cannot guarantee that his efforts will (or have been) successful. [ER] is not responsible for any perceived, or actual, errors including, but not limited to, commentary, opinions, views, assumptions, reported facts & financial calculations, or for the completeness of this article or future content. [ER] is not expected or required to subsequently follow or cover any specific events or news, or write about any particular company or topic. [ER] is not an expert in any company, industry sector or investment topic.
- Conspiracy buffs are probably wondering if Monday’s big vaccine announcement (that occurred just after the election of Joe Biden) was a coincidence.
- Would the outcome of the election have been different if the vaccine announcement was made a few days before the election?
- Probably, but gold bugs need to ignore this market noise and focus on using good tactics… to get richer!
- Please click here now. Double-click to enlarge this important daily gold chart.
- The $1850 support zone stopped yesterday’s $100/ounce price decline. It offers investors a great real risk versus potential reward opportunity to enter fresh positions.
- Stoploss enthusiasts can place a stop order at about $1845, basis this December futures chart.
- Please click here now. Double-click to enlarge. Conservative investors with a longer time horizon should focus on this weekly gold chart.
- Gold is in a kind of technical “no man’s land” between massive support at $1788 and massive resistance at $2089.
- The bottom line is that $1850 is a good entry point for short-term traders and $1788 is best for conservative investors. Having said that, investors with no gold (or related items) can buy at any price, because precious metals are the ultimate asset class!
- Please click here now. Double-click to enlarge this interesting BITCOIN chart.
- Like gold, BITCOIN is a private currency. At my https://gublockchain.com website, subscribers who took action at my key $4000 buy zone have recently booked “three bagger” profits at the $14,000 sell zone.
- Many analysts view gold and BITCOIN as competitors. I view them both as solid members of the global private currency family, with gold of course being the “senior statesman”.
- Please click here now. Double-click to enlarge this daily Dow chart.
- While the Corona virus has turned America into a bit of a pestilence and debt-themed wasteland, many companies are doing well and the Dow 30,000 price marker is important.
- A two-week close above 30,000 could usher in a fresh leg higher. The government handouts related to Corona have been retained as savings by many citizens, and those citizens are sitting on the stock market sidelines.
- Good news related to the vaccine and corporate sales could bring those investors into the market.
- If republican attempts to overturn the US election are successful (unlikely), more debt is as likely as it is with a Biden administration.
- While a vaccine announcement has initially produced a “risk-on” frenzy, it’s likely that inflation begins a significant up tick as citizens, corporations, and governments throughout the Western world take on even more debt… and then engage in even more consumerism than they did before the Corona crisis.
- China’s economy has taken on damage from Corona, but less than in most other nations. A good vaccine could produce powerful gold buying in December and January, to celebrate Chinese New Year.
- Please click here now. Double-click to enlarge this interesting silver chart. While gold broke its October low and reached its September low, silver has held above its equivalent lows.
- That’s positive action, and it’s likely related to institutional concern about inflation and the green energy boom that the Biden administration is likely to promote.
- Silver demand will grow as solar panel demand grows. Inflation could put that demand on steroids.
- Please click here now. Double-click to enlarge this GDX chart. The upside breakout from the bull wedge pattern was legitimate, but it was overwhelmed with the vaccine news.
- A pullback was expected, and to prove the breakout is real, GDX now needs to close above the $41.81 high. If that happens, a powerful leg higher should begin!
Special Offer For Website readers: please send me an Email to freereports4@gracelandupdates.com and I’ll send you my free “Golden Inflationary Rockets” report. The CDNX junior mining stocks index was barely down while gold took a $100/ounce hit on the day. I highlight eight solid junior miners on the move, with key buy and sell tactics for each stock!
Outlook for Gold Stocks Post 2020 Election
By Jordan Roy-Byrne CMT, MFTA
We last wrote to you roughly ten days ago.
We concluded, “It appears GDX and GDXJ will test their September lows at $37 and $52 reasonably soon. Should GDX & GDXJ break those lows to the downside, then we should get ready to buy.”
GDX and GDXJ did break their September lows but only for a day. They closed below those levels on October 29 and then gapped down the next day.
But as it stands, that gap lower figures to be the low in price for this correction.
The best sign for the sector is the technical outlook for the Dow Jones US Gold Mining Index, which is weighted heavily towards the largest handful of companies in the industry.
Since testing its 200-day moving average (and its 38% Fibonacci retracement), the index has rocketed higher on substantial volume. It has hit resistance, so it figures to soften over the coming days.
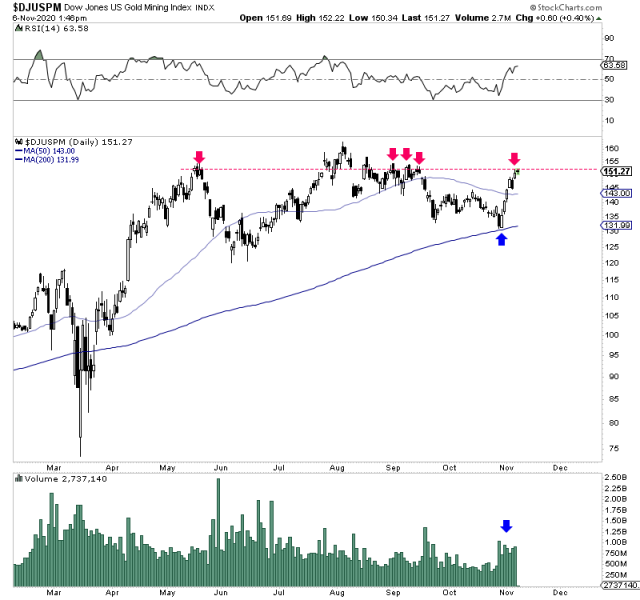
GDX and GDXJ, while not as strong, have managed to rebound. However, they are approaching similar resistance.
Consecutive daily closes above the red lines would confirm that the correction in terms of time is over.
The average length of comparable corrections (in GDX) is five months and suggests one more leg down (but not new lows).
The weakest of the three similar corrections (February 2009) argues for GDX to move to new highs but correct back to GDX $42 by the end of the year.
The good news is that the evidence suggests the corrective low in price is most likely behind us.
There isn’t necessarily any bad news right now.
However, there isn’t enough evidence to suggest a launch higher has begun. It wouldn’t be out of the ordinary if miners chopped around for another two months.
That being said, we are far enough into the correction and, coupled with the price low likely in place, to want to be buyers on weakness.
In our premium service, we continue to focus on identifying and accumulating those stocks with significant upside potential over the next 12 to 24 months. To learn the stocks we own and intend to buy that have 3x to 5x potential, consider learning more about our premium service.
The US stock-market action last quarter proved a roller-coaster ride. Big US stocks first surged to record highs on hopes for more huge pandemic-stimulus spending from Congress. Then with little progress on that front, the stock markets plunged again. Q3’20 proved a chaotic quarter leading into this week’s US elections. Its winding-down earnings season shows whether corporate profits are justifying lofty stock prices.
With all the often-surprising election results naturally dominating market news flow, it’s important to keep our eyes on the fundamental ball. While stock traders salivate for another big spending bill or more Fed quantitative-easing money printing depending on the new balance of power in Washington, stock-market levels are ultimately dependent on earnings. The government has pulled out all stops to radically boost them.
After March’s brutal stock panic triggered by states’ draconian lockdowns to slow the spread of COVID-19, the Fed flooded the US economy with epic amounts of money. After slashing interest rates back to zero, in just 3.0 months this panicking central bank radically expanded its balance sheet by 66.3%! The US-dollar supply skyrocketed 2/3rds higher as the Fed conjured up $2,857b of new money out of thin air.
Not to be outdone, Congress passed the gargantuan record $2,225b CARES Act pandemic-stimulus bill in late March! It directly paid Americans with helicopter money, and provided vast loans for businesses that could be turned into grants if they followed all the rules. That epic pandemic-stimulus spending was expanded by $484b in late April with the Paycheck Protection Program. Together they added up to $2,709b.
With literally trillions of dollars thrown at the ailing US economy, US GDP in Q3 skyrocketed at a dazzling record 33.1% annualized pace! But that was a rebound off of Q2’s record 31.4% annualized plummeting driven by those lockdowns. Despite all that astounding Fed money printing and government spending, the US economy still actually shrunk 2.9% year-over-year by the end of Q3! It was barely treading water.
But in early September the flagship S&P 500 benchmark stock index (SPX) soared to new all-time-record highs, before slipping merely 6.1% by quarter-end. That colossal deluge of new money certainly helped levitate the stock markets, which are the core linchpin of Americans’ economic sentiment. But with extreme bubble valuations exiting last quarter, foundational corporate profits weren’t justifying such lofty stock prices.
The 500 elite SPX stocks averaged trailing-twelve-month price-to-earnings ratios of 32.8x at the end of September! That’s well into formal bubble territory which starts at 28x historically. If these companies are weighted by their market capitalizations instead, that metric looked even more dangerous at 36.8x. That made Q3 earnings crucial. Would they surge enough on that liquidity deluge to make stellar stock prices righteous?
Every quarter I wade through the latest operating and financial results from the 25 largest stocks included in the SPX. These behemoths effectively are the US stock markets, commanding an incredible record 43.0% of the SPX’s total weighting as Q3 wrapped up! All investors need to care about how the big US stocks are faring, as some combination of them dominate almost all portfolios including retirement accounts.
The leading SPX ETFs are wildly popular, led by the gargantuan SPY SPDR S&P 500 ETF, IVV iShares Core S&P 500 ETF, and VOO Vanguard S&P 500 ETF. A staggering $297.7b, $220.8b, and $159.8b of investors’ capital was deployed in these colossal investment vehicles this week! The SPX companies are required to report their latest results by 40 calendar days after quarter-ends, in the form of SEC 10-Q reports.
It’s an exceedingly-important time for speculators and investors to understand how the big US stocks are actually doing fundamentally. The stock markets are drenched in euphoria surrounding the elections, on hopes for more huge Fed money printing and more huge pandemic-stimulus spending. But if that flood of liquidity doesn’t pan out with the gridlocked-government status quo continuing, fundamentals will matter again.
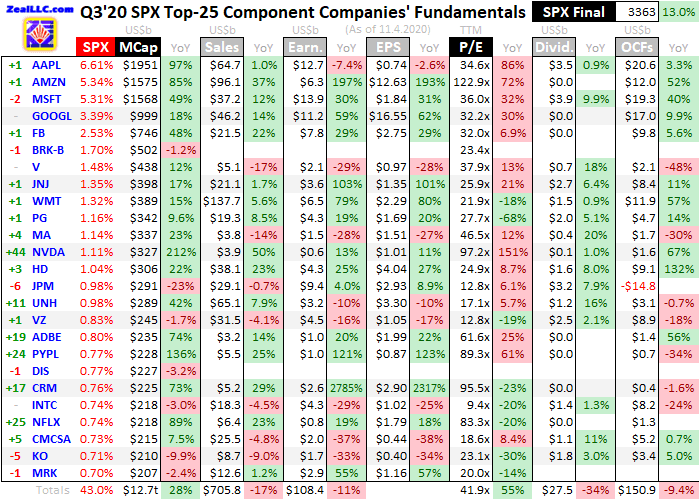
This table outlines key fundamentals of the 25 largest companies in the US stock markets. Their stock symbols are preceded by how their rankings within the SPX shifted in the year since the end of Q3’19. After the symbols these companies’ actual percentage weightings within the S&P 500 at the end of Q3’20 are shown, along with their market capitalizations in billions back when that reporting quarter was ending.
Their market caps, as well as their other fundamental data, are followed by year-over-year changes from the ends of Q3’19 to Q3’20. Looking at market-cap changes offers a purer read on companies’ values than stock-price changes, normalizing out some manipulative effects of corporate stock buybacks. They are done to artificially boost share prices and earnings per share, maximizing executives’ compensation.
Quarterly revenues, GAAP corporate profits, earnings per share, trailing-twelve-month price-to-earnings ratios as of quarter-end, dividends paid, and operating cash flows generated are shown. These key data are also followed by YoY changes. Blank fields mean a company hadn’t reported that particular data as of this week. Warren Buffett’s Berkshire Hathaway is the main culprit here, it hasn’t released Q3 results yet.
Berkshire likes to push that 40-day SEC deadline, reporting on the last Saturday before it arrives. Some companies have goofy fiscal quarters offset from calendar ones, making them harder to compare with peers. Adobe’s quarters end one month before calendar ones, while Walmart, NVIDIA, Home Depot, and Salesforce.com have quarters running one month after. So their latest-reported quarters are included here.
Percentage changes are left blank if they are misleading or not meaningful, primarily when data shifted from positive to negative or vice versa between Q3’19 to Q3’20. In a quarter where the S&P 500 itself surged 13.0% YoY, its top 25 companies’ results sure didn’t justify such big gains. Excluding the market-darling mega-cap tech stocks everyone loves, the biggest and best US companies are seeing business weaken.
Even as Q3 ended well before this week’s post-election euphoria on pollsters being horribly wrong on their blue-wave-sweep predictions, the extreme narrowness in these stock markets was stunning. The Big Five mega-cap technology stocks Apple, Amazon, Microsoft, Alphabet, and Facebook are universally adored and owned. Together these behemoths commanded a staggering 23.2% of the entire S&P 500!
Wall Street calls them the stay-at-home stocks, with businesses that have benefitted greatly from this new cloistered world defined by fears of catching COVID-19. People need upgraded Apple devices to work at home and be entertained at home. Americans are ordering everything they can online, fueling enormous growth for Amazon. Working remotely from home is also driving soaring demand for server-based services.
That’s really boosting the massive cloud businesses of Amazon, Microsoft, and Alphabet. Companies are advertising heavily on Alphabet and Facebook looking for new customers, as many Americans are deeply struggling financially with the US economy so hobbled by infection fears. And with most normal in-person gatherings taboo these days, Facebook usage has soared as people try to stay in touch with their friends.
Other stay-at-home tech stocks have proven the fastest climbers in the SPX’s ranks over this past year. NVIDIA produces fast graphics processors in heavy demand for gaming, which is the leading form of in-home entertainment. Adobe’s software is facilitating this white-collar work-from-home reality. PayPal is seeing big transaction growth from the major shift underway of buying virtually everything possible online.
And Netflix is bringing the streaming television and movie entertainment for the people not spending their evenings playing video games. The radical changes society is undergoing in this pandemic have heavily driven traders’ capital flows into the big US stocks! But it has exacerbated a stunning bifurcation, which is readily apparent across the Big Five mega-cap tech stocks and the next-largest 20 SPX companies under them.
The beloved Big Five again command a shocking 23.2% of the SPX’s total weighting, well exceeding the 19.8% of the next 20 stocks. That hasn’t proven a problem for years now, but eventually the torrid growth in these huge companies will stall out. Any material selling in them is a serious risk for the SPX as a whole since they dominate its weighting. The concentration in a handful of stocks has never been higher.
Overall revenues among the SPX top 25 in Q3’20 fell 17.2% YoY to $705.8b. But that decline is overstated, because Berkshire Hathaway hasn’t reported its latest results yet. Neither has Disney, which is trying to usurp Netflix’s streaming throne with its fantastic Disney+ service. Disney hasn’t reported its Q3 either yet, because that actually ends its fiscal year. SEC 10-K annual reports are due 60 days after quarter-ends.
So excluding Berkshire and Disney from Q3’19’s results, the SPX top 25’s sales only fell 8.1%. But that is still considerable in light of the trillions of dollars of money printing and government spending fueling that skyrocketing Q3 US GDP growth. Americans love spending money when they can, so falling revenues at these big US companies implies many people are struggling financially. This economy is wildly uneven.
The bifurcation between the Big Five and the next 20 SPX companies is astounding. Those elite mega-cap techs enjoyed colossal 17.9% revenue growth last quarter, compared to scary 19.0% shrinkage for the rest of these biggest US companies! Corporations can’t withstand falling sales for long without doing big layoffs to slash costs. Those leave more people without sufficient incomes, forcing overall spending lower.
This could spiral into a vicious circle spawning a full-blown depression, which is what the Fed is so darned worried about. The more people without normal jobs, the less they can buy from companies cutting their sales and profits. The less companies make, the more people they have to fire. The lower their earnings, the more overvalued stock markets become upping the odds for a new secular bear further damaging sentiment.
Major stock-market weakness scares the remaining Americans blessed to be doing fine in this pandemic, leading them to pull in their horns on spending. That further erodes corporate fundamentals. All of this can cascade in a devastating negative feedback loop. Neither the US economy nor the stock markets can thrive for long if Apple, Amazon, Microsoft, Alphabet, and Facebook are the only companies doing great!
GAAP corporate earnings among the SPX top 25 without Berkshire and Disney actually rose 3.4% YoY to $108.4b. But that is ridiculously pathetic given the US economy rebounding by a third last quarter per that record GDP report. And that slowly-rising profitability certainly isn’t universal, with all the growth coming from those Big Five mega-cap techs. Their earnings skyrocketed 31.1% YoY to $52.0b, almost half the total!
The next-20-largest US companies suffered 13.5%-lower profits last quarter. Weaker earnings coupled with higher prevailing stock prices naturally mean higher valuations. The SPX top 25’s average TTM P/Es soared 54.9% YoY to 41.9x at the end of Q3’20! This small group of companies encompassing almost 4/9ths of the entire S&P 500 are trading at super-dangerous bubble levels. That guarantees a bear.
These extreme overvaluations are even more stunning considering the trillions of dollars of Fed money printing and pandemic-stimulus payments deluging into Q3’20. How much lower would corporate profits had been without that epic liquidity flood? And how long will that fuel increased consumer spending that bolsters companies’ top and bottom lines? Probably not long with so many incomes still heavily impaired!
Much of recent months’ euphoric stock-market action, as well as this week’s in the wake of the elections, resulted from traders’ hopes for another huge round of pandemic-stimulus spending. That definitely isn’t a sure thing unless either Republicans or Democrats fully control the presidency, Senate, and House. But instead of the false-prophesied blue-wave sweep, gridlock still reigns greatly lowering the odds for any big deal.
Best case for these lofty stock markets is Congress approving another CARES-Act-style spending bill that helps struggling Americans. But after they spend all that new money within a couple months of getting it, that still leaves weakening corporate profits driving up valuations. And there’s an increasing chance a Republican-controlled Senate and Democrat-controlled House will continue to refuse to agree on anything.
Trillions of dollars of new spending can delay the inevitable valuation reckoning for these stock markets again, but probably not for long. And if that hyper-anticipated next round of pandemic stimulus fails to materialize, corporate earnings will continue to deteriorate forcing stock prices to mean revert far lower to better reflect profits even sooner. Big US stocks’ fundamentals certainly aren’t justifying their lofty prices!
On the dividend front, the top 25 SPX companies reported 31.5%-lower dividends from Q3’19 excluding Berkshire and Disney. Again that was heavily bifurcated, with the Big Five mega-cap techs seeing 5.4% dividend growth even though only Apple and Microsoft actually bother paying them. The next-20-largest SPX companies saw their dividends collapse 39.3% YoY! That’s partially from the changing SPX-top-25 mix.
The largest US companies’ operating-cash-flow generation in Q3’20 mirrored the rest of their results. Excluding Berkshire and Disney, that only slipped 4.2% YoY to $150.9b. But all that growth again came from the Big Five mega-cap techs, where OCFs surged 18.5% YoY. That compared to 20.7% shrinkage for the next-20-biggest SPX stocks! That doesn’t include the OCFs reported by the money-center banks.
Mega-banks’ operating cash flows are incredibly volatile and complex, swinging wildly from very positive to very negative quarter to quarter. So they skew these comparisons. The Big Five tech behemoths accounted for 52% of the SPX top 25’s OCFs last quarter, along with 38% of revenues and 48% of profits! So again if their high-flying businesses slow, stall out, or even reverse, the whole SPX is in a world of hurt.
The more that revenue, earnings, and operating-cash-flow growth are concentrated into fewer stocks, the more brittle stock markets become. And the Big Five aren’t only vulnerable to something impacting their amazing businesses. The sizes of their sales, profits, and OCFs have grown so incredibly massive that big growth from such high levels is getting ever-harder mathematically. That could turn sentiment against them.
These mega-cap techs dominating and driving the entire US stock markets averaged TTM P/Es of 51.5x as Q3’20 ended. That means at current earnings and stock-price levels it takes these companies almost 52 years to earn back the prices traders are paying for their stocks! The historical fair-value average for the broad US stock markets is 14x earnings, although tech stocks have usually enjoyed a growth premium.
But will traders be willing to pay 40x, 50x, or more for these elite market darlings if their revenues and earnings growth slows? The Big Five’s average sales and profits last quarter ran $53.1b and $10.4b, which are colossal numbers to keep seeing double-digit growth from. Thus even if this pandemic craziness persists, it’s going to be increasingly impossible for the mega-cap techs to continue reporting fast growth.
So make no mistake, today’s stock markets remain very dangerous and at risk for an imminent major selloff! Despite the trillions of dollars of Fed money printing and government spending so far, earnings are nowhere near high enough to justify these near-record-high stock prices. This week’s euphoria on a gridlocked US government hopefully preventing Biden’s enormous tax increases will likely start fading soon.
While another huge pandemic-stimulus-spending bill from Congress could delay this reckoning by a few months, anything big passing is far from certain. Eventually speculators and investors are going to have to face the ugly reality that corporate fundamentals come nowhere close to justifying these high prevailing stock prices. They must mean revert way lower to restore reasonable multiples of underlying earnings.
That is going to have to take the form of a long-overdue major bear market. These subtly begin way up near euphoric highs where everyone is convinced the party will go on forever. Bears are cunning and devious initially, taking their sweet time to keep people fully invested despite dangerous valuations. That eventually inflicts the most pain possible on the greatest number of traders before bears return to hibernation.
The classic bear-market strategy is selling stocks and holding cash. If a bear market cuts stocks in half, holding cash through it doubles purchasing power so twice as many shares can be bought back once it runs its course. But cash not only doesn’t appreciate, the Fed’s wildly-unprecedented pace of money printing is rapidly eroding the US dollar’s value. This epic currency debasement changes bear strategy.
That naturally leads to much-higher gold investment demand, driving the yellow metal’s price higher as bears ravage bubble-valued stock markets. As gold powers higher on balance, the major gold stocks tend to leverage its advance by 2x to 3x. While gold and its miners’ stocks have been correcting out of extremely-overbought levels in recent months, they remain the best destinations for capital in stock bears.
Since the Fed can’t artificially stave off the long-overdue bear forever, it’s essential to cultivate excellent contrarian intelligence sources. That’s our specialty at Zeal. After decades studying the markets and trading, we really walk the contrarian walk. We buy low when few others will, so we can later sell high when few others can. We can help you both understand these markets and prosper in them, even during bears.
We’ve long published acclaimed weekly and monthly newsletters for speculators and investors. They draw on my vast experience, knowledge, wisdom, and ongoing research to explain what’s going on in the markets, why, and how to trade them with specific stocks. As of Q3’20 we’ve recommended and realized 1178 newsletter stock trades since 2001, averaging outstanding annualized realized gains of +24.0% over that multi-decade span! Subscribe today and take advantage of our 20%-off sale!
The bottom line is the big US stocks’ just-reported Q3’20 results certainly don’t justify their dangerous bubble valuations. All the revenues and earnings growth remained concentrated in the handful of market-darling mega-cap techs. The rest of the elite US stocks suffered sharply-declining sales and profits last quarter. That was despite a record GDP surge fueled by trillions of dollars of money printing and spending!
Whether US lawmakers can work together to pass another huge pandemic-stimulus-spending bill or not, eventually these lofty stock prices must reasonably reflect underlying corporate profitability. That means they need to mean revert far lower in the long-overdue next bear market. And with pandemic fears still retarding Americans’ spending and weighing on big US stocks’ earnings, that serious selloff could start anytime.
Adam Hamilton, CPA
November 6, 2020
Copyright 2000 – 2020 Zeal LLC (www.ZealLLC.com)
- It appears that both gold and stock market investors believe the winner of the US election (held today) will be more money printing and debt.
- That’s almost certainly true, but what happens if the fed becomes less keen to continue its accommodation?
- Please click here now. Double-click to enlarge this US stock market daily chart.
- A rectangle pattern is in play. That’s theoretically bullish, but the rectangle is formed with lower lows and lower highs.
- That’s a concern, and it may reflect institutional money manager worry about a lack of Fed action in 2021.
- The Fed’s actions over the past decade have been good for government bonds and the stock market, but they have come at a horrifying expense for Main Street.
- In contrast, the government’s Corona crisis handouts in 2020 have helped both Wall Street and Main Street.
- That’s because handouts to regular people have enabled them to buy products. That produces corporate earnings and revenues which benefit the stock market.
- If the Fed were to curtail its handouts (QE and rate cuts) while the government continues theirs, the stock market could stagnate while gold would continue to rally.
- Please click here now. Double-click to enlarge. This chart provides a view of the US stock market when stagflation began around 1966.
- While history doesn’t repeat exactly, the winds of stagflation in America are blowing, much like they were in 1966-1970.
- The stock market can do well, but only if government and Fed handouts continue. The bottom line:
- From both a risk and potential reward perspective, gold looks like the best asset to own going into 2021.
- Please click here now. The US government’s financial situation is obviously pathetic.
- If the Fed doesn’t provide more QE, the government may be forced to essentially take over the Fed and order it to print money as the government sees fit.
- Please click here now. Double-click to enlarge this superb GDX chart. There are a lot of technical “green shoots” in play for the miners right now.
- For example, after an enormous rally that began in March, a classic three-wave reaction has occurred from the August peak.
- Also, the SIL silver mining stocks ETF did not make a lower low last week, while GDX, GDXJ, and GOAU did.
- In addition, the GDX advance decline line is sporting a bullish non-confirmation with GDX.
- Please click here now. Double-click to enlarge this weekly gold chart. Note the 5,15 moving average sell signals; a price lull often follows the sell signal, rather then a steep decline in the price.
- In a strong market, the price also often stops reacting well above the key support zone, and that could be the case now.
- There’s not enough price weakness for me to recommend “back up the truck” buying of size here, but there is enough positive technical and fundamental action to do some modest buying and to predict that the current reaction has a decent probability of having just ended!
- It’s important for investors to understand that if the Fed becomes reluctant to engage in greater accommodative policy, the US government is likely to “pick up the slack”, but it would do so with more handouts to Main Street rather then to Wall Street. That’s an important scenario for inflation enthusiasts to keep in mind.
- The genesis of long-term stagflation appears to be in play, and while the gold community is fully prepared… with an allocation to gold, silver, and the miners, it looks like the rest of the nation will be joining the party too, but at prices that are much higher than they are now!
If you would like to receive our free newsletter via email, simply enter your email address below & click subscribe.
 Follow us on Twitter
 Become our facebook fan
CONNECT WITH US
Tweets
Tweet with hash tag #miningfeeds or @miningfeeds and your tweets will be displayed across this site.
MOST ACTIVE MINING STOCKS
Daily Gainers
 CMC Metals Ltd. CMC Metals Ltd. |
CMB.V | +900.00% |
 Eden Energy Ltd Eden Energy Ltd |
EDE.AX | +200.00% |
| GoviEx Uranium Inc. |
GXU.V | +42.86% |
| Eagle Nickel Ltd. |
ENL.AX | +41.67% |
| Citigold Corp. Limited |
CTO.AX | +33.33% |
| Mount Burgess Mining NL |
MTB.AX | +33.33% |
| Exalt Resources Limited |
ERD.AX | +31.94% |
| Casa Minerals Inc. |
CASA.V | +30.00% |
| Cariboo Rose Resources Ltd |
CRB.V | +28.57% |
| Belmont Resources Inc. |
BEA.V | +28.57% |


