
With the February Presidential election looming in Ecuador, investors can be forgiven if a bit on edge. Changes in government, particularly in smaller, less developed countries, are often accompanied by shifts in policy, a period of instability, social reforms and even upheaval, and a myriad of other elements that can impact the fortunes of industries. This is certainly true of foreign enterprises doing business in Ecuador, and mining is no exception. But unlike some of the country’s previous turbulence following changes in leadership, this election gives every indication of having a positive outcome relevant to Canadian miners in Ecuador no matter the winner.
Ecuador has a wealth of natural resources and unparalleled biodiversity. It is one of only 17 countries in the world identified as megadiverse, meaning a superabundance of endemic species of plants and animals. Oil has been a significant resource for the country’s economy accounting for 40% of exports. It is South America’s second largest oil exporter. But today, mining is increasingly recognized as the way to diversify Ecuador’s resources income. Canada is a major player in this industry with a dozen mining companies currently working on 40 projects. Solaris Resources has its attention focused on the Warintza project, a copper-gold undertaking in the southeastern part of the country, an area mineral-rich but undeveloped.
Investor pre-election trepidation can be appreciated in light of Ecuador’s mercurial political climate. Rafael Correa, the man to hold the presidency (2007-2017) prior to the current Latín Moreno, was the first president to be re-elected since the end of military rule in 1982. And since 1996, he has been the only president permitted to complete his period of office. What is constant about Ecuadorian politics is change. Investors want a stable and favorable government, and with respect at least to the mining industry, this election could not be better.
It was on Correa’s watch in 2014 that the mining industry was opened. While a socialist, he is also an economist and pragmatic; he recognized the significance of tapping the country’s rich metal and mineral resources. While he is not permitted to run for a third term, he is a major force in this election. We will examine his influence in a moment.
Correa was constitutionally limited to two terms and, to his later dismay, backed the current Latín Moreno. Moreno made many promises, basically saying he would continue in the manner of Correa, who left office with a 60% approval rating. This sat well with voters as Correa had reduced poverty by nearly half and substantially increased investment in education and healthcare. But Moreno had his own ideas and did an about-face on nearly every campaign pledge. In 2019 he borrowed $10 billion dollars from the IMF and other lenders, who then insisted on cuts in education and healthcare (this just a year before the COVID crisis), reversing Correa’s achievements. The country is now in a debt-triggered economic crisis made all the worse by the pandemic.
For all this, Moreno is now out of the running, his approval rating in December only 16%. He wields power until the handoff, of course, and has succeeded in preventing Correa from running for vice-president, but recognizing his chances for another term are infinitesimal, he is not standing for re-election. The race essentially comes down to two men with a distant third at times polling in the single digits. Either man would be a win for Ecuadorean mining.
Guillermo Lasso of the CREO-PSC coalition is second in the polls. He is an extraordinarily successful businessman of 65, having been head of operations for Coca Cola Ecuador in the 1990s. He has been a member and Chairman of boards of major Ecuadorean companies, the CEO of Banco Guayaquil and the governor of Guayas Province. In the 2013 presidential election he ran against Correa, who won his second term. He ran again in 2017, but Moreno took it with a highly contested result.
Although sometimes referring to himself as “made liberal by life”, Lasso is seen as conservative and on record as wanting to reduce taxes and state debt. He is also known to strongly favor mining, seeing it as a way to lure foreign investment, grow the economy and help the country claw its way out of the current economic crisis. While he has pledged to protect the Yasuni Amazon reserve from oil exploitation, he is committed to developing Ecuador’s mining industry in “an environmentally and socially responsible manner.” A win for Lasso would be a win for that industry. He is currently running second in the polls with percentages in the twenties.
The current frontrunner is Andrés Arauz, a 35-year-old economist and confirmed correísta, a supporter of Rafael Correa’s political agenda. Hand-picked by Correa as the representative of the Union for Hope (UNES) party, the centre-left candidate is committed to undoing Moreno’s betrayals to Correa’s “Citizen’s Revolution”, such as renegotiating the enormous state debts, undoing privatizations, reducing capital flight and improving healthcare and education. All this and more has Arauz high in the polls, at times breaking 40%. This number is significant as presidential candidates who win with 40% and a 10% lead ahead of their nearest opponent do not have to go to a runoff election. If there is a runoff, it still bodes well for the industry, because a mining-friendly government will still take office, just a little later with a runoff.
Both men are seen favorably as keepers of Ecuador’s rich natural resources as well as protectors of its indigenous peoples. Unlike the ecological calamities of the past – the Texaco-Chevron catastrophe from the 1960s being the most infamous example – resulting from little or no state oversight, today no one, ambitious politicians included, wants bad press. Between the David Attenboroughs, satellites and other advanced monitoring technologies, all eyes are on the environment. Arauz and Lasso know this. The former as an ambitious young economist and the latter as a seasoned man of finance and industry will promote and encourage the responsible exploration and harvesting of Ecuador’s vast untapped metal and mineral resources.
And these characteristics and circumstances are not lost on industry chiefs. Daniel Earle, President and CEO of Solaris Resources says, “We are delighted to see strong support for candidates that recognize that the mining sector has a critical role to play in Ecuador’s future, in growing the economy, employment and tax bases through responsible mineral development, particularly in rural and remote parts of the country that historically have lacked opportunity. Likewise, Ecuador has a critical role to play in supplying the ongoing global energy transition to electrification in which copper is both indispensable and increasingly scarce.”

One of the most common ways investors day trade metals is through a futures contract. But for many investors, day trading stocks are a more feasible alternative to gain superior exposure to metals and commodities.
The case for day trading metal stocks is quite simple: 1) gold is acting more like a stock, 2) trading stocks can be done for free, and 3) trading stocks offer more choice and potential for outsized returns.
Gold Acting Like A Stock
Historically, people buy and hold gold and silver bars or coins for years, if not decades. These investors are unlikely to follow the price of commodities on a daily or even monthly basis.
And this was perfectly fine for most investors throughout history.
But in 2020, gold behaved much more like a volatile stock than a commodity and it should be treated as such. Consider a sample of sensationalist media headlines that have become the new norm in 2020 and so far in 2021:
Bloomberg reporting on March 13: “Gold’s worst week since 1983 strips metal of safe haven status.”
Forbes reporting on July 1:”Gold prices are soaring to the moon. Here’s why.”
Axios reporting on Aug. 12: “Gold had its worst day in 7 years, but investors remain bullish.”
Reuters reporting on Nov. 29: “Gold set for worst month since 2016 amid vaccine optimism.”
Barron’s reporting on Dec. 4: “Gold prices have soared. Expect more of that in 2021.”
Reuters reporting on Dec. 31: “Gold set for best year in a decade with 24% rise.”
Media outlets and investors stopped treating gold as a metal and more like a stock — and for good reason. Gold and stocks rose in unison in 2020 and for the same reason: government stimulus and seemingly endless money printing among global central banks.
So if gold is acting like a stock, it should be treated — and traded as such.
Day Trading Stocks Are A Cheaper Alternative
Day traders that want to trade metals and commodities can easily and conveniently do so through one of the many stockbrokers. Fast-growing brokers like Robinhood and eToro shook up the stock trading universe with zero commission trading in recent years. This forced legacy old-school brokers like Schwab and TD Ameritrade to follow suit in offering zero-commission accounts.
Certainly, the futures market can’t begin to match what brokers are offering stock traders.
Day trading metals can be accomplished in the same fashion as the futures market. The most popular gold exchange-traded fund (ticker $GLD) is a trust that only holds gold bars so its price fluctuates in unison with the price of gold, giving purists in essence a pure-play way to trade a metal through the equities market.
Stock day traders can buy and sell this and many other ETFs for free throughout a trading session. Stock traders are also allowed to hold an ETF overnight or for however long they wish.
Holding the GLD ETF for longer periods of time does come with a small cost, known as an expense ratio of 0.4%. This means that holding a $10,000 investment in the ETF will be subject to a $40 annual fee.
GLD one-year chart.
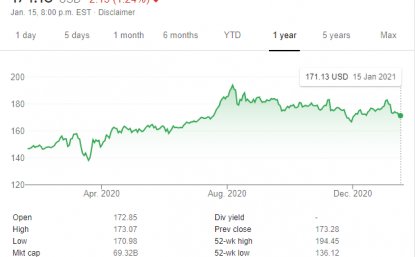
GLD one-year chart, retrieved Google Finance Jan. 18, 2021.
Trading Stocks: Superior Exposure
Throughout 2020, futures traders missed out on large gains associated with individual company-specific catalysts.
For example, the price of Barrick Gold’s stock surged more than 10% after billionaire investor Warren Buffett reversed a multi-decade long stance on gold. The “Oracle of Omaha” bought more than $500 million worth of the gold and copper miner’s stock.
Futures traders weren’t able to buy the individual stock so they missed out on a fantastic opportunity to profit from gold-related news.
Meanwhile, Barrick Gold’s stock is up more than 25% in the one-year period (as of Jan. 18, 2021) versus gold’s approximate 17% gain. Both these returns are inferior to Newmont’s stock that gained more than 40%.
Gold and other metal purists have a valid reason to avoid trading individual stocks like Barrick as it isn’t part of what they do. They want exposure to a metal — not a metal company.
And that is more than fine. But they are still missing out on what stocks have to offer traders.
There are several leveraged ETFs that offer stock traders outsized returns of two-times (in some cases three times) the return of the underlying asset.
For example, the ProShares Ultra Gold ($UGL) operates as a commodity pool that uses futures-based leveraged long positions in gold. If the price of gold moves higher by 2%, the leveraged ETF will move higher by 4%, thereby giving stock traders magnified returns.
On the flip side, stock traders can buy the ProShares UltraShort Gold ($GLL) that offers the exact opposite exposure. Instead of a long position, the commodity pool uses future contracts to take a short position on gold. If the price of gold falls by 2%, the leveraged ETF will move higher by 4%.
What Else Can Stock Trader’s Trade?
Here are some of the largest commodity stocks that investors should familiarize themselves with:
BHP Group ($BHP)
Rio Tinto Group ($RIO)
Vale S.A. ($VALE)
Newmont Corporation ($NEM)
Freeport-McMoRan Inc. ($FCX)
Barrick Gold Corporation ($GOLD)
ArcelorMittal ($MT)
These are some of the more commonly traded ETFs that offer exposure to one or many metals:
iShares Silver Trust ($SLV)
Aberdeen Standard Platinum Shares ETF ($PPLT)
Aberdeen Standard Physical Palladium Shares ETF ($PALL)
Invesco DB Precious Metals Fund ($DBP)
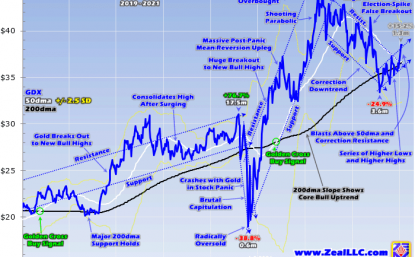
The gold miners’ stocks are rallying on balance again, following their recent multi-month correction. For several weeks now they’ve been carving both higher lows and highs, which sure appears to be forming a nascent uptrend. That increases the odds a new bull-market upleg is getting underway in this high-flying sector. While still dependent on gold’s fortunes, plenty of technical evidence supports a new-upleg thesis.
The leading and dominant gold-stock benchmark and trading vehicle is the GDX VanEck Vectors Gold Miners ETF. As of the middle of this week, GDX commanded nearly 2/3rds of all the capital deployed in gold stocks through all American gold-stock ETFs! GDX’s remarkable price action this year continues to boost its popularity among traders. The major gold stocks GDX contains more than doubled in mid-2020!
Like everything else, the gold miners’ stocks got sucked into mid-March’s extreme stock panic spawned by government lockdown orders attempting to slow COVID-19’s spread. That beat this contrarian sector to radically-oversold lows wildly disconnected from gold miners’ strong underlying fundamentals. GDX’s violent rebound upleg out of that huge anomaly proved a moonshot, the major gold stocks just skyrocketed.
In only 4.8 months between mid-March to early August, this leading gold-stock ETF soared a stupendous 134.1% higher! But such extraordinarily-big-and-fast gains naturally left gold stocks very overbought, so they rolled over into a major correction. These essential post-upleg selloffs keep bulls healthy, extending their longevity by rebalancing both sentiment and technicals. That process seemed to play out by late November.
From its euphoric early-August peak until then, GDX fell 24.9% over 3.6 months. A couple weeks ago before the major gold stocks’ new uptrend became apparent, I wrote an essay on the maturing gold-stock correction. GDX’s bullish technical action since really increases the likelihood that correction indeed gave up its ghost in late November. If that proves true, gold stocks’ next bull-market upleg has started marching.
GDX’s correction apparently culminated with a 2.7% drop to $33.42 on November 24th. That had the feel of a correction-slaying capitulation too, capping a 6.9% two-day plunge and a 12.1% seven-trading-day one! Prevailing sentiment deteriorated fast on so much pain, with bearishness flaring dramatically. This contrarian sector was deeply out of favor heading into Thanksgiving. That’s the stuff bottomings are made of.
In the several weeks since that ugly gold-stock trough, GDX has carved one higher low and two higher highs. In the first eight trading days after that bottom, GDX blasted 9.2% higher to $36.50. But such a fast V-bounce left gold stocks overextended, so GDX started selling off again to rebound at $34.29 five trading days later. Very importantly, that latest low this Monday was 2.6% above the late-November bottoming.
A capitulation nadir and subsequent higher low after a maturing correction form a rising lower-support line. That’s half of a new uptrend. The major gold miners again bounced sharply out of that, with GDX surging 5.1% this Tuesday and Wednesday. The resulting $36.03 mid-week close wasn’t a new high yet, but it was getting close. On Thursday as I penned this essay, GDX surged another 3.5% to close up at $37.29!
That second higher high since the correction bottoming was 2.2% above the initial bounce high. Those two higher highs together form a parallel rising upper-resistance line. So the major gold stocks are now in a new uptrend! And odds are mounting that it will grow into their next bull-market upleg. That portends more big gains coming in gold stocks in the months ahead, increasing the importance of getting deployed.
Whether or not GDX’s budding uptrend blossoms into a major new upleg depends on two things. Most importantly is how gold itself fares. The major gold stocks tend to amplify material gold moves by 2x to 3x. So if a new gold upleg is underway, gold stocks will follow it higher. My essay last week looked at gold’s own recent correction, which was right in line with its bull precedent in both total size and duration!
That gold analysis leaned on Relativity Trading indicators, looking at price levels relative to their baseline 200-day moving averages. That reveals when they are overbought and likely to sell off or oversold and likely to rally. Plenty of readers wrote in curious about how the gold stocks themselves were looking in Relativity terms. So here’s the latest Relative GDX chart, tracking GDX closes divided by their 200dmas.
The resulting multiples tend to form horizontal trading ranges over time. A Relativity chart effectively compresses 200dmas to flat at 1.00x, and then renders the price action surrounding them in perfectly-comparable percentage terms. That’s the light-red line here. Superimposed over this rGDX metric are this ETF’s normal technicals. Both support this new-gold-stock-upleg thesis, which is certainly bullish.
Relativity trading ranges are defined based on the past 5 calendar years of data, updated late each year. During its secular bull, GDX’s 200dma multiple has mostly meandered between 0.85x to 1.50x. Those are the oversold and overbought levels, the highest-probability-for-success times to respectively buy and sell gold stocks. When GDX’s last massive upleg peaked in early August, this rGDX indicator ran 1.448x.
The major gold stocks as a sector were stretched 45% over their 200dma, nearing extremely overbought. So a healthy correction was necessary to rebalance the excessively-greedy sentiment and overheated technicals. I warned our newsletter subscribers about the mounting downside risks in late July, when we ratcheted up the trailing stop losses on our many open gold-stock trades to protect big unrealized gains.
Extreme overboughtness after a major upleg is always a serious warning of looming corrections, so it can’t be ignored. We had aggressively redeployed in fundamentally-superior gold and silver stocks in the weeks right after mid-March’s stock panic. Those relatively-low buys grew into huge gains during gold stocks’ last upleg. Tightening up stop losses as major uplegs grow too overbought locks in more gains.
Indeed GDX soon started correcting, which slammed 17 and 9 stock trades in our weekly and monthly newsletters down to their stops. But those exits came at awesome absolute realized gains averaging +81.3% and +83.6%, which annualized to amazing +303.9% and +334.9% averages! We did some gold-stock-short trades during the correction, gold-stock-ETF put options and inverse-leveraged gold-stock ETFs.
But I didn’t recommend a single gold-stock-long trade between late June to late November. We started our gold-stock redeployment for this next upleg in our weekly newsletter on November 24th, the very day GDX happened to bottom. Since then we’ve layered in 8 and 4 new gold-stock trades in our weekly and monthly newsletters, attempting to buy in relatively-low so we can later sell relatively-high after the next upleg.
The gold-stock technicals shown in this chart were a major part of my decision in late November to start actively gaming a correction bottoming and new gold-stock upleg. GDX had again retreated 24.9% over 3.6 months, falling back to 0.945x its 200dma. Back in early September when GDX still traded near $42 and few believed a correction was upon us, I wrote an essay warning gold stocks were in correction mode.
My correction downside target way back then was 25%, “But with gold stocks remaining very overbought technically, and greed still elevated after an insufficient selloff, a resurgent correction is likely. That could easily extend to 25% in GDX, another 20% lower from this week’s levels.” That was based on a normal 10%ish gold correction, which the major gold stocks again leverage by 2x to 3x to hit 20%-to-30% selloffs.
With GDX finally sliding 25% in late November, and plunging well under its 200dma, odds were the lion’s share of the necessary corrective work was behind us. That paved the way for gold stocks’ next bull-market upleg. But there was and is some doubt, as GDX’s correction metrics remained well under the averages from this gold-stock bull’s prior corrections. They proved severe, hammering gold stocks way lower.
Eviscerating this sector in late 2016, mid-2018, and early 2020, they averaged huge 36.5% GDX selloffs over 8.0 months plummeting to just 0.754x GDX’s 200dma! Late November’s 24.9% over 3.6 months to 0.945x looked anemic in comparison. But for several reasons, this latest gold-stock correction probably didn’t need to be so extreme to accomplish its mission. Gold’s own correction progress was the most important.
Gold bottomed a few trading days after the gold stocks, on the Monday after Thanksgiving week. That extended gold’s total selloff to 13.9% over 3.8 months, driving it back down to 0.989x its own 200dma. This gold bull’s fourth correction was running right in line with the averages from its prior three, which weighed in at 14.3% over 4.1 months. If gold’s correction was ending, so would the gold-amplifying gold stocks’.
A serious gold-stock correction also didn’t seem as likely since GDX wasn’t as overbought leading into this latest one. That leaves less selling work to rebalance sentiment and technicals. Again the rGDX only hit 1.448x when gold stocks peaked in early August, far lower than GDX’s 1.567x peak in early August 2016 after this bull’s maiden upleg. Gold-stock overboughtness had been even more extreme leading into that.
The rGDX soared as high as 1.646x in early July that year, the major gold stocks had skyrocketed 65% above their 200dmas! The resulting greed was much more potent and universal, necessitating more corrective selling. The less-extreme a preceding upleg topping, the less-extreme its subsequent correction needs to be. So 25%ish seemed more likely than 35%+ given the milder setup heading into this latest one.
Finally this gold-stock bull’s prior three corrections were all dragged much lower than they needed to go due to anomalous unrepeatable market events of those times. Nothing similar threatened to extend this current correction. Back in late 2016, it was Trump’s surprise election victory. Stock markets soared on hopes for big tax cuts soon as Republicans fully controlled the government, hammering gold and its miners.
In mid-2018, a crazy-extreme gold-stock forced capitulation snowballed as cascading gold-futures selling sequentially triggered gold-stock stops. That magnitude of self-reinforcing selling is very rare, yet GDX’s total selloff still only extended to 31%. Finally in early 2020, a super-rare stock panic on the first-ever national economic lockdowns to fight an emerging virus sucked in gold and its miners. There’s sure no panic now.
So GDX’s total correction deepening to 25%ish, and forcing GDX back well under its baseline 200dma, seemed sufficient given the circumstances today. Whenever a bull-market sector is pounded back under its 200dma, it is oversold. And falling as low as 0.945x it in late November, the rGDX plunged well into that strong-buy territory. This gold-stock correction might not be over, but the odds sure support it being done.
As always, gold is the key. If its late-November $1775 correction low holds, gold stocks shouldn’t suffer a new one of their own. And with central banks still printing money like there’s no tomorrow, the bullish case for gold is stronger than ever. Last week Bank of America published some fascinating research on this. It found global central banks had monetized $1.3b in assets every hour since March, and cut rates 190 times!
In the US alone, between mid-March to early June the Fed monstrously expanded its balance sheet by $2,857b. It literally skyrocketed 66.3% in just 3.0 months! Other major central banks around the world panicked too, adding the equivalent of trillions more dollars of money. Gold is the ultimate hedge for big monetary inflation, an essential portfolio diversifier that every investor needs to really up their allocations in.
The biggest risk for gold and thus gold stocks remains the oversold US dollar and speculators’ bullish positioning in gold futures. I discussed all this in a mid-October essay. But if big gold investment demand comes back online, that will easily overpower whatever the futures guys do with their comparatively-paltry capital. If gold continues marching higher on balance in a new upleg, the gold stocks will amplify its gains.
So is a new gold-stock upleg really getting underway? It certainly appears so. GDX has been marching higher on balance since late November, with higher lows and highs in the several weeks since forming a nascent uptrend. Before that GDX fell 25% over several months, which should be plenty to rebalance away the greedy sentiment and overbought technicals from early August’s upleg topping. That’s all gone.
And this GDX selloff extended well into oversold territory under this leading gold-stock benchmark’s key 200dma technical baseline. So the evidence in favor of gold stocks’ correction being over and a new upleg underway is certainly growing. Absolute correction bottomings and upleg toppings are never known for sure until well after the fact, only proven by subsequent price action. But this latest bottoming looks promising.
The prudent way to game a probable correction bottoming is to gradually redeploy your capital over time in fundamentally-superior gold stocks. The idea is to add new trades straddling the likely actual absolute low. The earlier ones could grind lower before the next upleg really starts, while the later ones could get added after it is underway. But layering in new trades over time lowers risks and ups odds of catching a bottom.
Buying low and selling high can only be accomplished if there is plenty of uncertainty when those trades are being executed. By the time major correction bottomings or upleg toppings are readily apparent to all well after they’ve passed, the best gains have already been won. So even if gold and its miners’ stocks haven’t fully transitioned into their next bull-market upleg yet, their corrections have accomplished their missions.
At Zeal we walk the contrarian walk, buying low when few others are willing before later selling high when few others can. We overcome popular greed and fear by diligently studying market cycles. We trade on time-tested indicators derived from technical, sentimental, and fundamental research. That’s why all 1178 stock trades recommended in our newsletters since 2001 averaged hefty +24.0% annualized realized gains!
To multiply your wealth trading high-potential gold stocks, you need to stay informed about what’s going on in this sector. Staying subscribed to our popular and affordable weekly and monthly newsletters is a great way. They draw on my vast experience, knowledge, wisdom, and ongoing research to explain what’s going on in the markets, why, and how to trade them with specific stocks. Subscribe today and take advantage of our 20%-off sale! There’s no better time than around a correction-bottoming buying opportunity.
The bottom line is a new gold-stock upleg sure looks to be underway. The major gold stocks have spent the last several weeks carving a new uptrend, as evident in their leading GDX benchmark. This bullish price action came right after a major gold-stock correction climaxing in a capitulation plunge. That forced GDX back well under its baseline 200-day moving average, hammering the gold stocks to oversold levels.
That naturally crushed sector sentiment, breeding widespread bearishness. All this is a textbook setup for a correction bottoming paving the way for the next bull-market upleg. As always everything hinges on gold, which also corrected right in line with bull precedent in both size and duration. And the bullish case for gold is stronger than ever with global central banks spewing out endless trillions of dollars of new money.
Adam Hamilton, CPA
December 18, 2020
Copyright 2000 – 2020 Zeal LLC (www.ZealLLC.com)
Gold plummeted last Friday, dragging silver and their miners’ stocks down with it. That was reminiscent of another brutal down day in early November. While certainly uncommon, sharp selloffs naturally freak out traders crushing any bullish sentiment. Serious gold down days are nearly always driven by heavy speculator selling in super-leveraged gold futures. The risk of that erupting depends on their positioning.
A week ago on Jobs Friday, gold collapsed an ugly 3.5% to $1,847! Those monthly US jobs reports are the most-important economic data in terms of market-moving potential. So there are much-higher odds of big gold swings in the wake of those nonfarm-payrolls numbers. The jobs situation tends to move gold because it affects traders’ perceptions of what the Federal Reserve might do next in terms of monetary easing.
Gold normally reacts to payrolls coming in significantly different than expectations. A big upside surprise in monthly US jobs often leads to gold-futures selling, as that implies the Fed won’t be as aggressive with easing. And a major miss usually ignites sizable gold buying, as traders assume that implies a weaker US economy forcing the Fed’s hand to print more money. So last Friday’s data should’ve ignited a gold surge.
Economists expected US jobs growth to be weak in December, looking for a paltry +50k. But the actual came in much worse at -140k! Normally gold would’ve rallied 1% to 2% on such a rotten number. So its 3.5% plunge that day was definitely an anomaly. Despite happening on a Jobs Friday, that data was only partially responsible. Gold trades overnight around the world, and suffered big losses before that report.
The prior afternoon, gold ended the US trading day near $1,915. But overnight in late Asian trading while Americans were asleep, gold plunged sharply from around $1,909 to $1,885. Gold drifted a bit lower in the European session, re-entering US trading at $1,882 that Friday morning. So half of gold’s Jobs-Friday losses had already accrued well before that latest jobs data. That big downside surprise was indeed bullish.
Gold rebounded back up to $1,891 in that release’s immediate wake. But gold-futures speculators were spooked with the psychologically-heavy $1,900 level failing overnight. So they sold that bounce to pummel gold all the way down to $1,830 by early afternoon! While it recovered to $1,847 at the US close, that was still that 3.5% loss. Silver and the main GDX gold-stock ETF plunged 7.0% and 4.8% in sympathy.
While startling sentimentally, those sharp selloffs did not torpedo recent newer uptrends in the precious metals. Gold stocks’ major upleg breakout evident in GDX, which I discussed in last week’s essay written the day before Jobs Friday, stayed intact. Gold, silver, and their miners’ stocks remained in what still look like young bull-market uplegs technically. Their series of higher lows and higher highs survived that rout.
A few days earlier in our weekly newsletter, I warned subscribers a sharp gold selloff remained a real threat. “A snowballing gold-futures-longs mass exodus is still the biggest near-term risk gold faces, so we must stay wary.” If you understand and follow speculators’ collective gold-futures positioning, then sharp gold selloffs won’t scare you into making hasty emotional trading decisions that end up proving poor ones.
Speculators’ gold-futures trading is gold’s dominant short-term driver. Whenever gold sees a big daily swing up or down, it is usually the result of spec gold-futures action. Futures trading is way different from stock trading, because of its extreme inherent leverage. That greatly multiplies the gold-price impact of futures speculators’ capital, enabling it to often become the small tail that wags the far-larger gold-price dog.
Each American COMEX gold-futures contract controls 100 troy ounces of the yellow metal. At $1,850 gold, that’s worth $185,000. But this week speculators are only required to hold $10,000 cash in their accounts for each gold-futures contract they trade. That enables them to run maximum leverage way up at 18.5x. Every $1 they deploy can have the same affect on gold as fully $18.50 bought or sold outright!
And that’s actually pretty low for this wild-west realm. Gold-futures margins get raised when gold prices are volatile, to lower the risks of traders not being able to make good on their contract commitments. For years, maximum gold-futures leverage for speculators ranged from 25x to 35x! With extreme leverage comes extreme risk, forcing gold-futures traders to be ultra-myopic for the time horizons they operate in.
A big gold down day like last Friday’s 3.5% plummeting is a manageable 3.5% loss for investors using no margin. But at 18.5x leverage, that is multiplied to 64.8%! Imagine being long gold futures to the hilt and seeing nearly 2/3rds of your capital deployed obliterated in a matter of hours. When gold starts selling off materially for any reason, gold-futures speculators have to quickly pile on to avoid catastrophic losses.
That’s true regardless of the sparking catalyst. There were a few potential ones late last week leading into Jobs Friday. The US stock markets had just surged to another all-time high, weakening demand for alternative investments lead by gold. Bitcoin, which millennials and some institutional investors view as digital gold, had skyrocketed 35.8% to dazzling record highs in just four trading days stealing the limelight!
And 10-year US Treasury yields were soaring with Democrats taking the Senate and gaining full control of the US government. The prospects of trillions of dollars of more government spending drove a big bond selloff, catapulting 10y yields from 0.91% to 1.11% last week alone! Those higher yields were lighting a fire under the US Dollar Index, which is the main indicator gold-futures speculators watch for trading cues.
I suspect this latter dynamic was what unleashed the gold-futures selling in Asia heading into Jobs Friday. And once it started, it cascaded like usual since traders can’t afford to be wrong for long in exceedingly-unforgiving gold futures. So by the time the dust settled that day, gold had been pummeled that 3.5% lower sucking in silver and their miners’ stocks. Only gold-futures selling can yank gold prices down so fast.
Unfortunately speculators’ gold-futures positioning is only published weekly, late Friday afternoons but just current to preceding Tuesday closes. So when this essay was published, the latest Commitments of Traders report illuminating that Jobs Friday episode still hadn’t been released. But gold can’t plunge so sharply without heavy spec gold-futures selling. Another major indicator helped confirm that last Friday.
Over the longer term, gold’s dominant primary driver is investment flows. Investors control vast pools of capital radically dwarfing what the gold-futures speculators can wield. So while frenzied bursts of super-leveraged gold-futures trading can temporarily overwhelm gold prices, investment is ultimately way more important. Despite that Jobs-Friday plunge, gold’s most-important investment vehicles showed no selling.
Those are the American GLD SPDR Gold Shares and IAU iShares Gold Trust gold ETFs. The former’s gold-bullion holdings held in trust for its shareholders were dead-flat that day, while the latter’s edged up 0.1%. A couple weeks ago I wrote an essay on recent slowing gold-ETF selling, a very-bullish omen upping the odds a new gold bull upleg is underway. GLD and IAU saw no differential selling as gold dropped 3.5%.
As the fuel that drives sharp gold selloffs is speculator gold-futures positioning, that also governs the risks of those events happening. If these traders’ collective gold-futures long contracts are high, and/or their short contracts are low, a big gold down day could erupt anytime. I’d been warning our subscribers about this mounting risk for weeks before Jobs Friday, as our newsletters analyze every weekly gold-futures report.
This chart superimposes gold prices over total spec longs and shorts during the past couple years or so. Gold uplegs and corrections are marked, along with the changes in spec longs and shorts over those exact spans. The full trading ranges of spec longs and shorts during this entire secular gold bull since mid-December 2015 are also shown. Speculators’ gold-futures positioning has been excessively-bullish.
In the last CoT report before gold’s Jobs-Friday plummeting, total spec longs were running way up near 411.7k contracts. That is relatively high compared to their gold-bull trading range, which spanned from 186.7k in late December 2015 to 473.2k in mid-February 2020. Normally speculators sell down their long contracts during gold corrections, paring back their leveraged upside bets. But they didn’t during gold’s latest.
That started in early August, after gold had rocketed 40.0% higher out of deeply-oversold stock-panic lows last March. Gold had shot parabolic on enormous investment capital inflows into GLD and IAU, spawning dangerous euphoria. So a healthy correction was in order to rebalance both sentiment and technicals, paving the way for gold’s next bull upleg. I warned about this imminent correction risk in late July.
Indeed gold retreated 13.9% over the next 3.8 months into late November. That proved right in line with this secular bull’s prior corrections which had averaged 14.3% losses over 4.1 months. But despite that selloff largely driven by differential selling of GLD and IAU shares, gold’s decline was gradual enough to avoid spooking gold-futures speculators. So they merely sold 3.6k long contracts during that correction span.
That left their leveraged gold upside bets relatively high, with total spec longs 4/5ths up into their gold-bull trading range leading into Jobs Friday. So whenever the right catalyst came along, with a US dollar rally being the most-likely one, cascading gold-futures selling hammering gold lower was a real risk. And that is almost certainly exactly what happened a week ago, which should be confirmed by this week’s new CoT.
Excessively-bullish upside bets spawn gold-futures-selling overhangs. I think of these like the windblown-snow cornices that crown the high ridges of the Colorado mountains in the winter. Most of the time they do nothing, but all that heavy packed snow has great potential energy. That can be suddenly released in avalanches when just the right conditions of snow consistency and density, temperature, and wind arise.
Like snow cornices at elevation, high spec gold-futures longs aren’t inherently risky. Sometimes they stay high, or gradually shrink with little fanfare like sublimating or melting snow. But when the right catalyst hits at the right time, all that potential gold-futures selling can be suddenly released igniting a snowballing avalanche of selling. That bashes gold sharply lower whenever it happens, both in uplegs and corrections.
My decades of gold-futures research necessary to profitably trade high-potential gold stocks has led me to view 400k+ spec gold-futures longs as the danger zone. The higher those collective upside bets get, the more likely they are going to collapse into cascading selling. And for three CoT weeks in a row before Jobs Friday, total spec longs exceeded 400k at 408.7k, 400.5k, and 411.7k contracts. That demanded caution.
But that static threshold is simplistic within the context of a longer secular gold bull. The more years that gold marches higher on balance, the more bullish everyone gets including gold-futures speculators. They are less inclined to liquidate their longs back down to early-bull levels after gold has established a long track record trending higher. So spec longs’ relevant trading range likely climbs in its own uptrend parallel to gold.
Leading into Jobs Friday, spec longs’ bull support line had risen up near 355k contracts. That left room for about 57k of selling on the right catalyst. Anything over 20k in any single CoT week is huge, forcing gold sharply lower. I can’t wait to see total spec longs when the new CoT report straddling Jobs Friday is finally released late this afternoon. Were those long liquidations large enough to slash that overhang risk?
Total spec shorts work similarly, but in the opposite way. Adding a new gold short has the same gold-price impact as selling an existing long, while buying to cover a short is functionally identical to adding a new long. But spec shorts overall are proportionally less important to gold since there are usually way fewer of them. Ahead of Jobs Friday, total spec shorts of 90.8k contracts were just over 1/5th of total longs.
During this secular gold bull, speculators’ gold-futures shorts have run in a gigantic range between 47.8k in late April 2020 to 256.7k in mid-August 2018. But like longs, the deeper into a gold bull speculators get the less motivated they are to put on leveraged gold-futures shorts. So total spec shorts have seen a declining bull-resistance line in recent years, which was running near 105k contracts before Jobs Friday.
So before $1,900 gold failed overnight in Asian trading late last week prior to the latest monthly jobs read, specs had room to short sell another 14.2k contracts. While they are forced to pile into long liquidations during sharp gold selloffs to mitigate catastrophic losses, adding new shorts is optional. With Fed money printing out of control and government spending soaring, specs likely aren’t too keen on downside gold bets.
So last Friday’s sharp 3.5% gold plummeting hammering the entire precious-metals complex lower was almost certainly the result of a major spec gold-futures-long liquidation. These traders were forced to quickly pare their relatively-high gold-bullish bets, and that selling cascaded. The more traders decide to dump gold-futures longs, the faster gold’s price falls. The lower gold goes, the more traders are forced to sell.
This self-reinforcing vicious circle amplifies gold-futures-driven gold plunges until specs have sold enough to suitably reduce their leveraged downside risks. Then like an avalanche sliding to a halt after all that snow’s kinetic energy is spent, the snowballing gold-futures selling also runs out of momentum. Then gold prices stabilize and the yellow metal resumes whatever trend it was in before that gold-futures selling erupted.
Whether you trade or invest in gold or silver, gold- or gold-stock-ETF shares, or shares in individual gold and silver miners, it is really important to stay abreast of speculators’ collective gold-futures positioning. Watching their bets as a herd is like an early-warning system for big gold surges and plunges, which both silver and their miners’ stocks amplify. It reveals when sharp futures-driven gold moves are most probable.
Knowing such violent gold-price swings are likely before they happen really helps traders keep their own greed and fear in check. Before gold plunged 3.5% out of the blue on Jobs Friday, our subscribers were well aware a gold-futures-selling overhang existed that could be triggered any time. So they didn’t panic sell when it came to pass, with their gold-stock and silver-stock trades protected by loose trailing stop losses.
Despite gold, silver, and GDX plunging 3.5%, 7.0%, and 4.8% that day, no stop losses were tripped in our many new gold-stock and silver-stock trades to ride this sector’s young bull upleg. That now includes 12 trades in our weekly newsletter and 6 in our monthly added since late November. Their unrealized gains continue to gradually grow on balance, despite the periodic gold selloffs inevitable in all bull uplegs.
Knowledge and perspective are absolutely essential to multiplying wealth through stock trading. And specs’ gold-futures trading as a herd can really bully gold prices around when it grows frenzied. That doesn’t last for long since these guys’ capital firepower is relatively small and limited, but the resulting gold swings really affect sentiment and trading decisions. Not watching spec gold-futures positioning is flying blind.
At Zeal we walk the contrarian walk, buying low when few others are willing before later selling high when few others can. We overcome popular greed and fear by diligently studying market cycles. We trade on time-tested indicators derived from technical, sentimental, and fundamental research. That’s why all 1178 stock trades recommended in our newsletters since 2001 averaged hefty +24.0% annualized realized gains!
To multiply your wealth trading high-potential gold stocks, you need to stay informed about what’s going on in this sector. Staying subscribed to our popular and affordable weekly and monthly newsletters is a great way. They draw on my vast experience, knowledge, wisdom, and ongoing research to explain what’s going on in the markets, why, and how to trade them with specific stocks. Subscribe today and take advantage of our 20%-off sale! There’s no better time than around a correction-bottoming buying opportunity.
The bottom line is gold’s sharp Jobs-Friday plunge was fueled by cascading gold-futures selling by the speculators. Their collective upside bets were relatively high heading into that day, with total longs above the gold-futures-selling-overhang threshold. So when gold started selling off overnight well ahead of that US jobs report, these traders were forced to liquidate leveraged longs en masse or face catastrophic losses.
The resulting gold plunge suffered no identifiable differential gold investment selling. And that snowballing gold-futures selling quickly exhausted itself, enabling gold prices to stabilize this week. So gold’s young-upleg uptrend in place before that frenzied long liquidation should resume. That portends gold prices climbing again on balance, leading to outsized gains in fundamentally-superior gold-mining stocks.
Adam Hamilton, CPA
January 15, 2021
Copyright 2000 – 2021 Zeal LLC (www.ZealLLC.com)
The gold miners’ stocks entered this young new year with a bang, as their leading index surged to a major breakout above multiple key resistance lines. That really strengthens the technical case that gold stocks’ next bull-market upleg is underway. This sector has been carving a textbook-perfect series of higher lows and higher highs since late November now, forming a young upleg. Those usually mature to massive gains.
The leading and dominant gold-stock benchmark and trading vehicle is the GDX VanEck Vectors Gold Miners ETF. As of the middle of this week, GDX commanded nearly 2/3rds of all the capital deployed in gold stocks through all the American gold-stock ETFs! GDX is traders’ go-to destination when looking for gold-stock-sector portfolio exposure. And its popularity is growing after last summer’s magnificent upleg.
After getting sucked into March’s COVID-19-lockdown stock panic with gold, GDX skyrocketed 134.1% higher over the next 4.8 months! But after shooting parabolic, the major gold stocks held by GDX were extremely overbought. So a normal healthy correction was in order to rebalance way-overextended technicals and sentiment. That started in early August, and ultimately proved cunning in its price action.
Bull markets are an alternating series of uplegs followed by corrections oscillating around a long-term uptrend. Every two steps forward are followed by one step back. That corrective phase is necessary to bleed off excessive greed from preceding upleg toppings. Corrections’ mission is to annihilate bullish psychology, which is accomplished by toying with bullish traders to convince them to stay fully deployed.
So during most corrections, strong countertrend rallies disguise their true nature. Traders wearing rose-tinted glasses are deceived into believing a correction isn’t happening or it has largely passed quickly with minor losses. They then ride it most of the way down maximizing their financial pain. The best defense against being duped by a correction is maintaining perspective, which comes from studying past ones.
All this is important because gold stocks’ major breakout this week pretty much formally staked their recent correction. Until that happened, this sector had remained trapped in its correction downtrend despite GDX’s solid gains since late November. This chart looks at the gold-stock-bull technicals over the last couple years through that GDX lens. This week’s gold-stock developments are a major milestone.
The significance of this week’s GDX major upside breakout is most apparent within the context of its preceding correction. GDX’s last upleg peaked at $44.48 in early August, again after more than doubling in a matter of months. The initial selloff was hard and fast, GDX reversed violently to plunge 12.2% in just four trading days. I warned about that new correction soon after while analyzing gold miners’ quarterly results.
Technically a correction is a 10%+ selloff after an upleg, so there was no disputing one was underway. But GDX bounced sharply after that quick initial plunge, surging 9.9% higher in the next four trading days. So by mid-August, GDX was back to just 3.5% under its 7.5-year secular high seen less than two weeks earlier. So traders not sufficiently hardened by experiencing past gold-stock corrections figured it was over.
The GDX price action over the next several weeks certainly fostered that view. Rather than selling off, GDX was consolidating high. Consolidations accomplish the same sentiment and technical rebalancing as corrections, but take much longer to do so. Higher price levels after shallower selloffs enable greed to fester for extended durations. There’s always a tradeoff between selloffs’ depths and their longevities.
After trading gold-stock upleg-correction cycles for decades, I didn’t believe this latest correction was over yet in early September. I explained this in an essay then called Gold-Stock Correction Mode, which sure wasn’t popular with duped traders. One key reason was GDX had still only sold off 12.2% at worst, which was far too mild for a gold-stock correction. This bull’s previous three averaged way-more-serious 36.5% losses!
The dominant primary driver of gold-stock prices is gold, and its own correction at that point also looked too immature relative to bull precedent. So I concluded back then that “…with gold stocks remaining very overbought technically, and greed still elevated after an insufficient selloff, a resurgent correction is likely. That could easily extend to 25% in GDX, another 20% lower from this week’s levels.” Boy was that mocked!
Successfully multiplying wealth in the markets requires buying relatively-low before later selling relatively-high. But that can only be accomplished by being contrarian, fighting the herd to do whatever is least popular at any time. When most gold-stock traders fervently believed a mere 12.2% GDX selloff over just four trading days was enough after a massive 134.1% upleg, the contrarian trade was to short gold stocks.
We were doing that at the time in our newsletters, with inverse-leveraged gold-stock ETFs and gold-stock-ETF put options. Our many long gold-stock and silver-stock trades had been stopped out at big-to-huge realized gains in late July to late August as this sector started rolling over into correction mode. When gold-stock uplegs become too euphoric and overbought, it is prudent to ratchet-up trailing stop losses.
Tighter stop percentages enable traders to ride uplegs as long as possible, while still maximizing gains when they inevitably roll over and fail. During that last upleg, 17 and 9 stock trades in our weekly and monthly newsletters were stopped out at average +81.3% and +83.6% absolute realized gains. Those annualized to huge +303.9% and +334.9% averages! With all that cashed out, we could play the short side.
But GDX continued consolidating high into mid-September, extending that greed-fostering drift for over a month. With most traders convinced the selloff danger had passed, the lying-in-wait correction struck with a vengeance. In just five trading days GDX plunged another 12.2%, taking it to a new correction-to-date low of $37.63. But that only made for a 15.4% total selloff, still way under that 36.5% bull-to-date average.
Naturally correction worries flared again after that sharp drop, greed faded as fear mounted. But these necessary rebalancing selloffs are most effective at accomplishing their missions when they can lure the most traders into complacently staying deployed. There’s nothing like suffering big losses to shatter the greed from upleg toppings. Those are only possible when corrections sucker traders into thinking they are over.
Thus countertrend rallies within corrections are often incredibly strong, keeping the flame of greed alive. By mid-October GDX had rallied back 8.8%, and was only 7.9% below its early-August peak. That yet again led many gold-stock traders to conclude the worst of the selling was behind them. But if they had consulted a chart for essential perspective, they would’ve noticed the solidifying correction downtrend.
By that point GDX had carved two lower highs and two lower lows, which is evident in this chart. So we held on to our gold-stock-short trades and refused to go long any gold stocks or silver stocks at all. The correction still hadn’t done anywhere close to enough work to eradicate greed and overboughtness. That proved wise, as over the next couple weeks into late October GDX fell another 10.8% to a new correction low.
But even at $36.52, this leading gold-stock benchmark was still only down 17.9% from early August. That was getting closer to the right magnitude for gold stocks, but was still on the small side. Although GDX bounced a bit out of that selloff, the most-challenging time in the correction was still coming. It hit right in the wake of early November’s US elections, where the results weren’t quite what traders were expecting.
Remember polling leading into that voting showed Democrats crushing Republicans in both chambers of Congress and the presidency. But once the votes were counted, that blue-wave sweep didn’t materialize. Democrats lost a relatively-large number of House seats, leaving their majority very narrow. And before this week’s Georgia Senate runoffs, Republicans looked like they were going to keep that upper chamber.
So a couple days after early November’s elections, traders figured a divided government made another big pandemic-stimulus spending bill much less likely. Thus they reasoned the Fed would have to step in with even more quantitative-easing money printing. So GDX rocketed 7.2% higher to $41.23 that Thursday on a 2.5% gold surge. That blistering post-election spike was definitely a breakout from GDX’s downtrend!
That was without a doubt the most-psychologically-challenging day of that correction for contrarian gold-stock traders trying to maintain perspective. The hobbled-Congress-Fed-money-printing arguments were sound, and very bullish for gold and its miners’ stocks. The gold-stock correction could very well have been over, despite still being shallow and short. But one key trading rule saved contrarians from buying high.
Breakouts need to be confirmed, meaning gold-stock prices need to spend a few trading days well into that upside-breakout territory. News-driven spikes above correction-downtrend resistance lines aren’t terribly uncommon. The real test is whether they are sustained after whatever the catalytic news was soon starts to fade from traders’ minds. GDX needed to hold those levels before green lighting buying.
It looked to on the day after that post-election spike, with this leading gold-stock benchmark enjoying a 0.5% follow-up gain. But in the next couple trading days after that, GDX collapsed 6.2% and 3.4% which hammered it well back into its correction downtrend! So that election-spike breakout was proven false within three trading days. Since the news lifecycle is so fast, news-driven breakouts are more suspect anyway.
After that election-spike high failed to hold, gold stocks just crumbled over the next several weeks or so. Traders finally realized the correction had duped them, it remained alive and well despite the sharp gold-stock rallies within. By November 24th in that usually-quiet Thanksgiving week, GDX had fallen another 19.3% to a deep new correction low of $33.42! That extended that total selloff to 24.9% over 3.6 months.
I finally decided to bite that day, adding the first new long-gold-stock trades in our weekly newsletter since late June. That gold-stock correction hitting my months-old 25% downside target was a minor factor. Much more importantly, GDX had been battered back under its 200-day moving average which is strong support in bull markets. The major gold stocks were finally oversold, and sentiment was pretty darned bearish.
While I wasn’t convinced gold stocks’ correction was over that day, trading campaigns for subsequent uplegs are best layered in across a couple months. The idea is to attempt to straddle the actual bottom by buying in relatively-low both before and after it. Gradually adding new trades during a likely bottoming is the highest-probability-for-success way to redeploy near correction-low prices. So we started doing that.
Major upleg toppings and correction bottomings are never certain in real-time. They only become known well after the fact, after ensuing price action proves them out. And GDX’s strong uptrend since late November is increasingly solidifying the technical case that a new gold-stock upleg is indeed underway. Those correction lows are looking ever more decisive with each passing day, a very bullish omen for this sector.
Like a correction is a downtrend formed by a series of lower highs and lower lows, an uptrend is drawn by sequential higher lows and higher highs. And that is exactly what GDX has achieved over the last six weeks or so, oscillating around its major 200dma support to coalesce into a new uptrend. That December price action was so encouraging we kept adding new gold-stock and silver-stock trades as GDX recovered.
Those now number 10 and 6 in our weekly and monthly newsletters since this sector’s late-November bottoming. But despite several higher lows and higher highs GDX carved since then, there was one nagging technical doubt. Right up until year-end, this dominant gold-stock benchmark remained stuck in its correction downtrend and under its 50-day moving average. Was that just another countertrend rally?
Two prior times in its recent correction, GDX had climbed from the lower support to the upper resistance of its downtrend. This latest mostly-December rally was the third. While redeploying in beaten-down high-potential fundamentally-superior gold stocks was still prudent even if that correction hadn’t yet given up its ghost, deeper lows would’ve been painful. Loose trailing stops should’ve enabled us to ride them out.
The major gold stocks entered this young new year still in their correction downtrend and still under GDX’s 50dma, which is another strong overhead-resistance zone in corrections. So there was a good technical case that rebalancing selloff was still biding its time. But on the first trading day of 2021, the odds of that collapsed. Right out of the gates, GDX blasted 6.9% higher to a major new upleg high of $38.51!
That further fleshed out this apparent new upleg’s uptrend, which is very clear in this chart. That extended GDX’s higher-high streak since late November’s trough to $36.50, $37.29, and $38.51, nicely complementing its parallel higher lows of $33.42, $34.29, and $35.28. But more importantly technically, that January 4th surge blasted GDX decisively above both its downtrend resistance and 50dma on no news!
Remembering the election-spike false breakout, I didn’t get too excited about this latest breakout when it happened this Monday. But on both Tuesday and Wednesday, GDX held those new highs closing right up there at $38.50 and $38.45. That made for several trading days in a row confirming this major upside breakout, which didn’t happen in early November! And gold stocks are unusually-resilient compared to gold.
The major gold stocks and thus GDX tend to mirror and amplify gold’s own price action by 2x to 3x. That election spike quickly collapsed when GDX plunged 6.2% on a brutal 4.4% gold down day. Though mild 1.4x downside leverage, that knocked GDX back into its downtrend. On this Wednesday January 6th, gold suffered a big 1.5% down day. Normally GDX would plunge 3.0% to 4.5% on that, impairing its breakout.
Yet gold stocks all but ignored gold’s latest drop! GDX merely shed 0.1% on close that day, making for trivial 0.1x downside leverage which is pretty rare on a sharp gold fall. And as I pen this essay midday Thursday, GDX continues to hold near $38.00 well into breakout territory. This is increasingly looking like the real deal. And if that proves true, gold stocks’ next major upleg portending big gains is already well underway.
GDX soared 134.1% higher in last summer’s upleg, and 76.7% higher in the one before that. This bull’s four uplegs so far have averaged massive 99.2% gains! Another doubling from late November’s low isn’t a stretch at all, especially with central banks printing money like there is no tomorrow which is super-bullish for gold prices. So far GDX has only climbed 15.2% at best in this likely upleg, which isn’t much yet.
That means fundamentally-superior gold stocks and silver stocks can still be bought relatively-low, before this next move higher really gathers steam and entices in big capital. While there are no certainties in the markets, the GDX technical action since late November culminating in this week’s dual downtrend-resistance and 50dma breakouts really increase the odds that gold stocks’ recent correction indeed ended then.
At Zeal we walk the contrarian walk, buying low when few others are willing before later selling high when few others can. We overcome popular greed and fear by diligently studying market cycles. We trade on time-tested indicators derived from technical, sentimental, and fundamental research. That’s why all 1178 stock trades recommended in our newsletters since 2001 averaged hefty +24.0% annualized realized gains!
To multiply your wealth trading high-potential gold stocks, you need to stay informed about what’s going on in this sector. Staying subscribed to our popular and affordable weekly and monthly newsletters is a great way. They draw on my vast experience, knowledge, wisdom, and ongoing research to explain what’s going on in the markets, why, and how to trade them with specific stocks. Subscribe today and take advantage of our 20%-off sale! There’s no better time than around a correction-bottoming buying opportunity.
The bottom line is gold stocks kicked off 2021 with a major upside breakout. The leading gold-stock ETF finally burst decisively above its recent correction’s downtrend resistance and 50-day moving average this week. And the major gold stocks have confirmed that breakout since by holding those high levels despite a big gold plunge. All this really increases the odds that gold stocks’ next bull upleg is indeed underway.
On average major-gold-stock prices doubled during each of this bull’s prior four uplegs! So a likely young fifth one starting to power higher offers great opportunities for contrarian traders to multiply their wealth again. The gold miners are making money hand over fist with these high prevailing gold prices, and the epic money printing driving them isn’t going anywhere. That’s a tasty recipe for a major gold-stock upleg.
Adam Hamilton, CPA
January 8, 2021
Copyright 2000 – 2021 Zeal LLC (www.ZealLLC.com)
- The year 2020 was a solid year for gold, silver, and associated miners. The juniors were particularly impressive.
- Please click here now: https://gracelandupdates.com/wordpress/wp-content/uploads/2021/01/2020jan5gold1.png Double-click to enlarge this important weekly gold chart. It should be clear that the traditional Chinese New Year gold price rally is officially underway.
- Investors who focused on my key buy zones of $1450, $1566, and $1788 for gold (and 21,700 and 18,3000 for the Dow) did incredibly well… and 2021 is already off to a phenomenal start!
- Note the buy signal that is almost occurring now, on my 5,15 moving average series.
- Please click here now: https://gracelandupdates.com/wordpress/wp-content/uploads/2021/01/2020jan5dollar1.png Double-click to enlarge this ominous dollar vs. gold chart. A bear wedge meltdown is in play. Before the damage gets worse, dollar bugs would be wise to close out positions and get into gold.
- Fiat currencies have unlimited supply, and the main backbone of that money is government debt and income tax extortion. Simply put, fiat has no real spine.
- We all need some fiat because government makes sure everything we buy is priced in it, but this type of money really serves no purpose other than to empower the government.
- Electronic gold money with a tiny transaction fee could replace the current model of income tax revenue generation for government. That would generate more revenue than income tax does, while dramatically reducing rampant government “thugsterism”.
- A global launch of electronic gold money would probably see gold trade at a higher price than bitcoin.
- That launch won’t be happening though, because the nature of government is to endlessly brag about itself while using heavy-handed actions that create far more problems than solutions.
- Please click here now: https://gracelandupdates.com/wordpress/wp-content/uploads/2021/01/2020jan5block1.png Double-click to enlarge. When bitcoin was trading in the $1000-$100 price zone, I urged my https://gublockchain.com subscribers to buy as I bought. Many did, and are now happier than a crypto clam.
- I also set a $250,000 target for the “prince of coin” then. Now, mainstream analysts are pouring into the market. They sound more like fans at a sporting event than analysts, which is a concern.
- The bottom line is that it is not too late to get involved with bitcoin, but rather than listening to the silly cheerleaders who bought nothing in the sub $1000 price zone, the buying needs to be done professionally. That means using the big support and resistance zones on my weekly charts.
- Fear can be a more powerful emotional force than greed. Investor buying into a parabolic move like bitcoin is experiencing now can end with tears.
- I’m a happy seller of some bitcoin for gold right now, although I am buying some particularly interesting “alt” coins that could surge dramatically higher.
- Investors who wasted too much time ranting about U.S. politics and Corona missed out on buying the stock market at my important Dow 18,300 price zone.
- They also missed buying gold at numerous key areas that I highlighted emphatically.
- My suggested new year’s resolution for 2021 is to focus much less on the extortion racket known as government, and much more on what is happening at key weekly chart price zones for the dollar versus gold.
- Please click here now: https://gracelandupdates.com/wordpress/wp-content/uploads/2021/01/2020jan5goau.png Double-click to enlarge this fabulous GOAU ETF chart.
- Some investors panicked last week when the ETF made a distribution. The price dipped, but only by the amount of the distribution.
- The bottom line is that the chart looks solid, a breakout appears imminent, and stoploss enthusiasts can place a stop at $19.40 or $18.80.
- The next positive event to look for is an Edwards and Magee pattern of higher minor trend lows and highs, and that could come into play later this week.
- Please click here now: https://gracelandupdates.com/wordpress/wp-content/uploads/2021/01/2020jan5sil.png Double-click to enlarge this SIL silver stocks ETF. SIL already has a nice pattern of higher minor trend lows and highs in play.
- Please click here now: https://gracelandupdates.com/wordpress/wp-content/uploads/2021/01/2020jan5sil2.png Double-click to enlarge. On the monthly charts, silver stocks are staging major bull flag breakouts. If the SIL ETF pushes above $50, and another huge flagpole move to the upside should follow. Clearly, the time is now, for investors to make money in the metal markets, with a solid allocation to hi ho silver!
If you would like to receive our free newsletter via email, simply enter your email address below & click subscribe.
 Follow us on Twitter
 Become our facebook fan
CONNECT WITH US
Tweets
Tweet with hash tag #miningfeeds or @miningfeeds and your tweets will be displayed across this site.
MOST ACTIVE MINING STOCKS
Daily Gainers
 CMC Metals Ltd. CMC Metals Ltd. |
CMB.V | +900.00% |
 Eden Energy Ltd Eden Energy Ltd |
EDE.AX | +200.00% |
| GoviEx Uranium Inc. |
GXU.V | +42.86% |
| Eagle Nickel Ltd. |
ENL.AX | +41.67% |
| Citigold Corp. Limited |
CTO.AX | +33.33% |
| Mount Burgess Mining NL |
MTB.AX | +33.33% |
| Exalt Resources Limited |
ERD.AX | +31.94% |
| Casa Minerals Inc. |
CASA.V | +30.00% |
| Cariboo Rose Resources Ltd |
CRB.V | +28.57% |
| Belmont Resources Inc. |
BEA.V | +28.57% |


