DENVER, July 17, 2026–(BUSINESS WIRE)–SSR Mining Inc. (Nasdaq/TSX: SSRM) ("SSR Mining" or the "Company") is pleased to announce that it has closed the sale of its 20% ownership stake in the Hod Maden development project (the "Project"). At closing, SSR Mining received an uncapped 4.0% net smelter return royalty ("NSR") (1) on 100% of the Project (the "Transaction").
The 4.0% Hod Maden NSR strengthens SSR Mining’s existing royalty portfolio, which currently includes NSRs on the San Luis project (4.0%) owned by Highlander Silver, the Pitarrilla project (1.25%) owned by Endeavour Silver, the Rowan property (3.0%) owned by West Red Lake Gold, and the Sunrise Lake property (4.0%) owned by Honey Badger Silver.
The Transaction closing, together with the previously announced divestment of the Çöpler mine in Türkiye, completes SSR Mining’s strategic refocus to a free cash flow leading Americas gold and silver producer anchored by its long-lived operations in the United States.
SSR Mining would like to thank its employees and local communities across Türkiye for their cooperation, effort and support.
About SSR Mining
SSR Mining Inc. is a free-cash-flow-focused gold and silver mining company and the third-largest gold producer in the United States. SSR Mining has a diversified portfolio of operating, development and exploration assets across the Americas, including four operating mines in the USA, Canada, and Argentina. In 2026, SSR Mining is expected to produce between 450,000 and 535,000 Gold Equivalent Ounces. The Company is headquartered in Denver, Colorado and is listed under the ticker symbol SSRM on the Nasdaq Stock Market and the Toronto Stock Exchange.
For more information, please visit: www.ssrmining.com.
|
(1) |
Royal Gold will hold a fixed price call right to acquire 2.0% of the NSR from SSR Mining for $160 million, expiring 12 months following declaration of commercial production at the Project. Additionally, Royal Gold will hold a consent right on the sale of SSR Mining’s NSR prior to January 1, 2028, and a right of first refusal in connection with any sale of the SSR Mining NSR. |
Cautionary Note Regarding Forward-Looking Information and Statements:
This press release includes "forward looking information" within the meaning of applicable securities laws. Forward-looking information can be identified by terminology such as "may", "will", "could", "should", "expect", "plan", "anticipate", "believe", "intend", "estimate", "projects", "predict", "potential", "continue" or other similar expressions concerning matters that are not historical facts. Statements that refer to projections of our future financial performance, our anticipated growth and trends in our businesses, and other characterizations of future events or circumstances are forward-looking statements, and include, but are not limited to, the successful completion of the Hod Maden development project and the ability of Artmin to generate revenues from the project; our ability to receive revenues under, and realize the expected returns from, the NSR; whether Royal Gold would elect to exercise its call or consent rights; and whether and when we elect, and are able, to monetize the NSR.
Although we believe that the expectations and assumptions on which such forward-looking information and statements are based are reasonable, you should not place undue reliance on the forward-looking information and statements because we can give no assurance that they will prove to be correct. Forward-looking information and statements are subject to various risks and uncertainties which could cause actual results and expectations to differ materially from the anticipated results or expectations expressed in this press release. Important factors that could cause actual results to differ materially from our historical experience, and present projections and expectations are disclosed in our filings that we make on SEDAR+ at www.sedarplus.ca, and on EDGAR at www.sec.gov, including our most recent Annual Report on Form 10-K and our Quarterly Reports on Form 10-Q. All forward-looking statements in this press release are expressly qualified by such cautionary statements and by reference to the underlying assumptions. Forward-looking information and statements speak only as of the date they are made. Other than as required by law, we do not intend, and undertake no obligation to update any forward-looking information and statements to reflect, among other things, new information or events. The information contained on, or that may be accessed through, our website is not incorporated by reference into, and is not a part of, this document.
View source version on businesswire.com: https://www.businesswire.com/news/home/20260716634843/en/
Contacts
E-Mail: invest@ssrmining.com Phone: +1 (888) 338-0046
Investors interested in stocks from the Mining – Miscellaneous sector have probably already heard of Teck Resources Ltd (TECK) and Wheaton Precious Metals Corp. (WPM). But which of these two stocks is more attractive to value investors? We'll need to take a closer look to find out.
We have found that the best way to discover great value opportunities is to pair a strong Zacks Rank with a great grade in the Value category of our Style Scores system. The proven Zacks Rank puts an emphasis on earnings estimates and estimate revisions, while our Style Scores work to identify stocks with specific traits.
Teck Resources Ltd has a Zacks Rank of #2 (Buy), while Wheaton Precious Metals Corp. has a Zacks Rank of #3 (Hold) right now. This means that TECK's earnings estimate revision activity has been more impressive, so investors should feel comfortable with its improving analyst outlook. However, value investors will care about much more than just this.
Value investors analyze a variety of traditional, tried-and-true metrics to help find companies that they believe are undervalued at their current share price levels.
Our Value category grades stocks based on a number of key metrics, including the tried-and-true P/E ratio, the P/S ratio, earnings yield, and cash flow per share, as well as a variety of other fundamentals that value investors frequently use.
TECK currently has a forward P/E ratio of 16.35, while WPM has a forward P/E of 22.62. We also note that TECK has a PEG ratio of 1.67. This metric is used similarly to the famous P/E ratio, but the PEG ratio also takes into account the stock's expected earnings growth rate. WPM currently has a PEG ratio of 1.93.
Another notable valuation metric for TECK is its P/B ratio of 1.43. The P/B ratio pits a stock's market value against its book value, which is defined as total assets minus total liabilities. For comparison, WPM has a P/B of 5.33.
These are just a few of the metrics contributing to TECK's Value grade of B and WPM's Value grade of D.
TECK is currently sporting an improving earnings outlook, which makes it stick out in our Zacks Rank model. And, based on the above valuation metrics, we feel that TECK is likely the superior value option right now.
Want the latest recommendations from Zacks Investment Research? Today, you can download 7 Best Stocks for the Next 30 Days. Click to get this free report
Teck Resources Ltd (TECK) : Free Stock Analysis Report
Wheaton Precious Metals Corp. (WPM) : Free Stock Analysis Report
This article originally published on Zacks Investment Research (zacks.com).
Wall Street expects a year-over-year increase in earnings on higher revenues when Teck Resources Ltd (TECK) reports results for the quarter ended June 2026. While this widely-known consensus outlook is important in gauging the company's earnings picture, a powerful factor that could impact its near-term stock price is how the actual results compare to these estimates.
The earnings report, which is expected to be released on July 23, might help the stock move higher if these key numbers are better than expectations. On the other hand, if they miss, the stock may move lower.
While the sustainability of the immediate price change and future earnings expectations will mostly depend on management's discussion of business conditions on the earnings call, it's worth handicapping the probability of a positive EPS surprise.
Zacks Consensus Estimate
This company is expected to post quarterly earnings of $0.77 per share in its upcoming report, which represents a year-over-year change of +185.2%.
Revenues are expected to be $2.31 billion, up 58.2% from the year-ago quarter.
Estimate Revisions Trend
The consensus EPS estimate for the quarter has been revised 3.52% higher over the last 30 days to the current level. This is essentially a reflection of how the covering analysts have collectively reassessed their initial estimates over this period.
Investors should keep in mind that the direction of estimate revisions by each of the covering analysts may not always get reflected in the aggregate change.
Price, Consensus and EPS Surprise
Earnings Whisper
Estimate revisions ahead of a company's earnings release offer clues to the business conditions for the period whose results are coming out. This insight is at the core of our proprietary surprise prediction model — the Zacks Earnings ESP (Expected Surprise Prediction).
The Zacks Earnings ESP compares the Most Accurate Estimate to the Zacks Consensus Estimate for the quarter; the Most Accurate Estimate is a more recent version of the Zacks Consensus EPS estimate. The idea here is that analysts revising their estimates right before an earnings release have the latest information, which could potentially be more accurate than what they and others contributing to the consensus had predicted earlier.
Thus, a positive or negative Earnings ESP reading theoretically indicates the likely deviation of the actual earnings from the consensus estimate. However, the model's predictive power is significant for positive ESP readings only.
A positive Earnings ESP is a strong predictor of an earnings beat, particularly when combined with a Zacks Rank #1 (Strong Buy), 2 (Buy) or 3 (Hold). Our research shows that stocks with this combination produce a positive surprise nearly 70% of the time, and a solid Zacks Rank actually increases the predictive power of Earnings ESP.
Please note that a negative Earnings ESP reading is not indicative of an earnings miss. Our research shows that it is difficult to predict an earnings beat with any degree of confidence for stocks with negative Earnings ESP readings and/or Zacks Rank of 4 (Sell) or 5 (Strong Sell).
How Have the Numbers Shaped Up for Teck Resources?
For Teck Resources, the Most Accurate Estimate is higher than the Zacks Consensus Estimate, suggesting that analysts have recently become bullish on the company's earnings prospects. This has resulted in an Earnings ESP of +19.61%.
On the other hand, the stock currently carries a Zacks Rank of #2.
So, this combination indicates that Teck Resources will most likely beat the consensus EPS estimate.
Does Earnings Surprise History Hold Any Clue?
Analysts often consider to what extent a company has been able to match consensus estimates in the past while calculating their estimates for its future earnings. So, it's worth taking a look at the surprise history for gauging its influence on the upcoming number.
For the last reported quarter, it was expected that Teck Resources would post earnings of $0.76 per share when it actually produced earnings of $1.28, delivering a surprise of +68.42%.
Over the last four quarters, the company has beaten consensus EPS estimates four times.
Bottom Line
An earnings beat or miss may not be the sole basis for a stock moving higher or lower. Many stocks end up losing ground despite an earnings beat due to other factors that disappoint investors. Similarly, unforeseen catalysts help a number of stocks gain despite an earnings miss.
That said, betting on stocks that are expected to beat earnings expectations does increase the odds of success. This is why it's worth checking a company's Earnings ESP and Zacks Rank ahead of its quarterly release. Make sure to utilize our Earnings ESP Filter to uncover the best stocks to buy or sell before they've reported.
Teck Resources appears a compelling earnings-beat candidate. However, investors should pay attention to other factors too for betting on this stock or staying away from it ahead of its earnings release.
Expected Results of an Industry Player
Another stock from the Zacks Mining – Miscellaneous industry, Reliance (RS), is soon expected to post earnings of $5.33 per share for the quarter ended June 2026. This estimate indicates a year-over-year change of +20.3%. Revenues for the quarter are expected to be $4.16 billion, up 13.7% from the year-ago quarter.
The consensus EPS estimate for Reliance has remained unchanged over the last 30 days. However, a higher Most Accurate Estimate has resulted in an Earnings ESP of +3.10%.
When combined with a Zacks Rank of #3 (Hold), this Earnings ESP indicates that Reliance will most likely beat the consensus EPS estimate. Over the last four quarters, the company surpassed EPS estimates just once.
Stay on top of upcoming earnings announcements with the Zacks Earnings Calendar.
Want the latest recommendations from Zacks Investment Research? Today, you can download 7 Best Stocks for the Next 30 Days. Click to get this free report
Teck Resources Ltd (TECK) : Free Stock Analysis Report
Reliance, Inc. (RS) : Free Stock Analysis Report
This article originally published on Zacks Investment Research (zacks.com).
Southern Copper (SCCO) has recently been on Zacks.com's list of the most searched stocks. Therefore, you might want to consider some of the key factors that could influence the stock's performance in the near future.
Shares of this miner have returned -5.3% over the past month versus the Zacks S&P 500 composite's +0.5% change. The Zacks Mining – Non Ferrous industry, to which Southern Copper belongs, has lost 9.4% over this period. Now the key question is: Where could the stock be headed in the near term?
While media releases or rumors about a substantial change in a company's business prospects usually make its stock 'trending' and lead to an immediate price change, there are always some fundamental facts that eventually dominate the buy-and-hold decision-making.
Revisions to Earnings Estimates
Rather than focusing on anything else, we at Zacks prioritize evaluating the change in a company's earnings projection. This is because we believe the fair value for its stock is determined by the present value of its future stream of earnings.
We essentially look at how sell-side analysts covering the stock are revising their earnings estimates to reflect the impact of the latest business trends. And if earnings estimates go up for a company, the fair value for its stock goes up. A higher fair value than the current market price drives investors' interest in buying the stock, leading to its price moving higher. This is why empirical research shows a strong correlation between trends in earnings estimate revisions and near-term stock price movements.
For the current quarter, Southern Copper is expected to post earnings of $1.97 per share, indicating a change of +61.5% from the year-ago quarter. The Zacks Consensus Estimate has changed +6.3% over the last 30 days.
The consensus earnings estimate of $7.68 for the current fiscal year indicates a year-over-year change of +46.6%. This estimate has changed +5.8% over the last 30 days.
For the next fiscal year, the consensus earnings estimate of $7.05 indicates a change of -8.2% from what Southern Copper is expected to report a year ago. Over the past month, the estimate has changed +7.6%.
Having a strong externally audited track record, our proprietary stock rating tool, the Zacks Rank, offers a more conclusive picture of a stock's price direction in the near term, since it effectively harnesses the power of earnings estimate revisions. Due to the size of the recent change in the consensus estimate, along with three other factors related to earnings estimates, Southern Copper is rated Zacks Rank #3 (Hold).
The chart below shows the evolution of the company's forward 12-month consensus EPS estimate:
12 Month EPS
Projected Revenue Growth
Even though a company's earnings growth is arguably the best indicator of its financial health, nothing much happens if it cannot raise its revenues. It's almost impossible for a company to grow its earnings without growing its revenue for long periods. Therefore, knowing a company's potential revenue growth is crucial.
In the case of Southern Copper, the consensus sales estimate of $4.37 billion for the current quarter points to a year-over-year change of +43.3%. The $16.99 billion and $14.88 billion estimates for the current and next fiscal years indicate changes of +26.6% and -12.4%, respectively.
Last Reported Results and Surprise History
Southern Copper reported revenues of $4.25 billion in the last reported quarter, representing a year-over-year change of +36.2%. EPS of $1.92 for the same period compares with $1.19 a year ago.
Compared to the Zacks Consensus Estimate of $4.26 billion, the reported revenues represent a surprise of -0.11%. The EPS surprise was +8.47%.
The company beat consensus EPS estimates in each of the trailing four quarters. The company topped consensus revenue estimates three times over this period.
Valuation
Without considering a stock's valuation, no investment decision can be efficient. In predicting a stock's future price performance, it's crucial to determine whether its current price correctly reflects the intrinsic value of the underlying business and the company's growth prospects.
While comparing the current values of a company's valuation multiples, such as price-to-earnings (P/E), price-to-sales (P/S), and price-to-cash flow (P/CF), with its own historical values helps determine whether its stock is fairly valued, overvalued, or undervalued, comparing the company relative to its peers on these parameters gives a good sense of the reasonability of the stock's price.
The Zacks Value Style Score (part of the Zacks Style Scores system), which pays close attention to both traditional and unconventional valuation metrics to grade stocks from A to F (an A is better than a B; a B is better than a C; and so on), is pretty helpful in identifying whether a stock is overvalued, rightly valued, or temporarily undervalued.
Southern Copper is graded D on this front, indicating that it is trading at a premium to its peers. Click here to see the values of some of the valuation metrics that have driven this grade.
Conclusion
The facts discussed here and much other information on Zacks.com might help determine whether or not it's worthwhile paying attention to the market buzz about Southern Copper. However, its Zacks Rank #3 does suggest that it may perform in line with the broader market in the near term.
Want the latest recommendations from Zacks Investment Research? Today, you can download 7 Best Stocks for the Next 30 Days. Click to get this free report
Southern Copper Corporation (SCCO) : Free Stock Analysis Report
This article originally published on Zacks Investment Research (zacks.com).
In the latest close session, Southern Copper (SCCO) was down 3.24% at $175.66. This move lagged the S&P 500's daily loss of 0.51%. Elsewhere, the Dow saw a downswing of 0.2%, while the tech-heavy Nasdaq depreciated by 1.47%.
The stock of miner has fallen by 5.29% in the past month, leading the Basic Materials sector's loss of 8.52% and undershooting the S&P 500's gain of 0.53%.
Analysts and investors alike will be keeping a close eye on the performance of Southern Copper in its upcoming earnings disclosure. On that day, Southern Copper is projected to report earnings of $1.97 per share, which would represent year-over-year growth of 61.48%. Simultaneously, our latest consensus estimate expects the revenue to be $4.37 billion, showing a 43.28% escalation compared to the year-ago quarter.
Looking at the full year, the Zacks Consensus Estimates suggest analysts are expecting earnings of $7.68 per share and revenue of $16.99 billion. These totals would mark changes of +46.56% and +26.62%, respectively, from last year.
It's also important for investors to be aware of any recent modifications to analyst estimates for Southern Copper. These revisions help to show the ever-changing nature of near-term business trends. As a result, we can interpret positive estimate revisions as a good sign for the business outlook.
Research indicates that these estimate revisions are directly correlated with near-term share price momentum. To utilize this, we have created the Zacks Rank, a proprietary model that integrates these estimate changes and provides a functional rating system.
The Zacks Rank system, spanning from #1 (Strong Buy) to #5 (Strong Sell), boasts an impressive track record of outperformance, audited externally, with #1 ranked stocks yielding an average annual return of +25% since 1988. The Zacks Consensus EPS estimate has moved 5.83% higher within the past month. As of now, Southern Copper holds a Zacks Rank of #3 (Hold).
With respect to valuation, Southern Copper is currently being traded at a Forward P/E ratio of 23.65. This indicates a premium in contrast to its industry's Forward P/E of 23.2.
One should further note that SCCO currently holds a PEG ratio of 1.55. The PEG ratio bears resemblance to the frequently used P/E ratio, but this parameter also includes the company's expected earnings growth trajectory. SCCO's industry had an average PEG ratio of 1.29 as of yesterday's close.
The Mining – Non Ferrous industry is part of the Basic Materials sector. At present, this industry carries a Zacks Industry Rank of 209, placing it within the bottom 16% of over 250 industries.
The Zacks Industry Rank evaluates the power of our distinct industry groups by determining the average Zacks Rank of the individual stocks forming the groups. Our research shows that the top 50% rated industries outperform the bottom half by a factor of 2 to 1.
Make sure to utilize Zacks.com to follow all of these stock-moving metrics, and more, in the coming trading sessions.
Want the latest recommendations from Zacks Investment Research? Today, you can download 7 Best Stocks for the Next 30 Days. Click to get this free report
Southern Copper Corporation (SCCO) : Free Stock Analysis Report
This article originally published on Zacks Investment Research (zacks.com).
Rio Tinto Group RIO reported iron ore shipments from Pilbara (on a 100% basis) of 85.3 million tons (Mt) for the second quarter of 2025, which increased 7% year over year. On a sequential basis, shipments rose 18%. Total iron ore production from Pilbara for the quarter was 83.5 Mt, in line with the year-ago quarter. This marked the highest first-half iron ore production at Pilbara since 2018.Bauxite production dipped 3% year over year to 15.2 Mt in the second quarter. However, the figure marked a 14% increase from first-quarter 2026. Rio Tinto’s aluminum output was steady year over year at 840 thousand tons. Alumina production increased 10% to 2 Mt.
In the second quarter, mined copper production was 213 thousand tons, 7% lower than the year-ago quarter. Production at Kennecott was 49% lower year over year due to lower cathode production. Copper production at Escondida decreased 13% year over year due to expected lower ore grades from the mine sequence.
Oyu Tolgoi’s production rose 12% year over year to 97 thousand tons, driven by the ramp-up of underground operations, and a higher combined grade from the open pit and underground.
Titanium dioxide slag production declined 15% from the year-ago quarter, led by weak market conditions.
Rio Tinto’s Production Guidance for 2026
RIO expects Pilbara iron ore shipments (100% basis) at the lower end of 323-338 Mt.
The company retains its Bauxite’s guidance at 58-61 Mt. Alumina production is anticipated between 7.6 and 8 Mt, while aluminum production is expected to be 3.25-3.45 Mt for 2026. The copper output guidance remains unchanged at 800-870 kt.
RIO Share Price Performance
In a year, shares of the company have gained 64.2% compared with the industry’s 38.7% growth.
Image Source: Zacks Investment Research
Rio Tinto’s Peer Performances
BHP Group Limited BHP announced that its iron ore production dipped 3% year over year to 68.1 Mt in the fourth quarter of fiscal 2026 (ended June 30, 2026). However, the production increased 8% from the third quarter’s reported figure and 1% year over year, bringing the company’s total iron ore production for fiscal 2026 to a record 264.7 Mt. It came within its fiscal 2026 iron ore production guidance at 258-269 Mt.BHP Group’s copper output declined 5% year over year to 491.9 kt in the fourth quarter but increased 3% sequentially. The company’s fiscal 2026 copper output fell 3% year over year to 1,952.8 kt. BHP Group’s guidance for copper production for fiscal 2026 was 1,900-2,000 kt.
RIO’s Zacks Rank & Stocks to Consider
Rio Tinto currently carries a Zacks Rank #3 (Hold). Some better-ranked stocks from the basic materials space are Carpenter Technology Corporation CRS and Albemarle Corporation ALB. CRS sports a Zacks Rank #1 (Strong Buy) at present and ALB carries a Zacks Rank #2 (Buy). You can see the complete list of today’s Zacks #1 Rank stocks here.
Carpenter Technology has an average trailing four-quarter earnings surprise of 8.9%. The Zacks Consensus Estimate for Carpenter Technology’s 2026 earnings is pegged at $10.57 per share, indicating 41.3% year-over-year growth. Its shares have surged 101% in a year.
Albemarle has an average trailing four-quarter earnings surprise of 74.5%. The Zacks Consensus Estimate for the company’s 2026 earnings is pegged at $12.45 per share, indicating year-over-year growth from a loss of 79 cents. ALB shares have surged 66% so far this year.
Want the latest recommendations from Zacks Investment Research? Today, you can download 7 Best Stocks for the Next 30 Days. Click to get this free report
Rio Tinto PLC (RIO) : Free Stock Analysis Report
BHP Group Limited Sponsored ADR (BHP) : Free Stock Analysis Report
Carpenter Technology Corporation (CRS) : Free Stock Analysis Report
Albemarle Corporation (ALB) : Free Stock Analysis Report
This article originally published on Zacks Investment Research (zacks.com).
BHP Group Limited BHP announced that its iron ore production dipped 3% year over year to 68.1 Mt in the fourth quarter of fiscal 2026 (ended June 30, 2026). However, the production increased 8% from the third quarter’s reported figure and 1% year over year, bringing the company’s total iron ore production for fiscal 2026 to a record 264.7 Mt. It came within its iron ore production guidance of 258-269 Mt for fiscal 2026. The upside was driven by record production at Western Australia Iron Ore (“WAIO”) as a result of the strong operational performance. WAIO’s iron ore production was 256.9 Mt for fiscal 2026 (291.2 Mt on a 100% basis). This reflects solid supply-chain performance, along with a strong performance at South Flank. WAIO's production is expected between 253 Mt and 264 Mt (286 Mt and 298 Mt on a 100% basis) for fiscal 2027.
BHP’s FY26 Copper Output Within Guidance
The company’s opper output declined 5% year over year to 491.9 kt in the fourth quarter 2026 but increased 3% sequentially. BHP’s fiscal 2026 copper output fell 3% year over year to 1,952.8 kt. BHP’s guidance for copper production for fiscal 2026 was within 1,900-2,000 kt. Copper production at Escondida fell 3% year over year to 1,261.2 kt due to planned lower concentrator feed grade. This was partially offset by continued solid operational performance and productivity. Copper output at Pampa Norte was down 21% year over year to 212.6 kt in fiscal 2026. Production at Spence fell due to ongoing challenges with processing complex ore. Production was also impacted by Cerro Colorado remaining in care and maintenance throughout the year.Production from Copper South Australia was 320.7 kt, which marked a 2% rise from the prior fiscal quarter, aided by a strong operational performance. Antamina’s copper production rose 27% to record 151.5 kt in fiscal 2026 as a result of higher feed grades and improved operational performance.The company expects copper production of 1,650-1,800 kt for fiscal 2027.
BHP Group’s Energy & Steelmaking Coal Output Rises Y/Y
Energy coal production rose 3% year over year to 4.2 Mt in the fiscal fourth quarter, bringing the year’s total to 16.4 Mt. The fiscal 2026 energy coal production marked a 9% year-over-year increase. It came slightly above its production guidance of 14-16 Mt for fiscal 2026. Steelmaking coal production was 5.7 Mt, which increased 10% from the year-ago quarter. The fiscal 2026 production was up 3% year over year to 18.6 Mt. It came within its guidance of 18-20 Mt for fiscal 2026.
The production guidance for steelmaking coal is 18.5-20.5 Mt, while the energy coal guidance is 14-16 Mt for fiscal 2027.
BHP Sees Y/Y Growth in Average Prices
In the fiscal fourth quarter, average realized prices for iron ore were up 5% year over year to $83.58 per ton. Copper prices increased 47% year over year to $6.53 per pound. In fiscal 2024, average realized prices for iron ore grew 3% year over year to $84.56 per ton. Copper prices were up 35% to $5.74 per pound.
BHP Group’s Peer Performances
Rio Tinto Group RIO reported iron ore shipments from Pilbara (on a 100% basis) of 85.3 Mt for the second quarter of 2025, which increased 7% year over year. On a sequential basis, shipments rose 18%. Total iron ore production from Pilbara for the quarter was 83.5 Mt, in line with the year-ago quarter. This marked the highest first-half iron ore production at Pilbara since 2018.In the second quarter, Rio Tinto’s mined copper production was 213 thousand tons, 7% lower than the year-ago quarter. Production at Kennecott was 49% lower year over year due to lower cathode production. Copper production at Escondida decreased 13% year over year due to expected lower ore grades from the mine sequence.
BHP’s Price Performance
The company’s shares have surged 72.4% in a year compared with the industry’s 38.7% growth.
Image Source: Zacks Investment Research
BHP Group’s Zacks Rank & Stocks to Consider
BHP currently carries a Zacks Rank #3 (Hold).
Some better-ranked stocks from the basic materials space are Carpenter Technology Corporation CRS and Albemarle Corporation ALB. CRS sports a Zacks Rank #1 (Strong Buy) at present and ALB carries a Zacks Rank #2 (Buy). You can see the complete list of today’s Zacks #1 Rank stocks here.
Carpenter Technology has an average trailing four-quarter earnings surprise of 8.9%. The Zacks Consensus Estimate for Carpenter Technology’s 2026 earnings is pegged at $10.57 per share, indicating 41.3% year-over-year growth. Its shares have surged 101% in a year.
Albemarle has an average trailing four-quarter earnings surprise of 74.5%. The Zacks Consensus Estimate for the company’s 2026 earnings is pegged at $12.45 per share, indicating year-over-year growth from a loss of 79 cents. ALB shares have skyrocketed 66% so far this year.
Want the latest recommendations from Zacks Investment Research? Today, you can download 7 Best Stocks for the Next 30 Days. Click to get this free report
BHP Group Limited Sponsored ADR (BHP) : Free Stock Analysis Report
Rio Tinto PLC (RIO) : Free Stock Analysis Report
Carpenter Technology Corporation (CRS) : Free Stock Analysis Report
Albemarle Corporation (ALB) : Free Stock Analysis Report
This article originally published on Zacks Investment Research (zacks.com).
BHP has approved a $900 million (100% basis) investment to develop the Ministers North iron ore project in Western Australia's Pilbara, reinforcing its strategy to sustain long-term production from its flagship iron ore operations.
The project will develop the high-grade Brockman ore deposit as a satellite extension of the company's long-running Yandi mine, leveraging existing infrastructure to reduce development costs and improve operational efficiency. Once fully ramped up, Ministers North is expected to produce 20 million tonnes per annum, helping support BHP's medium-term iron ore production target of 305 million tonnes per year on a 100% basis.
Construction activities are scheduled to begin this month, with first ore targeted in fiscal 2029.
Development plans include a 13-kilometre haul road and land bridge linking Yandi and Ministers North, alongside upgrades to existing infrastructure and the installation of new primary and secondary crushers at Yandi.
BHP Western Australia Iron Ore Asset President Tim Day said the investment would extend the life of the company's Pilbara operations by utilizing established infrastructure, workforce expertise, and operational capabilities as the Yandi mine matures.
Ministers North is owned by a joint venture comprising BHP (85%), Itochu Corporation (8%) and Mitsui & Co. (7%), highlighting the partners' continued commitment to maintaining production capacity in one of the world's largest iron ore mining regions.
The approval comes as major Pilbara producers continue investing in replacement mines to offset the natural depletion of existing operations while preserving export volumes. Leveraging existing processing facilities and transport infrastructure has become a common strategy among Australian iron ore miners to lower capital costs and sustain long-term output.
By Charles Kennedy for Oilprice.com
More Top Reads From Oilprice.com
- India Hikes Diesel and Jet Fuel Export Tax
- Brent Futures Flip to Backwardation as Middle East Supply Risks Return
- U.S. Gasoline Prices Could Hit $4 Per Gallon Within Days
Oilprice Intelligence brings you the signals before they become front-page news. This is the same expert analysis read by veteran traders and political advisors. Get it free, twice a week, and you'll always know why the market is moving before everyone else.
You get the geopolitical intelligence, the hidden inventory data, and the market whispers that move billions – and we'll send you $389 in premium energy intelligence, on us, just for subscribing. Join 400,000+ readers today. Get access immediately by clicking here.
Company Executives Share Vision and Answer Questions Live at VirtualInvestorConferences.com
NEW YORK, July 16, 2026 (GLOBE NEWSWIRE) — Virtual Investor Conferences, the leading proprietary investor conference series, announced the agenda for the Precious Metals & Critical Minerals Virtual Investor Conference to be held July 22nd & 23rd, 2026.
Individual investors, institutional investors, advisors, and analysts are invited to attend.
It is recommended that investors pre-register and run the online system check to expedite participation and receive event updates. There is no cost to log-in, attend live presentations, or schedule 1×1 meetings with management.
Please Schedule 1×1 Meetings here.
"As global demand for precious metals and critical minerals continues to grow, this conference brings 28 companies together with a targeted investor audience through live presentations, interactive Q&A, and one-on-one meetings," said Greg Young, VP, Corporate Services, OTC Markets Group. "It’s an effective platform for companies to highlight their role in this evolving market and engage directly with investors."
Wednesday, July 22nd
| Presentation Time (ET) | Company | Tickers |
| 9:00 AM ET | Neometals Ltd. | (OTCQX: NMTAY | ASX: NMT) |
| 9:30 AM ET | AE Fuels Corporation | (OTCQB: NRGFF | TSXV: AEF) |
| 10:00 AM ET | Aurbis Resources Corp. | (OTCQB: QNICF | CSE: AURR) |
| 10:30 AM ET | Gemdale Gold Inc. | (OTCQB: GDGIF | TSXV: GEMG) |
| 11:00 AM ET | Liberty Gold Corp. | (OTCQX: LGDTF | TSX: LGD) |
| 11:30 AM ET | Viva Gold Corp. | (OTCQB: VAUCF | TSXV: VAU) |
| 12:00 PM ET | Evolve Royalties Ltd. | (OTCQX: EVRYF | CSE: EVR) |
| 12:30 PM ET | RUA Gold, Inc. | (OTCQX: NZAUF | TSX: RUA) |
| 1:00 PM ET | Cassiar Gold Corp. | (OTCQX: CGLCF | TSXV: GLDC) |
| 1:30 PM ET | Neo Performance Materials Inc. | (OTCQX: NOPMF | TSX: NEO) |
| 2:00 PM ET | District Metals Corp. | (OTCQX: DMXCF | TSXV: DMX) |
| 2:30 PM ET | Defense Metals Corp. | (OTCQB: DFMTF | TSXV: DEFN) |
| 3:00 PM ET | Camino Corp. | (OTCID: CAMZF | TSXV: COR) |
| 3:30 PM ET | North Arrow Minerals, Inc. | (OTCQB: NHAWF | TSXV: NAR) |
| 4:00 PM ET | Honey Badger Silver Inc. | (OTCQB: HBEIF | TSXV: TUF) |
Thursday, July 23rd
| Presentation Time (ET) | Company | Tickers |
| 9:30 AM ET | LaFleur Minerals Inc. | (OTCQB: LFLRF | CSE: LFLR) |
| 10:00 AM ET | Omai Gold Mines Corp. | (OTCQB: OMGGF| TSXV: OMG) |
| 10:30 AM ET | West Point Gold Corp. | (OTCQX: WPGCF | TSXV: WPG) |
| 11:00 AM ET | Outcrop Silver & Gold Corp. | (OTCQX: OCGSF | TSX: OCG) |
| 11:30 AM ET | American Critical Minerals Corp. | (OTCQB: APCOF | CSE: KCLI) |
| 12:00 PM ET | First Phosphate Corp. | (OTCQX: FRSPF, FPHOY | CSE: PHOS) |
| 12:30 PM ET | Neotech Metals Corp. | (OTCQB: NTMFF | CSE: NTMC) |
| 1:00 PM ET | Star Gold Corp. | (OTCQB: SRGZ) |
| 1:30 PM ET | Newcore Gold Ltd. | (OTCQX: NCAUF | TSXV: NCAU) |
| 2:00 PM ET | Sterling Metals Corp. | (OTCQB: SAGGF | TSXV: SAG) |
| 2:30 PM ET | 1911 Gold Corporation | (OTCQX: AUMBF | TSXV: AUMB) |
| 3:00 PM ET | Silverco Mining Ltd. | (OTCQB: SICOF | TSXV: SICO) |
| 4:00 PM ET | Four Nines Gold Inc. | (OTCQB: FNAUF | CSE: FNAU) |
To facilitate investor relations scheduling and to view a complete calendar of Virtual Investor Conferences, please visit www.virtualinvestorconferences.com.
About Virtual Investor Conferences®
Virtual Investor Conferences (VIC) is the leading proprietary investor conference series that provides an interactive forum for publicly traded companies to seamlessly present directly to investors.
Providing a real-time investor engagement solution, VIC is specifically designed to offer companies more efficient investor access. Replicating the components of an on-site investor conference, VIC offers companies enhanced capabilities to connect with investors, schedule targeted one-on-one meetings and enhance their presentations with dynamic video content. Accelerating the next level of investor engagement, Virtual Investor Conferences delivers leading investor communications to a global network of retail and institutional investors.
Media Contact: OTC Markets Group Inc. +1 (212) 896-4428, media@otcmarkets.com
Virtual Investor Conferences Contact:Greg YoungVP Corporate Services, Investor AccessOTC Markets Group(212) 652-5958greg@otcmarkets.com
The Basic Materials group has plenty of great stocks, but investors should always be looking for companies that are outperforming their peers. Is Nucor (NUE) one of those stocks right now? A quick glance at the company's year-to-date performance in comparison to the rest of the Basic Materials sector should help us answer this question.
Nucor is a member of the Basic Materials sector. This group includes 275 individual stocks and currently holds a Zacks Sector Rank of #13. The Zacks Sector Rank considers 16 different groups, measuring the average Zacks Rank of the individual stocks within the sector to gauge the strength of each group.
The Zacks Rank is a successful stock-picking model that emphasizes earnings estimates and estimate revisions. The system highlights a number of different stocks that could be poised to outperform the broader market over the next one to three months. Nucor is currently sporting a Zacks Rank of #2 (Buy).
The Zacks Consensus Estimate for NUE's full-year earnings has moved 43.3% higher within the past quarter. This means that analyst sentiment is stronger and the stock's earnings outlook is improving.
Based on the most recent data, NUE has returned 43.6% so far this year. Meanwhile, the Basic Materials sector has returned an average of 7.2% on a year-to-date basis. As we can see, Nucor is performing better than its sector in the calendar year.
One other Basic Materials stock that has outperformed the sector so far this year is Teck Resources Ltd (TECK). The stock is up 25.5% year-to-date.
Over the past three months, Teck Resources Ltd's consensus EPS estimate for the current year has increased 32.3%. The stock currently has a Zacks Rank #2 (Buy).
Looking more specifically, Nucor belongs to the Steel – Producers industry, a group that includes 17 individual stocks and currently sits at #72 in the Zacks Industry Rank. On average, stocks in this group have gained 31.3% this year, meaning that NUE is performing better in terms of year-to-date returns.
On the other hand, Teck Resources Ltd belongs to the Mining – Miscellaneous industry. This 85-stock industry is currently ranked #206. The industry has moved +13.6% year to date.
Investors with an interest in Basic Materials stocks should continue to track Nucor and Teck Resources Ltd. These stocks will be looking to continue their solid performance.
Want the latest recommendations from Zacks Investment Research? Today, you can download 7 Best Stocks for the Next 30 Days. Click to get this free report
Nucor Corporation (NUE) : Free Stock Analysis Report
Teck Resources Ltd (TECK) : Free Stock Analysis Report
This article originally published on Zacks Investment Research (zacks.com).
Nexa Resources S.A.’s NEXA Aripuanã mine delivered a second consecutive quarter of record zinc production in the first quarter of 2026, driven by higher grades. The mine produced 13,000 tons of zinc, a 4% increase from the previous record of 12,000 tons set in the fourth quarter of 2025.The Aripuanã mine is a long-life, tire-one asset for Nexa Resources that has been delivering steady performance. The mine began its ramp-up and achieved its first commercial sale in July 2022, reaching full operational status by July 2024. In the second half of 2025, the company commenced the fourth filter's arrival and installation. Installation of the fourth filter had concluded in the first quarter of 2026, which is expected to reduce the mine's reliance on weather conditions for tailings management.Nexa Resources is executing its long-term strategy to replace and expand its mineral reserves and resources. In sync with that, the company is moving forward with its disciplined exploration program focused on identifying orebodies and upgrading resource classifications through infill drilling campaigns. The efforts have already extended current life-of-mine plans across its portfolio, pushing Aripuanã’s life to 2041. The company expects the Aripuanã mine’s zinc production in 2026 to be 45,000-60,000 tons, indicating a 49% increase from the 2025 reported level. This will be driven by stable plant operations, the installation of the fourth filter and higher mining volumes. Zinc production is expected to increase 24% in 2027 to 60,000-70,000 tons, while it is expected to increase a further 7% in 2028, reaching 65,000-74,000 tons. Nexa Resources expects consolidated zinc production for 2026 to increase 6% from 2025. The company expects zinc production to grow 8% in 2027 from the 2026 reported level. The upside will be driven by higher production from Aripuanã, along with solid performances from the Atacocha and Vazante mines.
Nexa Resources Peers’ Outlook
Hudbay Minerals Inc. HBM expects zinc production of 16,000-21,000 tons in 2026, indicating an increase of 5% at the mid-point.Hudbay Minerals expects zinc production to increase to 29,000-36,000 tons by 2028, suggesting a 76% increase from the 2026 reported figure at the mid-point. The upside in Hudbay Minerals’ zinc production will be driven by higher production from the 1901 deposit.
Teck Resources Limited’s TECK production of zinc in concentrate declined to 120 thousand tons in the first quarter of 2026 from 137 thousand tons a year earlier, reflecting lower grades at Red Dog in line with the mine plan. Teck Resources expects zinc production to trend lower over the next three years as the mine approaches the end of its life. Teck Resources’ 2026 zinc production guidance is 410-460 thousand tons, whereas it produced 565 thousand tons in 2025.
NEXA’s Price Performance, Valuations & Estimates
Nexa Resources’ stock has rocketed 175.6% in a year, outperforming the Zacks Mining – Miscellaneous industry’s 36.3% return. Meanwhile, the Basic Materials sector has risen 24.7% and the S&P 500 has rallied 25.8%.
Image Source: Zacks Investment ResearchThe NEXA stock is currently trading at a forward 12-month earnings multiple of 5.08X, which is a discount to the industry average of 14.28X.
Image Source: Zacks Investment Research
The Zacks Consensus Estimate for Nexa Resources’ 2026 sales is $3.44 billion, indicating a 14.5% year-over-year jump. The consensus mark for the year’s earnings is pegged at $2.70 per share, suggesting a year-over-year upsurge of 217%.
The Zacks Consensus Estimate for 2027 sales implies a 6.5% year-over-year dip. The same for earnings suggests a rise of 0.7%.
EPS estimates for 2026 have moved 3.4% north over the past 60 days, while the same for 2027 has moved up 32% over the past 60 days.
Image Source: Zacks Investment Research
NEXA currently has a Zacks Rank #2 (Buy). You can see the complete list of today’s Zacks #1 Rank (Strong Buy) stocks here.
Want the latest recommendations from Zacks Investment Research? Today, you can download 7 Best Stocks for the Next 30 Days. Click to get this free report
Nexa Resources S.A. (NEXA) : Free Stock Analysis Report
HudBay Minerals Inc (HBM) : Free Stock Analysis Report
Teck Resources Ltd (TECK) : Free Stock Analysis Report
This article originally published on Zacks Investment Research (zacks.com).
By Karen Roman
Nova Minerals Corp. (NYSE: NVA) said it completed the engineering and design for a fully-funded antimony pilot processing plant in Alaska, the first step in fast-tracking domestic production that will enable future expansion and scalable processing for regional and global projects.
The plant is engineered to meet U.S. Department of War military-grade quality specifications, with construction expected to start this quarter, the company stated.
READ MORE
Defense AI Heats Up: BigBear.ai Lands First European Validation for AI-Powered Airport Screening
“We continue to make rapid progress on the antimony project and remain ahead of schedule, with another major milestone now completed,” said Mr. Christopher Gerteisen, Nova Minerals CEO. “Ore extraction and construction of the process plant are next steps as we continue progressing toward near-term antimony production.”
Never Miss our Weekly Highlights HERE
Contact:
Editor@IPO-Edge.com
Click HERE to follow us on LinkedIn
Nexa Resources S.A.’s NEXA Cajamarquilla smelter in Peru had to be temporarily suspended due to a fire on May 13. The fire damaged portions of the smelter's infrastructure. On the day of the incident, personnel were evacuated from the affected area as a safety precaution. The smelter gradually resumed production in late May, Nexa Resources expects a lost production impact of 7,000 tons of refined zinc, indicating 2% of annual production. Even though this is expected to reflect on its second-quarter performance, the company expects to recover the lost production in the second half of 2026.NEXA has kept its 2026 sales guidance intact. It expects consolidated zinc production to increase 6% at the mid-point from the 2025 reported level. The increase will be driven by increased output at the Aripuanã, Atacocha and Vazante mines. However, it will be partially offset by lower volumes at Cerro Lindo and El Porvenir due to mine sequencing that anticipates slightly lower grades.The company expects zinc production to increase 8% in 2027 from the 2026 reported level. 2028 zinc production is expected to be flat as higher production from the Atacocha, Aripuanã and Vazante mines will be offset by lower contributions from Cerro Lindo and El Porvenir.The company expects consolidated conversion costs for 2026 to remain flat year over year at 31-34 cents per pound. Higher output at Brazilian smelters, driven by plant recovery, process stabilization and roaster improvements, will be somewhat negated by lower production at the Cajamarquilla site.
Nexa Resources Peers’ Outlook
Hudbay Minerals Inc. HBM expects zinc production of 16,000-21,000 tons in 2026, indicating an increase of 5% at the mid-point. Zinc production in 2026 is expected to be flat with that reported in 2025. Hudbay Minerals expects zinc production to increase to 29,000-36,000 tons by 2028, suggesting a 76% increase from the 2026 reported figure at the mid-point. The upside in Hudbay Minerals’ zinc production will be driven by higher production from the 1901 deposit.Teck Resources Limited’s TECK production of zinc in concentrate declined to 120 thousand tons in the first quarter of 2026 from 137 thousand tons a year earlier, reflecting lower grades at Red Dog in line with the mine plan. Teck Resources expects zinc production to trend lower over the next three years as the mine approaches the end of its life. Teck Resources’ 2026 zinc production guidance is 410-460 thousand tons, whereas it produced 565 thousand tons in 2025.
NEXA’s Price Performance, Valuations & Estimates
Nexa Resources’ stock has rocketed 156.3% in a year, outperforming the Zacks Mining – Miscellaneous industry’s 33.7% return. Meanwhile, the Basic Materials sector has risen 23.5% and the S&P 500 has rallied 24.8%.
Image Source: Zacks Investment Research
The NEXA stock is currently trading at a forward 12-month earnings multiple of 5.02X, which is a discount to the industry average of 13.66X.
Image Source: Zacks Investment Research
The Zacks Consensus Estimate for Nexa Resources’ 2026 sales is $3.44 billion, indicating a 14.5% year-over-year jump. The consensus mark for the year’s earnings is pegged at $2.82 per share, suggesting a year-over-year upsurge of 231%.
The Zacks Consensus Estimate for 2027 sales implies a 9% year-over-year dip. The same for earnings suggests a fall of 16.9%.
EPS estimates for 2026 have moved 35.6% north over the past 60 days, while the same for 2027 has moved up 27.2% over the past 60 days.
Image Source: Zacks Investment Research
NEXA currently has a Zacks Rank #3 (Hold). You can see the complete list of today’s Zacks #1 Rank (Strong Buy) stocks here.
Want the latest recommendations from Zacks Investment Research? Today, you can download 7 Best Stocks for the Next 30 Days. Click to get this free report
Nexa Resources S.A. (NEXA) : Free Stock Analysis Report
HudBay Minerals Inc (HBM) : Free Stock Analysis Report
Teck Resources Ltd (TECK) : Free Stock Analysis Report
This article originally published on Zacks Investment Research (zacks.com).
Find your next quality investment with Simply Wall St’s easy and powerful screener, trusted by over 7 million individual investors worldwide.
Teck Resources (TSX:TECK.B) is back in focus after signing a large investment agreement with Canada Growth Fund and Natural Resources Canada to expand critical mineral production at its Trail Operations facility in British Columbia.
See our latest analysis for Teck Resources.
Despite the government backed funding news at Trail Operations and an upcoming Q2 2026 earnings release, Teck Resources’ recent momentum has cooled, with the 1 month share price return down 8.16% and the 7 day return down 5.82%. However, the year to date share price return of 20.55% and 1 year total shareholder return of 52.33% still point to stronger performance over a longer horizon.
If you are interested in how critical minerals and metals stories connect across the market, it could be worth scanning other producers through the 8 top copper producer stocks
The recent pullback in Teck Resources after government backed funding news raises a simple question: is the stock just giving back some sentiment driven heat, or are investors reassessing what the underlying business is worth today?
Most Popular Narrative: 6.4% Undervalued
At a last close of CA$79.55 versus a narrative fair value of CA$85.00, Teck Resources is framed as modestly undervalued, with that gap hinging on how convincingly its copper growth story plays out under an 8.23% discount rate.
The sanctioned Highland Valley Copper Mine Life Extension project and ongoing optimization/debottlenecking at QB are set to double Teck’s copper production by decade’s end, enabling the company to capitalize on the accelerating demand for copper from global electrification and energy transition, which should materially increase revenue and long-term earnings growth.
Curious what kind of revenue path and margin profile it takes to call Teck Resources modestly undervalued at today’s price? The most followed narrative leans on copper heavy volumes, steady profitability and a richer future earnings multiple that is usually reserved for faster growing sectors. The exact mix of growth, margins and discounting behind that CA$85.00 figure might surprise you.
Result: Fair Value of CA$85.00 (UNDERVALUED)
Have a read of the narrative in full and understand what’s behind the forecasts.
However, the Teck Resources narrative also leans on smooth execution at projects like QB2 and assumes copper and zinc prices hold up. Both of these assumptions could easily be tested.
Find out about the key risks to this Teck Resources narrative.
Another View on Teck Resources’ Valuation
The narrative fair value for Teck Resources suggests a modest gap to CA$85.00, but the SWS DCF model paints a different picture, with an estimate of CA$68.61 versus the current CA$79.55. That points to shares trading above that cash flow based value. Which story do you put more weight on?
Look into how the SWS DCF model arrives at its fair value.
TECK.B Discounted Cash Flow as at Jul 2026
Next Steps
If the split sentiment around Teck Resources has you undecided, it can help to move quickly, review the full picture, and weigh both sides for yourself with the 1 key reward and 1 important warning sign.
Looking for more investment ideas beyond Teck Resources?
If Teck Resources has sharpened your appetite for opportunities, do not stop here. Widen your search with a few focused stock ideas that could fit your style.
- Target resilient income by checking out 6 dividend fortresses that prioritise consistent payouts over speculation.
- Hunt for mispriced quality with the 6 high quality undervalued stocks that highlights companies combining solid finances with compressed valuations.
- Spot potential early movers using the screener containing 8 high quality undiscovered gems before they sit firmly on everyone else’s radar.
This article by Simply Wall St is general in nature. We provide commentary based on historical data
and analyst forecasts only using an unbiased methodology and our articles are not intended to be financial advice. It does not constitute a recommendation to buy or sell any stock, and does not take account of your objectives, or your
financial situation. We aim to bring you long-term focused analysis driven by fundamental data.
Note that our analysis may not factor in the latest price-sensitive company announcements or qualitative material.
Simply Wall St has no position in any stocks mentioned.
Companies discussed in this article include TECK-B.TO.
Have feedback on this article? Concerned about the content? Get in touch with us directly. Alternatively, email editorial-team@simplywallst.com
Vancouver, British Columbia–(Newsfile Corp. – July 9, 2026) – Intrepid Metals Corp. (TSXV: INTR) (OTCQB: IMTCF) ("Intrepid" or the "Company") is pleased to provide an update on the advancement of its integrated exploration program focused on defining high-priority porphyry copper-gold targets at its Corral Copper Project ("Corral" or the "Project") in Cochise County, Arizona. Building on the Company's successful identification of extensive carbonate replacement ("CRD") mineralization, Intrepid has continued to refine its understanding of the broader mineralizing system through an integrated exploration program undertaken with input from Teck Resources Limited ("Teck"). The next phase of work includes an approximately 65 line-kilometre induced polarization ("IP") survey, scheduled to commence in early August, ahead of the Company's planned September drill program, where approximately 5,000 metres ("m") of the planned 10,000m campaign are expected to be dedicated to testing priority porphyry targets.
"Our understanding of Corral continues to evolve with every phase of exploration," said Matt Lennox-King, Chairman and Interim CEO of Intrepid Metals. "While our previous drilling successfully demonstrated the scale and continuity of the CRD system, our 2026 work, undertaken in collaboration with Teck, has been focused on identifying the potential porphyry source that we believe drives that mineralization. While CRD mineralization can be economically significant on its own, a related porphyry system has the potential to represent a much larger mineralized system. By integrating the results of our geological, geochemical and geophysical programs, we are building the most comprehensive geological model assembled on the Project to date. This work will directly guide our first dedicated porphyry drill tests later this year."
Building the Porphyry Model
Initial drilling at Corral successfully demonstrated the presence of extensive CRD copper-gold-silver mineralization across multiple zones. CRD deposits commonly form when metal-rich fluids originating from a nearby porphyry intrusion migrate into favourable limestone host rocks, where they precipitate high-grade mineralization.
The Company's exploration model is based on geological similarities between Corral and Arizona's historic Bisbee Mining District, where extensive CRD mineralization is spatially associated with a significant porphyry copper system. Intrepid's 2026 exploration program has been designed to systematically evaluate whether a similar relationship exists at Corral through an integrated program of geological mapping, surface geochemistry, structural interpretation, drill core relogging and geophysical surveys.
Regional Analogue – Bisbee Mining District
The Corral Copper Project was acquired by Intrepid in 2023 based on its potential to host both near-surface, high-grade CRD copper-gold-silver mineralization and a related porphyry copper-gold system. This exploration model is supported by geological similarities to Arizona's historic Bisbee Mining District, located approximately 100 kilometres southeast of Corral, where high-grade CRD mineralization at the Copper Queen Mine (approximately 53 Mt grading 6% copper1) occurs in association with the Lavender Pit porphyry deposit (223 Mt grading 0.63% copper2).
Like Bisbee, Corral hosts widespread CRD mineralization spatially associated with Jurassic felsic intrusions emplaced into favourable Paleozoic carbonate rocks. While there is no assurance that Corral hosts mineralization similar in size or grade, these geological similarities support the Company's belief that the Project has the potential to host both styles of mineralization.
Technical Review Refines Porphyry Targeting
As part of the Company's integrated exploration program, Intrepid completed a comprehensive review and relogging of drill core, together with targeted field investigations aimed at refining its understanding of the Project's porphyry potential. This work included characterization of alteration styles, veining, intrusive lithologies and mineralization, supported by portable X-Ray Fluorescence ("pXRF") analyses and evaluation of porphyry vectoring indicators across the Project.
The review has strengthened the Company's geological model through the identification of multiple porphyry-style features, including intrusive-related alteration, quartz-sericite-pyrite ("QSP") alteration, stockwork veining, molybdenum-bearing mineralization and porphyry-style vein textures. These observations, combined with geological mapping, surface sampling and structural interpretation, have helped refine priority target areas that will be further evaluated through the upcoming IP survey and planned porphyry drill program.
Upcoming IP Survey
The next phase of the exploration program will include an approximately 65 line-kilometre IP survey, scheduled to commence in early August. The survey is designed to identify chargeability and resistivity anomalies that may represent sulphide-rich intrusive centres at depth and will provide an important dataset for refining the location and orientation of planned drill holes.
Planned Drill Program
Following completion and interpretation of the IP survey, Intrepid expects to commence its September drill program, with approximately half of the planned 10,000m drill campaign dedicated to testing porphyry targets. The remaining drilling will continue to evaluate and expand the extensive CRD mineralization previously identified across the Project.
Figure 1: Strongly quartz-sericite-pyrite altered intrusive at Corral Copper
To view an enhanced version of this graphic, please visit:https://images.newsfilecorp.com/files/6187/304558_4341be5e4468397f_001full.jpg
Technical Information
All scientific and technical information in this news release has been prepared by, or approved by Daniel MacNeil, P.Geo. Mr. MacNeil is a Technical Advisor to the Company and is a qualified person for the purposes of National Instrument 43-101 – Standards of Disclosure for Mineral Projects.
About Intrepid Metals Corp.
Intrepid Metals Corp. is focused on exploring for high-grade essential metals, including copper, silver, and zinc, in established mining jurisdictions in southeastern Arizona, USA. The Company's portfolio is anchored by the Corral Copper Property, an advanced exploration-stage, district-scale system with extensive drilling and significant shallow results, complemented by the Tombstone South and Mesa Well Properties. Intrepid is led by an experienced technical and management team with a strong track record of advancing and permitting projects across North America. The Company trades on the TSX Venture Exchange under the symbol "INTR" and on the OTCQB Venture Market under the symbol "IMTCF". For more information, visit www.intrepidmetals.com.
INTREPID METALS CORP.
On behalf of the Company"Matthew Lennox-King"Chairman & Interim-CEO
For further information regarding this news release, please contact:
Matthew Lennox-King, Chairman & Interim CEOEvelyn Cox, VP Corporate Development604-681-8030invest@intrepidmetals.com
Notes
1 Briggs, D.F., 2015, History of the Warren (Bisbee) Mining District, Arizona Geological Survey Contributed Report CR15b,8 p. https://data.azgs.arizona.edu/api/v1/collections/AGCR-1552428249591-961/cr-15-b_v1.0.pdf
2 Lewis, K., 2022, Geology and Mineralization of the Undeveloped Cochise Supergene Porphyry Copper Deposit, Warren (Bisbee) Mining District, Cochise County, Arizona, The University of Arizona, MSc thesis, 104 pages.
Cautionary Note Regarding Forward-Looking Information
Certain statements contained in this release constitute forward-looking information within the meaning of applicable Canadian securities laws. Such forward-looking statements relate to: the potential of the property; the timeline, goals and expectations regarding planned exploration and drilling programs at the Company's mineral projects; the timing and details of the planned IP survey; the timing and details of the planned Phase 2 drill program; the interpretation of exploration results; that Corral demonstrates the characteristics of a large-scale mineralized system with multiple target opportunities; the mineral potential of the Corral district; and the exploration potential of the Corral Copper Property and the Company's other mineral projects.
In certain cases, forward-looking information can be identified by the use of words such as "plans", "expects", "budget", "scheduled", "estimates", "forecasts", "intends", "anticipates" or "believes", or variations of such words and phrases or state that certain actions, events or results "may", "could", "would", "might", "occur" or "be achieved" suggesting future outcomes, or other expectations, beliefs, plans, objectives, assumptions, intentions or statements about future events or performance. Forward-looking information contained in this news release is based on certain factors and assumptions regarding, among other things, the Company can raise additional financing to continue operations; the results of exploration activities, commodity prices, the timing and amount of future exploration and development expenditures, the availability of labour and materials, receipt of and compliance with necessary regulatory approvals and permits, the estimation of insurance coverage, and assumptions with respect to currency fluctuations, environmental risks, title disputes or claims, and other similar matters. While the Company considers these assumptions to be reasonable based on information currently available to it, they may prove to be incorrect.
Forward-looking information involves known and unknown risks, uncertainties and other factors which may cause the actual results, performance or achievements of the Company to be materially different from any future results, performance or achievements expressed or implied by the forward-looking information. Such factors include risks inherent in the exploration and development of mineral deposits, including risks relating to the ability to access infrastructure, risks relating to the failure to access financing, risks relating to changes in commodity prices, risk related to unanticipated geological or structural formations and characteristics risks related to current global financial conditions, risks related to current global financial conditions and the impact of any future global pandemic on the Company's business, reliance on key personnel, operational risks inherent in the conduct of exploration and development activities, including the risk of accidents, labour disputes and cave-ins, regulatory risks including the risk that permits may not be obtained in a timely fashion or at all, financing, capitalization and liquidity risks, risks related to disputes concerning property titles and interests, environmental risks and the additional risks identified in the "Risk Factors" section of the Company's reports and filings with applicable Canadian securities regulators.
Although the Company has attempted to identify important factors that could cause actual actions, events or results to differ materially from those described in forward-looking information, there may be other factors that cause actions, events or results not to be as anticipated, estimated or intended. Accordingly, readers should not place undue reliance on forward-looking information. The forward-looking information is made as of the date of this news release. Except as required by applicable securities laws, the Company does not undertake any obligation to publicly update or revise any forward-looking information.
Neither the TSX Venture Exchange nor its Regulation Services Provider (as that term is defined in the policies of the TSX Venture Exchange) has reviewed or accepts responsibility for the adequacy or accuracy of this release.
To view the source version of this press release, please visit https://www.newsfilecorp.com/release/304558
- Teck Resources, Canada Growth Fund and Natural Resources Canada previously signed a Strategic Investment Agreement to support up to CA$400 million of equity-like funding into Teck’s Trail Operations in British Columbia, as part of a potential CA$850 million program to expand germanium, gallium and antimony processing capacity.
- The deal, which includes future offtake rights for Ottawa and marks the first transaction under the Canada Critical Minerals Accelerator, could reinforce Canada’s role as a secure supplier of high‑importance metals for technology and defence applications.
- We’ll now examine how this government-backed expansion of Trail’s critical minerals capacity may influence Teck’s existing copper-focused investment narrative.
Find 6 companies with promising cash flow potential yet trading below their fair value.
Teck Resources Investment Narrative Recap
To own Teck today, you generally have to believe in its copper led growth story while accepting exposure to metals price swings, project execution risk and capital intensive expansions. The Trail critical minerals agreement adds a government backed growth option but does not displace the near term focus on stable operations at core copper assets and disciplined project spending, where cost inflation and delays remain the most important near term risk to the business.
The Trail announcement sits alongside Teck’s upcoming Q2 2026 earnings release on 23 July, which many investors will watch for updated guidance on capital spending, cash flow and operating performance. Taken together, the Trail agreement and the next earnings update could shape how investors weigh Teck’s copper focused narrative against its emerging role in critical minerals processing and the financial demands of expanding that capability.
Yet investors should also be aware that cost inflation and project delays could still pressure cash flows and returns…
Read the full narrative on Teck Resources (it's free!)
Teck Resources' narrative projects CA$12.7 billion revenue and CA$2.0 billion earnings by 2029. This requires flat yearly revenue growth and roughly CA$0.1 billion earnings increase from CA$1.9 billion today.
Uncover how Teck Resources' forecasts yield a CA$85.00 fair value, a 7% upside to its current price.
Exploring Other PerspectivesTSX:TECK.B 1-Year Stock Price Chart
Some of the lowest analysts were already projecting revenue to fall about 7.6% a year and earnings to drop toward CA$354.4 million, a far more pessimistic view than the baseline narrative, and this Trail agreement might eventually challenge or reinforce that outlook depending on how you judge regulatory and project execution risk.
Explore 4 other fair value estimates on Teck Resources – why the stock might be worth 30% less than the current price!
Reach Your Own Conclusion
Don't just follow the ticker – dig into the data and build a conviction that's truly your own.
- A great starting point for your Teck Resources research is our analysis highlighting 1 key reward and 1 important warning sign that could impact your investment decision.
- Our free Teck Resources research report provides a comprehensive fundamental analysis summarized in a single visual – the Snowflake – making it easy to evaluate Teck Resources' overall financial health at a glance.
Curious About Other Options?
Every day counts. These free picks are already gaining attention. See them before the crowd does:
- Uncover the next big thing with 11 elite penny stocks that balance risk and reward.
- Capitalize on the AI infrastructure supercycle with our selection of the 52 best 'picks and shovels' of the AI gold rush converting record-breaking demand into massive cash flow.
- The latest GPUs need a type of rare earth metal called Dysprosium and there are only 29 companies in the world exploring or producing it. Find the list for free.
This article by Simply Wall St is general in nature. We provide commentary based on historical data
and analyst forecasts only using an unbiased methodology and our articles are not intended to be financial advice. It does not constitute a recommendation to buy or sell any stock, and does not take account of your objectives, or your
financial situation. We aim to bring you long-term focused analysis driven by fundamental data.
Note that our analysis may not factor in the latest price-sensitive company announcements or qualitative material.
Simply Wall St has no position in any stocks mentioned.
Companies discussed in this article include TECK-B.TO.
Have feedback on this article? Concerned about the content? Get in touch with us directly. Alternatively, email editorial-team@simplywallst.com
VANCOUVER, British Columbia, July 08, 2026 (GLOBE NEWSWIRE) — Teck Resources Limited (TSX: TECK.A and TECK.B, NYSE: TECK) (“Teck”) will release its second quarter 2026 earnings results before market open on Thursday, July 23, 2026.
A webcast to review the results will be held as follows:
| Date: | Thursday, July 23, 2026 |
| Time: | 8:00 a.m. PT / 11:00 a.m. ET |
| Listen-Only Webcast: | here |
| Dial In for Investor & Analyst Q&A: | 1.647.846.8877 or 1.833.752.3828Quote “Teck Resources”, to join the call |
| Alternate, pre-register to the call for Q&A: | registration link |
An archive of the webcast will be available at teck.com within 24 hours.
About TeckTeck is a leading Canadian resource company focused on responsibly providing metals essential to economic development and the energy transition. Teck has a portfolio of world-class copper and zinc operations across North and South America and an industry-leading copper growth pipeline. We are focused on creating value by advancing responsible growth and ensuring resilience built on a foundation of stakeholder trust. Headquartered in Vancouver, Canada, Teck’s shares are listed on the Toronto Stock Exchange under the symbols TECK.A and TECK.B and the New York Stock Exchange under the symbol TECK. Learn more about Teck at www.teck.com or follow @TeckResources.
Investor Contact:Ellen LaiCoordinator, Investor Relations604.699.4257ellen.lai@teck.com
Media Contact:Dale SteevesDirector, External Communications236.987.7405 dale.steeves@teck.com
Toronto, Ontario–(Newsfile Corp. – July 6, 2026) – Honey Badger Silver Inc. (TSXV: TUF) (OTCQB: HBEIF) (FSE: 1QA) (Tradegate: 1QA) ("Honey Badger Silver" or the "Company") is pleased to announce that members of its management team will attend the 2026 Rule Symposium on Natural Resource Investing taking place July 6-10, 2026 in Boca Raton, Florida.
The Rule Symposium brings together leading natural resource investors, analysts, newsletter writers, company executives and industry participants, with a particular focus on precious metals, critical minerals and resource investment opportunities.
Honey Badger Silver will use the conference to meet with existing shareholders, prospective investors and strategic industry participants as the Company continues to advance the PC Silver Mine in the Northwest Territories, one of Canada's most advanced, high-grade silver-zinc-lead mine restarts.
The Company recently acquired the PC Silver Mine and has initiated work on an updated NI 43-101 technical report and Preliminary Economic Assessment. The PC Silver Mine benefits from extensive historical investment, existing underground development, significant prior technical work, established permitting, and agreements with Indigenous partners in the region. In addition to silver, zinc, lead and copper, the Company is also evaluating the project's potential germanium content, further strengthening its relevance to Canada's and the United States' critical minerals strategies.
"We are looking forward to attending the Rule Symposium and introducing Honey Badger Silver's expanded story to a highly sophisticated natural resource investor audience," said Chad Williams, Chairman and Interim Chief Executive Officer of Honey Badger Silver. "With the acquisition of the PC Silver Mine, Honey Badger Silver has transformed into a company anchored by a large, advanced-stage Canadian silver and critical minerals asset. This is an ideal venue to communicate the scale of the opportunity, our near-term technical milestones, and our strategy to advance the project in partnership with Indigenous communities, governments and strategic capital providers."
Investors attending the conference who wish to meet with Honey Badger Silver are encouraged to contact the Company at investors@honeybadgersilver.com to arrange a meeting.
About Honey Badger Silver (TSXV: TUF) (OTCQB: HBEIF) (FSE: 1QA) (Tradegate: 1QA)
Silver is rare and valuable. Honey Badger Silver controls some of Canada's richest untapped silver potential. With the acquisition of the fully permitted, high-grade PC Silver Mine, the Company has become a leading North American silver and critical minerals company.
Backed by an impressive portfolio of 8 high-quality silver mineral projects in Canada, including the Sunrise Lake, Plata, and Nanisivik properties, Honey Badger Silver controls district-scale land positions in some of the most metal-rich jurisdictions on the continent.
What sets Honey Badger Silver apart is its strategic blend of real silver ownership and growth leverage: the Company holds 10,000 ounces of physical silver yielding 12% annually, reinforcing tangible asset value while advancing aggressive exploration and acquisition plans.
Led by a proven team of mine-builders and capital markets professionals, Honey Badger Silver is building a cash-generating, asset-backed platform for the bull cycle in precious and critical minerals.
More information is available at www.honeybadgersilver.com
Chad WilliamsExecutive Chairman, Interim CEO
Investor Relationsinvestors@honeybadgersilver.com | +1 (647) 226-7315
Neither the TSX Venture Exchange nor its Regulation Services Provider (as that term is defined in the policies of the TSX Venture Exchange) accepts responsibility for the adequacy or accuracy of this release.
Cautionary Note Regarding Forward-Looking Information
This news release contains "forward-looking information" within the meaning of the applicable Canadian securities legislation that is based on expectations, estimates, projections and interpretations as at the date of this news release. Any statement that involves discussions with respect to predictions, expectations, interpretations, beliefs, plans, projections, objectives, assumptions, future events or performance (often but not always using phrases such as "expects", or "does not expect", "is expected", "interpreted", "management's view", "anticipates" or "does not anticipate", "plans", "budget", "scheduled", "forecasts", "estimates", "believes" or "intends" or variations of such words and phrases or stating that certain actions, events or results "may" or "could", "would", "might" or "will" be taken to occur or be achieved) are not statements of historical fact and may be forward-looking information and are intended to identify forward-looking information. This forward-looking information is based on reasonable assumptions and estimates of management of the Company at the time such assumptions and estimates were made, and involves known and unknown risks, uncertainties and other factors which may cause the actual results, performance or achievements of Honey Badger to be materially different from any future results, performance or achievements expressed or implied by such forward-looking information.
Such factors include, but are not limited to, risks relating to capital and operating costs varying significantly from estimates; delays in obtaining or failures to obtain required governmental, environmental or other project approvals; uncertainties relating to the availability and costs of financing needed in the future; changes in equity markets; inflation; fluctuations in commodity prices; delays in the development of projects; other risks involved in the mineral exploration and development industry; and those risks set out in the Company's public documents filed on SEDAR+ (www.sedarplus.ca) under Honey Badger's issuer profile. Although the Company believes that the assumptions and factors used in preparing the forward-looking information in this news release are reasonable, undue reliance should not be placed on such information, which only applies as of the date of this news release, and no assurance can be given that such events will occur in the disclosed timeframes or at all. The Company disclaims any intention or obligation to update or revise any forward-looking information, whether as a result of new information, future events or otherwise, other than as required by law.
To view the source version of this press release, please visit https://www.newsfilecorp.com/release/303965
VANCOUVER, British Columbia, July 02, 2026 (GLOBE NEWSWIRE) — GoldHaven Resources Corp. ("GoldHaven" or the "Company") (CSE: GOH) (OTCQB: GHVNF) (FSE: 4QS) is pleased to announce that it has executed a drilling services agreement with Northtech Drilling Ltd. ("Northtech") to conduct the Company's fully funded inaugural diamond drill program at its 100%-owned Magno Project, located in the prolific Cassiar District of northern British Columbia.
Highlights:
- GoldHaven engages Northtech Drilling Ltd. for its inaugural drill program at the Magno Project.
- Initial 5,000–7,000 metre diamond drill program planned, subject to final permitting.
- Program to test historical tungsten mineralization and high-priority targets generated from the recently completed airborne QMAGT survey.
- Northtech has completed over 600,000 metres of drilling with more than 300 years of combined crew experience.
- Northtech has successfully drilled for major and junior mining companies, including De Beers, Anglo American, BHP and MMG Resources.
The upcoming drill program is expected to commence upon receipt of final exploration permits and will initially comprise approximately 5,000 to 7,000 metres of diamond drilling, with a minimum commitment of 3,000 metres, targeting the Company's priority tungsten, silver, zinc, lead, copper and indium mineralization. The agreement contemplates mobilization around August 1, 2026, subject to permitting and mutually agreed scheduling.
The drill program has been designed to verify and expand historical tungsten mineralization at the Kuhn Zone while testing additional high-priority targets generated through the recently completed district-scale airborne QMAGT geophysical survey, which covered more than 2,300-line kilometres across the Company's expanded Magno Project.
Experienced Northern Drilling Contractor
Northtech Drilling is a northern Canadian drilling contractor with more than two decades of operational experience and has completed over 600,000 metres of diamond drilling across Canada. The company brings over 300 years of combined crew experience and has successfully completed exploration programs for numerous major and junior mining companies, including De Beers, Anglo American, BHP, Kennady Diamonds, Yukon Zinc, NorZinc, MMG Resources, North Arrow Minerals, Blue Star Gold and others.
Rob Birmingham, President & CEO of GoldHaven, commented:
"Securing Northtech is another important milestone as we continue preparing for our inaugural drill campaign at Magno. Their extensive experience operating in northern Canada, combined with a proven track record on technically challenging exploration projects, makes them an excellent partner as we begin testing what we believe is one of the most compelling critical minerals exploration opportunities in the Cassiar District.”
”With financing complete, our district-scale airborne survey now finished, and a drilling contractor in place, we are entering the final stages of preparation ahead of drilling. We look forward to mobilizing as soon as permits are received."
2026 Drill Program
The inaugural drill campaign is expected to focus on several priority target areas across the Magno Project, including:
- Verification and expansion of the historical Kuhn tungsten skarn mineralization;
- Testing interpreted extensions of known tungsten-bearing skarn horizons;
- Initial drill testing of targets generated from the recently completed airborne QMAGT magnetic survey;
- Evaluation of additional silver-lead-zinc CRD and intrusion-related targets identified across the district-scale land package.
The Company believes the combination of historical drilling, high-grade surface sampling, extensive airborne geophysics and geological modelling provides a strong foundation for the upcoming exploration program.
Qualified Person:
The technical and scientific information contained in this news release has been reviewed and approved by Raymond Wladichuk P.Geo. who is a non-independent Qualified Person as defined under NI 43-101 and a consultant of the Company.
Equity Incentive Grant:
The Company has granted 750,000 Restricted Share Units ("RSUs") to an officer of the Company pursuant to its Omnibus Equity Incentive Plan (the “Plan”). The RSUs shall vest in equal monthly installments over a period of thirty-six (36) months, subject to the terms of the Plan and the continued service of the recipient.
Marketing:
The Company also announces that it has entered into a marketing services agreement with X Media Inc. SEZC ("X Media") effective July 1, 2026, pursuant to which X Media will provide digital marketing, investor awareness and public relations services for a six-month term. Services may include editorial placements, public relations distribution, influencer and investor network distribution, digital advertising campaigns, investor-focused landing pages, email capture and database growth systems, retargeting, and related marketing activities.
The Company has agreed to pay X Media a total of US$500,000 for the six-month campaign. Melissa Destarac, CEO of X Media, will oversee the services provided to the Company.
X Media and its principals are arm's length to the Company and, to the knowledge of the Company, neither X Media nor its principals own any securities of the Company. X Media is headquartered in George Town, Grand Cayman, Cayman Islands.
About GoldHaven Resources Corp.
GoldHaven Resources Corp. is a Canadian junior exploration company focused on advancing highly prospective mineral projects in North and South America. The Company’s flagship asset is the district-scale Magno Project in the Cassiar District of northern British Columbia. GoldHaven also owns the Three Guardsmen copper-gold project in British Columbia and the Copeçal Gold Project in Mato Grosso, Brazil. In addition, the Company holds a portfolio of critical mineral projects in Brazil.
On Behalf of the Board of Directors
Rob Birmingham, Chief Executive Officer
For further information, please contact: Rob Birmingham, CEOwww.GoldHavenresources.cominfo@goldhavenresources.comOffice Direct: (604) 629-8254
Neither the CSE nor its Regulation Services Provider (as that term is defined in the policies of the CSE- Canadian Securities Exchange) accepts responsibility for the adequacy or accuracy of this release.
Cautionary Statements Regarding Forward Looking Information
This news release contains forward-looking statements and forward-looking information (collectively, "forward looking statements") within the meaning of applicable Canadian and U.S. securities legislation, including the United States Private Securities Litigation Reform Act of 1995. All statements, other than statements of historical fact, included herein including, without limitation, those listed below under the heading “Forward-Looking Statements in This News Release” are forward-looking statements. Although the Company believes that such statements are reasonable, it can give no assurance that such expectations will prove to be correct. Forward-looking statements are typically identified by words such as: "believes", "will", "expects", "anticipates", "intends", "estimates", "plans", "may", "should", "potential", "scheduled", or variations of such words and phrases and similar expressions, which, by their nature, refer to future events or results that may, could, would, might or will occur or be taken or achieved. In making the forward-looking statements in this news release, the Company has applied several material assumptions, including without limitation, that there will be investor interest in future financings, market fundamentals will result in sustained precious metals demand and prices, the receipt of any necessary permits, licenses and regulatory approvals in connection with the future exploration and development of any future projects in a timely manner, the availability of financing on suitable terms for exploration and development of future projects and the Company's ability to comply with environmental, health and safety laws.
The Company cautions investors that any forward-looking statements by the Company are not guarantees of future results or performance, and that actual results may differ materially from those in forward-looking statements as a result of various factors, including, operating and technical difficulties in connection with mineral exploration and development activities, actual results of exploration activities, the estimation or realization of mineral reserves and mineral resources, the inability of the Company to obtain the necessary financing required to conduct its business and affairs, as currently contemplated, the inability of the Company to enter into definitive agreements in respect of possible Letters of Intent, the timing and amount of estimated future production, the costs of production, capital expenditures, the costs and timing of the development of new deposits, requirements for additional capital, future prices of precious metals, changes in general economic conditions, changes in the financial markets and in the demand and market price for commodities, lack of investor interest in future financings, accidents, labour disputes and other risks of the mining industry, delays in obtaining governmental approvals, permits or financing or in the completion of development or construction activities, changes in laws, regulations and policies affecting mining operations, title disputes, the inability of the Company to obtain any necessary permits, consents, approvals or authorizations, including by the Exchange, the timing and possible outcome of any pending litigation, environmental issues and liabilities, and risks related to joint venture operations, and other risks and uncertainties disclosed in the Company's latest interim Management's Discussion and Analysis and filed with certain securities commissions in Canada. All of the Company's Canadian public disclosure filings may be accessed via www.sedarplus.ca and readers are urged to review these materials.
Readers are cautioned not to place undue reliance on forward-looking statements. The Company undertakes no obligation to update any of the forward-looking statements in this news release or incorporated by reference herein, except as otherwise required by law.
Forward-Looking Statements in This News Release
The following statements in this news release constitute forward-looking information:
- the Company’s diamond drill program is expected to commence upon receipt of final exploration permits and to comprise approximately 5,000 to 7,000 metres, with a minimum commitment of 3,000 metres;
- mobilization of the drill program is expected to occur around August 1, 2026, subject to permitting and mutually agreed scheduling;
- the drill program is designed to verify and expand historical tungsten mineralization at the Kuhn Zone and to test additional high-priority targets identified through the Company’s airborne QMAGT survey;
- the inaugural drill campaign is expected to focus on verification of historical Kuhn tungsten skarn mineralization, testing of interpreted skarn extensions, initial testing of QMAGT-generated targets, and evaluation of additional silver-lead-zinc CRD and intrusion-related targets;
- the Company believes the combination of historical drilling, surface sampling, airborne geophysics and geological modelling provides a strong foundation for the upcoming exploration program;
- the 750,000 RSUs granted to an officer of the Company will vest in equal monthly installments over thirty-six months, subject to the recipient’s continued service;
- X Media will provide digital marketing, investor awareness and public relations services to the Company for a six-month term.
TORONTO, July 02, 2026 (GLOBE NEWSWIRE) — Wallbridge Mining Company Limited (TSX:WM, OTCQB:WLBMF) (“Wallbridge” or the “Company”) announces that it has temporarily evacuated the camp at its 100% owned Fenelon Gold project (“Fenelon”) and suspended all drilling and related exploration activities on its Detour-Fenelon Gold Trend Property following an evacuation order issued by SOPFEU (Société de protection des forêts contre le feu) and Quebec’s Ministère des Ressources naturelles et des Forêts due to increasing wildland fire danger in the area.
"The health and safety of our employees and contractors is our highest priority," said Brian Penny, CEO of Wallbridge. "Immediately upon receiving the evacuation order from SOPFEU late afternoon on July 1, we activated our emergency response procedures and safely evacuated all site personnel to Amos, Quebec. I thank the entire Fenelon project team for their professionalism, discipline, and exceptional response in carrying out a safe and orderly evacuation under rapidly evolving circumstances. The Company will continue to monitor conditions closely and will resume exploration activities when authorities determine it is safe to do so."
Information pertaining to the status of the forest fires in Quebec can be found here: https://www.sopfeu.qc.ca/en/current-situation/
About Wallbridge Mining
Wallbridge is focused on creating value through the exploration and sustainable development of gold projects in Quebec’s Abitibi region while respecting the environment and communities where it operates. The Company holds a contiguous mineral property position totaling 598 km2 that extends approximately 82 km along the Detour-Fenelon gold trend. The property is host to the Company’s flagship PEA stage Fenelon Gold Project, and its earlier exploration stage Martiniere Gold Project, as well as numerous greenfield gold projects.
For further information please visit the Company’s website at https://wallbridgemining.com/ or contact:
| Brian Penny, CPA, CMAChief Executive OfficerEmail: bpenny@wallbridgemining.comM: +1 416 716 8346 | Tania Barreto, CPIRDirector, Investor RelationsEmail: tbarreto@wallbridgemining.comM: +1 416 289 3012 |
Cautionary Note Regarding Forward-Looking Information
The information in this document may contain forward-looking statements or information (collectively, “FLI”) within the meaning of applicable Canadian securities legislation. FLI is based on expectations, estimates, projections and interpretations as at the date of this document.
All statements, other than statements of historical fact, included herein are FLI that involve various risks, assumptions, estimates and uncertainties. Generally, FLI can be identified by the use of statements that include, but are not limited to, words such as “seeks”, “believes”, “anticipates”, “plans”, “continues”, “budget”, “scheduled”, “estimates”, “expects”, “forecasts”, “intends”, “projects”, “predicts”, “proposes”, "potential", “targets” and variations of such words and phrases, or by statements that certain actions, events or results “may”, “will”, “could”, “would”, “should” or “might”, “be taken”, “occur” or “be achieved.”
FLI in this document may include, but is not limited to: statements regarding the return of personnel to the Fenelon site and the resumption of exploration activities.
FLI is designed to help you understand management’s current views of its near- and longer-term prospects, and it may not be appropriate for other purposes. FLI by their nature are based on assumptions and involve known and unknown risks, uncertainties and other factors which may cause the actual results, performance, or achievements of the Company to be materially different from any future results, performance or achievements expressed or implied by such FLI. Although the FLI contained in this document is based upon what management believes, or believed at the time, to be reasonable assumptions, the Company cannot assure shareholders and prospective purchasers of securities of the Company that actual results will be consistent with such FLI, as there may be other factors that cause results not to be as anticipated, estimated or intended, and neither the Company nor any other person assumes responsibility for the accuracy and completeness of any such FLI. Except as required by law, the Company does not undertake, and assumes no obligation, to update or revise any such FLI contained in this document to reflect new events or circumstances. Unless otherwise noted, this document has been prepared based on information available as of the date of this document. Accordingly, you should not place undue reliance on the FLI, or information contained herein.
Furthermore, should one or more of the risks, uncertainties or other factors materialize, or should underlying assumptions prove incorrect, actual results may vary materially from those described in FLI.
Assumptions upon which FLI is based, without limitation, include: the results of exploration activities, the Company’s financial position and general economic conditions; the ability of exploration activities to accurately predict mineralization; the accuracy of geological modelling; the ability of the Company to complete further exploration activities; the legitimacy of title and property interests in the Company’s mineral projects; the accuracy of key assumptions, parameters or methods used to estimate MREs and PEAs; the ability of the Company to obtain required approvals; geological, mining and exploration technical problems; failure of equipment or processes to operate as anticipated; the evolution of the global economic climate; metal prices; foreign exchange rates; environmental expectations; community and non-governmental actions; and, the Company’s ability to secure required funding. Risks and uncertainties about Wallbridge's business are discussed in the disclosure materials filed with the securities regulatory authorities in Canada, which are available at www.sedarplus.ca.
Cautionary Notes to United States Investors
Wallbridge prepares its disclosure in accordance with NI 43-101 which differs from the requirements of the U.S. Securities and Exchange Commission (the “SEC”). Terms relating to mineral properties, mineralization and estimates of mineral reserves and mineral resources and economic studies used herein are defined in accordance with NI 43-101 under the guidelines set out in CIM Definition Standards on Mineral Resources and Mineral Reserves, adopted by the Canadian Institute of Mining, Metallurgy and Petroleum Council on May 19, 2014, as amended. NI 43-101 differs significantly from the disclosure requirements of the SEC generally applicable to US companies. As such, the information presented herein concerning mineral properties, mineralization and estimates of mineral reserves and mineral resources may not be comparable to similar information made public by U.S. companies subject to the reporting and disclosure requirements under the U.S. federal securities laws and the rules and regulations thereunder.
Vancouver, British Columbia–(Newsfile Corp. – June 30, 2026) – Rokmaster Resources Corp. (TSXV: RKR) (OTCQB: RKMSF) (FSE: 1RR1) ("Rokmaster" or "the Company") is pleased to announce results from diamond drilling on the Hanson Property completed in April 2026.
The Hanson Property is a part of the Company's Nechako Project, which totals 28,238 hectares (282 km2) across four properties located in west-central British Columbia. The Nechako Project features multiple exploration targets for significant porphyry Cu-(Mo±Au) mineralization and high-grade Au-Ag vein systems in the southern portion of the productive Stikine terrane (Figure 1).
A small inaugural drill program, totalling 393.0 m in two drillholes, tested the Wilson Target within the Hanson Property. This program represents essentially the first drill test of a strong and broad soil molybdenum anomaly and coincident IP anomaly initially detected by Endako Mines in 1973. Endako Mines did complete two shallow drillholes in 1978 after a five-year hiatus in exploration. Drillholes H9 and H10 were completed to depths of only 62.5 m and 37.8 m, respectively, and were directed away from the central high resistivity anomaly. (Figure 2).
Field work completed in 2025 found that the Stern Creek granodiorite underlying the Wilson Zone hosts potassic secondary biotite alteration related to narrow mm-scale vein-hosted molybdenite mineralization on surface. An outcrop was found near the center of the Wilson Zone geochemical and geophysical anomaly, with brecciated clasts of Stern Creek granodiorite and porphyritic quartz monzonite, the primary target for this drill program.
Drillhole H26-02 intersected intrusive breccia with meter-scale intervals of foliated granodiorite and non-foliated porphyritic quartz monzonite from top of the hole until a larger stock of quartz monzonite was encountered between 30.6 and 44.0 m. Below the lower contact of that unit, the remainder of the drillhole consisted of foliated granodiorite with varying degrees of chlorite alteration, persistent potassic alteration, and molybdenite mineralization hosted in quartz B-veins down to the end of the drillhole.
Notable molybdenite mineralization in dense cm-scale quartz veins was intersected in drillhole H26-02 with an assay of 0.518% Mo (0.864% MoS2(1)) over 1.20 m (59.0-60.2 m). The surrounding interval near the lower contact of the quartz monzonite also hosted cm-scale quartz-molybdenite veins and elevated assays with a weighted average of 0.051% Mo (0.085% MoS2) over 18.2 m (42.0-60.2 m).
For comparison, the average grade in the 2025 mineral resource estimate(2) on the currently inactive Endako Mine (Canada's largest Mo Mine), located 23 km south of the Hanson Property, is 0.072% MoS2 for 335.6 Mt in the measured and indicated category. This estimate used a cut-off grade of 0.040% MoS2 and a price of USD$22.50/lb Mo. Rokmaster also intersected a larger interval of 0.023% Mo (0.038% MoS2) over 71.0 m (42.0-113.0 m) cored in drillhole H26-02. This interval is close to the projected restart cut-off grade used in the Endako Mine PEA.
Drillhole H26-01 was collared approximately 900 m west of drillhole H26-02 and intersected Hanson Phase porphyritic tonalite hosting ~5% disseminated pyrite mineralization. This drillhole tested a circular magnetic low feature, elevated gold in surface samples, and the less exposed western portion of high chargeability anomaly. Drillhole H26-01 returned elevated copper results of 500-1,600 ppm Cu over meter-scale intervals throughout the hole, further confirming the pyrite halo around the core of the Wilson Zone.
There is potential for porphyry-style mineralization on the Hanson Property, at the Wilson Zone and at the Cyr Zone 2.5 km to the north. The Cyr Zone has similar geology with strongly sericite-altered and pyritic Stern Creek granodiorite hosting elevated gold, silver, copper, and zinc as indicated in historical sampling and drilling, which may indicate a less eroded porphyry system. The Buckley Zone, approximately 4.0 km west of the Wilson Zone, is defined by a large, strong molybdenum anomaly in soil samples taken over the Hanson Phase tonalite.
A new 1,534 hectare mineral claim called the Chaplin Property was recently approved 8 km south of the Hanson Property. The Chaplin Property is bisected by the mainline Trout Road and characterized by moderate overburden cover over mapped Stern Creek granodiorite. A 1969 induced polarization survey identified a strong IP anomaly(3) that is coincident with a magnetic low that remains undrilled (Figure 3).
John Mirko, President and CEO, comments:
"This first-pass, low-cost drill program at the Wilson Zone has added good value to the Hanson Property by intersecting notable porphyry-style molybdenite mineralization. The high-grade interval of 0.518% Mo over 1.20 m in drillhole H26-02 demonstrates that the system's ability to locally concentrate mineralization in higher-grade vein corridors within a broader envelope of lower-grade mineralization is similar to what has been described at the Endako Mine. The location of the 18.2 m interval returning 0.051% Mo, which exceeds the average grade at the Endako Mine, also supports further exploration potential in the geological context of the Wilson Zone. With extensive road access and nearby infrastructure we can continue advancing the Wilson Zone and the other underexplored Hanson Property targets efficiently. We thank all our contractors, including Hy-Tech Drilling, for safely and efficiently completing this small drill program. Intersecting this porphyry-style mineralization in the Wilson Zone is an excellent start and we look forward to additional drilling on prospective porphyry targets on the Nechako Project later this year."
Footnote 1: Conversion of (% Mo) to (% MoS2) uses a factor of 1.668
Footnote 2: National Instrument NI 43-101 Technical Report for the Endako Mine Restart. Preliminary Economic Assessment (PEA). November 21, 2025. Completed by A-Z Mining Professionals Limited for Moon River Moly Ltd. Sourced from SEDAR filings.
Footnote 3: Chaplin. R. E. 1969. Geophysical Assessment Report on the TAT mineral claims. ARIS Report #2283
The technical information in this news release has been prepared in accordance with Canadian regulatory requirements as set out in National Instrument 43-101 and reviewed and approved by Eric Titley, P.Geo., who is independent of Rokmaster and who acts as Rokmaster's Qualified Person.
For more information please contact
Mr. John Mirko, President & CEO of Rokmaster Resources Corp., jmirko@rokmaster.com, Ph. +1 (604) 290-4647 or by website: www.rokmaster.com
On Behalf of the Board of Directors of
Rokmaster Resources Corp.
John Mirko,President & Chief Executive Officer.
Neither TSX Venture Exchange nor its Regulation Services Provider (as that term in defined in the policies of the TSX Venture Exchange) accepts responsibility for the adequacy or accuracy of this press release.
CAUTIONARY NOTE REGARDING FORWARD-LOOKING STATEMENTS: This news release may contain forward-looking information within the meaning of applicable securities laws ("forward-looking statements"). Forward-looking statements are statements that are not historical facts and are generally, but not always, identified by the words "expects," "plans," "anticipates," "believes," "intends," "estimates," 'projects," "potential" and similar expressions, or that events or conditions "will," "would," "may," "could" or "should" occur. These forward-looking statements are subject to a variety of risks and uncertainties which could cause actual events or results to differ materially from those reflected in the forward-looking statements, including, without limitation: receipt of regulatory approval with respect to the Hanson Property transaction; risks related to fluctuations in metal prices; uncertainties related to raising sufficient financing to fund the planned work in a timely manner and on acceptable terms; changes in planned work resulting from weather, logistical, technical or other factors; the possibility that results of work will not fulfill expectations and realize the perceived potential of the Company's properties; risk of accidents, equipment breakdowns and labour disputes or other unanticipated difficulties or interruptions; the possibility of cost overruns or unanticipated expenses in the work program; the risk of environmental contamination or damage resulting from Rokmaster's operations and other risks and uncertainties. Any forward-looking statement speaks only as of the date it is made and, except as may be required by applicable securities laws, the Company disclaims any intent or obligation to update any forward-looking statement, whether as a result of new information, future events or results or otherwise.
To view the source version of this press release, please visit https://www.newsfilecorp.com/release/303435
VANCOUVER, British Columbia, June 30, 2026 (GLOBE NEWSWIRE) — Teck Resources Limited (TSX: TECK.A and TECK.B, NYSE: TECK) (“Teck”) announced today that it has mailed a letter of transmittal and election form (the “Letter of Transmittal”) to each registered holder of Class A common shares and Class B subordinate voting shares of Teck (collectively, the “Teck Shares”) in connection with the previously-announced court-approved plan of arrangement (the “Plan of Arrangement”) under section 192 of the Canada Business Corporations Act, involving, among other things, the merger of equals of Anglo American plc (“Anglo American”) and Teck (the “Merger”).
The Letter of Transmittal explains how to exchange Teck Shares for the consideration under the Merger and, for eligible Canadian Teck shareholders, how to elect to receive the exchangeable share consideration under the Merger. Under the Merger, each Teck Share will be exchanged for 1.3301 ordinary shares (the “Anglo Shares”) of Anglo American (the “Exchange Ratio”), or, for eligible Canadian shareholders who so elect, the Exchange Ratio of exchangeable shares of Anglo Teck Exchangeco Limited (the “Exchangeable Shares”).
The Letter of Transmittal is for use by registered shareholders only. Beneficial (non-registered) shareholders whose Teck Shares are registered in the name of an intermediary such as a broker, investment dealer, bank, trust company, trustee, nominee or other intermediary should not use the Letter of Transmittal but rather should contact their intermediary for instructions and assistance in depositing their Teck Shares and, if applicable, in making an election as to the form of consideration they wish to receive. Every intermediary has its own procedures with respect to depositing Teck Shares pursuant to the Merger and making an election and may have an earlier deadline. The table below summarizes the default settlement pathway for each category of Teck shareholder:
| Shareholder Type | Default Settlement Pathway |
| Registered Teck shareholders (holding a share certificate or DRS advice) | Must deposit a completed Letter of Transmittal with Computershare Investor Services Inc. (the “Depositary”). Anglo Shares (as defined below) will be issued in certificated form in the shareholder’s name (or, for eligible Canadian Teck shareholders who so elect, Exchangeable Shares in DRS form). |
| Non-registered Teck shareholders holding through CDS | Anglo Shares will be issued to CDS and credited to the same CDS participant account through which the Teck Shares were held. If you are an eligible Canadian Teck shareholder and wish to receive Exchangeable Shares, you must provide your election instructions to your Intermediary by their deadline. |
| Non-registered Teck shareholders holding through DTC | Anglo Shares will be settled in the form of American Depositary Receipts (“ADRs”), credited to the same DTC account through which the Teck Shares were held. If you are an eligible Canadian Teck shareholder who holds Teck Shares through DTC and you wish to receive Exchangeable Shares, you must either (i) withdraw your Teck Shares from DTC and comply with the procedures described in this release for registered Teck shareholders, or (ii) instruct the transfer of your Teck Shares from DTC to CDS in advance of the Election Deadline (as defined below) and provide your election instructions to your intermediary by their deadline |
Registered shareholders are strongly encouraged to read Teck’s management proxy circular dated November 3, 2025 (the “Circular”), including the appendices attached thereto and the documents incorporated therein by reference, before completing the Letter of Transmittal. Shareholders should also carefully review the instructions contained in the Letter of Transmittal. The Circular and a copy of the form of Letter of Transmittal are each available under Teck’s issuer profiles on SEDAR+ at www.sedarplus.ca, EDGAR at www.sec.gov and on Teck’s website at www.Teck.com.The Letter of Transmittal outlines the necessary documentation and information required from each registered shareholder to obtain the consideration to which they are entitled under the Merger and, if applicable, make an election with respect to the form of consideration they wish to receive, as further described below. Registered shareholders should refer to the instructions contained in the Letter of Transmittal to ensure they provide the required documentation and information to the Depositary in order to validly deposit their Teck Shares and elect the form of consideration they wish to receive.
If a registered shareholder does not deposit a properly completed Letter of Transmittal prior to the deadline to make an election in respect of the consideration receivable in exchange for their Teck Shares pursuant to the Merger (the “Election Deadline”), or otherwise fails to comply with the requirements under the Plan of Arrangement and Letter of Transmittal with respect to such election and deposit of their Teck Shares, such registered shareholder will receive, upon delivery of a properly completed Letter of Transmittal together with certificate(s) if any representing their Teck Shares and all other required documentation, in respect of each such Teck Share for which no valid election was made, the consideration to which they are entitled in the form of Anglo Shares for such Teck Shares.
The election window is now open, and registered shareholders may begin depositing their completed Letters of Transmittal with the Depositary immediately. The Election Deadline has not been determined. Teck expects to announce the Election Deadline by news release not less than seven business days prior to the Election Deadline. Accordingly, once the Election Deadline is announced, there may be limited time to complete and deliver the Letter of Transmittal or to address any deficiencies in any delivered form. Registered shareholders who wish to make an election are strongly encouraged to submit their Letter of Transmittal as promptly as possible and are advised not to wait for the announcement of the Election Deadline before doing so.
Registered shareholders who have not deposited a duly completed Letter of Transmittal, together with the certificate(s) (if any) representing their Teck Shares and all other required documentation, with the Depositary will not be recorded on the register of holders of Anglo Shares and will not be entitled to vote or to receive any dividends or other distributions declared in respect of the Anglo Shares until they have done so. Further, if the Letter of Transmittal is not properly completed, executed and deposited, together with the certificate(s) (if any) and all other required documentation, before the day that is the third anniversary of the closing of the Merger, the right of any Teck Shareholder to receive the consideration for their Teck Shares pursuant to the Plan of Arrangement shall terminate and all consideration to which such former Teck Shareholder was entitled shall be deemed to have been surrendered and forfeited to Anglo Teck or ExchangeCo, as applicable.
Under current UK law, stamp duty or stamp duty reserve tax at a rate of 1.5% may apply where Anglo Shares are transferred after issuance into a clearance service (including CDS or DTC) or to the depositary bank for the ADR facility. Registered shareholders who currently hold certificated Teck Shares but intend to hold their Anglo Shares through CDS or in the form of American Depositary Receipts through DTC are therefore strongly advised to transfer their Teck Shares into CDS or DTC, as applicable, prior to completion of the Merger, and should review the Letter of Transmittal for further details.
Forward Looking StatementsThis news release contains certain forward-looking information and forward-looking statements as defined in applicable securities laws (collectively referred to as forward-looking statements). These statements relate to future events or future performance. All statements other than statements of historical fact are forward-looking statements. The use of any of the words “anticipate”, “can”, “could”, “plan”, “expect”, “may”, “will”, “likely”, “should” and similar expressions is intended to identify forward-looking statements. These statements involve known and unknown risks, uncertainties and other factors that may cause actual results or events to differ materially from those anticipated in such forward-looking statements. These statements speak only as of the date of this news release. These forward-looking statements include, but are not limited to, expectations with respect to shareholder elections, non-elections and timing of shareholder elections, the likelihood that the stamp duty or stamp duty reserve tax may apply to certain share transfers, the determination and announcement of the Election Deadline and the expected timing of completion of the Merger, and other statements that are not historical facts.
These statements are based on a number of assumptions, including, but not limited to, assumptions regarding general business and economic conditions, future outlook and anticipated events, such as the ability of Anglo American and Teck to complete the Merger, the ability of Teck and Anglo American to obtain all required regulatory approvals, the ability of Teck and Anglo American to satisfy all other conditions to the Merger, the strategic vision of the merger between Teck and Anglo American following the closing of the Merger, the satisfaction of the conditions precedent to the Merger and other factors, many of which are beyond the control of Teck. The foregoing list of assumptions is not exhaustive. Events or circumstances could cause actual results to vary materially.
Forward-looking information is based on the information available at the time those statements are made and reflects the good faith belief of the officers and directors of Teck and Anglo American as of that time with respect to future events and is subject to risks and uncertainties that could cause actual results to differ materially from those expressed in the forward-looking information. Factors that may cause actual results to vary materially include, but are not limited to, the possibility that the Merger will not be completed on the terms and conditions, or on the timing, currently contemplated, and that it may not be completed at all, due to a failure to obtain or satisfy, in a timely manner or otherwise, required regulatory approvals and other conditions to the closing of the Merger or for other reasons, public perception of the Merger, market reaction to the Merger, the negative impact that the failure to complete the Merger for any reason could have on the business of Anglo American or Teck, the ability of Anglo American and Teck to successfully integrate and capture expected synergies, general economic and market conditions, including interest and foreign exchange rates, global financial markets, changes in government regulations or in securities, tax or other laws, industry competition, technological developments and other factors described or discussed in Anglo American’s or Teck’s disclosure materials filed with applicable securities regulatory authorities from time to time. For additional risk factors regarding Teck’s business see also “Risk Factors” in Teck’s current Annual Information Form dated February 19, 2026, as filed under Teck’s profile on SEDAR+ (www.sedarplus.ca) and on EDGAR (www.sec.gov).
Teck assumes no obligation to update forward-looking statements except as required under securities laws. Further information concerning risks, assumptions and uncertainties associated with these forward-looking statements, the Merger and Teck’s business can be found in Teck’s Circular filed under Teck’s profile on SEDAR+ (www.sedarplus.ca) and on EDGAR (www.sec.gov).About TeckTeck is a leading Canadian resource company focused on responsibly providing metals essential to economic development and the energy transition. Teck has a portfolio of world-class copper and zinc operations across North and South America and an industry-leading copper growth pipeline. We are focused on creating value by advancing responsible growth and ensuring resilience built on a foundation of stakeholder trust. Headquartered in Vancouver, Canada, Teck’s shares are listed on the Toronto Stock Exchange under the symbols TECK.A and TECK.B and the New York Stock Exchange under the symbol TECK. Learn more about Teck at www.teck.com or follow @TeckResources.
Investor Contact:Emma Chapman Vice President, Investor Relations +44.207.509.6576 emma.chapman@teck.com
Edwin ShadeoActing Vice President, Investor Relations604.699.4531edwin.shadeo@teck.com
Media Contact:Dale SteevesDirector, External Communications236.987.7405 dale.steeves@teck.com
Southern Copper (SCCO) has been one of the most searched-for stocks on Zacks.com lately. So, you might want to look at some of the facts that could shape the stock's performance in the near term.
Shares of this miner have returned -8.5% over the past month versus the Zacks S&P 500 composite's -1.4% change. The Zacks Mining – Non Ferrous industry, to which Southern Copper belongs, has lost 3.6% over this period. Now the key question is: Where could the stock be headed in the near term?
Although media reports or rumors about a significant change in a company's business prospects usually cause its stock to trend and lead to an immediate price change, there are always certain fundamental factors that ultimately drive the buy-and-hold decision.
Earnings Estimate Revisions
Here at Zacks, we prioritize appraising the change in the projection of a company's future earnings over anything else. That's because we believe the present value of its future stream of earnings is what determines the fair value for its stock.
Our analysis is essentially based on how sell-side analysts covering the stock are revising their earnings estimates to take the latest business trends into account. When earnings estimates for a company go up, the fair value for its stock goes up as well. And when a stock's fair value is higher than its current market price, investors tend to buy the stock, resulting in its price moving upward. Because of this, empirical studies indicate a strong correlation between trends in earnings estimate revisions and short-term stock price movements.
Southern Copper is expected to post earnings of $1.90 per share for the current quarter, representing a year-over-year change of +55.7%. Over the last 30 days, the Zacks Consensus Estimate has changed +2.4%.
The consensus earnings estimate of $7.62 for the current fiscal year indicates a year-over-year change of +45.4%. This estimate has changed +10% over the last 30 days.
For the next fiscal year, the consensus earnings estimate of $6.96 indicates a change of -8.6% from what Southern Copper is expected to report a year ago. Over the past month, the estimate has changed +6.8%.
Having a strong externally audited track record, our proprietary stock rating tool, the Zacks Rank, offers a more conclusive picture of a stock's price direction in the near term, since it effectively harnesses the power of earnings estimate revisions. Due to the size of the recent change in the consensus estimate, along with three other factors related to earnings estimates, Southern Copper is rated Zacks Rank #3 (Hold).
The chart below shows the evolution of the company's forward 12-month consensus EPS estimate:
12 Month EPS
Projected Revenue Growth
Even though a company's earnings growth is arguably the best indicator of its financial health, nothing much happens if it cannot raise its revenues. It's almost impossible for a company to grow its earnings without growing its revenue for long periods. Therefore, knowing a company's potential revenue growth is crucial.
For Southern Copper, the consensus sales estimate for the current quarter of $4.26 billion indicates a year-over-year change of +39.6%. For the current and next fiscal years, $16.69 billion and $14.59 billion estimates indicate +24.4% and -12.6% changes, respectively.
Last Reported Results and Surprise History
Southern Copper reported revenues of $4.25 billion in the last reported quarter, representing a year-over-year change of +36.2%. EPS of $1.92 for the same period compares with $1.19 a year ago.
Compared to the Zacks Consensus Estimate of $4.26 billion, the reported revenues represent a surprise of -0.11%. The EPS surprise was +8.47%.
The company beat consensus EPS estimates in each of the trailing four quarters. The company topped consensus revenue estimates three times over this period.
Valuation
Without considering a stock's valuation, no investment decision can be efficient. In predicting a stock's future price performance, it's crucial to determine whether its current price correctly reflects the intrinsic value of the underlying business and the company's growth prospects.
Comparing the current value of a company's valuation multiples, such as its price-to-earnings (P/E), price-to-sales (P/S), and price-to-cash flow (P/CF), to its own historical values helps ascertain whether its stock is fairly valued, overvalued, or undervalued, whereas comparing the company relative to its peers on these parameters gives a good sense of how reasonable its stock price is.
As part of the Zacks Style Scores system, the Zacks Value Style Score (which evaluates both traditional and unconventional valuation metrics) organizes stocks into five groups ranging from A to F (A is better than B; B is better than C; and so on), making it helpful in identifying whether a stock is overvalued, rightly valued, or temporarily undervalued.
Southern Copper is graded D on this front, indicating that it is trading at a premium to its peers. Click here to see the values of some of the valuation metrics that have driven this grade.
Bottom Line
The facts discussed here and much other information on Zacks.com might help determine whether or not it's worthwhile paying attention to the market buzz about Southern Copper. However, its Zacks Rank #3 does suggest that it may perform in line with the broader market in the near term.
Want the latest recommendations from Zacks Investment Research? Today, you can download 7 Best Stocks for the Next 30 Days. Click to get this free report
Southern Copper Corporation (SCCO) : Free Stock Analysis Report
This article originally published on Zacks Investment Research (zacks.com).
Miners Hochschild and Fresnillo lead FTSE falls as gold pullback deepens Proactive uses images sourced from Shutterstock
Hochschild Mining PLC (LSE:HOC) and Fresnillo PLC (LSE:FRES) led London's mining sector lower on Thursday as falling gold and silver prices hit precious metals producers.
Hochschild fell 1.8%, Endeavour Mining PLC (LSE:EDV) lost 1.8%, Pan African Resources PLC (LSE:PAF) shed 1.5% and Fresnillo dropped 1.3% in early trading.
The declines came as gold slipped 0.6% to $3,975 an ounce, falling below the $4,000 mark for the first time since November, while silver fell 1.2% to $56.70 an ounce, having yesterday broken below $60 for the first time since December.
The weakness was concentrated among precious metals miners. More diversified groups were mixed, with Glencore PLC (LSE:GLEN) down 0.3%, Rio Tinto Ltd (LSE:RIO) little changed, Anglo American PLC (LSE:AAL) up 0.6% and Antofagasta PLC (LSE:ANTO) gaining 1%, helped by copper prices. Comex copper was up 0.6% to $5.9796 a pound.
Bullion has come under pressure as the US dollar strengthened to its highest level in more than a year as investors continued to price in interest rates remaining higher for longer. Higher rates raise the opportunity cost of holding non-yielding assets such as gold.
Patrick Munnelly, market analyst at Tickmill, said: "Gold is stabilising around $4,000/oz after briefly falling below that level for the first time since November. A stronger Dollar and higher-for-longer rate expectations have weighed on the metal, while the easing of Middle East risks has reduced safe-haven demand.
"The fact that gold is only stabilising, rather than rebounding strongly, suggests that the market is less concerned about geopolitical tail risk and more focused on real yields and the Dollar."
Chris Beauchamp, market analyst at IG, said the gold price was seeing its "largest pullback for four years".
"The parabolic move of late 2024, through 2025 and on into 2026 has firmly come unstuck. The bigger the party, the bigger the hangover, and gold is still working off its own exuberance… As the dollar keeps strengthening, there is more pain to come for gold."
Investors looking for stocks in the Mining – Miscellaneous sector might want to consider either Nexa Resources S.A. (NEXA) or Anglo American (NGLOY). But which of these two companies is the best option for those looking for undervalued stocks? Let's take a closer look.
There are plenty of strategies for discovering value stocks, but we have found that pairing a strong Zacks Rank with an impressive grade in the Value category of our Style Scores system produces the best returns. The Zacks Rank is a proven strategy that targets companies with positive earnings estimate revision trends, while our Style Scores work to grade companies based on specific traits.
Right now, Nexa Resources S.A. is sporting a Zacks Rank of #1 (Strong Buy), while Anglo American has a Zacks Rank of #2 (Buy). This system places an emphasis on companies that have seen positive earnings estimate revisions, so investors should feel comfortable knowing that NEXA is likely seeing its earnings outlook improve to a greater extent. However, value investors will care about much more than just this.
Value investors are also interested in a number of tried-and-true valuation metrics that help show when a company is undervalued at its current share price levels.
The Value category of the Style Scores system identifies undervalued companies by looking at a number of key metrics. These include the long-favored P/E ratio, P/S ratio, earnings yield, cash flow per share, and a variety of other fundamentals that help us determine a company's fair value.
NEXA currently has a forward P/E ratio of 4.83, while NGLOY has a forward P/E of 21.51. We also note that NEXA has a PEG ratio of 0.31. This popular metric is similar to the widely-known P/E ratio, with the difference being that the PEG ratio also takes into account the company's expected earnings growth rate. NGLOY currently has a PEG ratio of 0.50.
Another notable valuation metric for NEXA is its P/B ratio of 1.24. Investors use the P/B ratio to look at a stock's market value versus its book value, which is defined as total assets minus total liabilities. By comparison, NGLOY has a P/B of 2.41.
These metrics, and several others, help NEXA earn a Value grade of A, while NGLOY has been given a Value grade of C.
NEXA stands above NGLOY thanks to its solid earnings outlook, and based on these valuation figures, we also feel that NEXA is the superior value option right now.
Want the latest recommendations from Zacks Investment Research? Today, you can download 7 Best Stocks for the Next 30 Days. Click to get this free report
Nexa Resources S.A. (NEXA) : Free Stock Analysis Report
Anglo American (NGLOY) : Free Stock Analysis Report
This article originally published on Zacks Investment Research (zacks.com).
Watch on BNN Bloomberg nationalWednesday, June 24 at 7:30 PM EST, Saturday, June 27 at 8 PM EST, & Saturday, July 4 at 8PM EST
Tune into BTV and Discover Investment Opportunities.
Vancouver, British Columbia–(Newsfile Corp. – June 24, 2026) – From gold and lithium to copper and phosphate, BTV – Business Television features companies advancing projects tied to long-term commodity demand, resource development, and future supply growth across North America.
Cannot view this video? Visit:https://www.youtube.com/watch?v=JMRBG8Twxak
Osisko Development Corp. (NYSE: ODV) (TSXV: ODV) – New gold mine development remains increasingly scarce across North America. In British Columbia, active underground development, ongoing exploration, and a fully financed construction pathway are supporting the advancement of a large-scale gold opportunity. With production targeted later this decade, Osisko Development continues to advance key milestones while evaluating significant district-scale growth potential.
Dakota Gold Corp. (NYSE American: DC) – Historic U.S. mining districts are drawing renewed attention as domestic resource development gains strategic importance. In South Dakota's Homestake District, ongoing engineering work and exploration are helping outline a potential future gold producer. Backed by defined resources and a planned pre-feasibility study, Dakota Gold is progressing toward key development milestones while evaluating district-scale growth opportunities.
Q2 Metals Corp. (TSXV: QTWO) (OTCQB: QUEXF) – As North America works to secure domestic battery material supply, large-scale lithium deposits are drawing increased attention. Backed by a substantial resource, established infrastructure access, and a fully funded exploration program, Q2 Metals is advancing development activities in Quebec's James Bay region while working toward future economic studies and resource upgrades.
Talisker Resources Ltd. (TSX: TSK) (OTCQB: TSKFF) – The transition from explorer to producer is a milestone few junior mining companies achieve. After recording its first gold sales, Talisker Resources is advancing a district-scale growth strategy in British Columbia, combining ongoing production, resource expansion, and future development plans. The company is positioning around the long-term potential of one of Canada's historic gold-producing regions.
Wallbridge Mining Company Limited (TSX: WM) (OTCQB:WLBMF) – Canada's Abitibi region remains one of the world's premier gold districts, attracting continued investment in exploration and development. Backed by multiple discoveries, a growing resource base, and a fully funded pre-feasibility study, Wallbridge Mining is advancing key technical milestones while continuing to evaluate the long-term potential of its northern Abitibi gold portfolio.
Oreterra Metals Corp. (TSXV: OTMC) (OTCID: OTMCF) – Demand for copper continues to grow alongside global electrification trends, while early-stage discovery opportunities remain a key focus for investors. In British Columbia's Golden Triangle, Oreterra Metals is launching the first drill program on a newly identified copper-gold target that has never previously been tested. The program marks an important step in evaluating the scale and potential of a prospective porphyry system.
Nevada Organic Phosphate Inc. (CSE: NOP) (OTCQB: NOPFF) – As interest in sustainable agriculture and domestic fertilizer supply continues to grow, phosphate resources in stable jurisdictions are drawing renewed attention. Nevada Organic Phosphate is advancing a phosphate project with applications in organic farming, supported by ongoing drilling programs designed to define the scale of the deposit and support future development planning.
About BTV – Business Television / BTV The Agency:
For 28 years, BTV – Business Television has been the go-to half-hour investment show for savvy investors, delivering exclusive on-location interviews and actionable insights with emerging companies, industry leaders, and market experts. Hosted by Taylor Thoen and Jessica Katrichak, BTV provides investors with direct access to executive teams and compelling investment opportunities not found anywhere else.
Discover Investment Opportunities.
Watch BTV Episode; BROADCAST NETWORKS and TIMES:
CANADA: Airing on BNN Bloomberg!
- Wednesday, June 24 @ 7:30pm ET
- Saturday, June 27 @ 8:00pm ET
US National TV: Biz Television Network –
- Fri, June 26 @ 6:30am ET
- Sun, June 28 @ 1:00pm ET
- Mon, June 29 @ 8:30am ET
- Tues, June 30 @ 8:30pm ET & 11:30pm ET
BTV The Agency is a capital markets-focused TV production and digital marketing agency serving publicly traded and financial companies. Through strategic content creation and extensive distribution across top-tier networks including Bloomberg, CNBC, FOX Business News, and leading financial platforms, the agency helps companies reach investors, advisors, and institutions-building brand credibility and driving national retail and institutional investor awareness.
Take action now: Know a company investors should be watching?Put them in front of thousands of active investors on BTV.
Contact us directly at (604) 664-7401 or info@b-tv.com.
Don't miss a beat-stay informed and ahead of the market by subscribing to BTV news today.
To view the source version of this press release, please visit https://www.newsfilecorp.com/release/302711
The Basic Materials group has plenty of great stocks, but investors should always be looking for companies that are outperforming their peers. Has Gerdau (GGB) been one of those stocks this year? Let's take a closer look at the stock's year-to-date performance to find out.
Gerdau is one of 248 companies in the Basic Materials group. The Basic Materials group currently sits at #3 within the Zacks Sector Rank. The Zacks Sector Rank considers 16 different sector groups. The average Zacks Rank of the individual stocks within the groups is measured, and the sectors are listed from best to worst.
The Zacks Rank is a proven system that emphasizes earnings estimates and estimate revisions, highlighting a variety of stocks that are displaying the right characteristics to beat the market over the next one to three months. Gerdau is currently sporting a Zacks Rank of #2 (Buy).
Over the past 90 days, the Zacks Consensus Estimate for GGB's full-year earnings has moved 9.3% higher. This means that analyst sentiment is stronger and the stock's earnings outlook is improving.
Our latest available data shows that GGB has returned about 15.2% since the start of the calendar year. Meanwhile, the Basic Materials sector has returned an average of 12.7% on a year-to-date basis. As we can see, Gerdau is performing better than its sector in the calendar year.
Another Basic Materials stock, which has outperformed the sector so far this year, is Anglo American (NGLOY). The stock has returned 26.4% year-to-date.
The consensus estimate for Anglo American's current year EPS has increased 54.3% over the past three months. The stock currently has a Zacks Rank #2 (Buy).
Looking more specifically, Gerdau belongs to the Steel – Producers industry, a group that includes 17 individual stocks and currently sits at #38 in the Zacks Industry Rank. On average, this group has gained an average of 34.4% so far this year, meaning that GGB is slightly underperforming its industry in terms of year-to-date returns.
In contrast, Anglo American falls under the Mining – Miscellaneous industry. Currently, this industry has 72 stocks and is ranked #104. Since the beginning of the year, the industry has moved +22.3%.
Gerdau and Anglo American could continue their solid performance, so investors interested in Basic Materials stocks should continue to pay close attention to these stocks.
Want the latest recommendations from Zacks Investment Research? Today, you can download 7 Best Stocks for the Next 30 Days. Click to get this free report
Gerdau S.A. (GGB) : Free Stock Analysis Report
Anglo American (NGLOY) : Free Stock Analysis Report
This article originally published on Zacks Investment Research (zacks.com).
Southern Copper (SCCO) ended the recent trading session at $189.91, demonstrating a -1.57% change from the preceding day's closing price. The stock fell short of the S&P 500, which registered a loss of 0.37% for the day. Elsewhere, the Dow gained 0.29%, while the tech-heavy Nasdaq lost 1.33%.
Heading into today, shares of the miner had gained 7.38% over the past month, outpacing the Basic Materials sector's gain of 3.31% and the S&P 500's gain of 2.02%.
The upcoming earnings release of Southern Copper will be of great interest to investors. In that report, analysts expect Southern Copper to post earnings of $1.9 per share. This would mark year-over-year growth of 55.74%. Our most recent consensus estimate is calling for quarterly revenue of $4.23 billion, up 38.73% from the year-ago period.
SCCO's full-year Zacks Consensus Estimates are calling for earnings of $7.62 per share and revenue of $16.54 billion. These results would represent year-over-year changes of +45.42% and +23.22%, respectively.
Any recent changes to analyst estimates for Southern Copper should also be noted by investors. These recent revisions tend to reflect the evolving nature of short-term business trends. As a result, upbeat changes in estimates indicate analysts' favorable outlook on the business health and profitability.
Our research suggests that these changes in estimates have a direct relationship with upcoming stock price performance. We developed the Zacks Rank to capitalize on this phenomenon. Our system takes these estimate changes into account and delivers a clear, actionable rating model.
Ranging from #1 (Strong Buy) to #5 (Strong Sell), the Zacks Rank system has a proven, outside-audited track record of outperformance, with #1 stocks returning an average of +25% annually since 1988. Over the past month, the Zacks Consensus EPS estimate has shifted 9.96% upward. Southern Copper is currently a Zacks Rank #3 (Hold).
Investors should also note Southern Copper's current valuation metrics, including its Forward P/E ratio of 25.34. For comparison, its industry has an average Forward P/E of 26.09, which means Southern Copper is trading at a discount to the group.
We can also see that SCCO currently has a PEG ratio of 1.73. The PEG ratio is similar to the widely-used P/E ratio, but this metric also takes the company's expected earnings growth rate into account. The Mining – Non Ferrous was holding an average PEG ratio of 1.49 at yesterday's closing price.
The Mining – Non Ferrous industry is part of the Basic Materials sector. Currently, this industry holds a Zacks Industry Rank of 169, positioning it in the bottom 31% of all 250+ industries.
The Zacks Industry Rank is ordered from best to worst in terms of the average Zacks Rank of the individual companies within each of these sectors. Our research shows that the top 50% rated industries outperform the bottom half by a factor of 2 to 1.
Ensure to harness Zacks.com to stay updated with all these stock-shifting metrics, among others, in the next trading sessions.
Want the latest recommendations from Zacks Investment Research? Today, you can download 7 Best Stocks for the Next 30 Days. Click to get this free report
Southern Copper Corporation (SCCO) : Free Stock Analysis Report
This article originally published on Zacks Investment Research (zacks.com).
How much a stock's price changes over time is important for most investors, since price performance can both impact your investment portfolio and help you compare investment results across sectors and industries.
FOMO, or the fear of missing out, also plays a role in investing, particularly with tech giants and popular consumer-facing stocks.
What if you'd invested in Southern Copper (SCCO) ten years ago? It may not have been easy to hold on to SCCO for all that time, but if you did, how much would your investment be worth today?
Southern Copper's Business In-Depth
With that in mind, let's take a look at Southern Copper's main business drivers.
Phoenix, AZ-based Southern Copper Corporation engages in mining, exploring, smelting, and refining copper and other minerals. The company conducts exploration activities in Argentina, Chile, Ecuador, Mexico and Peru.Southern Copper has the largest copper reserves in the industry and operates high-quality, world-class assets in investment grade countries, such as Mexico and Peru. Southern Copper reports results under three reportable segments. Each consist of a groups of mines with similar economic characteristics, type of products, processes and support facilities, regulatory environments as well as employee bargaining contracts.Peruvian operations (around 36% of the company's revenues) includes the Toquepala and Cuajone mine complexes and the smelting and refining plants, industrial railroad and port facilities that service both mines. The Peruvian operations produce copper, with significant by-product production of molybdenum, silver and other materials.Mexican Open-Pit (58% of revenues) includes La Caridad and Buenavista mine complexes, the smelting and refining plants and support facilities, which service both mines. The Mexican open pit operations produce copper, with significant by-product production of molybdenum, silver and other materials.Mexican underground operations (6% of revenues) (IMMSA unit) includes five underground mines that produce zinc, lead, copper, silver and gold, a coal mine which produces coal and coke, and several industrial processing facilities for zinc, copper and silver. The geographic breakdown of the company’s sales is as follows – Americas (50% of revenues), Europe (32%) and Asia (18%).Approximately 80% of the company’s revenue come from the sale of copper, 6% from molybdenum and 10% from silver and zinc. Bottom Line
While anyone can invest, building a lucrative investment portfolio takes research, patience, and a little bit of risk. If you had invested in Southern Copper ten years ago, you're probably feeling pretty good about your investment today.
A $1000 investment made in June 2016 would be worth $7,331.28, or a gain of 633.13%, as of June 22, 2026, according to our calculations. This return excludes dividends but includes price appreciation.
Compare this to the S&P 500's rally of 262.13% and gold's return of 212.32% over the same time frame.
Analysts are anticipating more upside for SCCO.
Southern Copper reported a 4% decline in copper production in the first quarter 2026 due to lower ore grades at Peruvian operations. Even though grades are expected to improve through the year, the company expects copper output for 2026 at around 915,400 tons, which implies a 5% year-over-year decline. The company also anticipates declines in molybdenum, silver and zinc production. However, stronger metal prices are likely to cushion the impact on revenues. Rising energy and labor costs could weigh on near-term margins. Copper demand continues to be robust, supported by the global shift toward clean energy. An anticipated supply deficit should provide additional price support. The company expects to take its copper production to 1.6 million tons backed by its planned investments exceeding $20.5 billion across Peru and Mexico over the decade.
The stock is up 7.38% over the past four weeks, and no earnings estimate has gone lower in the past two months, compared to 4 higher, for fiscal 2026. The consensus estimate has moved up as well.
Want the latest recommendations from Zacks Investment Research? Today, you can download 7 Best Stocks for the Next 30 Days. Click to get this free report
Southern Copper Corporation (SCCO) : Free Stock Analysis Report
This article originally published on Zacks Investment Research (zacks.com).
BHP Group Limited BHP announced that it is increasing its investment in the Jansen Stage 2 project following the completion of a detailed review. BHP expects total investment for the project to be $6.9 billion, up from the previously mentioned $4.9 billion. Initial production is expected in late fiscal 2031.In August 2025, BHP announced an extension for Jansen Stage 2, delaying first production from fiscal 2029 to fiscal 2031. The increase in investment reflects this delay, alongside cost escalation, increased material quantities and extra construction hours identified as part of the comprehensive review.
BHP’s Jansen Stage 2 Targets 4.36M Tons Annual Output
As of May 31, 2026, the Jansen Stage 2 project is 16% complete. The engineering is 83% complete, de-risking the estimates for the project's outstanding work. The company expects Stage 2 to produce 4.36 million tons per annum. BHP has revised the project’s internal rate of return to 11%, with an expected payback period of eight years. The low-cost position ensures that the project’s underlying EBITDA margins remain above 65%.BHP is also advancing the Jansen Stage 1 potash project, a large-scale, low-cost, high-grade resource with a mine life exceeding 100 years. BHP is working toward its first production by mid-2027. These investments will transform Jansen into one of the world’s largest potash mines, doubling production capacity to 8.5 million tons per year, positioning BHP as a major global producer of potash by the end of the decade.BHP expects to recognize $2.3 billion in impairment charges (before and after tax) on its investment to date in the Jansen project. This is due to the higher forecasted capital intensity for both stages and potential future expansions.
BHP Stock's Price Performance
BHP Group’s shares have surged 95.6% in the past year compared with the industry’s 57.2% growth.
Image Source: Zacks Investment Research
BHP’s Zacks Rank & Other Stock to Consider
BHP Group currently carries a Zacks Rank #2 (Buy).
Some other top-ranked stocks from the basic materials space are Albemarle Corporation ALB, CF Industries Holdings, Inc. CF and Avino Silver & Gold Mines Ltd. ASM. ALB flaunts a Zacks Rank #1 (Strong Buy) at present, and CF and ASM carry a Zacks Rank #2. You can see the complete list of today’s Zacks #1 Rank stocks here.
Albemarle has an average trailing four-quarter earnings surprise of 74.5%. The Zacks Consensus Estimate for the company’s 2026 earnings is pegged at $12.45 per share, indicating year-over-year growth from a loss of 79 cents. ALB shares have skyrocketed 181% so far this year.
The Zacks Consensus Estimate for CF Industries’ current-year earnings is pegged at $17.16 per share, indicating an 83% year-over-year surge. CF has an average trailing four-quarter earnings surprise of 11.4%. CF Industries’ shares have gained 21.4% in a year.
Avino Silver has an average trailing four-quarter earnings surprise of 125%. The Zacks Consensus Estimate for Avino Silver’s 2026 earnings is pegged at 39 cents per share, indicating 34.5% year-over-year growth. Its shares have surged 90.5% in a year.
Want the latest recommendations from Zacks Investment Research? Today, you can download 7 Best Stocks for the Next 30 Days. Click to get this free report
BHP Group Limited Sponsored ADR (BHP) : Free Stock Analysis Report
CF Industries Holdings, Inc. (CF) : Free Stock Analysis Report
Albemarle Corporation (ALB) : Free Stock Analysis Report
Avino Silver (ASM) : Free Stock Analysis Report
This article originally published on Zacks Investment Research (zacks.com).
If you would like to receive our free newsletter via email, simply enter your email address below & click subscribe.
 Follow us on Twitter
 Become our facebook fan
CONNECT WITH US
Tweets
Tweet with hash tag #miningfeeds or @miningfeeds and your tweets will be displayed across this site.
MOST ACTIVE MINING STOCKS
Daily Gainers
 CMC Metals Ltd. CMC Metals Ltd. |
CMB.V | +900.00% |
 Eden Energy Ltd Eden Energy Ltd |
EDE.AX | +200.00% |
| GoviEx Uranium Inc. |
GXU.V | +42.86% |
| Eagle Nickel Ltd. |
ENL.AX | +41.67% |
| Citigold Corp. Limited |
CTO.AX | +33.33% |
| Mount Burgess Mining NL |
MTB.AX | +33.33% |
| Exalt Resources Limited |
ERD.AX | +31.94% |
| Casa Minerals Inc. |
CASA.V | +30.00% |
| Cariboo Rose Resources Ltd |
CRB.V | +28.57% |
| Belmont Resources Inc. |
BEA.V | +28.57% |


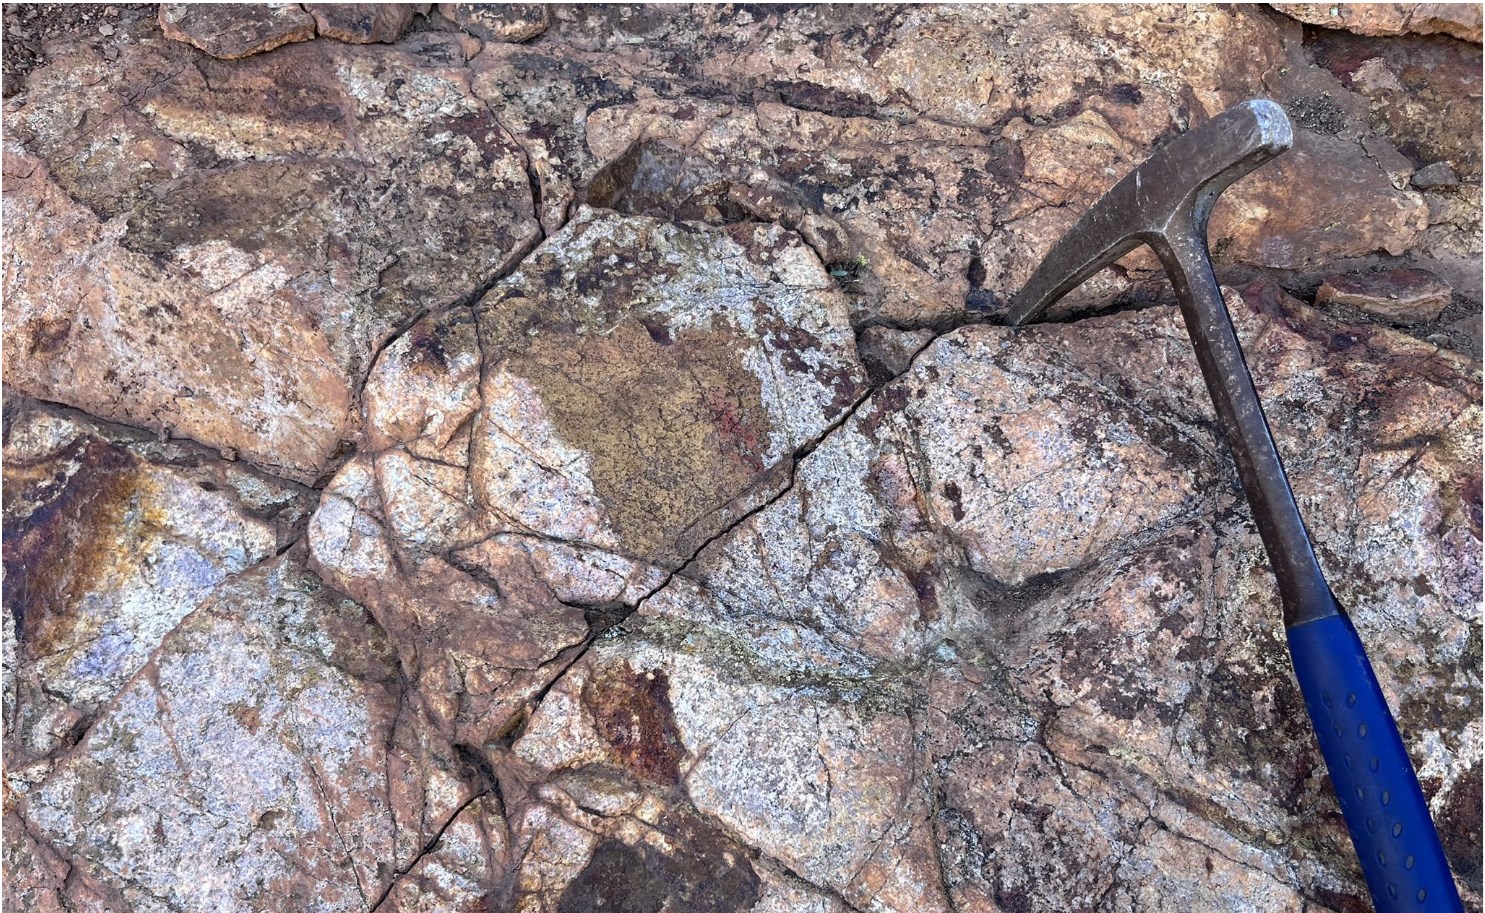