The federal government has signed off on the merger between Teck Resources Ltd. and Anglo American PLC, despite securing little further in concessions that would benefit Canada.
Federal Industry Minister Mélanie Joly said late Monday that the government had determined the deal is a net positive to the country.
"This merger is a significant win for Vancouver, British Columbia, and Canadians across the country," she said in a statement on social media.
Joly had previously suggested that the terms as proposed weren't good enough and that the government would be pushing for more.
A spokesperson for the minister declined to answer questions on why the government had approved the deal without securing further benefits.
Teck said in a release that the commitments set out in September when the deal was first announced have been further defined into a set of binding commitments under the Investment Canada Act.
"Establishing Anglo Teck here in Vancouver is wholly aligned with government’s economic focus and will help to further elevate Canada’s role and impact on the global critical minerals stage," said chief executive Jonathan Price.
Anglo and Teck's binding commitments include that the global headquarters of the company will forever be in Canada, as will a significant majority of senior management and board of directors.
The deal also has the new company committing to spend at least $4.5 billion in Canada over the next five years, though Teck itself has already approved about half of that after previously green-lighting the $2.4 billion Highland Valley Copper mine life extension.
The companies will also spend up to $850 million on critical minerals processing at Teck's Trail Operations, an increase from an initial commitment of up to $750 million.
Other spending includes up to $750 million to advance development of the Galore Creek and Schaft Creek copper projects.
The companies will also "cause" spending to be made of at least $300 million in Canadian critical mineral exploration and technology and $100 million on a critical minerals institute and skills training.
Taken all together, Teck says it will mean the combined company is set to spend at least $10 billion in Canada over 15 years.
Both the speed of the approval, and the lack of further benefits, caught some analysts by surprise.
"We had previously noted that this approval could be difficult to obtain without further concessions to the Canadian Government," said National Bank analyst Shane Nagle in a note.
"Industry Minister Mélanie Joly repeatedly told reporters that her decision on whether to approve or reject the Teck deal could take months and was clear that promises made by Anglo to maintain corporate headquarters and invest in Canada did not go far enough."
As recently as Dec. 9, after shareholders voted in favour of the deal, Nagle warned that a federal decision could still be months away as similar reviews have often stretched for six months or longer.
With Ottawa's decision in, the largest obstacles have been cleared, though it still requires approval from regulators in Europe, Japan, South Korea, the United States, Chile and China around antitrust concerns, said Nagle.
"With approval under the Investment Canada Act, and BHP dropping out of making an offer for Anglo, the chances of the merger being completed increase significantly."
Anglo American CEO Duncan Wanblad, who will stay in the role at the combined company, said in a statement that the deal represents a significant investment in Canada.
"We are all committed to preserving and building on the proud heritage of both companies, in Canada, as home to Anglo Teck’s global headquarters."
This report by The Canadian Press was first published Dec. 16, 2025.
Companies in this story: (TSX:TECK.B)
Ian Bickis, The Canadian Press
An aerial view of Teck Resources' Highland Valley Copper Mine in British Columbia.
(Credit: THE CANADIAN PRESS/Darryl Dyck)
The Canadian government has approved Vancouver-based Teck Resources Ltd.’s merger with Anglo American PLC, which will create a major copper producer with operations centred in the Americas.
The new company, to be called Anglo Teck, will keep its primary listing in London rather than in Canada — it will keep a listing on the Toronto Stock Exchange — but its headquarters will be in Vancouver; a compromise that helped the two companies win approval for their merger under the Investment Canada Act.
The deal involving Canada’s largest miner of copper, a key metal for electrification, has been closely watched by investors because the federal government has promised to raise a high bar before approving any foreign takeovers or mergers of critical minerals companies.
In recent years, many Canadian mining executives have complained that foreign takeovers of domestic companies mean that many of the country’s largest mines are controlled by executives in other countries and have few connections to Canada.
Industry Minister Mélanie Joly called the Anglo American-Teck deal “a merger of equals” and a “significant victory” for Canadians.
“It is an unequivocal endorsement of the federal government’s efforts to build the strongest economy in the G7,” she said in a statement on Tuesday.
Joly also said the companies made a series of legally binding commitments, such as maintaining Teck’s current employment levels within Canada, amounting to about 4,000 jobs; making sure 66 per cent of the senior executives must primarily reside in Canada and pay taxes there; and having 50 per cent Canadian representation on the board for seven years and 33 per cent thereafter.
She said that will keep management oversight and decision-making in Canada “in perpetuity regardless of any future transactions.”
The companies also committed to invest $4.5 billion in Canada over the next five years and $10 billion over the next 15 years. The new entity will also proceed with an extension of the Highland Valley Copper Mine in British Columbia and make enhancements to its smelter in Trail, B.C.
The Canadian government’s approval under the Investment Canada Act came about one week after shareholders of both companies voted overwhelmingly in favour of the deal. A number of trade organizations, including the Greater Vancouver Board of Trade, British Columbia Chamber of Commerce and Mining Association of British Columbia, have strongly supported it.
The merged company also will have assets in Chile, Peru, Brazil, South Africa, Australia and other countries.
The deal still needs to gain additional regulatory approvals, including in other counties, which could take months.
Under the proposed new company, Teck chief executive Jonathan Price will become deputy CEO, while Anglo chief executive Duncan Wanblad will retain his title.
From the beginning, the companies said the deal would create strong synergies because both control stakes in major copper mines adjacent to one another in Chile and could share certain assets. By putting them together, the companies could produce an additional 175,000 tonnes of copper per year and increase their annual earnings before interest, taxes, depreciation and amortization by $1.4 billion.
The companies said they also expect an additional $800 million in recurring synergies.
Wanblad has said the new company will maintain ties to both Canada and South Africa, where Anglo American was founded.
“We are all committed to preserving and building on the proud heritage of both companies, in Canada, as home to Anglo Teck’s global headquarters, in South Africa, where our commitment to investment and national priorities endures, and across our entire global operational and commercial footprint,” he said in a statement.
• Email: gfriedman@postmedia.com
Teck Resources and Anglo American late on Monday said it has received regulatory approval from the government of Canada under the Investment Canada Act for their merger of equals.
The deal is expected to establish a global critical minerals company headquartered in Canada.
The combined company, to be named Anglo Teck, has committed to spend at least C$4.5 billion in Canada within five years, including in connection with the Highland Valley Copper mine life extension, boosting critical minerals processing capacity at Trail, and advancing the development of the Galore Creek and Schaft Creek copper projects in British Columbia.
These projects will allow Anglo Teck to spend at least C$10 billion in total over 15 years.
The merger was approved by each company's shareholders at meetings held on Dec. 9. Deal completion is subject to customary conditions, including necessary regulatory approvals.
The merger has received competition approvals in Canada and Australia, with other reviews in progress.
Lundin Mining (TSX:LUN) has quietly doubled investors money over the past year, with shares up about 62% in the past 3 months. This performance is prompting a closer look at what is driving the momentum.
See our latest analysis for Lundin Mining.
With the share price now around CA$27.21 and a 90 day share price return of roughly 62%, Lundin Mining’s momentum looks firmly in “building” territory, backed by a 1 year total shareholder return of nearly 120% that reflects growing optimism about copper focused growth.
If Lundin’s run has you thinking bigger about the sector, it could be a good time to explore fast growing stocks with high insider ownership for other fast moving opportunities with committed insiders behind them.
Yet with Lundin Mining now trading slightly above the average analyst target and at a premium to some historical valuation markers, investors must ask: Is there still a buying opportunity here, or is future growth already priced in?
Most Popular Narrative: 10.9% Overvalued
Compared to the last close at CA$27.21, the most followed narrative points to a lower fair value of about CA$24.55, framing a richer valuation backdrop.
Lundin’s exposure to long term structural trends, specifically the rising demand for copper, nickel, and zinc driven by global electrification, infrastructure growth, and adoption of green technologies, is expected to underpin favorable pricing and volume growth, providing tailwinds to revenue and profitability as new projects come online.
Want to see how modest top line growth, fatter margins, and a punchy earnings multiple combine into that fair value call? The narrative walks through each step of the forecast engine, and the tension between earnings expansion and a premium valuation multiple might surprise you.
Result: Fair Value of $24.55 (OVERVALUED)
Have a read of the narrative in full and understand what’s behind the forecasts.
However, concentrated South American copper exposure and capital intensive growth projects mean political shocks or project delays could quickly undermine today’s optimistic valuation story.
Find out about the key risks to this Lundin Mining narrative.
Build Your Own Lundin Mining Narrative
If the consensus view does not quite fit your outlook, or you prefer to work from first principles, you can build a custom narrative in minutes: Do it your way.
A great starting point for your Lundin Mining research is our analysis highlighting 1 key reward and 1 important warning sign that could impact your investment decision.
Looking for more investment ideas?
If Lundin Mining already looks priced for perfection, now is the moment to broaden your watchlist and look for fresh opportunities before the crowd catches on.
-
Look for potential multi baggers early by scanning these 3613 penny stocks with strong financials that pair small market caps with solid fundamentals and meaningful growth prospects.
-
Explore the next wave of innovation by reviewing these 26 AI penny stocks that are using artificial intelligence to reshape industries and develop new lines of business.
-
Identify value oriented opportunities with these 13 dividend stocks with yields > 3% that combine income streams with the potential for long term capital appreciation.
This article by Simply Wall St is general in nature. We provide commentary based on historical data and analyst forecasts only using an unbiased methodology and our articles are not intended to be financial advice. It does not constitute a recommendation to buy or sell any stock, and does not take account of your objectives, or your financial situation. We aim to bring you long-term focused analysis driven by fundamental data. Note that our analysis may not factor in the latest price-sensitive company announcements or qualitative material. Simply Wall St has no position in any stocks mentioned.
Companies discussed in this article include LUN.TO.
Have feedback on this article? Concerned about the content? Get in touch with us directly. Alternatively, email editorial-team@simplywallst.com
We recently published 7 Best ASX Stocks to Buy Right Now. BHP Group (NYSE:BHP) is one of the best ASX stocks.
BHP Group (NYSE:BHP) is one of the biggest mining companies in the world. The firm made an important announcement on December 9th when it revealed that BlackRock’s Global Infrastructure Partners would invest $2 billion in Western Australia Iron Ore’s inland power network. Through the deal, BHP Group (NYSE:BHP) will retain operational control of the site, and the two companies will create an entity in which the firm will hold a 51% stake. The mining company will pay a tariff to the new entity corresponding to its share.
Photo by Shane Cottle on Unsplash
Late November and early December also saw considerable action by analysts for BHP Group (NYSE:BHP)’s shares. For instance, on December 3rd, JPMorgan increased its share price target for the firm to GBp 2,300 from GBp 2,100 and kept a Neutral rating on the shares. On November 24th, Bank of America Securities kept a Buy rating and an A$49 share price target. BHP Group (NYSE:BHP) also made an important announcement on November 24th when it announced that it was “no longer considering” a combination with Anglo American plc. The firm cited the “potential of its own organic growth strategy” as one of the reasons behind walking away from a deal that many thought was in response to Anglo teaming up with Teck Resources to create a sizable entity in the copper industry.
While we acknowledge the potential of BHP as an investment, our conviction lies in the belief that some AI stocks hold greater promise for delivering higher returns and have limited downside risk. If you are looking for an extremely cheap AI stock that is also a major beneficiary of Trump tariffs and onshoring, see our free report on the best short-term AI stock.
READ NEXT: 30 Stocks That Should Double in 3 Years and 11 Hidden AI Stocks to Buy Right Now.
Disclosure: None. This article is originally published at Insider Monkey.
Analysts have nudged their fair value estimate for BHP Group slightly lower, trimming it from 45.21 to 44.94 as they refine their long term assumptions rather than rethink the investment case. The modestly higher discount rate and a sharply upgraded revenue growth outlook reflect a more nuanced view of how macro risks and diversified commodity exposure may shape future cash flows. Stay tuned to see how investors can track these shifting assumptions and stay ahead of the evolving BHP narrative.
Stay updated as the Fair Value for BHP Group shifts by adding it to your watchlist or portfolio. Alternatively, explore our Community to discover new perspectives on BHP Group.
What Wall Street Has Been Saying
🐂 Bullish Takeaways
- JPMorgan analyst Dominic O'Kane has maintained a Neutral stance through recent revisions, which still signals confidence in BHP Group's ability to execute despite shifting macro conditions and commodity price uncertainty.
- The October price target lift from 2,160 GBp to 2,200 GBp at JPMorgan pointed to improving conviction in BHP's operational delivery and cash generation, with execution, cost control, and portfolio quality seen as supportive of long term value.
- Even after the later cut to 2,100 GBp, JPMorgan's target continues to sit close to prior highs, underscoring the view that BHP's diversified exposure and scale give it solid medium term growth and capital return potential.
🐻 Bearish Takeaways
- The subsequent reduction of JPMorgan's price target from 2,200 GBp to 2,100 GBp signals increasing caution on valuation, with some upside seen as already priced in given macro and commodity cycle risks.
- By keeping a Neutral rating rather than upgrading, Dominic O'Kane indicates that while BHP's execution is credible, near term uncertainties around demand, pricing, and capital allocation temper enthusiasm on further re rating from here.
Do your thoughts align with the Bull or Bear Analysts? Perhaps you think there's more to the story. Head to the Simply Wall St Community to discover more perspectives or begin writing your own Narrative!
ASX:BHP 1-Year Stock Price Chart What's in the News
- Anglo American has rejected BHP Group's latest takeover proposal and chosen to pursue its planned merger with Teck Resources instead, which curbs BHP's near term M&A options to scale up copper exposure.
- The English High Court has ruled that BHP is legally liable under Brazilian law for the 2015 Mariana/Fundão dam collapse, with the size of potential damages to be set in later trial phases, introducing significant long tail legal and financial risk.
- The U.S. has added copper, silver and metallurgical coal to its critical minerals list, highlighting the strategic value of key commodities in BHP's portfolio and raising the prospect of shifting trade, tariff and policy dynamics around these markets.
- China's state iron ore buyer has temporarily banned U.S. dollar priced seaborne iron ore cargoes from BHP amid a pricing dispute. BHP is continuing to move volumes by selling discounted cargoes via private tenders to Chinese traders as it seeks to defend share in a crucial market.
How This Changes the Fair Value For BHP Group
- The fair value estimate has edged down slightly from 45.21 to 44.94, which implies a modest reduction in intrinsic valuation per share.
- The discount rate has risen slightly from approximately 8.01% to 8.03%, reflecting a marginally higher required return on equity.
- The revenue growth assumption has increased significantly from about 2.8% to roughly 21.7%, indicating a much stronger long term top line outlook.
- The net profit margin has eased slightly from around 21.63% to 21.58%, suggesting an almost unchanged but fractionally lower profitability profile.
- The future P/E multiple has ticked up slightly from 17.10x to 17.21x, signaling a marginally higher valuation placed on forecast earnings.
🔔 Never Miss an Update: Follow The Narrative
Narratives are easy-to-understand stories that connect your view of a company with the numbers behind it, from future revenue and earnings to margins and fair value. On Simply Wall St’s Community page, millions of investors use Narratives to link BHP Group’s story to a forecast and a fair value, then compare that to today’s share price to inform their decisions. As news, results, or macro events appear, these Narratives update dynamically so your investment view stays current and actionable.
Head over to the Simply Wall St Community and follow the Narrative on BHP Group to stay on top of how the story and the numbers evolve:
- How demand for critical minerals, steelmaking materials, and decarbonization projects could influence BHP’s long term revenue and earnings path.
- Whether disciplined capex, long life low cost assets, and a strong balance sheet can support sustained dividends, buybacks, and a premium valuation multiple.
- How project execution risks, ESG pressures, and legal liabilities might affect margins, cash flows, and the gap between fair value and the current share price.
Follow the full Narrative here: BHP, Commodity Cycles And Legal Liabilities Will Shape Future Performance Outlook.
Curious how numbers become stories that shape markets? Explore Community Narratives
This article by Simply Wall St is general in nature. We provide commentary based on historical data
and analyst forecasts only using an unbiased methodology and our articles are not intended to be financial advice. It does not constitute a recommendation to buy or sell any stock, and does not take account of your objectives, or your
financial situation. We aim to bring you long-term focused analysis driven by fundamental data.
Note that our analysis may not factor in the latest price-sensitive company announcements or qualitative material.
Simply Wall St has no position in any stocks mentioned.
Companies discussed in this article include BHP.AX.
Have feedback on this article? Concerned about the content? Get in touch with us directly. Alternatively, email editorial-team@simplywallst.com
Coeur Mining, Inc. CDE is currently trading at a forward 12-month price-to-sales multiple of 6.37X, above the peer group average of 3.95X.
Image Source: Zacks Investment Research
The forward 12-month price-to-sales multiples for peers Southern Copper Corporation SCCO and Lundin Mining Corporation LUNMF are 9.1X and 4.31X, respectively. CDE and SCCO currently have a Value Score of D, while LUNMF has a score of C.
Coeur Mining has gained 205.5% year to date compared with the Zacks Mining-Non Ferrous industry’s 37.6% increase and the S&P 500’s 19.4% rise.
Southern Copper and Lundin Mining are up 62% and 129%, respectively.
Price Performance of CDE vs. Industry, S&P 500, SCCO & LUNMF
Image Source: Zacks Investment Research
Let’s look at the CDE’s fundamentals to analyze the stock better.
Coeur Reports Robust Q3 Revenue on Multi-Mine Strength
Coeur Mining reported third-quarter consolidated revenue of approximately $555 million, which represented a substantial 77% year-over-year (YoY) increase from the third quarter of 2024. This jump was driven by higher realized metal prices, increased sales volumes and balanced contributions from each of the company’s five wholly owned North American gold and silver operations.
Coeur Mining’s diversified North American portfolio—which spans the Las Chispas silver-gold mine in Sonora, the Palmarejo gold-silver complex in Chihuahua, the Rochester silver-gold mine in Nevada, the Kensington gold operation in Alaska and the Wharf gold mine in South Dakota—was a key driver of its strong quarterly results. The company noted that revenue contributions were evenly spread across these five assets, with Palmarejo generating about 23%, Kensington 22%, Rochester 20%, Wharf 18% and Las Chispas roughly 17% of total third-quarter revenue.
This balanced operational mix allowed Coeur Mining to fully capitalize on higher metal prices and robust production levels across multiple regions, leading to better operational execution, reduced reliance on any single asset and reinforced the company’s overall growth trajectory across its North American footprint.
Strong Cash, Low Debt Highlight Coeur’s Q3 Momentum
The company’s financial transformation underpins a more resilient business model, deleveraging rapidly while still funding growth and returning capital. Coeur Mining ended the third quarter of 2025 with a significantly strengthened financial footing, holding $266.3 million in cash and equivalents, more than double its previous quarter's balance.
Coeur Mining generated $237.7 million in cash flow from operating activities during the quarter, a strong increase from $206.95 million in the previous quarter. This robust operating cash flow forms a foundation for Coeur’s capital deployment strategy, supporting capex, debt repayment and its shareholder return initiatives.
Year to date, it has repaid more than $228 million of debt, reducing its total debt to $363.5 million and bringing its net-leverage ratio down to a very conservative 0.1.
Coeur Mining invested $49 million in capital expenditures in the third quarter, of which about 70% was allocated to sustaining capex and 30% toward development projects. On the exploration front, the company spent $30 million, with $25 million expensed and $5 million capitalized, signaling a dual focus on reserve maintenance and future growth.
The cash cushion not only provides flexibility for further expansion but also reduces risk in a volatile commodity price environment.
Major Growth Projects to Boost Coeur’s Future Revenue
The Rochester silver-gold mine in Nevada remains one of Coeur’s most important growth engines. A major expansion project completed over the past few years has significantly increased the mine’s throughput capacity, with the new Stage VI leach pad and enhanced crushing circuit now in commercial production.
Coeur’s acquisition of Las Chispas brought a high-grade, low-cost silver-gold asset into its portfolio early in 2025, contributing meaningfully to production and top-line results, including in the third quarter. Las Chispas’ strong performance has enhanced the overall production mix and cash flow, and is expected to continue supporting revenue growth as the asset is fully integrated and optimized.
Coeur is executing one of its largest exploration programs to date, with substantial drilling underway at Palmarejo, Kensington, Wharf, Rochester and Las Chispas, aimed at extending mine lives, improving grades and expanding reserves. The company announced a commitment of $67-$77 million for the same.
At the Silvertip project in British Columbia, Coeur has more than tripled its land position and is undertaking expanded drilling programs aimed at increasing understanding of this polymetallic deposit. Early indicators suggest the potential for significant future resource additions.
CDE’s Rising Earnings Estimates Reflect Positive Sentiments
The Zacks Consensus Estimate for 2025 and 2026 for CDE has been revised higher over the past 60 days.
Image Source: Zacks Investment Research
The Zacks Consensus Estimate for CDE’s 2025 earnings is currently pegged at 87 cents per share, suggesting year-over-year growth of 383.3%.
Image Source: Zacks Investment Research
Final Thought: Hold CDE for Now
Coeur Mining carries a Zacks Rank of #3 (Hold) as its recent operational momentum is offset by ongoing risks. The company has benefited from stronger metal prices, improved production and a healthier cash position, reflecting early returns from its multi-year investment cycle. These positives are offset by persistent sensitivity to gold and silver price swings and elevated capital spending. Given the risks and premium valuation new investors may wait until CDE demonstrates steadier cost control, consistent production delivery and long-term cash-flow strength.
You can see the complete lists of Zacks Rank #1 Rank (Strong Buy) stocks here.
Want the latest recommendations from Zacks Investment Research? Today, you can download 7 Best Stocks for the Next 30 Days. Click to get this free report
Southern Copper Corporation (SCCO) : Free Stock Analysis Report
Coeur Mining, Inc. (CDE) : Free Stock Analysis Report
Lundin Mining Corp. (LUNMF) : Free Stock Analysis Report
This article originally published on Zacks Investment Research (zacks.com).
VANCOUVER, BC, Dec. 12, 2025 /CNW/ – Gold Royalty Corp. ("Gold Royalty" or the "Company") (NYSE American: GROY) is pleased to announce that, further to its news release dated December 8, 2025, it has completed its acquisition of a royalty (the "Royalty") on the Pedra Branca operating copper and gold mine ("Pedra Branca"), currently owned and operated by a subsidiary of BHP Group Limited (the "Transaction").
The Royalty consists of a 25% NSR on gold and a 2% NSR on copper and other products produced from the Pedra Branca mine, comprising the Pedra Branca West and Pedra Branca East areas, and the former Antas North mine which has been fully depleted.
About Gold Royalty Corp.
Gold Royalty Corp. is a gold-focused royalty company offering creative financing solutions to the metals and mining industry. Its mission is to invest in high-quality, sustainable, and responsible mining operations to build a diversified portfolio of precious metals royalty and streaming interests that generate superior long-term returns for our shareholders. Gold Royalty's diversified portfolio currently consists primarily of net smelter return royalties on gold properties located in the Americas.
View original content:https://www.prnewswire.com/news-releases/gold-royalty-completes-pedra-branca-royalty-acquisition-302640000.html
Momentum investing is all about the idea of following a stock's recent trend, which can be in either direction. In the "long context," investors will essentially be "buying high, but hoping to sell even higher." And for investors following this methodology, taking advantage of trends in a stock's price is key; once a stock establishes a course, it is more than likely to continue moving in that direction. The goal is that once a stock heads down a fixed path, it will lead to timely and profitable trades.
While many investors like to look for momentum in stocks, this can be very tough to define. There is a lot of debate surrounding which metrics are the best to focus on and which are poor quality indicators of future performance. The Zacks Momentum Style Score, part of the Zacks Style Scores, helps address this issue for us.
Below, we take a look at BHP (BHP), a company that currently holds a Momentum Style Score of A. We also talk about price change and earnings estimate revisions, two of the main aspects of the Momentum Style Score.
It's also important to note that Style Scores work as a complement to the Zacks Rank, our stock rating system that has an impressive track record of outperformance. BHP currently has a Zacks Rank of #1 (Strong Buy). Our research shows that stocks rated Zacks Rank #1 (Strong Buy) and #2 (Buy) and Style Scores of "A or B" outperform the market over the following one-month period.
You can see the current list of Zacks #1 Rank Stocks here >>>
Set to Beat the Market?
Let's discuss some of the components of the Momentum Style Score for BHP that show why this global miner shows promise as a solid momentum pick.
Looking at a stock's short-term price activity is a great way to gauge if it has momentum, since this can reflect both the current interest in a stock and if buyers or sellers have the upper hand at the moment. It's also helpful to compare a security to its industry; this can show investors the best companies in a particular area.
For BHP, shares are up 7.53% over the past week while the Zacks Mining – Miscellaneous industry is up 2.79% over the same time period. Shares are looking quite well from a longer time frame too, as the monthly price change of 8.88% compares favorably with the industry's 10.91% performance as well.
While any stock can see its price increase, it takes a real winner to consistently beat the market. That is why looking at longer term price metrics — such as performance over the past three months or year — can be useful as well. Over the past quarter, shares of BHP have risen 16.75%, and are up 16.15% in the last year. On the other hand, the S&P 500 has only moved 5.09% and 14.7%, respectively.
Investors should also pay attention to BHP's average 20-day trading volume. Volume is a useful item in many ways, and the 20-day average establishes a good price-to-volume baseline; a rising stock with above average volume is generally a bullish sign, whereas a declining stock on above average volume is typically bearish. BHP is currently averaging 2,860,280 shares for the last 20 days.
Earnings Outlook
The Zacks Momentum Style Score encompasses many things, including estimate revisions and a stock's price movement. Investors should note that earnings estimates are also significant to the Zacks Rank, and a nice path here can be promising. We have recently been noticing this with BHP.
Over the past two months, 2 earnings estimates moved higher compared to none lower for the full year. These revisions helped boost BHP's consensus estimate, increasing from $3.89 to $4.59 in the past 60 days. Looking at the next fiscal year, 2 estimates have moved upwards while there have been no downward revisions in the same time period.
Bottom Line
Given these factors, it shouldn't be surprising that BHP is a #1 (Strong Buy) stock and boasts a Momentum Score of A. If you're looking for a fresh pick that's set to soar in the near-term, make sure to keep BHP on your short list.
Want the latest recommendations from Zacks Investment Research? Today, you can download 7 Best Stocks for the Next 30 Days. Click to get this free report
BHP Group Limited Sponsored ADR (BHP) : Free Stock Analysis Report
This article originally published on Zacks Investment Research (zacks.com).
Friday, December 12, 2025The Zacks Research Daily presents the best research output of our analyst team. Today's Research Daily features new research reports on 16 major stocks, including Visa Inc. (V), The Charles Schwab Corp. (SCHW) and Amphenol Corp. (APH), as well as two micro-cap stocks Autoscope Technologies Corp. (AATC) and United-Guardian, Inc. (UG). The Zacks microcap research is unique as our research content on these small and under-the-radar companies is the only research of its type in the country.These research reports have been hand-picked from the roughly 70 reports published by our analyst team today.You can see all of today’s research reports here >>>Ahead of Wall StreetThe daily 'Ahead of Wall Street' article is a must-read for all investors who would like to be ready for that day's trading action. The article comes out before the market opens, attempting to make sense of that morning's economic releases and how they will affect that day's market action. You can read this article for free on our home page and can actually sign up there to get an email notification as this article comes out each morning.You can read today's AWS here >>> Pre-markets Mixed Ahead of Consequential Week of DataToday's Featured Research ReportsVisa’s shares have outperformed the Zacks Financial Transaction Services industry over the past year (+11.1% vs. -8.7%). The company’s strong market position is underpinned by consistent volume-driven growth, acquisitions and technological leadership in digital payments. Expansion in cross-border volumes, rising transactions and investments in AI and stablecoin infrastructure enhance its future prospects.Total revenue rose 11% YoY in FY25, along with 13% cross-border growth. A robust financial position with ample liquidity and shareholder returns further supports long-term growth. However, it faces rising client incentives and expenses, which can affect margin growth. The Zacks analyst expects FY26 adjusted costs to rise nearly 11%. Regulatory pressures and potential legislative changes pose additional risks to its fee structure. While declining cash volumes align with its digital strategy, regional softness warrants monitoring. As such, the stock warrants a cautious stance.(You can read the full research report on Visa here >>>)Shares of Charles Schwab have gained +21.8% over the past year against the Zacks Financial – Investment Bank industry’s gain of +37%. The company’s expenses will likely remain elevated amid continued investments in marketing, thus hurting the bottom line. The Zacks analyst expects expenses to witness a CAGR of 7% by 2027. The uncertainty about the performance of the capital markets is another major concern. Nevertheless, Strategic buyouts (including the deal to buy Forge Global) and branch expansion efforts amid favorable market conditions will likely drive client assets. We estimate total client assets to witness a CAGR of 8.2% by 2027. Despite the rate cuts so far along with expectations of more, relatively higher rates and an increased focus on repaying high-cost bank supplemental funding balances will support net interest margin (NIM). A solid balance sheet and liquidity position will enable sustainable capital distribution activities.(You can read the full research report on Charles Schwab here >>>)Amphenol’s shares have gained +88.5% over the past year against the Zacks Electronics – Connectors industry’s gain of +89.8%. The company benefits from a diversified business model that lowers the volatility of individual end markets and geographies. Its strong portfolio of solutions, including high-technology interconnect products, is a key catalyst. Expanding spending on both current and next-generation defense technologies bodes well for APH’s top-line growth. Apart from Defense, APH’s prospects ride on strong demand for its solutions across Commercial Air, Industrial, and IT Datacom. Strong demand for high-speed and power interconnect products, which are critical components in next-gen IT systems, creates long term growth opportunities. APH expects fourth-quarter 2025 earnings to grow between 62% and 65% year over year. Revenues are anticipated to grow in the 39-41% range. However, macroeconomic uncertainty and stiff competition are major concerns. (You can read the full research report on Amphenol here >>>)Shares of Autoscope Technologies have underperformed the Zacks Technology Services industry over the past year (-5.5% vs. +20.6%). This microcap company with a market capitalization of $34.02 million is strengthening its position in the evolving ITS market through a next-generation platform built for AI-driven detection, multi-sensor integration and Smart City readiness, supporting future upgrades and broader use cases. Autoscope Technologies’ shift toward data-centric analytics expands long-term market opportunity and deepens customer integration through recurring software revenues. Federal safety initiatives provide multi-year demand tailwinds across its portfolio, while a new long-duration contract in Georgia enhances visibility and diversifies revenue beyond traditional ITS. An exclusive distribution agreement with Econolite secures stable market access during product transitions, and a capital-efficient operating model enables sustained innovation without dilution or added leverage.(You can read the full research report on Autoscope Technologies here >>>)United-Guardian’s shares have underperformed the Zacks Medical – Products industry over the past year (-34.4% vs. -0.5%). This microcap company with a market capitalization of $27.57 million is facing declining profitability, weakened operating leverage and ongoing instability in the cosmetics segment tied to partner and regional exposure. Limited R&D intensity restricts innovation momentum, and rising working capital needs point to operational strain. Persistent tariffs and geographic risks add uncertainty to margin recovery and long-term earnings visibility.
Nevertheless, United-Guardian’s investment case reflects strengths in expanding its pharmaceutical portfolio, particularly through broader formulary access for Renacidin, alongside stable medical products that support baseline revenues.
Strong cash conversion enables sustained capital returns with a conservative balance sheet. Growing international distribution further reduces concentration risks, while the upcoming Natrajel launch adds a differentiated growth avenue. (You can read the full research report on United-Guardian here >>>)Other noteworthy reports we are featuring today include American Express Co. (AXP), BHP Group Ltd. (BHP) and Trane Technologies plc (TT).Mark VickerySenior EditorNote: Sheraz Mian heads the Zacks Equity Research department and is a well-regarded expert of aggregate earnings. He is frequently quoted in the print and electronic media and publishes the weekly Earnings Trends and Earnings Preview reports. If you want an email notification each time Sheraz publishes a new article, please click here>>>
Today's Must Read
Visa (V) Rides On Cross Border Volume Growth, Expenses High
Strategic Acquisitions Aid Schwab (SCHW) Amid Cost Concerns
End-Market Strength and Diversification Aids Amphenol (APH)
Featured Reports
AmEx (AXP) Aided by Strong Card Member Spending Amid High CostsPer the Zacks analyst, higher card member spending will drive American Express' U.S. Consumer Services unit. However, growing expenses will impact its profit growth.
Strong HVAC Market Aids Trane Technologies (TT), Costs HighPer the Zacks analyst, Trane Technologies' top-line gains from a strong HVAC Market. Innovative customer-centric solutions are fueling the company's growth. Rising costs remain a concern.
Improving Air Traffic Aid Curtiss-Wright (CW) Amid Labor ShortagePer the Zacks analyst, Curtiss-Wright is likely to benefit from the improving air traffic. Yet labor shortage result in delays and likely impact operating results.
Strength in Industrial Segment Aids Graco (GGG), Costs HurtPer the Zacks analyst, solid traction of Graco's Industrial segment, led by solid demand for liquid finishing systems should drive its growth. However, high operating costs remain concerning.
UDR's Growth Buoyed by Demand Despite Supply and Competition PressuresPer the Zacks analyst, UDR's strong portfolio, healthy demand and tech-driven efficiencies support growth, though elevated supply in select markets and rising competition may temper rent gains ahead.
Range Resources (RRC) Thrives with Low-Cost Marcellus GasPer the Zacks analyst, Range Resources leverages low-cost Marcellus operations and a strong liquids mix to generate resilient cash flows and deliver attractive returns, even amid gas price volatility.
Syfovre and Empaveli Sales Boost Apellis (APLS), Overdependence A WoePer the Zacks Analyst, Syfovre and Empaveli sales have been driving revenues for Apellis. However, the company's dependence on these drugs for growth is concerning.
New Upgrades
Investment in Growth Projects to Aid BHP Group (BHP)The Zacks analyst appreciates BHP's focus on investing in commodities that will help it ride on growing global trends such as decarbonization as well as its efforts to make operations more efficient.
Seagate Gains From (STX) Increasing Data Center and AI Demand Per the Zacks analyst, Seagate's cost-efficient, high-density, and reliable storage gives it a competitive edge in serving hyperscale cloud providers, social media and AI-driven enterprises.
Sanmina (SANM) Rides on Healthy Demand, Portfolio StrengthPer the Zacks analyst, solid momentum across multiple verticals, including communications networks, cloud and AI infrastructure, will likely drive Sanmina's top line.
New Downgrades
Bath and Body Works (BBWI) Faces Demand Weakness and Margin PressurePer the Zacks analyst, BBWI continues to grapple with broad demand softness, heavier promotions and tariff pressures, signaling prolonged margin and growth challenges.
QuidelOrtho (QDEL) Faces Solvency Issues, Competition and Policy RiskPer the Zacks Analyst, QuidelOrtho (QDEL) faces stiff competition, weak solvency, and reimbursement uncertainties, though strong product sales and lab potential offer cautious optimism.
High Costs and Macro Woes Hurt Toll Brothers' (TOL) PerformancePer the Zacks analyst, Toll Brothers' business is being hurt by ongoing affordability concerns in the housing market. Also, higher land and labor costs are added concerns.
Want the latest recommendations from Zacks Investment Research? Today, you can download 7 Best Stocks for the Next 30 Days. Click to get this free report
Visa Inc. (V) : Free Stock Analysis Report
BHP Group Limited Sponsored ADR (BHP) : Free Stock Analysis Report
American Express Company (AXP) : Free Stock Analysis Report
Amphenol Corporation (APH) : Free Stock Analysis Report
The Charles Schwab Corporation (SCHW) : Free Stock Analysis Report
Trane Technologies plc (TT) : Free Stock Analysis Report
United-Guardian, Inc. (UG): Free Stock Analysis Report
Autoscope Technologies Corporation (AATC) : Free Stock Analysis Report
This article originally published on Zacks Investment Research (zacks.com).
Southern Copper (SCCO) just climbed to a top Zacks Rank of 1, with consensus earnings estimates rising about 7% this past quarter, and that upgrade is reshaping how investors are sizing up the stock.
See our latest analysis for Southern Copper.
That stronger earnings story is landing on top of powerful momentum, with Southern Copper’s share price now at $140.4 and supported by a roughly 57.9% year to date share price return. Its five year total shareholder return above 200% shows the longer term trend has been firmly in investors’ favor.
If you are weighing Southern Copper’s run and wondering what else might be setting up for strong multi year compounding, this is a good moment to discover fast growing stocks with high insider ownership.
Yet with the stock trading above many analyst targets and its value score looking stretched, investors have to ask: Is Southern Copper still a buyable compounder, or is the market already pricing in years of growth ahead?
Most Popular Narrative: 18.7% Overvalued
With Southern Copper last closing at $140.4 against a narrative fair value of $118.29, the story hinges on future copper tightness and margin gains.
The analysts have a consensus price target of $95.247 for Southern Copper based on their expectations of its future earnings growth, profit margins and other risk factors. However, there is a degree of disagreement amongst analysts, with the most bullish reporting a price target of $128.7, and the most bearish reporting a price target of $66.63.
Curious how relatively modest revenue growth, rising margins and a premium future earnings multiple can still point to downside from here? The full narrative joins those dots.
Result: Fair Value of $118.29 (OVERVALUED)
Have a read of the narrative in full and understand what’s behind the forecasts.
However, a sharper than expected downturn in global growth or renewed project disruptions, particularly at Tia Maria, could quickly undermine the bullish earnings path.
Find out about the key risks to this Southern Copper narrative.
Build Your Own Southern Copper Narrative
If you want to stress test this view or build your own angle from the numbers, you can craft a full narrative in minutes, Do it your way.
A great starting point for your Southern Copper research is our analysis highlighting 2 key rewards and 1 important warning sign that could impact your investment decision.
Looking for your next smart investment angle
Before you move on, put Simply Wall Street’s Screener to work so you do not miss fresh opportunities that could outpace Southern Copper over the next few years.
-
Capture early stage momentum by scanning these 3589 penny stocks with strong financials that pair smaller market caps with robust balance sheets and improving fundamentals.
-
Position ahead of the next tech wave by targeting these 27 AI penny stocks that are building real revenue from artificial intelligence, not just hype.
-
Explore income potential with these 15 dividend stocks with yields > 3% focused on reliable payouts that may support overall portfolio returns through different market conditions.
This article by Simply Wall St is general in nature. We provide commentary based on historical data and analyst forecasts only using an unbiased methodology and our articles are not intended to be financial advice. It does not constitute a recommendation to buy or sell any stock, and does not take account of your objectives, or your financial situation. We aim to bring you long-term focused analysis driven by fundamental data. Note that our analysis may not factor in the latest price-sensitive company announcements or qualitative material. Simply Wall St has no position in any stocks mentioned.
Companies discussed in this article include SCCO.
Have feedback on this article? Concerned about the content? Get in touch with us directly. Alternatively, email editorial-team@simplywallst.com
REAlloys, which is in the process of merging with Blackboxstocks Inc. (NASDAQ: BLBX), has moved to the front of the rare earth sector with a new agreement that gives it control over the lion’s share of North America’s upcoming heavy rare earth production.
Its partnership with the Saskatchewan Research Council (SRC) brings commercial volumes of dysprosium, terbium, and high-purity NdPr into the region for the first time, directly targeting the largest bottleneck in Western magnet manufacturing.
Reuters described the transaction as a “rare earths tie-up with strategic implications for the North American supply chain” because policymakers have their eyes glued to this space in light of 2027 procurement rules.
As new U.S. sourcing laws tighten, REAlloys now holds the supply position that downstream defense and advanced-manufacturing buyers will depend on, the Globe & Mail heralding the SRC facility as “North America’s first vertically integrated rare-earth processing complex–capable of separation and smelting at commercial scale”.
This is the segment of the supply chain the United States has been trying to rebuild for nearly two decades.
Heavy rare earths are the performance elements. They dictate whether a magnet can withstand heat, acceleration, and EMI without losing stability. These are all capabilities that extend far beyond defense. They are central to electric-vehicle motors, high-efficiency industrial equipment, medical imaging, renewable-energy generation, satellites, aerospace controls, and precision manufacturing. In short, they sit at the core of technologies that underpin both modern economies and military readiness.
And until now, North America has had no commercial-scale ability to refine them.
A Midstream Capability the Region Has Never Had
SRC’s facility in Saskatoon is North America’s first rare-earth complex designed to integrate monazite processing, separation, and metal production at a commercial scale. That’s a capability the region has lacked for decades.
The new agreement with REAlloys accelerates that evolution by adding a full heavy rare earth line, transforming the site from an advanced separation plant into the continent’s only integrated source of dysprosium, terbium, and high-purity NdPr metals.
Under the partnership, REAlloys will invest approximately $21 million to expand SRC’s refining capacity, increasing heavy rare earth throughput by roughly 300% and boosting NdPr metal output by about 50%.
When the upgraded system enters production in early 2027, SRC expects to deliver 30 tonnes of dysprosium oxide, 15 tonnes of terbium oxide, and 400-600 tonnes of high-purity NdPr metal annually.
REAlloys has secured 80% of this expanded output under a long-term offtake arrangement, a position that gives the company the dominant share of the first commercial heavy rare earth production run in North America.
According to the announcement, the redesigned system will also include “AI-driven separation and smelting infrastructure,” enabling SRC to move directly into metal production rather than stopping at oxide, a step most Western facilities historically have been unable to achieve.
This changes where REAlloys sits in the market. It is no longer a magnet manufacturer with upstream ambitions. Instead, it’s the principal customer of the only heavy rare earth refining platform in the region, and one of the few companies globally positioned to supply high-performance magnet metals into compliant supply chains.
The timing is highly strategic.
Beginning January 1, 2027, the U.S. Department of Defense will be barred from sourcing rare earth metals, magnets, and components from China, Russia, Iran, or North Korea. Federal buyers will shift procurement to domestic or allied suppliers. And for heavy rare earth metals, SRC’s upgraded facility–with REAlloys as its primary offtake partner–will be the only operation ready to meet that requirement at commercial scale.
Integrating the Chain From Source to Magnet
This agreement fits into a larger structure REAlloys has been putting in place across the rare-earth chain.
At the upstream level, the company anchors its plans in Hoidas Lake in Saskatchewan, a deposit with roughly 2.15 million tonnes of measured and indicated TREO and one of Canada’s most significant rare-earth resources. It gives REAlloys a defined long-term feedstock, supported by additional allied and recycled material sources that broaden the supply base.
The midstream is defined by the Saskatchewan Research Council’s separation and metal-making operation, now being expanded with AI-driven separation and smelting systems to create North America’s first commercial-scale heavy rare earth production line. Under the new agreement, REAlloys becomes the primary offtake partner for this upgraded capacity, securing 80% of the heavy rare earth output and effectively linking its upstream resource base to a domestic refining platform capable of producing dysprosium, terbium, and high-purity NdPr metals at meaningful scale.
Downstream, the Euclid Magnet Facility in Ohio forms the final step in the chain. Established in 2013 to serve U.S. Department of Defense and Department of Energy customers, the facility produces advanced alloys and magnet materials, holds SBIR status that permits sole-source federal procurement, and has earned multiple R&D 100 awards and associated materials-science distinctions. Together, these assets give REAlloys something Western operators have struggled to assemble: a vertically aligned system that spans ore, metals, alloys, and magnets inside a single continental corridor.
Adding to this structure is a clear signal from Washington.
The U.S. Export-Import Bank issued a $200 million Letter of Interest in support of REAlloys’ integrated mine-to-magnet strategy, underscoring federal recognition of the need for a domestic magnet industry as procurement rules tighten.
Piece by piece, the company has begun to build the architecture of a supply chain that has been missing from North America for decades and is now central to reindustrialization efforts on both sides of the border.
A Shift in Market Dynamics
Demand for high-performance magnets continues to accelerate across defense, electric mobility, automation, satellites, and clean energy. Still, the bottleneck has always been the same. Even when Western miners produced rare earth concentrate, they still depended on China for metal-making and heavy rare earth preparation.
That pressure point is now tightening under new procurement rules. Beginning January 1, 2027, the U.S. Department of Defense will be barred from sourcing rare earth metals, magnets, and components from China, Russia, Iran, or North Korea.
This shift forces federal buyers to transition toward domestic or allied supply. Most manufacturers are not ready for that deadline.
REAlloys, through its partnership with SRC, is now one of the only groups positioned to supply dysprosium, terbium, and NdPr metals at the volumes required by the U.S. and Canadian industrial base.
Heavy rare earths remain the least substitutable inputs in magnet production. They determine stability under heat, acceleration, magnetic load, and environmental stress–all the things that define missile guidance accuracy, aircraft efficiency, EV motor durability, satellite maneuvering, and industrial automation reliability. For nearly 15 years, every Western supply chain assessment has identified heavy rare earths as the system’s most acute vulnerability.
With this agreement, that vulnerability lessens. REAlloys and SRC are establishing the first commercially scaled heavy rare earth production line in North America, and for the first time, a significant portion of that output is contracted directly to a domestic magnet producer.
Execution Will Define the Next Step
North America’s rare earth problem has never been about geology. It has always been the absence of a functioning midstream, the refining and metal-making steps that turn mined material into usable inputs. This gap has forced the United States and Canada to depend on offshore supply even when domestic or allied resources were available.
Heavy rare earths have been the hardest of all to source, leaving defense, aerospace, and advanced manufacturing exposed to single-country dependence for the materials that determine thermal stability, precision, and performance.
SRC’s expansion arrives as North America finally confronts the part of the rare earth chain it never built: the part rare earths are converted into usable critical materials. Beginning in 2027, U.S. defense buyers must shift away from Chinese supply, but the region has had no commercial-scale source of dysprosium, terbium, or NdPr metals, prompting Reuters to note that the SRC upgrade is the first step toward filling that gap.
The REAlloys agreement doesn’t close the loop, but it does create the first steady flow of heavy rare earth metals inside the U.S.-Canada system. For defense, auto manufacturing, and advanced industrial applications, it marks a shift from theoretical supply to material that can be contracted, scheduled, and built into production plans.
What happens next depends on execution. If SRC delivers its upgraded capacity on schedule and if downstream buyers adapt to the new procurement landscape, 2027 could mark the first time North America has had a functional heavy rare earth channel of its own. It would not eliminate vulnerability, but it would begin to narrow the exposure that has shaped every rare earth strategy discussion since the early 2000s.
Other companies to watch in the resources sector:
Vale S.A. (NYSE: VALE)
Vale S.A. continues to aggressively decouple its base metals operations from its traditional iron ore business to capture higher valuations in the green energy market. The Brazilian mining giant has formally structured Vale Base Metals as a distinct entity tasked with managing its vast nickel and copper assets in Canada, Brazil and Indonesia. This strategic separation allows the unit to operate with the agility of a growth-focused company while leveraging the massive capital resources of its parent.
Vale is currently executing a $25 billion to $30 billion capital investment program aimed at increasing its copper production to 900,000 metric tons per year and its nickel output to 300,000 metric tons per year by 2030. The company’s operations in Sudbury, Ontario, and Voisey’s Bay in Labrador remain the linchpins of this strategy, providing low-carbon nickel rounds and pellets that Western automakers prioritize for their compliance with inflation-reduction incentives and ESG mandates.
Beyond simple extraction, Vale has deepened its downstream integration to secure its role as a direct supplier to the battery supply chain. The company is advancing joint ventures in Indonesia to process laterite nickel ore using high-pressure acid leaching technology, a method essential for producing the mixed hydroxide precipitate required for battery cathodes. Simultaneously, Vale has solidified long-term supply agreements with major automotive partners, including General Motors and Tesla, ensuring that a significant percentage of its high-grade Class 1 nickel is allocated directly to North American and European electric vehicle production.
Energy Fuels Inc. (NYSE American: UUUU)
Energy Fuels Inc. has successfully transitioned from a pure-play uranium miner into a diversified critical minerals processor, leveraging its White Mesa Mill in Utah to bridge a critical gap in the U.S. supply chain. As of late 2025, the company is processing commercial volumes of monazite sands—a radioactive byproduct of heavy mineral sand operations—to recover both uranium and rare earth elements.
The White Mesa Mill is the only facility in the United States with the existing licenses and tailings capacity to handle the radionuclides associated with monazite, giving Energy Fuels a distinct regulatory advantage. The company has moved beyond producing a mixed rare earth carbonate and is now operating Phase 1 separation circuits to produce commercial quantities of separated neodymium and praseodymium oxides. This operational shift effectively bypasses the historical necessity of shipping American feedstocks to China for separation, creating a nascent but vital domestic pathway for magnet materials.
To secure sufficient feedstock for this expansion, Energy Fuels has aggressively acquired heavy mineral sand projects in the Southern Hemisphere, including the acquisition of Base Resources and its Toliara Project in Madagascar, as well as the Bahia Project in Brazil. These acquisitions provide the company with a vertically integrated supply of monazite, insulating it from spot market volatility. The company is utilizing its "crack and leach" capacity to extract the rare earths while simultaneously recovering uranium for the nuclear fuel market, creating a dual-revenue model that lowers the effective cost of production for both commodities.
MP Materials Corp. (NYSE: MP)
MP Materials Corp. has completed its multi-year strategy to restore the full rare earth magnet supply chain to the United States. While the company continues to maximize output at its Mountain Pass mine in California, its strategic focus has shifted heavily toward midstream and downstream manufacturing.
In 2025, MP Materials ramped up commercial production at its magnet manufacturing facility in Fort Worth, Texas. This facility is now actively producing finished neodymium-iron-boron magnets, sourcing the metal alloy directly from the company’s own separated oxides. This vertical integration allows MP Materials to control every step of the process, from the open pit in California to the finished component in Texas, effectively insulating its customers from the geopolitical risks associated with the Chinese supply chain. The Fort Worth plant is designed to produce approximately 1,000 tonnes of finished magnets annually in its initial phase, with plans to scale significantly to meet demand from General Motors and other automotive partners.
MP Materials has secured substantial backing from the Department of Defense to refine heavy rare earths as well, acknowledging that a complete magnet supply chain requires dysprosium and terbium. The company is currently fulfilling a contract to supply rare earth materials to the Pentagon, underscoring the dual-use nature of its products. By successfully closing the loop between mining and manufacturing, MP Materials has established itself not just as a mining firm, but as the foundational industrial anchor for the American electrification and defense sectors.
Critical Metals Corp. (NASDAQ: CRML)
Critical Metals Corp. is advancing its "trans-Atlantic" strategy to supply strategic materials to Western markets through its flagship assets in Austria and Greenland. The company’s Wolfsberg Lithium Project in Carinthia, Austria, has moved through the definitive feasibility stage and is positioning itself as the first fully permitted lithium mine in Europe.
Located roughly 170 miles from major battery manufacturing hubs, Wolfsberg offers a logistical advantage that reduces transportation emissions and aligns with the European Union’s Critical Raw Materials Act. The project is designed as an underground mine to minimize surface disruption, a key factor in securing local community support and regulatory approval in an environmentally sensitive region. Critical Metals has signed binding offtake agreements with top-tier partners like BMW, ensuring that the lithium hydroxide produced at Wolfsberg has a guaranteed route to market as soon as commercial production begins.
In parallel, the company is developing the Tanbreez Rare Earth Project in Greenland, which hosts one of the largest known deposits of heavy rare earth elements and zirconium in the world. The Tanbreez asset differs from many competitors because its mineralization is hosted in kakortokite rather than carbonatite, which allows for different processing metrics and a potentially lower acid consumption profile.
USA Rare Earth, Inc. (NASDAQ: USAR)
USA Rare Earth, Inc. is executing a strategy centered on the revitalization of the American magnet manufacturing sector, anchored by its new facility in Stillwater, Oklahoma. Unlike peers that focus primarily on extraction, USA Rare Earth prioritizes the downstream production of sintered neo magnets, the highest-performance category of permanent magnets used in electric vehicle traction motors and defense systems.
The Stillwater plant has commenced initial qualification runs, utilizing equipment and intellectual property acquired from former Hitachi Metals facilities in North Carolina. This approach has allowed the company to leapfrog the typical research and development timeline, deploying proven commercial-scale technology to meet immediate demand. The company aims to scale production to meet a substantial portion of the U.S. defense industry's annual requirement, reducing the Pentagon's exposure to foreign supply shocks.
To support this manufacturing capacity, USA Rare Earth is developing the Round Top Heavy Rare Earth and Critical Minerals Project in West Texas. Round Top is a unique geological deposit containing a wide suite of magnetic rare earths alongside lithium, beryllium and gallium. The company is piloting a continuous ion exchange processing method to efficiently separate these materials from the rhyolite host rock. While the mine development continues, the company has secured intermediate feedstock supplies to ensure the Oklahoma plant can operate independently of the mine’s timeline.
Lynas Rare Earths Ltd. (OTC: LYSDY)
Lynas Rare Earths Ltd. remains the most significant producer of separated rare earth materials outside the People’s Republic of China, providing the global market with a proven non-Chinese supply of NdPr oxide. The Australian firm has substantially reconfigured its industrial footprint to mitigate regulatory risks and expand capacity.
The company’s new cracking and leaching facility in Kalgoorlie, Western Australia, is now fully operational. This plant processes the lanthanide concentrate from the Mt Weld mine locally, removing radioactive waste material before shipping a mixed rare earth carbonate to Malaysia for final separation. This operational change was necessitated by tightened environmental regulations in Malaysia but has ultimately strengthened the company’s supply chain by retaining the most hazardous waste handling within the mining jurisdiction of Australia.
Simultaneously, Lynas is constructing a heavy rare earth separation facility in Seadrift, Texas, a project partially funded by the U.S. Department of Defense. This facility is designed to process heavy rare earth feedstock to produce separated dysprosium and terbium, materials that are currently sourced almost exclusively from China.
General Motors Company (NYSE: GM)
General Motors Company has fundamentally altered its procurement strategy to become an active participant in the mining sector, recognizing that raw material availability is the primary bottleneck for its "Ultium" electric vehicle platform. The automaker is investing directly in resource development to secure the lithium, nickel, cobalt and manganese required for its battery cells. GM’s $650 million equity investment in Lithium Americas Corp. has facilitated the development of the Thacker Pass mine in Nevada, the largest known lithium source in the United States. This deal grants GM exclusive access to the Phase 1 production from Thacker Pass, ensuring a domestic supply of lithium carbonate that enables its vehicles to qualify for full consumer tax credits under the Inflation Reduction Act.
Beyond lithium, GM has forged a web of direct supply agreements for other battery metals, bypassing traditional intermediaries. The company has multi-year contracts with Glencore for cobalt and with Vale for low-carbon nickel sulfate from Canada. GM is also constructing a localized cathode active material supply chain through a joint venture with POSCO Chemical in Quebec, which will process materials sourced from GM’s mining partners. The automaker is heavily investing in a closed-loop battery recycling ecosystem through its collaboration with Li-Cycle, aiming to recover up to 95 percent of the critical minerals from end-of-life batteries and manufacturing scrap.
Southern Copper Corporation (NYSE: SCCO)
Southern Copper Corporation is leveraging its position as the holder of the world’s largest copper reserves to meet the structural supply deficit projected for the late 2020s. The company operates open-pit mines in Peru and Mexico that are among the lowest-cost producers in the industry, allowing it to generate robust cash flows even during periods of price volatility.
A major development for the company is the advancement of the Tía María project in the Arequipa region of Peru. After more than a decade of social and political delays, the company has commenced construction on the $1.4 billion greenfield mine. Tía María is expected to produce 120,000 tons of copper cathodes annually using solvent extraction and electrowinning technology, which eliminates the need for a smelter and reduces the environmental footprint. The successful activation of this project signals a significant improvement in the company’s ability to navigate complex community relations in Peru.
In Mexico, Southern Copper is investing heavily to expand its Buenavista Zinc and Pilares projects, aiming to increase its total production capacity to over 1.2 million tons of copper per year. The company is also advancing the massive Michiquillay project in Cajamarca, Peru, a world-class deposit that is currently in the exploration and social baseline study phase. Southern Copper’s strategy focuses on organic growth through the development of its own extensive concession portfolio rather than through expensive acquisitions.
Piedmont Lithium Inc. (NASDAQ: PLL)
Piedmont Lithium Inc. is establishing itself as a multi-jurisdictional supplier of lithium hydroxide, balancing near-term revenue generation with long-term domestic development. The company’s Carolina Lithium project in Gaston County, North Carolina, has received its state mining permit, a crucial regulatory victory that clears the path for construction. This fully integrated project is designed to mine spodumene ore and convert it into battery-grade lithium hydroxide on the same site, minimizing logistics costs and carbon emissions.
However, recognizing the time required to build such a facility, Piedmont has executed a strategy to secure lithium units earlier through international partnerships. The company holds a supply agreement and equity interest in Sayona Mining’s Quebec operations, where production is already underway at the North American Lithium complex. This partnership allows Piedmont to sell commercial shipments of spodumene concentrate to the global market while its U.S. assets are developed.
Piedmont is also advancing the Ewoyaa Lithium Project in Ghana in partnership with Atlantic Lithium. The company is funding the development of this asset in exchange for a 50 percent interest in the project’s production. The Ewoyaa material is intended to serve as a primary feedstock for Piedmont’s proposed conversion facility in Tennessee, known as Tennessee Lithium. This merchant plant aims to process foreign concentrate into domestic lithium hydroxide, further expanding the U.S. refining base.
Nouveau Monde Graphite Inc. (NYSE: NMG)
Nouveau Monde Graphite Inc. is nearing the completion of its "ore-to-anode" business model, aimed at providing a carbon-neutral alternative to Chinese synthetic and natural graphite. The company is constructing the Matawinie Mine in Saint-Michel-des-Saints, Quebec, which is notable for being the world’s first open-pit mine designed to operate with an all-electric fleet of mining equipment. This electrification strategy allows the company to produce graphite concentrate with a significantly lower carbon footprint than competitors. The extracted material will be transported to the company’s advanced manufacturing plant in Bécancour, Quebec, a dedicated battery materials industrial park. Here, the concentrate will be shaped and purified to produce the coated spherical graphite required for lithium-ion battery anodes.
The company has solidified its commercial viability through multi-year offtake agreements with anchor customers General Motors and Panasonic Energy. These contracts cover the vast majority of the company’s projected Phase 1 production, providing the revenue certainty needed to secure project financing. Nouveau Monde has also attracted strategic capital investments from Mitsui & Co. and Pallinghurst Resources, partners that bring both financial strength and logistical expertise.
Perpetua Resources Corp. (NASDAQ: PPTA)
Perpetua Resources Corp. has achieved a historic regulatory milestone for its Stibnite Gold Project in central Idaho, securing a Final Record of Decision from the U.S. Forest Service. This approval authorizes the company to proceed with the restoration and redevelopment of the brownfield site, which was abandoned by previous operators decades ago. The project is unique in that it contains one of the largest economic reserves of antimony not controlled by China.
Antimony is a federally designated critical mineral essential for the production of munitions, specifically as a hardening agent for lead in bullets and in the primers of small-caliber ammunition. It is also increasingly vital for large-scale liquid metal batteries used in grid energy storage.
Recognizing the national security implications of the project, the U.S. Department of Defense has awarded Perpetua Resources nearly $75 million in funding through the Defense Production Act and other initiatives to accelerate the project's development. This government backing effectively de-risks the permitting and construction timeline, validating the project's strategic necessity.
Perpetua’s plan involves reprocessing historical tailings to recover gold and antimony while simultaneously repairing the environmental damage left by World War II-era mining, including the restoration of fish passage for native salmon populations.
By. Michael Scott
The AI boom is triggering an unexpected and unprecedented bull run in natural gas and power stocks. If you aren't paying attention to the energy demands of data centers, you will miss the biggest energy story of the decade. The smart money is already quietly moving into the few companies prepared to power the trillion-dollar AI machine.
Oilprice Intelligence brings you the inside view on where the next gains will come from, breaking down the market's biggest growth driver with analysis from veteran oilmen and experts. Click here to get this crucial intel for free
Important Disclosure: The owner of Oilprice.com owns shares and/or stock options of the company and therefore has an incentive to see the company’s stock perform well. We encourage you to conduct your own due diligence and seek the advice of your financial advisor or broker before investing.
Oilprice Intelligence brings you the signals before they become front-page news. This is the same expert analysis read by veteran traders and political advisors. Get it free, twice a week, and you'll always know why the market is moving before everyone else.
You get the geopolitical intelligence, the hidden inventory data, and the market whispers that move billions – and we'll send you $389 in premium energy intelligence, on us, just for subscribing. Join 400,000+ readers today. Get access immediately by clicking here.
Toronto, Ontario–(Newsfile Corp. – December 8, 2025) – Honey Badger Silver Inc. (TSXV: TUF) (OTCQB: HBEIF) ("Honey Badger" or the "Company") is pleased to announce that Michael Jalonen, who has served as a trusted long-time advisor to the Company, has been appointed to its Board of Directors.
Mr. Jalonen brings 34 years of capital markets expertise, including 33 years with Bank of America Securities (1989-2022), where he was consistently ranked as one of world's leading precious metals mining analysts. Michael covered twenty companies in the North American senior, mid-tier and intermediate gold and silver producer sector and five senior precious metal royalty and streaming companies. His independent studies on publicly traded companies, gold and silver prices, and the precious metals sector were well recognized by investors and mining companies globally. Throughout his career, he travelled globally conducting on-site tours of well over a hundred mining projects.
Chad Williams, Executive Chairman and Interim CEO, commented: "We are very fortunate to add Mr. Jalonen to our Board. His experience in the global precious metals space is extensive. He is widely respected, including by many institutional investors, because of his very solid track record of success analysing precious metal companies for decades. Mr. Jalonen was instrumental in the idea of Honey Badger acquiring the Nanisivik claims, as well as providing many other value-added insights, since he joined as an advisor several years ago."
Prior to BofA, Mr. Jalonen was junior mining analyst for Dean Witter Canada for one year (1988-89). Mr. Jalonen also worked for 1.5 years as a corporate development analyst with Somicom Mining (1986-88) and as a junior geologist at Nanisivik Mines (summers of 1980-83). He holds an Honors B.Sc., Geology, from University of Windsor (1982) and an MBA from McMaster University (1986). He was awarded the CFA designation in 1992.
About Honey Badger Silver Inc.
Honey Badger Silver is a silver company. The company is led by a highly experienced leadership team with a track record of value creation backed by a skilled technical team. Our projects are located in areas with a long history of mining, including the Sunrise Lake project with a historic resource of 12.8 Moz of silver at a grade of 262 g/t silver (and 201.3 million pounds of zinc at a grade of 6% zinc) Indicated and 13.9 Moz of silver at a grade of 169 g/t silver (and 247.8 million pounds of zinc at a grade of 4.4% zinc) Inferred(1) located in the Northwest Territories and the Plata high grade silver project located 165 km east of Yukon's prolific Keno Hill and adjacent to Snowline Gold's Rogue discovery. The Company's Clear Lake Project in the Yukon Territory has an unclassified historic resource of 5.5 Moz of silver at a grade of 22 g/t silver and 1.3 billion pounds of zinc at a grade of 7.6% zinc(2). The Company also has a significant land holding at the Nanisivik Mine Area located in Nunavut, Canada that produced over 20 Moz of silver between 1976 and 2002(3). A qualified person has not done sufficient work to classify the foregoing historical resources as current mineral resources, and the Company is not treating the estimates as current mineral resources. The historical resource estimates are provided solely for the purpose as an indication of the volume of mineralization that could be present. Additional work, including verification drilling / sampling, will be required to verify any of the historical estimates as a current mineral resources.
(1) Sunrise Lake 2003 RPA historic resource: Indicated 1.522 million tonnes grading 262 grams/tonne silver, 6.0% zinc, 2.4% lead, 0.08% copper, and 0.67 grams/tonne gold and Inferred 2.555 million tonnes grading 169 grams/tonne silver, 4.4% zinc, 1.9% lead, 0.07% copper, and 0.51 grams/tonne gold.
(2) Clear Lake 2010 SRK historic Resource: Inferred 7.76 million tonnes grading 22 grams/tonne silver, 7.6% zinc, and 1.08% lead.
(3) Geological Survey of Canada, 2002-C22, "Structural and Stratigraphic Controls on Zn-Pb-Ag Mineralization at the Nanisivik Mississippi Valley type Deposit, Northern Baffin Island, Nunavut; by Patterson and Powis."2) Clear Lake 2010 SRK historic Resource: Inferred 7.76 million tonnes grading 22 grams/tonne silver, 7.6% zinc, and 1.08% lead.
ON BEHALF OF THE BOARD,
Chad Williams, Executive Chairman
Sonya PekarInvestor Relationsspekar@honeybadgersilver.com | +1 (647) 498-8244
For more information, please visit our website www.honeybadgersilver.com.
Neither the TSX Venture Exchange nor its Regulation Services Provider (as that term is defined in the policies of the TSX Venture Exchange) accepts responsibility for the adequacy or accuracy of this release.
Cautionary Note Regarding Forward-Looking Information
This news release contains "forward-looking information" within the meaning of the applicable Canadian securities legislation that is based on expectations, estimates, projections and interpretations as at the date of this news release. Any statement that involves discussions with respect to predictions, expectations, interpretations, beliefs, plans, projections, objectives, assumptions, future events or performance (often but not always using phrases such as "expects", or "does not expect", "is expected", "interpreted", "management's view", "anticipates" or "does not anticipate", "plans", "budget", "scheduled", "forecasts", "estimates", "believes" or "intends" or variations of such words and phrases or stating that certain actions, events or results "may" or "could", "would", "might" or "will" be taken to occur or be achieved) are not statements of historical fact and may be forward-looking information and are intended to identify forward-looking information. This forward-looking information is based on reasonable assumptions and estimates of management of the Company at the time such assumptions and estimates were made, and involves known and unknown risks, uncertainties and other factors which may cause the actual results, performance or achievements of Honey Badger to be materially different from any future results, performance or achievements expressed or implied by such forward-looking information.
Such factors include, but are not limited to, risks relating to capital and operating costs varying significantly from estimates; delays in obtaining or failures to obtain required governmental, environmental or other project approvals; uncertainties relating to the availability and costs of financing needed in the future; changes in equity markets; inflation; fluctuations in commodity prices; delays in the development of projects; other risks involved in the mineral exploration and development industry; and those risks set out in the Company's public documents filed on SEDAR+ (www.sedarplus.ca) under Honey Badger's issuer profile. Although the Company believes that the assumptions and factors used in preparing the forward-looking information in this news release are reasonable, undue reliance should not be placed on such information, which only applies as of the date of this news release, and no assurance can be given that such events will occur in the disclosed timeframes or at all. The Company disclaims any intention or obligation to update or revise any forward-looking information, whether as a result of new information, future events or otherwise, other than as required by law.
To view the source version of this press release, please visit https://www.newsfilecorp.com/release/277225
Virtual Investor Conferences
Company Executives Share Vision and Answer Questions Live at VirtualInvestorConferences.com
NEW YORK, Dec. 05, 2025 (GLOBE NEWSWIRE) — Virtual Investor Conferences, the leading proprietary investor conference series, today announced the presentations from the Precious Metals & Critical Minerals Virtual Investor Conference, held December 2–4th are now available for online viewing.
REGISTER AND VIEW PRESENTATIONS HERE
The company presentations will be available 24/7 for 90 days. Investors, advisors, and analysts may downloadinvestor materials from the company’s resource section.
Select companies are accepting 1×1 management meeting requests through December 12th.
Please schedule 1×1 meetings here
December 2nd
|
Presentation |
Ticker(s) |
|
Metals One PLC |
|
|
PolarX Limited |
|
|
Guanajuato Silver Company Ltd. |
|
|
Cassiar Gold Corp. |
|
|
Blackrock Silver Corp. |
|
|
Panthera Resources PLC |
|
|
Harena Rare Earths PLC |
|
|
DynaResource, Inc. |
|
|
Wallbridge Mining Company Ltd. |
|
|
Cerrado Gold Inc. |
|
|
Grid Metals Corp. |
|
|
Spartan Metals Corp. |
December 3rd
|
Presentation |
Ticker(s) |
|
European Lithium Ltd |
|
|
Yellow Cake Plc |
|
|
Castile Resources Limited |
|
|
Kirkland Lake Discoveries Corp. |
|
|
District Metals Corp. |
|
|
Liberty Gold Corp. |
|
|
DLP Resources Inc. |
|
|
Ecora Resources PLC |
|
|
Beyond Lithium Inc. |
|
|
Precore Gold Corp. |
|
|
Heliostar Metals Ltd. |
|
|
LibertyStream Infrastructure Partners Inc. |
|
|
Banyan Gold Corp. |
|
|
Astra Exploration Inc. |
December 4th
|
Presentation |
Ticker(s) |
|
Empire Metals Ltd. |
|
|
Elevate Uranium Ltd. |
|
|
Silver Tiger Metals Inc. |
|
|
STLLR Gold Inc. |
|
|
Arras Minerals Corp. |
|
|
Apollo Silver Corp. |
|
|
First Phosphate Corp. |
|
|
Galloper Gold Corp. |
|
|
Arizona Sonoran Copper Company |
|
|
CUPANI Metals Corporation |
|
|
OceanaGold (Philippines), Inc. |
To facilitate investor relations scheduling and to view a complete calendar of Virtual Investor Conferences, please visit www.virtualinvestorconferences.com.
About Virtual Investor Conferences®
Virtual Investor Conferences (VIC) is the leading proprietary investor conference series that provides an interactive forum for publicly traded companies to seamlessly present directly to investors.
Providing a real-time investor engagement solution, VIC is specifically designed to offer companies more efficient investor access. Replicating the components of an on-site investor conference, VIC offers companies enhanced capabilities to connect with investors, schedule targeted one-on-one meetings and enhance their presentations with dynamic video content. Accelerating the next level of investor engagement, Virtual Investor Conferences delivers leading investor communications to a global network of retail and institutional investors.
Media Contact: OTC Markets Group Inc. +1 (212) 896-4428, media@otcmarkets.com
Virtual Investor Conferences Contact:John M. ViglottiSVP Corporate Services, Investor AccessOTC Markets Group (212) 220-2221johnv@otcmarkets.com
Toronto, Ontario–(Newsfile Corp. – December 1, 2025) – CEO.CA ("CEO.CA"), the leading investor social network in junior resource and venture stocks, shares exclusive updates with CEOs of junior mining explorers.
Founded in 2012, CEO.CA, a wholly owned subsidiary of EarthLabs, Inc., is one of the most popular free financial websites and apps in Canada and for investors globally – with industry leading audience engagement and mobile functionality. Millions of people visit CEO.CA each year to connect with investors from around the world, share knowledge and view impactful stories about stocks, commodities, and emerging companies.
Meet the Executive Shaping the Mining Landscape
'Inside the Boardroom' is more than just an interview series – it's a chance to gain firsthand knowledge from industry leaders, understanding their vision, challenges, and strategy.
We caught up with Chad Williams, Executive Chairman of Honey Badger Silver Inc. (TSXV: TUF) (OTCQB: HBEIF). Follow what investors are saying and join our community: https://ceo.ca/tuf
Honey Badger Silver(TSXV: TUF) (OTCQB: HBEIF)
Cannot view this video? Visit:https://www.youtube.com/watch?v=D-EAFYJjOmQ
Tune in to 'Inside the Boardroom' each week and be part of the conversation that's shaping the business landscape. Visit CEO.CA or our YouTube page for hundreds more executive interviews from CEO.CA here.
Interested in showcasing your company on 'Inside the Boardroom'? Get in touch with our team at sales@ceo.ca for further details and opportunities.
About CEO.CA
The leading community for investors & traders in junior resource & venture stocks. CEO.CA is one of the most popular free financial websites and apps in Canada and for small-cap investors globally — with industry leading audience engagement and mobile functionality. Since 2012, CEO.CA has brought millions of investors together from over 164 countries to discuss their portfolio holdings and find new investment opportunities. Download our App on iOS or Android marketplace or visit us today at CEO.CA to set up your free account.
CEO.CA is a wholly owned subsidiary of EarthLabs, Inc.
For further information please contact:
CEO.CA Email: hello@ceo.caWebsite: CEO.CA
Neither the TSX Venture Exchange ("TSXV"), OTC Best Market ("OTCQX") nor its Regulation Services Provider (as that term is defined in the policies of the TSXV) accepts responsibility for the adequacy or accuracy of this release.
Cautionary Statement
The information regarding any issuer contained or referred to in any interviews conducted by CEO.CA has been furnished by such issuer directly, and neither CEO.CA nor any of its affiliates or principals assumes any responsibility for the accuracy or completeness of such information or for any failure by an issuer to ensure disclosure of events or facts which may affect the significance or accuracy of any such information.
No stock exchange, securities commission or other regulatory authority has approved or disapproved the information contained herein. This news release contains forward-looking information which involves risks, uncertainties and other factors that could cause actual events, results, performance, prospects, and opportunities to differ materially from those expressed or implied by such forward-looking information. Forward-looking information in this news release may include, but is not limited to, the objectives, goals, future plans, statements regarding exploration results and exploration and/or development plans of companies featured on the CEO.CA platform. Factors that could cause actual results to differ materially from such forward-looking information include, but are not limited to, capital and operating costs varying significantly from estimates, the preliminary nature of metallurgical test results, delays in obtaining or failures to obtain required governmental, environmental or other project approvals, uncertainties relating to the availability and costs of financing needed in the future, changes in equity markets, inflation, fluctuations in commodity prices, delays in the development of projects, currency risk and the other risks involved in the applicable exploration and development industry, and those risks set out in the public documents of such companies filed on SEDAR or elsewhere from time to time. Undue reliance should not be placed on such information, which only applies as of the date of this news release, and no assurance can be given that such events will occur in the disclosed time frames or at all. CEO.CA disclaims any intention or obligation to update or revise any forward-looking information, whether as a result of new information, future events or otherwise, other than as required by law.
To view the source version of this press release, please visit https://www.newsfilecorp.com/release/276444
Toronto, Ontario–(Newsfile Corp. – December 1, 2025) – Honey Badger Silver Inc. (TSXV: TUF) (OTCQB: HBEIF) ("Honey Badger" or the "Company") is pleased to share the results from the recent geophysical survey and prospecting work completed at it's 100%-owned Nanisivik Project, Nunavut. Nanisivik is a former polymetallic-silver mine that produced over 20 Moz of silver between 1976 and 2002(3), when low metal prices forced the mine into closure. Since then, silver and zinc prices are up approximately 1,000% and 300% respectively, and infrastructure access has improved with the construction of a deep-water port only a few kilometers from the former mine site.
The Company's Executive Chairman, Chad Williams, commented, "The recent surface exploration program completed at Nanisivik was a success: several large new zones with strong conductivity at the Area 14 and Oceanview targets were discovered. Some of these new zones may significantly extend the strike length of unmined mineralization at these targets while other new zones may represent completely new areas of mineralization. We are also very encouraged with assay results up to 249 g/t silver and 51.5% zinc collected from distal zones at the Area 14 target that coincide with underlying conductors from the Loupe EM survey. Nanisivik was a high-quality mining operation until 2002 when low commodity prices forced the mine to cease operations. We plan to drill these high-priority targets in 2026. We believe Nanisivik has substantial exploration potential."
2025 Data Review and Target Prioritization
Earlier in the year, the Company announced three priority target areas that were identified during data review, each hosting significant zinc and silver intercepts from historical drilling (see press release dated March 25, 2025). The areas are Deb, Ocean View North, and Area 14. A review of historical exploration drilling at the former mine site identified several significant drill intersections located outside mined areas. These discoveries were not followed up in the past due to the previous operator's tight focus on production. As a result, each of these represents a priority target for follow up work. A selection of significant silver and/or zinc mineralized intercepts from these priority target areas is provided in the Table 2 and the locations of the target areas are illustrated in Figure 1.
2025 Exploration Program Summary
The recent exploration program at Nanisivik was primarily focused on utilizing ground geophysics (Loupe Time Domain Electromagnetics or "TDEM") as a cost-effective and portable method to:
Reconnaissance sampling was also completed around the Area 14 target to identify new zones of mineralization.
Results from the Loupe EM survey are very encouraging and have exceeded expectations for this program. The survey successfully identified conductors underlying unmined and partially mined mineralized areas at both Area 14 and across the broader Oceanview area. Importantly, the Loupe EM data shows several strong untested conductors at both Area 14 and Oceanview that are located between or adjacent to known zones of massive sulfide mineralization. These untested Loupe EM anomalies also coincide with historic airborne EM conductors, which further validates these areas as high-priority drill targets with potential for the discovery of new silver-lead-zinc massive sulfide mineralization (Figure 1).
Figure 1. Map of the main Nanisivik block showing results from the recently completed Loupe EM surveys at the Oceanview and Area 14 targets as well as locations of rock samples collected during the work program. Strong untested conductors are highlighted in the dark blue dotted boxes. The locations of historical underground, open pit, or trenched silver-zinc-lead ore bodies are also shown on the map.
To view an enhanced version of this graphic, please visit:https://images.newsfilecorp.com/files/3204/276371_3ba41a2c24f1f953_001full.jpg
In addition to the success of the Loupe EM Survey, reconnaissance prospecting work has identified an area of potentially sub-cropping massive sulfide mineralization at Area 14 that has returned values up to 249 g/t silver and 51.5% zinc. In total, 21 grab samples were primarily collected from large angular boulders interpreted by the field geologist to potentially represent sub-crop from underlying or nearby bedrock. Due to partial snow cover at the time of sampling plus the historical disturbance related to reclamation after mine closure, it remains to be confirmed if each of these large angular boulders truly represent in-situ mineralization. These grab samples validate the high-grade nature of the mineralization seen in historic drilling at Area 14 and occur on top of a conductive body identified by the Loupe EM survey.
Table 1. 2025 Assay Results of Grab Samples from Area 14*
To view an enhanced version of this graphic, please visit:https://images.newsfilecorp.com/files/3204/276371_3ba41a2c24f1f953_002full.jpg
Overview of Priority Target Areas
Oceanview North TargetThere are no indications of any mining having been completed at the Oceanview North target area, which is located approximately 1.7 km east northeast from the main Nanisivik orebody and some 400 m north of the historically mined main Oceanview zone (Figure 1). At the Oceanview North area, data from some 72 historical exploration drillholes was examined and a cluster of high-grade Ag-Zn intersections were identified at the northern extent of the drilling. Highlight silver (Ag) and zinc (Zn) intersections at the Ocean View North target area include hole 87-63, which intersected 5.3m of 97.6 g/t Ag and 22.79% Zn, and hole 90-28 which intersected 1.3m of 116 g/t Ag and 20.3% Zn.
Area 14 TargetThe Area 14 target is located approximately 1.8 km southeast of the main Nanisivik orebody (Figure 1). Historical data indicates that a portal was developed and some stope mining was carried out at Area 14. However, Honey Badger has examined the data from a cluster of 27 historical drillholes located immediately east and northeast of the historically mined area where a number of high-grade Ag-Zn intersections have been identified, including; hole A14_85-08 which intersected 2.3m of 280.0 g/t Ag and 27.43% Zn, hole A14_85-10 which intersected 2.3m of 239.3 g/t Ag and 6.10% Zn, and hole 86-191 which intersected 3.0m of 143.3 g/t Ag and 26.16% Zn.
Deb TargetThe Deb target area is located approximately 3 km southwest of the main orebody at Nanisivik and is unmined. The Company has examined data from 15 drillholes completed in this area in the 1980's and 1990's. High-grade Ag-Zn intersections include; hole 90-51 which intersected 1.3m of 54.9 g/t Ag and 5.74% Zn, hole 90-59 which intersected 0.7m of 263 g/t Ag and 34.6% Zn, and hole 91-19 which intersected 0.6m of 290 g/t Ag and 43.0% Zn.
Table 2. Select Historical Drillholes from Unmined Areas at the Nanisivik Project*
To view an enhanced version of this graphic, please visit:https://images.newsfilecorp.com/files/3204/276371_3ba41a2c24f1f953_003full.jpg
*reported as core length intervals as no information regarding true width is available (may include minor sample gaps where no grade has been assumed/assigned)
QAQC
Loupe TDEM Survey
The Loupe TDEM survey was completed by APEX Geoscience between August 27 to September 3, 2025. At the Oceanview target, a total of 16.7-line kilometers was completed over 14 lines. Lines were N-S oriented and spaced 250m apart with 125m infill spacing on the west side of the grid. At Area 14, a total of 11.4 line-kilometers was completed over 13 lines. Lines were E-W oriented and spaced 100m apart. The survey had a 10m Tx-Rx coil separation and used a 450 Hz base frequency.
Loupe TDEM is a man-portable, rapid, and inexpensive system developed by Loupe Geophysics (www.loupegeophysics.com.au) used to assess the conductivity of an area, particularly where there is significant outcrop and little to no weathering. The system is designed to measure electrical conductivity in the near-surface (generally between 20-50m depth) at high resolutions. The system provides x, y and z components of the EM field and is equipped with a real time RTK GPS system for accurate ground location.
Rock Samples
Sample preparation and multi-element analyses for rock samples were carried out at ALS Minerals' laboratories in Vancouver, British Columbia. Each rock sample was dried and fine crushed to better than 70% passing 2 mm, and then a 250 g split was pulverized to better than 85% passing 75 microns. The fine fraction was analyzed for 48 elements using four acid digestion (ME-MS61). For all samples, silver, lead and zinc were analyzed using an ore grade four acid digestion package with an inductively coupled plasma and atomic emission spectroscopy finish (Ag-OG63, Pb-OG62, Zn-OG62). Samples with zinc values over 30% and lead values over 20% were further analyzed using titration (Zn-VOL50 and Pb-VOL70). For all samples, an additional 30 g charge was further analyzed for gold by fire assay with inductively coupled plasma and atomic emission spectroscopy finish (Au-ICP21). At this early stage of mineral exploration, no Quality Control (QC) samples were inserted into the sample stream with the rock grab samples.
About Nanisivik
The Nanisivik Mine (near Arctic Bay, Nunavut) produced over 20 million ounces of silver between 1976 and 2002, from 17.9 million tons of ore, grading 9% zinc, 0.72% lead, and 35 grams per tonne of silver(3). In addition to the polymetallic orebody, previous exploration identified massive sulphide bodies (principally pyrite) still in place, totaling about 100 million tonnes(3) containing locally anomalous base metal and silver values.
Qualified Person
Technical information in this news release has been reviewed and approved by Benjamin Kuzmich, P. Geo., a consultant, who is a Qualified Person (QP) for the purpose of National Instrument 43-101 "Standards of Disclosure for Mineral Projects".
About Honey Badger Silver Inc.
Honey Badger Silver is a silver company. The company is led by a highly experienced leadership team with a track record of value-creation backed by a skilled technical team. Our projects are located in areas with a long history of mining, including the Sunrise Lake project with a historic resource of 12.8 Moz of silver at a grade of 262 g/t silver (and 201.3 million pounds of zinc at a grade of 6% zinc) Indicated and 13.9 Moz of silver at a grade of 169 g/t silver (and 247.8 million pounds of zinc at a grade of 4.4% zinc) Inferred(2) located in the Northwest Territories and the Plata high grade silver project located 165 km east of Yukon's prolific Keno Hill and adjacent to Snowline Gold's Rogue discovery. The Company's Clear Lake Project in the Yukon Territory has an unclassified historic resource of 5.5 Moz of silver at a grade of 22 g/t silver and 1.3 billion pounds of zinc at a grade of 7.6% zinc(3). The Company also has a significant land holding at the Nanisivik Mine Area located in Nunavut, Canada that produced over 20 Moz of silver between 1976 and 2002(4). In each instance, the reliability of the historical resource estimates (the "Historical Estimates") are considered reasonable, but a qualified person has not done sufficient work to classify the foregoing Historical Estimates as current mineral resources, and the Company is not treating the estimates as current mineral resources. There is no technical report associated with the Historical Estimates. The Historical Estimate contains categories that are not consistent with current CIM definitions. The Company considers the Historical Estimates to be relevant for the proper understanding of its mineral properties, however, significant data compilation, re-drilling, re-sampling and data verification may be required by a Qualified Person for the Historical Estimates to be in accordance with NI 43-101 standards and to verify the Historical Estimates as current mineral resources. No more recent estimates of the mineral resources or other data are available to the Company. There can be no certainty, following further evaluation and/or exploration work, that the historical estimates can be upgraded or verified as mineral resources or mineral reserves in accordance with NI 43-101.
(1) Sunrise Lake historic resource (2000-2003): Indicated 1.522 million tonnes grading 262 grams/tonne silver, 6.0% zinc, 2.4% lead, 0.08% copper, and 0.67 grams/tonne gold and Inferred 2.555 million tonnes grading 169 grams/tonne silver, 4.4% zinc, 1.9% lead, 0.07% copper, and 0.51 grams/tonne gold. The resource estimate for the Sunrise Deposit was carried out by Silver Standard Resources Inc. (SSR) using a classical polygonal method that relied on 72 diamond drillholes and an average density of 4 t/m3. Drill hole intercepts were taken directly from the drill logs (CBA 1998). Polygons were created within AutoCAD and AutoCAD calculated the areas. Horizontal widths were calculated using the ratio of core length to the width used by CBA in their 1998 estimate. Intercepts not used by CBA were measured on the cross sections. The intercepts were composited primarily using a geological cut-off based on the sulphide content and a nominal 30 g/t Ag grade. Internal values below 30 g/t were included for geological continuity if the composite remained above cut-off. Stringer mineralization was included where silver grades were above 30 g/t and occasionally lower if base metal grades were high. It is assumed the upper 100 m could be mined by open pit methods and the stringer mineralization would have to be removed to access the massive sulphides. The classification of the mineralization is based on the number of drill holes on a section and the continuity of the mineralization. The main massive sulphide horizon has been drilled on sections spaced 40 m apart, and above the -280 m elevation, the down dip continuity of the horizon has been tested with holes 25 to 30 m apart down dip. All mineralization in the massive sulphide horizon above 280 m is considered an Indicated Resource while the near surface stringer mineralization and the massive sulphides below 280 m are considered to be Inferred Resources. Forty holes define the massive sulphide Indicated Resource horizon. In a 2003 report to SSR, Roscoe Postle Associates Inc. (RPA) concluded SSR's resource estimate was reasonable based on approximating a NSR using typical smelter contracts, assuming metallurgical recoveries based on the limited metallurgical testing and on the following price assumptions: USD$ 5.50 per ounce silver, USD$ 400 per ounce gold, USD$ 0.45 per pound zinc, USD$ 0.25 per pound lead, and USD$ 0.80 per pound copper, as well as a USD$ 75 transportation cost, and a CDN$ 1.45:USD$ 1.00 exchange rate.
(2) Clear Lake historic Resource (2010): Inferred 7.76 million tonnes grading 22 grams/tonne silver, 7.6% zinc, and 1.08% lead. In 2010 SRK was engaged to complete a NI 43-101 compliant resource estimate for the Clear Lake deposit for Copper Ridge Explorations Inc. The estimate was made utilizing 1,842 assays from within the deposit, from a total of 13,168 m of drilling in 63 historical drill holes. An average density of 4.07 gm/cc was used, based on a limited number of field measurements that were confirmed in the laboratory, and with a minimum thickness of 2 m. Mineral resources were estimated by ordinary kriging in 12m by 12m by 9m blocks. The mineral resources are reported at a 4% (Pb+Zn) cut-off. Pb grades have been capped at 1.5% and Ag grades were capped at 60 g/t. Although SRK placed this resource in the inferred category due to uncertainties related to the historical nature of the available data, they noted that most of the resource has been drilled at a sufficiently close enough spacing to support indicated classification. The above information has been taken from a news release by Copper Ridge dated January 18th, 2010, as no technical report is publicly available.
(3) Geological Survey of Canada, 2002-C22, "Structural and Stratigraphic Controls on Zn-Pb-Ag Mineralization at the Nanisivik Mississippi Valley type Deposit, Northern Baffin Island, Nunavut; by Patterson and Powis."
ON BEHALF OF THE BOARD,
Chad Williams, Executive Chairman
Sonya PekarInvestor Relationsspekar@honeybadgersilver.com | +1 (647) 498-8244
For more information, please visit our website www.honeybadgersilver.com.
Neither the TSX Venture Exchange nor its Regulation Services Provider (as that term is defined in the policies of the TSX Venture Exchange) accepts responsibility for the adequacy or accuracy of this release.
Cautionary Note Regarding Forward-Looking Information
This news release contains "forward-looking information" within the meaning of the applicable Canadian securities legislation that is based on expectations, estimates, projections and interpretations as at the date of this news release, including without limitation, the potential of the Nanisivik project. Any statement that involves discussions with respect to predictions, expectations, interpretations, beliefs, plans, projections, objectives, assumptions, future events or performance (often but not always using phrases such as "expects", or "does not expect", "is expected", "interpreted", "management's view", "anticipates" or "does not anticipate", "plans", "budget", "scheduled", "forecasts", "estimates", "believes" or "intends" or variations of such words and phrases or stating that certain actions, events or results "may" or "could", "would", "might" or "will" be taken to occur or be achieved) are not statements of historical fact and may be forward-looking information and are intended to identify forward-looking information. This forward-looking information is based on reasonable assumptions and estimates of management of the Company at the time such assumptions and estimates were made, and involves known and unknown risks, uncertainties and other factors which may cause the actual results, performance or achievements of Honey Badger to be materially different from any future results, performance or achievements expressed or implied by such forward-looking information.
Such factors include, but are not limited to, risks relating to capital and operating costs varying significantly from estimates; delays in obtaining or failures to obtain required governmental, environmental or other project approvals; uncertainties relating to the availability and costs of financing needed in the future; changes in equity markets; inflation; fluctuations in commodity prices; delays in the development of projects; other risks involved in the mineral exploration and development industry; and those risks set out in the Company's public documents filed on SEDAR+ (www.sedarplus.ca) under Honey Badger's issuer profile. Although the Company believes that the assumptions and factors used in preparing the forward-looking information in this news release are reasonable, undue reliance should not be placed on such information, which only applies as of the date of this news release, and no assurance can be given that such events will occur in the disclosed timeframes or at all. The Company disclaims any intention or obligation to update or revise any forward-looking information, whether as a result of new information, future events or otherwise, other than as required by law.
To view the source version of this press release, please visit https://www.newsfilecorp.com/release/276371
An influential City group is urging investors to oppose plans that would guarantee a multimillion pound share bonanza to executives at Anglo American as it finalises a $33bn merger with Canada’s Teck Resources.
Sky News understands that the Investment Association's IVIS voting advisory service has issued next month's vote on amendments to Anglo's long-term incentive awards with a 'red-top' alert – its strongest possible warning against the resolution.
The development comes days after rival miner BHP approached Anglo for a second time about a potential takeover, before abruptly withdrawing.
Anglo, the mining group which owns De Beers, wants to amend its share awards to guarantee that they would pay out at least 62.5% of their value if the merger completes.
Institutional Shareholder Services, which has recommended that shareholders vote in favour of the merger itself, has also recommended opposition to the bonus scheme amendments.
"The amending of awards to reflect M&A factors not envisioned when the awards were first granted is not considered inappropriate in the UK market per se," ISS said in a report to clients.
"However, in this case, the amending of in-flight LTIP awards in order to ensure a minimum payout linked to the completion of the merger transaction is.
"Indeed, the linking of variable incentives to the completion of transactions is not considered good practice, which is itself recognised by the company."
Read more from Sky News:TGI Fridays' UK chain up for sale'Sticking to Labour manifesto pledge costs workers'HSBC chair candidates to pitch to board next week
The IA declined to comment further on the red-top alert.
A spokesman for Anglo American said the proposed changes would drive "even greater alignment with shareholders' interests".
Teck Resources (TSX:TECK.B) shares have gained some ground in recent sessions, catching the attention of investors interested in the materials sector. The company’s stock performance may be drawing renewed curiosity, given its diverse mining operations and revenue streams.
See our latest analysis for Teck Resources.
After a sluggish start to the year, Teck Resources’ share price has bounced back with strong momentum recently, notching a 28.8% jump over the past three months. While the 1-year total shareholder return still sits in negative territory, the long-term view remains much brighter given its impressive 5-year total return of nearly 198%. This suggests investors who held on through the cycles have seen significant gains.
If you’re interested in uncovering more opportunities in the sector, now is a great time to check out the full list for free with our solid balance sheet and fundamentals stocks screener: solid balance sheet and fundamentals stocks screener (None results)
With Teck Resources trading only slightly below analyst price targets and carrying a substantial intrinsic discount, the question remains: is there hidden value in the stock, or is the market already reflecting its future prospects?
Most Popular Narrative: 4.2% Undervalued
Teck Resources’ most widely followed narrative points to a fair value above its recent close, implying the market still underestimates the company’s potential. The spread between current price and this fair value is small, yet the analysis suggests overlooked drivers could fuel upside.
The sanctioned Highland Valley Copper Mine Life Extension project and ongoing optimization or debottlenecking at QB are set to double Teck’s copper production by decade’s end. This would enable the company to capitalize on the accelerating demand for copper from global electrification and energy transition, which should materially increase revenue and long-term earnings growth.
Want to know what’s really powering this narrative? The model banks on a huge jump in copper output and a margin surge not seen in previous cycles. The punchline: it all hinges on certain numbers and assumptions that could be game-changers for Teck’s valuation. Ready to see what could send the stock soaring? Don’t miss the underlying details driving this fair value target.
Result: Fair Value of $62.44 (UNDERVALUED)
Have a read of the narrative in full and understand what’s behind the forecasts.
However, persistent project delays or another slump in copper prices could undermine Teck Resources’ growth story and shift investor sentiment quickly.
Find out about the key risks to this Teck Resources narrative.
Another View: Market Multiples Raise Caution
While the fair value discussion points to an undervalued stock, the lens of price-to-earnings tells a different story. Teck Resources trades at 23.5 times earnings, higher than both the Canadian industry average of 19.3 and the fair ratio of 17.7. This premium suggests investors are already pricing in some future upside. However, it raises the question of whether there is enough margin for error.
See what the numbers say about this price — find out in our valuation breakdown.
TSX:TECK.B PE Ratio as at Nov 2025Build Your Own Teck Resources Narrative
If you have different insights, or prefer to analyze the numbers personally, you can build your own perspective on Teck Resources in just a few minutes. Do it your way
A good starting point is our analysis highlighting 2 key rewards investors are optimistic about regarding Teck Resources.
Looking for More Investment Ideas?
Unlock a world of fresh opportunities and take charge of your investment journey today. Don’t let game-changing stocks and innovative sectors pass you by.
-
Uncover hidden value by tapping into these 926 undervalued stocks based on cash flows that could be trading below their true worth right now.
-
Capitalize on powerful income potential with these 15 dividend stocks with yields > 3% offering yields that stand out in today’s market.
-
Catch the next wave in digital innovation by targeting these 25 AI penny stocks powering breakthroughs across industries.
This article by Simply Wall St is general in nature. We provide commentary based on historical data and analyst forecasts only using an unbiased methodology and our articles are not intended to be financial advice. It does not constitute a recommendation to buy or sell any stock, and does not take account of your objectives, or your financial situation. We aim to bring you long-term focused analysis driven by fundamental data. Note that our analysis may not factor in the latest price-sensitive company announcements or qualitative material. Simply Wall St has no position in any stocks mentioned.
Companies discussed in this article include TECK-B.TO.
Have feedback on this article? Concerned about the content? Get in touch with us directly. Alternatively, email editorial-team@simplywallst.com
VANCOUVER — A second major proxy advisory service has recommended shareholders vote in favour of the deal to combine Teck Resources Ltd. and Anglo American plc.
Institutional Shareholder Services, Inc. said Wednesday that the arrangement makes strategic sense and that there's additional potential upside through the merger.
The endorsement comes after Glass Lewis & Co. said on Nov. 21 that the combined company would have a stronger financial footing and make it a more resilient producer.
The recommendations come ahead of a special meeting of shareholders on Dec. 9 to decide on the proposal.
The companies have said the deal would create a $70-billion copper mining powerhouse with headquarters and top executives based in Vancouver, though Industry Minister Mélanie Joly has said the government is looking to see more benefits to Canada.
The proposal is subject to review under the Investment Canada Act, which can be used to block deals deemed against the national interest.
Jonathan Price, president and CEO of Teck, said in a statement that the recommendations further affirm the company's view that the merger is the best past forward.
This report by The Canadian Press was first published Nov. 26, 2025.
Companies in this story: (TSX:TECK.B)
The Canadian Press
By David Ljunggren and Divya Rajagopal
OTTAWA (Reuters) -Canada will submit the proposed merger of Anglo American and Teck Resources to a national security review, Industry Minister Melanie Joly said on Wednesday.
Joly also said Ottawa would come to a final decision in the coming months.
"The national security review for any transaction is always part of the process… so we're following the process," she told reporters from South Korea via a teleconference.
Shares of Teck were up 1% in midday trade in Toronto. Anglo American shares closed up 2.4% at the London Stock Exchange on Wednesday.
The proposed $53 billion deal, one of the biggest in the mining industry, would create a copper giant. But the deal, due to its size, needs a nod from several regulators, including in Canada.
The top leadership of both companies has proposed to move the combined headquarters to Vancouver and maintain a dual listing. However, Ottawa has asked for more, such as investment in the country and job security.
The national security review, according to the Investment Canada Act, would look at the potential impact the transaction would have on the critical minerals and critical mineral supply chains. Copper is considered a critical mineral by Canada.
Teck also produces germanium, which is also on the critical mineral list. Canada amended the ICA in 2024 to tighten rules around any large foreign acquisition of its domestic companies and the potential impact on national security.
Though the Anglo-Teck merger primarily combines the companies' copper assets in Chile, Teck owns the Highland Valley copper mine in Canada.
Teck shareholders are scheduled to vote on the merger on December 9. On Wednesday, proxy advisory firm ISS recommended that Anglo American and Teck shareholders vote in favor of the deal.
(Reporting by David Ljunggren in Ottawa and Divya Rajagopal in Toronto; Editing by Bill Berkrot)
Teck Resources Ltd
Recommendations Highlight Significant Benefits and Value Creation Opportunity for Teck Shareholders
Teck’s Board of Directors Unanimously Recommends Teck Shareholders Vote “FOR” the Merger TODAY
VANCOUVER, British Columbia, Nov. 26, 2025 (GLOBE NEWSWIRE) — Teck Resources Limited (TSX: TECK.A and TECK.B, NYSE: TECK) (“Teck”) today announced that independent proxy advisory firms Institutional Shareholder Services, Inc. (“ISS”) and Glass Lewis & Co. (“Glass Lewis”) have recommended that Teck shareholders vote “FOR” the Company’s merger of equals (the “Merger”) with Anglo American plc (“Anglo American”). As previously announced, Teck has scheduled a special meeting of shareholders on December 9, 2025 (the “Meeting”).
In their reports dated November 26, 2025, and November 21, 2025, respectively, ISS and Glass Lewis stated:
-
ISS: “The arrangement makes strategic sense in light of the anticipated synergies, strategic benefits, and opportunity for additional upside through ownership in the combined company. The universe of potential buyers is limited, the board actively explored alternative transaction structures in order to maximize shareholder value, shareholders are expected to benefit from increased liquidity and stronger financial position for the combined company, and the market reaction has been positive.”
-
Glass Lewis: “Overall, the strategic merits of the combination appear well supported by the scale, asset quality and long-term copper growth profile of the combined company. If successfully executed, the merger positions Anglo Teck as a financially stronger and more resilient producer with meaningful upside from operational integration and future development opportunities…On balance, we believe the transaction presents a compelling strategic opportunity for Teck shareholders.”
“The Teck Board has determined that a merger of equals with Anglo American is the best path forward for Teck shareholders and all stakeholders,” said Jonathan Price, President and CEO. “The recent recommendations from ISS and Glass Lewis further affirm this view. This merger is a unique opportunity to build a new global critical minerals champion headquartered in Canada with increased scale, a world-class portfolio of copper and critical minerals assets, and enormous growth potential. We are confident the transaction will drive significant value creation and encourage all Teck shareholders to vote for the merger.”
Teck Shareholders Encouraged to Vote Ahead of the Proxy DeadlineTeck shareholders of record as of the close of business on October 20, 2025, should vote “FOR” the Merger now and can advance vote up to the proxy voting deadline of 11:00 a.m. PST, December 5, 2025.
Teck’s notice of meeting, management information circular and other related Meeting materials have been mailed to shareholders and can also be accessed online on Teck’s website at www.Teck.com/reports and under Teck’s issuer profiles on SEDAR+ at www.sedarplus.ca and EDGAR at www.sec.gov.
Any shareholder who has questions about how to vote should contact our proxy solicitation agents:
Shareholders Located in CanadaLaurel Hill Advisory GroupToll-Free: 1-877-452-7184Text Message: 1-416-304-0211Email: assistance@laurelhill.com
Shareholders Located Outside of Canada
Innisfree M&A IncorporatedUS Toll Free: 1-877-750-0510Outside US: +1-412-232-3651Banks and Brokers: 1-212-750-5833
The Merger, which was announced in September 2025, is subject to shareholder approvals and customary closing conditions, including approval under the Investment Canada Act and applicable competition and regulatory approvals in various jurisdictions globally.
Shareholder Support for the Merger In addition to the unanimous support of the Teck Board of Directors, the Merger is supported by Temagami Mining Company Limited, SMM Resources Incorporated, Dr. Norman B. Keevil and the directors and executive leadership team of Teck, who have collectively agreed to vote shares representing approximately 79.8% of the issued and outstanding Teck Class A common shares and approximately 0.02% of the issued and outstanding Teck Class B subordinate voting shares (as of the record date for the Meeting) in favour of the Merger at the Meeting.
Forward Looking StatementsThis news release contains certain forward-looking information and forward-looking statements as defined in applicable securities laws (collectively referred to as forward-looking statements). These statements relate to future events or future performance. All statements other than statements of historical fact are forward-looking statements. The use of any of the words “anticipate”, “can”, “could”, “plan”, “continue”, “estimate”, “expect”, “may”, “will”, “would”, “project”, “predict”, “likely”, “potential”, “should”, “believe” and similar expressions is intended to identify forward-looking statements. These statements involve known and unknown risks, uncertainties and other factors that may cause actual results or events to differ materially from those anticipated in such forward-looking statements. These statements speak only as of the date of this news release. These forward-looking statements include, but are not limited to, statements concerning the anticipated benefits and synergies from the proposed Merger, the expected effects of the Merger on Anglo American and Teck, future production levels, the expected timing of completion of the Merger, and other statements that are not historical facts.
These statements are based on a number of assumptions, including, but not limited to, assumptions regarding general business and economic conditions, future outlook and anticipated events, such as the ability of Anglo American and Teck to complete the Merger, the ability of Teck and Anglo American to obtain all required regulatory and court approvals, the ability of Teck and Anglo American to obtain their respective shareholder approvals for the Merger, the ability of Teck and Anglo American to satisfy all other conditions to the Merger, the strategic vision of the merger between Teck and Anglo American following the closing of the Merger, expectations regarding exploration, production and operational potential, expectations with respect to production capabilities and future financial or operating performance of Teck and Anglo American following the Merger, expectations with respect to Teck’s current production and cost guidance and previously disclosed updates, the potential valuation of the merger of Teck and Anglo American, the expected synergies between Teck and Anglo American, the expected revenue from the synergies between Teck and Anglo American, expectations regarding integration and synergy capture; the accuracy of the pro forma financial position and outlook of Teck and Anglo American following the closing of the Merger, the success of the new board and management team, the satisfaction of the conditions precedent to the Merger, the future financial or operating performance of the merged Teck and Anglo American, the expected EBITDA uplift, the expectations around the headquarters of the combined entity being in Canada, the expectations of the results and success of the Investment Canada Act commitments, the expectations with respect to receiving Investment Canada Act approval, the assumptions surrounding the proposed Investment Canada Act commitments, the expectations with respect to the proposed investments by the combined company in Canada, the potential of Teck and Anglo American following the Merger to meet industry target, public profile expectations, future plans, projections, objectives, estimates and forecasts and the timing related thereto and the expectations surrounding the combined companies long-term strategy. The foregoing list of assumptions is not exhaustive. Events or circumstances could cause actual results to vary materially.
Forward-looking information is based on the information available at the time those statements are made and are of good faith belief of the officers and directors of Teck and Anglo American as of the time with respect to future events and are subject to risks and uncertainties that could cause actual results to differ materially from those expressed in the Forward-looking information. Factors that may cause actual results to vary materially include, but are not limited to, the possibility that the Merger will not be completed on the terms and conditions, or on the timing, currently contemplated, and that it may not be completed at all, due to a failure to obtain or satisfy, in a timely manner or otherwise, required regulatory, shareholder and court approvals and other conditions to the closing of the Merger or for other reasons, the risk that competing offers or acquisition proposals will be made, public perception of the Merger, market reaction to the Merger, the negative impact that the failure to complete the Merger for any reason could have on the business of Anglo American or Teck, the ability of Anglo American and Teck to successfully integrate and capture expected synergies, general economic and market conditions, including interest and foreign exchange rates, global financial markets, changes in government regulations or in tax laws, industry competition, technological developments and other factors described or discussed in Anglo American’s or Teck’s disclosure materials filed with applicable securities regulatory authorities from time to time.
Teck assumes no obligation to update forward-looking statements except as required under securities laws. Further information concerning risks, assumptions and uncertainties associated with these forward-looking statements, the Merger and Teck’s business can be found in Teck’s management information circular in respect of the Meeting filed under Teck’s profile on SEDAR+ (www.sedarplus.ca) and on EDGAR (www.sec.gov).
About TeckTeck is a leading Canadian resource company focused on responsibly providing metals essential to economic development and the energy transition. Teck has a portfolio of world-class copper and zinc operations across North and South America and an industry-leading copper growth pipeline. We are focused on creating value by advancing responsible growth and ensuring resilience built on a foundation of stakeholder trust. Headquartered in Vancouver, Canada, Teck’s shares are listed on the Toronto Stock Exchange under the symbols TECK.A and TECK.B and the New York Stock Exchange under the symbol TECK. Learn more about Teck at www.teck.com or follow @TeckResources.
Investor Contact:Emma ChapmanVice President, Investor Relations +44.207.509.6576emma.chapman@teck.com
Media Contact:Dale SteevesDirector, External Communications236.987.7405 dale.steeves@teck.com
Energy stocks were higher late Wednesday afternoon, with the NYSE Energy Sector Index and the Energy Select Sector SPDR Fund (XLE) each adding about 1.1%.
The Philadelphia Oil Service Sector Index advanced 1.4%, and the Dow Jones US Utilities Index climbed 1.4%.
West Texas Intermediate crude oil rose 1.2% at $58.67 a barrel, and global benchmark Brent gained 1% to $63.13 a barrel. Henry Hub natural gas futures climbed 2.7% to $4.60 per 1 million BTU.
US natural gas stocks fell 11 billion cubic feet in the week ended Friday, a larger drop than the 5 billion expected in a Bloomberg survey and following a fall of 14 billion in the previous week.
In sector news, Blackstone (BX) is in advanced talks to acquire MacLean Power Systems for more than $4 billion, Bloomberg reported.
In corporate news, Teck Resources (TECK) said that proxy advisory firms Institutional Shareholder Services and Glass Lewis recommended the company's shareholders to vote in favor of its merger with Anglo American. Teck shares rose 0.8%.
Venture Global (VG) shares climbed 3.6% after the company agreed to sell 1 million metric tons of liquefied natural gas annually to Tokyo Gas for 20 years starting in 2030.
Rio Tinto (RIO) is looking to sell its US assets that produce the critical mineral boron, Bloomberg reported. Rio shares added 1.7%.
Talen Energy (TLN) shares gained 3% a day after the company completed the acquisitions of the Freedom Generating Station in Pennsylvania and the Guernsey Power Station in Ohio.
The Toronto Stock Exchange set a second-straight record close on Wednesday as Canada's federal government announced new aid measures for the steel and lumber industries as it moves to make this nation more independent of trade with the United States, even as Canadians poured $61 billion into U.S. securities over recent months and the leaders of both nations are slated to meet tomorrow.
The resources-heavy S&P/TSX Composite Index closed up 279.60 points, or 0.9%, to 31,180.25, taking total gains to more than 1,300 points over the last four trading sessions.
All sectors were higher, led by Base Metals up 2.3%. Within that sector Teck Resources (TECK.-A.TO and TECK-B.TO) was modestly higher as it said independent proxy advisory firms Institutional Shareholder Services. and Glass Lewis recommended that Teck shareholders vote to approve the company's merger with Anglo American plc. As previously announced, Teck has scheduled a special meeting of shareholders for Dec.9. This comes just days after BHP Group (BHP)walked away from a fresh takeover approach for Anglo American, aimed at thwarting a planned tie-up between its rival and Teck.
On business relations between Canada and the U.S., BNN Bloomberg noted a new poll from the Angus Reid Institute that shows three in five Canadians say the country should limit foreign investment. Only a quarter said they would generally welcome it. BNN said Canada's federal government recently delayed the proposed Teck and Anglo American deal, with the government pushing for the $70 billion merger to be legally domiciled in Canada. It cited Industry Minister Melanie Joly saying Ottawa wants to see longer-term commitments to Canada if the deal can go forward.
This comes as BNN Bloomberg in a separate report noted new data from Statistics Canada that says investors funneled $61 billion into U.S. securities over the first half of 2025. BNN noted the securities included treasury bills, notes and bonds and are considered low risk as they are backed by the U.S. government's financial health. Wednesday's report said investors poured $38.1 billion in U.S. equities and investment fund shares alongside $22.3 in U.S. corporate and government bonds from February to June. Only $1.3 billion was invested in all other non-U.S. foreign securities combined with bond purchases offsetting divestments in money market instruments and equities.
BNN noted the agency said over three quarters of acquisitions occurred in February and March when Canadian households, businesses and government grappled with high levels of uncertainty over Canada's economic relationship with the United States. It also noted Canadian investors continued to increase their holdings of U.S. assets, adding $31.9 billion in equities and investment fund shares, government and corporate bonds and money market instruments during July and August.
While Canadians were investing in U.S. portfolio assets, BNN noted foreign investors were reducing their exposure to Canadian securities. It cited the agency saying foreign acquisitions of Canadian securities declined steadily resulting in a net decrease of $22.4 billion from February to May. But foreign investors rekindled their demand for Canadian securities adding $31.9 billion in equities and investment fund shares, government and corporate bonds and money market instruments in the months of July and August. The report noted net purchases totaled $49.0 billion, more than offsetting the cumulative divestment of $22.4 billion in the first half of the year. The acquisition of foreign securities by Canadian investors and the divestment in Canadian securities by foreign investors combined generated a net outflow of funds from the Canadian economy totaling $84.7 billion during the first half of 2025, the BNN report said.
The federal government on Wednesday moved to help and protect Canada's steel and lumber industries against U.S. tariffs, it is further limiting foreign steel imports from countries without a free trade agreement with Canada from 50% to 20% of 2024 levels. It will also cut freight rates to ship steel and lumber across Canada by 50%, from the spring of 2026.
Prime Minister Mark Carney was asked about tomorrow's proposed announcement of a Memorandum of Understanding with Alberta around an oil-pipeline project to the North Coast. According to Carney, the announcement will be about "much more than one thing". Fundamentally, he said, it is about building the Canadian economy and making Canada more independent and more sustainable. "So I would suggest that we wait until the full announcement is made tomorrow," Carney added.
Of note, Carney said he will likely meet with President Donald Trump tomorrow at an event related to the 2026 World Cup tournament of football, which will have Canada and the United States as host nations. "I don't want to over dramatize it," Carney said. "So I would repeat that we are ready to re-engage on those [trade and tariff talks] when the United States wants to re-engage."
Of commodities today, gold traded higher late afternoon Wednesday, buoyed by rising expectations the Federal Reserve will again cut interest rates next month. Gold for February delivery was up $19.10 to US$4,196.40 per ounce.
West Texas Intermediate closed up despite high supply and an increasing possibility of a peace deal to end Russia's war on Ukraine, while a report showed a rise in U.S. inventories last week. WTI crude oil for January delivery closed up $0.70 to settle at US$58.65 per barrel while January Brent crude was last seen up US$0.59 to US$63.07.
(Bloomberg) — BHP Group has walked away from a fresh takeover approach for Anglo American Plc, ending an unexpected and short-lived attempt by the world’s largest miner to thwart a planned tie-up between its smaller rival and Canada’s Teck Resources Ltd.
BHP confirmed on Monday that it had held preliminary discussions with Anglo, but said it was now “no longer considering a combination of the two companies,” and would focus on its own existing portfolio.
Most Read from Bloomberg
- India’s Richest Family Powers Push for Green Space in Mumbai
- San Francisco Hotels That Echoed City’s Decline Sell for 75% Off
- Despite Star Architect’s Alleged Misconduct, New Harlem and Princeton Museums Shine
- Where Train Dreams Meet Reality in Texas
- High-Rises Are Changing the Slovak Capital of Bratislava Beyond Recognition
The regulatory statement followed a Bloomberg News report on Sunday that BHP — which had already failed in a bid for Anglo last year — made a new overture in recent days. Anglo rejected that new approach, according to people familiar with the situation, having reviewed the proposal and decided that it was not superior to the combination with Teck. The people asked not to be named as the discussions were private.
WATCH: BHP says it’s “no longer considering a combination” with Anglo American. Martin Ritchie reports.Source: Bloomberg
BHP’s renewed interest speaks to pressures in an industry eager to add scale and growth, especially in copper, where supply has been dwindling and demand is expected to rise as the world electrifies. Approachable miners with high-quality copper assets are scarce, and their shares are typically more expensive than those of large diversified miners.
The mining giant’s overture comes just weeks before shareholders from Anglo and Teck are scheduled to vote on their own deal to create a company worth more than $60 billion, — effectively putting two long-coveted, copper-rich targets further out of reach.
BHP shares rose as much as 1.3% in Sydney on Monday before paring gains, as investors digested news of the attempt and its abandonment. The stock closed up 0.6%. Anglo American shares whipsawed as markets opened in London, initially rallying 2.6% before giving up gains to trade as much as 2% lower. They were little changed at £27.09 a share as of 8:21 a.m. local time.
BHP CEO Mike Henry at a news conference in Melbourne, Australia, on Oct. 23.Source: Bloomberg
The miner’s first proposal had required Anglo to partly break itself up. The latest plan was structured in a simpler way, the people said, and Anglo has since exited its South African platinum business — potentially making it more digestible to BHP.
Still, since BHP’s last dalliance with Anglo ended, its shares have fallen in Australian trading, while the smaller company’s shares have risen about 11% in London. The deal with Teck has also received broad-based support from Anglo investors.
“Maybe BHP thought there was still an opportunity to squeeze in,” said Glyn Lawcock, head of metals and mining at Barrenjoey Markets Pty Ltd. He added that BHP now had to focus on its big-ticket investments — its most ambitious growth program in years — including at the giant Escondida copper mine in Chile, at the Vicuna venture in Argentina and at operations in South Australia.
BHP said in its statement on Monday that it continued to believe that a combination with Anglo “would have had strong strategic merits and created significant value for all shareholders.” But, the company added, it was “confident in the highly compelling potential of its own organic growth strategy.” It did not provide details of any specifics put to the target’s board.
Mining investors are wary of overly complex deals after the excesses of the last cycle, so many will not mourn the loss of a pricey transaction that would have likely given Anglo an even larger share of the combined entity.
Still, investors were caught by surprise on Monday — leaving the company with the task of explaining its volte-face to shareholders, especially after Chief Executive Officer Mike Henry had spent the months since the last takeover attempt reaffirming the company’s focus on its existing assets, said Dylan Kelly, head of research at Terra Capital, which previously held BHP stock.
“There are lots of questions surrounding what this means for their new strategy,” he said.
Lazard Inc., UBS Group AG and Barclays Plc acted as advisers to BHP on their latest approach.
Anglo declined to comment. Teck and Anglo shareholders are set to vote on Dec. 9 and the deal still needs the approval of regulators in countries including China, the US and Canada.
–With assistance from Jacob Lorinc, Keira Wright, Sybilla Gross and Robin Paxton.
(Corrects fourth-last paragraph to show that Terra Capital no longer holds BHP stock.)
Most Read from Bloomberg Businessweek
- The AI Industry Is Built on a Big Unproven Assumption
- Permabull Tom Lee Sees Bitcoin as High as $200,000 by January’s End
- Target Needs More Than a Vibe Shift to Turn Its Business Around
- The Dirty Secret of Biodegradable Plastic
- Weed Drinks That Get You Very, Very High Could Be Gone Soon
©2025 Bloomberg L.P.
(Bloomberg) — Last Thursday night, the world’s biggest miner made a brazen attempt to gatecrash one of the industry’s biggest-ever deals. Yet just three days later, the bid was already dead.
BHP Group’s last-minute proposal to buy Anglo American Plc and prevent the smaller company from completing its $60 billion combination with Canada’s Teck Resources Ltd. has left investors, bankers and rival executives reeling — especially because the commodities giant spent the past 18 months insisting it had “moved on” from its last failed attempt to acquire London-based Anglo.
Most Read from Bloomberg
-
San Francisco Hotels That Echoed City’s Decline Sell for 75% Off
-
India’s Richest Family Powers Push for Green Space in Mumbai
-
Despite Star Architect’s Alleged Misconduct, New Harlem and Princeton Museums Shine
-
High-Rises Are Changing the Slovak Capital of Bratislava Beyond Recognition
The surprise move and near-instant capitulation have raised questions about BHP’s strategy and its confidence in its standalone growth plans in copper, the metal viewed as increasingly critical by governments across the globe and in tight supply over the coming years. But the company has also drawn praise from some investors for its willingness to once again walk away rather than risk overpaying for a deal.
This account of BHP’s latest bid for Anglo American and its rapid reversal is based on conversations with a dozen people familiar with the situation, who asked not to be identified because the information is private. Representatives for both companies declined to comment.
For BHP and Chief Executive Officer Mike Henry, the attempt simply represented a last-chance attempt to negotiate a friendly deal to acquire a group of copper mines that it has long coveted, according to some of the people. Anglo’s South American operations are some of the best in the business, and were the key driver for BHP’s failed attempt last year.
“There’s a general sense of ‘now-or-never’,” said Tiago Rodrigues Lourenco, a fund manager at Aberdeen Group Plc, whose funds hold shares in both Anglo and BHP. “After the business combination, the complexity of acquiring Anglo–Teck will be much greater, and it would be a much bigger asset for any new bidder to try to acquire in its entirety.”
Anglo has also spent the past year and a half improving and simplifying its business — including by exiting the South African platinum business that BHP didn’t want to own.
When Anglo announced this September it had agreed to a combination with Teck, the industry’s biggest players saw the prospect of two prized copper targets slipping out of reach. Anglo and Teck’s shareholders are due to vote on the combination on Dec. 9 — just two weeks away.
Premium Offer
And so BHP made its move. A small team led by CEO Henry and Chief Development Officer Catherine Raw put together a bid which was comprised mostly of shares, but also included a cash component, according to people familiar with the matter.
The offer was for all of Anglo, and at a premium to the current share price — which BHP’s team believed should be more attractive than the zero-premium deal announced by Anglo and Teck. The companies haven’t disclosed a valuation, but two people familiar with the matter said it valued Anglo’s shares at comfortably above £30, versus a closing price on Thursday of £27.36.
It was also significantly more straightforward than BHP’s proposal last year, which had required Anglo to first partly break itself up before being acquired, and which the company rejected at the time as overly complex.
Coincidentally, executives from both companies attended events around the G-20 over the past week in South Africa — whose government was viewed as one of the key stumbling blocks for BHP’s previous bid for Anglo.
BHP contacted Anglo over the course of last week, before sending the formal and detailed proposal to the Anglo board late Thursday, or early Friday morning in Australia, where the bigger company is based.
WATCH: BHP has walked away from a fresh takeover approach for Anglo American. Martin Ritchie reports.Source: Bloomberg
The bold move set off a rapid chain reaction.
Anglo alerted Teck to the development on Friday, leaving its new partner and its advisers waiting anxiously to see how the situation would play out.
The Anglo board gathered online to discuss the proposal, comparing it to the benefits offered by the Teck deal which would allow the two firms to generate savings and efficiencies by combining their giant and neighboring copper mines in Chile. Chief Executive Officer Duncan Wanblad dialed in from South Africa, where his own calendar included a dinner attended by President Cyril Ramaphosa.
BHP was hoping its overtures would remain behind the scenes to give it time to win over Anglo and avoid a repeat of last year’s public rejection. But on Sunday morning, Bloomberg reported BHP’s approach, citing people familiar with the matter.
Shortly after that, Anglo informed the larger company that it wasn’t interested. The board had decided that the Teck deal remained its best option.
For BHP, there was only one response, according to people familiar: the company would walk away immediately. The world’s biggest miner still feels the scars from its prolonged and public attempt to win Anglo over last year — this time, the proposal would only work if Anglo was interested from the outset in discussing a friendly deal.
BHP’s board and management were also acutely aware of how a protracted process, with little chance of success, would undermine its own growth story.
BHP has huge copper growth options, including new mines in Australia and Argentina as well as growing output at its Escondida mine, the world’s biggest. Still these projects are costly, even for a company of BHP’s size, and do little to offset declines in its production in the short term.
No Deal
By late Sunday night in London, and before Australian markets opened, BHP issued a terse statement saying it had decided against a deal with Anglo after preliminary discussions. Under UK takeover rules, that means it’s restricted from making an offer for the company for the next six months, except in specific circumstances.
The terms BHP offered have not been made public by either side, leaving Anglo investors wondering what might have been offered for their company.
“It would need to be quite a reasonable premium because the Anglo-Teck combination does offer upside in our view,” said George Cheveley, a portfolio manager at asset manager Ninety One, who owns Teck and Anglo shares.
People close to BHP say the offer was serious and compelling and marked a superior bid to the one Anglo rejected 18 months ago.
But from Anglo’s perspective, there were also significant risks tied to discussing a largely stock deal, given BHP’s high dependence on iron ore and its ongoing conflict with China over its sales of the steelmaking ingredient.
Copper prices have risen 24% this year after a series of setbacks at key mines around the world, helping to boost Anglo’s stock relative to BHP because of its greater exposure to the wiring metal. Iron ore by contrast has gained less than 5%.
While investors were still digesting the fast-moving turn of events on Monday and seeking more information from the companies, some BHP shareholders said they would have been concerned about valuation and the risk that BHP might overpay.
“This underscores just how hard it is to do M&A for copper in the current environment,” said Jamie Hannah, the Sydney-based deputy head of investments and capital markets at Van Eck Associates Corp., which holds shares in BHP. “It was always going to be hard.”
–With assistance from Leonard Kehnscherper, Jack Farchy, William Clowes and Mark Burton.
Most Read from Bloomberg Businessweek
-
Permabull Tom Lee Sees Bitcoin as High as $200,000 by January’s End
-
Pulte’s Move to Fix Credit Scores Is Bad News for Homebuyers
-
Target Needs More Than a Vibe Shift to Turn Its Business Around
©2025 Bloomberg L.P.
Company Executives Share Vision and Answer Questions Live at VirtualInvestorConferences.com
NEW YORK, Nov. 25, 2025 (GLOBE NEWSWIRE) — Virtual Investor Conferences, the leading proprietary investor conference series, announced the agenda for the Precious Metals & Critical Minerals Virtual Investor Conference to be held December 2nd, 3rd, and 4th.
Individual investors, institutional investors, advisors, and analysts are invited to attend.REGISTER HERE
It is recommended that investors pre-register and run the online system check to expedite participation and receive event updates. There is no cost to log-in, attend live presentations, or schedule 1×1 meetings with management.
Please Schedule 1×1 Meetings Here
With more than 35 OTCQX and OTCQB companies on the agenda, we’re excited to host our biggest Virtual Investor Conference of the year,” said Jason Paltrowitz, Executive Vice President of Corporate Services at OTC Markets Group. “This is a unique opportunity for resource companies to connect directly with U.S. investors and showcase the strategies shaping the future of precious metals and critical minerals.”
December 2nd
| EasternTime (ET) | Presentation | Ticker(s) |
| 10:00 AM | Metals One PLC | (OTCQB: MTOPF | LSE: MET1) |
| 11:00 AM | Guanajuato Silver Company Ltd. | (OTCQX: GSVRF | TSXV: GSVR) |
| 11:30 AM | Cassiar Gold Corp. | (OTCQX: CGLCF | TSXV: GLDC) |
| 12:30 PM | Panthera Resources PLC | (OTCQB: PATRF | LSE: PAT) |
| 1:00 PM | Harena Rare Earths PLC | (OTCQB: CRMNF | LSE: HREE) |
| 1:30 PM | DynaResource, Inc. | (OTCQX: DYNR) |
| 2:00 PM | Apollo Silver Corp. | (OTCQB: APGOF| TSXV: APGO) |
| 2:30 PM | Wallbridge Mining Company Ltd. | (OTCQB: WLBMF | TSX: WM) |
| 3:00 PM | Cerrado Gold Inc. | (OTCQX: CRDOF | TSXV: CERT) |
| 3:30 PM | Grid Metals Corp. | (OTCQB: MSMGF| TSXV: GRDM) |
| 4:00 PM | Spartan Metals Corp. | (OTCQB: SPRMF| TSXV: W) |
December 3rd
| EasternTime (ET) | Presentation | Ticker(s) |
| 9:00 AM | European Lithium Ltd | (OTCQB: EULIF | ASX: EUR) |
| 9:30 AM | Yellow Cake Plc | (OTCQX: YLLXF | LSE: YCA) |
| 10:00 AM | Hochschild Mining Plc | (OTCQX: HCHDF | LSE: HOC) |
| 10:30 AM | Kirkland Lake Discoveries Corp. | (OTCID: KLKLF| TSXV: KLDC) |
| 11:00 AM | District Metals Corp. | (OTCQX: DMXCF | TSXV: DMX) |
| 11:30 AM | Liberty Gold Corp. | (OTCQX: LGDTF | TSX: LGD) |
| 12:00 PM | DLP Resources Inc. | (OTCQB: DLPRF | TSXV: DLP) |
| 12:30 PM | Ecora Resources PLC | (OTCQX: ECRAF | TSX: ECOR | LSE: ECOR) |
| 1:00 PM | Beyond Lithium Inc. | (OTCQB: BYDMF | CSE: BY) |
| 1:30 PM | Precore Gold Corp. | (CSE: PRCG) |
| 2:00 PM | Heliostar Metals Ltd. | (OTCQX: HSTXF | TSXV: HSTR) |
| 2:30 PM | LibertyStream Infrastructure Partners Inc. | (OTCQB: VLTLF | TSXV: LIB) |
| 3:00 PM | Banyan Gold Corp. | (OTCQB: BYAGF | TSXV: BYN) |
| 4:00 PM | Astra Exploration Inc. | (OTCQB: ATEPF | TSXV: ASTR) |
December 4th
| EasternTime (ET) | Presentation | Ticker(s) |
| 9:00 AM | Empire Metals Ltd. | (OTCQX: EPMLF | LSE: EEE) |
| 9:30 AM | Elevate Uranium Ltd. | (OTCQX: ELVUF | ASX: EL8) |
| 10:00 AM | Silver Tiger Metals Inc. | (OTCQX: SLVTF| TSXV: SLVR) |
| 10:30 AM | STLLR Gold Inc. | (OTCQX: STLRF| TSX: STLR) |
| 11:00 AM | Arras Minerals Corp. | (OTCQB: ARRKF| TSXV: ARK) |
| 11:30 AM | Precipitate Gold Corp. | (OTCQB: PREIF | TSXV: PRG) |
| 12:00 PM | First Phosphate Corp. | (OTCQX: FRSPF | CSE: PHOS) |
| 12:30 PM | Galloper Gold Corp. | (PINK: GGDCF | CSE: BOOM) |
| 1:00 PM | Arizona Sonoran Copper Company | (OTCQX: ASCUF | TSX: ASCU) |
| 1:30 PM | CUPANI Metals Corporation | (OTCQB: CUPIF | CSE: CUPA) |
| 2:00 PM | OceanaGold (Philippines), Inc. | (OTCQX: OGPIF| PSE: OGP) |
To facilitate investor relations scheduling and to view a complete calendar of Virtual Investor Conferences, please visit www.virtualinvestorconferences.com.
About Virtual Investor Conferences®
Virtual Investor Conferences (VIC) is the leading proprietary investor conference series that provides an interactive forum for publicly traded companies to seamlessly present directly to investors.
Providing a real-time investor engagement solution, VIC is specifically designed to offer companies more efficient investor access. Replicating the components of an on-site investor conference, VIC offers companies enhanced capabilities to connect with investors, schedule targeted one-on-one meetings and enhance their presentations with dynamic video content. Accelerating the next level of investor engagement, Virtual Investor Conferences delivers leading investor communications to a global network of retail and institutional investors.
CONTACT: Media Contact:
OTC Markets Group Inc. +1 (212) 896-4428, media@otcmarkets.com
Virtual Investor Conferences Contact:
John M. Viglotti
SVP Corporate Services, Investor Access
OTC Markets Group
(212) 220-2221
johnv@otcmarkets.com
Australia’s BHP Group (BHP.AX) has walked away from a fresh takeover approach for London-listed mining rival Anglo American (AAL.L) just 18 months after its last ill-fated attempt to snap up the firm.
BHP confirmed it had held “preliminary discussions” with Anglo American about a possible bid, but said late on Sunday it was now “no longer considering a combination of the two companies”.
The FTSE 100 (^FTSE) firm added: “Whilst BHP continues to believe that a combination with Anglo American would have had strong strategic merits and created significant value for all stakeholders, BHP is confident in the highly compelling potential of its own organic growth strategy.”
It is thought that Anglo had rejected the latest approach from BHP, which would have thwarted the agreed mega-merger between Anglo and Canadian rival Teck Resources (TECK-A.TO).
Anglo is just weeks away from a shareholder vote on the Teck tie-up, which will create one of the world’s largest copper producers with a combined value of close to £40 billion.
The Teck deal will see Anglo move its headquarters away from London, with the combined group to be led out of Vancouver in Canada, although it will retain corporate offices in the UK and Johannesburg, South Africa.
The merged firm – to be called Anglo Teck – will keep its primary listing on the London Stock Exchange (LSE), with secondary listings in Toronto, South Africa and New York.
The deal is billed as a “merger of equals”, though Anglo shareholders will own about 62.4% of the merged company and Teck the remaining 37.6%.
BHP’s previous near-£39 billion proposal for Anglo ended in May last year as the pair were unable to reach an agreement over specific issues.
A deal between the two companies would have created the biggest copper miner in the world, with 10% of global output.
Anglo’s vast reserves of copper are a key driver of the interest in the business, as the mineral is an important building block for low-carbon technologies such as solar farms and electric cars.
Earlier in 2024, Anglo announced plans to break up major parts of the business and heavily slow down its development of a £7 billion North Yorkshire fertiliser mine.
STORY: BHP’s late multi-billion dollar attempt to buy Anglo American ended on Monday (November 24).The Australian miner said it was no longer interested in a potential link-up after early discussions with Anglo’s board.BHP said it still believes a tie-up would have offered “strong strategic merits” and created value for stakeholders.But further said it was still confident in its own organic growth strategy.Any takeover would have boosted BHP’s dominance in copper.It’s already the world’s biggest copper producer but risks losing that title in the years ahead without major new projects.UK securities rules means BHP can’t now make another bid for Anglo for six months. Anglo had already rejected three approaches from BHP last year.Investors will now look towards a key vote in two weeks.Shareholders at Anglo and Canada’s Teck Resources are due to vote on a $60 billion merger to become Anglo Teck.It would be a copper giant with big developments in Chile and Peru.
This article first appeared on GuruFocus.
BHP's (NYSE:BHP) latest move landed like a plot twist investors didn't see coming. After holding preliminary discussions with Anglo American in recent days, the miner said it is no longer considering a combination, effectively abandoning a short-lived attempt to interrupt Anglo's planned merger with Teck Resources. People familiar with the matter said Anglo reviewed the approach and rejected it, concluding it was not superior to the Teck tie-up already headed for a December 9 shareholder vote. The timing raised eyebrows: this was BHP's second overture in two years, following a failed 2024 proposal that would have required Anglo to partially break itself up, even as the two copper-rich targets prepare to create a company worth more than $60 billion.
Investors spent Monday trying to interpret what the retreat could mean for a sector where copper scarcity and electrification-driven demand keep raising the stakes. BHP shares initially jumped as much as 1.3% in Sydney before fading to a 0.1% gain near the close, reflecting a market still digesting the pivot. Dylan Kelly at Terra Capital said some shareholders were possibly surprised because CEO Mike Henry had spent months emphasizing discipline around existing assets. Meanwhile, Anglo shares have gained 11% in London since BHP's previous bid ended, even as BHP's have drifted lower, underscoring a backdrop where copper miners with long-life assets have become both rare and expensive. Van Eck's Jamie Hannah suggested the attempt was always going to be difficult in this environment rather than a straightforward strategic miss.
Now the focus moves back to BHP's own copper portfolio and the decisive December 9 vote that will determine whether Anglo and Teck proceed with their merger. Glyn Lawcock at Barrenjoey said the miner will likely need to lean harder into its existing growth engines, including Escondida in Chile, the Vicuna venture in Argentina, and operations in South Australia. BHP said the Anglo combination could have offered strong strategic merits but reiterated confidence in the potential of its organic growth strategy. Lazard, UBS, and Barclays advised BHP on the now-abandoned approach, while the Anglo-Teck deal remains subject to regulatory approvals in China, the US, and Canadasetting up a consequential stretch for one of the copper market's most closely watched consolidation stories.
Rokmaster Resources (RKR.V) on Monday provided an update on the Fox-Coconut and Mystery properties w
If you would like to receive our free newsletter via email, simply enter your email address below & click subscribe.
 Follow us on Twitter
 Become our facebook fan
CONNECT WITH US
Tweets
Tweet with hash tag #miningfeeds or @miningfeeds and your tweets will be displayed across this site.
MOST ACTIVE MINING STOCKS
Daily Gainers
 CMC Metals Ltd. CMC Metals Ltd. |
CMB.V | +900.00% |
 Eden Energy Ltd Eden Energy Ltd |
EDE.AX | +200.00% |
| GoviEx Uranium Inc. |
GXU.V | +42.86% |
| Eagle Nickel Ltd. |
ENL.AX | +41.67% |
| Citigold Corp. Limited |
CTO.AX | +33.33% |
| Mount Burgess Mining NL |
MTB.AX | +33.33% |
| Exalt Resources Limited |
ERD.AX | +31.94% |
| Casa Minerals Inc. |
CASA.V | +30.00% |
| Cariboo Rose Resources Ltd |
CRB.V | +28.57% |
| Belmont Resources Inc. |
BEA.V | +28.57% |


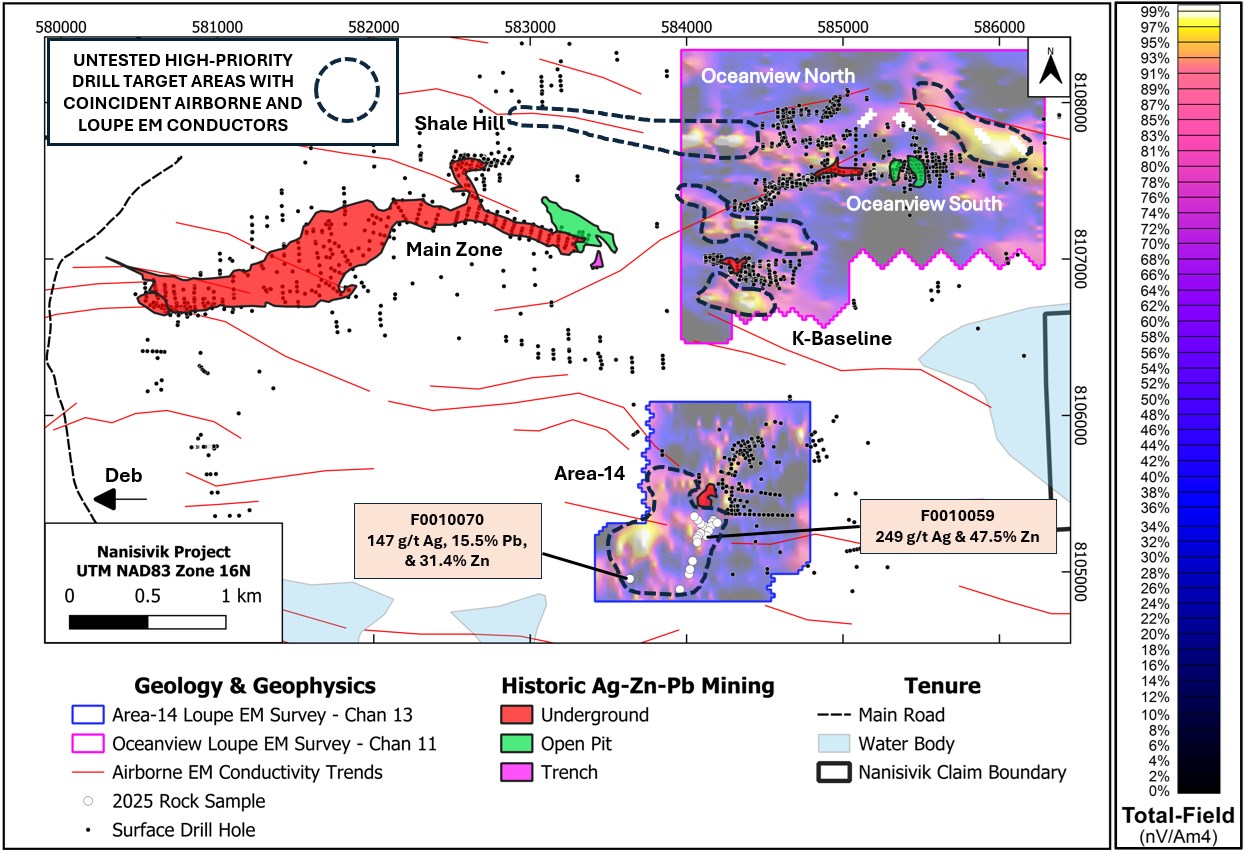
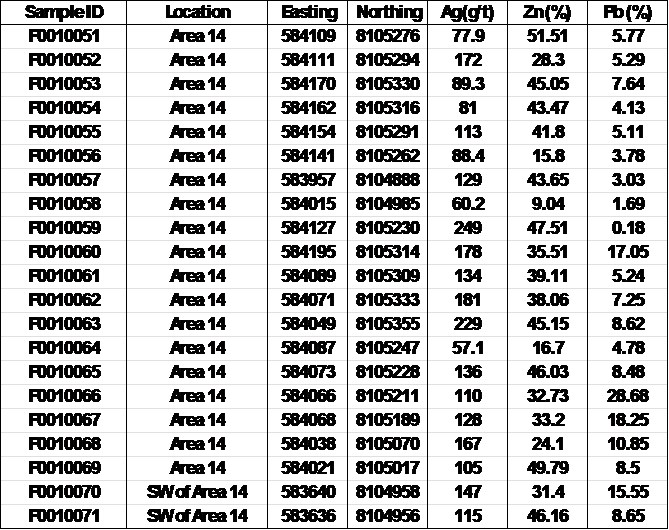
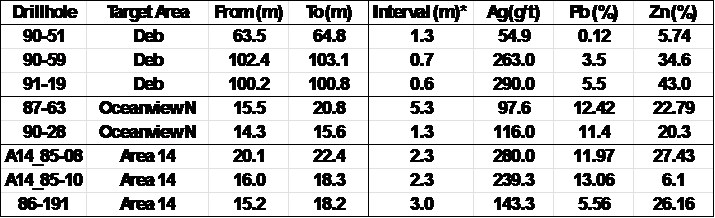