VANCOUVER, BC, Nov. 24, 2025 /CNW/ – Rokmaster Resources Corp. (TSXV: RKR) (OTCQB: RKMSF) (FSE: 1RR1) ("Rokmaster" or "the Company") is pleased to provide an update on the Fox-Coconut and Mystery properties within the Nechako Project.
The Nechako Project is located in west-central British Columbia within the prolific Stikine terrane with several past producing deposits and advanced development projects in the region (Figure 1). Rokmaster has options to acquire up to a 100% interest on three road-accessible properties (Mystery, Fox-Coconut, and Hanson) which when combined totals 27,178 hectares (271 km2). Despite significant improvements in access by logging and in outcrop exposure by fires, the region remains an underexplored portion of the productive Stikine terrane.
Field work in 2025 included trenching and channel sampling the NW structure on the Fox-Coconut Property and additional exploration on the Mystery Property. Trenching on the Coconut Property uncovered a structurally controlled zone of high-grade gold and silver mineralization known as the NW Structure. Four trenches exposed highly strained and oxidized andesite tuff hosting boxwork quartz-limonite-barite veining near a contact with quartz monzonite. Several channel samples from trenches CT2501 and CT2502, which are separated by 45 m along strike, returned high-grade silver mineralization as shown in the table below and in Figure 2.
|
Trench |
Sample Type |
Au g/t |
Ag g/t |
Length (m) |
|
CT2501 |
Channel |
0.75 |
614.0 |
1.2 |
|
CT2502 |
Channel |
0.24 |
497.0 |
2.5 |
|
Notes to Table: |
|
1. Widths reported are sampled widths, such that true thicknesses are unknown. |
|
2. Samples were prepared and analyzed by MSALABS in Langley BC. After preparation, samples were analyzed for Au by 30 g Fire Assay AAS finish (method FAS-111), Ag by 4-acid digest single element (ore grade method ICF-6Ag) and ICP 34 for elements including Zn, Pb and Ag by 4-acid digestion of a 0.25 g subsample with ICP-ES finish (method ICP-230). |
Work on the Mystery Property in 2025 included multiple phases of prospecting and mapping which collected rock grab and soil samples for geochemical, spectral, and geochronology analysis. The B2 Zone returned elevated Cu-Mo-Au assay results associated with pyrite-chalcopyrite D-veining in the strongly magnetite and potassic altered andesite host which has limited exposure. Further Cu-Mo-Au mineralization in similar style was discovered in the B3 Zone located approximately 800 to the southeast, with the distance between blanketed by glacial till cover (Figure 3). Further prospecting found new molybdenite mineralization hosted in monzonite north of the Ford Anomaly and expanded the footprint of argillic altered felsic volcanic rocks to the west. The high-resolution magnetic survey was subject to a 3D inversion which offers multiple targets with coincident anomalous surface geochemistry for follow-up. The Ford Anomaly occurs near the northern end of the large area of sericite- and pyrite-altered Kasalka Group rhyolite and hosts a large Cu-Au soil anomaly coincident with the margins of the magnetic feature. The area is also near the southern contact of a monzonite stock which belongs to the fertile late cretaceous Bulkley suite, which is associated with porphyry Cu-Mo-Au-Ag mineralization at the nearby Huckleberry, Ox, and Seel deposits1.
Although the company recently gained approval on a three year exploration permit on the Mystery Property that allows for 12 drill sites and 6 helipads, several conditions of the permit were unable to be completed during autumn largely due to the job action by the BC Government. Specifically, the exploration drilling permit currently has a restricted timeframe to complete drilling in the summer months and while the company attempted to extend that by completing a Wildlife Management Plan, that process was interrupted by the inability to obtain essential data from government. The job action has since been resolved and the process has resumed.
John Mirko, President and CEO, comments:
"The Nechako Project is advancing three prospective properties in a highly underexplored portion of the prolific Stikine Terrane. The fires which raged through the area in 2018-2021 gives us a huge advantage over previous operators, and we're finding encouraging alteration and mineralization in areas which were walked over before. Field work on the Nechako Project in 2025 further developed several key areas to the point of drill testing, particularly on the Mystery Property where there are multiple very enticing targets to test. While the delays to extend the drilling window have been unfortunate, the team is eager to resume exploration on the Nechako Project as early as possible in 2026."
|
Footnote 1: Sharman, L., Lang, J.T. and Chapman, J. eds., 2021. Porphyry deposits of the northwestern Cordillera of North America: A 25-year update. CIM Special Volume 57. |
The technical information in this news release has been prepared in accordance with Canadian regulatory requirements as set out in National Instrument 43-101 and reviewed and approved by Eric Titley, P.Geo., who is independent of Rokmaster and who acts as Rokmaster's Qualified Person.
On Behalf of the Board of Directors of Rokmaster Resources Corp. John Mirko, President & Chief Executive Officer.
Neither TSX Venture Exchange nor its Regulation Services Provider (as that term in defined in the policies of the TSX Venture Exchange) accepts responsibility for the adequacy or accuracy of this press release.
CAUTIONARY NOTE REGARDING FORWARD LOOKING STATEMENTS: This news release may contain forward-looking information within the meaning of applicable securities laws ("forward-looking statements"). Forward-looking statements are statements that are not historical facts and are generally, but not always, identified by the words "expects," "plans," "anticipates," "believes," "intends," "estimates," 'projects," "potential" and similar expressions, or that events or conditions "will," "would," "may," "could" or "should" occur. These forward-looking statements are subject to a variety of risks and uncertainties which could cause actual events or results to differ materially from those reflected in the forward-looking statements, including, without limitation: closing of the FT Financing; risks related to fluctuations in metal prices; uncertainties related to raising sufficient financing to fund the planned work in a timely manner and on acceptable terms; changes in planned work resulting from weather, logistical, technical or other factors; the possibility that results of work will not fulfill expectations and realize the perceived potential of the Company's properties; risk of accidents, equipment breakdowns and labour disputes or other unanticipated difficulties or interruptions; the possibility of cost overruns or unanticipated expenses in the work program; the risk of environmental contamination or damage resulting from Rokmaster's operations and other risks and uncertainties. Any forward-looking statement speaks only as of the date it is made and, except as may be required by applicable securities laws, the Company disclaims any intent or obligation to update any forward-looking statement, whether as a result of new information, future events or results or otherwise.
Cision
View original content to download multimedia:https://www.prnewswire.com/news-releases/rokmaster-samples-614-gt-ag-over-1-2-m-on-the-fox-coconut-property-and-provides-update-on-nechako-project-302624249.html
Cision
View original content to download multimedia: http://www.newswire.ca/en/releases/archive/November2025/24/c8982.html
Next month shareholders in London-based mining giant Anglo-American will gather at City lawyers Linklaters' 1980's office in the shadow of the Barbican to vote on the firms' $50 billion powerhouse copper merger with Canada's Teck Resources.
The proposed deal – the second biggest mining merger ever – would consolidate two vast copper fields in Chile, Collahuasi, operated by Anglo American, and Quebrada Blanca, operated by Teck.
Called Anglo Teck, the firm would be headquartered in Vancouver – a further blow to the UK mining sector after BHP left the City in 2022 – though it will remain primarily listed in the London.
Yet issues over the deal keep emerging, not least Chile’s environmental authorities voicing longstanding concerns over air pollution and damage to glaciers in the central Andes.
Glaciers are vital water sources for Chilean capital Santiago and have significantly retreated over 60 years. Anglo-Teck plan to mine underneath the protected Yerba Loca nature reserve and Anglo has already built an exploratory five mile tunnel underneath three glaciers. They also plan to transport 48m tonnes of toxic waste through a 25-mile pipeline which Anglo say has governmental and environmental approval in Chile.
But, as Prince William's recent intervention at the Cop 30 summit shows, environmental concerns are becoming a huge worldwide issue not localised ones. And Chilean campaigners are quick to point out that: “Moving thousands of tonnes of toxic waste through the mountains to a dam not far from the capital could lead to an environmental disaster.”
Anglo have already warned that its 2026 copper output will be lower than expected. Their plans to expand copper production in Chile have been hit by a number of setbacks at Collahuasi.
Neither are the Canadian Government falling over themselves with excitement at the deal either, despite the mooted Vancouver headquarters.
The federal government is pressuring Anglo American to become legally Canadian and is forensically examining the British miner’s $20-billion bid. Ottowa wants it listed in Canada, under Canadian regulatory authority, which is unsurprising given the industry's criticisms of the deal.
Indeed Anglo have already admitted increased Governmental scrutiny may have an adverse affect on business operations in countries they operate in.
In a published circular they concede:"“While the Directors believe that the Merger is in the best interests of Anglo American and Shareholders, it may not be viewed favourably by governments in certain jurisdictions and Anglo Teck may be subject to heightened regulatory scrutiny by Governmental Entities, which could disrupt business operations in countries in which Anglo Teck will operate or result in the imposition of increased restrictions or conditions on Anglo Teck’s business and operations, the nature and extent of which are uncertain and unpredictable.”
Critics of the deal also point out Anglo American is struggling to sell $9.3 billion of its other assets as it looks to strengthen their balance sheet to enable the merger and concentrate on copper production. A not entirely positive third quarter production report raised questions over delivery of merger synergies.
These include its current failure to sell off its 85% stake in diamond company De Beers, a guilty plea to environmental breaches in their Northern Ontario operations, failure to sell its steelmaking coal business, a regulatory impasse in the sale of its Brazilian nickel assets and a $1.6 billion write down at Anglo’s flagship Woodsmith fertiliser mine in North Yorkshire following a $1.7 billion write down in 2024. Around 1,000 workers at the mine have been laid off.
The UK Government is unlikely to be impressed by the merger either, with job reductions likely in Britain rather than Canada as a result of $60 million synergy cost reductions proposed by Anglo and the subsequent loss of tax contributions to HMRC.
Now despite caution over Canada's desire to retain control over Teck and fears that Chile's environmental backlash may hinder expansion plans, rival bidders in this most macho of resource sectors are licking their lips at the thought of dramatic last minute interventions that could see off Anglo's chances.
Rio Tinto is being urged by investors to make a bid for Teck; and Glencore continue to hold a keen interest in the merger with the Collahuasi site – a joint venture with Glencore and Anglo each owning 44% of the mine.
In contrast to Anglo, Glencore recently published its own Q3 production report which showed its copper production is up 36% quarter-on-quarter – giving Glencore the potential to pull the rug from under Anglo’s feet, especially considering the firm's past attempts to acquire Teck.
Rio shareholder Palliser Capital has called on Rio Tinto to make a “now or never” bid to acquire Teck, stating it would unlock $800 million in cost synergies.
By adding Teck’s copper to its own portfolio and the result is beyond iron ore and into major league copper production. By unifying the two companies, it could ultimately see Rio divide into two parts, one concentrating on copper, aluminium and zinc based in Canada, and one in Australia focused on iron ore.
Already Rio Tinto's stock increased by 0.3% on the Australian stock market earlier this month, aligning stronger underlying prices and a recent uptick in copper prices with speculation of intervention in the Teck merger.
So with a perfect storm of Canada's regulatory demands, UK Government disapproval, howling environmental protests, Anglo's asset sale woes and pressure on Rio Tinto and possibly Glencore to counter bid, its shareholders might now be questioning whether Anglo can make good on the promised synergies and improved financial performance that form the rationale for the merger.
Nigel Rosser is an international mining consultant. He is currently involved with a major documentary film on Brazil’s gold and mineral trade.
Toronto, Ontario–(Newsfile Corp. – November 19, 2025) – Honey Badger Silver Inc. (TSXV: TUF) (OTCQB: HBEIF) ("Honey Badger" or the "Company") is pleased to announce that the Company has identified two new silver-gold-lead-zinc zones from the recent soil sampling and prospecting program at its 100% owned Plata Project in the Yukon: the newly named "Pimento" located northwest of the high-grade silver- gold Ajo zone, and the "Inferno" zone located near the newly-staked claims.
The Company's Executive Chairman, Chad Williams, commented: "Plata has exceptional potential. I have never seen a property in my career with this many different types of mineral occurrences in such varied geologic settings in so many areas. We've identified a large geochemical anomaly over the Inferno Zone in conjunction with important field observations like the presence of copper sulfide-bearing sheeted quartz veins, altered felsic intrusions, and hornfels altered host rock, all of which suggest the potential for a large silver-gold system. Inferno is another high-priority follow-up area for the 2026 field season. Pimento is yet another new area of silver-gold-lead-zinc mineralization located ~2.3 km northwest of the high-grade silver and gold-bearing Ajo zone. Plata is a truly exceptional property with tremendous mineral endowment that we are excited to get back to for additional fieldwork and expected drilling in 2026."
Summary of 2025 Fieldwork
This past summer, Honey Badger completed a large fieldwork program focused on soil sampling and prospecting at Plata. The goal of the fieldwork program was to collect soil and supplementary grab samples over several target areas across the large property to identify new silver and gold zones. The program was successfully completed in late September and included a total of 1,027 soil samples and 115 rock samples. The program culminated in the discovery of several new silver-gold-lead-zinc zones including Canela (see press release dated Nov 13, 2025) and Pimento as well as the identification of significant geochemical anomalies over the Inferno zone area coinciding with sheeted quartz veining and hornfels alteration. Visual observations from the fieldwork combined with the identification of historic gold-in-soil anomalies also led to staking additional prospective ground in the Inferno zone area.
Figure 1. Regional map of the Plata Project showing the location of the Canela, Pimento, Inferno, and Ajo zones at Plata relative to other major gold and silver showings in the area. Note: The QP has not independently verified the Rogue Mineral Resource Estimate (MRE) or drill results quoted in the image above. The Rogue MRE is not necessarily indicative of mineralization on the property that is the subject of the disclosure.
To view an enhanced version of this graphic, please visit:https://images.newsfilecorp.com/files/3204/275224_9b3afad964efaad7_001full.jpg
Background on Inferno
The Company is pleased to share that soil sampling over the Inferno zone has returned a broad 2.3 km x 1 km antimony anomaly that includes local elevated silver and gold anomalies, hornfels alteration in host rock, and sheeted veining with copper sulfides (Fig. 2). Antimony is an important pathfinder element that is often associated with silver and gold deposits. The strongest part of the antimony anomaly coincides with a broad 1100 m x 400 m gold-in-soil anomaly that includes a ~450 x 200m core of elevated gold values, which range up to 74 ppb Au in the Inferno zone area (Fig. 2). The broad gold anomaly also coincides with elevated silver, tellurium, and bismuth values, which are also important pathfinder elements commonly associated with silver and gold deposits. There are also several soil samples with anomalous gold values that form a trend along or proximal to the Plata Thrust Fault. The Plata Thrust Fault is an important structure elsewhere at Plata and is host to the high-grade silver-gold-antimony Ajo zone (Fig. 3). The Inferno zone area will be a priority follow-up target for prospecting work in 2026. Honey Badger also completed additional staking to the south of the Inferno zone area this past summer (see press release dated October 16, 2025), securing highly prospective ground that borders on a significant 2 km long gold-in-soil anomaly (Fig. 3).
Watch this fly-over video of the newly discovered Inferno zone showing bright yellow sulfide-lenses along the hillside.
Figure 2. Map of the Inferno Zone area at the Plata Project showing antimony (Sb) values in both soil and rock samples. Results from the 2025 fieldwork have delineated a ~2.3 km x 1 km zone of moderate to strongly anomalous antimony values within soil and rock samples. During the field program, additional ground was staked to the south of the Inferno zone, which will be critical in for follow-up work to find the source of the broad geochemical anomaly, sheeted quartz veining, and host rock alteration.
To view an enhanced version of this graphic, please visit:https://images.newsfilecorp.com/files/3204/275224_9b3afad964efaad7_002full.jpg
Figure 3. Map of the Inferno Zone area at the Plata Project showing gold values in both soil and rock samples. Results from the 2025 fieldwork has delineated a ~450m x 200m zone of moderate gold-in-soil values within a broader 1200 x 400m gold anomaly. During the field program, additional ground was staked to the south of the Inferno zone, which will be critical in identifying the source of high gold-in-soil values of up to 0.12 g/t from 2023 soil sampling.
To view an enhanced version of this graphic, please visit:https://images.newsfilecorp.com/files/3204/275224_9b3afad964efaad7_003full.jpg
Background on Pimento
In addition to the newly discovered Canela Zone, the Company has also discovered another zone of silver-gold-lead-zinc mineralization, newly named the Pimento zone. Pimento is located ~2.3 km to the northwest of the high-grade silver-gold-antimony Ajo zone and comprises newly collected rock samples spaced ~500 m apart that returned grades of up to 0.15 g/t gold, 44.3 g/t silver, 0.14% lead, and 0.39% zinc (Fig. 4). The rock samples include both subcrop and float which are interpreted to be locally sourced. This area has never had any documented work completed on it and represents a brand-new zone of mineralization on the property, with the closest historic sample being ~600m away. Follow-up prospecting work will be completed at Pimento in 2026, which will aim to uncover additional Ajo-style mineralization (Fig. 4).
Figure 4. Map of the newly discovered silver-gold-lead-zinc "Pimento Zone" at the Plata Project showing silver values in both soil and rock samples. The new mineralized rock samples are approximately 500m apart along a ridge top approximately 2.3km northwest of the high-grade silver and gold Ajo Zone. Tarea has been explored (closest historic sample is ~600m away).
To view an enhanced version of this graphic, please visit:https://images.newsfilecorp.com/files/3204/275224_9b3afad964efaad7_004full.jpg
Next Steps
The Company will continue to review the new assay data in conjunction with historical drilling, soil and grab samples as well as leverage geophysical and structural data over the winter to prepare for follow-up fieldwork and expected drilling in 2026.
About Plata
Plata is located in east-central Yukon within the Tombstone Gold Belt and is a past producing high-grade silver property that produced about 290,000 ounces of silver from small-scale mining of high-grade veins that are exposed at surface (Carlson, G.G., 2010, "Technical Report Describing Exploration and Development at the Plata Project, located in the Mayo Mining District, East-Central Yukon", report prepared for Platoro West Holdings Inc.). Ore was mined and flown by fixed wing aircraft to Idaho for processing. Historical exploration at Plata has primarily focused on the outcropping high-grade silver veins. These are analogous to the rich Keno Hill Silver Mine in the Yukon, one of the highest-grade silver deposits in the world, now operated by Hecla Mining. While the analogy to Keno Hill remains valid, the Company has continued to develop its understanding of Plata as part of a larger "Snowline-style" mineralized system. Understanding how Plata might fit into a Reduced Intrusion Related Gold System (RIRGS) like Snowline Gold's Rogue and Valley deposits adds the potential for a large gold deposit in addition to the high-grade silver vein potential.
QAQC
Soil samples were collected using soil augers and placed into labeled kraft paper bags that were tied shut. Soil pits were dug as deep as possible to achieve collecting material from the lower B and early C soil horizons. Sample locations were collected using field tablets with built-in GPS.
Rock samples were collected using geotools and rock hammers to break up rock material, which was then placed by hand into labeled plastic poly bags that were tied shut. Samples were labeled as either outcrop, subcrop, or float. All sample locations were marked with flagging tape containing the sample ID, and sampled locations were collected using field tablets with built-in GPS.
Sample preparation and multi-element analyses for rock and soil samples were carried out at ALS Minerals' laboratories in Whitehorse, Yukon and North Vancouver, BC, respectively. Each rock sample was dried and fine crushed to better than 70% passing 2 mm, and then a 250 g split was pulverized to better than 85% passing 75 microns. Soil samples were dried to 60C and sieved to <180 um. The fine fraction was analyzed for 35 elements using aqua regia digestion with ICP-AES finish (ME-ICP41). For all samples, an additional 30 g charge was further analyzed for gold by fire assay with inductively coupled plasma and atomic emission spectroscopy finish (Au-ICP21).
Qualified Person
Technical information in this news release has been approved by Benjamin Kuzmich, P. Geo., who is a Qualified Person (QP) for the purpose of National Instrument 43-101 "Standards of Disclosure for Mineral Projects".
About Honey Badger Silver Inc.
Honey Badger Silver is a silver company. The company is led by a highly experienced leadership team with a track record of value creation backed by a skilled technical team. Our projects are located in areas with a long history of mining, including the Sunrise Lake project with a historic resource of 12.8 Moz of silver at a grade of 262 g/t silver (and 201.3 million pounds of zinc at a grade of 6% zinc) Indicated and 13.9 Moz of silver at a grade of 169 g/t silver (and 247.8 million pounds of zinc at a grade of 4.4% zinc) Inferred(1) located in the Northwest Territories and the Plata high grade silver project located 165 km east of Yukon's prolific Keno Hill and adjacent to Snowline Gold's Rogue discovery. The Company's Clear Lake Project in the Yukon Territory has an unclassified historic resource of 5.5 Moz of silver at a grade of 22 g/t silver and 1.3 billion pounds of zinc at a grade of 7.6% zinc(2). The Company also has a significant land holding at the Nanisivik Mine Area located in Nunavut, Canada that produced over 20 Moz of silver between 1976 and 2002(3). A qualified person has not done sufficient work to classify the foregoing historical resources as current mineral resources, and the Company is not treating the estimates as current mineral resources. The historical resource estimates are provided solely for the purpose as an indication of the volume of mineralization that could be present. Additional work, including verification drilling / sampling, will be required to verify any of the historical estimates as a current mineral resources.
(1) Sunrise Lake 2003 RPA historic resource: Indicated 1.522 million tonnes grading 262 grams/tonne silver, 6.0% zinc, 2.4% lead, 0.08% copper, and 0.67 grams/tonne gold and Inferred 2.555 million tonnes grading 169 grams/tonne silver, 4.4% zinc, 1.9% lead, 0.07% copper, and 0.51 grams/tonne gold.
(2) Clear Lake 2010 SRK historic Resource: Inferred 7.76 million tonnes grading 22 grams/tonne silver, 7.6% zinc, and 1.08% lead.
(3) Geological Survey of Canada, 2002-C22, "Structural and Stratigraphic Controls on Zn-Pb-Silver Mineralization at the Nanisivik Mississippi Valley type Deposit, Northern Baffin Island, Nunavut; by Patterson and Powis."2 Clear Lake 2010 SRK historic Resource: Inferred 7.76 million tonnes grading 22 grams/tonne silver, 7.6% zinc, and 1.08% lead.
ON BEHALF OF THE BOARD
Chad Williams, Executive Chairman
Sonya PekarInvestor Relationsspekar@honeybadgersilver.com | +1 (647) 498-8244
For more information, please visit our website www.honeybadgersilver.com.
Neither the TSX Venture Exchange nor its Regulation Services Provider (as that term is defined in the policies of the TSX Venture Exchange) accepts responsibility for the adequacy or accuracy of this release.
Cautionary Note Regarding Forward-Looking Information
This news release contains "forward-looking information" within the meaning of the applicable Canadian securities legislation that is based on expectations, estimates, projections and interpretations as at the date of this news release. Any statement that involves discussions with respect to predictions, expectations, interpretations, beliefs, plans, projections, objectives, assumptions, future events or performance (often but not always using phrases such as "expects", or "does not expect", "is expected", "interpreted", "management's view", "anticipates" or "does not anticipate", "plans", "budget", "scheduled", "forecasts", "estimates", "believes" or "intends" or variations of such words and phrases or stating that certain actions, events or results "may" or "could", "would", "might" or "will" be taken to occur or be achieved) are not statements of historical fact and may be forward-looking information and are intended to identify forward-looking information. This forward-looking information is based on reasonable assumptions and estimates of management of the Company at the time such assumptions and estimates were made, and involves known and unknown risks, uncertainties and other factors which may cause the actual results, performance or achievements of Honey Badger to be materially different from any future results, performance or achievements expressed or implied by such forward-looking information.
Such factors include, but are not limited to, risks relating to capital and operating costs varying significantly from estimates; delays in obtaining or failures to obtain required governmental, environmental or other project approvals; uncertainties relating to the availability and costs of financing needed in the future; changes in equity markets; inflation; fluctuations in commodity prices; delays in the development of projects; other risks involved in the mineral exploration and development industry; and those risks set out in the Company's public documents filed on SEDAR+ (www.sedarplus.ca) under Honey Badger's issuer profile. Although the Company believes that the assumptions and factors used in preparing the forward-looking information in this news release are reasonable, undue reliance should not be placed on such information, which only applies as of the date of this news release, and no assurance can be given that such events will occur in the disclosed timeframes or at all. The Company disclaims any intention or obligation to update or revise any forward-looking information, whether as a result of new information, future events or otherwise, other than as required by law.
To view the source version of this press release, please visit https://www.newsfilecorp.com/release/275224
Teck Resources (TECK) and Anglo American must offer more to secure Ottawa's approval for their planned merger, The Wall Street Journal reported Tuesday, citing Canada's Industry Minister Melanie Joly.
In September, the companies agreed to combine in a merger of equals to form Anglo Teck.
While a decision on the takeover is expected next month, Anglo Teck's commitments to date are insufficient under Canada's foreign-investment laws, Joly was quoted as saying by the Journal.
A Teck spokesman said the companies continue to engage with the government, while a spokesman for Anglo declined to comment, according to the Journal.
Teck Resources, Anglo American, and representatives for Joly did not immediately respond to MT Newswires' request for comment on the matter.
Shares of Teck Resources were down 2.5% in recent Tuesday trading.
(Market Chatter news is derived from conversations with market professionals globally. This information is believed to be from reliable sources but may include rumor and speculation. Accuracy is not guaranteed.)
(REVISED TO REFLECT WEEKLY GAINS BY TSX VENTURE)
Toronto stocks went resolutely up Friday to end a successful week, led by tech and energy stocks, as news also came in from the trade front involving neighbours Canada and the U.S.
The TSX Composite Index barged ahead 277.7 points, or 1%, to conclude Friday and the week at 28,333.13, for a gain on the week of 427.64 points, or 1.53%
The Canadian dollar climbed 0.39 cents to 72.33 cents U.S.
Techs led the way Friday, as Celestica collected $9.75, or 3.9%, to $262.04, while Lightspeed Commerce jumped 70 cents, or 4.3%, to $16.99.
Cenovus Energy jumped $1.53, or 7.2%, to $22.70. after the oil and gas producer agreed to buy MEG Energy in a cash-and-stock deal valued at $7.9 billion including debt. MEG shares grabbed 37 cents, or 1.3%, to $27.93.
In materials, Teck Resources hiked $2.34, or 5.3%, to $46.49, while Methanex shares took on $2.54, or 5.4%, to $49.59.
Consumer staples wavered, though, as George Weston dipped $3.61, or 3.9%, to $88.53, while Empire Company withered $1.66, or 3%, to $54.08.
In telecoms, BCE dropped 50 cents, or 1.4%, to $35.22, while Quebecor sank 22 cents to $40.62.
Health-care also backtracked Bausch Health Companies gave back seven cents to $10.36, and Chartwell Retirement Residences sank six cents to $18.24.
Canada removed many of its retaliatory tariffs on the U.S. on Friday, marking a significant step forward in the two countries’ relationship.
Canada in March imposed counter-tariffs of 25% on a long list of U.S. products that fall in line with the North American trade deal after the U.S. had announced 25% duties on steel and aluminum.
Notably, Canada’s 25% tariffs on U.S. autos, steel and aluminum will remain in place for now, Canadian Prime Minister Mark Carney said in a press conference Friday.
The change will go into effect on Sept. 1, Carney added, saying he believes Canada has the best trade deal out of all of the countries working with the U.S.
In other macroeconomic news, Statistics Canada said retail sales increased 1.5% to $70.2 billion in June. Sales were up in all nine subsectors and were led by increases at food and beverage retailers.
ON BAYSTREET
The TSX Venture Exchange popped 17.28 points, or 2.2%, to 803.61, for a gain on the week of 12.84 points, or 1.62%.
Eight of the 12 TSX subgroups were gainers Friday with information technology popping 2.8%, while shares in energy jumped 1.2%, and material stocks flew 1.4%.
Read:
-
Mining Stocks Finally Wake Up as Gold Stays Hot Above $3,300
-
$40 Silver Breakout Imminent as Miners Enter High-Momentum Phase
-
Encryption Is Dying—Here’s What Comes Next for Cyber Defense
-
FDA Fast-Track Cancer Treatments Drive $900B Market Growth Forecast
-
Mining Stocks Outpace Gold's Historic Rally as Sector Primes for Breakout
The four laggards were weighed most by consumer staples, down 1.8%, telecoms, down 0.6%, and health-care, off 0.3%.
ON WALLSTREET
The Dow Jones Industrial Average rallied to an all-time high Friday after Federal Reserve Chair Jerome Powell signaled the central bank could begin easing monetary policy next month.
The 30-stock index popped 846.24 points, or 1.9%, to close Friday at 45,631.74.
The S&P 500 revived 96.73 points, or 1.5%, to 6,466.90.
The NASDAQ surged 396.22 points, or 1.9%, to 21,496.54.
Both the 30-stock Dow and S&P 500 were now headed for a weekly advance, while the NASDAQ cut its weekly losses significantly.
Shares of megacap technology stocks soared on Powell’s comments. Nvidia added 1.3%, while Meta, Alphabet and Amazon each climbed more than 2%. Tesla shares jumped about 5%.
In a tepid speech at the central bank’s annual conclave in Jackson Hole, Wyoming, Powell said that “the baseline outlook and the shifting balance of risks may warrant adjusting our policy stance.”
Powell added that “the balance of risks appear to be shifting” between the Fed’s dual mandate of full employment and stable prices. He cited “sweeping changes” in tax, trade and immigration policies.
Expectations for a 0.25 percentage-point rate cut in September skyrocketed to roughly 91% following the speed from about 75% earlier in the week,
Recently, the prospect of lower interest rates helped bolster parts of the market that have missed out on this year’s rally, with investors dumping megacap tech for small caps and value plays. However, a more hawkish outlook from Powell could throw cold water on the market.
Prices for 10-year Treasury moved upward Friday, reducing yields to 4.26% from Thursday’s 4.33%. Treasury prices and yields move in opposite directions.
Oil prices moved higher 18 cents to $67.85U.S. a barrel.
Gold prices rocketed $34.80 at $3,416.60 U.S. an ounce.
Dow Moves Skyward as Powell Speech Sparks Rally
It doesn't matter your age or experience: taking full advantage of the stock market and investing with confidence are common goals for all investors.
Achieving those goals is made easier with the Zacks Style Scores, a unique set of guidelines that rates stocks based on popular investing methodologies, namely value, growth, and momentum. The Style Scores can help you narrow down which stocks are better for your portfolio and which ones can beat the market over the long-term.
Why This 1 Growth Stock Should Be On Your Watchlist
For growth investors, a company's financial strength, overall health, and future outlook take precedence, so they'll want to zero in on the Growth Style Score. This Score examines things like projected and historical earnings, sales, and cash flow to find stocks that will generate sustainable growth over time.
Freeport-McMoRan (FCX)
Based in Phoenix, AZ, Freeport-McMoRan Inc., formerly Freeport-McMoRan Copper & Gold Inc., is engaged in mineral exploration and development; mining and milling of copper, gold, molybdenum and silver; as well as the smelting and refining of copper concentrates. The company conducts its operations primarily through its principal operating subsidiaries, PT Freeport Indonesia (PT-FI), Freeport Minerals Corporation and Atlantic Copper. PT Freeport Indonesia's principal asset is Papua, Indonesia-based Grasberg mine, which contains the world's largest copper and gold reserves.
FCX is a Zacks Rank #3 (Hold) stock, with a Growth Style Score of B and VGM Score of B. Earnings are expected to grow 17.6% year-over-year for the current fiscal year, with sales growth of 6.7%.
Five analysts revised their earnings estimate higher in the last 60 days for fiscal 2025, while the Zacks Consensus Estimate has increased $0.05 to $1.74 per share. FCX also boasts an average earnings surprise of 10.4%.
Looking at cash flow, Freeport-McMoRan is expected to report cash flow growth of 2.3% this year; FCX has generated cash flow growth of 24.8% over the past three to five years.
Investors should take the time to consider FCX for their portfolios due to its solid Zacks Rank rating, notable growth metrics, and impressive Growth and VGM Style Scores.
Want the latest recommendations from Zacks Investment Research? Today, you can download 7 Best Stocks for the Next 30 Days. Click to get this free report
Freeport-McMoRan Inc. (FCX) : Free Stock Analysis Report
This article originally published on Zacks Investment Research (zacks.com).
Freeport-McMoRan Inc.’s FCX shares have gained 11.3% in the past six months. It has outperformed the Zacks Mining – Non Ferrous industry’s rise of 1.3% and the S&P 500’s gain of 7.3% over the same period. Its peers, Southern Copper Corporation SCCO and BHP Group Limited BHP, have gained 0.8% and 4.9%, respectively, in the same time. While FCX’s second-quarter results showed a rise in both top and bottom line on higher copper and gold prices, its guidance indicates higher expected unit costs and weaker copper and gold sales volumes.
Freeport’s Six-Month Price PerformanceZacks Investment Research
Image Source: Zacks Investment Research
Technical indicators show that FCX has been trading below the 50-day simple moving average (SMA) since July 30, 2025. The stock is currently trading above its 200-day SMA. Following a golden crossover on July 8, 2025, the 50-day SMA is reading higher than the 200-day SMA, indicating a bullish trend.
FCX Stock Trades Below 50-Day SMAZacks Investment Research
Image Source: Zacks Investment Research
Let’s take a look at FCX’s fundamentals to better analyze how to play the stock.
Freeport’s Growth Actions to Drive Capacity & Production
Freeport is well-placed with high-quality copper assets and remains focused on strong execution and advancing its organic growth opportunities. At its Cerro Verde operation in Peru, a large-scale concentrator expansion provided incremental annual production of around 600 million pounds of copper and 15 million pounds of molybdenum. It is evaluating a large-scale expansion at El Abra in Chile to define a large sulfide resource that could potentially support a major mill project similar to the large-scale concentrator at Cerro Verde. FCX is also conducting pre-feasibility studies (expected to be completed in 2026) in the Safford/Lone Star operations in Arizona to define a significant sulfide expansion opportunity. It also has expansion opportunities at Bagdad in Arizona to more than double the concentrator capacity of the operation. Also, PT Freeport Indonesia (PT-FI) substantially completed the construction of the new greenfield smelter in Eastern Java during 2024, with start-up commenced in second-quarter 2025. The first production of copper anode was achieved in July 2025. PT-FI is also developing the Kucing Liar ore body within the Grasberg district with a targeted commencement of production by 2030. Gold production also commenced at the new precious metals refinery in late 2024. Plans are in place to transition PT-FI’s existing energy source from coal to natural gas, which is expected to significantly reduce greenhouse gas emissions at Grasberg.
FCX’s Solid Financial Health & Capital Discipline Bode Well
FCX has a strong liquidity position and generates substantial cash flows, which allow it to finance its growth projects, pay down debt and drive shareholder value. It generated operating cash flows of around $2.2 billion in the second quarter of 2025. It has distributed $5.2 billion to its shareholders through dividends and share purchases since June 30, 2021. Freeport ended the second quarter with strong liquidity, including $4.5 billion in cash and cash equivalents, $3 billion in availability under the FCX revolving credit facility, and $1.5 billion in availability under the PT-FI credit facility.At the end of the second quarter, Freeport had a net debt of $1.5 billion, excluding PTFI’s new downstream processing facilities. Its net debt is below its targeted range of $3-$4 billion. Freeport has a policy of distributing 50% of the available cash to shareholders and the balance to either reduce debt or invest in growth projects. FCX has no significant debt maturities until 2027. Its long-term debt-to-capitalization is around 22.9% compared with 40.2% for Southern Copper and 26.7% for BHP Group.FCX offers a dividend yield of roughly 0.7% at the current stock price. Its payout ratio is 20% (a ratio below 60% is a good indicator that the dividend will be sustainable), with a five-year annualized dividend growth rate of about 19.4%. Backed by strong financial health, the company's dividend is perceived to be safe and reliable.
Retreating Copper Prices Pose Concerns for FCX
Copper prices remained volatile in the second quarter amid global economic and trade uncertainties. After racking up solid gains in late March, copper prices slipped to around $4.1 per pound in early April amid demand worries due to tariffs, which threatened to cause a broader slowdown globally. However, prices of the red metal moved up in late April to roughly $4.9 per pound amid a weakening U.S. dollar on heightened concerns about the prospect of a downturn in the U.S. economy. Prices again retreated to around $4.7 per pound in late May on weak global demand and increased supply. Prices recovered in June to close the second quarter above the $5 per pound level, leading to a roughly 25% gain in the first six months of 2025.However, prices have again retreated to below $4.5 per pound lately amid increased supply, currently hovering just above $4.4 per pound. Weaker global manufacturing activities pose risks to copper demand. Copper demand is also likely to remain under pressure due to tariffs.
Higher Unit Costs May Weigh on Freeport’s Q3 Margins
FCX saw a notable reduction in its average unit net cash cost per pound of copper in the second quarter to just $1.13 from $1.73 a year earlier and well below its guidance of $1.50. The decline was fueled by operational efficiencies, higher gold credits and an uptick in copper sales volumes. Freeport's outlook for the third quarter, however, suggests higher costs on a sequential basis. It expects unit net cash costs to rise to $1.59 per pound, while still projecting a full-year average of roughly $1.55. Lower expected sales volumes are likely to impact costs in the quarter. The potential impacts of tariffs may lead to further upside to the projected costs. FCX estimates that the tariffs could potentially increase the cost of goods it purchases in the United States by roughly 5%. Higher costs are likely to weigh on the company's margins.
FCX’s Tepid Volume Outlook Points to Challenges Ahead
Freeport’s copper sales volumes increased around 9% year over year in the second quarter to 1,016 million pounds, primarily driven by shipment timing. The company sold 522,000 ounces of gold, reflecting around 45% year-over-year growth. FCX also sold 22 million pounds of molybdenum, up about 4.8% from the year-ago quarter.Freeport has provided a tepid copper sales volume outlook for the third quarter, which suggests modestly lower volumes on a sequential basis. FCX expects copper sales volumes of 990 million pounds, indicating a 4% year-over-year decline. It has also provided a weaker gold and molybdenum sales volumes guidance of 350,000 ounces and 18 million pounds, respectively, reflecting sequential and year-over-year declines. The lack of growth in volumes may impact the company’s performance.
FCX’s Earnings Estimates Going Up
Freeport’s earnings estimates have been going up over the past 60 days. The Zacks Consensus Estimate for 2025 and 2026 has been revised higher over the same time frame. The Zacks Consensus Estimate for 2025 earnings is currently pegged at $1.74, suggesting year-over-year growth of 17.6%. Earnings are expected to register roughly 33.8% growth in 2026.
Zacks Investment Research
Image Source: Zacks Investment Research
A Look at FCX’s Valuation
FCX is currently trading at a forward price/earnings of 19.52X, a roughly 2% premium to the industry average of 19.13X. The FCX stock is trading at a discount to Southern Copper and a premium to BHP Group.
FCX’s P/E F12M Vs. Industry, SCCO and BHPZacks Investment Research
Image Source: Zacks Investment Research
Final Thoughts: Hold FCX Stock for Now
FCX is poised to gain from progress in expansion activities that will boost production capacity. Robust financial health allows FCX to invest in growth projects and drive shareholder value. Rising earnings estimates and healthy dividend growth are the other positives. Despite these positives, the recent pullback in copper prices, weaker sales volume outlook and higher expected unit costs warrant caution. Holding onto this Zacks Rank #3 (Hold) stock will be prudent for investors who already own it.You can see the complete list of today’s Zacks #1 Rank (Strong Buy) stocks here.
Want the latest recommendations from Zacks Investment Research? Today, you can download 7 Best Stocks for the Next 30 Days. Click to get this free report
Freeport-McMoRan Inc. (FCX) : Free Stock Analysis Report
BHP Group Limited Sponsored ADR (BHP) : Free Stock Analysis Report
Southern Copper Corporation (SCCO) : Free Stock Analysis Report
This article originally published on Zacks Investment Research (zacks.com).
By Ernest Scheyder and Jarrett Renshaw
(Reuters) -The Trump administration is considering a plan to reallocate at least $2 billion from the CHIPS Act to fund critical minerals projects and boost Commerce Secretary Howard Lutnick's influence over the strategic sector, two sources familiar with the matter told Reuters.
The proposed move would take from funds already allocated by Congress for semiconductor research and chip factory construction, avoiding a fresh spending request as it seeks to reduce U.S. dependence on China for critical minerals used widely in the electronics and defense industries.
Boosting Lutnick's role over critical minerals financing would also help centralize the administration's approach to the sector, a push sought by White House officials after the rollout of the Pentagon investment in rare earths company MP Materials last month sparked questions about the U.S. government's minerals strategy, one source said.
The White House did not respond to requests for comment. Pentagon officials were not immediately available to comment. MP Materials declined to comment.
The Commerce Department oversees the $52.7 billion CHIPS Act, formally known as the CHIPS and Science Act. The act, signed into law by then-President Joe Biden in 2022, has provided funding so far for research while also seeking to lure chip production away from Asia and boost American domestic semiconductor production.
But since taking office in January, Trump has moved to change the CHIPS Act – legislation he has called "a horrible, horrible thing" that amounts to a giveaway to companies – largely by renegotiating grants to chipmakers.
Repurposing some funds for mining-related projects would align in part with the spirit of the CHIPS Act as the semiconductor industry requires abundant supplies of germanium, gallium and other critical minerals over which China has tightened its market control, said the sources, who are not permitted to speak publicly about the deliberations.
"The administration is creatively trying to find ways to fund the critical minerals sector," said the first source. The plans are under discussion and could change, the sources added.
Mining companies themselves could benefit, but also processing and recycling firms. Most of the minerals considered critical by the U.S. government are not processed inside the country.
Kent Masters, CEO of North Carolina-based Albemarle, the world's largest producer of lithium for rechargeable batteries, told Reuters last month that the company's stalled plans to build a U.S. lithium refinery are "difficult now without some type of government support or partnership."
It was not immediately clear if the Trump administration aimed to use the funds for grants or equity stakes in mining companies, but Lutnick aims to "get the $2 billion out the door" as soon as possible, the first source said, adding that the administration aims to find other funds to reallocate in the near future.
A former U.S. official said the Biden administration considered using CHIPS Act grants for rare earths but decided it was uneconomical, required many environmental exemptions and was best left for the Department of Energy to handle.
The administration is also looking to use CHIPS Act-related funding to take equity stakes in Intel and other chip makers in exchange for cash grants, Reuters reported on Tuesday.
Trump moved quickly to expand U.S. critical minerals production since taking office in January by signing executive orders to boost deep-sea mining and domestic projects.
On Tuesday he met with the CEOs of Rio Tinto and BHP at the White House despite the ongoing negotiations with European leaders over Russia's invasion of Ukraine, a move aimed at underscoring his support for U.S. mining.
The CHIPS Act deliberations come after the Energy Department last week proposed $1 billion in spending for some critical minerals projects, with funds tied to the 2021 Bipartisan Infrastructure Law.
LUTNICK
The White House aims to give Lutnick a greater role over funding decisions for critical minerals by giving him oversight of the decision making process within the administration, the sources said.
The Pentagon's multibillion-dollar investment in MP Materials and its move to extend a price support mechanism – a deal negotiated by Deputy Defense Secretary Steve Feinberg – was seen by White House Chief of Staff Susie Wiles as uncoordinated as it sparked confusion over whether Washington would guarantee a price floor for all miners and forced the administration to clarify that it does not intend for MP to have a rare earths monopoly, the two sources said.
Much of the funding for MP's deal – including Washington's equity stake, loans and purchase agreements – still needs to be allocated by Congress.
Two weeks after the Pentagon announced its MP investment, administration officials rushed to meet at the White House with rare earths firms and their customers to underscore broad support for the entire sector, Reuters reported.
Lutnick will now help coordinate the administration's funding decisions, taking the lead from the Pentagon and other agencies, the sources said.
Lutnick ran brokerage firm Cantor Fitzgerald before he joined Trump's cabinet. Cantor is a large shareholder in Critical Metals Corp, which Reuters reported in June is under consideration for a loan from the U.S. Export-Import Bank.
(Reporting by Ernest Scheyder and Jarrett Renshaw; additional reporting by Alexandra Alper; Editing by Chris Sanders, Veronica Brown Alistair Bell)
Nordson Corporation’s NDSN third-quarter fiscal 2025 (ended July 31, 2025) adjusted earnings of $2.73 per share surpassed the Zacks Consensus Estimate of $2.63. The bottom line increased 13% year over year.
Quarterly Results of NDSN
Nordson’s revenues were $742 million, up 12% from the year-ago fiscal quarter’s number, driven by strength in the Advanced Technology Solutions segment and contributions from acquired assets. Revenues beat the consensus estimate of $717 million.Organic sales rose 2% year over year, driven by strong demand in the Asia-Pacific region. Acquisitions had a positive impact of 8% while foreign currency translation had a positive impact of 2%.On a regional basis, revenues from the Asia Pacific region were $240.3 million, up 23.1% year over year. Revenues generated from Europe increased 4% to $186.6 million, while the metric in the Americas increased 9.6% to $314.6 million.Nordson reports revenues under three segments. The segments are Industrial Precision Solutions, Medical and Fluid Solutions and Advanced Technology Solutions. A brief snapshot of the segmental sales is provided below:Revenues from Industrial Precision Solutions amounted to $350.8 million, up 0.5% from the year-ago fiscal quarter’s level. The segment contributed 47.3% to NDSN’s top line in the quarter.Organic sales decreased 2% from the year-ago fiscal quarter’s level, while foreign currency translation had a positive impact of 2.5%.Revenues from Medical and Fluid Solutions amounted to $219.5 million, up 31.6% from the year-ago fiscal quarter’s level. The segment contributed 29.6% to NDSN’s top line.Organic sales decreased 0.4% from the year-ago fiscal quarter’s level. Acquisitions boosted sales by 31% while foreign currency translation had a positive impact of 1%.Advanced Technology Solutions’ sales were $171.3 million, up 17.4% from the year-ago fiscal quarter’s figure. The metric represented 23.1% of Nordson’s revenues in the period.Organic sales increased 14.6% from the year-ago fiscal quarter’s level. Foreign currency translation had a positive impact of 2.8%.
Nordson Corporation Price, Consensus and EPS Surprise
Nordson Corporation price-consensus-eps-surprise-chart | Nordson Corporation Quote
Nordson’s Margin Profile
Nordson’s cost of sales increased 14.5% from the year-ago fiscal quarter’s level to $335 million. Gross profit was $406.5 million, up 10.2% from the year-ago fiscal quarter’s level. The gross margin decreased 100 basis points (bps) to 54.8%.Selling and administrative expenses increased 2.3% year over year to $206.5 million. Adjusted EBITDA was $238.5 million (up 14.6% year over year), the margin being 32.2%. Operating income was $187.8 million, up 12.4% year over year. Operating margin of 25.3% was flat from the year-ago period.Net interest expenses totaled $26 million, reflecting a 44.6% increase from the year-ago fiscal quarter’s level.
Nordson’s Balance Sheet & Cash Flow
At the time of exiting the third quarter of fiscal 2025, Nordson’s cash and cash equivalents were $147.8 million compared with $116 million recorded at the end of fiscal 2024. Long-term debt was $1.79 billion compared with $2.10 billion recorded at the end of fiscal 2024.In the first nine months of fiscal 2025, NDSN generated net cash of $516.3 million from operating activities, up 12.3% from the last fiscal year period’s tally. Capital invested in purchasing property, plant and equipment totaled $49 million, down 11.9% from the year-ago fiscal period.
NDSN’s Dividends/Share Buyback
In the first nine months of fiscal 2025, Nordson paid out dividends of $133 million, up 13.9% from $116.8 million in the previous fiscal year period.Treasury purchase shares amounted to $218.2 million, up from $34.1 million in the year-ago period.
NDSN’s Outlook
For fiscal 2025 (ending October 2025), it projects sales to be in the range of $2.75- $2.87 billion, with adjusted earnings of $9.70-$10.50 per share.
Nordson’s Zacks Rank & Stocks to Consider
The company currently carries a Zacks Rank #3 (Hold). You can see the complete list of today’s Zacks #1 Rank (Strong Buy) stocks here.
Performance of Other Companies
Dover Corporation DOV reported earnings of $2.44 per share in second-quarter 2025, beating the Zacks Consensus Estimate of $2.39. This compares with earnings of $2.36 per share a year ago.Dover posted revenues of $2.05 billion in the quarter, surpassing the Zacks Consensus Estimate by 0.6%. This compares with year-ago revenues of $2.18 billion.Teck Resources Limited TECK came out with earnings of $0.27 per share in the second quarter of 2025, beating the Zacks Consensus Estimate of $0.2. This compares with earnings of $0.58 per share a year ago.Teck Resources posted revenues of $1.46 billion in the quarter, missing the Zacks Consensus Estimate by 8.7%. This compares with year-ago revenues of $2.83 billion. Packaging Corporation of America PKG reported earnings of $2.48 per share, beating the Zacks Consensus Estimate of $2.44. This compares with earnings of $2.2 per share a year ago.Packaging Corp. posted revenues of $2.17 billion in the quarter, surpassing the Zacks Consensus Estimate by 0.5%. This compares with year-ago revenues of $2.08 billion.
Want the latest recommendations from Zacks Investment Research? Today, you can download 7 Best Stocks for the Next 30 Days. Click to get this free report
Dover Corporation (DOV) : Free Stock Analysis Report
Packaging Corporation of America (PKG) : Free Stock Analysis Report
Nordson Corporation (NDSN) : Free Stock Analysis Report
Teck Resources Ltd (TECK) : Free Stock Analysis Report
This article originally published on Zacks Investment Research (zacks.com).
This article first appeared on GuruFocus.
Release Date: August 19, 2025
For the complete transcript of the earnings call, please refer to the full earnings call transcript.
Positive Points
-
BHP Group Ltd (NYSE:BHP) achieved record iron ore and copper production, with copper volumes growing by 28% over the past three years.
-
The company delivered a strong financial performance with an underlying EBITDA margin of 53% and a return on capital employed of 21%.
-
BHP Group Ltd (NYSE:BHP) paid a final dividend of 60 US cents per share, resulting in a full-year dividend of $5.6 billion.
-
The company achieved gender balance in its global workforce, with female representation now at 41.3%, contributing to better business performance.
-
BHP Group Ltd (NYSE:BHP) has reduced its capital spend by $1 billion per year over the medium term and revised its target net debt range to $10 to $20 billion.
Negative Points
-
The company experienced a 10% decline in EBITDA due to unfavorable commodity prices, despite favorable foreign exchange rates.
-
BHP Group Ltd (NYSE:BHP) encountered higher inflation and cost escalation than anticipated, particularly affecting the Jansen project.
-
The pace of development for decarbonization technology has slowed, delaying anticipated operational decarbonization spend to the 2030s.
-
Higher labor costs over and above CPI inflation impacted the company’s financial performance.
-
The transition to closure for New South Wales Energy Coal is progressing, indicating a phase-out of operations in that segment.
Q & A Highlights
Q: Can you elaborate on the factors contributing to the 10% decline in EBITDA? A: The decline in EBITDA was entirely due to commodity prices. While we benefited from favorable foreign exchange rates, these were offset by inflationary pressures. Despite this, our operational performance remained strong, with copper equivalent volume growth up around 4%. (CFO, Vendita Pant)
Q: How has BHP managed to maintain its position as the lowest cost major iron ore producer globally? A: Western Australia iron ore has consistently demonstrated its leadership with record production and shipments, achieving an EBITDA margin of 63%. Our costs are just $17.29 per ton, maintaining our status as the lowest cost major iron ore producer for six consecutive years. (CFO, Vendita Pant)
Q: What are the future growth projections for BHP’s production? A: Assuming our projects proceed as planned, we anticipate an average production growth of 2.2% per annum over the next decade. This growth is supported by our focus on highly attractive commodities and world-class assets. (CEO, Mike Henry)
Q: Can you discuss the impact of inflation and cost escalation on the Jansen project? A: We encountered higher inflation and cost escalation than anticipated, particularly in surface works. We’ve taken action to contain these costs and will apply learnings to future projects. The first production for stage 2 has been extended by two years to free up capital for higher returning projects. (CEO, Mike Henry)
Q: How is BHP addressing the challenges in decarbonization technology development? A: The pace of development for our decarbonization technology, particularly diesel displacement, has slowed. We now expect operational decarbonization spending to occur in the 2030s, aligning with the delayed timeline for critical technologies. However, we remain on track to meet our 2030 target for operational greenhouse gas emissions. (CFO, Vendita Pant)
For the complete transcript of the earnings call, please refer to the full earnings call transcript.
US President Donald Trump welcomed Rio Tinto CEO Jakob Stausholm and incoming CEO Simon Trott, as well as BHP CEO Mike Henry, to the Oval Office on Tuesday to discuss the developments around a vast copper mine project called Resolution Copper.
This came a day after the opponents succeeded in temporarily blocking the project.
The president called opponents of a huge copper mine in Arizona “radical left activists” in a social media post after the meeting.
The project — a joint venture owned by international mining giants Rio Tinto and BHP — is set to be one of the biggest copper mines in North America.
President Trump has emphasised the need for more copper production in the US, as the versatile metal is important for the country’s mineral security. Copper is key to the energy transition and has many uses, remaining an essential component of electrical circuits, as well as defence and technology products.
The two international mining giants teamed up to develop Resolution Copper after the deposit was discovered two decades ago.
However, Native American tribes and environmentalists have been fighting fiercely ever since, citing religious, cultural and environmental concerns.
After a series of court cases and environmental studies, the companies were set to take over the federal forest land in Arizona on Tuesday when a US appeals court temporarily blocked the transfer, delaying the mining.
The US Ninth Circuit Court of Appeals issued a temporary injunction late on Monday in response to last-minute appeals by a Native American tribe and environmentalists.
The land includes Oak Flat — an area used for centuries for religious ceremonies, prayer and gathering of medicinal plants by the San Carlos Apache people and other Native American tribes. The tribe celebrated the pause.
President Donald Trump, however, called the opponents “Anti-American, and representing other copper competitive countries,” in his post on Truth Social. He also stated that delaying the project would affect thousands of jobs.
A press release from Resolution Copper stated that the companies view this as “merely a temporary pause”. The statement added: “We are confident the court will ultimately affirm the district court’s well-reasoned orders explaining in detail why the congressionally directed land exchange satisfies all applicable legal requirements.”
Mike Henry, CEO of BHP, said in a social media post that the project “will create thousands of high-value local jobs in Arizona and billions in economic activity across America”.
An earlier estimate from Resolution Copper stated that the mine would generate $1 billion (€860 million) a year for Arizona’s economy and create thousands of jobs.
A brief history of opposing Resolution Copper
The fight over Oak Flat has spanned two decades, with the latest legal wrangling centred on a required environmental review that was released by the US Forest Service earlier this summer and an appraisal of the land to be mined by Resolution Copper about 60 miles (96 kilometres) east of Phoenix.
Before the land exchange can happen, the plaintiffs argued that the federal government must prepare a comprehensive review that covers “every aspect of the planned mine and all related infrastructure”.
They said the government failed to consider the potential for a dam breach, pipeline failure and if there was an emergency plan for a tailings storage area.
As for the appraisal, they said it did not account for the value of the copper deposits that are at least 5,000 feet (1,500 metres) below the surface.
Related
-
Copper prices near an all-time high amid Trump’s tariff threats, China’s stimulus
-
Why copper, aluminium and steel are at the core of Trump’s MAGA ideology
The appeals court plans to hear arguments on the merits of the case later this year, but no date has been announced yet.
“This injunction comes in a desperate time of asking for miracles, all over the country and all over the world,” Wendsler Nosie Sr. of the group Apache Stronghold said in a statement shared on social media.
Resolution Copper has said the project underwent an extensive review by the US Forest Service that has included consultation with tribes that have ancestral ties to the land.
“The collaborative process has directly led to major changes to the mining plan to preserve and reduce potential impacts on tribal, social, environmental and cultural interests,” the company stated.
The Forest Service has argued in court filings that it has no discretion because the land exchange was mandated by Congress when language was included in a must-pass national defence spending bill that was signed into law in 2014 by then-President Barack Obama.
There have been unsuccessful legislative attempts in the years since to withdraw the Oak Flat area from mining activity.
(Bloomberg) — President Donald Trump met with the chief executive officers of the world’s two biggest mining companies to discuss a copper project that could supply the US with a quarter of its demand for decades to come, adding greater weight to his push to boost local output of the vital metal.
Rio Tinto Group’s Jakob Stausholm; his incoming replacement, Simon Trott; and counterpart at BHP Group, Mike Henry, met the US leader to discuss the Resolution project in Arizona, according to a LinkedIn post by Stausholm. In a separate post, Trump criticized a court judgment that set back the development, insisting the US’ need for greater domestic production was urgent.
Most Read from Bloomberg
-
Why New York City Has a Fleet of New EVs From a Dead Carmaker
-
Chicago Schools Seeks $1 Billion of Short-Term Debt as Cash Gone
-
Trump Takes Second Swing at Cutting Housing Assistance for Immigrants
-
A London Apartment Tower With Echoes of Victorian Rail and Ancient Rome
The Trump administration has made the revival of US metals and minerals production a key priority, including copper, a commodity vital for the energy transition as well as conventional uses in pipes. As part of that push, Washington imposed tariffs on a wide range of products made from the metal earlier this year, although flows of refined material were not covered.
Jakob StausholmPhotographer: Betty Laura Zapata/Bloomberg
“Today, I visited the White House with Simon Trott to meet with US President Donald Trump, Secretary of the Interior Doug Burgum, and other officials to discuss Rio Tinto’s crucial role in delivering American copper and other critical minerals,” Stausholm said in the post. They discussed Resolution and the potential the project had to provide domestic supply, he added.
The talkscentered on the “industry’s capacity to deliver long-term domestic supplies of copper and other critical minerals,” Rio said in a statement.
Still, even with Trump’s support, building a mega-mine in America remains a challenging and drawn-out endeavor. It takes 29 years on average between discovery and commercial mine production in the US, the longest timeline of any country except Zambia, according to S&P Global.
Most easy-to-reach deposits, including one located above Resolution, were depleted during the 20th century. Now, miners must go deeper, into earth so hot it would have been impossible for workers to survive a century ago, presenting a host of technical obstacles that jack up project costs.
If developed, the Arizona project could supply the US with 25% of its annual copper needs for as many as 40 years, according to Rio Tinto, but it has been delayed for decades due to permitting, environmental concerns, and litigation.
Final environmental approval for the mine was given in June. However, opponents then lodged an appeal seeking a review of the decision. On Tuesday, they won a delay in approving a land swap that’s key to the development.
Trump criticized the court’s decision in a social-media post that coincided with the visit by the Rio Tinto and BHP executives.
Mike HenryPhotographer: Carla Gottgens/Bloomberg
“A Copper Mine in Arizona, ‘Resolution,’ was just delayed by a Radical Left Court for two months — 3,800 Jobs are affected, and our Country, quite simply, needs Copper — AND NOW!” the president said on Truth Social.
Benchmark copper futures have advanced about 11% this year, and last traded above $9,708 a ton on the London Metal Exchange. The record price was set last year at a little above $11,000.
In June, Rio Tinto said it had incurred gross costs of $321 million associated with US tariffs on aluminum, but added that a “substantial part” of that sum had been clawed back from higher premiums on US sales.
(Adds reference to Trump post in second paragraph.)
Most Read from Bloomberg Businessweek
-
Foreigners Are Buying US Homes Again While Americans Get Sidelined
-
What Declining Cardboard Box Sales Tell Us About the US Economy
-
Women’s Earnings Never Really Recover After They Have Children
-
Americans Are Getting Priced Out of Homeownership at Record Rates
©2025 Bloomberg L.P.
BHP Group Limited BHP reported a 26% year-over-year decrease in underlying attributable profit from continuing operations at $10.2 billion for fiscal 2025 (ended June 30, 2025). The downside was led by a decline in iron ore and coal prices. This was partially offset by record copper and iron ore production volumes, and higher steelmaking coal production and copper prices. BHP’s underlying earnings per share were $2.00 compared with $2.70 in fiscal 2024. Earnings per American Depositary Share (ADS) were $4.00, lower than $5.40 in the previous year. The metric beat the Zacks Consensus Estimate of $3.87. BHP’s each ADS represents two fully-paid ordinary shares.
BHP Group Limited Sponsored ADR Price, Consensus and EPS Surprise
BHP Group Limited Sponsored ADR price-consensus-eps-surprise-chart | BHP Group Limited Sponsored ADR Quote
BHP’s FY25 Revenues Dip Y/Y
Revenues for fiscal 2025 totaled $51.3 billion, which missed the Zacks Consensus Estimate of $52.1 billion. The top line was 8% lower than the prior fiscal year.The Iron ore segment’s revenues fell 18% year over year to around $23 billion, whereas revenues in the Copper segment increased 21.4% to $22.5 billion. The Coal segment’s revenues plunged 34.2% to $5 billion.
BHP Group Delivers Record Iron & Copper Production in FY25
The company’s total iron ore production for fiscal 2025 was a record 263 Mt, up 1% year over year. The figure came within the company’s guidance of 255-265.5 Mt. Production at Western Australia Iron Ore (“WAIO”) was a record of 257 Mt (290 Mt on a 100% basis), reflecting supply-chain excellence with record productive movement, in addition to improved rail cycle times, and enhanced car dumper and ship loader performance unlocked by the Port Debottlenecking Project 1 (PDP1). The record production was delivered despite the impacts of Tropical Cyclone Zelia and Tropical Storm Sean in the third quarter, and the planned increase in tie-in activity of the multi-year Rail Technology Program (RTP1).Copper production rose 8% year over year to a record 2,017 kt. In fiscal 2025, nickel output was 30.2 kt, which was 63% lower year over year.
BHP’s FY25 EBITDA Margin Slips Y/Y
Underlying earnings before interest, taxes, depreciation and amortization (EBITDA) decreased 10.6% from the prior year to $26 billion due to lower revenues. The underlying EBITDA margin was 53%, down from the prior year’s 54%. For the Iron ore segment, underlying EBITDA was down 23.9% year over year to $14 billion, while the Copper segment’s underlying EBITDA increased 43.9% to $12 billion. The Coal segment’s underlying EBITDA plunged 75% year over year to $573 million.Profit from operations increased 11% year over year to $19.4 billion. In fiscal 2025, BHP’s attributable profit (for total operations) increased 14% year over year to $9 billion.
BHP Group’s Financial Position
Net operating cash flow for fiscal 2025 was $18.7 billion compared with $20.7 billion in fiscal 2024. The downside was attributed to lower realized prices. BHP Group reported a free cash flow of $5.3 billion, down from $11.9 billion in fiscal 2024.The company invested $2.1 billion to acquire a 50% interest in the Vicuña joint venture. Capital and exploration expenditure totaled $9.8 billion, up 6% from the prior fiscal year. As of the end of fiscal 2025, net debt was $12.9 billion compared with $9.1 billion as of the end of fiscal 2024.
BHP’s Production Guidance for FY26
BHP Group’s iron ore production guidance for fiscal 2026 is 258-269 Mt. WAIO's production is expected to be 251-262 Mt (284-296 Mt on a 100% basis). The company expects copper production to be 1,800-2,000 kt in fiscal 2026.Steelmaking coal production in fiscal 2026 is expected at 18-20 Mt (36-40 Mt on a 100% basis). Energy coal production is expected to be 14-16 Mt.
BHP Group Provides Unit Cost Guidance for FY26
Unit cost guidance for WAIO is expected to be $18.25-$19.75 per ton. Escondida unit costs are estimated to be $1.20-$1.50 per pound. Spence unit costs are expected between $2.00 and $2.40 per pound. Copper South Australia’s unit costs are anticipated to be $1.00-$1.50 per pound. BMA unit costs are expected between $116 and $128 per ton.
BHP Stock’s Price Performance
BHP Group’s shares have gained 4.9% in a year compared with the industry’s 12.7% growth.
Zacks Investment Research
Image Source: Zacks Investment Research
BHP Group’s Zacks Rank
BHP currently has a Zacks Rank #3 (Hold). You can see the complete list of today’s Zacks #1 Rank (Strong Buy) stocks here.
Other Performances in the Basic Materials Sector
Reliance, Inc. RS recorded earnings of $4.43 per share. Reliance lagged the Zacks Consensus Estimate of $4.72.Reliance recorded net revenues of $3.66 billion, up around 0.5% year over year. The top line beat the Zacks Consensus Estimate of $3.63 billion. Reliance reported a 3.9% year-over-year increase in shipments (thousand tons sold) to 1,615. Wheaton Precious Metals Corp. WPM reported adjusted earnings per share of 63 cents in second-quarter 2025, which surpassed the Zacks Consensus Estimate of 58 cents. The bottom line surged 90.9% year over year.Wheaton Precious Metals generated record revenues of around $503 million, which improved 68.3% on a year-over-year basis. The upside was caused by a 32% increase in average realized price and a 28% improvement in gold equivalent ounces (GEOs) sold. The top line beat the Zacks Consensus Estimate of $468 million.Teck Resources Ltd. TECK came out with earnings of 27 cents per share in the second quarter of 2025, beating the Zacks Consensus Estimate of 20 cents. This compares with earnings of 58 cents per share a year ago.Teck Resources posted revenues of $1.46 billion in the quarter, missing the Zacks Consensus Estimate by 8.7%. This compares with year-ago revenues of $2.83 billion.
Want the latest recommendations from Zacks Investment Research? Today, you can download 7 Best Stocks for the Next 30 Days. Click to get this free report
BHP Group Limited Sponsored ADR (BHP) : Free Stock Analysis Report
Reliance, Inc. (RS) : Free Stock Analysis Report
Teck Resources Ltd (TECK) : Free Stock Analysis Report
Wheaton Precious Metals Corp. (WPM) : Free Stock Analysis Report
This article originally published on Zacks Investment Research (zacks.com).
BHP CEO Mike Henry says he sees growth opportunities in copper and potash. He speaks with Haslinda Amin on “Insight with Haslinda Amin.”
By Ernest Scheyder
(Reuters) – U.S. President Donald Trump on Tuesday criticized an appeals court's decision to temporarily block federal officials from completing a land transfer needed for Rio Tinto and BHP to develop Arizona's Resolution Copper project.
Trump's post on his Truth Social platform came after he and Interior Secretary Doug Burgum met at the White House with the CEOs of Rio and BHP, two of the world's largest mining companies, which have been trying to develop Resolution for more than a decade.
The San Francisco-based 9th U.S. Circuit Court of Appeals ruled on Monday that the transfer – which had been slated for Tuesday – should be halted while the court weighs a request from the San Carlos Apache tribe to block the project for religious, cultural and environmental reasons.
It was only the second time any court has ruled in favor of the Apache or their allies in more than five years of myriad legal maneuvers against Resolution, slated to become one of the world's largest supplies of a metal used to build nearly every electronic device.
Trump called the court a "radical left court" and said that those who oppose the mine "are Anti-American, and representing other copper competitive Countries."
"It is so sad that Radical Left Activists can do this, and affect the lives of so many people," Trump said in the post. "We can't continue to allow this to happen to the U.S.A.!"
Trump did not outline any actions he plans to take to sway the court, but said that "our Country, quite simply, needs Copper — AND NOW!" He did not provide evidence for his claims about the court and opponents of the project.
Terry Rambler, chairman of the San Carlos Apache, said in a statement that he and the tribe were "working to save the U.S. from making a disastrous decision that would give up American resources to foreign interests."
Rambler noted in his statement that BHP is based in Australia, while Rio is based in Australia and the U.K. and its largest shareholder is a Chinese aluminum company.
Rio has said it plans to keep all of Resolution's copper inside the U.S. should the mine be approved. The company controls one of the two U.S. copper smelters.
Rambler said he believes that Rio is likely to export Resolution's copper to China.
"I look forward to sitting down with the administration and providing factual information that will help protect American assets," Rambler said.
COURT
The appeals court made clear it takes "no position on the merits" of the Apache's arguments and would expedite its review. Judges asked for filings to be submitted by October 14, but have not yet scheduled a hearing date. Ten of the appeals court's 29 members were appointed by Trump.
Rio said it was "confident the court will ultimately affirm" the land transfer. Rio CEO Jakob Stausholm and his successor Simon Trott, who will take the company's reins next month, were at the White House meeting with Trump.
BHP CEO Mike Henry thanked Trump and Burgum on social media "for their strong leadership to reinvigorate mining and processing supply chains in and for America."
Trump's post comes less than a month after he imposed a copper tariff on wiring and pipe, but not the copper concentrate produced by mines themselves, a levy falling far short of what the mining industry had expected. That will allow other countries to import copper into the U.S. without fear of tariff implications.
HISTORY
The mine's construction would cause a crater that would swallow a site where the Apache worship. Congress and then-President Barack Obama approved the mine in 2014 after it was added at the last minute to a must-pass military funding bill with the condition that an environmental report be published.
The underground mine – which Trump approved in his first term before successor Joe Biden reversed him – would supply more than a quarter of U.S. appetite for copper and be a key part of Trump's plan to boost U.S. mining.
Apache Stronghold, a nonprofit group comprised of some Apache and conservationists, asked the U.S. Supreme Court to block the transfer, a request that the high court denied in May.
Meanwhile, the tribe itself made the same request of federal courts. It failed last week at the district court level and appealed over the weekend.
(Reporting by Ernest Scheyder; Additional reporting by Trevor Hunnicutt; Editing by Franklin Paul, Stephen Coates and Sonali Paul)
BHP Group recently announced a reduction in its final dividend for 2025 and reported a decrease in annual sales, while seeing an increase in net income and earnings per share. Over the last quarter, the company’s share price moved up by 9%, a shift that aligns with the Dow Jones reaching an all-time high. This growth in BHP’s profitability might have added weight to the broader market moves, particularly as other major indices like the S&P 500 saw declines during the same period. BHP’s production guidance for the coming fiscal year might have also contributed positively to investor sentiment.
We’ve discovered 1 warning sign for BHP Group that you should be aware of before investing here.
ASX:BHP Earnings Per Share Growth as at Aug 2025
The recent announcement of BHP Group’s dividend reduction and strong short-term share price move raises questions about its potential long-term impacts. While the company’s share price rose by 9% in the last quarter, a broader look reveals a total shareholder return of 74.81% over the last five years, reflecting solid performance. However, over the past year, BHP underperformed the Australian market and the Metals and Mining industry, which returned 12.2% and 15.6% respectively. This context is vital for understanding the potential implications of BHP’s current strategies on its long-term growth and stability.
The performance trajectory may influence sentiment regarding revenue and earnings forecasts. With a projected annual revenue decline of 1.4% over three years, combined with stable earnings forecasts, there is potential for cautious optimism. The share price stands at A$42.12, marginally lower than the consensus price target of A$42.60. This slight discount underscores the market’s careful consideration of BHP’s growth strategies and their potential outcomes. As such, BHP’s exploration into copper and potash could bear on its future revenue, offering a hedge against industry and earnings volatility.
Assess BHP Group’s future earnings estimates with our detailed growth reports.
This article by Simply Wall St is general in nature. We provide commentary based on historical data and analyst forecasts only using an unbiased methodology and our articles are not intended to be financial advice. It does not constitute a recommendation to buy or sell any stock, and does not take account of your objectives, or your financial situation. We aim to bring you long-term focused analysis driven by fundamental data. Note that our analysis may not factor in the latest price-sensitive company announcements or qualitative material. Simply Wall St has no position in any stocks mentioned.
Companies discussed in this article include ASX:BHP.
This article was originally published by Simply Wall St.
Have feedback on this article? Concerned about the content? Get in touch with us directly. Alternatively, email editorial-team@simplywallst.com
DoorDash (DASH) look to purchase Deliveroo (DLVEY) in major acquisition, BHP (BHP) reports a slump in revenue and Nvidia (NVDA) announces new chip.
Video Transcript
Now it’s time for some of today’s trending tickers.
We’re watching DoorDash, BHP and Nvidia.
First up, DoorDash, the meal delivery platform’s planned $3.9 billion takeover of British delivery company Deliveroo will be reviewed under the European Union’s simplified merger procedure.
That typically means the EU regulator does not see any competition concerns and that the deal is likely to get approval.
The company reached a deal in May that valued Deliveroo at about $3.92 billion.
Now Deliveroo operates across nine countries in Europe and Asia.
Next up on our list we have BHP, the iron ore company.
The company’s profits have hit a 5-year low due to weakening iron ore prices.
The firm reported a 14% profit rise for the year ending June 30th, but overall, revenue fell 8% to $51.3 billion.
Now, although this still did beat expectations, BHP shares have actually jumped in the pre-market, with one analyst at Hargreaves Lansdowne saying that the company’s ultra low cost production gives it an edge even when prices falter.
The company has blamed mixed global demand for iron ore, but added that these losses had been offset by an increase in copper prices, which ballooned following one of President Trump’s tariffs on the metal.
BHP has increased its copper production by 28% in the last three years.
A big factor for the reducing iron ore price has been its main importer, China, which has seen a reduction in its steel output.
Now BHP will also be bracing for the upcoming Simandou iron ore project in Guinea, where a consortium of Chinese miners and its rival Rio Tinto are expected to start shipping by the end of the year.
OK, finally we’ve got Nvidia and it’s reportedly working on a new AI chip for China that’s more powerful than the H100 model it’s currently allowed to sell there.
According to a report from Reuters, the new chip is tentatively known as the B30A.
The new chip will have a single design, high bandwidth memory, and Nvidia’s NV Link technology for fast data transmission between processors.
Nvidia reportedly hopes to deliver samples to Chinese clients for testing as early as next month.
Shares of Nvidia have nearly doubled since early April.
OK, that does it for trending tickers, but you can track the best and worst performing stocks with Yahoo Finance’s Trending Tickers page.
LONDON (Reuters) -Peabody Energy on Tuesday withdrew its $3.78 billion bid for Anglo American's Australian coking coal assets after failing to cut the price following a mine fire, with the dispute now set for arbitration.
Peabody had agreed to acquire the mines in Queensland's Bowen Basin, the world's top steelmaking coal region, as the London-listed Anglo moved to sell or spin off non-core assets following bigger rival BHP's failed takeover attempt last year.
The aborted sale sets that process back, after Anglo counted the coking coal assets as discontinued operations at its mid-year results in July.
Peabody shares rose more than 6% in U.S. premarket trade, while Anglo American initially pared gains sharply after the news before recovering to trade 2.9% higher at 1231 GMT.
Operations at the Moranbah North mine were halted in April after an underground fire caused by high gas levels, prompting Peabody to invoke a clause allowing it to walk away or renegotiate if a major adverse event occurred between signing and completion.
"The two companies did not reach a revised agreement to cure the MAC (material adverse change) that compensated Peabody for the material and long-term impacts of the MAC on the most significant mine in the planned acquisition," said Peabody President and Chief Executive Officer Jim Grech.
Reuters could not immediately establish whether a termination fee would be paid.
Anglo on Tuesday said it would "shortly initiate an arbitration to seek damages for wrongful termination," disputing that the fire and mine closure constituted a material adverse change, due to the lack of damage to the mine or equipment and progress made towards restarting it.
"We are therefore very disappointed that Peabody has decided not to complete the transaction," said Anglo's CEO Duncan Wanblad.
Wanblad reiterated that given strong interest for the assets during the bidding process, Anglo was confident an alternative buyer could be found through a new sales process.
(Reporting by Yadarisa Shabong and Clara Denina. Editing by Shilpi Majumdar, Bernadette Baum and Mark Potter)
STORY: BHP said Tuesday (August 19) its annual profit fell to its lowest in five years.
That’s as sluggish China demand weighed on iron ore prices.
But it declared a bigger-than-expended final dividend, sending its shares higher.
The Australian firm also raised its debt target and said it would consider acquisitions in commodities like copper.
The world’s largest listed miner’s full year profit was $10.16 billion.
Down more than a quarter from last year and below analyst expectations.
Iron ore prices were pressured for much of the year through a combination of factors.
This included more products being shipped from Australia, Brazil and South Africa…
As well as lower steel production in top consumer China.
It affected earnings not just for BHP but other top miners like Rio Tinto.
BHP’s average realized price for iron ore fell by 19% during the year.
But that was partly offset by stronger prices for copper, its second-biggest profit driver.
Still, the miner said it expects demand for its commodities to remain resilient.
That’s even as the global economy faces an uncertain environment due to “shifting trade policies.”
Intel (INTC)
Shares in Intel popped 5% in pre-market trading on Tuesday, following reports of major investments in the struggling chipmaker.
Japanese company Softbank Group (9984.T) announced on Tuesday that it had signed an agreement with Intel to buy $2bn of its common stock.
Masayoshi Son, CEO of SoftBank Group, said: "This strategic investment reflects our belief that advanced semiconductor manufacturing and supply will further expand in the United States, with Intel playing a critical role."
Meanwhile, Bloomberg reported on Monday that the Trump administration is in talks to take a stake of about 10% in Intel.
Palo Alto Networks (PANW)
Shares in Palo Alto Networks (PANW) jumped more than 5% in pre-market trading on Tuesday, after the US cybersecurity firm's latest quarterly earnings beat expectations.
Palo Alto posted a 16% rise in revenue in the fourth quarter to $2.54bn, compared with estimates of $2.5bn, according to S&P Global Market Intelligence. Earnings per share of $0.95 were also ahead of the $0.89 expected by analysts.
Nikesh Arora, CEO of Palo Alto Networks, said: "We exited fiscal year 2025 with an acceleration in RPO [remaining performance obligations], and surpassed the $10bn revenue run-rate milestone, positioning ourselves well for sustained growth ahead."
Read more: Stocks that are trending today
For the first quarter of its 2026 fiscal year, Palo Alto guided to total revenue in the range of $2.45bn to $2.47bn, which would represent year-on-year growth of 15%. The company said it expected to report earnings per share of $0.88 to $0.90.
As for the full year ahead, Palo Alto expects total revenue to be in the range of $10.475bn to $10.525bn and earnings per share of $3.75 to $3.85.
GoodRx Holdings (GDRX)
Shares in GoodRx (GDRX) soared more than 37% on Monday and were up a further 3.5% in pre-market trading on Tuesday, after the telemedicine platform operator announced a collaboration with Danish pharma giant Novo Nordisk (NOVO-B.CO, NVO).
GoodRx said that all strengths of Ozempic and Wegovy pens were available to eligible paying patients in the US for $499 per month through its platform.
The partnership significantly lowered the price of GLP-1 medications, marking the first time Ozempic has been made available to patients at this self-pay price.
Wendy Barnes, CEO of GoodRx, said: "Demand for GLP-1 medications is at an all-time high, but too many Americans still face barriers accessing them. By partnering with Novo Nordisk, we’re taking a significant step forward in making these innovative brand-name treatments more accessible for millions of people who need them."
The move comes as Novo Nordisk seeks to maintain its share of the weight-loss drug market, amid increasing competition from rivals. On Friday, Novo announced that Wegovy had been approved in the US to treat a form of liver disease.
Duolingo (DUOL)
Shares in Duolingo (DUOL) surged nearly 13% on Monday, after positive news around analyst ratings.
KeyBanc upgraded its rating on the stock to "overweight" from "sector weight", while Citigroup (C) initiated its coverage of the stock with a "buy" rating.
Stocks: Create your watchlist and portfolio
Meanwhile, in a New York Times interview published on Sunday, Duolingo CEO Luis von Ahn responded to the backlash against a memo sent a few months ago, in which it was declared the company would become "AI-first".
“Internally, this was not controversial,” von Ahn said in the NYT interview. “Externally, as a publicly traded company some people assume that it’s just for profit. Or that we’re trying to lay off humans. And that was not the intent at all.”
BHP Group (BHP.L)
On the London market, shares in BHP (BHP.L) rose nearly 2% despite the iron ore company reporting a mixed set of results.
BHP said that attributable profit rose 14% for the year ended 30 June to $9bn, though revenue dipped 8% to £51.3bn.
Matt Britzman, senior equity analyst at Hargreaves Lansdown, said: "Mining giant BHP saw profits fall to a five-year low, as softer iron ore prices weighed on the bottom line. But riding the commodity price wave is part and parcel of being a global miner, and considering where we are in the cycle, performance has been solid.
"Chinese iron ore demand has remained relatively robust, but a general shift to more protectionist trade policies in Western countries is expected to put prices under pressure over the near term.
Read more: Analysts' top emerging market fund and trust picks
"What sets BHP apart is its enviable cost base. Its Australian operations deliver ultra-low-cost production, giving it a competitive edge even when prices falter. Meanwhile, the group is steadily ramping up its exposure to copper – a metal with lingering tariff risks but a compelling long-term demand story.
"Management struck an optimistic chord on the broader commodity outlook, underscored by a hike in the dividend payout ratio and a more flexible approach to debt. It’s a signal of confidence, not just in the balance sheet, but in the future of the business."
Read more:
Download the Yahoo Finance app, available for Apple and Android.
Base metal prices remained range-bound amid a slower news week as the earnings season officially end
Freeport-McMoRan Inc. FCX saw a notable reduction in its average unit net cash cost per pound of copper in the second quarter of 2025 to just $1.13, a sharp improvement from $1.73 a year earlier and well below its guidance of $1.50. The decline was fueled by operational efficiencies, higher gold credits and an uptick in copper sales volumes. Lower costs contributed to stronger profit margins in the quarter. Freeport's outlook for the third quarter, however, suggests higher costs on a sequential basis. It expects unit net cash costs to rise to $1.59 per pound in the third quarter, while still projecting a full-year average of roughly $1.55. Lower expected sales volumes are likely to impact costs in the third quarter. The potential impacts of tariffs may lead to further upside to the projected third-quarter costs. FCX estimates that the tariffs could potentially increase the cost of goods it purchases in the United States by roughly 5%. Higher costs are likely to weigh on the company's margins.Among FCX’s peers, Southern Copper Corporation SCCO also reported lower unit costs in the second quarter. Southern Copper’s operating cash cost per pound of copper, net of by-product revenue credits, was $0.63, marking a 17% decline from $0.76 per pound reported in the prior-year quarter. Southern Copper’s operating cash cost per pound of copper also declined roughly 24% year over year in the first six months of 2025.BHP Group Limited BHP saw lower unit costs across its copper operations in fiscal 2025. BHP expects the unit cost for Escondida to be in the band of $1.20-$1.50 per pound for fiscal 2026. BHP also expects Copper South Australia’s unit cost to be between $1 and $1.50 per pound. Unit costs at Spence are expected to be between $2.10 and $2.40 per pound for fiscal 2026.
The Zacks Rundown for FCX
Shares of Freeport-McMoRan are up 9.6% year to date against the Zacks Mining – Non Ferrous industry’s rise of 3.2%.
Zacks Investment Research
Image Source: Zacks Investment Research
From a valuation standpoint, FCX is currently trading at a forward 12-month earnings multiple of 19.76, a modest 1% premium to the industry average of 19.49X. It carries a Value Score of B.
Zacks Investment Research
Image Source: Zacks Investment Research
The Zacks Consensus Estimate for FCX’s 2025 and 2026 earnings implies a year-over-year rise of 18.2% and 33%, respectively. The EPS estimates for 2025 and 2026 have been trending higher over the past 60 days.
Zacks Investment Research
Image Source: Zacks Investment Research
FCX stock currently carries a Zacks Rank #3 (Hold). You can see the complete list of today’s Zacks #1 Rank (Strong Buy) stocks here.
Want the latest recommendations from Zacks Investment Research? Today, you can download 7 Best Stocks for the Next 30 Days. Click to get this free report
Freeport-McMoRan Inc. (FCX) : Free Stock Analysis Report
BHP Group Limited Sponsored ADR (BHP) : Free Stock Analysis Report
Southern Copper Corporation (SCCO) : Free Stock Analysis Report
This article originally published on Zacks Investment Research (zacks.com).
Written by Amy Legate-Wolfe at The Motley Fool Canada
Gold and copper prices have been on a tear, and that momentum is pulling some of Canada’s biggest miners into the spotlight. Agnico Eagle Mines (TSX:AEM) and Lundin Mining (TSX:LUN) have both been trending lately, riding strong commodity prices and operational wins. But with both mining stocks already showing big moves, the question is whether there’s still upside for new investors.
AEM
Agnico Eagle has been one of the TSX‘s standout performers over the past year, with its share price up more than 75% and recently hitting an all-time high. That’s been fuelled by a mix of strong gold prices and exceptional operational execution.
In the second quarter (Q2) of 2025, the mining stock delivered payable gold production of over 866,000 ounces at total cash costs of just $933 per ounce, well below the mid-point of its guidance. Revenue jumped thanks to a realized gold price of $3,288 per ounce, while net income surged to $1.07 billion, more than doubling from the same quarter last year.
Perhaps more impressive, free cash flow hit a record $1.3 billion, allowing Agnico to pay down debt, build a net cash position, and return $300 million to shareholders through dividends and buybacks. The pipeline looks healthy too, with key growth projects like Canadian Malartic, Detour Lake, and Upper Beaver advancing on schedule. The risk for investors is obvious: gold prices have been a major tailwind, and if these retreat, margins and sentiment could take a hit. But with a strong balance sheet and a disciplined approach to capital spending, Agnico is in a good position to weather a softer market.
LUN
Lundin Mining is coming at the rally from a different angle. Its share price is up over 26% in the past year, boosted by solid copper production and a strategic shift toward long-term growth. Q2 2025 saw copper output of just over 80,000 tonnes, alongside nearly 38,000 ounces of gold, with consolidated copper cash costs dropping to $1.92 per pound. Revenue rose to $937 million, while net earnings from continuing operations climbed to $126 million.
The big headline, though, was the $1.4 billion sale of its European assets, which allowed Lundin to slash net debt to just $135 million. That gives the mining stock flexibility to invest in its ambitious growth plans, particularly the Vicuña Project. This project could become one of the world’s largest copper, gold, and silver mining complexes.
The project’s resource estimates are massive, but development will take years, and investors will need to be patient. In the meantime, Lundin looks to boost production through brownfield expansions and incremental efficiency gains at existing mines. Commodity price swings remain the biggest short-term risk, especially given copper’s volatility, but the mining stock’s improving cost profile and cleaner balance sheet give it more room to manoeuvre.
Bottom line
The challenge with both stocks is valuation. After big gains, neither is a bargain by traditional metrics, and any pullback in metal prices could cool the momentum quickly. Still, if you believe the macro backdrop for gold and copper remains supportive, these miners could have more room to run. The key will be whether they can keep delivering on costs, production, and project timelines while staying disciplined with capital. But these do offer a dividend, with a $5,000 investment in each bringing in about $95 each year.
|
COMPANY |
RECENT PRICE |
NUMBER OF SHARES |
DIVIDEND |
TOTAL PAYOUT |
FREQUENCY |
TOTAL INVESTMENT |
|---|---|---|---|---|---|---|
|
AEM |
$183.75 |
27 |
$2.22 |
$59.94 |
Quarterly |
$4,961.25 |
|
LUN |
$15.73 |
318 |
$0.11 |
$34.98 |
Quarterly |
$5,001.14 |
In short, Agnico Eagle looks like the steadier, cash-rich play on gold, while Lundin offers more long-term torque from copper growth. Both are trending for good reason, and while buying after a big run always carries risks, those betting on sustained strength in precious and base metals may find either, or both, worth a closer look.
The post Mining Momentum: Agnico Eagle and Lundin Mining Are Trending, So Should You Buy? appeared first on The Motley Fool Canada.
Should you invest $1,000 in Shopify right now?
Before you buy stock in Shopify, consider this:
The Motley Fool Stock Advisor Canada analyst team identified what they believe are the 15 best stocks for investors to buy now… and Shopify wasn’t one of them. The 15 stocks that made the cut could potentially produce monster returns in the coming years.
Consider MercadoLibre, which we first recommended on January 8, 2014 … if you invested $1,000 in the “eBay of Latin America” at the time of our recommendation, you’d have $24,427.64!*
Now, it’s worth noting Stock Advisor Canada’s total average return is 94%* – a market-crushing outperformance compared to 61%* for the S&P/TSX Composite Index. Don’t miss out on our top 15 list, available when you join Stock Advisor Canada.
* Returns as of July 15th, 2025
More reading
Fool contributor Amy Legate-Wolfe has no position in any of the stocks mentioned. The Motley Fool has no position in any of the stocks mentioned. The Motley Fool has a disclosure policy.
2025
By Sameer Manekar and Byron Kaye
(Reuters) -BHP said annual profit fell to the lowest in five years as sluggish demand from China weighed on iron ore prices and flagged a cut in capital and exploration spending but declared a bigger-than-expected final dividend, sending its shares higher.
The world's largest listed miner also raised its debt target and said it would consider acquisitions in commodities such as copper and potash.
It posted a $10.16 billion underlying profit for the year ended June 30, down 26% from last year and below the Visible Alpha consensus of $10.22 billion.
BHP cut its final dividend but by less than analysts had forecast. It said it will pay shareholders $0.60 per share, from $0.74 a year earlier, taking the year's total to $1.10, its lowest since 2017, but well ahead of a Visible Alpha consensus of $1.01.
The Sydney-listed company's shares were up 1% in early trading, compared to a 0.7% dip on the broader market, as investors welcomed the payout.
"Inflationary pressures across the cost base have largely normalised, although pockets of pressure persist in some areas and overall cost levels remain materially higher than pre-pandemic benchmarks," said Citi analysts. "We expect the higher div payout ratio to be taken as a modest positive."
A combination of more product being shipped from Australia, Brazil and South Africa and lower steel production in top consumer China, pressured iron ore prices for much of the financial year, affecting earnings for top miners including BHP and Rio Tinto.
BHP's average realised price for iron ore fell by 19% during the year, though that was partly offset by stronger prices for copper, its second-biggest profit driver.
Still, the miner said it expects demand for its commodities to remain resilient even as the global economy faces an uncertain environment due to "shifting trade policies".
"Policy uncertainty, particularly around tariffs, fiscal policy, monetary easing, and industrial policy, has been elevated and continues to influence investment and trade flows. Despite these dynamics, commodity demand remained resilient," Chief Executive Mike Henry said in a statement.
BHP raised its net debt target range to between $10 billion and $20 billion, from between $5 billion and $15 billion, saying the decision was a result of technical analysis and not a sign of increased appetite for mergers and acquisitions activity.
The company would consider acquisitions in target growth areas like copper and potash but only of assets which were reasonably-priced and high quality, and "the overlap between those factors is a rare thing", Henry said on a call with reporters.
BHP said it plans to spend $11 billion on growth projects and exploration over the next two years, up from $9.79 billion in fiscal 2025. However, it said the spending will slow down to an average $10 billion each year between 2028 and 2030.
In July, the mining giant flagged a delay and a cost overrun of up to $1.7 billion at its key Jansen potash project in Canada, and also exited its interest in the $942 million Kabanga nickel project in Tanzania.
On Tuesday, it said it had agreed to sell copper assets in Brazil for up to $465 million.
(Reporting by Sameer Manekar and Roushni Nair in Bengaluru; Editing by Maju Samuel and Sonali Paul)
SAO PAULO (Reuters) -Global miner BHP has agreed to sell copper assets in Brazil to CoreX Holding for up to $465 million, it reported alongside its earnings on Monday.
BHP has entered into a binding agreement with CoreX for the sale of the so-called Carajas assets, BHP said, noting the transaction is expected to be completed in early 2026.
CoreX did not immediately respond to a request for comment.
"This transaction follows a strategic review in 2024, which concluded that the Carajas assets would benefit from owners prioritizing the operations and developing the assets to their full growth potential," BHP said.
Carajas produced 9,400 metric tons of copper in the 12 months through June, according to BHP.
Under the agreement, BHP will receive $240 million on the deal's completion and up to $225 million as contingent payments that could begin as early as 2027 based on a range of production and project-related targets.
(Reporting by Andre Romani in Sao Paulo and Marta Nogueira in Rio de Janeiro; Editing by Daina Beth Solomon and Kylie Madry)
Vancouver, British Columbia–(Newsfile Corp. – August 18, 2025) – Visionary Metals Corp. (TSXV: VIZ) ("Visionary" or the "Company") is pleased to announce that it has contracted Geotech Ltd. ("Geotech") to conduct a Versatile Time-Domain Electromagnetic (VTEM) survey across its 40 km² land package in Wyoming's Granite Mountains. The VTEM survey, scheduled to begin this month, is designed to detect possible sulfide mineralization in outcrop and under post-Archean cover occurrences at depth and marks the first step in Visionary's recently announced, strategic Exploration Alliance with Teck Resources Limited ("Teck") to advance nickel exploration in Wyoming (See July 31st, 2025, Press Release).
"The VTEM survey is a significant first step as part of our recently announced Strategic Exploration Alliance with Teck," commented Wes Adams, CEO of Visionary Metals Corp. "Geotech's state-of-the-art data collection systems will significantly enhance our ability to detect conductive sulfide zones at depth at our flagship Tin Cup and King Solomon nickel projects and allow us to test additional regional prospects."
The VTEM survey will collect data from Visionary's entire 40 km² land package in Fremont County, Wyoming. It will focus on the Tin Cup project, where a 4.3-kilometer (km) by 150-meter (m) peridotite intrusion is in contact with sulfidic iron formation indicating strong nickel sulfide potential, and the King Solomon project, where Visionary made Wyoming's first nickel sulfide discovery in 2022. Flight lines will be flown at 100 m line spacing in these two areas to generate high resolution data for drill targeting and 200 m spaced lines will be used to test sulfide potential at earlier stage targets within Visionary's 40 km2 land package. Visionary has existing drill permits in place at King Solomon and plans to apply for new drill notifications at Tin Cup following interpretation of the VTEM survey data.
Regional Geology
Visionary's properties are located within Wyoming's Archean greenstone belt, which share several geological characteristics with other renowned nickel provinces, such as the Yilgarn Craton, in Australia. The VTEM survey is designed to detect conductive anomalies indicative of high-grade nickel sulfide deposits to depths up to 400 m. Teck will assist with data interpretation. Geotech's VTEM system is a leading airborne electromagnetic tool, renowned for detecting conductive mineral deposits like nickel sulfides at depths up to 400 meters. VTEM induces currents in subsurface conductors, mapping their size and location. This technology is particularly effective for identifying nickel sulfide systems in ultramafic rocks like peridotites, which are prevalent in Visionary's land package and thought to be analogous to other nickel districts of Archean age.
About Visionary Metals Corp.
Visionary Metals Corp. (TSXV: VIZ) is a Vancouver-based exploration company focused on base and precious metals exploration in Fremont County, Wyoming. With a 40 km² land package in the Granite Mountains, Visionary is advancing nickel, copper, gold, and cobalt projects, highlighted by Wyoming's first nickel discovery at King Solomon in 2022. The Company's exploration targets mirror the geological framework of Western Australia's Yilgarn Craton, positioning Visionary as a leader in Wyoming's nickel frontier.
About Geotech Ltd.
Geotech Ltd., based in Aurora, Ontario, is a global leader in airborne geophysical surveys, incorporated in 1981. Its proprietary VTEM system has mapped over two million line-kilometers worldwide, enabling the discovery of conductive mineral deposits like nickel, copper, and gold with unmatched precision.
Summary of Strategic Exploration Alliance with Teck
-
Initial Funding: On August 1st, 2025, Teck bought 17,392,193 common shares of Visionary via private placement at $0.07 per share, providing $1,217,454 in gross proceeds, representing 9.9% of Visionary's issued and outstanding shares on a non-diluted basis. These proceeds will be used to fund initial exploration activities.
-
Subsequent Funding: If Visionary completes an additional equity financing during the Alliance term, Teck may invest up to $500,000 on terms no less favorable than other investors, potentially increasing its ownership up to 19.9% on a partially diluted basis, subject to TSX Venture Exchange approval.
-
Exploration Program: Visionary will manage exploration programs, incurring expenditures equal to or exceeding the combined proceeds from Teck's investment and any government grants during the Alliance period (ending December 31, 2026, subject to extensions). Teck may fund additional exploration through optional three-month extensions, contributing $300,000 per extension.
-
Option for Teck: Teck has the exclusive option to earn a 70% interest in designated properties by incurring exploration expenditures within three years of designation, as follows:
-
Diamond Springs Property: $4,000,000, including a firm commitment of $500,000 within one year of designation.
-
King Solomon or Tin Cup Properties: $6,000,000 each, including a firm commitment of $750,000 within one year of designation.
-
Newly Designated Properties: $500,000, including a firm commitment of $100,000 within one year of designation.
-
Upon exercising the option, Teck will own 70% and Visionary 30% of the designated property, and the parties will form a joint venture. If Teck completes 50% of the required expenditures, but does not exercise the option, it will receive a 1% net smelter return ("NSR") royalty and rights to 50% of future concentrate production from the property.
-
-
Joint Venture Terms: Post-option exercise, each party will fund its pro-rata share of expenditures, with dilution for non-contribution. If a party's interest falls below 20%, it converts to a 2% NSR royalty, with a buy-back right for 1% at US$4,000,000. The majority interest holder will operate the joint venture.
-
Technical Oversight: A Technical Committee, with two representatives each from Visionary and Teck, will oversee exploration programs, with Teck holding a tie-breaking vote to ensure efficient decision-making.
For further information, please contact:Wes Adams, CEOVisionary Metals Corp.
407-325 Howe StreetVancouver, BC V6C 1Z7Tel: (303) 809-4668Email: wadams@visionarymetalscorp.com
Cautionary Statement Regarding Forward-Looking Information
This news release contains statements that constitute "forward-looking statements." Such forward-looking statements involve known and unknown risks, uncertainties and other factors that may cause actual results, performance or achievements, or developments in the industry to differ materially from the anticipated results, performance or achievements expressed or implied by such forward-looking statements. Forward-looking statements are statements that are not historical facts and are generally, but not always, identified by the words "expects," "plans," "anticipates," "believes," "intends," "estimates," "projects," "potential" and similar expressions, or that events or conditions "will," "would," "may," "could" or "should" occur.
Forward-looking statements in this document include statements regarding the Company's expectations regarding the commencement and timing of the VTEMs survey as well as the efficacy thereof, subsequent funding, the completion of exploration activities, the exercise of any option by Teck and the funding related thereto and the entering into of any joint venture, the use of proceeds from any funding and other statements that are not historical facts. By their nature, forward-looking statements involve known and unknown risks, uncertainties and other factors which may cause our actual results, performance or achievements, or other future events, to be materially different from any future results, performance or achievements expressed or implied by such forward-looking statements. Such factors and risks include, among others: the Company may choose to defer, accelerate or abandon its exploration plans; Teck may choose not to exercise any option; new laws or regulations and/or unforeseen events could adversely affect the Company's business and results of operations; stock markets have experienced volatility that often has been unrelated to the performance of companies and such volatility may adversely affect the price of the Company's securities regardless of its operating performance risks generally associated with the exploration for and production of resources; the uncertainty of estimates and projections relating to expenses; constraint in the availability of services; commodity price and exchange rate fluctuations; adverse weather conditions; and uncertainties resulting from potential delays or changes in plans with respect to exploration or development projects or capital expenditures.
When relying on forward-looking statements and information to make decisions, investors and others should carefully consider the foregoing factors and risks and other uncertainties and potential events. The Company has assumed that the material factors referred to in the previous paragraphs will not cause such forward-looking statements and information to differ materially from actual results or events. However, the list of these factors is not exhaustive and is subject to change and there can be no assurance that such assumptions will reflect the actual outcome of such items or factors. The reader is cautioned not to place undue reliance on any forward-looking information. Such information, although considered reasonable by management at the time of preparation, may prove to be incorrect and actual results may differ materially from those anticipated. Forward-looking statements contained in this press release are expressly qualified by this cautionary statement. The forward-looking statements contained in this press release are made as of the date of this press release. The Company does not intend, and expressly disclaims any intention or obligation to, update or revise any forward-looking statements whether as a result of new information, future events or otherwise, except as required by law.
Neither the TSX Venture Exchange nor its Regulation Services Provider (as that term is defined in the policies of the TSX Venture Exchange) accepts responsibility for the adequacy or accuracy of this release.
To view the source version of this press release, please visit https://www.newsfilecorp.com/release/262612
BHP Group Limited (NYSE:BHP) is among the 12 Best Australian Stocks to Buy Right Now. On August 11, the company announced that it would be part of an industry consortium to assess the development of Carbon Capture, Utilisation and Storage (CCUS) hubs across Asia.
A close up of the hand of a financial analyst, holding a copy of a report from a rating agency.
The consortium will comprise leading steelmakers, including ArcelorMittal Nippon Steel India, Hyundai Steel Company, JSW Steel, and value chain players BHP Group Limited (NYSE:BHP), Chevron, and Mitsui & Co., Ltd. The first of its kind industry-led study in Asia will investigate the commercial and technical pathways to utilising CCUS in hard-to-abate sectors across the continent.
According to BHP Group Limited (NYSE:BHP)’s press release, the research will focus on the potential for large-scale projects that could store or repurpose captured CO2. The study will also seek applications for the use of captured CO2 in industrial processes or its transportation to Asia or Northern Australia through pipeline or shipping.
The research will conclude in 2026 and is open to additional members wanting to join and contribute to the study. Dr Ben Ellis, Vice President of Marketing Sustainability at BHP Group Limited (NYSE:BHP) shared the following remarks on the announcement of the consortium:
“BHP is committed to supporting our steelmaking customers on their journey to decarbonise the industry.With more than 1 billion tonnes of production a year in Asia coming from blast furnace capacity that is relatively early in its production life, it’s important for industry to progress technologies to decarbonise existing steelmaking assets while new commercial pathways to decarbonise steelmaking are developed over time.
By leveraging shared knowledge and resources with our partners, we are investing in support for innovative solutions—like the potential of CCUS—that we see as an essential part of decarbonising hard-to-abate sectors such as steelmaking.”
While we acknowledge the potential of BHP as an investment, we believe certain AI stocks offer greater upside potential and carry less downside risk. If you're looking for an extremely undervalued AI stock that also stands to benefit significantly from Trump-era tariffs and the onshoring trend, see our free report on the best short-term AI stock.
READ NEXT: 11 Best Large Cap Defense Stocks to Buy According to Analysts and 10 Best Low Priced Defense Stocks to Buy Now.
Disclosure: None.
It doesn't matter your age or experience: taking full advantage of the stock market and investing with confidence are common goals for all investors.
While you may have an investing style you rely on, finding great stocks is made easier with the Zacks Style Scores. These are complementary indicators that rate stocks based on value, growth, and/or momentum characteristics.
Why Investors Should Pay Attention to This Value Stock
Finding good stocks at good prices, and discovering which companies are trading under their true value, are what value investors like to focus on. So, the Value Style Score takes into account ratios like P/E, PEG, Price/Sales, and Price/Cash Flow to highlight the most attractive and discounted stocks.
Freeport-McMoRan (FCX)
Based in Phoenix, AZ, Freeport-McMoRan Inc., formerly Freeport-McMoRan Copper & Gold Inc., is engaged in mineral exploration and development; mining and milling of copper, gold, molybdenum and silver; as well as the smelting and refining of copper concentrates. The company conducts its operations primarily through its principal operating subsidiaries, PT Freeport Indonesia (PT-FI), Freeport Minerals Corporation and Atlantic Copper. PT Freeport Indonesia’s principal asset is Papua, Indonesia-based Grasberg mine, which contains the world’s largest copper and gold reserves.
FCX boasts a Value Style Score of B and VGM Score of B, and holds a Zacks Rank #3 (Hold) rating. Shares of Freeport-McMoRan are trading at a forward earnings multiple of 24.2X , as well as a PEG Ratio of 0.8, a Price/Cash Flow ratio of 13.9X, and a Price/Sales ratio of 2.4X.
Value investors don't just pay attention to a company's valuation ratios; positive earnings play a crucial role, too. Seven analysts revised their earnings estimate upwards in the last 60 days for fiscal 2025. The Zacks Consensus Estimate has increased $0.1 to $1.75. FCX has an average earnings surprise of 10.4%.
FCX should be on investors' short list because of its impressive earnings and valuation fundamentals, a good Zacks Rank, and strong Value and VGM Style Scores.
Want the latest recommendations from Zacks Investment Research? Today, you can download 7 Best Stocks for the Next 30 Days. Click to get this free report
Freeport-McMoRan Inc. (FCX) : Free Stock Analysis Report
This article originally published on Zacks Investment Research (zacks.com).
Earnings season is winding down but there are still a number of companies due to report, along with key economic data and events on both sides of the Atlantic – including the Jackson Hole Symposium.
This year's Jackson Hole Symposium will see central bankers from around the world gather to discuss economic policy – an event that will be closely watched by investors for any signals on the US Federal Reserve's plans for future interest rate cuts.
Back in the UK, the focus will be on the latest inflation data, which has been ticking higher over the past couple of months.
In terms of earnings releases, investors will be looking at results from US retail giant Walmart (WMT), which is considered a barometer for consumer sentiment.
In the tech sector, US cybersecurity giant Palo Alto Networks (PANW) is set to report, with the stock having seen a couple of analyst ratings upgrades this week.
China's Baidu (9888.HK, BIDU) is another major tech company scheduled to report, having recently struck a deal with Uber (UBER) to deploy its autonomous cars on the ride-hailing platform across markets outside of the US and mainland China.
Here's more on what to look out for:
Jackson Hole Symposium – Takes place from Thursday 21 August to Saturday 23 August
The theme for this year's Jackson Hole event is "Labor Markets in Transition: Demographics, Productivity, and Macroeconomic Policy". This comes amid concerns about a cooling labour market, as economic uncertainty sees firms put off hiring decisions.
Central bankers keep a close eye on labour market data, which includes payroll numbers, unemployment rates, job vacancies and wage growth. This data helps inform their decisions on interest rates, as they seek to balance maintaining labour market health, with ensuring inflation continues to ease to the widely used 2% target.
This has been more challenging amid fears that US president Donald Trump's tariffs could weigh on economic growth but also drive inflation higher.
Susannah Streeter, head of money and markets at Hargreaves Lansdown, said: "Although the effect of Trump’s tariffs on monetary policy will be the undercurrent theme, investors will be looking specifically for clues as to the Fed’s inclination to cut interest rates going forward."
Read more: Analysts' top emerging market fund and trust picks
"Bets on a cut in September have increased sharply following a stable inflation reading for July and there will focus on what could lie ahead for borrowing costs," she said.
Data released on Tuesday showed that "core" inflation rose 0.3% in July, surpassing June's 0.2% uptick. On an annual basis, the core consumer prices index (CPI) reading came in at 3.1%, up from 2.9% in June.
Another inflation measure, the producer price index (PPI) came in hotter than expected in July, according to figures released on Thursday. US PPI for July showed inflation for businesses rose 0.9% over the prior month, well ahead of the 0.2% increase that was forecast. On an annual basis, prices rose 3.3%, which was also ahead of the 2.5% expected. This data dented investor hopes of a bigger 50-basis-point interest rate cut by the Fed.
In addition, Streeter said: "How to bolster productivity in an era of demographic change will also be a big focus of discussions, with labour markets around the world in a state of upheaval as population changes, tougher immigration laws and AI developments are set to be hugely disruptive in the years to come."
UK consumer price inflation – Data due out on Wednesday 20 August
Following a year-on-year uptick in the UK consumer prices index (CPI) to 3.6% in June from 3.4% in May, Streeter said that there is set to be a "steamier inflation reading for July".
"The Bank of England is now forecasting that CPI will hit a peak of 4% in September so, for now, it looks like the only way is up for prices," she said.
"Barclaycard data has shown that there was an uplift in card spending in July, especially around events like the Oasis tour," she added. "The hot but stormy weather also led to a spurt in clothing purchases. Wage inflation has remained sticky."
Office for National Statistics (ONS) data, released on Tuesday, showed that annual wage growth excluding bonuses came in at 5% in April to June, unchanged from the previous three months.
Read more: What are bitcoin ETNs?
"Although pay growth has slowed, it’s now static and is still outstripping inflation, so there’s a risk that firms will pass on heavier costs as higher prices," said Streeter.
"Unless there’s a marked and unexpected fall in inflation, the Bank of England looks set to stay cautious and delay another interest rate cut at least November or December."
Sanjay Raja, senior economist at Deutsche Bank (DBK.DE), said in a note on Friday that his team expect headline CPI to rise to 3.8% in July.
"July inflation will likely see price momentum rise further into uncomfortable territory," he said.
Walmart (WMT) – Releases second quarter earnings on Thursday 21 August
As the largest retailer in the US, Walmart (WMT) is consider to act as a bellwether for consumer health, so it's earnings are closely watched by investors.
Shares are up more than 11% year-to-date but edged lower after Walmart released a mixed set of first quarter results in May.
Walmart (WMT) posted first quarter revenue of $165.5bn (£122.02bn) , which was up 2.5% from the same period last year, though this missed Wall Street expectations of $166.02bn. Adjusted earnings per share grew 1.7% year over year to $0.61, beating estimates of $0.58. US same-store sales also beat expectations with a 4.5% increase, led by health and wellness, and groceries.
However, the retailer signalled that there could be more pain ahead. In an earnings call, Walmart (WMT) CEO Doug McMillon said: "We will do our best to keep our prices as low as possible, but given the magnitude of the tariffs, even at the reduced levels announced this week, we aren't able to absorb all the pressure given the reality of narrow retail margins."
Stocks: Create your watchlist and portfolio
John David Rainey, chief financial officer of Walmart (WMT), said in the earnings release that the company had decided to hold off on providing a specific range of guidance for operating income growth and earnings per share for the second quarter, given the "dynamic nature of the backdrop".
Walmart (WMT) did guide to net sales growth of 3.5% to 4.5% for the quarter, based on the $167.8bn it reported a year ago.
AJ Bell's (AJB.L) investment director Russ Mould and head of financial analysis Danni Hewson said that analysts expect a headline figure for net sales of $174bn.
"That turns into a consensus analysts’ forecasts for [net profit in] the second quarter of $5.8bn, and a headline earnings per share (EPS) figure of $0.72, up from $0.67 a year ago," they said.
"For the full year to January 2026, Walmart has thus far guided to a net sales increase on a constant currency basis of 3% to 4% and analysts’ headline estimate for the top line is $699bn," they added. "Management expects full-year EPS to come in between $2.50 and $2.60, and the current analysts’ consensus is $2.58."
Palo Alto Networks (PANW) – Releases fourth quarter earnings on Monday 18 August
Ahead of the release of its fourth quarter earnings, Palo Alto Networks (PANW) has seen two analyst rating upgrades this week.
Analysts at Piper Sandler (PIPR) upgraded their rating on Palo Alto (PANW) to "overweight" and raised their price target on the stock from $200 to $225, according to data gathered by Yahoo Finance.
The shares are currently down 4.6% year-to-date, with the stock having closed Thursday's session at $173.55 per share.
Deutsche Bank (DBK.DE) also upgraded its rating to a "buy" and raised its price target from $200 to $220.
Read more: Stocks that are trending today
Brad Zelnick, managing director, software equity research at Deutsche Bank (DBK.DE), said in a note on Wednesday that his team upgraded the stock given its "thoughts on the health of the business, quality of its leadership, and forward prospects for the announced acquisition of CyberArk (CYBR)".
Palo Alto (PANW) announced at the end of July that it had agreed to buy Israeli rival CyberArk in a $25bn deal.
"With the stock underperforming broader cyber by 15% YTD and 11% since credible speculation of the acquisition, we think investor concerns are overblown," said Zelnick.
Shares in the Palo Alto (PANW) came under pressure following the release of its third quarter earnings in May, as the results failed to impress investors.
The cybersecurity company's third quarter revenue came in at $2.3bn, just above expectations, while adjusted earnings per share (EPS) were $0.80.
For the fourth quarter, Palo Alto (PANW) guided to total revenue in the range of $2.49bn to $2.51bn, representing year-over-year growth of between 14% and 15%.
Baidu (9888.HK, BIDU) – Releases second quarter earnings on Wednesday 20 August
In July, Baidu (9888.HK, BIDU) and ride-hailing app Uber (UBER) announced a multi-year partnership to deploy thousands of the Chinese company's Apollo Go autonomous vehicles on the Uber platform across multiple global markets.
The companies said that the first deployments are expected in Asia and the Middle East later this year.
Baidu's (9888.HK, BIDU) Hong Kong-listed shares rose following the news, though the stock is still trading just 5.3% in the green year-to-date.
In terms of financial performance, Baidu's (9888.HK, BIDU) total revenue was up 3% year-on-year in the first quarter to $4.47bn, though adjusted earnings before interest, tax, depreciation and amortisation (EBITDA) were down 13% year-on-year at $993m.
Read more: EU economic growth slows to 0.2% in second quarter
Robin Li, CEO of Baidu (9888.HK, BIDU), said that 7% growth in the company's core revenue was "driven by the accelerating momentum" of its AI cloud business.
"The strong performance of our AI cloud business underscores the growing market recognition of our distinctive strength in providing full-stack AI products and solutions with a highly competitive price-performance advantage," he said. "We also achieved a pivotal milestone in our robotaxi business, as Apollo Go expanded internationally by entering Dubai and Abu Dhabi."
"We are confident that our AI-first strategy positions us to remain at the forefront and to capture long-term growth opportunities in the AI era," Li added.
Other companies reporting next week include:
Monday 18 August
BATM Communications (BVC.L)
Thungela Resources (TGA.L)
Tuesday 19 August
IWG (IWG.L)
Tribal (TRB.L)
BHP (BHP.L)
Xiaomi (1810.HK)
Coloplast (COLO-B.CO)
Home Depot (HD)
Medtronic (MDT)
Amer Sports (AS)
Toll Brothers (TOL)
Wednesday 20 August
OSB (OSB.L)
Costain (COST.L)
Ithaca Energy (ITH.L)
Kenmare Resources (KMR.L)
Hong Kong Exchanges (0388.HK)
DFDS (DFDS.CO)
Lowe’s (LOW)
Analog Devices (ADI)
Estée Lauder (EL)
Coty (COTY)
Thursday 21 August
Hays (HAS.L)
Brambles (BXB.AX)
AIA (1299.HK)
Aegon (AGN.AS)
GN Store Nord (GN.CO)
Tessenderlo (TESB.BR)
Zoom Communications (ZM)
Dollar Tree (DLTR)
Friday 22 August
Meituan (3690.HK)
GoldFields (GFI.JO)
You can read Yahoo Finance's full calendar here.
Read more:
Download the Yahoo Finance app, available for Apple and Android.
If you would like to receive our free newsletter via email, simply enter your email address below & click subscribe.
 Follow us on Twitter
 Become our facebook fan
CONNECT WITH US
Tweets
Tweet with hash tag #miningfeeds or @miningfeeds and your tweets will be displayed across this site.
MOST ACTIVE MINING STOCKS
Daily Gainers
 CMC Metals Ltd. CMC Metals Ltd. |
CMB.V | +900.00% |
 Eden Energy Ltd Eden Energy Ltd |
EDE.AX | +200.00% |
| GoviEx Uranium Inc. |
GXU.V | +42.86% |
| Eagle Nickel Ltd. |
ENL.AX | +41.67% |
| Citigold Corp. Limited |
CTO.AX | +33.33% |
| Mount Burgess Mining NL |
MTB.AX | +33.33% |
| Exalt Resources Limited |
ERD.AX | +31.94% |
| Casa Minerals Inc. |
CASA.V | +30.00% |
| Cariboo Rose Resources Ltd |
CRB.V | +28.57% |
| Belmont Resources Inc. |
BEA.V | +28.57% |


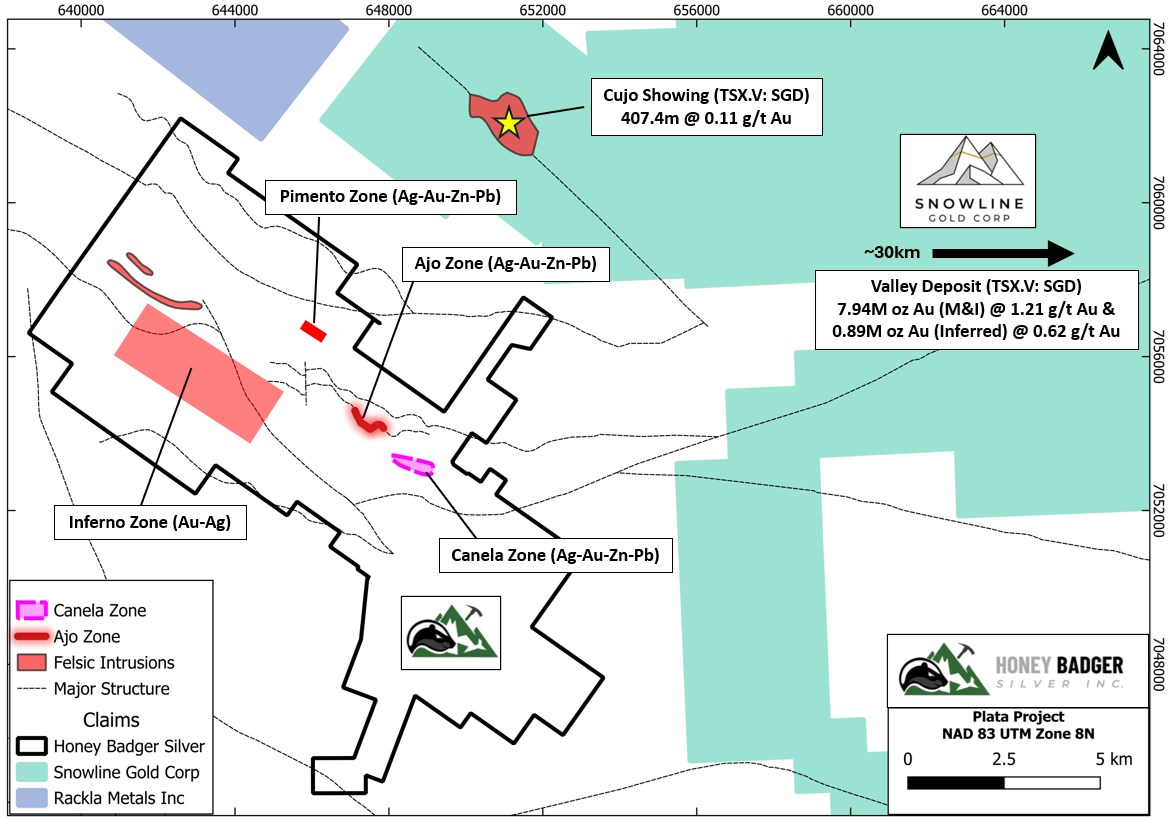
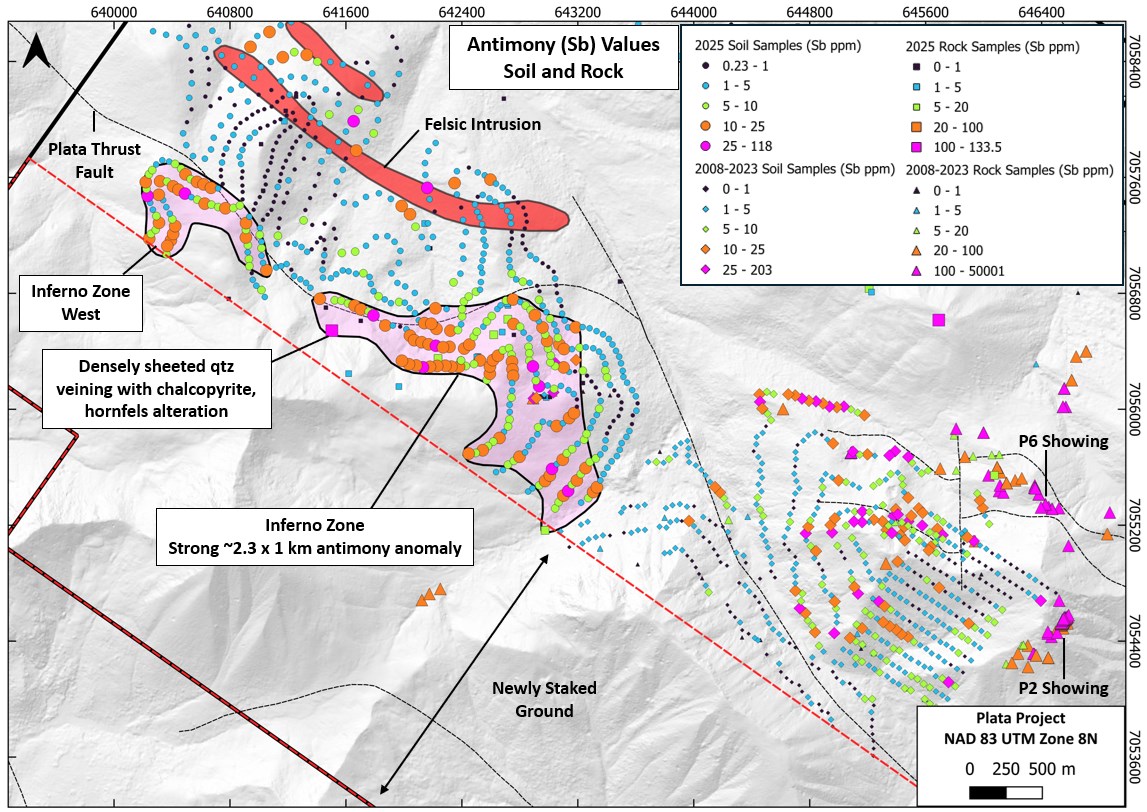
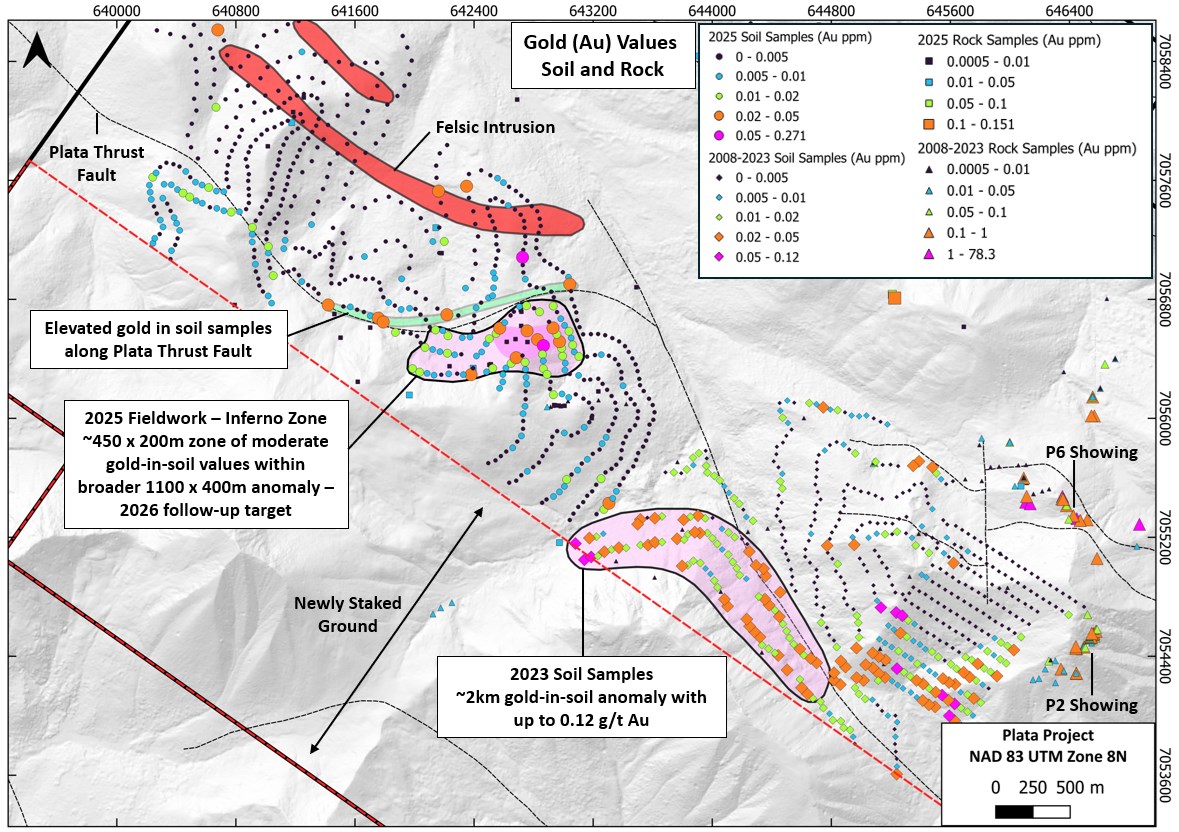
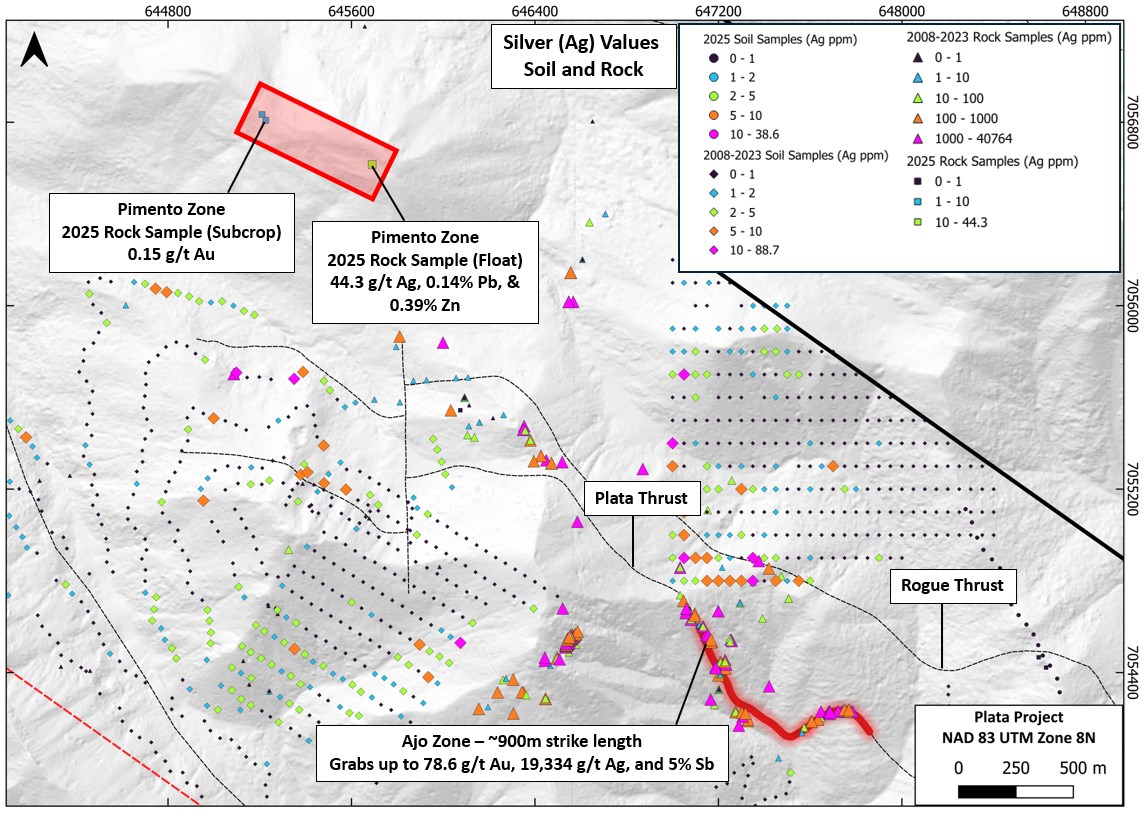