Written by Amy Legate-Wolfe at The Motley Fool Canada
If you’ve got $5,000 to invest and a decade to let it work, one name on the TSX stands out. This is a stock known for its operational momentum, long-term growth potential, and a valuation that still leaves room for upside. That’s Lundin Mining (TSX:LUN). The dividend stock quietly climbed more than 22% over the past year, rising from $8.94 to just under $15.75. Yet that move only tells part of the story. This is a copper-heavy producer with ambitions to become one of the world’s top 10 copper miners. And its recent performance suggests it’s not just talk.
What happened
In the past 12 months, Lundin stock has been busy reshaping its portfolio. The $1.4 billion sale of its European assets allowed it to pay off its term loan and bring net debt (excluding leases) down to just $135 million. This was a dramatic improvement in balance sheet flexibility. That’s especially important as the company pursues its massive Vicuña Project. This could eventually produce more than 500,000 tonnes of copper annually alongside significant gold and silver output.
Furthermore, in the second quarter of 2025, the dividend stock reaffirmed its full-year production guidance and even lowered cash cost projections. That’s thanks in part to strong performance at its Chapada mine, where costs hit their lowest level since 2021.
Operationally, Lundin stock is firing on multiple fronts. Q2 revenue came in at $937 million, up nearly 7% year over year, and adjusted earnings before interest, taxes, depreciation and amortization (EBITDA) rose to $394.7 million from continuing operations. Free cash flow (FCF) from operations was $211 million despite heavier-than-usual tax payments at Candelaria. Copper production reached 80,073 tonnes for the quarter, supported by healthy gold and nickel output. Chapada was a standout, producing over 11,000 tonnes of copper and more than 17,500 ounces of gold at cash costs of just $0.75 per pound. Even at Caserones, where grades were lower, cost reductions and favourable currency effects helped the bottom line.
More to come
The strategic case for Lundin stock over the next decade is rooted in copper demand. With electrification trends, renewable energy buildouts, and global infrastructure spending all requiring more copper, producers with long-life, low-cost assets are well-positioned. Lundin’s existing operations provide steady cash flow today. Meanwhile, its brownfield expansions and the Vicuña Project could transform its scale by the early 2030s. That growth pipeline is being developed with discipline, supported by a five-year outlook showing the ability to fund projects. All while maintaining shareholder returns through dividends and buybacks.
Of course, there are risks. Copper prices can be volatile, and Lundin’s earnings are sensitive to both commodity swings and operational hiccups at key mines. Large-scale projects like Vicuña carry execution and cost overrun risks, and while the balance sheet is much stronger now, funding billions in future capex will require careful capital allocation. There’s also the challenge of integrating production from multiple jurisdictions with different regulatory and political environments.
Still, for an investor with $5,000 and a 10-year timeframe, those risks may be worth taking. At a forward price-to-earnings (P/E) of about 21, the market seems to be pricing in steady performance but not fully reflecting the upside from Lundin’s long-term expansion. If copper prices remain supportive, or climb further, earnings could grow faster than expected, making today’s valuation look cheap in hindsight.
Bottom line
With a small but consistent dividend, a clear growth strategy, and operational results that are trending in the right direction, Lundin stock offers a compelling mix of current stability and future potential. The next decade could see it transform from a mid-tier producer into a global copper heavyweight, and getting in before that transition is fully priced in could make all the difference for patient investors.
The post $5,000 and a Decade to Invest? One Undervalued Canadian Stock to Consider Now appeared first on The Motley Fool Canada.
Should you invest $1,000 in Shopify right now?
Before you buy stock in Shopify, consider this:
The Motley Fool Stock Advisor Canada analyst team identified what they believe are the 15 best stocks for investors to buy now… and Shopify wasn’t one of them. The 15 stocks that made the cut could potentially produce monster returns in the coming years.
Consider MercadoLibre, which we first recommended on January 8, 2014 … if you invested $1,000 in the “eBay of Latin America” at the time of our recommendation, you’d have $24,427.64!*
Now, it’s worth noting Stock Advisor Canada’s total average return is 94%* – a market-crushing outperformance compared to 61%* for the S&P/TSX Composite Index. Don’t miss out on our top 15 list, available when you join Stock Advisor Canada.
* Returns as of July 15th, 2025
More reading
Fool contributor Amy Legate-Wolfe has no position in any of the stocks mentioned. The Motley Fool has no position in any of the stocks mentioned. The Motley Fool has a disclosure policy.
2025
RBC Capital Markets on Thursday recapped the earnings results of North American base metals equities
TSX:LUN 1 Year Share Price vs Fair Value
Explore Lundin Mining's Fair Values from the Community and select yours
Lundin Mining Corporation (TSE:LUN) recently posted some strong earnings, and the market responded positively. We have done some analysis, and we found several positive factors beyond the profit numbers.
TSX:LUN Earnings and Revenue History August 15th 2025
In order to understand the potential for per share returns, it is essential to consider how much a company is diluting shareholders. Lundin Mining expanded the number of shares on issue by 10% over the last year. Therefore, each share now receives a smaller portion of profit. To celebrate net income while ignoring dilution is like rejoicing because you have a single slice of a larger pizza, but ignoring the fact that the pizza is now cut into many more slices. You can see a chart of Lundin Mining's EPS by clicking here.
How Is Dilution Impacting Lundin Mining's Earnings Per Share (EPS)?
Unfortunately, Lundin Mining's profit is down 78% per year over three years. The good news is that profit was up 27% in the last twelve months. On the other hand, earnings per share are only up 21% over the same period. Therefore, the dilution is having a noteworthy influence on shareholder returns.
In the long term, earnings per share growth should beget share price growth. So Lundin Mining shareholders will want to see that EPS figure continue to increase. But on the other hand, we'd be far less excited to learn profit (but not EPS) was improving. For that reason, you could say that EPS is more important that net income in the long run, assuming the goal is to assess whether a company's share price might grow.
That might leave you wondering what analysts are forecasting in terms of future profitability. Luckily, you can click here to see an interactive graph depicting future profitability, based on their estimates.
How Do Unusual Items Influence Profit?
On top of the dilution, we should also consider the US$247m impact of unusual items in the last year, which had the effect of suppressing profit. It's never great to see unusual items costing the company profits, but on the upside, things might improve sooner rather than later. We looked at thousands of listed companies and found that unusual items are very often one-off in nature. And, after all, that's exactly what the accounting terminology implies. If Lundin Mining doesn't see those unusual expenses repeat, then all else being equal we'd expect its profit to increase over the coming year.
Our Take On Lundin Mining's Profit Performance
To sum it all up, Lundin Mining took a hit from unusual items which pushed its profit down; without that, it would have made more money. But unfortunately the dilution means that shareholders now own a smaller proportion of the company (assuming they maintained the same number of shares). That will weigh on earnings per share, even if it is not reflected in net income. After taking into account all these factors, we think that Lundin Mining's statutory results are a decent reflection of its underlying earnings power. With this in mind, we wouldn't consider investing in a stock unless we had a thorough understanding of the risks. While conducting our analysis, we found that Lundin Mining has 1 warning sign and it would be unwise to ignore this.
Our examination of Lundin Mining has focussed on certain factors that can make its earnings look better than they are. But there is always more to discover if you are capable of focussing your mind on minutiae. Some people consider a high return on equity to be a good sign of a quality business. While it might take a little research on your behalf, you may find this free collection of companies boasting high return on equity, or this list of stocks with significant insider holdings to be useful.
Have feedback on this article? Concerned about the content? Get in touch with us directly. Alternatively, email editorial-team (at) simplywallst.com.This article by Simply Wall St is general in nature. We provide commentary based on historical data and analyst forecasts only using an unbiased methodology and our articles are not intended to be financial advice. It does not constitute a recommendation to buy or sell any stock, and does not take account of your objectives, or your financial situation. We aim to bring you long-term focused analysis driven by fundamental data. Note that our analysis may not factor in the latest price-sensitive company announcements or qualitative material. Simply Wall St has no position in any stocks mentioned.
Written by Adam Othman at The Motley Fool Canada
Dips in the stock market often prompt many investors to take their money out of the market and park it somewhere they feel might be safer. As of this writing, the S&P/TSX Composite Index seems to be doing really well. The benchmark index for the Canadian stock market is up by over 25% from its 52-week low, indicating a bull market.
Despite the broader market being on the uptick, not every stock has been performing well. Savvier investors know that some of the best opportunities to invest in high-quality businesses is at lower prices. One Canadian stock that seems to be going against the broader market trend is Teck Resources Ltd. (TSX:TECK.B).
While down considerably from its 52-week high, this TSX copper stock boasts strong long-term growth potential. Today, we’ll take a look at why it might be an excellent pick for your self-directed portfolio despite its recent performance.
Teck Resources
Teck is a diversified mining company headquartered in Vancouver with a $21.9 billion market capitalization. The company’s core focus is on metallurgical resources, followed by copper and zinc, and it has oil sands operations in Canada, the US, Chile, and Peru. The company is ranked the second-largest seaborne metallurgical coal exporter and a top-three zinc mining company.
The company’s fiscal report for 2024 saw it post $283 million in net income and $9.1 billion in revenue. All the commodities it produces are essential materials for various applications, ranging from infrastructure to electric vehicles. The global demand for copper and zinc is only expected to grow in the coming years. The rising demand should, in turn, benefit the company and its investors.
The April 2025-ending first quarter for fiscal 2025 saw Teck report a 41.4% year-over-year increase in its revenue, hitting $2.3 billion compared to $1.6 billion from the same period last year. One of the reasons contributing to its performance on the stock market is the fine the company faces for lead and selenium contamination in British Columbia. The pollution issues its operations cause are a risk to its costs and reputation.
Foolish takeaway
Why might Teck Resources stock be a good investment, you ask? I think its focus on producing copper and zinc might be the best reason. Teck offloaded its steelmaking coal business a little over a year ago to focus more on zinc and copper. Thermal coal prices are volatile, limiting the company’s exposure to it. Meanwhile, copper and zinc are expected to become increasingly expensive in the coming years.
The long-term view is that green energy and infrastructure requirements will increase demand for the commodities it produces. Higher prices for the underlying commodity mean better margins for the mining company.
Despite all the potential positives, Teck isn’t a risk-free investment. Environmental regulations can change, and so can commodity prices. If the demand for electric vehicles slows down, the demand for copper might soften. However, the industry trends as we see them today point toward a better future for copper mining companies. Teck Resources offers diversified exposure to a wide mix of commodities with potentially high long-term-demand commodities. It can be a good investment at current levels.
The post Copper Price Changes: 1 Magnificent Copper Stock to Buy appeared first on The Motley Fool Canada.
Should you invest $1,000 in Shopify right now?
Before you buy stock in Shopify, consider this:
The Motley Fool Stock Advisor Canada analyst team identified what they believe are the 15 best stocks for investors to buy now… and Shopify wasn’t one of them. The 15 stocks that made the cut could potentially produce monster returns in the coming years.
Consider MercadoLibre, which we first recommended on January 8, 2014 … if you invested $1,000 in the “eBay of Latin America” at the time of our recommendation, you’d have $24,427.64!*
Now, it’s worth noting Stock Advisor Canada’s total average return is 94%* – a market-crushing outperformance compared to 61%* for the S&P/TSX Composite Index. Don’t miss out on our top 15 list, available when you join Stock Advisor Canada.
* Returns as of July 15th, 2025
More reading
Fool contributor Adam Othman has no position in any of the stocks mentioned. The Motley Fool has no position in any of the stocks mentioned. The Motley Fool has a disclosure policy.
2025
Applied Industrial Technologies AIT reported fourth-quarter fiscal 2025 (ended June 30, 2025) earnings of $2.80 per share, which surpassed the Zacks Consensus Estimate of $2.60. The bottom line increased 5.9% year over year.Net revenues of $1.22 billion beat the consensus estimate of $1.18 billion. The top line increased 5.5% year over year. Acquisitions boosted the top line by 6.5% while foreign-currency translation had a negative impact of 0.4%. Organic sales increased 0.2% year over year. Selling days had an adverse impact of 0.8%.For fiscal 2025, AIT reported net revenues of $4.6 billion, which increased 1.9% year over year. The company’s adjusted earnings were $10.12 per share, up 3.8% year over year.
Segmental Discussion
The Service Center-Based Distribution segment’s revenues, which contributed 66% to net revenues, totaled $779.2 million. On a year-over-year basis, the segment’s revenues decreased 1.5%. Our estimate for segmental revenues was $797.3 million. Organic sales decreased 0.4%. Foreign currency translation lowered sales by 0.6% while acquisitions boosted sales by 0.3%. Selling days had an unfavorable impact of 0.8% year over year. Segmental revenues were impacted by muted end-market demand.The Engineered Solutions segment’s revenues (formerly the Fluid Power & Flow Control segment), which contributed 34% to net revenues, totaled $445.5 million. On a year-over-year basis, the segment’s revenues increased 20.7%. Our estimate for the segment’s revenues was $382.1 million.Acquisitions boosted the top line by 19.7%. Organic sales increased 1.8% driven by an increase in order rate and solid demand across key growth verticals, including technology & automation. Selling days had an adverse impact of 0.8% year over year.
Applied Industrial Technologies, Inc. Price, Consensus and EPS Surprise
Applied Industrial Technologies, Inc. price-consensus-eps-surprise-chart | Applied Industrial Technologies, Inc. Quote
AIT’s Margin Profile
In the quarter, Applied Industrial’s cost of sales was up 5.7% year over year to $850 million. Gross profit was $374.7 million, up 5.2% from the year-ago quarter. The gross margin decreased to 30.6% from 30.7% in the year-ago quarter. Selling, distribution and administrative expenses (including depreciation) increased 10.5% year over year to $239.7 million. EBITDA was $153 million, reflecting a decrease of 0.3%.
AIT’s Balance Sheet & Cash Flow
In fiscal 2025, Applied Industrial had cash and cash equivalents of $388.4 million compared with $460.6 million at the end of fiscal 2024. Long-term debt was $572.3 million, in line with the figure reported at the end of the prior fiscal year.In the fiscal year, it generated net cash of $492.4 million from operating activities, indicating an increase of 32.6% from the year-ago quarter. Capital expenditures totaled $27.2 million, up 9.3% year over year. Free cash flow increased 34.2% year over year to $465.2 million.In fiscal 2025, AIT rewarded its shareholders with dividends of $63.7 million, up 14% year over year.
Applied Industrial’s Guidance
For fiscal 2026 (ending June 2026), Applied Industrial anticipates adjusted earnings to be in the range of $10-$10.75 per share. The Zacks Consensus Estimate for adjusted earnings is pegged at $10.52 per share. The company currently anticipates sales to increase in the range of 4-7% year over year. AIT expects the EBITDA margin to be in the range of 12.2-12.5%.
AIT’s Zacks Rank & Stocks to Consider
The company currently carries a Zacks Rank #4 (Sell). You can see the complete list of today’s Zacks #1 Rank (Strong Buy) stocks here.
Performance of Other Companies
Dover Corporation DOV reported earnings of $2.44 per share in second-quarter 2025, beating the Zacks Consensus Estimate of $2.39. This compares with earnings of $2.36 per share a year ago.Dover posted revenues of $2.05 billion in the quarter, surpassing the Zacks Consensus Estimate by 0.6%. This compares with year-ago revenues of $2.18 billion.Teck Resources Limited TECK came out with earnings of $0.27 per share in the second quarter of 2025, beating the Zacks Consensus Estimate of $0.2. This compares with earnings of $0.58 per share a year ago.Teck Resources posted revenues of $1.46 billion in the quarter, missing the Zacks Consensus Estimate by 8.7%. This compares with year-ago revenues of $2.83 billion. Packaging Corporation of America PKG reported earnings of $2.48 per share, beating the Zacks Consensus Estimate of $2.44. This compares with earnings of $2.2 per share a year ago.Packaging Corp. posted revenues of $2.17 billion in the quarter, surpassing the Zacks Consensus Estimate by 0.5%. This compares with year-ago revenues of $2.08 billion.
Want the latest recommendations from Zacks Investment Research? Today, you can download 7 Best Stocks for the Next 30 Days. Click to get this free report
Dover Corporation (DOV) : Free Stock Analysis Report
Applied Industrial Technologies, Inc. (AIT) : Free Stock Analysis Report
Packaging Corporation of America (PKG) : Free Stock Analysis Report
Teck Resources Ltd (TECK) : Free Stock Analysis Report
This article originally published on Zacks Investment Research (zacks.com).
Southern Copper Corporation (NYSE:SCCO) is one of the best copper stocks to buy according to hedge funds. On July 30, the company reported mixed second-quarter 2025 results. While sales were down year-over-year, attributed to lower copper prices, the company posted a modest net income growth.
Net sales for the quarter decreased 2% to $3.05 billion, primarily due to lower copper prices. However, the company delivered a 2% increase in net income to $973 million, affirming a solid cost structure and improved operational efficiency.
Southern Copper achieved a 3% reduction in operating costs to $1.46 billion as cash cost per pound of copper fell 17% to $0.63. Copper production in the quarter was down 1% year-over-year to 238,980 tons. Molybdenum production increased by 4% to 7,919 tons, as zinc production rose 56% to 45,899 tons.
The company has also initiated an ambitious capital investment program designed to enhance production capacity. The board has already approved some projects expected to add 156,000 tons of copper production. The projects include the Tía María project in Peru, with a 120,000-ton copper capacity, and Michiquillay in Peru, with a 225,000-ton copper capacity.
Southern Copper Corporation (NYSE:SCCO) is a mining company focused on copper production. It also produces other metals like molybdenum, silver, and zinc. The company operates mines, smelting, and refining facilities, primarily in Peru and Mexico.
While we acknowledge the potential of SCCO as an investment, we believe certain AI stocks offer greater upside potential and carry less downside risk. If you're looking for an extremely undervalued AI stock that also stands to benefit significantly from Trump-era tariffs and the onshoring trend, see our free report on the best short-term AI stock.
READ NEXT: 10 Best EV Penny Stocks to Buy According to Hedge Funds and 10 Best Performing Crypto Stocks So Far in 2025.
Disclosure: None. This article is originally published at Insider Monkey.
Vancouver, British Columbia–(Newsfile Corp. – August 13, 2025) – CopperCorp Resources Inc. (TSXV: CPER) (OTCQB: CPCPF) (FSE: NU0) ("CopperCorp" or the "Company") is pleased to announce the appointment of Alan Coutts to its Board of Directors, effective immediately.
Mr. Coutts is a mining executive with over 35 years of global experience in mineral exploration, project development, mine operations, and corporate leadership in both Australia, Canada, and other international jurisdictions.
Most recently, Mr. Coutts served as President and CEO of Noront Resources Ltd., which was acquired by Wyloo Metals in April 2022 for approximately C$650 million following a high-profile bidding contest with BHP. This acquisition centred on Noront's flagship Eagle's Nest Ni-Cu-PGE project in Ontario's Ring of Fire district. After the transaction, Mr. Coutts joined Wyloo's Advisory Board, serving a two-year term.
Career Highlights:
-
2008-2013 Executive General Manager & Managing Director, Xstrata Nickel Australasia (Perth, Australia): Oversaw three producing nickel mines and two processing plants in Western Australia with over 800 employees, supported a development project in Tanzania, and served on the board of the US$5B Koniambo Nickel Project in New Caledonia.
-
2003-2008 General Manager of the "Brunswick 12" mine, Noranda Mines (now Xstrata) (New Brunswick, Canada): Managed a 10,000 t/day underground Cu-Pb-Zn-Ag operation with 850 employees.
-
1999-2003 General Superintendent, Falconbridge Raglan mine (Quebec Arctic): Led underground and open-pit nickel sulphide operations with 450 employees.
-
Earlier roles included exploration and operational positions in Canada and Sweden.
Stephen Swatton, President and CEO of CopperCorp, commented:
"We are thrilled to welcome Alan to CopperCorp's board. His proven track record in mine development, operations, and strategic exploration, combined with his experience guiding large-scale battery metals-focused projects, aligns perfectly with our vision. There are strong parallels between Noront's large land package and CopperCorp's position in western Tasmania, and Alan's insight will be invaluable as we advance exploration on our two highly prospective copper-gold belts through 2025 and into 2026."
Alan Coutts, Director, added:
"I am pleased to join the board of CopperCorp. I'm impressed with the quality of the technical team and the outstanding land package that has been assembled in this highly prospective, yet somewhat underappreciated, historical mining district. The insatiable demand for copper over the upcoming decade is well documented and the timing of the Razorback drilling program in the current commodity cycle is optimal. I look forward to getting back to Australia and visiting the property later this year to review the drilling progress.
In my previous position Noront became the subject of a successful bid by Wyloo in 2022, largely driven by the quality, size and prospectivity of the entire land package which contained many of the key battery minerals required for global decarbonization. I am excited to play a part in another initiative with a similar strategy."
In connection with his appointment, CopperCorp has granted Mr. Coutts 400,000 incentive stock options in accordance with the Company's omnibus incentive plan. The options are exercisable at C$0.165 per share for five years, subject to certain vesting provisions and TSX Venture Exchange approval.
About CopperCorpCopperCorp is focused on the exploration and development of its Skyline and AMC copper-gold-REE projects in western Tasmania, Australia.
Contact:Stephen SwattonPresident, CEO & DirectorEmail: stephen@coppercorpinc.com
For additional information, please visit:Website: www.coppercorpinc.comSEDAR+: www.sedarplus.ca
Neither TSX Venture Exchange nor its Regulation Service Provider accepts responsibility for the adequacy or accuracy of this release.
To view the source version of this press release, please visit https://www.newsfilecorp.com/release/262313
BHP Group Limited (NYSE:BHP) is one of the best copper stocks to buy according to hedge funds. On August 6, reports emerged indicating that the company, in partnership with Lundin, plans to apply for a new investment incentive scheme in Argentina.
Pixabay/Public Domain
The company is eyeing the incentive to support the development of the Vicuna copper project. The Large Investment Incentive Regime, which began last year, seeks to boost activities in the mining sector by offering tax breaks. The scheme also provides access to international dispute courts for investments exceeding $200 million.
In addition to the Argentinian push, BHP Group is fresh from reporting record copper and iron ore production for fiscal year 2025. The milestone came despite the company experiencing a delay and potential cost overrun at its Jansen potash project in Canada that reached $1.7 billion.
BHP Group Limited (NYSE:BHP) is a global resources company focused on producing a range of commodities essential for various industries and the global transition to a more sustainable future. They are a leading producer of iron ore, copper, and metallurgical coal, and are also involved in nickel, potash, and other minerals.
While we acknowledge the potential of BHP as an investment, we believe certain AI stocks offer greater upside potential and carry less downside risk. If you're looking for an extremely undervalued AI stock that also stands to benefit significantly from Trump-era tariffs and the onshoring trend, see our free report on the best short-term AI stock.
READ NEXT: 10 Best EV Penny Stocks to Buy According to Hedge Funds and 10 Best Performing Crypto Stocks So Far in 2025.
Disclosure: None. This article is originally published at Insider Monkey.
Teck Resources Limited (NYSE:TECK) is one of the top copper stocks to buy, according to hedge funds. On July 28, analysts at Benchmark reiterated a ‘Buy’ rating on the stock but cut their price target to $48 from $55.
The price target adjustment follows the company’s second-quarter results, whereby adjusted EBITDA came in at C$722 million, below consensus estimates of C$730 million. The earnings miss came as strong performance in the Zinc segment offset lower copper sales. Second-quarter revenue totaled C$2.0 billion, with an adjusted EBITDA of C$722 million.
During the quarter, the company faced operational challenges at its QB copper project as development work at the Tailings Management facility limited online time. Sales were also affected by trailed production due to a shipload outage, forcing Teck Resources to lower its full-year production for the QB project. Consequently, the company produced 109,100 tons of copper.
The Teck Resources board has approved the Highland Valley Copper Mine Life Extension, expected to produce an average of 132,000 metric tons of copper annually from 2028 to 2046 for C$2.1 billion to C$2.4 billion.
Teck Resources Limited (NYSE:TECK) is a Canadian mining company that explores, develops, and produces various minerals. It focuses on producing essential metals for global development and the energy transition, including copper and zinc.
While we acknowledge the potential of TECK as an investment, we believe certain AI stocks offer greater upside potential and carry less downside risk. If you're looking for an extremely undervalued AI stock that also stands to benefit significantly from Trump-era tariffs and the onshoring trend, see our free report on the best short-term AI stock.
READ NEXT: 10 Best EV Penny Stocks to Buy According to Hedge Funds and 10 Best Performing Crypto Stocks So Far in 2025.
Disclosure: None. This article is originally published at Insider Monkey.
Teck Resources Limited (NYSE: TECK) is one of the best commodity stocks to buy now. On August 8, 2025, Wells Fargo analyst Tiago Fauth reiterated an Overweight rating on the Canadian miner and set a $101 price target, describing it as “one of the most attractive risk/rewards” in his coverage.
Fauth pointed to Teck’s strong liquidity, with a current ratio of about 3.47, and argued that market skepticism does not match the company’s solid fundamentals and valuable exposure to long-term copper demand.
Wells Fargo Backs Teck Resources as Top Copper Play Despite Sector Caution
Pixabay/Public Domain
The upbeat view from Wells Fargo comes as other firms take a more measured stance. Benchmark maintained a Buy rating on July 28 but lowered its target from $55 to $48. B. Riley and JPMorgan have moved to Neutral, citing operational challenges at the Quebrada Blanca Phase 2 project and softer near-term expectations. Jefferies and Raymond James remain constructive but have also trimmed price targets.
Teck Resources is a diversified miner, headquartered in Vancouver, with major operations in copper, zinc, steelmaking coal and energy. Its assets span Canada, Chile and the United States, and it is positioning copper at the center of its growth strategy to capitalize on the global energy transition.
While we acknowledge the potential of TECK as an investment, we believe certain AI stocks offer greater upside potential and carry less downside risk. If you're looking for an extremely undervalued AI stock that also stands to benefit significantly from Trump-era tariffs and the onshoring trend, see our free report on the best short-term AI stock.
READ NEXT: 30 Stocks That Should Double in 3 Years and 11 Hidden AI Stocks to Buy Right Now.
Disclosure: None.
Applied Industrial Technologies, Inc. AIT is scheduled to release fourth-quarter fiscal 2025 (ended June 2025) results on Aug. 14, before market open.The Zacks Consensus Estimate for fiscal fourth-quarter earnings has remained steady in the past 60 days. The company has an impressive earnings surprise history, having beat the consensus estimate in each of the preceding four quarters, the average surprise being 6.2%.The consensus estimate for revenues is pegged at $1.18 billion, indicating an increase of 1.7% from the year-ago quarter’s figure. However, the consensus estimate for adjusted earnings is pinned at $2.60 per share, indicating a decrease of 1.5% from the year-ago quarter’s figure.Let's see how things have shaped up for AIT this earnings season.
Factors to Note
Solid momentum in the technology-related fluid power end market is likely to have supported the Engineered Solutions segment. Favorable order trends across automation, technology, mobile and industrial verticals are likely to have aided the segment’s revenues. We expect the segment’s revenues to be $382.1 million, implying an increase of 3.5% from the year-ago number.Focus on improving the product line, value-added services and initiatives to drive operational excellence are expected to have driven AIT’s top line. Also, the company’s investments to expand automation, industrial Internet of Things and digital offerings like smart vision and mobile robots are likely to have been advantageous.Synergistic gains from the acquisitions made by the company are expected to have boosted revenues. The May 2024 acquisition of Grupo Kopar, which expanded its automation platform and extended its footprint into Mexico, is expected to have bolstered AIT’s top-line performance. However, AIT is expected to have put up a weak show across the Service Center Based Distribution segment due to reduced maintenance, repair and operations (MRO) spending, lower capital maintenance projects and prolonged customer plant shutdowns.Rising selling, distribution and administrative expenses, due to higher costs associated with acquired businesses, are likely to have dented Applied Industrial’s margins and profitability. For the quarter under review, we anticipate Applied Industrial’s gross margin to be 30.4%, indicating a decline of 30 basis points on a year-over-year basis.
Applied Industrial Technologies, Inc. Price and EPS Surprise
Applied Industrial Technologies, Inc. price-eps-surprise | Applied Industrial Technologies, Inc. Quote
Earnings Whispers
Our proven model does not conclusively predict an earnings beat for AIT this time around. The combination of a positive Earnings ESP and a Zacks Rank #1 (Strong Buy), 2 (Buy) or 3 (Hold) increases the odds of an earnings beat, which is not the case here, as elaborated below.Earnings ESP: Applied Industrial has an Earnings ESP of 0.00% as both the Most Accurate Estimate and the Zacks Consensus Estimate are pegged at $2.60. You can uncover the best stocks before they’re reported with our Earnings ESP Filter.Zacks Rank: Applied Industrial presently carries a Zacks Rank #4 (Sell).
You can see the complete list of today’s Zacks #1 Rank stocks here.
Performance of Other Companies
Dover Corporation DOV reported earnings of $2.44 per share in second-quarter 2025, beating the Zacks Consensus Estimate of $2.39. This compares with earnings of $2.36 per share a year ago.Dover posted revenues of $2.05 billion in the quarter, surpassing the Zacks Consensus Estimate by 0.6%. This compares with year-ago revenues of $2.18 billion.Teck Resources Limited TECK came out with earnings of $0.27 per share in the second quarter of 2025, beating the Zacks Consensus Estimate of $0.2. This compares with earnings of $0.58 per share a year ago.Teck Resources posted revenues of $1.46 billion in the quarter, missing the Zacks Consensus Estimate by 8.7%. This compares with year-ago revenues of $2.83 billion. Packaging Corporation of America PKG reported earnings of $2.48 per share, beating the Zacks Consensus Estimate of $2.44. This compares with earnings of $2.2 per share a year ago.Packaging Corp. posted revenues of $2.17 billion in the quarter, surpassing the Zacks Consensus Estimate by 0.5%. This compares with year-ago revenues of $2.08 billion.
Want the latest recommendations from Zacks Investment Research? Today, you can download 7 Best Stocks for the Next 30 Days. Click to get this free report
Dover Corporation (DOV) : Free Stock Analysis Report
Applied Industrial Technologies, Inc. (AIT) : Free Stock Analysis Report
Packaging Corporation of America (PKG) : Free Stock Analysis Report
Teck Resources Ltd (TECK) : Free Stock Analysis Report
This article originally published on Zacks Investment Research (zacks.com).
Toronto, Ontario–(Newsfile Corp. – August 13, 2025) – Honey Badger Silver Inc. (TSXV: TUF) (OTCQB: HBEIF) ("Honey Badger" or the "Company") is pleased to provide an update from its highly promising 2025 summer field program at its 100%-owned Plata project in the Yukon.
The Company is now awaiting assays which could lead to the possibility of drilling these new targets very soon. This news release presents results obtained since the Company's news release of a few weeks ago (July 30, 2025: "Honey Badger Discovers Promising Sheeted Veins in Multiple Zones over 18km at Plata, Yukon") and highlights the discovery of even more 'sheeted vein' zones.
The Company's Executive Chairman, Chad Williams, commented, "Honey Badger has discovered numerous auspicious geologic targets that absolutely merit follow up work. Plata is shaping up to be a game-changer for Honey Badger. We continue to identify many new promising geologic targets especially on our new claims. We are particularly excited by the recognition of additional 'sheeted vein' zones that may indicate the presence of reduced intrusion-related gold (RIRG) systems, similar to those found at the directly adjacent Rogue project, owned by Snowline Gold (TSXV: SGD), containing 7.94M oz Au (M&I) and 0.89M oz Au (Inferred) (see SGD news release dated May 15, 2025)."
Note: The QP has not independently verified the Rogue Mineral Resource Estimate (MRE) quoted above. The Rogue MRE is not necessarily indicative of mineralization on the property that is the subject of the disclosure.
Summary
– Extended the Sheeted Vein Zone at Northwest Plata: Honey Badger has uncovered additional 'sheeted vein' systems, which increases the total area prospective for RIRG mineralization to ~4 x 5 km within the newly staked claim blocks, with significant potential to discover more (Fig. 1). Central to the sheeted vein systems are interpreted Mayo Suite felsic intrusions found over a 2.3 x 0.67 km area. Importantly, the team has successfully identified the western extent of the Rogue Thrust Fault in this area, a key geological boundary known to host mineralization in the region.
– Aho Zone Materially Expanded: The central claims host the high-grade, past-producing Aho silver zone. The team has uncovered an 810 x 230 m zone of quartz veining and sulfide mineralization overlapping high-grade silver geochemical anomalies (Fig. 1). Two additional zones with similar geology have also been identified near key geological structures, including the Plata and Rogue Thrust Faults.
– Geophysical Low at South Plata: Quartz veining and felsic intrusive float have been discovered at South Plata over a magnetic low geophysical anomaly. No known work has ever been completed here (Fig. 1).
Next Steps:
Assays for 102 rock samples and 568 soil samples are expected in the coming weeks. Results of these assays, coupled with further fieldwork, is expected to help guide drilling before year-end.
Figure 1: Plata property, showing the newly staked claim outline (red) and summary observations from the recent field program.
To view an enhanced version of this graphic, please visit:https://images.newsfilecorp.com/files/3204/262310_b7d9cc91049b68b0_001full.jpg
Notes:
The Cujo intercept is from a Snowline Gold (TSXV: SGD) News Release dated November 9, 2023. The QP has been unable to verify the information.
The Cujo intercept is not necessarily indicative of mineralization that may be present at the Plata project.
Geological Discussion
Key results of the recent exploration fieldwork completed at Plata since the press release of a few weeks ago (July 30th, 2025) include:
Northwest Plata (newly staked ground)
Identification of potential Mayo-suite felsic intrusions and presence of hornfels alteration, sulfide mineralization, and quartz veining (locally sheeted) observed for over 2.7 km in strike length towards the southern claim margin (Figures 1, 2 and 3). The presence of potential Mayo-suite intrusive rock is important because of their close association with gold and silver mineralization in the region. Hornfels alteration is significant because it indicates that the host rock has been altered due to proximity to an intrusion.
Several occurrences of felsic plutonic rock interpreted to represent Mayo Suite Intrusions were identified in both outcrop and float over a 2.3 x 0.67 km area in the newly staked ground in the northwest of the property towards the southern claim boundary. Samples of the felsic intrusive rock are noted as granodiorite to quartz porphyry and range from fresh-looking to intensely sericite and clay altered with occasional fine-grained pyrite observed (Fig. 2).
Extensive quartz veining (locally sheeted and stockwork) with associated silicification, hornfels alteration, oxidation and sulfide mineralization has been observed within interbedded mudstones, shales, chert and lesser sandstone over a 2.7 x 2 km zone that overlaps with the mapped felsic intrusive units (Fig. 2 and 3).
Field observations in this area describe several outcrops with densely sheeted quartz veins and local stockwork textures, as well as rare chalcopyrite and malachite mineralization. Many of the field observations also highlight the presence of disseminated to stringer pyrite associated with the presence of the oxidized quartz veining (Fig. 2 and 3).
Mapped the western extension of the Rogue Thrust Fault
Mapping was continued of the interpreted Rogue Thrust Fault that separates the Mt. Christie Formation and the Earn Group. This fault represents an important structural boundary and potential mineralizing fluid pathway in this area.
Figure 2: (A) Sericite altered granodiorite interpreted to represent Mayo Suite Intrusive rock; (B) Large outcrop of densely sheeted quartz veining with blebby chalcopyrite (<0.5%) mineralization. Veining occurs perpendicular to bedding in massive black chert of the Earn Group proximal to the mapped granodiorite intrusions in the newly staked ground in the NW of the property. Hammer (24 inches) for scale.
To view an enhanced version of this graphic, please visit:https://images.newsfilecorp.com/files/3204/262310_b7d9cc91049b68b0_002full.jpg
East Central Plata (Aho Zone)
Discovered several new zones comprising hornfels altered and silicified host rock with associated quartz veining and sulfide mineralization to the east and southeast of the Aho Zone.
The largest zone is an ~810 x 230 m area that partially overlaps with a historic 1000 x 300 m Ag soil anomaly with silver in soil up to 50 g/t Ag (Assessment Report 091705, by A. Harman, 1976). This zone includes silicified and hornfels altered mudstones, siltstones and chert with quartz veining, disseminated and stringer pyrite, as well as local galena and sphalerite stringers and blebs.
Another zone beginning ~900 m to the east of the Aho zone in proximity to the Plata Thrust Fault extends for approximately 1.1 km towards the eastern claim boundary and comprises a series of limestone, shale, and sandstone outcrops hosting extensive sheeted and stockwork quartz-calcite veining with associated oxidation (Fig. 3).
Yet another zone comprising several outcrops hosting oxidized sheeted and stockwork quartz veining was observed to the northeast of the Aho Zone in proximity to the Rogue Thrust Fault.
Mapped eastern extensions of the Plata and Rogue Thrust Faults
Extended both the Plata and Rogue Thrust Faults to the East of the Aho Zone, which is an ~800 m long zone of semi-continuous high-grade silver, gold, zinc and lead mineralization present along the Plata Thrust Fault.
Figure 3: (A) Oxidized quartz veining hosted in hornfels altered siltstone of the Mt. Christie Formation collected adjacent to the mapped felsic intrusive units in the NW of the property; (B) Strong recrystallization of originally black chert interpreted to represent hornfels alteration due to proximity to mapped intrusive units in the NW of the property; (C) Quartz veining with associated strong oxidation and fine-grained sulfide veinlets hosted in a chert outcrop SE of the Aho Zone.
To view an enhanced version of this graphic, please visit:https://images.newsfilecorp.com/files/3204/262310_b7d9cc91049b68b0_003full.jpg
Major Takeaways of the Completed Summer Field Work Program:
-
A total of 102 rock samples and 569 soil samples were taken during this initial program. Assays are pending.
-
Confirmed the presence of felsic plutonic rocks interpreted to be Mayo Suite Intrusions occurring throughout the newly staked ground in the northwest of the property (Fig. 1).
-
Newly discovered extensive sheeted quartz veins with associated oxidation and sulfide mineralization throughout all traversed areas in the recently staked ground in the northwest of the property that defines a new highly prospective area for potential RIRG mineralization at least 5 x 4 km in size (Fig. 1).
-
Discovery of local quartz veining and felsic intrusive float within newly staked ground in 2024 over a magnetic low geophysical anomaly in the south end of the property (Fig. 1).
-
Identified several new zones comprising hornfels altered and silicified host rock with associated oxidized quartz veining and sulfide mineralization to the east and southeast of the Aho Zone (Fig. 1).
-
Mapped extensions of the mineralized Plata and Rogue Thrust Faults to the West and East.
About Plata
Plata is located in east-central Yukon within the Tombstone Gold Belt and is a past producing high-grade silver property that produced about 290,000 ounces of silver (Ag) from small-scale mining of high-grade veins that are exposed at surface (Carlson, G.G., 2010, "Technical Report Describing Exploration and Development at the Plata Project, located in the Mayo Mining District, East-Central Yukon", report prepared for Platoro West Holdings Inc.). Ore was mined and flown by fixed wing aircraft to Idaho for processing. Historical exploration at Plata has primarily focused on the outcropping high-grade silver veins. These are analogous to the rich Keno Hill Silver Mine in the Yukon, one of the highest-grade silver deposits in the world, now operated by Hecla Mining. While the analogy to Keno Hill remains valid, the Company has continued to develop its understanding of Plata as part of a larger "Snowline-style" mineralized system. Understanding how Plata might fit into a Reduced Intrusion Related Gold System (RIRGS) like Snowline Gold's Rogue and Valley deposits adds the potential for a large gold deposit in addition to the high-grade silver vein potential.
Qualified Person
Technical information in this news release has been approved by Dorian L. (Dusty) Nicol (PG, FAusIMM), a director and technical advisor of the Company, who is a Qualified Person (QP) for the purpose of National Instrument 43-101.
About Honey Badger Silver Inc.
Honey Badger Silver is a silver company. The company is led by a highly experienced leadership team with a track record of value creation backed by a skilled technical team. Our projects are located in areas with a long history of mining, including the Sunrise Lake project with a historic resource of 12.8 Moz of silver at a grade of 262 g/t silver (and 201.3 million pounds of zinc at a grade of 6% zinc) Indicated and 13.9 Moz of silver at a grade of 169 g/t silver (and 247.8 million pounds of zinc at a grade of 4.4% zinc) Inferred(1) located in the Northwest Territories and the Plata high grade silver project located 165 km east of Yukon's prolific Keno Hill and adjacent to Snowline Gold's Rogue discovery. The Company's Clear Lake Project in the Yukon Territory has an unclassified historic resource of 5.5 Moz of silver at a grade of 22 g/t silver and 1.3 billion pounds of zinc at a grade of 7.6% zinc(2). The Company also has a significant land holding at the Nanisivik Mine Area located in Nunavut, Canada that produced over 20 Moz of silver between 1976 and 2002(3). A qualified person has not done sufficient work to classify the foregoing historical resources as current mineral resources, and the Company is not treating the estimates as current mineral resources. The historical resource estimates are provided solely for the purpose as an indication of the volume of mineralization that could be present. Additional work, including verification drilling / sampling, will be required to verify any of the historical estimates as a current mineral resources.
(1) Sunrise Lake 2003 RPA historic resource: Indicated 1.522 million tonnes grading 262 grams/tonne silver, 6.0% zinc, 2.4% lead, 0.08% copper, and 0.67 grams/tonne gold and Inferred 2.555 million tonnes grading 169 grams/tonne silver, 4.4% zinc, 1.9% lead, 0.07% copper, and 0.51 grams/tonne gold.
(2) Clear Lake 2010 SRK historic Resource: Inferred 7.76 million tonnes grading 22 grams/tonne silver, 7.6% zinc, and 1.08% lead.
(3) Geological Survey of Canada, 2002-C22, "Structural and Stratigraphic Controls on Zn-Pb-Ag Mineralization at the Nanisivik Mississippi Valley type Deposit, Northern Baffin Island, Nunavut; by Patterson and Powis."2) Clear Lake 2010 SRK historic Resource: Inferred 7.76 million tonnes grading 22 grams/tonne silver, 7.6% zinc, and 1.08% lead.
ON BEHALF OF THE BOARD,
Chad Williams, Executive Chairman
Sonya Pekar Investor Relationsspekar@honeybadgersilver.com | +1 (647) 498-8244
For more information, please visit our website www.honeybadgersilver.com
Neither the TSX Venture Exchange nor its Regulation Services Provider (as that term is defined in the policies of the TSX Venture Exchange) accepts responsibility for the adequacy or accuracy of this release.
Cautionary Note Regarding Forward-Looking Information
This news release contains "forward-looking information" within the meaning of the applicable Canadian securities legislation that is based on expectations, estimates, projections and interpretations as at the date of this news release. Any statement that involves discussions with respect to predictions, expectations, interpretations, beliefs, plans, projections, objectives, assumptions, future events or performance (often but not always using phrases such as "expects", or "does not expect", "is expected", "interpreted", "management's view", "anticipates" or "does not anticipate", "plans", "budget", "scheduled", "forecasts", "estimates", "believes" or "intends" or variations of such words and phrases or stating that certain actions, events or results "may" or "could", "would", "might" or "will" be taken to occur or be achieved) are not statements of historical fact and may be forward-looking information and are intended to identify forward-looking information. This forward-looking information is based on reasonable assumptions and estimates of management of the Company at the time such assumptions and estimates were made, and involves known and unknown risks, uncertainties and other factors which may cause the actual results, performance or achievements of Honey Badger to be materially different from any future results, performance or achievements expressed or implied by such forward-looking information.
Such factors include, but are not limited to, risks relating to capital and operating costs varying significantly from estimates; delays in obtaining or failures to obtain required governmental, environmental or other project approvals; uncertainties relating to the availability and costs of financing needed in the future; changes in equity markets; inflation; fluctuations in commodity prices; delays in the development of projects; other risks involved in the mineral exploration and development industry; and those risks set out in the Company's public documents filed on SEDAR+ (www.sedarplus.ca) under Honey Badger's issuer profile. Although the Company believes that the assumptions and factors used in preparing the forward-looking information in this news release are reasonable, undue reliance should not be placed on such information, which only applies as of the date of this news release, and no assurance can be given that such events will occur in the disclosed timeframes or at all. The Company disclaims any intention or obligation to update or revise any forward-looking information, whether as a result of new information, future events or otherwise, other than as required by law.
To view the source version of this press release, please visit https://www.newsfilecorp.com/release/262310
Consortium signing ceremony
Singapore, Aug. 12, 2025 (GLOBE NEWSWIRE) — An industry consortium comprised of leading steelmakers ArcelorMittal Nippon Steel India, JSW Steel, Hyundai Steel Company and other value chain players, BHP, Chevron, Mitsui & Co., Ltd. (the Consortium), are undertaking a pre-feasibility study to assess the development of Carbon Capture, Utilisation and Storage (CCUS) hubs across Asia.
The CCUS Hub study is the first independent industry-led study of its kind in Asia and will examine the technical and commercial pathways to utilising CCUS in hard-to-abate industries across Asia. The study will focus on the potential to develop large-scale projects which can repurpose, or store, captured carbon dioxide (CO2).
By leveraging shared infrastructure and economies of scale, the study will seek potential applications for captured CO2 in industrial processes, or transport captured CO2 via pipeline or shipping to storage sites in Asia or Northern Australia.
The plan is for each participant in the study to be included in at least one hub, and the study will deliver conceptual development strategies for each hub including cost and schedule estimates, and potential commercialisation pathways.
The study will also look at non-technical enablers required to make CCUS hubs a reality, for example regulatory assessments including intra and inter-regional assessments of CCUS and cross border transport.
The Consortium, which is open to additional members joining and contributing to the study, has appointed Hatch as Project Management Officer in collaboration with Global CCS Institute, McDaniel, and Pace CCS.
The study is expected to conclude at the end of 2026, with findings to be shared publicly to promote broader industry learning and support the development of enabling policy and regulatory frameworks.
A role for CCUS is well represented in a number of external global climatic scenarios. Carbon capture technologies used in a range of existing industrial applications are relatively mature, and able to integrate with existing facilities.
The Consortium is prioritising the next important step – the study of scalable utilisation and storage solutions to test the potential for broader adoption to support decarbonisation, especially in regions where regulatory hurdles and market maturity limit progress.
By concentrating on regional hubs, the Consortium’s study will look to find ways to solve the challenge of scale by aggregating captured carbon into sufficiently large quantities to:
-
Optimise the unit cost of capture, transportation, and storage through economies-of-scale
-
Provide sufficient scale for economic utilisation solutions
-
Unlock novel solutions for multiple hard-to-abate industries at once, to enable regional decarbonisation efforts to be accelerated, and/or
-
Ensure cost and risk is appropriately shared among interested parties.
Comment from Dr Ben Ellis, Vice President Marketing Sustainability, BHP
“BHP is committed to supporting our steelmaking customers on their journey to decarbonise the industry.
With more than 1 billion tonnes of production a year in Asia coming from blast furnace capacity that is relatively early in its production life, it’s important for industry to progress technologies to decarbonise existing steelmaking assets while new commercial pathways to decarbonise steelmaking are developed over time.
By leveraging shared knowledge and resources with our partners, we are investing in support for innovative solutions—like the potential of CCUS—that we see as an essential part of decarbonising hard-to-abate sectors such as steelmaking.”
Comment from Dr. Arvind Bodhankar, the Chief Sustainability Officer at ArcelorMittal Nippon Steel India (AM/NS India)
"At AM/NS India, we recognise that the future of steel is inextricably linked to the well-being of our planet and the generations to come. The choices we make today will fundamentally shape the next generation, far more than our own. This profound responsibility underpins our commitment, which extends well beyond the delivery of world-class steel. It is this shared vision that has led to the formation of a robust consortium, which will enable all stakeholders to strategically undertake pioneering initiatives not only to decarbonise steelmaking but also set new benchmarks in industrial practices. For AM/NS India, the priority is to spearhead a new era of industrial responsibility and leadership, with the clear purpose of accelerating India's journey towards the net-zero goal and significantly enhancing its global competitiveness."
Comment from Prabodha Acharya, the Chief Sustainability Officer at JSW Group
“Sustainability is a value that lies at the very core of JSW's Sustainability Vision that shapes the organization's strategic goals and priorities.
We remain committed to transforming our sustainability vision into reality with specific targets and commitments. We aim to reduce our CO2 emission intensity in steelmaking by 42% by 2030 from a base year of 2005 and achieving net neutral carbon emissions by 2050. This commitment to decarbonization has already progressed well and achieved a reduction of carbon emissions intensity by 30% against our 2005 baseline.
However, we believe that, CCUS has to be developed to become a financially viable decarbonization lever which would be crucial to achieve near zero emissions in the steel sector. Partnerships and collaboration to accelerate the development and deployment of CCUS is essential, and this consortium would help pave the way forward”.
Comment from Yonghee Kim, Vice President of the Process R&D Sub-division, Hyundai Steel
“Hyundai Steel is committed to leading the decarbonisation of the steel industry, despite it being one of the most carbon-intensive and technically challenging sectors to decarbonise.
This consortium goes beyond conventional technological development – it aims to deliver real and measurable emissions reductions through collaboration with global partners, sharing knowledge and experience across borders.
Hyundai Steel will continue to take the lead in developing a wide range of low-carbon technologies, including CCUS, contributing to the overall sustainability of the industry.”
Comment from David Fallon, Chevron Australia Lower Carbon Execution General Manager
“Chevron believes in the critical role CCUS can play in a lower carbon world, including by reducing carbon emissions in the hard-to-abate sectors.
We are focused on leveraging our expertise and global reach to advance CCS technologies and scale lower carbon solutions across the value chain with a focus on areas including the hard-to-abate sector.”
Comment from Masaya Inamuro, Chief Operating Officer of Mineral & Metal Resources Business Unit, Mitsui & Co., Ltd.
"Mitsui has established a vision to achieve net-zero emissions by 2050 and is targeting a 30% reduction by 2030, relative to 2020 levels.
We are committed to accelerating the transition to a low-carbon future by initiating a study on CCUS in collaboration with key industrial partners across the Asia-Pacific region.
This initiative aims to explore viable pathways for large-scale CO₂ reduction and lay the groundwork for future deployment of decarbonization solutions in various industries."
+++
BHP is a global resources company. With more than 90,000 employees and contractors, we work in more than 90 locations worldwide and our products are sold globally. We're focused on the resources the world needs to grow and decarbonise. Population growth, urbanisation and improving living standards are global trends that underpin strong demand for the commodities we produce. Demand for essential commodities is expected to increase as the world seeks to decarbonise. Our project pipeline and focus on continuous improvement in existing operations leave us well positioned for growth across our four commodity pillars of copper, potash, iron ore and steelmaking coal in the decades ahead.
We are partnering with customers and others to try to accelerate decarbonisation in steelmaking. BHP’s 2030 goals include supporting industry to develop steel production technology capable of 30 per cent lower GHG emissions intensity relative to conventional blast furnace steelmaking, with widespread adoption expected post-2030.
ArcelorMittal Nippon Steel India (AM/NS India) is a joint venture between ArcelorMittal and Nippon Steel, two of the world’s leading steel manufacturing organisations. A leading integrated flat carbon steel producer in India, the company has a crude steel capacity of 9 million tonnes per annum with state-of-the-art downstream facilities. It produces a fully diversified range of flat steel products, including value-added steel, and has a pellet capacity of 20 million tonnes. With the objective to make steel production climate-neutral, AM/NS India has strategic plans to transition its business to cleaner technology and is looking to strengthen its sustainability roadmap through clean energy sources viz., renewable power, natural gas, carbon capture utilization and/or storage and green hydrogen.
Hyundai Steel Company, established in 1953 as Korea’s first steel manufacturer, is a member of Hyundai Motor Group and a recognized leader in high-performance steel materials. Hyundai Steel has paved the way for sustainable growth by launching its blast furnace business in the 2010s as a new growth engine, in addition to its existing electric arc furnace-based operations. Hyundai Steel has served as a prime mover in Korea’s steel industry and is now actively undertaking the establishment of an overseas production base to secure a foundation for future growth. Hyundai Steel aims to achieve Net Zero carbon emissions by 2050, emphasizing sustainable practices and innovative carbon-neutral technologies to meet government-mandated carbon reduction requirements and become a low-carbon steelmaker.
JSW Steel is the flagship company of the US$23 billion JSW Group, a diversified Indian conglomerate with interests spanning energy, infrastructure, cement, paints, realty, mobility, defence, sports, and venture capital. Over three decades, JSW Steel has evolved into India’s leading integrated steel producer with a consolidated crude steel capacity of 35.7 MTPA (including 1.5 MTPA in the US), set to grow to 43.4 MTPA in three years. Its Vijayanagar plant in Karnataka is India’s largest single-location steel facility at 17.5 MTPA.JSW Steel is recognized for sustainability and operational excellence, earning accolades like the Steel Sustainability Champion (2019–2025), Deming Prize for TQM, and top rankings in CDP disclosures and global sustainability indices. It ranks 2nd globally in S&P Global CSA Score 2024 and 8th in World-Class Steelmaker Rankings by WSD. Committed to climate goals, JSW Steel targets a 42% CO₂ reduction by 2030 and net-zero emissions by 2050, aiming to power steel-making entirely with renewables by 2030. It’s also certified as a Great Place to Work and recognized among India’s best employers in health and wellness.
Chevron Australia New Energies (CANE) is a subsidiary of Chevron, one of the world's leading integrated energy companies and through its Australian subsidiaries, has been present in Australia for more than 70 years. With the ingenuity and commitment of thousands of workers, Chevron in Australia operates the Gorgon and Wheatstone natural gas facilities and is a significant investor in exploration, operates one of the world’s largest integrated CCS projects at Gorgon, and delivers quality fuels and lubricants primarily via its Caltex network of service stations across Australia. Globally, Chevron aims to grow its oil and gas business, lower the carbon intensity of its operations, and grow new businesses in renewable fuels, carbon capture and offsets, hydrogen, power generation for data centers, and emerging technologies, through various subsidiaries including CANE.
Mitsui & Co., Ltd. is a global trading and investment company with a presence in more than 60 countries and a diverse business portfolio covering a wide range of industries. Mitsui & Co., Ltd. identifies, develops, and grows its businesses in partnership with a global network of trusted partners including world leading companies, combining its geographic and cross-industry strengths to create long-term sustainable value for its stakeholders. Mitsui & Co., Ltd. has set "Global Energy Transition" as one of Key Strategic Initiatives in the Medium-term Management Plan 2026.
Attachment
CONTACT: Lindsay Janca Hatch Ltd +1 905 403 4199 media@hatch.com Michael Cox BHP +65 8964 3561 michael.cox1@bhp.com
SAO PAULO (Reuters) -Brazilian miner Samarco, a joint venture between Vale and BHP, has received approval from a court in Minas Gerais state to exit bankruptcy protection proceedings, it said in a statement on Tuesday.
The process allowed Samarco to reorganize more than 50 billion reais ($9.28 billion) in liabilities involving around 10,000 creditors, the statement said. The proceedings were triggered by a 2015 dam collapse near the Brazilian city of Mariana which halted operations for several years.
($1 = 5.3896 reais)
(Reporting by Marta Nogueira; Writing by Isabel Teles; Editing by Kylie Madry)
Written by Amy Legate-Wolfe at The Motley Fool Canada
If you’ve got $5,000 ready to put to work in the market and the patience to let it grow, a few Canadian names look like they could reward you for years to come. They aren’t quick flips or speculative flyers. These are well-established Canadian stocks with strong growth potential, solid business models, and room to expand their reach. Right now, Alimentation Couche-Tard (TSX:ATD), Air Canada (TSX:AC), and Teck Resources (TSX:TECK.B) each offer a different way to tap into long-term market trends without having to overthink your timing.
ATD
Couche-Tard has been a quiet Canadian growth machine for decades, and its latest quarter showed it’s still a steady operator even when conditions get tricky. The convenience store giant reported merchandise revenue growth in Canada and Europe, with Canadian same-store sales up 3.5% year over year. Fuel volumes in Canada also rose 3.7%, offsetting softer U.S. numbers.
While adjusted earnings per share (EPS) dipped 4.2% from last year, the company is still highly profitable with a forward price-to-earnings (P/E) ratio around 17.5 and a return on equity above 18%. Couche-Tard’s scale, disciplined cost control, and ability to integrate acquisitions like its TotalEnergies assets keep it positioned for steady expansion.
Risks here are tied to fuel margins and discretionary spending, but its global network gives it flexibility to adapt. Over time, the combination of share buybacks, dividend growth, and operational efficiencies has the potential to turn even modest growth into impressive shareholder returns.
AC
Air Canada has had to navigate turbulence before, but it’s now flying with a healthier balance sheet and a clearer growth runway. Now that we’ve got all the puns out of the way, let’s look at earnings.
In its second quarter, the airline posted operating revenue of $5.6 billion, up 2% from last year, along with an operating margin of 7.4%. Premium revenues climbed 5%, showing customers are still willing to pay up for better service. Operationally, the airline led major North American carriers in on-time performance for May and June, a win for brand reputation.
The carrier also completed a $500 million share buyback during the quarter and has a leverage ratio of 1.4, which gives it more breathing room than in the past. Looking ahead, Air Canada expects to expand capacity up to 3.8% in the third quarter and is sticking with its 2025 adjusted earnings before interest, taxes, depreciation and amortization (EBITDA) guidance of $3.2 to $3.6 billion. If travel demand remains steady, the stock’s relatively low forward P/E under 10 could make it a compelling long-term hold.
Teck
Teck Resources offers a very different kind of growth story, one rooted in the long-term need for copper. The Canadian stock’s second quarter brought in adjusted EBITDA of $722 million, with copper production holding steady at just over 109,000 tonnes. The big news was the approval of its Highland Valley Copper Mine Life Extension project, which will keep production going until 2046 with an average output of 132,000 tonnes per year.
Teck has been aggressive about returning cash to shareholders, repurchasing $1 billion worth of shares so far this year. It also holds $4.8 billion in cash and has total liquidity of $8.9 billion, which gives it a buffer against commodity price swings. While earnings are vulnerable to copper price fluctuations and higher operating costs, the long-term demand story for copper could keep Teck well-positioned for decades.
Bottom line
With $5,000 split across these three names, you’d be tapping into three industries with very different economic drivers. That diversification helps balance risks, since each company’s performance depends on separate forces. None are immune to headwinds, but each has a clear growth path, disciplined capital allocation, and strong positioning in its sector.
The best part of a long-term approach is that you don’t need to catch the exact bottom or sell at the peak. With these Canadian stocks, the real value comes from holding through the cycles, letting dividends, buybacks, and earnings growth do the work. Five years from now, you might look back and be glad you put that $5,000 to work in three very different but equally promising Canadian growth stories.
The post 3 Canadian Stocks to Buy With $5,000 for Long-Term Growth appeared first on The Motley Fool Canada.
Should you invest $1,000 in Air Canada right now?
Before you buy stock in Air Canada, consider this:
The Motley Fool Stock Advisor Canada analyst team just identified what they believe are the Top Stocks for 2025 and Beyond for investors to buy now… and Air Canada wasn’t one of them. The Top Stocks that made the cut could potentially produce monster returns in the coming years.
Consider MercadoLibre, which we first recommended on January 8, 2014 … if you invested $1,000 in the “eBay of Latin America” at the time of our recommendation, you’d have $24,927.94!*
Stock Advisor Canada provides investors with an easy-to-follow blueprint for success, including guidance on building a portfolio, regular updates from analysts, and two new stock picks each month – one from Canada and one from the U.S. The Stock Advisor Canada service has outperformed the return of S&P/TSX Composite Index by 30 percentage points since 2013*.
See the Top Stocks * Returns as of 6/23/25
More reading
Fool contributor Amy Legate-Wolfe has no position in any of the stocks mentioned. The Motley Fool has positions in and recommends Alimentation Couche-Tard. The Motley Fool recommends Air Canada. The Motley Fool has a disclosure policy.
2025
(Reuters) -BHP, the world's largest miner, is leading a global consortium of steelmakers to explore carbon capture, utilisation and storage (CCUS) opportunities across Asia, project manager Hatch said on Monday.
The group, comprising ArcelorMittal Nippon Steel India, JSW Steel, Hyundai Steel, Chevron Corp and Mitsui & Co, will assess the deployment of CCUS in "hard-to-abate" sectors, such as steelmaking.
The one-year pre-feasibility study will focus on the potential to develop large-scale projects in Asia, which could repurpose or store captured carbon dioxide.
While carbon capture technologies are relatively mature, they face cost and regulatory hurdles in many Asian markets.
The consortium will evaluate how shared infra can cut costs, aggregate sufficient volumes of carbon dioxide for storage or reuse and distribute risks across companies.
"By leveraging shared knowledge and resources with our partners, we are investing in support for innovative solutions, like the potential of CCUS, that we see as an essential part of decarbonising hard-to-abate sectors such as steelmaking," said Ben Ellis, BHP's vice president of marketing sustainability.
The study is expected to conclude at the end of 2026, with findings to be made public.
(Reporting by Shivangi Lahiri in Bengaluru; Editing by Sumana Nandy)
SANTIAGO (Reuters) -Copper production from Chilean state-run miner Codelco ticked up 17% year-over-year in June, data from copper commission Cochilco showed on Monday, climbing to 120,200 metric tons.
Codelco is the world's largest miner of the red metal.
Meanwhile production at BHP's Escondida mine, the world's largest copper mine, slid 33% to 76,400 tons.
At Collahuasi, another major copper mine jointly run by Glencore and Anglo American, output fell 29% to 34,300 tons.
(Reporting by Fabian Cambero; Editing by Alexander Villegas)
Hudbay Minerals HBM is slated to report second-quarter 2025 results on Aug. 13, before market open. HBM is expected to deliver a year-over-year improvement in both its top and bottom lines in the quarter, aided by higher gold and copper prices.
The Zacks Consensus Estimate for HBM’s second-quarter 2025 revenues is currently pegged at $495.3 million, indicating year-over-year growth of 16.4%. The estimate for earnings has moved down 35.3% over the past 60 days to 11 cents per share. Despite this, the consensus mark indicates a solid jump from the break-even earnings reported in the last year’ quarter.
Zacks Investment Research
Image Source: Zacks Investment Research
Hudbay Minerals’ Earnings Surprise History
The company’s earnings outpaced the Zacks Consensus Estimate in two of the last four quarters, while matching in one quarter and missing in the remaining quarter. HBM has a trailing four-quarter earnings surprise of 50%, on average.
Zacks Investment Research
Image Source: Zacks Investment Research
What the Zacks Model Unveils for HBM Stock
Our proven model does not conclusively predict an earnings beat for Hudbay Minerals this time around. The combination of a positive Earnings ESP and a Zacks Rank #1 (Strong Buy), 2 (Buy) or 3 (Hold) increases the odds of an earnings beat, but that is not the case here.
Earnings ESP: HBM has an Earnings ESP of 0.00%. You can uncover the best stocks before they are reported with our Earnings ESP Filter.
Zacks Rank: The company currently carries a Zacks Rank of 3. You can see the complete list of today’s Zacks #1 Rank stocks here.
Factors Likely to Have Shaped Hudbay Minerals’ Q2 Performance
In the first quarter of 2025, HBM produced 30,958 tons of copper and 73,784 ounces of gold. While copper output fell 11% and gold production declined 18% compared with the first quarter of 2024, these results were in line with the company’s internal expectations. Consolidated silver output totaled 919,775 ounces, down 3% year over year, while zinc production fell 29% to 6,265 tons.
The ongoing stripping phase in the high-grade Pampacancha pit has weighed on the company’s production numbers in Peru. However, this setback was partially offset by higher gold production in Manitoba from better-than-expected gold grades.
The Manitoba operations delivered 60,354 ounces of gold, 3,469 tons of copper, 6,265 tons of zinc and 285,603 ounces of silver in the quarter, delivering on targets. Compared with the first quarter of 2024, production of gold was up 6% due to higher grades, copper was up 10% and silver gained 30%. Zinc production, however, was down 29%.
For 2025, Hudbay Minerals’ production guidance calls for 117,000–149,000 tons of copper, 247,500–308,000 ounces of gold, 21,000–27,000 tons of zinc, 3.52–4.39 million ounces of silver and 1,300–1,500 tons of molybdenum. Compared with the 2024 production levels, the midpoint of the copper guidance implies a 4% decline mainly due to lower grades in Peru as Pampacancha depletes by year-end, partially offset by higher production in British Columbia from increased mill throughput and improved grades.
Gold guidance suggests a 16% decline at the midpoint as the accelerated mining of high-grade gold at Pampacancha last year of high-grade gold zones at Lalor in 2024, resulted in both Peru and Manitoba delivering higher numbers in 2024. The zinc and silver guidances suggest year-over-year declines of 16%, 28% and 1%, respectively. The Molybdenum expectations, however, indicate a 6% climb.
These lower volumes are likely to be reflected in the company’s second-quarter results as well.
The quarter also saw operational challenges from wildfires in Manitoba, prompting evacuation orders in Snow Lake, Flin Flon and nearby areas. Although Hudbay Minerals no longer mines in Flin Flon after closing the 777 mine in 2022, it maintains care and maintenance activities there and provides support services for Snow Lake. The company expects temporary reduced production levels in Snow Lake. However, given its strong year-to-date performance, it remains on track to deliver 2025 targets.
In the April-June 2025 period, gold prices averaged around $3.301.42 per ounce, marking a 41% year-over-year increase. Tariff threats, financial uncertainty, geopolitical tensions and solid demand from central banks boosted gold prices. Prices had even reached the $3,500 per-ounce mark for the first time. Silver prices rose 16%. Copper prices also demonstrated strength and the average price was up 5% year over year.
These favorable pricing trends are expected to have helped offset the impact of lower production volumes on HudBay Minerals’ top-line performance in the to-be-reported quarter. Also, the company’s ongoing effective cost control across all business units is likely to have boosted earnings in the quarter.
HudBay Minerals’ Price Performance & Valuation
HBM shares have gained 19% in the past three months, outpacing the industry’s growth of 17.9%. The company has performed better than its peers, Teck Resources TECK and ERO Copper ERO. While Teck Resources has declined 18.5% year to date, Ero Copper has gained 3.5%.
HBM’s Price Performance vs. Industry, Teck Resources & Ero CopperZacks Investment Research
Image Source: Zacks Investment Research
HudBay Minerals is currently trading at a forward price/sales ratio of 1.74 compared with the industry's 1.15.
Zacks Investment Research
Image Source: Zacks Investment Research
ERO Copper is a cheaper option, trading at a forward price/sales ratio of 1.61. Teck Resources, however, is trading higher at 2.02.
Investment Thesis on HudBay Minerals
Hudbay Minerals’ diversified copper and gold operations in Peru and Canada provide leverage to strong commodity prices and robust free cash flow. The company is advancing high-return brownfield mill upgrades and greenfield copper projects to drive growth. Copper output is projected to average 144,000 tons annually over the next three years and rise 17% (from 2024 levels) to 161,000 tons by 2027, aided by Copper Mountain optimization. Full ownership of Copper Mountain boosts 2027 attributable output by 200% compared with 2024. Copper World is the highest grade and lowest capital intensity fully permitted copper project in the Americas. Gold production is set to average 253,000 ounces annually, supported by strong Manitoba output.
Should You Buy HBM Stock Now?
Hudbay Minerals is expected to post upbeat second-quarter results, mainly driven by higher gold prices. However, lower production levels for the year due to the depletion of the high-grade Pampacancha deposit in Peru remain a concern. Given the stock’s currently elevated valuation compared with peers, new investors may be better off waiting for a more attractive entry point. Existing shareholders should consider holding the stock to benefit from its robust long-term fundamentals and exposure to gold and base metals.
Want the latest recommendations from Zacks Investment Research? Today, you can download 7 Best Stocks for the Next 30 Days. Click to get this free report
HudBay Minerals Inc (HBM) : Free Stock Analysis Report
Teck Resources Ltd (TECK) : Free Stock Analysis Report
Ero Copper Corp. (ERO) : Free Stock Analysis Report
This article originally published on Zacks Investment Research (zacks.com).
Wheaton Precious Metals Corp. WPM reported adjusted earnings per share of 63 cents in second-quarter 2025, which surpassed the Zacks Consensus Estimate of 58 cents. The bottom line surged 90.9% year over year.
WPM Q2 Revenues Reflect Higher Metal Prices
Wheaton Precious Metals generated record revenues of around $503 million, which improved 68.3% on a year-over-year basis. The upside was caused by a 32% increase in average realized price and a 28% improvement in gold equivalent ounces (GEOs) sold. The top line beat the Zacks Consensus Estimate of $468 million.In the second quarter, the average realized gold price was $3,318 per ounce. The figure was 40.8% higher than the year-ago quarter. Silver prices were $34.05 per ounce, up 17% year over year. Palladium prices were $996 per ounce compared with $979 per ounce in the prior-year quarter. Cobalt prices improved 16.1% year over year to $18.60 per pound.
Wheaton Precious Metals’ Q2 Gold Equivalent Production Rises Y/Y
WPM’s gold production was 91,968 ounces, up from the prior-year quarter’s 83,743 ounces. Attributable silver production increased 7.1% year over year to 5,407 ounces, while palladium production fell 43.9% to 2,435 ounces. The company produced 158,608 GEOs in the June-end quarter, up 9.5% from the prior-year quarter’s 144,904 GEOs.
Wheaton Precious Metals sold 157,916 GEOs, up 27.9% from the last-year quarter.
Wheaton Precious Metals Corp. Price, Consensus and EPS Surprise
Wheaton Precious Metals Corp. Price, Consensus and EPS Surprise
Wheaton Precious Metals Corp. price-consensus-eps-surprise-chart | Wheaton Precious Metals Corp. Quote
WPM’s Margins Rise Y/Y in Q2
The total cost of sales was up 33% year over year to around $150 million in the second quarter. The gross profit surged 86.9% to $353 million. The gross margin was 70.2% in the reported quarter compared with 62.3% in the prior-year quarter.General and administrative expenses increased 7.6% year over year to $11 million. Earnings from operations were $330 million, a 95.1% rise from $169 million in the second quarter of 2024.Average cash costs in the second quarter of 2025 were $470 per GEO, up from $437 in the year-ago quarter. The cash operating margin increased 37% year over year to $2,717 per GEO sold due to a higher realized price per ounce.
Wheaton Precious Metals’ Balance Sheet Updates
The company had around $1 billion of cash in hand at the end of the second quarter of 2025 compared with $0.83 billion at the end of 2024. It reported an operating cash flow of $415 million compared with $234 million in the prior-year quarter. The company has a $2-billion undrawn revolving credit facility. The maturity date has been extended to June 23, 2030.
WPM Reaffirms 2025 Outlook
Gold production is expected to be 350,000-390,000 ounces. Silver production is projected between 20.5 million and 22.5 million ounces. The production of other metals is anticipated to be 12,500-13,500 GEOs.
Wheaton Precious Metals Stock’s Price Performance
Shares of Wheaton Precious Metals have gained 77.7% in the past year compared with the industry’s 15.7% growth.
Zacks Investment Research
Image Source: Zacks Investment Research
WPM’s Zacks Rank
Wheaton currently carries a Zacks Rank #3 (Hold). You can see the complete list of today’s Zacks #1 Rank (Strong Buy) stocks here.
Wheaton Precious Metals’ Peer Performances
Kinross Gold Corporation KGC reported adjusted earnings of 44 cents per share compared with the prior-year quarter’s 14 cents. The bottom line beat the Zacks Consensus Estimate of 33 cents.Kinross Gold’s revenues rose 41.7% year over year to $1,728.5 million in the second quarter. It topped the Zacks Consensus Estimate of $1,347.3 million. The rise is attributed to a higher average realized gold price.Agnico Eagle Mines Limited AEM reported adjusted earnings of $1.94 per share for the second quarter of 2025, up from $1.07 in the year-ago quarter. The bottom line topped the Zacks Consensus Estimate of $1.83.Agnico Eagle Mines generated revenues of $2,816.1 million, up 35.6% year over year. The top line surpassed the Zacks Consensus Estimate of $2,553 million.Teck Resources Limited TECK came out with earnings of 27 cents per share in the second quarter of 2025, beating the Zacks Consensus Estimate of 2 cents. This compares with earnings of 58 cents per share a year ago.Teck Resources posted revenues of $1.46 billion in the quarter, missing the Zacks Consensus Estimate by 8.7%. This compares with year-ago revenues of $2.83 billion.
Want the latest recommendations from Zacks Investment Research? Today, you can download 7 Best Stocks for the Next 30 Days. Click to get this free report
Kinross Gold Corporation (KGC) : Free Stock Analysis Report
Agnico Eagle Mines Limited (AEM) : Free Stock Analysis Report
Teck Resources Ltd (TECK) : Free Stock Analysis Report
Wheaton Precious Metals Corp. (WPM) : Free Stock Analysis Report
This article originally published on Zacks Investment Research (zacks.com).
TORONTO, ON / ACCESS Newswire / August 11, 2025 / Grid Metals Corp. (TSXV:GRDM)(OTCQB:MSMGF) ("Grid" or the "Company") is pleased to provide an update at its Makwa Ni-Cu-PGE project in southeastern Manitoba where an Option and Joint Venture Agreement (the "Agreement") with Teck Resources Limited ("Teck") was announced in December 2024. The target model is a footwall-hosted Ni-Cu-PGE deposit similar to the Eagle's Nest deposit1 located in Ontario's 'Ring of Fire' mineral district. Initial exploration completed under the new option and joint venture agreement has led to the discovery of semi-massive nickel sulfide mineralization at surface (up to 1.1% nickel in grab samples, see Table 1) associated with a recently identified geophysical anomaly ("Pavo" or the "Pavo Anomaly") in a previously unexplored part of the Makwa property. The Pavo Anomaly is now a priority drill target with drilling anticipated to commence in the Fall of 2025.
Dr. Dave Peck, the Company's V.P. Exploration, stated, "The new discovery of nickel-rich magmatic massive sulfide mineralization at Pavo is significant given its location in an interpreted feeder structure to the Bird River Sill – host to most of the known Ni-Cu-PGE sulfide mineralization in the Bird River Belt. Importantly, the Pavo conductor trend is contained within a large magnetic anomaly that suggests a large volume of prospective ultramafic rocks are present in the broader target area. Our view, shared by Federal and Provincial Government geoscientists2, is that the Bird River Belt is strongly analogous to the Ring of Fire District in northwestern Ontario where a significant Ni-Cu-PGE deposit at Eagle's Nest was discovered in 2007. The potential to participate with Teck in the discovery of an Eagle's Nest-type sulfide deposit is an exciting opportunity for Grid."
The Pavo Anomaly: A new grassroots nickel sulfide surface discovery in the footwall of the Bird River Sill
The Pavo Anomaly is a shallow electromagnetic ("EM") conductor trend that has a strike length of approximately 600m in east-west extent that was outlined from an airborne geophysical survey completed in late 2024. The Company completed reconnaissance geology in the area and one day of field prospecting at the Pavo Anomaly (Blaze Showing) before forest fires restricted access to the area. Nonetheless, the initial day of prospecting led to the discovery of semi-massive sulfide mineralization in soil-covered bedrock located directly on the eastern part of the Pavo Anomaly. Initial grab samples taken from this new showing returned peak nickel grades of up to 1.1% hosted by semi-massive magmatic sulfide mineralization (see Table 1).
1 The Eagle's Nest deposit in the McFauld's Lake greenstone belt of northwestern Ontario is an established, high-grade magmatic nickel sulfide resource that is owned by Wyloo Canada. See the Wyloo website for more information about the Eagle's Nest deposit: https://wyloo.com/wylooeaglesnest/
2 Geological Survey of Canada Open File Report 8722, 2020.
|
Sample Number |
Ni (%) |
Cu (%) |
Co (%) |
S (%) |
FieldDescription |
|
C1296925 |
0.84 |
0.20 |
0.10 |
24.5 |
Semi-massive sulfides in ultramafic |
|
C1296927 |
0.62 |
0.12 |
0.07 |
18.7 |
Semi-massive sulfides in ultramafic |
|
C1296973 |
1.13 |
0.08 |
0.11 |
28.3 |
Semi-massive sulfides in ultramafic |
Table 1. Select assay results for surface grab samples from the Pavo Anomaly.
Above: Part of a new channel sample comprising sulfide-matrix breccia from the magmatic sulfide discovery at the Pavo Anomaly. Fragments are altered ultramafic rock. Sulfide matrix is composed of pyrrhotite +/- pentlandite with lesser pyrite and minor chalcopyriteAbove: Pavo EM Anomaly on a first vertical derivative magnetic image showing location of the Blaze nickel sulfide showing and recent field sample lithologies
Next Steps
Additional prospecting recently commenced following the lifting of fire restrictions in the area. A follow-up deep-penetrating ground time-domain EM geophysical survey is also planned to further define initial drill targets. Drilling at Pavo is planned to commence this Fall pending receipt of applicable exploration permits.
The principal objective of the ongoing exploration program is to fully explore the Makwa property for high-grade massive Ni-Cu-PGE sulfide deposits located in structural favourable sites, including structural traps along the base of the Bird River Sill and within interpreted feeder structures to the sill. Pavo is expected to be the first major anomaly to be drill tested. However, there are numerous other untested, coincident magnetic and EM anomalies that are currently being mapped and prospected that could become priorities for future drilling campaigns.
Above: Location of Grid’s copper/nickel properties in the Bird River Belt, southeastern Manitoba.
Quality Assurance and Quality Control
Grid Metals applies best practice quality assurance and quality control ("QAQC") protocols in all of its exploration programs. For the Pavo prospecting program, grab samples were cleaned of obvious weathering and bagged and tagged in the field. The samples were then transported by secure carrier to the Actlabs (Thunder Bay) laboratory for sample preparation and analysis for nickel, copper, cobalt and selected major and trace element abundances using a multi-acid digestion method followed by ICP-OES analysis. Samples were also analyzed for Pd, Pt and Au using a lead collection 30 g fire assay method followed by ICP-OES analysis. The Company is using several different certified reference materials ("CRMs") and one analytical blank for the Makwa project to monitor analytical accuracy and check for cross contamination between samples. The analytical results for the CRMs and the blank for the new analytical results reported here did not show any significant bias compared to the certified values and fell within the acceptable limits of variability.
For more information about the Company, please see the Company website at www.gridmetalscorp.com or contact:
Robin Dunbar – President, CEO & Director Telephone: 416-955-4773 Email: rd@gridmetalscorp.comBrandon Smith – Chief Development Officer – bsmith@gridmetalscorp.comDavid Black – Investor Relations Email – info@gridmetalscorp.com
Qualified Persons Statements
Dr. Dave Peck, P.Geo., the V.P. Exploration of Grid, is the Qualified Person for purposes of National Instrument 43-101 and has reviewed and approved the technical content of this release.
About Grid Metals Corp.
Grid Metals is focused on exploration and development in southeastern Manitoba with four key projects in the Bird River area.
The Makwa Property (Ni-Cu-PGM-Co), which is subject to an Option and Joint Venture Agreement with Teck Resources Limited ("Teck"). Teck can earn up to a 70% interest in Makwa by incurring a total of CAD$17.3 million, comprising project expenditures (CAD$15.7 million) and cash payments or equity participation (CAD$1.6 million) with Grid. Makwa is located on the south arm of the Bird River Greenstone Belt.
The Mayville Property (Cu-Ni) is located on the north arm of the Bird River Greenstone Belt. The property is owned subject to a minority interest.
The Falcon West Property (Li-Cs) is located 110 km east of Winnipeg along the Trans-Canada highway and contains highly anomalous cesium values in a number of historical drill holes including 2.2 m at 15.0% Cs2O and 3.2 m at 4.6% Cs2O.
The Donner Property (Li-Cs) is adjacent to the Mayville Property, and Grid owns 75% of the project. Grid announced a cesium purchase agreement with Tanco on February 18, 2025.
All of the Company's southeastern Manitoba projects are located on the ancestral lands of the Sagkeeng First Nation with whom the Company maintains an Exploration Agreement.
We seek safe harbour. This news release contains forward-looking statements within the meaning of the United States Private Securities Litigation Reform Act of 1995 and forward-looking information within the meaning of the Securities Act (Ontario) (together, "forward-looking statements"). Such forward-looking statements include the Company's closing of the proposed financial transactions, sale of royalty and property interests. the overall economic potential of its properties, the availability of adequate financing and involve known and unknown risks, uncertainties and other factors which may cause the actual results, performance or achievements expressed or implied by such forward- looking statements to be materially different. Such factors include, among others, risks and uncertainties relating to potential political risk, uncertainty of production and capital costs estimates and the potential for unexpected costs and expenses, physical risks inherent in mining operations, metallurgical risk, currency fluctuations, fluctuations in the price of nickel, cobalt, copper and other metals, completion of economic evaluations, changes in project parameters as plans continue to be refined, the inability or failure to obtain adequate financing on a timely basis, and other risks and uncertainties, including those described in the Company's Management Discussion and Analysis for the most recent financial period and Material Change Reports filed with the Canadian Securities Administrators and available at www.sedar.com.
Neither the TSX Venture Exchange nor its Regulations Services Provider (as that term is defined in the policies of the TSX Venture Exchange) accepts responsibility for the adequacy or accuracy of this press release.
SOURCE: Grid Metals Corp.
View the original press release on ACCESS Newswire
Key Insights
-
Significant control over Aurelia Metals by individual investors implies that the general public has more power to influence management and governance-related decisions
-
44% of the business is held by the top 25 shareholders
To get a sense of who is truly in control of Aurelia Metals Limited (ASX:AMI), it is important to understand the ownership structure of the business. And the group that holds the biggest piece of the pie are individual investors with 56% ownership. In other words, the group stands to gain the most (or lose the most) from their investment into the company.
Individual insiders, on the other hand, account for 24% of the company's stockholders. Institutions will often hold stock in bigger companies, and we expect to see insiders owning a noticeable percentage of the smaller ones.
Let's delve deeper into each type of owner of Aurelia Metals, beginning with the chart below.
Check out our latest analysis for Aurelia Metals
ASX:AMI Ownership Breakdown August 11th 2025What Does The Institutional Ownership Tell Us About Aurelia Metals?
Many institutions measure their performance against an index that approximates the local market. So they usually pay more attention to companies that are included in major indices.
As you can see, institutional investors have a fair amount of stake in Aurelia Metals. This implies the analysts working for those institutions have looked at the stock and they like it. But just like anyone else, they could be wrong. When multiple institutions own a stock, there's always a risk that they are in a 'crowded trade'. When such a trade goes wrong, multiple parties may compete to sell stock fast. This risk is higher in a company without a history of growth. You can see Aurelia Metals' historic earnings and revenue below, but keep in mind there's always more to the story.
ASX:AMI Earnings and Revenue Growth August 11th 2025
We note that hedge funds don't have a meaningful investment in Aurelia Metals. Franklyn Brazil is currently the largest shareholder, with 20% of shares outstanding. For context, the second largest shareholder holds about 5.3% of the shares outstanding, followed by an ownership of 3.1% by the third-largest shareholder.
A deeper look at our ownership data shows that the top 25 shareholders collectively hold less than half of the register, suggesting a large group of small holders where no single shareholder has a majority.
While studying institutional ownership for a company can add value to your research, it is also a good practice to research analyst recommendations to get a deeper understand of a stock's expected performance. Quite a few analysts cover the stock, so you could look into forecast growth quite easily.
Insider Ownership Of Aurelia Metals
While the precise definition of an insider can be subjective, almost everyone considers board members to be insiders. The company management answer to the board and the latter should represent the interests of shareholders. Notably, sometimes top-level managers are on the board themselves.
Most consider insider ownership a positive because it can indicate the board is well aligned with other shareholders. However, on some occasions too much power is concentrated within this group.
Our information suggests that insiders maintain a significant holding in Aurelia Metals Limited. Insiders own AU$79m worth of shares in the AU$330m company. This may suggest that the founders still own a lot of shares. You can click here to see if they have been buying or selling.
General Public Ownership
The general public, who are usually individual investors, hold a substantial 56% stake in Aurelia Metals, suggesting it is a fairly popular stock. With this amount of ownership, retail investors can collectively play a role in decisions that affect shareholder returns, such as dividend policies and the appointment of directors. They can also exercise the power to vote on acquisitions or mergers that may not improve profitability.
Next Steps:
While it is well worth considering the different groups that own a company, there are other factors that are even more important.
Many find it useful to take an in depth look at how a company has performed in the past. You can access this detailed graph of past earnings, revenue and cash flow.
If you would prefer discover what analysts are predicting in terms of future growth, do not miss this free report on analyst forecasts.
NB: Figures in this article are calculated using data from the last twelve months, which refer to the 12-month period ending on the last date of the month the financial statement is dated. This may not be consistent with full year annual report figures.
Have feedback on this article? Concerned about the content? Get in touch with us directly. Alternatively, email editorial-team (at) simplywallst.com.This article by Simply Wall St is general in nature. We provide commentary based on historical data and analyst forecasts only using an unbiased methodology and our articles are not intended to be financial advice. It does not constitute a recommendation to buy or sell any stock, and does not take account of your objectives, or your financial situation. We aim to bring you long-term focused analysis driven by fundamental data. Note that our analysis may not factor in the latest price-sensitive company announcements or qualitative material. Simply Wall St has no position in any stocks mentioned.
Pan American Silver Corp. (NYSE:PAAS) is one of the most undervalued Canadian stocks to buy now. On August 6, Pan American Silver Corp. announced the immediate appointment of Pablo Marcet to its Board of Directors. The appointment is part of the company’s board renewal strategy and commitment to governance and operational excellence.
Mr. Marcet brings over 35 years of international experience in the mining industry, with a focus on exploration, development, and operations across the Americas and Africa. His expertise includes geology, environmental management, mine operations, stakeholder engagement, and mergers and acquisitions.
Pan American Silver Appoints Mining Veteran Pablo Marcet to Board of Directors
He has held senior leadership positions at companies such as Orosur Mining, Waymar Resources, Northern Orion Resources, and spent 15 years at BHP, with a primary focus on Latin America. Mr. Marcet is currently the Executive Director of Piche Resources and the founder and President of Geo Logic, which is a mining consultancy firm.
Pan American Silver Corp. (NYSE:PAAS) explores, mines, develops, extracts, processes, and refines mines in Canada, Mexico, Peru, Bolivia, Argentina, Chile, and Brazil. It explores for silver, gold, zinc, lead, and copper deposits.
While we acknowledge the potential of PAAS as an investment, we believe certain AI stocks offer greater upside potential and carry less downside risk. If you’re looking for an extremely undervalued AI stock that also stands to benefit significantly from Trump-era tariffs and the onshoring trend, see our free report on the best short-term AI stock.
READ NEXT: 30 Stocks That Should Double in 3 Years and 11 Hidden AI Stocks to Buy Right Now.
Disclosure: None. This article is originally published at Insider Monkey.
TSX:LUN 1 Year Share Price vs Fair Value
Explore Lundin Mining's Fair Values from the Community and select yours
Lundin Mining (TSE:LUN) Second Quarter 2025 ResultsKey Financial Results
-
Net income: US$126.1m (up 3.7% from 2Q 2024).
-
EPS: US$0.15.
TSX:LUN Earnings and Revenue Growth August 9th 2025
All figures shown in the chart above are for the trailing 12 month (TTM) period
Lundin Mining Revenues and Earnings Beat Expectations
Revenue exceeded analyst estimates by 8.7%. Earnings per share (EPS) also surpassed analyst estimates by 117%.
Looking ahead, revenue is forecast to grow 15% p.a. on average during the next 3 years, compared to a 15% growth forecast for the Metals and Mining industry in Canada.
Performance of the Canadian Metals and Mining industry.
The company's shares are up 14% from a week ago.
Risk Analysis
Be aware that Lundin Mining is showing 2 warning signs in our investment analysis that you should know about…
Have feedback on this article? Concerned about the content? Get in touch with us directly. Alternatively, email editorial-team (at) simplywallst.com.This article by Simply Wall St is general in nature. We provide commentary based on historical data and analyst forecasts only using an unbiased methodology and our articles are not intended to be financial advice. It does not constitute a recommendation to buy or sell any stock, and does not take account of your objectives, or your financial situation. We aim to bring you long-term focused analysis driven by fundamental data. Note that our analysis may not factor in the latest price-sensitive company announcements or qualitative material. Simply Wall St has no position in any stocks mentioned.
By Lucila Sigal
SAN JUAN (Reuters) -Argentina holds rich copper deposits in the mountainous north along the Chilean border, but, unlike its mining powerhouse neighbor, has not built power lines and roads needed for new projects backed by miners such as BHP and Rio Tinto.
President Javier Milei's austerity campaign to clamp down on inflation and debt means the South American country is up against bigger challenges than most countries to build the infrastructure needed by mines worldwide.
Unconventional ideas, such as sharing infrastructure between miners or paying for it with royalties, will likely be part of the solution.
"The government said it won't provide any funding, but that doesn't mean it isn't responsible for getting things done," said Roberto Cacciola, president of Argentina's mining chamber, who is urging authorities to step up efforts to ensure infrastructure gets built.
Argentina exports gold, silver, and lithium but has not produced copper since 2018.
Milei's administration, as well as governors who control local development, are banking on copper to help stabilize the country's volatile economy, just as mining companies worldwide seek to boost output to cover a looming supply gap for the metal widely used in construction and electric vehicles.
A federal official said the government is assessing infrastructure needs nationwide and identifying ways the private sector could play a role.
Eight copper projects in Argentina could bring total mining export value to $15.4 billion by 2030, according to a government forecast.
That would more than triple last year's figure and make the sector one of the country's largest net foreign exchange earners. Copper projects alone could reel in $5.2 billion by 2030, if they reach the government's projection of producing 521,000 metric tons a year.
The copper projects are concentrated in the northern province of San Juan, which some call the "Vaca Muerta of copper," an allusion to Argentina's shale oil and gas field the size of Belgium.
San Juan enacted a compensation program in 2022 that could help get infrastructure built. It allows mining companies that develop road or energy infrastructure to be repaid with mining royalties if provincial legislators deem the project a "public utility." Miners normally pay royalties to governments.
The Vicuna project, from global miner BHP and Canada's Lundin, hopes to use the provision, said Vicuna's Argentina director Jose Morea.
"That speeds up investments that the private sector is currently in a position to make … which the provincial government would probably have to defer otherwise," he said in an interview.
Vicuna consists of two mines, Filo del Sol and the more advanced Josemaria, which could become one of the region's first projects to start production. The $5-billion mine will need a 220-kilometer (137-mile) road – a distance of about two or three hours by car – to reach operations at an altitude of 4,200 meters (13,780 feet) in the Andes Mountains.
It will also require a high-voltage power transmission line at a scale that could support a large city.
SHARING INFRASTRUCTURE
Some miners are exploring other ways to reduce costs. McEwen Mining's Los Azules is looking at sharing infrastructure with nearby projects and has consulted the Inter-American Development Bank about infrastructure loans.
Some business leaders want the government to turn over more projects, such as railways and road maintenance, to the private sector through public tenders or public-private partnerships, said Nicolas Munoz, a copper supply analyst at consultancy CRU.
"It's feasible to think that private companies will assume these costs and see a business opportunity," Munoz said.
There are already signs of interest from the mining sector, such as global miner Rio Tinto, which recently took over U.S.-based Arcadium's lithium mines in Argentina and is developing another of its own in the country.
According to a public register of lobbyist meetings, Rio held a meeting with Argentina's mining secretary in June after expressing interest in bidding for the state's Belgrano Cargas railway, which the government said in February it would privatize.
Rio Tinto did not have an immediate comment.
Rio Tinto is also backing McEwen's Los Azules and Aldebaran's Altar copper projects through shares owned by its leaching technology arm, Nuton.
Some governors are still looking to the federal government to take part of the burden. Governor Gustavo Saenz of Salta, where Canada's First Quantum Minerals wants to develop the Taca Taca copper mine, said aqueducts, roads, and gas pipelines will pay off.
"We need them to give us … everything necessary so that those who want to come and invest can do so," he said this week at the Argentina Copper 2025 conference in San Juan.
(Reporting by Lucila Sigal, Writing by Daina Beth Solomon, Editing by Rod Nickel)
As the Canadian economy navigates a landscape of moderated services inflation and shifting labor market dynamics, investors are increasingly seeking opportunities that balance potential growth with stability. Penny stocks, though an older term, still capture the essence of investing in smaller or less-established companies that may offer significant value. By focusing on those with strong financials and clear growth paths, investors can uncover promising opportunities in this often-overlooked segment of the market.
Top 10 Penny Stocks In Canada
|
Name |
Share Price |
Market Cap |
Financial Health Rating |
|
Westbridge Renewable Energy (TSXV:WEB) |
CA$0.69 |
CA$69.79M |
★★★★★★ |
|
illumin Holdings (TSX:ILLM) |
CA$2.15 |
CA$110.97M |
★★★★★☆ |
|
Fintech Select (TSXV:FTEC) |
CA$0.035 |
CA$2.8M |
★★★★★★ |
|
Findev (TSXV:FDI) |
CA$0.42 |
CA$12.03M |
★★★★★★ |
|
Thor Explorations (TSXV:THX) |
CA$0.735 |
CA$488.99M |
★★★★★★ |
|
Pulse Seismic (TSX:PSD) |
CA$3.97 |
CA$201.5M |
★★★★★★ |
|
Avino Silver & Gold Mines (TSX:ASM) |
CA$4.45 |
CA$646.16M |
★★★★★★ |
|
ACT Energy Technologies (TSX:ACX) |
CA$4.68 |
CA$158.82M |
★★★★★☆ |
|
Hemisphere Energy (TSXV:HME) |
CA$1.88 |
CA$179.49M |
★★★★★★ |
|
McChip Resources (TSXV:MCS) |
CA$1.51 |
CA$8.62M |
★★★★★★ |
Click here to see the full list of 439 stocks from our TSX Penny Stocks screener.
Here we highlight a subset of our preferred stocks from the screener.
Simply Wall St Financial Health Rating: ★★★★★★
Overview: Pulse Seismic Inc. acquires, markets, and licenses 2D and 3D seismic data for the energy sector in Canada with a market cap of CA$201.50 million.
Operations: The company’s revenue is derived entirely from its Oil Well Equipment & Services segment, generating CA$49.38 million.
Market Cap: CA$201.5M
Pulse Seismic Inc. has shown impressive financial performance, with net income for the second quarter reaching CA$9.57 million, a significant increase from the previous year. The company is debt-free and boasts high-quality earnings, with a remarkable Return on Equity of 76.5%. Its profitability growth has accelerated, outpacing industry averages, and its short-term assets comfortably cover both short- and long-term liabilities. Recent dividend announcements include a regular quarterly dividend and a special dividend totaling approximately CA$11 million. Despite an unstable dividend track record, Pulse Seismic’s seasoned management team continues to drive strong earnings growth.
-
Dive into the specifics of Pulse Seismic here with our thorough balance sheet health report.
-
Assess Pulse Seismic’s previous results with our detailed historical performance reports.
TSX:PSD Debt to Equity History and Analysis as at Aug 2025Critical Elements Lithium
Simply Wall St Financial Health Rating: ★★★★★☆
Overview: Critical Elements Lithium Corporation focuses on acquiring, exploring, and developing mining properties in Canada with a market cap of CA$98.03 million.
Operations: Currently, there are no reported revenue segments for the company.
Market Cap: CA$98.03M
Critical Elements Lithium Corporation, with a market cap of CA$98.03 million, remains pre-revenue as it focuses on exploration and development activities. Despite this, the company maintains a solid financial position with short-term assets of CA$25.4 million exceeding liabilities and no debt burden. Recent developments include regaining full ownership of the Bourier property and conducting extensive exploration on its Nemaska Belt properties to identify high-priority drill targets for potential Nickel-Copper-PGE mineralization. These strategic moves are supported by conditional funding commitments aimed at advancing the Rose Lithium-Tantalum project, highlighting growth potential despite current unprofitability.
-
Take a closer look at Critical Elements Lithium’s potential here in our financial health report.
-
Explore Critical Elements Lithium’s analyst forecasts in our growth report.
TSXV:CRE Financial Position Analysis as at Aug 2025Wallbridge Mining
Simply Wall St Financial Health Rating: ★★★★☆☆
Overview: Wallbridge Mining Company Limited focuses on acquiring, exploring, discovering, and developing gold properties, with a market cap of CA$76.99 million.
Operations: Wallbridge Mining Company Limited has not reported any revenue segments.
Market Cap: CA$76.99M
Wallbridge Mining Company Limited, with a market cap of CA$76.99 million, is pre-revenue and focuses on gold exploration. Recent drilling at the Martiniere project has shown promising high-grade gold intercepts in multiple zones, including Dragonfly and Martiniere Northeast. Despite its potential, Wallbridge faces challenges such as a volatile share price and limited cash runway under one year. The management team is relatively new with an average tenure of 1.8 years, while the company remains debt-free but unprofitable with increasing losses over five years. Short-term assets cover immediate liabilities but fall short for long-term obligations.
TSX:WM Debt to Equity History and Analysis as at Aug 2025Where To Now?
-
Discover the full array of 439 TSX Penny Stocks right here.
-
Want To Explore Some Alternatives? The best AI stocks today may lie beyond giants like Nvidia and Microsoft. Find the next big opportunity with these 19 smaller AI-focused companies with strong growth potential through early-stage innovation in machine learning, automation, and data intelligence that could fund your retirement.
This article by Simply Wall St is general in nature. We provide commentary based on historical data and analyst forecasts only using an unbiased methodology and our articles are not intended to be financial advice. It does not constitute a recommendation to buy or sell any stock, and does not take account of your objectives, or your financial situation. We aim to bring you long-term focused analysis driven by fundamental data. Note that our analysis may not factor in the latest price-sensitive company announcements or qualitative material. Simply Wall St has no position in any stocks mentioned.
Companies discussed in this article include TSX:PSD TSXV:CRE and TSX:WM.
This article was originally published by Simply Wall St.
Have feedback on this article? Concerned about the content? Get in touch with us directly. Alternatively, email editorial-team@simplywallst.com
Vancouver, British Columbia–(Newsfile Corp. – August 1, 2025) – Reagan Glazier, President & CEO, Pacific Bay Minerals Ltd. (TSXV: PBM) ("Pacific Bay" or, the "Company") reports that the proposed extension of warrants announced July 8th, 2025 will not be proceeding. The Company previously announced its intention to extend the expiry of 7,365,873 warrants that were issued July 20, 2022 (the "2022 Warrants") pursuant to a non-brokered private placement financing, which extension was subject to TSX Venture Exchange approval. The 2022 Warrants had an exercise price of $0.10 and expired on July 20, 2025. The TSXV declined to approve the extension as the market price exceeded the strike price of the Warrants at the relevant times.
Pacific Bay Minerals Ltd.Per/
Reagan Glazier, President and CEOreagan@pacificbayminerals.com(604) 682-2421
pacificbayminerals.com / Twitter / LinkedIn
Neither the TSX Venture Exchange nor its Regulation Services Provider (as that term is defined in the policies of the TSX Venture Exchange) accepts responsibility for the adequacy or accuracy of this release.
To view the source version of this press release, please visit https://www.newsfilecorp.com/release/261069
For new and old investors, taking full advantage of the stock market and investing with confidence are common goals.
While you may have an investing style you rely on, finding great stocks is made easier with the Zacks Style Scores. These are complementary indicators that rate stocks based on value, growth, and/or momentum characteristics.
Why This 1 Growth Stock Should Be On Your Watchlist
For growth investors, a company's financial strength, overall health, and future outlook take precedence, so they'll want to zero in on the Growth Style Score. This Score examines things like projected and historical earnings, sales, and cash flow to find stocks that will generate sustainable growth over time.
Southern Copper (SCCO)
Phoenix, AZ-based Southern Copper Corporation engages in mining, exploring, smelting, and refining copper and other minerals. The company conducts exploration activities in Argentina, Chile, Ecuador, Mexico and Peru.
SCCO is a Zacks Rank #3 (Hold) stock, with a Growth Style Score of A and VGM Score of A. Earnings are expected to grow 10.4% year-over-year for the current fiscal year, with sales growth of 8.2%.
Four analysts revised their earnings estimate higher in the last 60 days for fiscal 2025, while the Zacks Consensus Estimate has increased $0.4 to $4.78 per share. SCCO also boasts an average earnings surprise of 3.7%.
Southern Copper is also cash rich. The company has generated cash flow growth of 13.4%, and is expected to report cash flow expansion of 29.6% in 2025.
SCCO should be on investors' short lists because of its impressive growth fundamentals, a good Zacks Rank, and strong Growth and VGM Style Scores.
Want the latest recommendations from Zacks Investment Research? Today, you can download 7 Best Stocks for the Next 30 Days. Click to get this free report
Southern Copper Corporation (SCCO) : Free Stock Analysis Report
This article originally published on Zacks Investment Research (zacks.com).
VANCOUVER, BC, July 22, 2025 /CNW/ – Rokmaster Resources Corp. (TSXV: RKR) (OTCQB: RKMSF) (FSE: 1RR1) ("Rokmaster" or "the Company") is pleased to provide an update for ongoing fieldwork on the Nechako Project.
The Nechako Project area totals 27,178 hectares (271 km2) across three properties located in west-central British Columbia. Despite significant improvements in access by logging and in outcrop exposure by fires, the region remains an underexplored portion of the productive Stikine terrane which hosts many past producing deposits and advanced development projects (Figure 1).
Fieldwork beginning in May 2025 has already completed several key goals:
-
Ongoing prospecting and mapping on the Fox-Coconut and Mystery Properties including the collection of samples for spectral analysis.
-
Initial prospecting and soil sampling program completed on the Hanson Property resulted in the collection of 61 rock samples, 304 soil samples, and one sample for geochronology.
-
Airborne high-resolution magnetic surveys completed 70 line-km over the Fox Showing and 176 line-km over the central portion of the Mystery Property.
-
A field visit to the project properties by Mr. Alan J. Wilson, renowned expert in porphyry copper systems confirmed highly encouraging potassic alteration related to chalcopyrite and molybdenite mineralization on Rokmaster's Mystery and Hanson Properties.
Fieldwork plans for this August include:
-
Ongoing permitting work on the Hanson and Mystery Properties.
-
Trenching and sampling of the NW Structure on the Coconut Property.
-
A large phase of prospecting, mapping, and channel sampling on the Mystery Property.
John Mirko, President and CEO, comments:
"The field crews are off to a great start on the Nechako Project. After the first dedicated field work program on the Hanson Property we are very encouraged by what was observed in the field and are looking forward to the geochemical results. Work is ongoing on the Fox-Coconut and Mystery Properties where multiple datasets will be added to and combined together to develop robust targets for high-grade gold – silver mineralization and significant porphyry Cu-(Au-Mo) mineralization."
On Behalf of the Board of Directors of
Rokmaster Resources Corp.
John Mirko,President & Chief Executive Officer.
Neither TSX Venture Exchange nor its Regulation Services Provider (as that term in defined in the policies of the TSX Venture Exchange) accepts responsibility for the adequacy or accuracy of this press release.
CAUTIONARY NOTE REGARDING FORWARD LOOKING STATEMENTS: This news release may contain forward-looking information within the meaning of applicable securities laws ("forward-looking statements"). Forward-looking statements are statements that are not historical facts and are generally, but not always, identified by the words "expects," "plans," "anticipates," "believes," "intends," "estimates," 'projects," "potential" and similar expressions, or that events or conditions "will," "would," "may," "could" or "should" occur. These forward-looking statements are subject to a variety of risks and uncertainties which could cause actual events or results to differ materially from those reflected in the forward-looking statements, including, without limitation: receipt of regulatory approval with respect to the Hanson Property transaction; risks related to fluctuations in metal prices; uncertainties related to raising sufficient financing to fund the planned work in a timely manner and on acceptable terms; changes in planned work resulting from weather, logistical, technical or other factors; the possibility that results of work will not fulfill expectations and realize the perceived potential of the Company's properties; risk of accidents, equipment breakdowns and labour disputes or other unanticipated difficulties or interruptions; the possibility of cost overruns or unanticipated expenses in the work program; the risk of environmental contamination or damage resulting from Rokmaster's operations and other risks and uncertainties. Any forward-looking statement speaks only as of the date it is made and, except as may be required by applicable securities laws, the Company disclaims any intent or obligation to update any forward-looking statement, whether as a result of new information, future events or results or otherwise.
Rokmaster Resources Corp. logo (CNW Group/Rokmaster Resources Corp.)
SOURCE Rokmaster Resources Corp.
Cision
View original content to download multimedia: http://www.newswire.ca/en/releases/archive/July2025/22/c7957.html
Rokmaster Resources (RKR.V) was edging lower on Tuesday after providing an update for ongoing fieldw
The most recent trading session ended with Southern Copper (SCCO) standing at $93.16, reflecting a +0.89% shift from the previouse trading day's closing. This change lagged the S&P 500's 2.05% gain on the day. Elsewhere, the Dow saw an upswing of 1.78%, while the tech-heavy Nasdaq appreciated by 2.47%.
The the stock of miner has fallen by 1.58% in the past month, lagging the Basic Materials sector's gain of 2.82% and the S&P 500's gain of 5.21%.
Market participants will be closely following the financial results of Southern Copper in its upcoming release. On that day, Southern Copper is projected to report earnings of $1.05 per share, which would represent a year-over-year decline of 13.93%. Meanwhile, our latest consensus estimate is calling for revenue of $2.9 billion, down 6.86% from the prior-year quarter.
For the annual period, the Zacks Consensus Estimates anticipate earnings of $4.38 per share and a revenue of $11.88 billion, signifying shifts of +1.15% and +3.86%, respectively, from the last year.
Investors should also take note of any recent adjustments to analyst estimates for Southern Copper. These revisions help to show the ever-changing nature of near-term business trends. As a result, upbeat changes in estimates indicate analysts' favorable outlook on the company's business health and profitability.
Our research reveals that these estimate alterations are directly linked with the stock price performance in the near future. We developed the Zacks Rank to capitalize on this phenomenon. Our system takes these estimate changes into account and delivers a clear, actionable rating model.
The Zacks Rank system, which varies between #1 (Strong Buy) and #5 (Strong Sell), carries an impressive track record of exceeding expectations, confirmed by external audits, with stocks at #1 delivering an average annual return of +25% since 1988. Over the last 30 days, the Zacks Consensus EPS estimate has witnessed a 1.92% decrease. Currently, Southern Copper is carrying a Zacks Rank of #3 (Hold).
In terms of valuation, Southern Copper is presently being traded at a Forward P/E ratio of 21.07. This valuation marks a premium compared to its industry's average Forward P/E of 21.02.
Meanwhile, SCCO's PEG ratio is currently 2.23. This metric is used similarly to the famous P/E ratio, but the PEG ratio also takes into account the stock's expected earnings growth rate. As the market closed yesterday, the Mining – Non Ferrous industry was having an average PEG ratio of 0.77.
The Mining – Non Ferrous industry is part of the Basic Materials sector. At present, this industry carries a Zacks Industry Rank of 32, placing it within the top 13% of over 250 industries.
The Zacks Industry Rank is ordered from best to worst in terms of the average Zacks Rank of the individual companies within each of these sectors. Our research shows that the top 50% rated industries outperform the bottom half by a factor of 2 to 1.
Remember to apply Zacks.com to follow these and more stock-moving metrics during the upcoming trading sessions.
Want the latest recommendations from Zacks Investment Research? Today, you can download 7 Best Stocks for the Next 30 Days. Click to get this free report
Southern Copper Corporation (SCCO) : Free Stock Analysis Report
This article originally published on Zacks Investment Research (zacks.com).
If you would like to receive our free newsletter via email, simply enter your email address below & click subscribe.
 Follow us on Twitter
 Become our facebook fan
CONNECT WITH US
Tweets
Tweet with hash tag #miningfeeds or @miningfeeds and your tweets will be displayed across this site.
MOST ACTIVE MINING STOCKS
Daily Gainers
 CMC Metals Ltd. CMC Metals Ltd. |
CMB.V | +900.00% |
 Eden Energy Ltd Eden Energy Ltd |
EDE.AX | +200.00% |
| GoviEx Uranium Inc. |
GXU.V | +42.86% |
| Eagle Nickel Ltd. |
ENL.AX | +41.67% |
| Citigold Corp. Limited |
CTO.AX | +33.33% |
| Mount Burgess Mining NL |
MTB.AX | +33.33% |
| Exalt Resources Limited |
ERD.AX | +31.94% |
| Casa Minerals Inc. |
CASA.V | +30.00% |
| Cariboo Rose Resources Ltd |
CRB.V | +28.57% |
| Belmont Resources Inc. |
BEA.V | +28.57% |


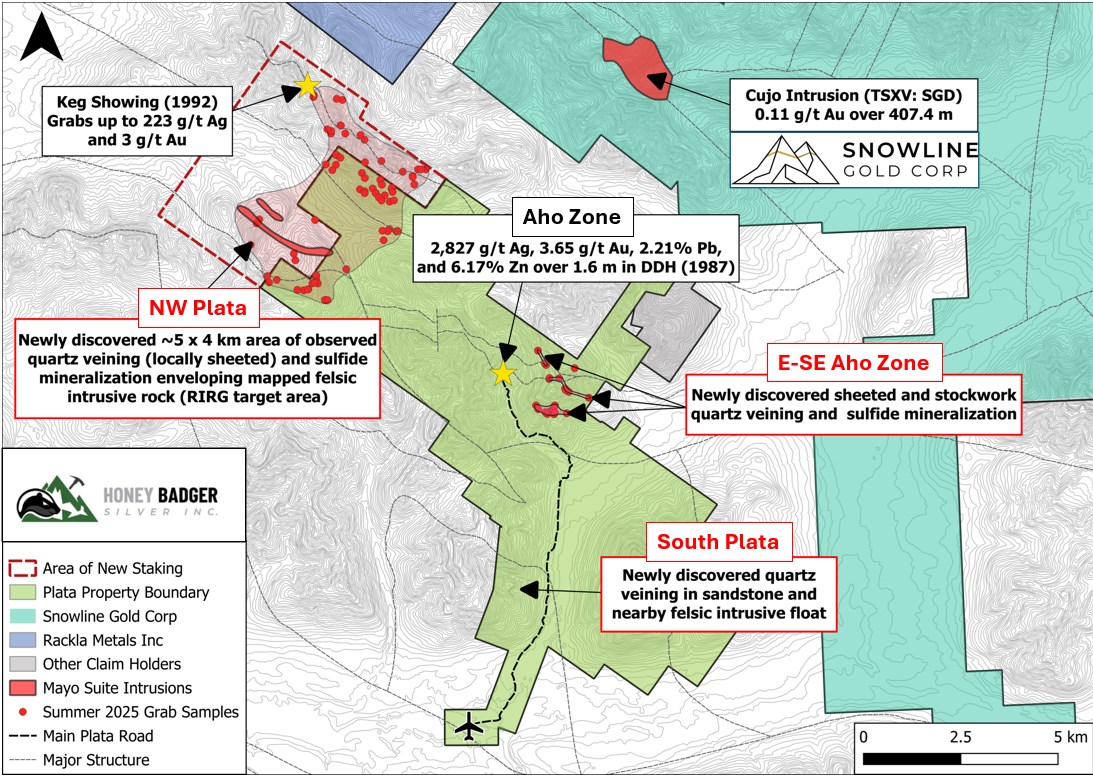
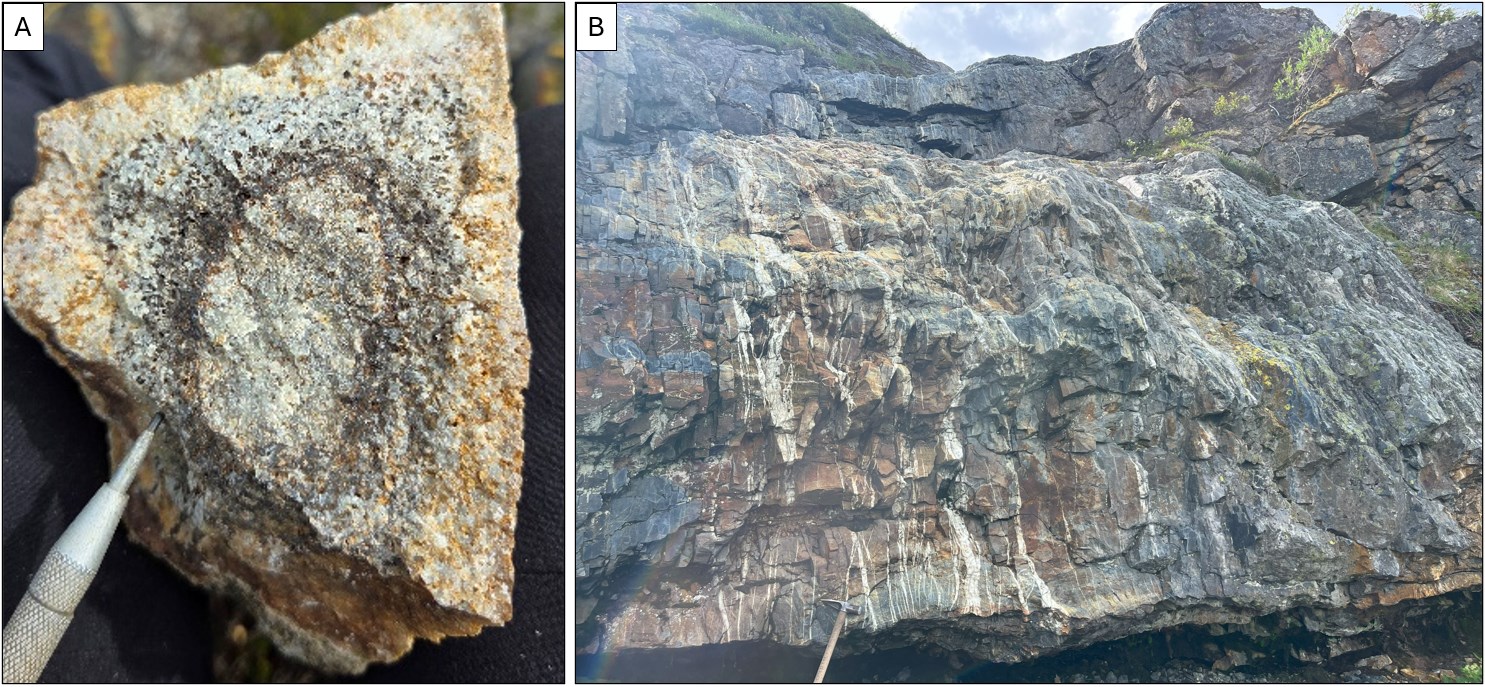
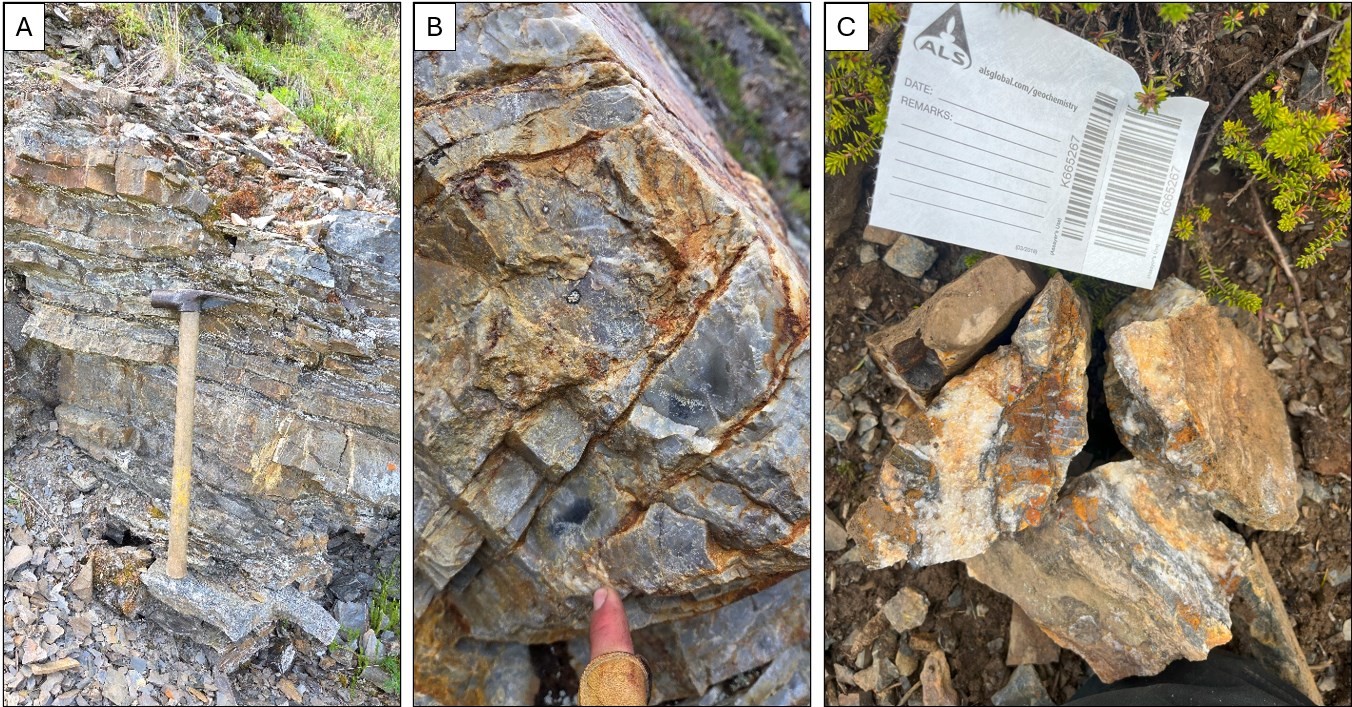