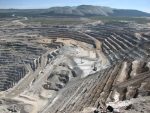
(Reuters) -Canadian miner Teck Resources on Thursday reported first-quarter results that beat expectations due to higher commodity prices and copper sales volumes.
The company reported adjusted earnings per share from continuing operations of C$0.60, above expectations of C$0.32, according to data compiled by LSEG.
"Our profitability improved significantly … primarily as a result of higher base metal prices, increased copper and zinc in concentrate sales volumes, and the positive impact of a weaker Canadian dollar on our business," Teck said in a statement.
Teck's first-quarter copper sales volumes rose to 106,200 tonnes, an increase of 11% year-on-year.
Revenue rose to C$2.29 billion ($1.65 billion) from C$1.62 billion last year, beating expectations.
Teck also maintained its forecast for 2025.
In February, the company had said that U.S. President Donald Trump's tariffs on Canadian imports will not have any material impact on its business.
($1 = 1.3867 Canadian dollars)
(Reporting by Kanjyik Ghosh; Editing by Mrigank Dhaniwala)
Teck Resources Ltd
Strong quarterly EBITDA and resilient balance sheet
VANCOUVER, British Columbia, April 24, 2025 (GLOBE NEWSWIRE) — Teck Resources Limited (TSX: TECK.A and TECK.B, NYSE: TECK) (Teck) today announced its unaudited first quarter results for 2025.
"Our profitability improved significantly in the first quarter compared to a year ago as a result of higher commodity prices and copper sales volumes, and we continue to return significant cash to shareholders," said Jonathan Price, President and CEO. "We remain committed to our strategy of balancing value-accretive growth with returns to shareholders, and our strong balance sheet and commercial strategy provide us with resilience and the ability to continue to create value amidst market uncertainty."
Highlights
-
Adjusted EBITDA1 of $927 million in Q1 2025 more than doubled compared to the same period last year, primarily driven by higher copper and zinc prices, and increased sales volumes of copper and zinc in concentrate. Our profit from continuing operations before taxes was $450 million in Q1 2025.
-
Adjusted profit from continuing operations attributable to shareholders1 was $303 million, or $0.60 per share, in Q1 2025. Our profit from continuing operations attributable to shareholders was $370 million.
-
From January 1 through April 23, 2025, we returned $505 million to shareholders through share buybacks, and in total, have completed $1.75 billion of our authorized share buyback program of $3.25 billion.
-
Our strong balance sheet provides resilience to market uncertainty, with liquidity as at April 23, 2025 of $10.0 billion, including $5.8 billion of cash. We ended the quarter in a net cash1 position of $764 million.
-
QB successfully achieved the completion testing requirements under the US$2.5 billion project finance facility, another milestone for QB that further confirms the robustness of the design, construction and operational performance of the asset as we advance ramp-up to consistent full production.
-
Copper production increased by 7% to 106,100 tonnes in Q1 2025 with steady performance across our established operations. QB produced 42,300 tonnes as production was impacted by an extended shutdown in January, a national power outage in Chile, and challenging weather, which reduced material movement needed to complete planned tailings lifts, ultimately reducing asset utilization.
-
Our copper business generated gross profit before depreciation and amortization1 of $704 million in the first quarter, up 90% from a year ago, driven by higher copper prices and an increase in sales volumes of 11% to 106,200 tonnes. Gross profit from our copper business was $343 million in the first quarter.
-
Our zinc business generated gross profit before depreciation and amortization1 of $225 million in the first quarter, up 79% from a year ago, supported by a 16% increase in zinc prices, strong sales volumes at Red Dog, and improved profitability at Trail. Sales volumes from Red Dog were 90,800 tonnes, higher than our previously disclosed guidance range. Gross profit from our zinc business was $193 million in the first quarter.
-
QB's third labour union ratified a new three-year collective bargaining agreement in early April, completing all labour negotiations for QB's workforce. Labour agreements are now in place through 2028 across our QB operation.
Note:1. This is a non-GAAP financial measure or ratio. See “Use of Non-GAAP Financial Measures and Ratios” for further information.
Financial Summary Q1 2025
|
Financial Metrics(CAD$ in millions, except per share data) |
Q1 2025 |
Q1 2024 |
||||
|
Revenue |
$ |
2,290 |
|
$ |
1,619 |
|
|
Gross profit |
$ |
536 |
|
$ |
169 |
|
|
Gross profit before depreciation and amortization1 |
$ |
929 |
|
$ |
497 |
|
|
Profit (loss) from continuing operations before taxes |
$ |
450 |
|
$ |
(235 |
) |
|
Adjusted EBITDA1 |
$ |
927 |
|
$ |
409 |
|
|
Profit (loss) from continuing operations attributable to shareholders |
$ |
370 |
|
$ |
(125 |
) |
|
Adjusted profit (loss) from continuing operations attributable to shareholders1 |
$ |
303 |
|
$ |
(6 |
) |
|
Basic earnings (loss) per share from continuing operations |
$ |
0.74 |
|
$ |
(0.24 |
) |
|
Diluted earnings (loss) per share from continuing operations |
$ |
0.73 |
|
$ |
(0.24 |
) |
|
Adjusted basic earnings (loss) per share from continuing operations1 |
$ |
0.60 |
|
$ |
(0.01 |
) |
|
Adjusted diluted earnings (loss) per share from continuing operations1 |
$ |
0.60 |
|
$ |
(0.01 |
) |
|
|
|
|
|
|
|
|
Note:1. This is a non-GAAP financial measure or ratio. See “Use of Non-GAAP Financial Measures and Ratios” for further information.
Key Updates
QB Ramp-Up
-
QB ramp-up continued in the quarter with production of 42,300 tonnes. Production during the quarter was impacted by the 18-day shutdown in January to conduct maintenance and reliability work, and complete additional tailings lifts as part of the development of the Tailings Management Facility (TMF), as previously disclosed. Production was also negatively impacted by a nationwide power outage in Chile at the end of February, which resulted in the site being without power causing several days of unplanned downtime.
-
In the first quarter, challenging weather impacted the material movement needed to complete the planned tailings lifts, ultimately reducing asset utilization and production. TMF development was also impacted by challenges with sand deposition in the first quarter of 2025 due to sand drainage times being longer than expected. This has resulted in a delay in completing the required tailings lifts associated with the development of the TMF. As a result, we expect to extend planned maintenance shutdowns in the second and third quarters to advance TMF development.
-
Despite factors impacting asset utilization at QB, outlined above, and excluding the extended shut-down in the quarter, the average daily plant throughput increased in the first quarter of 2025 compared to the fourth quarter of 2024, demonstrating continued improvement in operational stability. Higher levels of transition ore material were mined in the first quarter, leading to lower recoveries, consistent with our previously disclosed guidance. Higher grade ore mined in March increased the average grade in the first quarter. We continue to estimate average grades of approximately 0.60% for 2025, and grade variability is expected over the mine life.
-
The overall performance of QB continues to improve, as indicated by the average daily throughput rates, and recoveries and grades are in line with our expectations. Further validating the capability of the operations to operate at design levels and generate strong cash flow, we achieved the QB project financing completion testing requirements, which included a series of independently verified operational and technical tests. With this milestone now reached, Teck and the other sponsor guarantees of the project finance facility have been released.
-
We continue to expect to be within our previously disclosed 2025 annual copper and molybdenum production guidance ranges for QB of between 230,000 and 270,000 tonnes and between 3,000 and 4,500 tonnes, respectively, albeit at the lower end of the ranges as a result of the maintenance shutdowns, noted above. Our previously disclosed 2025 annual net cash unit cost1 guidance for QB of US$1.80 –$2.15 per pound is unchanged, although we expect to be at the higher end of the range.
Note:1. This is a non-GAAP financial measure or ratio. See “Use of Non-GAAP Financial Measures and Ratios” for further information.
Value-Driven Growth
-
In Q1, we continued to make progress in advancing our copper growth strategy, reinforcing our commitment to long-term value creation through a balanced approach of growth investments and shareholder returns. Our focus remains on advancing our near-term projects – Highland Valley Copper Mine Life Extension (HVC MLE), Zafranal, where we received the permit for Advanced Works in early April, and San Nicolás – for potential sanction decisions in 2025, and advancing optimization of QB, with a strong focus on identifying near-term opportunities for debottlenecking within the current asset base.
-
Our disciplined capital allocation framework and project sanction requirements address short term uncertainty in commodity pricing and enable prudent deployment of capital. All growth projects must meet stringent criteria, delivering attractive risk-adjusted returns and competing for capital in alignment with Teck’s capital allocation framework.
Safety and Sustainability Leadership
-
Our High-Potential Incident (HPI) Frequency rate remained low at 0.05, reflecting strong safety performance in the first quarter of 2025.
-
On March 21, 2025, we released our 24th annual Sustainability Report, outlining Teck’s 2024 environmental and social performance and continued commitment to responsible development.
Guidance
There has been no change to our previously disclosed guidance. Our guidance is outlined in summary below and our usual guidance tables, including three-year production guidance, can be found on pages 25–28 of Teck’s first quarter results for 2025 at the link below.
|
2025 Guidance – Summary |
Current |
|
Production Guidance |
|
|
Copper (000’s tonnes) |
490 – 565 |
|
Zinc (000’s tonnes) |
525 – 575 |
|
Refined zinc (000’s tonnes) |
190 – 230 |
|
Sales Guidance – Q2 2025 |
|
|
Red Dog zinc in concentrate sales (000’s tonnes) |
25 – 35 |
|
Unit Cost Guidance |
|
|
Copper net cash unit costs (US$/lb.)1 |
1.65 – 1.95 |
|
Zinc net cash unit costs (US$/lb.)1 |
0.45 – 0.55 |
|
|
|
Note:1. This is a non-GAAP financial measure or ratio. See “Use of Non-GAAP Financial Measures and Ratios” for further information.
All dollar amounts expressed in this news release are in Canadian dollars unless otherwise noted.
Click here to view Teck’s full first quarter results for 2025.
WEBCAST
Teck will host an Investor Conference Call to discuss its Q1/2025 financial results at 11:00 AM Eastern time, 8:00 AM Pacific time, on April 24, 2025. A live audio webcast of the conference call, together with supporting presentation slides, will be available at our website at www.teck.com. The webcast will be archived at www.teck.com.
REFERENCE
Emma Chapman, Vice President, Investor Relations: +44 207.509.6576Dale Steeves, Director, External Communications: +1 236.987.7405
USE OF NON-GAAP FINANCIAL MEASURES AND RATIOS
Our annual financial statements are prepared in accordance with IFRS® Accounting Standards as issued by the International Accounting Standards Board (IASB). Our interim financial results are prepared in accordance with IAS 34, Interim Financial Reporting (IAS 34). This document refers to a number of non-GAAP financial measures and non-GAAP ratios, which are not measures recognized under IFRS Accounting Standards and do not have a standardized meaning prescribed by IFRS Accounting Standards or by Generally Accepted Accounting Principles (GAAP) in the United States.
The non-GAAP financial measures and non-GAAP ratios described below do not have standardized meanings under IFRS Accounting Standards, may differ from those used by other issuers, and may not be comparable to similar financial measures and ratios reported by other issuers. These financial measures and ratios have been derived from our financial statements and applied on a consistent basis as appropriate. We disclose these financial measures and ratios because we believe they assist readers in understanding the results of our operations and financial position and provide further information about our financial results to investors. These measures should not be considered in isolation or used as a substitute for other measures of performance prepared in accordance with IFRS Accounting Standards.
Adjusted profit (loss) from continuing operations attributable to shareholders – For adjusted profit from continuing operations attributable to shareholders, we adjust profit from continuing operations attributable to shareholders as reported to remove the after-tax effect of certain types of transactions that reflect measurement changes on our balance sheet or are not indicative of our normal operating activities.
EBITDA – EBITDA is profit before net finance expense, provision for income taxes, and depreciation and amortization.
Adjusted EBITDA – Adjusted EBITDA is EBITDA before the pre-tax effect of the adjustments that we make to adjusted profit from continuing operations attributable to shareholders as described above.
Adjusted profit from continuing operations attributable to shareholders, EBITDA and Adjusted EBITDA highlight items and allow us and readers to analyze the rest of our results more clearly. We believe that disclosing these measures assists readers in understanding the ongoing cash-generating potential of our business in order to provide liquidity to fund working capital needs, service outstanding debt, fund future capital expenditures and investment opportunities, and pay dividends.
Adjusted basic earnings (loss) per share from continuing operations – Adjusted basic earnings per share from continuing operations is adjusted profit from continuing operations attributable to shareholders divided by average number of shares outstanding in the period.
Adjusted diluted earnings (loss) per share from continuing operations – Adjusted diluted earnings per share from continuing operations is adjusted profit from continuing operations attributable to shareholders divided by average number of fully diluted shares in a period.
Gross profit before depreciation and amortization – Gross profit before depreciation and amortization is gross profit with depreciation and amortization expense added back. We believe this measure assists us and readers to assess our ability to generate cash flow from our reportable segments or overall operations.
Total cash unit costs – Total cash unit costs for our copper and zinc operations includes adjusted cash costs of sales, as described below, plus the smelter and refining charges added back in determining adjusted revenue. This presentation allows a comparison of total cash unit costs, including smelter charges, to the underlying price of copper or zinc in order to assess the margin for the mine on a per unit basis.
Net cash unit costs – Net cash unit costs of principal product, after deducting co-product and by-product margins, are also a common industry measure. By deducting the co- and by-product margin per unit of the principal product, the margin for the mine on a per unit basis may be presented in a single metric for comparison to other operations.
Adjusted cash cost of sales – Adjusted cash cost of sales for our copper and zinc operations is defined as the cost of the product delivered to the port of shipment, excluding depreciation and amortization charges, any one-time collective agreement charges or inventory write-down provisions and by-product cost of sales. It is common practice in the industry to exclude depreciation and amortization, as these costs are non-cash, and discounted cash flow valuation models used in the industry substitute expectations of future capital spending for these amounts.
Total debt – Total debt is the sum of debt plus lease liabilities, including the current portions of debt and lease liabilities.
Net debt (cash) – Net debt (cash) is total debt, less cash and cash equivalents. Net cash is the amount by which our cash balance exceeds our total debt balance.
Profit (Loss) from Continuing Operations Attributable to Shareholders and Adjusted Profit (Loss) from Continuing Operations Attributable to Shareholders
|
|
Three months ended March 31, |
|||||
|
(CAD$ in millions) |
|
2025 |
|
2024 |
||
|
|
|
|
||||
|
Profit (loss) from continuing operations attributable to shareholders |
$ |
370 |
|
$ |
(125 |
) |
|
Add (deduct) on an after-tax basis: |
|
|
||||
|
QB variable consideration to IMSA and Codelco |
|
(50 |
) |
|
10 |
|
|
Environmental costs |
|
6 |
|
|
(11 |
) |
|
Share-based compensation |
|
10 |
|
|
25 |
|
|
Commodity derivatives |
|
(20 |
) |
|
2 |
|
|
Foreign exchange losses |
|
— |
|
|
22 |
|
|
Tax items |
|
(28 |
) |
|
44 |
|
|
Other |
|
15 |
|
|
27 |
|
|
|
|
|
||||
|
Adjusted profit (loss) from continuing operations attributable to shareholders |
$ |
303 |
|
$ |
(6 |
) |
|
|
|
|
||||
|
Basic earnings (loss) per share from continuing operations |
$ |
0.74 |
|
$ |
(0.24 |
) |
|
Diluted earnings (loss) per share from continuing operations |
$ |
0.73 |
|
$ |
(0.24 |
) |
|
Adjusted basic earnings (loss) per share from continuing operations |
$ |
0.60 |
|
$ |
(0.01 |
) |
|
Adjusted diluted earnings (loss) per share from continuing operations |
$ |
0.60 |
|
$ |
(0.01 |
) |
|
|
|
|
||||
|
|
|
|
||||
Reconciliation of Basic Earnings (Loss) per share from Continuing Operations to Adjusted Basic Earnings (Loss) per share from Continuing Operations
|
|
Three months ended March 31, |
|||||
|
(Per share amounts) |
|
2025 |
|
2024 |
||
|
|
|
|
||||
|
Basic earnings (loss) per share from continuing operations |
$ |
0.74 |
|
$ |
(0.24 |
) |
|
Add (deduct): |
|
|
||||
|
QB variable consideration to IMSA and Codelco |
|
(0.10 |
) |
|
0.02 |
|
|
Environmental costs |
|
0.01 |
|
|
(0.02 |
) |
|
Share-based compensation |
|
0.02 |
|
|
0.05 |
|
|
Commodity derivatives |
|
(0.04 |
) |
|
— |
|
|
Foreign exchange losses |
|
— |
|
|
0.04 |
|
|
Tax items |
|
(0.06 |
) |
|
0.08 |
|
|
Other |
|
0.03 |
|
|
0.06 |
|
|
|
|
|
||||
|
Adjusted basic earnings (loss) per share from continuing operations |
$ |
0.60 |
|
$ |
(0.01 |
) |
|
|
|
|
||||
|
|
|
|
||||
Reconciliation of Diluted Earnings (Loss) per share from Continuing Operations to Adjusted Diluted Earnings (Loss) per share from Continuing Operations
|
|
Three months ended March 31, |
|||||
|
(Per share amounts) |
|
2025 |
|
2024 |
||
|
|
|
|
||||
|
Diluted earnings (loss) per share from continuing operations |
$ |
0.73 |
|
$ |
(0.24 |
) |
|
Add (deduct): |
|
|
||||
|
QB variable consideration to IMSA and Codelco |
|
(0.10 |
) |
|
0.02 |
|
|
Environmental costs |
|
0.01 |
|
|
(0.02 |
) |
|
Share-based compensation |
|
0.02 |
|
|
0.05 |
|
|
Commodity derivatives |
|
(0.04 |
) |
|
— |
|
|
Foreign exchange losses |
|
— |
|
|
0.04 |
|
|
Tax items |
|
(0.05 |
) |
|
0.08 |
|
|
Other |
|
0.03 |
|
|
0.06 |
|
|
|
|
|
||||
|
Adjusted diluted earnings (loss) per share from continuing operations |
$ |
0.60 |
|
$ |
(0.01 |
) |
|
|
|
|
||||
|
|
|
|
||||
Reconciliation of EBITDA and Adjusted EBITDA
|
|
Three months ended March 31, |
|||||
|
(CAD$ in millions) |
|
2025 |
|
2024 |
||
|
|
|
|
||||
|
Profit (loss) from continuing operations before taxes |
$ |
450 |
|
$ |
(235 |
) |
|
Finance expense net of finance income |
|
129 |
|
|
196 |
|
|
Depreciation and amortization |
|
412 |
|
|
345 |
|
|
|
|
|
||||
|
EBITDA |
|
991 |
|
|
306 |
|
|
|
|
|
||||
|
Add (deduct): |
|
|
||||
|
QB variable consideration to IMSA and Codelco |
|
(84 |
) |
|
20 |
|
|
Environmental costs |
|
9 |
|
|
(22 |
) |
|
Share-based compensation |
|
12 |
|
|
33 |
|
|
Commodity derivatives |
|
(28 |
) |
|
2 |
|
|
Foreign exchange (gains) losses |
|
(1 |
) |
|
18 |
|
|
Other |
|
28 |
|
|
52 |
|
|
|
|
|
||||
|
Adjusted EBITDA |
$ |
927 |
|
$ |
409 |
|
|
|
|
|
||||
|
|
|
|
||||
Reconciliation of Gross Profit Before Depreciation and Amortization
|
|
Three months ended March 31, |
|||||
|
(CAD$ in millions) |
|
2025 |
|
2024 |
||
|
|
|
|
||||
|
Gross profit |
$ |
536 |
|
$ |
169 |
|
|
Depreciation and amortization |
|
393 |
|
|
328 |
|
|
|
|
|
||||
|
Gross profit before depreciation and amortization |
$ |
929 |
|
$ |
497 |
|
|
|
|
|
||||
|
Reported as: |
|
|
||||
|
Copper |
|
|
||||
|
Quebrada Blanca |
$ |
176 |
|
$ |
66 |
|
|
Highland Valley Copper |
|
190 |
|
|
112 |
|
|
Antamina |
|
233 |
|
|
197 |
|
|
Carmen de Andacollo |
|
104 |
|
|
(4 |
) |
|
Other |
|
1 |
|
|
— |
|
|
|
|
|
||||
|
|
|
704 |
|
|
371 |
|
|
|
|
|
||||
|
Zinc |
|
|
||||
|
Trail Operations |
|
80 |
|
|
25 |
|
|
Red Dog |
|
139 |
|
|
108 |
|
|
Other |
|
6 |
|
|
(7 |
) |
|
|
|
|
||||
|
|
|
225 |
|
|
126 |
|
|
|
|
|
||||
|
Gross profit before depreciation and amortization |
$ |
929 |
|
$ |
497 |
|
|
|
|
|
||||
|
|
|
|
||||
CAUTIONARY STATEMENT ON FORWARD-LOOKING STATEMENTS
This news release contains certain forward-looking information and forward-looking statements as defined in applicable securities laws (collectively referred to as forward-looking statements). These statements relate to future events or our future performance. All statements other than statements of historical fact are forward-looking statements. The use of any of the words “anticipate”, “plan”, “continue”, “estimate”, “expect”, “may”, “will”, “project”, “predict”, “potential”, “should”, “believe” and similar expressions is intended to identify forward-looking statements. These statements involve known and unknown risks, uncertainties and other factors that may cause actual results or events to differ materially from those anticipated in such forward-looking statements. These statements speak only as of the date of this news release.
These forward-looking statements include, but are not limited to, statements concerning: our focus and strategy, including being a pure-play energy transition metals company; anticipated global and regional supply, demand and market outlook for our commodities; our business, assets, and strategy going forward, including with respect to future and ongoing project development; our ability to execute our copper growth strategy in a value accretive manner; the timing and format of any cash returns to shareholders; our expectations regarding cost, timing and completion of TMF development and installation of remaining permanent tailings infrastructure at our QB operations; the continued ramp-up to consistent full production and future optimization and debottlenecking of our QB operations; our expectations with respect to the occurrence, timing and length of required maintenance shutdowns; expectations regarding inflationary pressures and our ability to manage controllable operating expenditures; expectations with respect to the potential impact of any tariffs, countervailing duties or other trade restrictions, including the impact on trade flows, demand for our products and general economic conditions and our ability to manage our sale arrangements to minimize any impacts or maintain compliance with any exemptions provided; expectations with respect to execution of our copper growth strategy, including the timing and occurrence of any sanction decisions and prioritization and amount of planned growth capital expenditures; expectations regarding advancement of our copper growth portfolio projects, including advancement of study, permitting, execution planning, detailed engineering and design, risk mitigation, and advanced early works, community and Indigenous engagement, completion of updated cost estimates, tendering processes, and timing for receipt of permits related to QB debottlenecking, the HVC MLE, San Nicolás, and Zafranal projects, as applicable; expectations with respect to timing and outcome of the regulatory approvals process for our copper growth projects, including with respect to the dispute resolution processes underway related to HVC MLE; expectations for copper growth capital expenditures to progress our medium- to long-term projects, including Galore Creek, Schaft Creek, NewRange, and NuevaUnion; expectations regarding our effective tax rate; liquidity and availability of borrowings under our credit facilities; requirements to post and our ability to obtain additional credit for posting security for reclamation at our sites; expectations for our general and administration and research and innovation costs and costs related to the ERP system; all guidance appearing in this document including but not limited to the production, sales, cost, unit cost, capital expenditure, capitalized production stripping, operating outlook, and other guidance under the headings “Guidance” and "Outlook" and as discussed elsewhere in the various reportable segment sections; our expectations regarding inflationary pressures and increased key input costs; and expectations regarding the adoption of new accounting standards and the impact of new accounting developments.
These statements are based on a number of assumptions, including, but not limited to, assumptions disclosed elsewhere in this document and assumptions regarding general business and economic conditions, interest rates, commodity and power prices; acts of foreign or domestic governments and the outcome of legal proceedings; the imposition of tariffs, import or export restrictions, or other trade barriers or retaliatory measures by foreign or domestic governments; the continued operation of QB in accordance with our expectations; our ability to complete TMF development work in a timely manner; the possibility that our business may not perform as expected or in a manner consistent with historical performance; the supply and demand for, deliveries of, and the level and volatility of prices of copper and zinc and our other metals and minerals, as well as steel, crude oil, natural gas and other petroleum products; the timing of the receipt of permits and other regulatory and governmental approvals for our development projects and other operations, including mine extensions; positive results from the studies on our expansion and development projects; our ability to secure adequate transportation, including rail and port services, for our products; our costs of production and our production and productivity levels, as well as those of our competitors; continuing availability of water and power resources for our operations; changes in credit market conditions and conditions in financial markets generally; the availability of funding to refinance our borrowings as they become due or to finance our development projects on reasonable terms; availability of letters of credit and other forms of financial assurance acceptable to regulators for reclamation and other bonding requirements; our ability to procure equipment and operating supplies in sufficient quantities and on a timely basis; the availability of qualified employees and contractors for our operations, including our new developments and our ability to attract and retain skilled employees; the satisfactory negotiation of collective agreements with unionized employees; the impact of changes in Canadian-U.S. dollar, Canadian dollar-Chilean Peso and other foreign exchange rates on our costs and results; engineering and construction timetables and capital costs for our development and expansion projects; our ability to develop technology and obtain the benefits of technology for our operations and development projects; closure costs; environmental compliance costs; market competition; the accuracy of our mineral reserve and resource estimates (including with respect to size, grade and recoverability) and the geological, operational and price assumptions on which these are based; tax benefits and statutory and effective tax rates; the outcome of our copper, zinc and lead concentrate treatment and refining charge negotiations with customers; the resolution of environmental and other proceedings or disputes; our ability to obtain, comply with and renew permits, licenses and leases in a timely manner; and our ongoing relations with our employees and with our business and joint venture partners.
Statements regarding the availability of our credit facilities are based on assumptions that we will be able to satisfy the conditions for borrowing at the time of a borrowing request and that the facilities are not otherwise terminated or accelerated due to an event of default. Assumptions regarding the costs and benefits of our projects include assumptions that the relevant project is constructed, commissioned and operated in accordance with current expectations. Expectations regarding our operations are based on numerous assumptions regarding the operations. Our Guidance tables include disclosure and footnotes with further assumptions relating to our guidance, and assumptions for certain other forward-looking statements accompany those statements within the document. Statements concerning future production costs or volumes are based on numerous assumptions regarding operating matters and on assumptions that demand for products develops as anticipated, that customers and other counterparties perform their contractual obligations, that operating and capital plans will not be disrupted by issues such as mechanical failure, unavailability of parts and supplies, labour disturbances, interruption in transportation or utilities, or adverse weather conditions, and that there are no material unanticipated variations in the cost of energy or supplies. The foregoing list of assumptions is not exhaustive. Events or circumstances could cause actual results to vary materially.
Factors that may cause actual results to vary materially include, but are not limited to, changes in commodity and power prices; changes in market demand for our products; changes in interest and currency exchange rates; acts of governments and the outcome of legal proceedings; the imposition of tariffs, import or export restrictions, or other trade barriers or retaliatory measures by foreign or domestic governments; inaccurate geological and metallurgical assumptions (including with respect to the size, grade and recoverability of mineral reserves and resources); operational difficulties (including failure of plant, equipment or processes to operate in accordance with specifications or expectations, cost escalation, unavailability of labour, materials and equipment); government action or delays in the receipt of government approvals; changes in royalty or tax rates; industrial disturbances or other job action; adverse weather conditions; unanticipated events related to health, safety and environmental matters; union labour disputes; political risk; social unrest; failure of customers or counterparties (including logistics suppliers) to perform their contractual obligations; changes in our credit ratings; unanticipated increases in costs to construct our development projects; difficulty in obtaining permits; inability to address concerns regarding permits or environmental impact assessments; and changes or further deterioration in general economic conditions. The amount and timing of capital expenditures is depending upon, among other matters, being able to secure permits, equipment, supplies, materials and labour on a timely basis and at expected costs. Certain operations and projects are not controlled by us; schedules and costs may be adjusted by our partners, and timing of spending and operation of the operation or project is not in our control. Certain of our other operations and projects are operated through joint arrangements where we may not have control over all decisions, which may cause outcomes to differ from current expectations. Ongoing monitoring may reveal unexpected environmental conditions at our operations and projects that could require additional remedial measures. Production at our QB and Red Dog Operations may also be impacted by water levels at site. Sales to China may be impacted by general and specific port restrictions, Chinese regulation and policies, and normal production and operating risks.
We assume no obligation to update forward-looking statements except as required under securities laws. Further information concerning risks, assumptions and uncertainties associated with these forward-looking statements and our business can be found in our Annual Information Form for the year ended December 31, 2024 filed under our profile on SEDAR+ (www.sedarplus.ca) and on EDGAR (www.sec.gov) under cover of Form 40-F, as well as subsequent filings that can also be found under our profile.
Scientific and technical information in this quarterly report regarding our material properties was reviewed, approved and verified by Rodrigo Alves Marinho, P.Geo., a contractor of Teck and a Qualified Person as defined under National Instrument 43-101.
We recently published a list of 12 Best Uranium Stocks to Invest in According to Analysts. In this article, we are going to take a look at where BHP Group Limited (NYSE:BHP) stands against other uranium stocks to invest in.
Nuclear power is making a notable comeback. More than 20 countries pledged to triple nuclear energy by 2050 at the COP28 summit. Nuclear power is considered crucial for lowering emissions, and it is gaining support from both environmental advocates and US national security interests, though for different motivations. Big tech companies are also getting involved as they hunt for more energy to power massive data centers.
Uranium is not presently categorized as a “critical mineral” by the US Geological Survey (USGS) because it is classified as a fuel mineral. However, President Trump is pushing for its inclusion in the list, which would gather federal support and speed up project approvals. This seems like a sensible play on Trump’s part, as demand for uranium is climbing, and the US relies almost entirely on imports, with most of the world’s supply originating from a handful of countries. Uranium prices were at a 16-year high in 2023 and, while they have dipped marginally, they remain higher than at any time since Fukushima in 2011.
In December 2024, John Ciampaglia, CEO of Sprott Asset Management, told CNBC that the uranium industry had been on life support for nearly a decade after Fukushima, and there needed to be better supply discipline in the market. Uranium producers need to ensure that future supply matches demand. He noted that three factors supported the industry – first, the growing electrification in China, India, and other developing countries, secondly, energy security and decarbonization are putting the focus back on nuclear fuel as an energy source, and third, tech companies are now investing in the development of small modular reactors. He also commented on uranium spot and market prices, which are gradually moving upward. He believes uranium prices need to go higher to incentivize chemical producers and miners to increase production and build new mines, which is critical to developing uranium as a reliable electricity fuel in the coming decades.
Current supply shortages, higher long-term prices, and forecasts for record nuclear energy production in 2025 all point to a positive future. With that industry outlook in mind, let’s take a look at the best uranium stocks to buy according to analysts.
BHP Group Limited (BHP): Among the Best Uranium Stocks to Invest in According to Analysts
An aerial view of a mining operation in action, with large trucks and yellow diggers.
Our Methodology
For this article, we searched credible websites and compiled an extensive list of US-listed uranium stocks. Next, we manually searched for the average upside potential of each stock and selected 12 stocks with the highest values. The list below is ranked in ascending order of the upside potential as of April 19. We have also mentioned the hedge fund sentiment as of Q4 2024.
Why are we interested in the stocks that hedge funds pile into? The reason is simple: our research has shown that we can outperform the market by imitating the top stock picks of the best hedge funds. Our quarterly newsletter’s strategy selects 14 small-cap and large-cap stocks every quarter and has returned 373.4% since May 2014, beating its benchmark by 218 percentage points (see more details here).
BHP Group Limited (NYSE:BHP)
Number of Hedge Fund Holders: 28
Average Upside Potential: 14.82%
BHP Group Limited (NYSE:BHP) is one of the biggest natural resources companies in the world, focusing on the mining of copper, iron ore, coal, gold, uranium, nickel, silver, zinc, lead, cobalt, and molybdenum. It is one of the best uranium stocks on Wall Street. On February 18, 2025, the company announced an interim dividend of $0.50 per share for the half year ended 31 December 2024. The dividend was distributed to shareholders on March 27. The company has consistently shelled out dividends for 45 years.
In February 2025, BHP Group Limited (NYSE:BHP) assured investors that it can double its copper production in South Australia without significantly increasing uranium output. This helps ease long-time concerns that expanding the Olympic Dam mine would flood the market with excess uranium and drive prices down. Under its new smelter expansion plan, copper production could jump from 322,000 to 650,000 tonnes a year, while uranium output would only rise slightly, from 3,600 to no more than 4,000 tonnes.
According to Insider Monkey’s fourth quarter database, 28 hedge funds were bullish on BHP Group Limited (NYSE:BHP), compared to 22 funds in the prior quarter. Ken Fisher’s Fisher Asset Management holds a $1 billion stake in the company.
Overall, BHP ranks 12th among the best uranium stocks to invest in according to analysts. While we acknowledge the potential of BHP as an investment, our conviction lies in the belief that AI stocks hold greater promise for delivering higher returns, and doing so within a shorter time frame. There is an AI stock that went up since the beginning of 2025, while popular AI stocks lost around 25%. If you are looking for an AI stock that is more promising than BHP but that trades at less than 5 times its earnings, check out our report about this cheapest AI stock.
READ NEXT: 20 Best AI Stocks To Buy Now and 30 Best Stocks to Buy Now According to Billionaires.
Disclosure: None. This article is originally published at Insider Monkey.
Freeport-McMoRan Inc. FCX and Southern Copper Corporation SCCO are two heavyweights in the copper mining industry. Both operate on a global scale, extracting and processing copper and other metals. Also, both are navigating challenges such as fluctuating copper prices and global economic uncertainties. Given the current uncertainties surrounding the U.S.-China trade tensions and their potential impact on copper prices, analyzing these companies' fundamentals is timely and pertinent.Copper prices surged to a new record high of $5.24 per pound in late March as buyers stocked up the commodity amid concerns that President Donald Trump could impose tariffs on copper, leading to a disruption in the global supply chain. However, prices nosedived to around $4.1 per pound earlier this month amid demand worries due to tariffs, which threatened to cause a broader slowdown globally. Prices of the red metal have moved up lately to roughly $4.9 per pound amid a weakening U.S. dollar on heightened concerns about the prospect of a downturn in the U.S. economy. The trade conflict with China continues to pose risks to copper demand, as the metal is essential in various industries, including electronics and construction. Let’s dive deep and closely compare the fundamentals of these two copper mining giants to determine which one is a better investment now.
The Case for Freeport
Freeport is well-placed with high-quality copper assets and remains focused on strong execution and advancing its organic growth opportunities. At its Cerro Verde operation in Peru, a large-scale concentrator expansion provided incremental annual production of around 600 million pounds of copper and 15 million pounds of molybdenum. It is evaluating a large-scale expansion at El Abra in Chile to define a large sulfide resource that could potentially support a major mill project similar to the large-scale concentrator at Cerro Verde. FCX is also conducting pre-feasibility studies (expected to be completed by mid-2026) in the Safford/Lone Star operations in Arizona to define a significant sulfide expansion opportunity. It also has expansion opportunities at Bagdad in Arizona to more than double the concentrator capacity of the operation. Also, PT Freeport Indonesia (PT-FI) substantially completed the construction of the new greenfield smelter in Eastern Java during 2024, with an expected start-up in mid-2025, followed by a full ramp-up by the end of 2025. PT-FI is also developing the Kucing Liar ore body within the Grasberg district with a targeted commencement of production by 2030. Gold production also commenced at the new precious metals refinery in late 2024. Plans are in place to transition PT-FI’s existing energy source from coal to natural gas, which is expected to significantly reduce greenhouse gas emissions at Grasberg.FCX has a strong liquidity position and generates substantial cash flows, which allow it to finance its growth projects, pay down debt and drive shareholder value. It generated operating cash flows of around $1.4 billion in the fourth quarter. The same for full-year 2024 climbed around 35% year over year to $7.2 billion. It has distributed $4.7 billion to shareholders through dividends and share purchases since June 30, 2021. Freeport ended 2024 with strong liquidity, having $3.9 billion in cash and cash equivalents, $3 billion in availability under the FCX credit facility and $1.5 billion in availability under the PT FI credit facility.FCX offers a dividend yield of roughly 0.9% at the current stock price. Its payout ratio is 20% (a ratio below 60% is a good indicator that the dividend will be sustainable), with a five-year annualized dividend growth rate of about 21.8%. Backed by strong financial health, the company's dividend is perceived to be safe and reliable.Despite these positives, Freeport faces headwinds from higher costs. Freeport’s consolidated unit net cash costs per pound of copper for fourth-quarter 2024 were 9% higher than the prior-year level. The company now estimates that consolidated unit net cash costs for the first quarter will be roughly 5% higher than the January 2025 guidance of $2.05 per pound of copper, mainly due to the timing of gold shipments, which has led to lower by-product credits. FCX is grappling with higher unit net cash costs in North America. Higher labor and mining costs are leading to increased unit costs in the region.
The Case for Southern Copper
Southern Copper has a strong pipeline of world-class copper greenfield projects and various other promising opportunities. The company’s capital investment program for this decade is more than $15 billion. This includes investments in the Buenavista Zinc, Pilares, El Pilar and El Arco projects in Mexico and the Tia Maria, Los Chancas and Michiquillay projects in Peru.The company continues to build its presence in Peru as the country is the second-largest producer of copper. Peru holds about 9% of the world’s copper reserves. Southern Copper’s Michiquillay is expected to become one of Peru's largest copper mines and will produce 225,000 tons of copper per year (along with by-products of molybdenum, gold and silver) for an expected mine life of more than 25 years. Production is expected to start by 2032.Southern Copper targets copper production of 967,000 tons for 2025, in line with last year. This growth is expected to be fueled by higher production in Peru and production from its new Buenavista zinc concentrator. SCCO generated net cash from operating activities of $4.42 billion in 2024, up roughly 24% from $3.57 billion in 2023, attributable to higher net income. SCCO offers a healthy dividend yield of 3.2% at the current stock price. Its payout ratio is 65%, with a five-year annualized dividend growth rate of roughly 13.4%.On the flip side, Southern Copper remains hamstrung by higher operating costs. It saw a 3% year-over-year increase in total operating costs and expenses in 2024. The increase was mainly due to repair materials, translation differences, workers' participation, fuel, labor costs, reagents, currency translation and other factors. The company has been witnessing higher labor costs due to the ongoing tightness of the labor supply. This, along with ongoing inflation for repair materials, operating materials, inventory consumption, operation contractors and services, will likely continue to weigh on Southern Copper’s margins.
Price Performance and Valuation of FCX & SCCO
Year to date, FCX stock has lost 10.6%, while SCCO stock has declined 2.2% compared with the Zacks Mining – Non Ferrous industry’s fall of 14.6%.
Zacks Investment Research
Image Source: Zacks Investment Research
FCX is currently trading at a forward 12-month earnings multiple of 18.95X, higher than its five-year median. This represents a roughly 4.2% premium when stacked up with the industry average of 18.19X.
Zacks Investment Research
Image Source: Zacks Investment Research
SCCO is currently trading at a forward 12-month earnings multiple of 19.66X, lower than its five-year median but above FCX and the industry.
Zacks Investment Research
Image Source: Zacks Investment Research
How Do the Zacks Consensus Estimate Compare for FCX & SCCO?
The Zacks Consensus Estimate for FCX’s 2025 sales and EPS implies a year-over-year rise of 3.4% and 8.8%, respectively. The EPS estimates for 2025 have been trending lower over the past 60 days.
Zacks Investment Research
Image Source: Zacks Investment Research
The consensus estimate for SCCO’s 2025 sales and EPS implies year-over-year growth of 4.2% and 3.2%, respectively. The EPS estimates for 2025 have been trending southward over the past 60 days.
Zacks Investment Research
Image Source: Zacks Investment Research
(Find the latest EPS estimates and surprises on Zacks Earnings Calendar.)
FCX or SCCO: Which Is a Better Pick?
Both FCX and SCCO currently have a Zacks Rank #3 (Hold), so picking one stock is not easy. You can see the complete list of today’s Zacks #1 Rank (Strong Buy) stocks here.Both Freeport and Southern Copper present compelling investment cases. FCX is poised to gain from progress in expansion activities that will boost production capacity. Robust financial health allows FCX to invest in growth projects and drive shareholder value. On the other hand, SCCO is well-positioned to deliver enhanced performance, backed by its constant commitment to increasing low-cost production and growth investments. Leveraging its substantial cash generation capacity, Southern Copper remains committed to returning value to its shareholders while prioritizing the development of projects to uphold its reputation as a low-cost copper producer. However, both companies face the common headwind of higher costs. FCX appears to have a slight edge over SCCO due to its more attractive valuation. In addition, FCX's higher earnings growth projections suggest that it may offer better investment prospects in the current market environment.
Want the latest recommendations from Zacks Investment Research? Today, you can download 7 Best Stocks for the Next 30 Days. Click to get this free report
Freeport-McMoRan Inc. (FCX) : Free Stock Analysis Report
Southern Copper Corporation (SCCO) : Free Stock Analysis Report
This article originally published on Zacks Investment Research (zacks.com).
We recently published a list of 20 Best Stock To Buy According to Marjorie Taylor Greene. In this article, we are going to take a look at where Southern Copper Corporation (NYSE:SCCO) stands against other best stock to buy according to Marjorie Taylor Greene.
Marjorie Taylor Greene is one of the most active members of the Trump administration on the US stock market. Her latest disclosures show that Greene, who is the US representative for the 14th congressional district of Georgia since 2021, purchased stakes in several beaten down technology stocks in the days prior to the announcement of a 90-day pause on new Trump tariffs. Following the pause, the share prices of many of these technology stocks rallied. This trading activity has drawn the ire of social media, where users routinely highlight that lawmakers from both major parties in the US Congress should be banned from stock trading because of the apparent conflict of interest in owning shares of companies they can heavily influence with positions they can take in office. Like Greene, other US lawmakers active on the stock market, like Nancy Pelosi, are also in the spotlight following the latest bout of the US-China trade war.
Read more about these developments by accessing 10 Best AI Data Center Stocks and 10 Buzzing AI Stocks According to Goldman Sachs.
Taylor Greene sits on important Congressional committees, including the House Committee on Oversight and Accountability, where she is the Chairwoman of the Subcommittee on Delivering on Government Efficiency (DOGE). She is also on the House Committee on Homeland Security, where she sits on the Subcommittee on Counterterrorism and Intelligence, as well as the Subcommittee on Oversight, Investigations, and Accountability. Disclosures made by Greene through her latest transaction report reveal that the lawmaker sold between $50,000 to $100,000 worth of US Treasury Bills to fund the purchase of beaten down technology stocks just before an announcement by US President Trump that he was pausing for 90 days new tariffs that had earlier sent markets tumbling around the world. Greene is a staunch supporter of the tariffs, having said in a post on social networking platform X that tariffs were a powerful proven source of leverage to protect national interests.
For this article, we consulted Capitol Trades, a platform that tracks the stock trading activity of politicians in the United States. It is important to clarify that the stocks listed below were picked from the public record of investments Marjorie Taylor Greene has made in the past few months. These stocks are also popular among hedge funds. Why are we interested in the stocks that hedge funds pile into? The reason is simple: our research has shown that we can outperform the market by imitating the top stock picks of the best hedge funds. Our quarterly newsletter’s strategy selects 14 small-cap and large-cap stocks every quarter and has returned 373.4% since May 2014, beating its benchmark by 218 percentage points (see more details here).
Is Southern Copper Corporation (SCCO) the Best Stock To Buy According to Marjorie Taylor Greene?
A large open-pit mining site, its machinery providing a long-term supply of copper.
Southern Copper Corporation (NYSE:SCCO)
Number of Hedge Fund Holders: 33
Southern Copper Corporation (NYSE:SCCO) is a mining company that focuses on the production of copper. According to a Periodic Transaction Report from April 11, Taylor Greene purchased Southern Copper Corporation (NYSE:SCCO) stock worth somewhere between $1,000 and $15,000 on April 8. This trade was disclosed the following day. Copper futures have been in turmoil since Trump announced sweeping tariffs on imports. Per a Reuters report, outright price turbulence of the metal overlays a re-configuration of the physical supply chain as traders ship more copper to the US, which is starting to tighten up availability everywhere else, including in China. After Trump announced a 90-day tariff pause for most countries, excluding China, copper prices rebounded from 17-month lows of $8,105 per metric ton to above $9,000 per ton within a few hours. A Bloomberg report contends that major players in the US copper industry have called on President Donald Trump to restrict exports of ore and scrap metal rather than imposing tariffs on imports, in his efforts to boost domestic production.
Overall, SCCO ranks 20th on our list of best stock to buy according to Marjorie Taylor Greene. While we acknowledge the potential of these companies, our conviction lies in the belief that some AI stocks hold greater promise for delivering higher returns, and doing so within a shorter timeframe. There is an AI stock that went up since the beginning of 2025, while popular AI stocks lost around 25%. If you are looking for an AI stock that is more promising than SCCO but that trades at less than 5 times its earnings, check out our report about this cheapest AI stock.
READ NEXT: 20 Best AI Stocks To Buy Now and 30 Best Stocks to Buy Now According to Billionaires.
Disclosure: None. This article is originally published at Insider Monkey.
(Bloomberg) — Follow Bloomberg India on WhatsApp for exclusive content and analysis on what billionaires, businesses and markets are doing. Sign up here.
Most Read from Bloomberg
-
DOGE Visits National Gallery of Art to Discuss Museum’s Legal Status
-
Trump Gives New York ‘One Last Chance’ to End Congestion Fee
-
Trump Administration Takes Over New York Penn Station Revamp
-
Nashville’s $3 Billion Transit Plan Brings a Call for Zoning Reform
Indian billionaire Anil Agarwal is inching closer to finishing a long-planned breakup of his metals-to-energy conglomerate Vedanta Ltd., a move aimed at trimming the group’s $11 billion debt pile and giving greater attention to different businesses.
While prices of aluminum, zinc, and copper have given up the heady gains of 2024, the 71-year-old tycoon is betting that a simpler structure for the sprawling group and growing demand for critical minerals will add to the allure of his companies even as the specter of a global recession looms.
The overhaul will allow the group to list each of its key businesses: aluminum, oil & gas, power, iron & steel, along with the publicly traded core company Vedanta. The demerger could provide new funding sources and increase financial transparency across the group, according to Bloomberg Intelligence analyst Mary Ellen Olson.
“The time for growth is now as demand is strong, supply is tight, and we’re positioned in the right markets,” Agarwal said in a recent video interview from his London home, adding that most of the materials mined by his company are locally consumed. The billionaire said that this makes Vedanta less vulnerable to potential disruptions in global supply chains arising from US President Donald Trump’s tariff measures.
Vedanta is also expanding the gamut of its operations by winning rights to mine critical minerals like nickel, chromium, platinum, and cobalt in India through November auctions. The global demand for these and other metals that are key to energy transition remains high and will give the group the next fillip of growth, Agarwal said.
Middle East and Africa
Agarwal has long dreamed of building an empire that spans continents and competing with the ranks of the world’s largest diversified miners, including Rio Tinto Group and BHP Group Ltd.
The group plans to spend more on overseas projects and is doubling on investments in the Middle East and Africa. Vedanta is set to invest $2 billion in copper-processing facilities in Saudi Arabia — one of the largest by a foreign firm — as the oil kingdom aspires to build its metals and mining industries significantly.
“Saudi not only has good geology but strong local consumption too,” Agarwal said, adding that “funding is never a problem for a project like that.”
According to local government estimates, Saudi Arabia has untapped resources, including phosphate, copper, gold, and bauxite, worth as much as $2.5 trillion. About a third of its investments in the country will be funded through internal accruals, and for the rest, the group will seek project financing, Agarwal said.
The company is currently seeking funds to develop mines in Africa, too. The Konkola Copper Mines in Zambia, which it controls, has a major copper deposit and cobalt reserves, according to Vedanta.
The financing options being weighed range from a billion-dollar bond offering, “off-take financing, or sale of a minority stake to global investors, for which there is significant demand,” Agarwal said.
Cutting Debt
Vedanta shares dropped about 7% this year in Mumbai trading amid a slump in commodities prices. Other than economic growth woes, weighing on investor sentiment is the company’s $6.2 billion debt, the upshot of an acquisition spree since the turn of the century that includes stakes in Bharat Aluminium Co. and Hindustan Zinc Ltd.
Over the last two years, Agarwal has been on a drive to cut leverage and push back repayment deadlines on the group’s borrowings. The plan is to halve it over the next three years.
The group will be cautious about loading up on debt as it chases growth for each demerged unit, he said. All existing shareholders of Vedanta will receive one new share in each of the newly listed entities against each share they own in the parent company.
“There is no need for a stake sale to reduce our debt at the parent company level, and neither are there any plans to sell our stakes in any of the demerged entities,” Agarwal, who started as a scrap metal dealer and has weathered cash crunches and government friction, said. Each listed company can look at issuing fresh shares to raise funds for expansion, he said.
The so-called debt to earnings before interest, taxes, depreciation, and amortization ratio — a financial metric that measures a company’s ability to pay off its debt obligations — for Vedanta has to be brought down to 1 from the current 1.4 and maintained, according to him.
Over the years, Agarwal has been grooming his daughter Priya Agarwal Hebbar to take over from him as the head of the conglomerate. A psychology and film studies graduate from the University of Warwick, the 35-year-old is the chairwoman of Hindustan Zinc and is on the board of Vedanta.
“The group’s future is very focused on transition and critical minerals, and that is where the company will go,” Hebbar said.
–With assistance from Sanjit Das.
Most Read from Bloomberg Businessweek
©2025 Bloomberg L.P.
Lundin Mining (LUN.TO) over the holiday weekend, pre-announced certain items that impacted its first
Southern Copper (SCCO) is expected to deliver a year-over-year increase in earnings on higher revenues when it reports results for the quarter ended March 2025. This widely-known consensus outlook gives a good sense of the company's earnings picture, but how the actual results compare to these estimates is a powerful factor that could impact its near-term stock price.
The earnings report might help the stock move higher if these key numbers are better than expectations. On the other hand, if they miss, the stock may move lower.
While the sustainability of the immediate price change and future earnings expectations will mostly depend on management's discussion of business conditions on the earnings call, it's worth handicapping the probability of a positive EPS surprise.
Zacks Consensus Estimate
This miner is expected to post quarterly earnings of $1.13 per share in its upcoming report, which represents a year-over-year change of +20.2%.
Revenues are expected to be $2.98 billion, up 14.7% from the year-ago quarter.
Estimate Revisions Trend
The consensus EPS estimate for the quarter has been revised 0.87% lower over the last 30 days to the current level. This is essentially a reflection of how the covering analysts have collectively reassessed their initial estimates over this period.
Investors should keep in mind that the direction of estimate revisions by each of the covering analysts may not always get reflected in the aggregate change.
Earnings Whisper
Estimate revisions ahead of a company's earnings release offer clues to the business conditions for the period whose results are coming out. This insight is at the core of our proprietary surprise prediction model — the Zacks Earnings ESP (Expected Surprise Prediction).
The Zacks Earnings ESP compares the Most Accurate Estimate to the Zacks Consensus Estimate for the quarter; the Most Accurate Estimate is a more recent version of the Zacks Consensus EPS estimate. The idea here is that analysts revising their estimates right before an earnings release have the latest information, which could potentially be more accurate than what they and others contributing to the consensus had predicted earlier.
Thus, a positive or negative Earnings ESP reading theoretically indicates the likely deviation of the actual earnings from the consensus estimate. However, the model's predictive power is significant for positive ESP readings only.
A positive Earnings ESP is a strong predictor of an earnings beat, particularly when combined with a Zacks Rank #1 (Strong Buy), 2 (Buy) or 3 (Hold). Our research shows that stocks with this combination produce a positive surprise nearly 70% of the time, and a solid Zacks Rank actually increases the predictive power of Earnings ESP.
Please note that a negative Earnings ESP reading is not indicative of an earnings miss. Our research shows that it is difficult to predict an earnings beat with any degree of confidence for stocks with negative Earnings ESP readings and/or Zacks Rank of 4 (Sell) or 5 (Strong Sell).
How Have the Numbers Shaped Up for Southern Copper?
For Southern Copper, the Most Accurate Estimate is higher than the Zacks Consensus Estimate, suggesting that analysts have recently become bullish on the company's earnings prospects. This has resulted in an Earnings ESP of +10.22%.
On the other hand, the stock currently carries a Zacks Rank of #3.
So, this combination indicates that Southern Copper will most likely beat the consensus EPS estimate.
Does Earnings Surprise History Hold Any Clue?
While calculating estimates for a company's future earnings, analysts often consider to what extent it has been able to match past consensus estimates. So, it's worth taking a look at the surprise history for gauging its influence on the upcoming number.
For the last reported quarter, it was expected that Southern Copper would post earnings of $1.02 per share when it actually produced earnings of $1.01, delivering a surprise of -0.98%.
Over the last four quarters, the company has beaten consensus EPS estimates three times.
Bottom Line
An earnings beat or miss may not be the sole basis for a stock moving higher or lower. Many stocks end up losing ground despite an earnings beat due to other factors that disappoint investors. Similarly, unforeseen catalysts help a number of stocks gain despite an earnings miss.
That said, betting on stocks that are expected to beat earnings expectations does increase the odds of success. This is why it's worth checking a company's Earnings ESP and Zacks Rank ahead of its quarterly release. Make sure to utilize our Earnings ESP Filter to uncover the best stocks to buy or sell before they've reported.
Southern Copper appears a compelling earnings-beat candidate. However, investors should pay attention to other factors too for betting on this stock or staying away from it ahead of its earnings release.
Stay on top of upcoming earnings announcements with the Zacks Earnings Calendar.
Want the latest recommendations from Zacks Investment Research? Today, you can download 7 Best Stocks for the Next 30 Days. Click to get this free report
Southern Copper Corporation (SCCO) : Free Stock Analysis Report
This article originally published on Zacks Investment Research (zacks.com).
(Bloomberg) — The world’s biggest iron ore miners face a difficult start to the year, after extreme weather impacted production and as their biggest customer China braces for a trade war.
Most Read from Bloomberg
-
Trump Signs Executive Orders on Federal Purchasing, Office Space
-
DOGE Places Entire Staff of Federal Homelessness Agency on Leave
-
LA County Floats Leaner Budget Burdened by Fire and Legal Costs
This week, BHP Group Ltd., Rio Tinto Group, and Vale SA all reported drops in quarterly shipments from the year before, the result of disruptions from cyclones in Australia’s Pilbara and heavy rains in northern Brazil. Rio was worst affected, with exports slumping 9% to a six-year low.
That leaves the companies needing to play catch-up on their supply targets at a time when escalating tensions with the US could wreak havoc on the Chinese economy. The question now is whether Beijing will deliver enough stimulus to support demand for steel and its inputs, of which iron ore is key.
“We might see a recovery phase where these companies ramp up production to compensate for the lost output,” said David Cachot, an iron ore research director at Wood Mackenzie Ltd. “Market participants are waiting to see what Beijing will do to further stimulate its economy, an additional source of concern the country did not need.”
Market Dives
Before the supply disruptions hit and trade tensions ratcheted higher, the iron ore market was contending with a surge in supply just as demand in China’s maturing economy was dwindling. Still, benchmark iron ore futures in Singapore were steady, averaging around $103 a ton over the first three months, about the same as the previous quarter.
But the market dived earlier this month, to below $95 a ton at one point, after the Trump administration announced punitive tariffs on China, and Beijing responded with its own eye-watering levies on the US.
Now, China’s economic targets are in doubt, and officials have set a clear goal of expanding domestic consumption to counter the hit to exports. That could lift demand for the steel used in vehicles, household durable goods and machinery. Iron ore traders are also probably hoping that Beijing doesn’t ignore the playbook it has used during previous downturns, which involves splurging on more steel-intensive infrastructure to generate growth.
BHP Chief Executive Officer Mike Henry warned on Thursday that slower global growth and a fragmented trading environment could have a significant impact on the company.
“China’s ability to shift toward a consumption-led economy and for trade flows to adapt to the new environment will be key to sustaining the global outlook,” he said.
–With assistance from Paul-Alain Hunt.
Most Read from Bloomberg Businessweek
-
Trade Tensions With China Clear Path for Salt-Powered Batteries
-
GM’s Mary Barra Has to Make a $35 Billion EV Bet Work in Trump’s America
©2025 Bloomberg L.P.
VANCOUVER, BC, April 17, 2025 /CNW/ – (TSX: LUN) (Nasdaq Stockholm: LUMI) Lundin Mining Corporation ("Lundin Mining" or the "Company") is pre-announcing certain items impacting the Company's quarterly earnings, adjusted earnings before interest, taxes, depreciation and amortization ("adjusted EBITDA")1, adjusted earnings1 and adjusted earnings per share1.
Revenue and Provisional Pricing Adjustments
Revenue in the first quarter 2025 is expected to be positively impacted by unaudited provisional pricing adjustments on prior period concentrate sales by approximately $45 million on a pre-tax basis. These adjustments primarily include upward adjustments in relation to copper and gold sales, partially offset by downward adjustments on molybdenum sales.
Foreign Exchange and Derivatives
Items of significant impact in the first quarter 2025 are expected to include unaudited realized losses on foreign exchange derivative contracts of approximately $12 million on a pre-tax basis primarily due to Canadian dollar derivative contracts entered into in relation to the cash consideration for Filo Corp. Additionally, unaudited realized foreign exchange losses of approximately $10 million on a pre-tax basis were primarily due to strengthening of the Brazilian real ("BRL") and Chilean peso ("CLP") against the US dollar during the quarter.
In the first quarter 2025 the Company is also expected to recognize certain non-cash items that will impact the Company's earnings but not adjusted EBITDA, adjusted earnings or adjusted earnings per share. These include unaudited unrealized foreign exchange losses of approximately $9 million on a pre-tax basis and an unaudited unrealized gain of approximately $36 million on a pre-tax basis related to the mark-to-market valuation of the Company's foreign exchange and commodity derivative contracts, primarily due to strengthening of the BRL and CLP against the US dollar during the quarter, partially offset by unrealized losses on gold derivative contracts.
First Quarter 2025 Results Conference Call and Webcast Details
The Company will release its first quarter 2025 operations and financial results after market close on Wednesday, May 7, 2025, and will hold a webcast and conference call on Thursday, May 8, 2025 to present the results. Webcast and conference call details are provided below.
Webcast / Conference Call Details:
Date: Thursday, May 8, 2025
Time: 7:00 AM PT | 10:00 AM ET
Listen Only Webcast: WEBCAST LINK
Dial In for Investor & Analyst Q&A: DIAL IN LINK
To participate in the call click on the dial in LINK above and complete the online registration form. Once registered you will receive the dial-in information and a unique PIN to join the call and ask questions.
A replay of the webcast will be available by clicking on the webcast LINK above and will be archived on the Company's website for a limited period of time.
About Lundin Mining
Lundin Mining is a diversified Canadian base metals mining company with operations or projects in Argentina, Brazil, Chile, and the United States of America, primarily producing copper, gold and nickel.
The information was submitted for publication, through the agency of the contact persons set out below on April 17, 2025 at 3:00 pm Pacific Time.
Cautionary Statement on Forward-Looking Information
Certain of the statements made and information contained herein are "forward-looking information" within the meaning of applicable Canadian securities laws. All statements other than statements of historical facts included in this document constitute forward-looking information, including but not limited to statements regarding the Company's plans, prospects and business strategies; the terms of the contingent payments and expectations related thereto; the expected benefits of the Transaction for the Company, including the expectation to support its growth plans in the Vicuña District; the realization of prospects in the Vicuña district; the identification of additional value creation opportunities; the Company's guidance on the timing and amount of future production and its expectations regarding the results of operations; expected costs; permitting requirements and timelines; anticipated exploration and development activities at the Company's projects; expansion projects and the realization of additional value; the Company's integration of acquisitions and expansions and any anticipated benefits thereof; the Company's ability to become a top tier copper producer; and expectations for other economic, business, and/or competitive factors. Words such as "believe", "expect", "anticipate", "contemplate", "target", "plan", "goal", "aim", "intend", "continue", "budget", "estimate", "may", "will", "can", "could", "should", "schedule" and similar expressions identify forward-looking information.
Forward-looking information is necessarily based upon various estimates and assumptions including, without limitation, the expectations and beliefs of management, including that the Company can access financing, appropriate equipment and sufficient labour; assumed and future price of copper, zinc, nickel, gold and other metals; anticipated costs; the ability to achieve goals and identify and realize opportunities; that the political environment in which the Company operates will continue to support the development and operation of mining projects; and assumptions related to the factors set forth below. While these factors and assumptions are considered reasonable by Lundin Mining as at the date of this document in light of management's experience and perception of current conditions and expected developments, these statements are inherently subject to significant business, economic and competitive uncertainties and contingencies. Known and unknown factors could cause actual results to differ materially from those projected in the forward-looking information and undue reliance should not be placed on such information. Such factors include, but are not limited to: dependence on international market prices and demand for the metals that the Company produces; political, economic, and regulatory uncertainty in operating jurisdictions, including but not limited to those related to permitting and approvals, nationalization or expropriation without fair compensation, environmental and tailings management, labour, trade relations, and transportation; risks relating to mine closure and reclamation obligations; health and safety hazards; inherent risks of mining, not all of which related risk events are insurable; risks relating to tailings and waste management facilities; risks relating to the Company's indebtedness; challenges and conflicts that may arise in partnerships and joint operations; risks relating to development projects; risks that revenue may be significantly impacted in the event of any production stoppages or reputational damage in Chile; the impact of global financial conditions, market volatility and inflation; business interruptions caused by critical infrastructure failures; challenges of effective water management; exposure to greater foreign exchange and capital controls, as well as political, social and economic risks as a result of the Company's operation in emerging markets; risks relating to stakeholder opposition to continued operation, further development, or new development of the Company's projects and mines; any breach or failure information systems; risks relating to reliance on estimates of future production; risks relating to litigation and administrative proceedings which the Company may be subject to from time to time; risks relating to acquisitions or business arrangements; risks relating to competition in the industry; failure to comply with existing or new laws or changes in laws; challenges or defects in title or termination of mining or exploitation concessions; the exclusive jurisdiction of foreign courts; the outbreak of infectious diseases or viruses; risks relating to taxation changes; receipt of and ability to maintain all permits that are required for operation; minor elements contained in concentrate products; changes in the relationship with its employees and contractors; the Company's Mineral Reserves and Mineral Resources which are estimates only; payment of dividends in the future; compliance with environmental, health and safety laws and regulations, including changes to such laws or regulations; interests of significant shareholders of the Company; asset values being subject to impairment charges; potential for conflicts of interest and public association with other Lundin Group companies or entities; activist shareholders and proxy solicitation firms; risks associated with climate change; the Company's common shares being subject to dilution; ability to attract and retain highly skilled employees; reliance on key personnel and reporting and oversight systems; risks relating to the Company's internal controls; counterparty and customer concentration risk; risks associated with the use of derivatives; exchange rate fluctuations; and other risks and uncertainties, including but not limited to those described in the "Risks and Uncertainties" section of the Company's MD&A for the year ended December 31, 2024 and the "Risks and Uncertainties" section of the Company's Annual Information Form for the year ended December 31, 2024, which are available on SEDAR+ at www.sedarplus.ca under the Company's profile.
All of the forward-looking information in this document are qualified by these cautionary statements. Although the Company has attempted to identify important factors that could cause actual results to differ materially from those contained in forward-looking information, there may be other factors that cause results not to be as anticipated, estimated, forecasted or intended and readers are cautioned that the foregoing list is not exhaustive of all factors and assumptions which may have been used. Should one or more of these risks and uncertainties materialize, or should underlying assumptions prove incorrect, actual results may vary materially from those described in forward-looking information. Accordingly, there can be no assurance that forward-looking information will prove to be accurate and forward-looking information is not a guarantee of future performance. Readers are advised not to place undue reliance on forward-looking information. The forward-looking information contained herein speaks only as of the date of this document. The Company disclaims any intention or obligation to update or revise forward‐looking information or to explain any material difference between such and subsequent actual events, except as required by applicable law.
__________________________
1 These measures are non-GAAP measures. These performance measures have no standardized meaning within generally accepted accounting principles under International Financial Reporting Standards and, therefore, amounts presented may not be comparable to similar data presented by other mining companies. For additional details please refer to the Company's discussion of non-GAAP and other performance measures in its Management's Discussion and Analysis for the year ended December 31, 2024 which is available on SEDAR+ at www.sedarplus.com.
Lundin Mining Pre-Announces Items Impacting the First Quarter 2025 Results (CNW Group/Lundin Mining Corporation)
SOURCE Lundin Mining Corporation
Cision
View original content to download multimedia: http://www.newswire.ca/en/releases/archive/April2025/17/c2927.html
Teck Resources Ltd (TECK) is expected to deliver a year-over-year decline in earnings on lower revenues when it reports results for the quarter ended March 2025. This widely-known consensus outlook gives a good sense of the company's earnings picture, but how the actual results compare to these estimates is a powerful factor that could impact its near-term stock price.
The earnings report, which is expected to be released on April 24, 2025, might help the stock move higher if these key numbers are better than expectations. On the other hand, if they miss, the stock may move lower.
While management's discussion of business conditions on the earnings call will mostly determine the sustainability of the immediate price change and future earnings expectations, it's worth having a handicapping insight into the odds of a positive EPS surprise.
Zacks Consensus Estimate
This company is expected to post quarterly earnings of $0.27 per share in its upcoming report, which represents a year-over-year change of -51.8%.
Revenues are expected to be $1.6 billion, down 46.1% from the year-ago quarter.
Estimate Revisions Trend
The consensus EPS estimate for the quarter has been revised 9.92% lower over the last 30 days to the current level. This is essentially a reflection of how the covering analysts have collectively reassessed their initial estimates over this period.
Investors should keep in mind that an aggregate change may not always reflect the direction of estimate revisions by each of the covering analysts.
Earnings Whisper
Estimate revisions ahead of a company's earnings release offer clues to the business conditions for the period whose results are coming out. This insight is at the core of our proprietary surprise prediction model — the Zacks Earnings ESP (Expected Surprise Prediction).
The Zacks Earnings ESP compares the Most Accurate Estimate to the Zacks Consensus Estimate for the quarter; the Most Accurate Estimate is a more recent version of the Zacks Consensus EPS estimate. The idea here is that analysts revising their estimates right before an earnings release have the latest information, which could potentially be more accurate than what they and others contributing to the consensus had predicted earlier.
Thus, a positive or negative Earnings ESP reading theoretically indicates the likely deviation of the actual earnings from the consensus estimate. However, the model's predictive power is significant for positive ESP readings only.
A positive Earnings ESP is a strong predictor of an earnings beat, particularly when combined with a Zacks Rank #1 (Strong Buy), 2 (Buy) or 3 (Hold). Our research shows that stocks with this combination produce a positive surprise nearly 70% of the time, and a solid Zacks Rank actually increases the predictive power of Earnings ESP.
Please note that a negative Earnings ESP reading is not indicative of an earnings miss. Our research shows that it is difficult to predict an earnings beat with any degree of confidence for stocks with negative Earnings ESP readings and/or Zacks Rank of 4 (Sell) or 5 (Strong Sell).
How Have the Numbers Shaped Up for Teck Resources?
For Teck Resources, the Most Accurate Estimate is higher than the Zacks Consensus Estimate, suggesting that analysts have recently become bullish on the company's earnings prospects. This has resulted in an Earnings ESP of +15.73%.
On the other hand, the stock currently carries a Zacks Rank of #3.
So, this combination indicates that Teck Resources will most likely beat the consensus EPS estimate.
Does Earnings Surprise History Hold Any Clue?
While calculating estimates for a company's future earnings, analysts often consider to what extent it has been able to match past consensus estimates. So, it's worth taking a look at the surprise history for gauging its influence on the upcoming number.
For the last reported quarter, it was expected that Teck Resources would post earnings of $0.22 per share when it actually produced earnings of $0.33, delivering a surprise of +50%.
Over the last four quarters, the company has beaten consensus EPS estimates three times.
Bottom Line
An earnings beat or miss may not be the sole basis for a stock moving higher or lower. Many stocks end up losing ground despite an earnings beat due to other factors that disappoint investors. Similarly, unforeseen catalysts help a number of stocks gain despite an earnings miss.
That said, betting on stocks that are expected to beat earnings expectations does increase the odds of success. This is why it's worth checking a company's Earnings ESP and Zacks Rank ahead of its quarterly release. Make sure to utilize our Earnings ESP Filter to uncover the best stocks to buy or sell before they've reported.
Teck Resources appears a compelling earnings-beat candidate. However, investors should pay attention to other factors too for betting on this stock or staying away from it ahead of its earnings release.
An Industry Player's Expected Results
Among the stocks in the Zacks Mining – Miscellaneous industry, Reliance (RS) is soon expected to post earnings of $3.66 per share for the quarter ended March 2025. This estimate indicates a year-over-year change of -30.9%. This quarter's revenue is expected to be $3.46 billion, down 5.2% from the year-ago quarter.
The consensus EPS estimate for Reliance has remained unchanged over the last 30 days. However, a higher Most Accurate Estimate has resulted in an Earnings ESP of 1.09%.
This Earnings ESP, combined with its Zacks Rank #3 (Hold), suggests that Reliance will most likely beat the consensus EPS estimate. The company could not beat consensus EPS estimates in any of the last four quarters.
Stay on top of upcoming earnings announcements with the Zacks Earnings Calendar.
Want the latest recommendations from Zacks Investment Research? Today, you can download 7 Best Stocks for the Next 30 Days. Click to get this free report
Teck Resources Ltd (TECK) : Free Stock Analysis Report
Reliance, Inc. (RS) : Free Stock Analysis Report
This article originally published on Zacks Investment Research (zacks.com).
By Roushni Nair and Melanie Burton
(Reuters) -BHP Group said that an escalating trade war could harm the world economy and adaptation was key to sustaining global growth, as it reported a slight decline in iron ore production in the third quarter on Thursday.
The direct impact on BHP of the tariffs unleashed by U.S. President Donald Trump this month was limited, the mining giant said.
Trump has since postponed some of the duties, but has increased levies on China even further. Tariffs apply to steel from China where BHP sells most of its major product, iron ore.
"China's ability to shift toward a consumption-led economy and for trade flows to adapt to the new environment will be key to sustaining the global outlook," CEO Mike Henry said in a statement.
The comments came as the world's biggest listed miner reported a slightly lower third-quarter iron ore output and flagged higher production of copper, which is also subject to a tariff probe by the U.S.
BHP said the dip in quarterly iron ore production was due to cyclones, while it forecast 2025 Chilean copper production in the upper half of its guidance range as part of a ramp-up at its Escondida mine.
The world's largest listed miner was forced to temporarily halt operations at Port Hedland, the world's largest iron ore export hub, after Cyclone Zelia struck Western Australia's Pilbara region in February, following earlier disruptions from Cyclone Sean in January.
Despite the bad weather, BHP hit record nine-month output from its Pilbara operations, where the South Flank and Mining Area C sites benefited from the completed ramp-up of South Flank last year and a 13% boost in mining activity.
Shares of the company rose 0.6% to A$36.2, as of 0027 GMT, largely in line with a 1% jump in the broader mining sub-index.
Copper production rose 10% to 513,200 metric tons in the quarter, bolstered by a 20% jump in volumes at the Escondida mine in Chile due to improved operational performance.
The company said it expects to meet its fiscal 2025 unit cost targets across all operations except at its BMA coal joint venture, where adverse weather and geological issues at the Broadmeadow mine are expected to increase costs.
BHP has been leveraging revenue from its iron ore business, which still generates over half its earnings, to expand copper and potash potash projects, as it positions for growth from the energy transition.
Iron ore production from the global miner's Western Australia operations eased to 67.8 million tons in the quarter ended March 31, from 68.1 million tons a year earlier, in line with Visible Alpha consensus view of 68.03 million tons.
(Reporting by Roushni Nair and Roshan Thomas in Bengaluru, Melanie Burton in Sydney; Editing by Maju Samuel, Rashmi Aich and Kate Mayberry)
VANCOUVER, BC, April 16, 2025 /CNW/ – (TSX: LUN) (Nasdaq Stockholm: LUMI) Lundin Mining Corporation ("Lundin Mining" or the "Company") is pleased to announce the completion of the sale of its Neves-Corvo operation in Portugal and Zinkgruvan operation in Sweden to Boliden AB (OM: BOL) ("Boliden") (the "Transaction"). At closing Lundin Mining received cash proceeds of $1.40 billion which includes accrued interest from the lock-box date of August 31, 2024.
Future contingent payments of up to $150 million are tied to commodity prices and satisfaction of certain conditions as outlined in the press release dated December 9, 2024 "Lundin Mining Announces Sale of Neves-Corvo and Zinkgruvan for Total Consideration of up to $1.52 Billion".
Jack Lundin, President and CEO, commented "The sale of Neves-Corvo and Zinkgruvan marks the close of a pivotal chapter for Lundin Mining, one that elevated our profile and laid the groundwork for the growth we are now poised to deliver. With a more focused portfolio and a strengthened balance sheet, we are well-positioned for what's ahead.
"As we enter the next phase, led by our high-potential growth strategy in the Vicuña District, we do so with enhanced financial flexibility to drive long-term shareholder value. Operationally, we remain on track to meet our guidance, which excludes the Neves-Corvo and Zinkgruvan assets."
About Lundin Mining
Lundin Mining is a diversified base metals mining company with operations or projects in Argentina, Brazil, Chile, and the United States of America, primarily producing copper, gold and nickel.
The information in this news release is information that Lundin Mining is required to make public under the EU Market Abuse Regulation. The information was submitted for publication, through the agency of the contact persons set out below on April 16, 2025 at 7:00 am EST.
Cautionary Statement on Forward-Looking Information
Certain of the statements made and information contained herein are "forward-looking information" within the meaning of applicable Canadian securities laws. All statements other than statements of historical facts included in this document constitute forward-looking information, including but not limited to statements regarding the Company's plans, prospects and business strategies; the terms of the contingent payments and expectations related thereto; the expected benefits of the Transaction for the Company, including the expectation to support its growth plans in the Vicuña District; the realization of prospects in the Vicuña district; the identification of additional value creation opportunities; the Company's guidance on the timing and amount of future production and its expectations regarding the results of operations; expected costs; permitting requirements and timelines; anticipated exploration and development activities at the Company's projects; expansion projects and the realization of additional value; the Company's integration of acquisitions and expansions and any anticipated benefits thereof; the Company's ability to become a top tier copper producer; and expectations for other economic, business, and/or competitive factors. Words such as "believe", "expect", "anticipate", "contemplate", "target", "plan", "goal", "aim", "intend", "continue", "budget", "estimate", "may", "will", "can", "could", "should", "schedule" and similar expressions identify forward-looking information.
Forward-looking information is necessarily based upon various estimates and assumptions including, without limitation, the expectations and beliefs of management, including that the Company can access financing, appropriate equipment and sufficient labour; assumed and future price of copper, zinc, nickel, gold and other metals; anticipated costs; the ability to achieve goals and identify and realize opportunities; that the political environment in which the Company operates will continue to support the development and operation of mining projects; and assumptions related to the factors set forth below. While these factors and assumptions are considered reasonable by Lundin Mining as at the date of this document in light of management's experience and perception of current conditions and expected developments, these statements are inherently subject to significant business, economic and competitive uncertainties and contingencies. Known and unknown factors could cause actual results to differ materially from those projected in the forward-looking information and undue reliance should not be placed on such information. Such factors include, but are not limited to: dependence on international market prices and demand for the metals that the Company produces; political, economic, and regulatory uncertainty in operating jurisdictions, including but not limited to those related to permitting and approvals, nationalization or expropriation without fair compensation, environmental and tailings management, labour, trade relations, and transportation; risks relating to mine closure and reclamation obligations; health and safety hazards; inherent risks of mining, not all of which related risk events are insurable; risks relating to tailings and waste management facilities; risks relating to the Company's indebtedness; challenges and conflicts that may arise in partnerships and joint operations; risks relating to development projects; risks that revenue may be significantly impacted in the event of any production stoppages or reputational damage in Chile; the impact of global financial conditions, market volatility and inflation; business interruptions caused by critical infrastructure failures; challenges of effective water management; exposure to greater foreign exchange and capital controls, as well as political, social and economic risks as a result of the Company's operation in emerging markets; risks relating to stakeholder opposition to continued operation, further development, or new development of the Company's projects and mines; any breach or failure information systems; risks relating to reliance on estimates of future production; risks relating to litigation and administrative proceedings which the Company may be subject to from time to time; risks relating to acquisitions or business arrangements; risks relating to competition in the industry; failure to comply with existing or new laws or changes in laws; challenges or defects in title or termination of mining or exploitation concessions; the exclusive jurisdiction of foreign courts; the outbreak of infectious diseases or viruses; risks relating to taxation changes; receipt of and ability to maintain all permits that are required for operation; minor elements contained in concentrate products; changes in the relationship with its employees and contractors; the Company's Mineral Reserves and Mineral Resources which are estimates only; payment of dividends in the future; compliance with environmental, health and safety laws and regulations, including changes to such laws or regulations; interests of significant shareholders of the Company; asset values being subject to impairment charges; potential for conflicts of interest and public association with other Lundin Group companies or entities; activist shareholders and proxy solicitation firms; risks associated with climate change; the Company's common shares being subject to dilution; ability to attract and retain highly skilled employees; reliance on key personnel and reporting and oversight systems; risks relating to the Company's internal controls; counterparty and customer concentration risk; risks associated with the use of derivatives; exchange rate fluctuations; and other risks and uncertainties, including but not limited to those described in the "Risks and Uncertainties" section of the Company's MD&A for the year ended December 31, 2024 and the "Risks and Uncertainties" section of the Company's Annual Information Form for the year ended December 31, 2024, which are available on SEDAR+ at www.sedarplus.ca under the Company's profile.
All of the forward-looking information in this document are qualified by these cautionary statements. Although the Company has attempted to identify important factors that could cause actual results to differ materially from those contained in forward-looking information, there may be other factors that cause results not to be as anticipated, estimated, forecasted or intended and readers are cautioned that the foregoing list is not exhaustive of all factors and assumptions which may have been used. Should one or more of these risks and uncertainties materialize, or should underlying assumptions prove incorrect, actual results may vary materially from those described in forward-looking information. Accordingly, there can be no assurance that forward-looking information will prove to be accurate and forward-looking information is not a guarantee of future performance. Readers are advised not to place undue reliance on forward-looking information. The forward-looking information contained herein speaks only as of the date of this document. The Company disclaims any intention or obligation to update or revise forward‐looking information or to explain any material difference between such and subsequent actual events, except as required by applicable law.
Lundin Mining Completes the Sale of Neves-Corvo and Zinkgruvan to Boliden (CNW Group/Lundin Mining Corporation)
SOURCE Lundin Mining Corporation
Cision
View original content to download multimedia: http://www.newswire.ca/en/releases/archive/April2025/16/c2814.html
WHITE ROCK, BC / ACCESS Newswire / April 16, 2025 / Honey Badger Silver Inc. (TSXV:TUF)(OTCQB:HBEIF) ("Honey Badger" or the "Company") is pleased to provide an update on its 100%-owned Plata project, located adjacent to Snowline Gold Corp's ("Snowline") major discovery at its Rogue project in the Yukon Territory. The Company has been prioritizing targets to plan the next phase of work on the project.
The Company's Executive Chairman, Chad Williams, commented, "We have always been excited by the high-grade silver occurrences at Plata and the similarities to the local prolific Keno Hill district. The fact that silver grades at surface were so high as to allow for direct transport of ore by airplane to Idaho for treatment speaks for itself! The additional component of strong indications of a potential large gold system similar to Snowline's Rogue discovery, which is located adjacent to Plata, potentially with a significant silver component, adds to our excitement. We will continue compiling data in preparation of a highly focused field program with the objective of advancing Plata toward one or more discoveries."
About Plata
Plata is located in east-central Yukon within the Tombstone Gold Belt and is a past producing high-grade silver property that produced about 290,000 oz Ag from small-scale, high-grade mining at surface (Carlson, 2010). Ore was mined and flown by fixed wing aircraft to Idaho for processing. Historical exploration work at Plata has primarily focused on the high-grade silver veins at surface. These are analogous to the rich Keno Hill Silver Mine in the Yukon, one of the highest-grade silver deposits in the world, now operated by Hecla Mining. While the analogy to Keno Hill remains valid, the Company has continued to develop its understanding of Plata as part of a larger "Snowline-style" mineralized system. Understanding how Plata may fit into a Reduced Intrusion Related Gold System (RIRGS) adds the potential for a large gold deposit in addition to the high-grade silver and lead potential.
New targets have been identified:
-
Potential extension of high-grade Aho zone to the east.
-
Potential unrecognized mineralization along the Plata and Rogue thrust faults. The Rogue Thrust is a newly named structure north of the Plata Thrust.
-
Potential for RIRGS mineralization in newly staked claims over a magnetic low anomaly.
Mineralization and Targets at Plata
To date, exploration has identified four types of mineralization at Plata (Table 1). The most well understood of these are Type I and Type II mineralization. Type I mineralization consists of high-grade silver veins hosted in northeast-trending faults. The most significant occurrences of Type I mineralization occur as veins up to tens of metres wide that can be traced for up to 100 metres. Mineralization consists of heavily disseminated to massive galena, tetrahedrite and sphalerite. Type II mineralization is characterized by high-grade gold and silver veins that form within parallel structures along the Plata Thrust Fault. Mineralization comprises bands of arsenopyrite, pyrite, galena, boulangerite, tetrahedrite and sphalerite. Type II mineralization comprises the P3 and P4 showings, which are collectively known as the Aho Zone (Fig. 1).
The recognition and continued understanding of the Aho Zone in the context of a larger RIRGS has become increasingly important to the Plata project. The structures that play a role in the distribution of intrusions and associated mineralization at Snowline's Rogue project also occur at Plata, which strongly suggests that the mineralization at Plata is closely tied to a larger RIRGS in the region (Figures 1 and 2). The Aho Zone has been traced along the Plata Thrust Fault for over 800 metres strike length, and downdip to a depth of 580 metres, with drill results such as 711 g/t silver and 6.17% zinc over 1.52m (Table 1). No rock samples have been collected to the east of the Aho showing despite elevated topography that appears conducive for outcrop exposure. The current extent of detailed mapping on the property also suggests that over 1 km of the Plata Thrust remains completely unexplored towards the eastern claim boundary (Figure 1). This is an important observation and presents a significant opportunity to find additional Aho-style mineralization along the underexplored Plata Thrust Fault. This has been identified as a top priority target for follow up exploration at Plata. Future fieldwork will also revisit the area to the northwest of the Aho Zone in order to identify additional Aho-style mineralization along the Plata and/or Rogue Thrust Faults that may have been previously overlooked. Sheeted quartz veining within a felsic dyke (Vein Type IV) was recognized for the first time at Plata in this area in 2023, which further supports the interpretation that there may be a buried, mineralized intrusion at Plata analogous to RIRGS mineralization identified on Snowline's Rogue project.
Table 1. Known Mineralization (Vein) Types at the Plata Project.
|
Vein Type |
I |
II |
III |
IV |
|
Vein Composition |
Argentiferous sulphide-siderite vein |
Auriferous and argentiferous sulphide-quartz-clay vein |
Argentiferous and auriferous clay and scorodite altered quartz vein |
Sheeted quartz-siderite-sulphide veins |
|
Description |
High-grade veins hosted in northeast-trending faults. Veins widen in dilatant zones where steeply dipping faults |
Hosted in parallel structures along Plata Thrust Fault |
Manganese-bearing siderite vein with sheeted quartz veins and chalcedonic breccias developed up to 15 m on either side of the central siderite vein |
Sheeted veins only recently identified in a biotite-quartz monzonite dyke located between, and subparallel to, the Plata and Rogue thrusts |
|
Vein Width |
cm's to 10's m |
0.3 – 3 m |
Up to ~30 m |
cm-scale |
|
Best Intercepts / Grades |
Drilling returned 453 g/t Ag, 2.09% Pb, and 17.46% Zn over 2.35 m from the P2 showing, as well as 151 g/t Ag, 0.16 g/t Au, 0.09% Pb, and 1.42% Zn over 12.61 m that includes 1655 g/t Ag, 0.46 g/t Au, 0.25% Pb, and 1.09% Zn over 1.0 m |
Drilling returned 711 g/t Ag, 4.57 g/t Au, 7.24% Pb, and 6.17% Zn over 1.52 m, and 1244 g/t Ag, 4.25 g/t Au, and 6.6% Pb over 0.96 m |
Chip sampling returned 344 g/t Ag over 0.85 m |
Elevated Ag-As-Pb-Zn |
|
Showings |
P1, P2, P6 |
P3, P4 |
P2B |
P17 |
Figure 1. Map of the Plata property highlighting the extent of current detailed mapping on the property, as well as high priority target areas for follow up work.
The Company increased its land position at Plata in 2024 by adding 1,338 hectares to the project area over a magnetic low geophysical signature in the southern portion of the property (Fig. 2). Diagnostic features of reduced intrusions in the Tombstone Gold Belt are magnetic and conductivity low geophysical signatures that may be enveloped by a magnetic high due to the presence of pyrrhotite in the hornfelsed aureoles of the intrusion. This newly acquired ground shares an important structure that transects Snowline's Cynthia project, which comprises a 2×2 km zone of alteration, veining, and elevated gold geochemistry between two Tombstone suite intrusions (Figure 2). This newly acquired ground at Plata is a high priority exploration target and will be the subject of a reconnaissance field mapping and sampling program to evaluate the significance of the geophysical anomaly and any associated alteration and mineralization. Significantly, this area can be easily accessed by the main road that connects the north part of the property to the Plata airstrip located to the south.
Figure 2. Regional first vertical derivative magnetic map encompassing Honey Badger's Plata project and Snowline Gold's Rogue project.
Qualified Person
Technical information in this news release has been approved by Dorian L. (Dusty) Nicol, a Director and technical advisor of the Company (PG, FAusIMM), who is a Qualified Person (QP) for the purpose of National Instrument 43-101.
About Honey Badger Silver Inc.
Honey Badger Silver is a silver company. The company is led by a highly experienced leadership team with a track record of value creation backed by a skilled technical team. Our projects are located in areas with a long history of mining, including the Sunrise Lake project with a historic resource of 12.8 Moz of silver (and 201.3 million pounds of zinc) Indicated and 13.9 Moz of silver (and 247.8 million pounds of zinc) Inferred (1)(3) located in the Northwest Territories and the Plata high grade silver project located 165 km east of Yukon's prolific Keno Hill and adjacent to Snowline Gold's Rogue discovery. The Company's Clear Lake Project in the Yukon Territory has a historic resource of 5.5 Moz of silver and 1.3 billion pounds of zinc (2)(3). The Company also has a significant land holding at the Nanisivik Mine Area located in Nunavut, Canada that produced over 20 Moz of silver between 1976 and 2002 (2,3). A qualified person has not done sufficient work to classify the foregoing historical resources as current mineral resources and the Company is not treating the estimates as current mineral resources. The historical resource estimates are provided solely for the purpose as an indication of the volume of mineralization that could be present. Additional work, including verification drilling / sampling, will be required to verify any of the historical estimates as a current mineral resources.
(1) Sunrise Lake 2003 RPA historic resource: Indicated 1.522 million tonnes grading 262 grams/tonne silver, 6.0% zinc, 2.4% lead, 0.08% copper, and 0.67 grams/tonne gold and Inferred 2.555 million tonnes grading 169 grams/tonne silver, 4.4% zinc, 1.9% lead, 0.07% copper, and 0.51 grams/tonne gold.
(2) Clear Lake 2010 SRK historic Resource: Inferred 7.76 million tonnes grading 22 grams/tonne silver, 7.6% zinc, and 1.08% lead.
(3) Geological Survey of Canada, 2002-C22, "Structural and Stratigraphic Controls on Zn-Pb-Ag Mineralization at the Nanisivik Mississippi Valley type Deposit, Northern Baffin Island, Nunavut; by Patterson and Powis."
(4) Carlson, G.G., 2010, Technical Report describing Exploration and Development at the Plata Project, located in the Mayo Mining District, East-Central Yukon, Report Prepared for Platoro West Holdings Inc.
ON BEHALF OF THE BOARD
Chad Williams, Executive Chairman
For more information please visit our website www.honeybadgersilver.com or contact Mrs. Sonya Pekar for Investor Relations | spekar@honeybadgersilver.com | +1 (647) 498-8244.
Neither the TSX Venture Exchange nor its Regulation Services Provider (as that term is defined in the policies of the TSX Venture Exchange) accepts responsibility for the adequacy or accuracy of this release.
Cautionary Note Regarding Forward-Looking Information
This news release contains "forward-looking information" within the meaning of the applicable Canadian securities legislation that is based on expectations, estimates, projections and interpretations as at the date of this news release. Any statement that involves discussions with respect to predictions, expectations, interpretations, beliefs, plans, projections, objectives, assumptions, future events or performance (often but not always using phrases such as "expects", or "does not expect", "is expected", "interpreted", "management's view", "anticipates" or "does not anticipate", "plans", "budget", "scheduled", "forecasts", "estimates", "believes" or "intends" or variations of such words and phrases or stating that certain actions, events or results "may" or "could", "would", "might" or "will" be taken to occur or be achieved) are not statements of historical fact and may be forward-looking information and are intended to identify forward-looking information. This forward-looking information is based on reasonable assumptions and estimates of management of the Company at the time such assumptions and estimates were made, and involves known and unknown risks, uncertainties and other factors which may cause the actual results, performance or achievements of Honey Badger to be materially different from any future results, performance or achievements expressed or implied by such forward-looking information.
Such factors include, but are not limited to, risks relating to capital and operating costs varying significantly from estimates; delays in obtaining or failures to obtain required governmental, environmental or other project approvals; uncertainties relating to the availability and costs of financing needed in the future; changes in equity markets; inflation; fluctuations in commodity prices; delays in the development of projects; other risks involved in the mineral exploration and development industry; and those risks set out in the Company's public documents filed on SEDAR+ (www.sedarplus.ca) under Honey Badger's issuer profile. Although the Company believes that the assumptions and factors used in preparing the forward-looking information in this news release are reasonable, undue reliance should not be placed on such information, which only applies as of the date of this news release, and no assurance can be given that such events will occur in the disclosed timeframes or at all. The Company disclaims any intention or obligation to update or revise any forward-looking information, whether as a result of new information, future events or otherwise, other than as required by law.
SOURCE: Honey Badger Silver Inc.
View the original press release on ACCESS Newswire
As the Australian market navigates a period of slower trade and investor caution amid ongoing global tensions, identifying growth companies with significant insider ownership can offer valuable insights into potential investment opportunities. In this environment, where confidence is tempered by geopolitical uncertainties, stocks with strong insider commitment may signal a higher level of trust in the company’s long-term prospects.
Top 10 Growth Companies With High Insider Ownership In Australia
|
Name |
Insider Ownership |
Earnings Growth |
|
Alfabs Australia (ASX:AAL) |
10.8% |
41.3% |
|
Fenix Resources (ASX:FEX) |
21.1% |
47.8% |
|
Cyclopharm (ASX:CYC) |
11.3% |
97.8% |
|
Acrux (ASX:ACR) |
15.5% |
106.9% |
|
Newfield Resources (ASX:NWF) |
31.5% |
72.1% |
|
Echo IQ (ASX:EIQ) |
19.8% |
111.1% |
|
Titomic (ASX:TTT) |
11.2% |
77.2% |
|
Plenti Group (ASX:PLT) |
12.7% |
85% |
|
Image Resources (ASX:IMA) |
16.1% |
127.3% |
|
BETR Entertainment (ASX:BBT) |
38.6% |
77.5% |
We’re going to check out a few of the best picks from our screener tool.
Simply Wall St Growth Rating: ★★★★☆☆
Overview: Aurelia Metals Limited is an Australian company involved in the exploration and production of mineral properties, with a market capitalization of A$456.99 million.
Operations: The company’s revenue is primarily derived from its operations at the Peak Mine (A$245.13 million), Dargues Mine (A$73.90 million), and Hera Mine (A$5.98 million).
Insider Ownership: 23.9%
Aurelia Metals shows promise as a growth company with substantial insider ownership, evidenced by significant insider buying in recent months. The company has returned to profitability, reporting A$17.95 million net income for the half-year ending December 2024 compared to a loss previously. While gold and silver production declined, copper output increased significantly. Analysts forecast robust annual earnings growth of 23.6%, outpacing the broader Australian market’s expected growth rate of 11.7%.
ASX:AMI Earnings and Revenue Growth as at Apr 2025Clarity Pharmaceuticals
Simply Wall St Growth Rating: ★★★★★☆
Overview: Clarity Pharmaceuticals Ltd is a clinical stage radiopharmaceutical company focused on research and development of radiopharmaceutical products in Australia and the United States, with a market cap of A$539.87 million.
Operations: The company’s revenue segment consists of Radiopharmaceutical Development, generating A$10.78 million.
Insider Ownership: 17.8%
Clarity Pharmaceuticals demonstrates strong growth potential, driven by its innovative Cu-SAR-bisPSMA platform for prostate cancer treatment. Recent trial advancements show promising efficacy and safety, with significant PSA reductions in heavily pre-treated participants. The FDA’s Fast Track Designation supports accelerated development. Despite a net loss of A$23.58 million for the half-year ending December 2024, revenue grew to A$10.94 million from A$6.52 million year-over-year, with forecasts indicating rapid revenue growth exceeding market averages.
-
Take a closer look at Clarity Pharmaceuticals’ potential here in our earnings growth report.
-
Our valuation report here indicates Clarity Pharmaceuticals may be overvalued.
ASX:CU6 Earnings and Revenue Growth as at Apr 2025IperionX
Simply Wall St Growth Rating: ★★★★★★
Overview: IperionX Limited is involved in the exploration and development of mineral properties in the United States, with a market capitalization of approximately A$900.03 million.
Operations: IperionX Limited’s revenue segments are not specified in the provided text.
Insider Ownership: 19.2%
IperionX is poised for significant growth, driven by its Titan Critical Minerals Project in Tennessee and strategic U.S. partnerships, including a USD 47.1 million government award to enhance the titanium supply chain. Despite recent shareholder dilution and a net loss of USD 16.24 million for the half-year ending December 2024, IperionX’s revenue is forecast to grow rapidly, outpacing market averages with expected profitability within three years, supported by innovative technologies and substantial insider ownership.
ASX:IPX Ownership Breakdown as at Apr 2025Where To Now?
-
Click through to start exploring the rest of the 90 Fast Growing ASX Companies With High Insider Ownership now.
-
Contemplating Other Strategies? This technology could replace computers: discover the 22 stocks are working to make quantum computing a reality.
This article by Simply Wall St is general in nature. We provide commentary based on historical data and analyst forecasts only using an unbiased methodology and our articles are not intended to be financial advice. It does not constitute a recommendation to buy or sell any stock, and does not take account of your objectives, or your financial situation. We aim to bring you long-term focused analysis driven by fundamental data. Note that our analysis may not factor in the latest price-sensitive company announcements or qualitative material. Simply Wall St has no position in any stocks mentioned.The analysis only considers stock directly held by insiders. It does not include indirectly owned stock through other vehicles such as corporate and/or trust entities. All forecast revenue and earnings growth rates quoted are in terms of annualised (per annum) growth rates over 1-3 years.
Companies discussed in this article include ASX:AMI ASX:CU6 and ASX:IPX.
Have feedback on this article? Concerned about the content? Get in touch with us directly. Alternatively, email editorial-team@simplywallst.com
The Australian market has experienced a relatively stable day, with the ASX200 closing at 7,760 points and sectors like Health Care leading gains. For investors interested in exploring beyond the well-known stocks, penny stocks offer intriguing opportunities. Although the term may seem outdated, these smaller or newer companies can present a mix of affordability and growth potential when backed by strong financials.
Top 10 Penny Stocks In Australia
|
Name |
Share Price |
Market Cap |
Financial Health Rating |
|
CTI Logistics (ASX:CLX) |
A$1.55 |
A$120.92M |
★★★★☆☆ |
|
MotorCycle Holdings (ASX:MTO) |
A$2.04 |
A$150.57M |
★★★★★★ |
|
EZZ Life Science Holdings (ASX:EZZ) |
A$1.50 |
A$70.76M |
★★★★★★ |
|
IVE Group (ASX:IGL) |
A$2.36 |
A$363.87M |
★★★★★☆ |
|
GTN (ASX:GTN) |
A$0.63 |
A$121.16M |
★★★★★★ |
|
Bisalloy Steel Group (ASX:BIS) |
A$3.25 |
A$154.21M |
★★★★★★ |
|
Regal Partners (ASX:RPL) |
A$1.88 |
A$631.99M |
★★★★★★ |
|
Southern Cross Electrical Engineering (ASX:SXE) |
A$1.735 |
A$458.51M |
★★★★★★ |
|
NRW Holdings (ASX:NWH) |
A$2.40 |
A$1.1B |
★★★★★☆ |
|
LaserBond (ASX:LBL) |
A$0.385 |
A$45.17M |
★★★★★★ |
Click here to see the full list of 983 stocks from our ASX Penny Stocks screener.
Here we highlight a subset of our preferred stocks from the screener.
Simply Wall St Financial Health Rating: ★★★★☆☆
Overview: Aurelia Metals Limited is an Australian company involved in the exploration and production of mineral properties, with a market cap of A$406.22 million.
Operations: The company’s revenue is derived from its operations at the Hera Mine (A$5.98 million), Peak Mine (A$245.13 million), and Dargues Mine (A$73.90 million).
Market Cap: A$406.22M
Aurelia Metals has shown a turnaround, becoming profitable recently with net income of A$17.95 million for the half year ending December 2024, compared to a loss previously. The company’s operating cash flow significantly covers its debt, indicating strong financial management. However, its Return on Equity remains low at 4.3%, and interest coverage by EBIT is below optimal levels at 2.6 times. While short-term and long-term liabilities are well-covered by assets, the board and management team lack extensive experience, which could impact strategic decisions as the company navigates growth in a competitive industry environment.
-
Take a closer look at Aurelia Metals’ potential here in our financial health report.
-
Assess Aurelia Metals’ future earnings estimates with our detailed growth reports.
ASX:AMI Debt to Equity History and Analysis as at Apr 2025Chalice Mining
Simply Wall St Financial Health Rating: ★★★★★★
Overview: Chalice Mining Limited is a mineral exploration and evaluation company with a market capitalization of A$408.48 million.
Operations: Currently, there are no reported revenue segments for this mineral exploration and evaluation company.
Market Cap: A$408.48M
Chalice Mining, with a market cap of A$408.48 million, is pre-revenue with sales under US$1 million. Despite being debt-free and having sufficient cash runway for over three years, the company remains unprofitable and isn’t expected to achieve profitability in the near term. Recent management changes include appointing a new COO to advance its Gonneville Project, which may enhance operational focus. However, significant insider selling in recent months could signal caution among stakeholders. While short-term assets exceed liabilities comfortably, earnings are forecasted to decline by 9.3% annually over the next three years amidst high share price volatility.
ASX:CHN Financial Position Analysis as at Apr 2025Sunrise Energy Metals
Simply Wall St Financial Health Rating: ★★★★☆☆
Overview: Sunrise Energy Metals Limited focuses on metal recovery and the exploration of mineral tenements in Australia, with a market cap of A$64.06 million.
Operations: The company generates revenue from its Metals segment, amounting to A$0.24 million.
Market Cap: A$64.06M
Sunrise Energy Metals, with a market cap of A$64.06 million, is pre-revenue and debt-free, with short-term assets exceeding liabilities. Despite being unprofitable, it has reduced losses by 58.4% annually over five years. Recent announcements highlight positive assay results from the Syerston Scandium Project, indicating potential high-grade scandium mineralisation. An updated Mineral Resource Estimate (MRE) supports plans for a dedicated scandium mine and processing plant in NSW. However, the company faces less than a year of cash runway based on current free cash flow trends and exhibits significant share price volatility recently increasing to 21%.
ASX:SRL Financial Position Analysis as at Apr 2025Summing It All Up
-
Embark on your investment journey to our 983 ASX Penny Stocks selection here.
-
Interested In Other Possibilities? Outshine the giants: these 25 early-stage AI stocks could fund your retirement.
This article by Simply Wall St is general in nature. We provide commentary based on historical data and analyst forecasts only using an unbiased methodology and our articles are not intended to be financial advice. It does not constitute a recommendation to buy or sell any stock, and does not take account of your objectives, or your financial situation. We aim to bring you long-term focused analysis driven by fundamental data. Note that our analysis may not factor in the latest price-sensitive company announcements or qualitative material. Simply Wall St has no position in any stocks mentioned.
Companies discussed in this article include ASX:AMI ASX:CHN and ASX:SRL .
This article was originally published by Simply Wall St .
Have feedback on this article? Concerned about the content? Get in touch with us directly. Alternatively, email editorial-team@simplywallst.com
The Australian market has been experiencing a relatively stable period, with the ASX200 closing at 7,760 points and sectors such as Health Care showing positive momentum. In this environment of steady market activity and sector-specific movements, identifying stocks with unique growth potential can be particularly rewarding. Discovering these hidden gems requires looking beyond current volatility and focusing on companies that demonstrate resilience and innovation in their respective fields.
Top 10 Undiscovered Gems With Strong Fundamentals In Australia
|
Name |
Debt To Equity |
Revenue Growth |
Earnings Growth |
Health Rating |
|---|---|---|---|---|
|
Sugar Terminals |
NA |
3.78% |
4.30% |
★★★★★★ |
|
Schaffer |
25.47% |
6.03% |
-5.20% |
★★★★★★ |
|
Fiducian Group |
NA |
9.97% |
7.85% |
★★★★★★ |
|
Hearts and Minds Investments |
NA |
47.09% |
49.82% |
★★★★★★ |
|
Tribune Resources |
NA |
-10.33% |
-48.18% |
★★★★★★ |
|
Djerriwarrh Investments |
1.14% |
8.17% |
7.54% |
★★★★★★ |
|
Red Hill Minerals |
NA |
95.16% |
40.06% |
★★★★★★ |
|
Lycopodium |
6.89% |
16.56% |
32.73% |
★★★★★☆ |
|
Carlton Investments |
0.02% |
4.45% |
3.97% |
★★★★★☆ |
|
K&S |
20.24% |
1.58% |
25.54% |
★★★★☆☆ |
Let’s explore several standout options from the results in the screener.
Simply Wall St Value Rating: ★★★★☆☆
Overview: Aurelia Metals Limited is an Australian company focused on the exploration and production of mineral properties, with a market capitalization of A$406.22 million.
Operations: Aurelia Metals generates revenue primarily from its Peak Mine, contributing A$245.13 million, followed by the Dargues Mine at A$73.90 million and Hera Mine at A$5.98 million.
Aurelia Metals, a promising player in the mining sector, has shown significant improvements recently. The company reported a net income of A$17.95 million for the half-year ending December 2024, bouncing back from a loss of A$2.03 million the previous year. Sales increased to A$162.42 million from A$147.29 million, indicating robust operational performance despite lower gold and silver production compared to last year. Trading at 85% below its estimated fair value suggests potential upside for investors seeking undervalued opportunities. However, its interest coverage ratio of 2.6x indicates room for improvement in managing debt-related expenses efficiently.
-
Take a closer look at Aurelia Metals’ potential here in our health report.
-
Understand Aurelia Metals’ track record by examining our Past report.
ASX:AMI Earnings and Revenue Growth as at Apr 2025Tasmea
Simply Wall St Value Rating: ★★★★★☆
Overview: Tasmea Limited offers shutdown, maintenance, emergency breakdown, and capital upgrade services in Australia with a market capitalization of A$612.06 million.
Operations: With a market capitalization of A$612.06 million, Tasmea Limited generates revenue primarily from providing shutdown, maintenance, emergency breakdown, and capital upgrade services in Australia.
Tasmea’s recent addition to the S&P/ASX All Ordinaries Index highlights its growing prominence. The company reported impressive half-year sales of A$246.65 million, up from A$193.32 million, with net income jumping to A$27.81 million from A$15.78 million a year earlier, showcasing solid growth momentum. Earnings per share rose to A$0.12 from A$0.08, reflecting improved profitability despite a high net debt to equity ratio of 49.7%. With earnings growth outpacing the construction industry at 75% and well-covered interest payments by EBIT (10x), Tasmea seems poised for continued expansion under fresh leadership and strategic focus on organic growth strategies.
-
Get an in-depth perspective on Tasmea’s performance by reading our health report here.
-
Assess Tasmea’s past performance with our detailed historical performance reports.
ASX:TEA Debt to Equity as at Apr 2025West African Resources
Simply Wall St Value Rating: ★★★★★★
Overview: West African Resources Limited focuses on the mining, mineral processing, acquisition, exploration, and project development of gold projects in West Africa with a market capitalization of A$2.66 billion.
Operations: West African Resources Limited generates its revenue primarily from mining operations, amounting to A$726.63 million. The company’s financial structure includes a notable net profit margin trend, which can provide insights into its profitability.
West African Resources is gearing up for a transformative phase with its Kiaka project, which is over 80% complete and set to start gold production in Q3 2025. This development could elevate annual output to about 420,000 ounces, enhancing revenue streams. The firm reported first-quarter gold production at 50,033 ounces and sales of 48,338 ounces at an average price of US$2,832 per ounce. With net income rising from A$146.87 million to A$223.84 million year-over-year and profit margins projected to grow from 30.7% to 35.3%, the company shows promising potential despite regulatory risks in Burkina Faso and market volatility concerns impacting future earnings projections between A$423.6 million and A$840 million by April 2028.
ASX:WAF Earnings and Revenue Growth as at Apr 2025Turning Ideas Into Actions
-
Click here to access our complete index of 50 ASX Undiscovered Gems With Strong Fundamentals.
-
Are you invested in these stocks already? Keep abreast of every twist and turn by setting up a portfolio with Simply Wall St, where we make it simple for investors like you to stay informed and proactive.
-
Discover a world of investment opportunities with Simply Wall St’s free app and access unparalleled stock analysis across all markets.
Ready For A Different Approach?
-
Explore high-performing small cap companies that haven’t yet garnered significant analyst attention.
-
Fuel your portfolio with companies showing strong growth potential, backed by optimistic outlooks both from analysts and management.
-
Find companies with promising cash flow potential yet trading below their fair value.
This article by Simply Wall St is general in nature. We provide commentary based on historical data and analyst forecasts only using an unbiased methodology and our articles are not intended to be financial advice. It does not constitute a recommendation to buy or sell any stock, and does not take account of your objectives, or your financial situation. We aim to bring you long-term focused analysis driven by fundamental data. Note that our analysis may not factor in the latest price-sensitive company announcements or qualitative material. Simply Wall St has no position in any stocks mentioned.
Companies discussed in this article include ASX:AMI ASX:TEA and ASX:WAF.
Have feedback on this article? Concerned about the content? Get in touch with us directly. Alternatively, email editorial-team@simplywallst.com
Over the last 7 days, the United States market has risen by 5.8%, contributing to a 4.8% climb over the past year, with earnings forecasted to grow by 14% annually. In this dynamic environment, identifying strong dividend stocks like A-Mark Precious Metals can be a prudent strategy for investors seeking reliable income and potential growth opportunities.
Top 10 Dividend Stocks In The United States
|
Name |
Dividend Yield |
Dividend Rating |
|
Columbia Banking System (NasdaqGS:COLB) |
6.91% |
★★★★★★ |
|
Interpublic Group of Companies (NYSE:IPG) |
5.37% |
★★★★★★ |
|
Douglas Dynamics (NYSE:PLOW) |
5.24% |
★★★★★★ |
|
First Interstate BancSystem (NasdaqGS:FIBK) |
7.73% |
★★★★★★ |
|
OceanFirst Financial (NasdaqGS:OCFC) |
5.42% |
★★★★★★ |
|
Regions Financial (NYSE:RF) |
7.51% |
★★★★★★ |
|
Peoples Bancorp (NasdaqGS:PEBO) |
5.96% |
★★★★★★ |
|
Southside Bancshares (NYSE:SBSI) |
5.43% |
★★★★★★ |
|
Dillard’s (NYSE:DDS) |
8.36% |
★★★★★★ |
|
Citizens & Northern (NasdaqCM:CZNC) |
6.11% |
★★★★★★ |
Click here to see the full list of 176 stocks from our Top US Dividend Stocks screener.
Here’s a peek at a few of the choices from the screener.
Simply Wall St Dividend Rating: ★★★★☆☆
Overview: A-Mark Precious Metals, Inc., along with its subsidiaries, operates as a precious metals trading company and has a market cap of approximately $588.14 million.
Operations: A-Mark Precious Metals, Inc. generates revenue primarily through its Direct-To-Consumer segment, which accounts for $1.81 billion, and its Wholesale Sales & Ancillary Services segment, contributing $10.09 billion.
Dividend Yield: 3.4%
A-Mark Precious Metals maintains a quarterly dividend of US$0.20 per share, with a payout ratio of 35.8%, indicating dividends are well-covered by earnings and cash flows (cash payout ratio at 15.3%). However, its dividend history is volatile, lacking reliability over the past decade despite some growth. The stock trades at a favorable price-to-earnings ratio of 11.4x compared to the US market average of 16.3x but has low profit margins and debt challenges impacting financial stability.
NasdaqGS:AMRK Dividend History as at Apr 2025CNH Industrial
Simply Wall St Dividend Rating: ★★★★☆☆
Overview: CNH Industrial N.V. is an equipment and services company involved in the design, production, marketing, sale, and financing of agricultural and construction equipment across various regions including North America, Europe, the Middle East, Africa, South America, and Asia Pacific with a market cap of approximately $14.40 billion.
Operations: CNH Industrial generates revenue from its key segments, with $14.01 billion from Industrial Activities – Agriculture, $3.05 billion from Industrial Activities – Construction, and $2.77 billion from Financial Services.
Dividend Yield: 4.1%
CNH Industrial’s dividend of US$0.25 per share, while covered by earnings (payout ratio: 34.1%) and cash flows (cash payout ratio: 75%), is lower than the top US dividend payers. Despite past increases, its dividend history is unstable. Recent executive changes, including a new CFO with extensive finance experience, may impact strategic priorities. The company continues to explore acquisitions to enhance technology offerings while investing in advanced training methods globally to improve workforce skills and product quality.
NYSE:CNH Dividend History as at Apr 2025Southern Copper
Simply Wall St Dividend Rating: ★★★★☆☆
Overview: Southern Copper Corporation is involved in the mining, exploration, smelting, and refining of copper and other minerals across Peru, Mexico, Argentina, Ecuador, and Chile with a market cap of $67.38 billion.
Operations: Southern Copper Corporation’s revenue primarily comes from its Mexican Open-Pit operations at $6.32 billion, followed by Peruvian Operations generating $4.60 billion, and the Mexican Industrial Minera Mexico and Subsidiaries (IMMSA) Unit contributing $704.10 million.
Dividend Yield: 3.3%
Southern Copper’s dividend of US$0.70 per share is well-covered by earnings (payout ratio: 48.2%) and cash flows (cash payout ratio: 64.8%), though its history shows volatility over the past decade. Recent financial results highlight strong growth, with annual net income rising to US$3.38 billion from US$2.43 billion, supporting its dividend payments despite a relatively low yield compared to top-tier U.S. dividend payers at 3.26%.
NYSE:SCCO Dividend History as at Apr 2025Seize The Opportunity
-
Delve into our full catalog of 176 Top US Dividend Stocks here.
-
Have you diversified into these companies? Leverage the power of Simply Wall St’s portfolio to keep a close eye on market movements affecting your investments.
-
Invest smarter with the free Simply Wall St app providing detailed insights into every stock market around the globe.
Curious About Other Options?
-
Explore high-performing small cap companies that haven’t yet garnered significant analyst attention.
-
Fuel your portfolio with companies showing strong growth potential, backed by optimistic outlooks both from analysts and management.
-
Find companies with promising cash flow potential yet trading below their fair value.
This article by Simply Wall St is general in nature. We provide commentary based on historical data and analyst forecasts only using an unbiased methodology and our articles are not intended to be financial advice. It does not constitute a recommendation to buy or sell any stock, and does not take account of your objectives, or your financial situation. We aim to bring you long-term focused analysis driven by fundamental data. Note that our analysis may not factor in the latest price-sensitive company announcements or qualitative material. Simply Wall St has no position in any stocks mentioned.
Companies discussed in this article include NasdaqGS:AMRK NYSE:CNH and NYSE:SCCO.
Have feedback on this article? Concerned about the content? Get in touch with us directly. Alternatively, email editorial-team@simplywallst.com
WHITE ROCK, BC / ACCESS Newswire / April 14, 2025 / Honey Badger Silver Inc. (TSXV:TUF)(OTCQB:HBEIF) ("Honey Badger" or the "Company") announces that Dorian L. (Dusty) Nicol will be stepping down as the Company's CEO, effective today. Chad Williams, the Company's Chairman, will change his role to Executive Chairman and Interim CEO. Dusty will remain a Director of the Company and will be retained as an advisor on technical matters.
Honey Badger's Executive Chairman, Chad Williams, commented, "The Company thanks Dusty for his efforts and commitment during this time of transition and growth of Honey Badger. He will continue to serve an important function as the Company's senior technical advisor. As a large shareholder of Honey Badger, and a strong believer in the outlook for the price of silver, I am committed to the success of this Company. We own 100% of 7 high-quality silver mineral assets located in favorable locations. We acquired these assets at very attractive prices while other silver companies were essentially dormant during a period of lower silver prices. Our projects represent much higher value than what is being represented in our current share price. It's up to me, and Honey Badger in general, to surface that value."
Chad Williams has an extensive background in capital markets and business management. He is the founder and Chairman of Red Cloud Mining Capital, Inc. He was one of the founders of both Agilith Capital Inc. and Westwind Capital Inc., as well as the former CEO of Victoria Gold Corp. (he departed in 2011) and former Head of Mining Investment Banking at Blackmont Capital Inc. Prior to these positions, Mr. Williams was a top-ranked mining analyst at TD Bank and other Canadian brokerage firms in Toronto. Mr. Williams is a member of the Association of Professional Engineers of Ontario, having received a Bachelor of Engineering degree and a Master of Business Administration from McGill University.
About Honey Badger Silver Inc.
Honey Badger Silver is a silver company. The company is led by a highly experienced leadership team with a track record of value creation backed by a skilled technical team. Our projects are located in areas with a long history of mining, including the Sunrise Lake project with a historic resource of 12.8 Moz of silver (and 201.3 million pounds of zinc) Indicated and 13.9 Moz of silver (and 247.8 million pounds of zinc) Inferred (1)(3) located in the Northwest Territories and the Plata high grade silver project located 165 km east of Yukon's prolific Keno Hill and adjacent to Snowline Gold's Rogue discovery. The Company's Clear Lake Project in the Yukon Territory has a historic resource of 5.5 Moz of silver and 1.3 billion pounds of zinc (2)(3). The Company also has a significant land holding at the Nanisivik Mine Area located in Nunavut, Canada that produced over 20 Moz of silver between 1976 and 2002 (2,3). A qualified person has not done sufficient work to classify the foregoing historical resources as current mineral resources and the Company is not treating the estimates as current mineral resources. The historical resource estimates are provided solely for the purpose as an indication of the volume of mineralization that could be present. Additional work, including verification drilling / sampling, will be required to verify any of the historical estimates as a current mineral resources.
(1) Sunrise Lake 2003 RPA historic resource: Indicated 1.522 million tonnes grading 262 grams/tonne silver, 6.0% zinc, 2.4% lead, 0.08% copper, and 0.67 grams/tonne gold and Inferred 2.555 million tonnes grading 169 grams/tonne silver, 4.4% zinc, 1.9% lead, 0.07% copper, and 0.51 grams/tonne gold.
(2) Clear Lake 2010 SRK historic Resource: Inferred 7.76 million tonnes grading 22 grams/tonne silver, 7.6% zinc, and 1.08% lead.
(3) Geological Survey of Canada, 2002-C22, "Structural and Stratigraphic Controls on Zn-Pb-Ag Mineralization at the Nanisivik Mississippi Valley type Deposit, Northern Baffin Island, Nunavut; by Patterson and Powis."
ON BEHALF OF THE BOARD
Chad Williams, Executive Chairman
For more information please visit our website www.honeybadgersilver.com or contact Mrs. Sonya Pekar for Investor Relations | spekar@honeybadgersilver.com | +1 (647) 498-8244.
Neither the TSX Venture Exchange nor its Regulation Services Provider (as that term is defined in the policies of the TSX Venture Exchange) accepts responsibility for the adequacy or accuracy of this release.
Cautionary Note Regarding Forward-Looking Information
This news release contains "forward-looking information" within the meaning of the applicable Canadian securities legislation that is based on expectations, estimates, projections and interpretations as at the date of this news release. Any statement that involves discussions with respect to predictions, expectations, interpretations, beliefs, plans, projections, objectives, assumptions, future events or performance (often but not always using phrases such as "expects", or "does not expect", "is expected", "interpreted", "management's view", "anticipates" or "does not anticipate", "plans", "budget", "scheduled", "forecasts", "estimates", "believes" or "intends" or variations of such words and phrases or stating that certain actions, events or results "may" or "could", "would", "might" or "will" be taken to occur or be achieved) are not statements of historical fact and may be forward-looking information and are intended to identify forward-looking information. This forward-looking information is based on reasonable assumptions and estimates of management of the Company at the time such assumptions and estimates were made, and involves known and unknown risks, uncertainties and other factors which may cause the actual results, performance or achievements of Honey Badger to be materially different from any future results, performance or achievements expressed or implied by such forward-looking information.
Such factors include, but are not limited to, risks relating to capital and operating costs varying significantly from estimates; delays in obtaining or failures to obtain required governmental, environmental or other project approvals; uncertainties relating to the availability and costs of financing needed in the future; changes in equity markets; inflation; fluctuations in commodity prices; delays in the development of projects; other risks involved in the mineral exploration and development industry; and those risks set out in the Company's public documents filed on SEDAR+ (www.sedarplus.ca) under Honey Badger's issuer profile. Although the Company believes that the assumptions and factors used in preparing the forward-looking information in this news release are reasonable, undue reliance should not be placed on such information, which only applies as of the date of this news release, and no assurance can be given that such events will occur in the disclosed timeframes or at all. The Company disclaims any intention or obligation to update or revise any forward-looking information, whether as a result of new information, future events or otherwise, other than as required by law.
SOURCE: Honey Badger Silver Inc.
View the original press release on ACCESS Newswire
Most readers would already be aware that Aurelia Metals' (ASX:AMI) stock increased significantly by 33% over the past three months. But the company's key financial indicators appear to be differing across the board and that makes us question whether or not the company's current share price momentum can be maintained. In this article, we decided to focus on Aurelia Metals' ROE.
Return on equity or ROE is an important factor to be considered by a shareholder because it tells them how effectively their capital is being reinvested. In other words, it is a profitability ratio which measures the rate of return on the capital provided by the company's shareholders.
How Is ROE Calculated?
ROE can be calculated by using the formula:
Return on Equity = Net Profit (from continuing operations) ÷ Shareholders' Equity
So, based on the above formula, the ROE for Aurelia Metals is:
4.3% = AU$14m ÷ AU$329m (Based on the trailing twelve months to December 2024).
The 'return' is the yearly profit. That means that for every A$1 worth of shareholders' equity, the company generated A$0.04 in profit.
Check out our latest analysis for Aurelia Metals
What Has ROE Got To Do With Earnings Growth?
We have already established that ROE serves as an efficient profit-generating gauge for a company's future earnings. Based on how much of its profits the company chooses to reinvest or "retain", we are then able to evaluate a company's future ability to generate profits. Assuming all else is equal, companies that have both a higher return on equity and higher profit retention are usually the ones that have a higher growth rate when compared to companies that don't have the same features.
Aurelia Metals' Earnings Growth And 4.3% ROE
It is quite clear that Aurelia Metals' ROE is rather low. Not just that, even compared to the industry average of 12%, the company's ROE is entirely unremarkable. For this reason, Aurelia Metals' five year net income decline of 35% is not surprising given its lower ROE. However, there could also be other factors causing the earnings to decline. For instance, the company has a very high payout ratio, or is faced with competitive pressures.
However, when we compared Aurelia Metals' growth with the industry we found that while the company's earnings have been shrinking, the industry has seen an earnings growth of 20% in the same period. This is quite worrisome.
ASX:AMI Past Earnings Growth April 14th 2025
Earnings growth is a huge factor in stock valuation. The investor should try to establish if the expected growth or decline in earnings, whichever the case may be, is priced in. This then helps them determine if the stock is placed for a bright or bleak future. Is Aurelia Metals fairly valued compared to other companies? These 3 valuation measures might help you decide.
Is Aurelia Metals Using Its Retained Earnings Effectively?
Because Aurelia Metals doesn't pay any regular dividends, we infer that it is retaining all of its profits, which is rather perplexing when you consider the fact that there is no earnings growth to show for it. It looks like there might be some other reasons to explain the lack in that respect. For example, the business could be in decline.
Summary
On the whole, we feel that the performance shown by Aurelia Metals can be open to many interpretations. While the company does have a high rate of profit retention, its low rate of return is probably hampering its earnings growth. That being so, the latest industry analyst forecasts show that the analysts are expecting to see a huge improvement in the company's earnings growth rate. To know more about the latest analysts predictions for the company, check out this visualization of analyst forecasts for the company.
Have feedback on this article? Concerned about the content? Get in touch with us directly. Alternatively, email editorial-team (at) simplywallst.com.This article by Simply Wall St is general in nature. We provide commentary based on historical data and analyst forecasts only using an unbiased methodology and our articles are not intended to be financial advice. It does not constitute a recommendation to buy or sell any stock, and does not take account of your objectives, or your financial situation. We aim to bring you long-term focused analysis driven by fundamental data. Note that our analysis may not factor in the latest price-sensitive company announcements or qualitative material. Simply Wall St has no position in any stocks mentioned.
Wallbridge Mining Company Limited
TORONTO, April 10, 2025 (GLOBE NEWSWIRE) — Wallbridge Mining Company Limited (TSX: WM, OTCQB: WLBMF) (“Wallbridge” or the “Company”) announces that Tony Makuch is stepping down as a Director and Chairperson of the Board of Wallbridge. Janet Wilkinson, who currently serves as an independent director, has been appointed Chairperson of the Board, effective April 9, 2025.
“On behalf of the Board, I take this opportunity to express our deep appreciation to Tony for having served as a dedicated Chairperson and member of various Board committees since joining the Board in 2019,” commented Danielle Giovenazzo, Director and Chairperson of the Technical and HSE Committee. “We are pleased to appoint Janet Wilkinson as Wallbridge’s new Chairperson. As Wallbridge’s longest-tenured director, Janet has a deep knowledge of the Company and extensive Board experience. We are confident she will add tremendous value to this important leadership position,” concluded Ms. Giovenazzo.
“I have enjoyed working with the Wallbridge management team and Board however, at this time my commitment and full attention needs to be dedicated to Discovery Silver,” commented Mr. Makuch. “I look forward to following the progress at Fenelon and am confident in the Company’s projects and Wallbridge’s future success.”
About Wallbridge Mining
Wallbridge is focused on creating value through the exploration and sustainable development of gold projects in Quebec’s Abitibi region while respecting the environment and communities where it operates. The Company holds a contiguous mineral property position totaling 830 km2 that extends approximately 97 km along the Detour-Fenelon gold trend. The property is host to the Company’s flagship PEA stage Fenelon Gold Project, and its earlier exploration stage Martiniere Gold Project, as well as numerous other gold exploration projects.
For further information please visit the Company’s website at https://wallbridgemining.com/ or contact:
|
Brian Penny, CPA, CMACEOEmail: bpenny@wallbridgemining.comM: +1 416 716 8346 |
Tania Barreto, CPIRDirector Investor RelationsEmail: tbarreto@wallbridgemining.comM: +1 289 819 3012 |
Cautionary Note Regarding Forward-Looking Information
The information in this document may contain forward-looking statements or information (collectively, “FLI”) within the meaning of applicable Canadian securities legislation. FLI is based on expectations, estimates, projections, and interpretations as at the date of this document.
All statements, other than statements of historical fact, included herein are FLI that involve various risks, assumptions, estimates and uncertainties. Generally, FLI can be identified by the use of statements that include, but are not limited to, words such as “seeks”, “believes”, “anticipates”, “plans”, “continues”, “budget”, “scheduled”, “estimates”, “expects”, “forecasts”, “intends”, “projects”, “predicts”, “proposes”, "potential", “targets” and variations of such words and phrases, or by statements that certain actions, events or results “may”, “will”, “could”, “would”, “should” or “might”, “be taken”, “occur” or “be achieved.”
FLI in this document may include, but is not limited to; the Company’s exploration plans; the future prospects of Wallbridge; statements regarding the results of the Fenelon preliminary economic assessment (“PEA”); future drill results; the Company’s ability to convert inferred resources into measured and indicated resources; environmental matters; stakeholder engagement and relationships; parameters and methods used to estimate the mineral resource estimates (“MRE”) at the Fenelon and Martiniere properties (collectively the “Deposits”); the prospects, if any, of the Deposits; future drilling at the Deposits; and the significance of historic exploration activities and results.
FLI is designed to help you understand management’s current views of its near- and longer-term prospects, and it may not be appropriate for other purposes. FLI by their nature are based on assumptions and involve known and unknown risks, uncertainties and other factors which may cause the actual results, performance, or achievements of the Company to be materially different from any future results, performance or achievements expressed or implied by such FLI. Although the FLI contained in this document is based upon what management believes, or believed at the time, to be reasonable assumptions, the Company cannot assure shareholders and prospective purchasers of securities of the Company that actual results will be consistent with such FLI, as there may be other factors that cause results not to be as anticipated, estimated or intended, and neither the Company nor any other person assumes responsibility for the accuracy and completeness of any such FLI. Except as required by law, the Company does not undertake, and assumes no obligation, to update or revise any such FLI contained in this document to reflect new events or circumstances. Unless otherwise noted, this document has been prepared based on information available as of the date of this document. Accordingly, you should not place undue reliance on the FLI, or information contained herein.
Furthermore, should one or more of the risks, uncertainties or other factors materialize, or should underlying assumptions prove incorrect, actual results may vary materially from those described in FLI.
Assumptions upon which FLI is based, without limitation, include: the results of exploration activities, the Company’s financial position and general economic conditions; the ability of exploration activities to accurately predict mineralization; the accuracy of geological modelling; the ability of the Company to complete further exploration activities; the legitimacy of title and property interests in the Deposits; the accuracy of key assumptions, parameters or methods used to estimate the MREs and in the PEA; the ability of the Company to obtain required approvals; geological, mining and exploration technical problems; and failure of equipment or processes to operate as anticipated; the evolution of the global economic climate; metal prices; foreign exchange rates; environmental expectations; community and non-governmental actions; and, the Company’s ability to secure required funding. Risks and uncertainties about Wallbridge's business are discussed in the disclosure materials filed with the securities regulatory authorities in Canada, which are available at www.sedarplus.ca.
Cautionary Notes to United States Investors
Wallbridge prepares its disclosure in accordance with NI 43-101 which differs from the requirements of the U.S. Securities and Exchange Commission (the "SEC"). Terms relating to mineral properties, mineralization and estimates of mineral reserves and mineral resources and economic studies used herein are defined in accordance with NI 43-101 under the guidelines set out in CIM Definition Standards on Mineral Resources and Mineral Reserves, adopted by the Canadian Institute of Mining, Metallurgy and Petroleum Council on May 19, 2014, as amended. NI 43-101 differs significantly from the disclosure requirements of the SEC generally applicable to US companies. As such, the information presented herein concerning mineral properties, mineralization and estimates of mineral reserves and mineral resources may not be comparable to similar information made public by U.S. companies subject to the reporting and disclosure requirements under the U.S. federal securities laws and the rules and regulations thereunder.
VANCOUVER, BC, April 4, 2025 /CNW/ – Rokmaster Resources Corp. (TSXV: RKR) (OTCQB: RKMSF) (FSE: 1RR1) ("Rokmaster" or "the Company") announces that the Company intends to complete a non-brokered financing (the "Financing") for a total of up to $550,000 involving the sale of flow-through shares (the "FT Shares") and non-flow-through units (the "NFT Units").
The flow-through funding will consist of up to 6,250,000 FT Shares, priced at $0.04 per FT Share for gross proceeds of up to $250,000 and the non-flow-through funding will consist of up to 15,000,000 NFT Units, priced at $0.02 per NFT Unit for gross proceeds of up to $300,000. Each NFT Unit will consist of one common share plus one-half non-transferable share purchase warrant (a "Warrant"). Each whole Warrant is exercisable to purchase one additional common share of the Company (the "Warrant Share") at $0.05 for a period of two years from the date of closing.
The Warrants are subject to an accelerated expiry date, which comes into effect when the trading price on the TSX Venture Exchange of the Company's common shares closes at or above $0.10 per share for a period of 10 consecutive trading days commencing four months plus one day after the date of closing. In such event, the Company may, at its option, accelerate the expiry date of the Warrants by issuing a press release (the "Notice") to the Warrant holders and in such case, the expiry date of the Warrants will be 30 days from the date of the Notice.
The FT Shares will qualify as "flow-through shares" (within the meaning of subsection 66(15) of the Income Tax Act (Canada) (the "Tax Act"). The gross proceeds raised from the sale of the FT Share will be used by Rokmaster to incur "Canadian exploration expenses" (within the meaning of the Tax Act). Rokmaster will use funds raised from the sale of the NFT Units on non-flow-through eligible project expenses as well as for general working capital purposes. The Company reserves the right to accept additional funds, subject to regulatory approval, should the Financing be oversubscribed.
Directors and officers of the Company may acquire securities under the Financing, which participation would be considered to be a "related party transaction" as defined under Multilateral Instrument 61-101 ("MI 61-101"). Such participation is expected to be exempt from the formal valuation and minority shareholder approval requirements of MI 61-101.
The Financing is subject to TSX Venture Exchange approval and all securities issued pursuant to the Financing will be subject to a four-month and one day hold period from the closing date and are not being offered or registered in the United States.
For more information please contact:John Mirko, President & CEO of Rokmaster Resources Corp., jmirko@rokmaster.com Ph. +1 (604) 290-4647 or by website: www.rokmaster.com
For shareholder information please contact:Mike Kordysz, mkordysz@rokmaster.com, Ph. +1 (604) 319-3171
On Behalf of the Board of Directors ofRokmaster Resources Corp.John Mirko,President & Chief Executive Officer.
Neither TSX Venture Exchange nor its Regulation Services Provider (as that term in defined in the policies of the TSX Venture Exchange) accepts responsibility for the adequacy or accuracy of this press release.
CAUTIONARY NOTE REGARDING FORWARD LOOKING STATEMENTS: This news release may contain forward-looking information within the meaning of applicable securities laws ("forward-looking statements"). Forward-looking statements are statements that are not historical facts and are generally, but not always, identified by the words "expects," "plans," "anticipates," "believes," "intends," "estimates," 'projects," "potential" and similar expressions, or that events or conditions "will," "would," "may," "could" or "should" occur. These forward-looking statements are subject to a variety of risks and uncertainties which could cause actual events or results to differ materially from those reflected in the forward-looking statements, including, without limitation: completing the Financing; risks related to fluctuations in metal prices; uncertainties related to raising sufficient financing to fund the planned work in a timely manner and on acceptable terms; changes in planned work resulting from weather, logistical, technical or other factors; the possibility that results of work will not fulfill expectations and realize the perceived potential of the Company's properties; risk of accidents, equipment breakdowns and labour disputes or other unanticipated difficulties or interruptions; the possibility of cost overruns or unanticipated expenses in the work program; the risk of environmental contamination or damage resulting from Rokmaster's operations and other risks and uncertainties. Any forward-looking statement speaks only as of the date it is made and, except as may be required by applicable securities laws, the Company disclaims any intent or obligation to update any forward-looking statement, whether as a result of new information, future vents or results or otherwise.
SOURCE Rokmaster Resources Corp.
Cision
View original content to download multimedia: http://www.newswire.ca/en/releases/archive/April2025/04/c6114.html
Southern Copper (SCCO) ended the recent trading session at $94.36, demonstrating a +0.51% swing from the preceding day's closing price. The stock's performance was behind the S&P 500's daily gain of 0.67%. Elsewhere, the Dow gained 0.56%, while the tech-heavy Nasdaq added 0.87%.
The miner's shares have seen an increase of 9.26% over the last month, surpassing the Basic Materials sector's gain of 0.34% and the S&P 500's loss of 5.28%.
The investment community will be paying close attention to the earnings performance of Southern Copper in its upcoming release. In that report, analysts expect Southern Copper to post earnings of $1.05 per share. This would mark year-over-year growth of 11.7%. Meanwhile, the latest consensus estimate predicts the revenue to be $2.79 billion, indicating a 7.48% increase compared to the same quarter of the previous year.
Looking at the full year, the Zacks Consensus Estimates suggest analysts are expecting earnings of $4.63 per share and revenue of $11.7 billion. These totals would mark changes of +6.93% and +2.31%, respectively, from last year.
Investors should also pay attention to any latest changes in analyst estimates for Southern Copper. These revisions help to show the ever-changing nature of near-term business trends. As a result, upbeat changes in estimates indicate analysts' favorable outlook on the company's business health and profitability.
Our research shows that these estimate changes are directly correlated with near-term stock prices. To utilize this, we have created the Zacks Rank, a proprietary model that integrates these estimate changes and provides a functional rating system.
The Zacks Rank system, ranging from #1 (Strong Buy) to #5 (Strong Sell), possesses a remarkable history of outdoing, externally audited, with #1 stocks returning an average annual gain of +25% since 1988. Within the past 30 days, our consensus EPS projection has moved 1.22% higher. As of now, Southern Copper holds a Zacks Rank of #3 (Hold).
In terms of valuation, Southern Copper is presently being traded at a Forward P/E ratio of 20.28. This represents a premium compared to its industry's average Forward P/E of 18.8.
We can additionally observe that SCCO currently boasts a PEG ratio of 1.84. Comparable to the widely accepted P/E ratio, the PEG ratio also accounts for the company's projected earnings growth. As of the close of trade yesterday, the Mining – Non Ferrous industry held an average PEG ratio of 0.79.
The Mining – Non Ferrous industry is part of the Basic Materials sector. At present, this industry carries a Zacks Industry Rank of 188, placing it within the bottom 25% of over 250 industries.
The Zacks Industry Rank assesses the vigor of our specific industry groups by computing the average Zacks Rank of the individual stocks incorporated in the groups. Our research shows that the top 50% rated industries outperform the bottom half by a factor of 2 to 1.
Remember to apply Zacks.com to follow these and more stock-moving metrics during the upcoming trading sessions.
Want the latest recommendations from Zacks Investment Research? Today, you can download 7 Best Stocks for the Next 30 Days. Click to get this free report
Southern Copper Corporation (SCCO) : Free Stock Analysis Report
This article originally published on Zacks Investment Research (zacks.com).
We recently published a list of 10 Best Metal Stocks to Buy According to Billionaires. In this article, we will look at where Teck Resources Limited (NYSE:TECK) stands against other best metal stocks to buy.
When investing in the best metal stocks, the stakes are high, and the potential rewards are even higher. Metals power the modern economy, from the foundations of skyscrapers to the circuits in your smartphone. For savvy investors, these commodities offer a strategic opportunity to capitalize on global demand, fluctuating prices, and billionaire-backed bets that shape the future of the industry.
As of March 2025, the U.S. stock market has been riding a wave of volatility, with the broader market reaching a record high of 6,152.87 in February, marking a 3.49% increase year-to-date. However, the index suffered a decline in March. Meanwhile, copper prices have skyrocketed to an unprecedented $5.24 per pound, largely driven by looming 25% tariffs on imports and China’s aggressive economic stimulus measures. Investors have been quick to respond, driving up the stock prices of major mining giants.
The precious metals sector has been equally dynamic. Gold futures are climbing 14%, and analysts are projecting further earnings growth of 17% in 2025 and 16% in 2026.
One of the strongest signals in the metals market comes from billionaire investors. Heavyweights like Berkshire Hathaway, led by Warren Buffett, have a strong presence in the metals sector, with a strategic focus on silver and gold mining companies rather than direct gold ownership. Beyond U.S. borders, Buffett’s investment strategy has extended into Japan’s massive trading conglomerates. These firms operate across multiple industries, with significant stakes in natural resources and metals, highlighting the global nature of the metals market.
The rise of rare metals has also drawn significant interest, with billionaires like Bill Gates and Jeff Bezos funneling $537 million into Africa’s rare metals sector, as reported by Business Insider. As the world shifts toward renewable energy and advanced technology, the demand for critical minerals is soaring, promising new wealth for those who control these resources.
With 40% of investors planning to increase their exposure to gold and other precious metals in the next 12 months, as highlighted by the UBS Billionaire Ambitions Report 2024, the metals and mining sector remains a dynamic and lucrative space. While tech and banking CEOs dominate the headlines, eight of the world’s 100 richest individuals on the Forbes Billionaires List have built their fortunes in metals and mining. Understanding the factors driving these investments is key to making informed decisions.
Deloitte’s Tracking the Trends 2025 Report highlighted the key trends in the industry. Specifically, it underscores the power of inclusive leadership in driving innovation and problem-solving in the metals industry—critical in today’s fast-evolving economic, social, and environmental landscape. Companies that embrace technology, enhance safety, and stay adaptable position themselves for sustainable growth.
Meanwhile, AI is revolutionizing mineral exploration, optimizing geoscience data to accelerate target identification, slash costs, and streamline project timelines—essential for mitigating metal shortages.
On the revenue side, PwC’s Mine Report revealed that despite increased production, the world’s top 40 miners saw revenues drop over 7% in 2024 due to falling commodity prices and rising costs. KPMG’s 2024 industry index shows modest gains despite geopolitical turbulence and macroeconomic pressures. Key challenges? Tech investment, ecosystem collaboration, talent acquisition, and funding.
On the billionaire front, metals and mining remain a lucrative—albeit volatile—business. The world’s richest investors play long games, with Warren Buffett notably favoring silver over gold due to its industrial and medical applications. As always, informed strategies separate winners from the rest.
In the next section, we’ll delve into the methodology used to identify the best metal stocks to buy, backed by billionaire insights and industry trends.
Is Teck Resources Limited (TECK) the Best Canadian Stock to Buy According to Billionaires?
A close up of an automated machine processing other Industrial Metals & Mining resources.
Our Methodology
We used Insider Monkey’s exclusive database of billionaire stock holdings to arrive at our list of best metal stocks to buy according to billionaires. We selected the 10 best stocks to buy based on the highest number of billionaire investors, updated as of Q4 2024. For the stocks with the same number of billionaire holdings, we have used the total dollar value of billionaire holdings as a secondary metric to rank the stocks. Billionaires are founders or managers of some of the world’s leading hedge funds and companies.
Why are we interested in the stocks that hedge funds pile into? The reason is simple: our research has shown that we can outperform the market by imitating the top stock picks of the best hedge funds. Our quarterly newsletter’s strategy selects 14 small-cap and large-cap stocks every quarter and has returned 373.4% since May 2014, beating its benchmark by 218 percentage points (see more details here).
Teck Resources Limited (NYSE:TECK)
Number of Billionaires: 16
Teck Resources Limited (NYSE:TECK) is a leading Canadian resource company specializing in the exploration, development, and production of essential minerals. The company’s primary products include copper and zinc.
In recent years, Teck Resources Limited (NYSE:TECK) has strategically shifted its focus toward metals integral to the global energy transition. This pivot was underscored by the sale of its steelmaking coal business to a Glencore-led consortium for $9 billion, allowing the company to concentrate on expanding its copper and zinc operations.
In Q4 2024, the company reported a 19% year-over-year increase in copper output, totaling 122,100 tonnes, with 60,700 tonnes from the Quebrada Blanca mine in Chile. This surge contributed to an adjusted profit of C$0.45 per share, surpassing analysts’ expectations. Teck forecasts copper production to rise to between 490,000 and 565,000 tonnes in 2025.
In response to recent U.S. tariffs on Canadian imports, Teck Resources Limited (NYSE:TECK) is exploring alternative markets for its zinc products. The company is considering redirecting sales to Asia to mitigate the impact of a 25% tariff imposed by the U.S. administration.
Teck Resources (NYSE:TECK) has strong analyst support, with 77% of 22 analysts rating it a Buy. The stock has an average target price, suggesting a 36.19% upside potential. Additionally, institutional investors hold 77.46% of the company’s shares, reflecting strong confidence in its long-term growth.
The company’s strategic realignment and focus on critical minerals position it well to capitalize on the increasing demand for resources vital to the global energy transition as a best metal stock to invest in.
Overall, TECK ranks first on our list of the best metal stocks to buy according to billionaires. While we acknowledge the potential for TECK as an investment, our conviction lies in the belief that some AI stocks hold greater promise for delivering higher returns and doing so within a shorter time frame. If you are looking for an AI stock that is more promising than TECK but that trades at less than 5 times its earnings, check out our report about the cheapest AI stock.
READ NEXT: 20 Best AI Stocks To Buy Now and 30 Best Stocks to Buy Now According to Billionaires.
Disclosure: None. This article is originally published at Insider Monkey.
Caterpillar Inc. CAT has entered into a partnership with Luminar Technologies, Inc. LAZR to integrate its LiDAR technology into the former’s next-generation autonomous solution. This collaboration marks a significant step in the evolution of industrial automation. It will bring Luminar’s cutting-edge technology that will aid in obstacle detection and navigation as well as increase the efficiency of Caterpillar’s autonomous trucks.
CAT & Luminar Tie Up Takes LiDAR Beyond Automotive
LiDAR (Light Detection and Ranging) is a remote sensing method that uses light in the form of a pulsed laser and continuously scans the environment in front of a vehicle. It enables an accurate and high-precision estimate of the shape and size of objects in three-dimensional understanding of the surroundings. It is gaining popularity as a crucial technology for the safe and efficient operation of autonomous machines.
Luminar’s LiDAR technology is the world’s first and only high-performing LiDAR technology to be included as standard on a global production vehicle, such as Volvo’s VLVLY Volvo EX90. Earlier this month, Volvo Cars unveiled the second vehicle in its line-up to feature Luminar technology, the Volvo ES90.
Luminar estimates that if all cars on the road today were integrated with its LiDAR hardware and vehicle software, up to 70% of collisions could be avoided and 90% of fatalities could be reduced.
The Luminar LiDAR technology will currently be introduced with Cat Command for hauling, and initially targeted for quarry and aggregate operations. The Cat off-highway truck will feature two Iris LiDARs with a unique integration system designed exclusively for Caterpillar. Luminar’s agreement with Caterpillar marks its foray into other markets beyond automotive. It also represents a significant technological expansion from automotive applications to heavy industrial equipment. Luminar's LiDAR, which was originally designed for passenger vehicles, is being repurposed for much larger industrial machines that operate in harsh quarry and aggregate environments. These present more technical challenges than roads, including dust, vibration and varied terrain. This calls for substantial engineering collaboration between Luminar and Caterpillar to ensure the technology performs per expectations in these challenging settings.
Caterpillar’s Leadership in Autonomous Solutions
Caterpillar has invested in autonomy and automation for more than three decades and is considered an industry leader in autonomy. Its autonomous trucks have covered more than 334 million kilometers across three continents and moved more than 9.3 billion tons of material.
The addition of Luminar’s LiDAR technology will further enhance the capabilities of Caterpillar’s autonomous systems. By enhancing autonomous capabilities and integrating innovative solutions, CAT is not only strengthening its competitive edge but also helping customers shift to safer, more efficient and environmentally sustainable operations.
For instance, diesel is a major source of operational GHG emissions for miners. To achieve their sustainability targets, as well as to increase productivity, reduce cost and improve frontline safety, miners are increasingly relying on Caterpillar as their partner.
BHP Group BHP was the first customer to announce its plans to trial Caterpillar’s ground-breaking Cat Dynamic Energy Transfer at its mining site. This cutting-edge solution is engineered to transfer energy to large mining trucks (both diesel-electric and battery-electric) while they operate on site.
Also, to replace diesel, BHP has been working with Caterpillar since 2021 to support the development of battery-electric trucks. In 2024, BHP agreed to trial large battery-powered haul trucks manufactured by Caterpillar.
Want the latest recommendations from Zacks Investment Research? Today, you can download 7 Best Stocks for the Next 30 Days. Click to get this free report
Caterpillar Inc. (CAT) : Free Stock Analysis Report
BHP Group Limited Sponsored ADR (BHP) : Free Stock Analysis Report
AB Volvo (VLVLY) : Free Stock Analysis Report
Luminar Technologies, Inc. (LAZR) : Free Stock Analysis Report
This article originally published on Zacks Investment Research (zacks.com).
VANCOUVER, BC, March 31, 2025 /CNW/ – Rokmaster Resources Corp. (TSXV: RKR) (OTCQB: RKMSF) (FSE: 1RR1) ("Rokmaster" or "the Company") is pleased to announce the signing of a binding letter of intent ("LOI") for the option to acquire 100% of the Hanson Property.
The Property is located in west-central British Columbia within the prolific Stikine Terrane. The Property totals 5,349 hectares and is accessed from extensive logging roads approximately 20 km north of the past producing Endako Mine. The Hanson Property joins the Mystery and Fox-Coconut Properties in Rokmaster's Nechako Project, where Rokmaster is developing several enticing exploration targets for significant porphyry Cu-Mo-Au mineralization in a favourable district (Figure 1).
The Property has been subject to multiple exploration programs since 1965 involving AMAX Exploration, Canadian Exploration Limited (Placer Dome), Cazador Explorations, and Stone Ridge Exploration among others. The previous work has so far work generated three principal targets on the Property (Figure 2):
Buckley Zone: A large and strong Mo soil anomaly was generated in 1973 and tested with five shallow drillholes totalling only 471 m in 1977-1978. Very little work has been completed on this target since the late 1970's. A ZTEM survey completed in 2012 shows a magnetic low embayment in the mapped Early Cretaceous Hanson Lake phase of the Endako Batholith underlying this target.
Wilson Zone: A Mo-Cu soil anomaly was developed in 1972 and a coincident chargeability anomaly was found in 1973. Only two shallow drillholes totalling 100 m were completed in 1977. Later surface work by Stone Ridge and Tundra Exploration collected multiple anomalous rock samples with results up to 1.37% Mo, 1.79% Cu, and 0.10 g/t Au. The 2012 ZTEM survey shows a concentric magnetic low coincident with the soil and IP anomaly over the Wilson zone which straddles the contact between the Hanson Lake phase and older gneissic quartz diorites.
Cyr Zone: Work completed in the late 1980's and early 1990's developed the Cyr Zone with a series of trenches, pits, and drillholes. The Cyr zone is described to be underlain by a quartz porphyry unit with strong clay alteration and disseminated pyrite. Previous sampling returned high levels of silver, lead, and zinc particularly in silicified zones.
John Mirko, President and CEO, comments:
"The Hanson Property is a tremendous addition to our Nechako Project which is an outstanding region, both geologically and operationally. The Stikine Terrane hosts many large mineral deposits related to multiple mineralizing events, making it a great place to explore for more. There are numerous past and recently producing operations in the vicinity of the Nechako Project Properties. Active logging operations provide easy access for efficient exploration programs. Our team is excited to build upon the positive results generated on the Hanson Property from past programs and leverage modern exploration tools to develop new targets for substantial Cu-Mo-Au mineralization."
To earn a 100% interest in the Property: Rokmaster or its assigns would agree to pay a total cash consideration of CDN $210,000 to an arms length vendor according to the following schedule:
$15,000 upon 5 business days of execution of a Definitive Option Agreement.
$25,000 ($40,000 total) on or before April1st, 2026;
$30,000 ($70,000 total) on or before April1st, 2027;
$60,000 ($130,000 total) on or before April1st, 2028;
$80,000 ($210,000 total) on or before April 1rst, 2029
Rokmaster or its assigns will commit to making a total paid-up exploration expenditure on the Property of CDN $30,000 on or before July 30th, 2025. Further, on or before any of the subsequent anniversary dates for the claims that make up the Property, Rokmaster or its assigns will record sufficient paid-up exploration expenditures to keep the claims in good standing for a period of at least one year from each anniversary date, according to the following share payment schedule:
Rokmaster or its assigns would agree to issue 3,600,000 common shares according to the following schedule:
500,000 shares upon execution of a Definitive Option Agreement and all regulatory approvals;
500,000 shares (1,000,000 total) on or before April1st, 2026;
600,000 shares (1,600,000 total) on or before April1st, 2027;
1,000,000 shares (2,600,000 total) on or before April1st, 2028;
1,000,000 shares (3,600,000 total) on or before April1st, 2029;
In addition, a 1.5% NSR will be granted on all areas of the Property, one half of which (0.75%) can be purchased by Rokmaster for $750,000.
The technical information in this news release has been prepared in accordance with Canadian regulatory requirements as set out in National Instrument 43-101 and reviewed and approved by Eric Titley, P.Geo., who is independent of Rokmaster and who acts as Rokmaster's Qualified Person.
On Behalf of the Board of Directors of
Rokmaster Resources Corp.
John Mirko,President & Chief Executive Officer.
Neither TSX Venture Exchange nor its Regulation Services Provider (as that term in defined in the policies of the TSX Venture Exchange) accepts responsibility for the adequacy or accuracy of this press release.
CAUTIONARY NOTE REGARDING FORWARD LOOKING STATEMENTS: This news release may contain forward-looking information within the meaning of applicable securities laws ("forward-looking statements"). Forward-looking statements are statements that are not historical facts and are generally, but not always, identified by the words "expects," "plans," "anticipates," "believes," "intends," "estimates," 'projects," "potential" and similar expressions, or that events or conditions "will," "would," "may," "could" or "should" occur. These forward-looking statements are subject to a variety of risks and uncertainties which could cause actual events or results to differ materially from those reflected in the forward-looking statements, including, without limitation: risks related to fluctuations in metal prices; uncertainties related to raising sufficient financing to fund the planned work in a timely manner and on acceptable terms; changes in planned work resulting from weather, logistical, technical or other factors; the possibility that results of work will not fulfill expectations and realize the perceived potential of the Company's properties; risk of accidents, equipment breakdowns and labour disputes or other unanticipated difficulties or interruptions; the possibility of cost overruns or unanticipated expenses in the work program; the risk of environmental contamination or damage resulting from Rokmaster's operations and other risks and uncertainties. Any forward-looking statement speaks only as of the date it is made and, except as may be required by applicable securities laws, the Company disclaims any intent or obligation to update any forward-looking statement, whether as a result of new information, future vents or results or otherwise.
Hanson Property (CNW Group/Rokmaster Resources Corp.)Rokmaster Resources Corp. logo (CNW Group/Rokmaster Resources Corp.)
SOURCE Rokmaster Resources Corp.
Cision
View original content to download multimedia: http://www.newswire.ca/en/releases/archive/March2025/31/c9523.html
(Bloomberg) — A fragile ceasefire in the Black Sea brings hope for a boost in global shipments of wheat from Europe’s breadbasket. The US is set to release its latest corn plantings report, signaling future output for the world’s largest exporter of the grain. And energy traders across the world are hot for US liquefied natural gas.
Most Read from Bloomberg
-
Bank Regulators Fight for Desks as OCC Returns to New York Tower
-
These US Bridges Face High Risk of Catastrophic Ship Strikes
-
Charter Schools, Colleges Push Muni Debt Distress Near Record
Here are five notable charts to consider in global commodity markets as the week gets underway.
Wheat
The US-brokered ceasefire between Russia and Ukraine in the Black Sea stands to lift global shipments of wheat and other agricultural goods from the countries. Russia is on track to be the world’s top wheat exporter for an eighth season. And, despite attacks on vessels and infrastructure in the port of Odesa, Ukraine’s grain loads are close to pre-war levels. The deal has the potential to make transporting goods cheaper by reducing insurance costs for vessels.
Corn
American farmers are expected to plant the most corn acres in five years, potentially boosting supplies in the world’s biggest producer and exporter. The US Department of Agriculture releases its annual spring planting outlook Monday, as well as a quarterly grain stockpiles report. Roughly a third of the US corn crop is used for domestic ethanol production, and farmers are expected to turn to a surer bet of corn as US President Donald Trump’s proposed reciprocal tariffs may hit export demand for crops.
Copper
Chile’s state-owned Codelco has held its status as the world’s biggest copper producer by a slim margin after reporting 2024 output just above Australia’s BHP Group. Codelco posted total full-year production of 1.44 million metric tons last year, which includes its share from mines it doesn’t operate. That compared with BHP’s attributable production of 1.43 million tons, according to Bloomberg Intelligence estimates. Codelco has been playing catch-up after decades of underinvestment, with a push to finish projects key to tapping richer areas of its aging mines. BHP has also embarked on a $10.8 billion plan to overhaul old operations in Chile, where it oversees the world’s largest copper mine, Escondida.
LNG
The US is set to expand export capacity of liquefied natural gas by 60% in the next few years, according to BloombergNEF, and international traders are taking notice. Asia-originated trading of benchmark US natural gas has more than doubled over the past year. The US market has also seen increases originating from Europe, the Middle East and Africa. The surge underscores the growing importance of LNG for global energy supplies.
Oil
Venezuela is boosting oil exports to China to the highest in almost two years as the Trump administration deploys sanctions and secondary tariffs. Shipments are set to rise to the highest since June 2023, according to preliminary data from shipping reports and vessel movements tracked by Bloomberg. China, the world’s biggest oil importer, has historically been a top purchaser of deeply discounted barrels from sanctioned nations, including Venezuela, Iran and Russia.
–With assistance from Elizabeth Elkin and Lucia Kassai.
Most Read from Bloomberg Businessweek
©2025 Bloomberg L.P.
(Bloomberg) — Codelco has retained its status as the world’s biggest copper producer by the slimmest of margins after reporting 2024 output that nudged past that of BHP Group.
Most Read from Bloomberg
-
Bank Regulators Fight for Desks as OCC Returns to New York Tower
-
These US Bridges Face High Risk of Catastrophic Ship Strikes
-
Charter Schools, Colleges Push Muni Debt Distress Near Record
Codelco posted total full-year production of 1.44 million metric tons, which includes its share of copper from mines it doesn’t operate, according to a Friday presentation. That compares with BHP’s attributable production of 1.43 million tons, according to Bloomberg Intelligence estimates based on the Melbourne-based firm’s reported fiscal-year numbers. BHP’s own calculation was slightly lower.
Codelco posted a slight increase from the quarter-century low it registered in 2023, thanks in part to its purchase of a 10% stake in a giant mine operated by Teck Resources Ltd.
Chief Executive Officer Ruben Alvarado has shaken up management and is pushing to finish late and over-budget projects that are key to tapping richer areas of its aging mines after decades of underinvestment. The state firm expects its own mines to churn out between 1.37 and 1.4 million tons this year, up from 1.33 million last year.
BHP, which last year benefited from higher production at Escondida, the world’s largest copper mine, is also embarking on a $10.8 billion investment program to overhaul aging operations in Chile. BHP’s initiatives would see the company produce at an average annual rate of about 1.4 million tons next decade in Chile. Without the investments, that output would drop to about 900,000 tons.
Most Read from Bloomberg Businessweek
©2025 Bloomberg L.P.
Taking full advantage of the stock market and investing with confidence are common goals for new and old investors alike.
Achieving those goals is made easier with the Zacks Style Scores, a unique set of guidelines that rates stocks based on popular investing methodologies, namely value, growth, and momentum. The Style Scores can help you narrow down which stocks are better for your portfolio and which ones can beat the market over the long-term.
Is This 1 Momentum Stock a Screaming Buy Right Now?
For momentum investors, upward or downward trends in a stock's price or earnings outlook take precedent, so they'll want to zero in on the Momentum Style Score. This Score can pinpoint good times to build a position in a stock, using factors like one-week price change and the monthly percentage change in earnings estimates.
Southern Copper (SCCO)
Phoenix, AZ-based Southern Copper Corporation engages in mining, exploring, smelting, and refining copper and other minerals. The company conducts exploration activities in Argentina, Chile, Ecuador, Mexico and Peru.
SCCO boasts a Momentum Style Score of A and VGM Score of B, and holds a Zacks Rank #3 (Hold) rating. Shares of Southern Copper has seen some interesting price action recently; the stock is down 2.4% over the past one week and up 7% over the past four weeks. And in the last one-year period, SCCO has lost 8.1%. As for the stock's trading volume, 1,811,117.25 shares on average were traded over the last 20 days.
Momentum investors also pay close attention to a company's earnings. For SCCO, two analysts revised their earnings estimate upwards in the last 60 days, and the Zacks Consensus Estimate has increased $0.08 to $4.63 per share for 2025. SCCO boasts an average earnings surprise of 7.9%.
SCCO should be on investors' short list because of its impressive earnings fundamentals, a good Zacks Rank, and strong Momentum and VGM Style Scores.
Want the latest recommendations from Zacks Investment Research? Today, you can download 7 Best Stocks for the Next 30 Days. Click to get this free report
Southern Copper Corporation (SCCO) : Free Stock Analysis Report
This article originally published on Zacks Investment Research (zacks.com).
It doesn't matter your age or experience: taking full advantage of the stock market and investing with confidence are common goals for all investors.
Achieving those goals is made easier with the Zacks Style Scores, a unique set of guidelines that rates stocks based on popular investing methodologies, namely value, growth, and momentum. The Style Scores can help you narrow down which stocks are better for your portfolio and which ones can beat the market over the long-term.
Why This 1 Growth Stock Should Be On Your Watchlist
Different than value or momentum investors, growth-oriented investors are concerned with a stock's future prospects, and the overall financial health and strength of a company. Thus, they'll want to focus on the Growth Style Score, which analyzes characteristics like projected and historical earnings, sales, and cash flow to find stocks that will see sustainable growth over time.
Southern Copper (SCCO)
Phoenix, AZ-based Southern Copper Corporation engages in mining, exploring, smelting, and refining copper and other minerals. The company conducts exploration activities in Argentina, Chile, Ecuador, Mexico and Peru.
SCCO boasts a Growth Style Score of B and VGM Score of B, and holds a Zacks Rank #3 (Hold) rating. Its bottom-line is projected to rise 6.9% year-over-year for 2025, while Wall Street anticipates its top line to improve by 2.3%.
Two analysts revised their earnings estimate higher in the last 60 days for fiscal 2025, while the Zacks Consensus Estimate has increased $0.08 to $4.63 per share. SCCO also boasts an average earnings surprise of 7.9%.
Looking at cash flow, Southern Copper is expected to report cash flow growth of 29.6% this year; SCCO has generated cash flow growth of 13.4% over the past three to five years.
SCCO should be on investors' short lists because of its impressive growth fundamentals, a good Zacks Rank, and strong Growth and VGM Style Scores.
Want the latest recommendations from Zacks Investment Research? Today, you can download 7 Best Stocks for the Next 30 Days. Click to get this free report
Southern Copper Corporation (SCCO) : Free Stock Analysis Report
This article originally published on Zacks Investment Research (zacks.com).
If you would like to receive our free newsletter via email, simply enter your email address below & click subscribe.
 Follow us on Twitter
 Become our facebook fan
CONNECT WITH US
Tweets
Tweet with hash tag #miningfeeds or @miningfeeds and your tweets will be displayed across this site.
MOST ACTIVE MINING STOCKS
Daily Gainers
 CMC Metals Ltd. CMC Metals Ltd. |
CMB.V | +900.00% |
 Eden Energy Ltd Eden Energy Ltd |
EDE.AX | +200.00% |
| GoviEx Uranium Inc. |
GXU.V | +42.86% |
| Eagle Nickel Ltd. |
ENL.AX | +41.67% |
| Citigold Corp. Limited |
CTO.AX | +33.33% |
| Mount Burgess Mining NL |
MTB.AX | +33.33% |
| Exalt Resources Limited |
ERD.AX | +31.94% |
| Casa Minerals Inc. |
CASA.V | +30.00% |
| Cariboo Rose Resources Ltd |
CRB.V | +28.57% |
| Belmont Resources Inc. |
BEA.V | +28.57% |