VANCOUVER, British Columbia, June 22, 2026 (GLOBE NEWSWIRE) — Teck Resources Limited (TSX: TECK.A and TECK.B, NYSE: TECK) (“Teck”) today announced the appointment of Edwin Shadeo as Acting Vice President, Investor Relations and Treasurer, effective immediately. Mr. Shadeo succeeds Emma Chapman, who is leaving Teck to pursue new professional opportunities.
“As Treasurer, Edwin has developed extensive relationships within the capital markets community, building on his deep understanding of our business. This, combined with his long-standing experience in investor relations, equips him well to lead our engagement with shareholders,” said President and CEO Jonathan Price. “I would also like to thank Emma for her leadership and outstanding contributions to Teck during her time as Vice President, Investor Relations.”
Mr. Shadeo joined Teck in 2005 as Strategic Analyst, Business Development, Coal, and has held progressively more senior and leadership roles in Investor Relations, Corporate Development, the Office of the President and CEO, and Treasury.
Mr. Shadeo holds a Bachelor of Commerce from the University of British Columbia, as well as the Chartered Alternative Investment Analyst (CAIA) and Certified Treasury Professional (CTP) designations.
About TeckTeck is a leading Canadian resource company focused on responsibly providing metals essential to economic development and the energy transition. Teck has a portfolio of world-class copper and zinc operations across North and South America and an industry-leading copper growth pipeline. We are focused on creating value by advancing responsible growth and ensuring resilience built on a foundation of stakeholder trust. Headquartered in Vancouver, Canada, Teck’s shares are listed on the Toronto Stock Exchange under the symbols TECK.A and TECK.B and the New York Stock Exchange under the symbol TECK. Learn more about Teck at www.teck.com or follow @TeckResources.
Investor Contact:Edwin ShadeoActing Vice President, Investor Relations604.699.4531edwin.shadeo@teck.com
Media Contact:Dale SteevesDirector, External Communications236.987.7405 dale.steeves@teck.com
Vancouver, British Columbia–(Newsfile Corp. – June 22, 2026) – Kay Copper Corporation (formerly Railtown II Capital Corp), currently an unlisted reporting issuer, is pleased to provide an update on the proposed transaction announced on April 29, 2026 (the "Transaction") with Teck Resources Limited (collectively with its subsidiary Teck American Incorporated, "Teck") and Kodiak Copper Corp. ("Kodiak").
Under the Transaction, Kodiak would vend its 100% owned Mohave project ("Mohave") and Teck would vend its 100% owned Copper Hill project ("Copper Hill"), both located in Arizona, into a subsidiary of Kay Copper to create a new US-focused copper exploration company that would apply to list its shares on the TSX Venture Exchange ("TSXV"). The Transaction is subject to ongoing negotiations, the execution of definitive agreements, due diligence, consents and regulatory approval, approval of the TSXV and the completion of the Newco Concurrent Financing (as defined below). There is no guarantee that the Transaction will be completed.
Transaction Progress
- The Transaction is advancing as planned and is expected to close in the third quarter of 2026;
- A new private company has been incorporated ("NewCo") for the purposes of the Transaction;
- NewCo has completed a non-brokered initial financing at $0.10 per share for gross proceeds of $830,000 (the "NewCo Initial Financing") to a broad group of investors, which is intended to support the distribution requirement for a listing on the TSXV;
- Mark Osterberg will join Kay Copper as Vice President, Exploration on closing of the Transaction. Other management and board appointments are being finalized and will be announced in due course; and
- The drafting of definitive agreements, due diligence and NewCo Concurrent Financing (as defined below) are under way in preparation for the application to list on the TSXV.
Management Appointment – VP Exploration
Further to the previously announced management and board appointments (see news release of April 29, 2026), Mark Osterberg has been named VP Exploration of Kay Copper. Mark is an exploration geologist with decades of base and precious metals mining experience, with a strong focus on porphyry copper deposits. He earned a PhD from the University of Arizona and spent the first half of his career working for Gold Fields Mining Corporation, Cyprus Mining Company, and BHP focused primarily on porphyry deposit exploration including Bagdad, Robinson, and Ok Tedi. Since 2001, he has worked as the founding principal for Mine Mappers, LLC, a geological consulting firm specializing in resource discovery and delineation, working for both major and junior mining and exploration companies.
Transaction Overview
The Transaction is anticipated to include the following steps:
- NewCo would acquire Mohave and Copper Hill from Kodiak and Teck respectively and issue to each of Kodiak and Teck 20 million common shares at a deemed price of $0.25 per share as consideration for Mohave and Copper Hill, respectively. The $0.25 share price is a deemed price for transaction purposes only and does not represent a valuation;
- NewCo would complete a three-cornered amalgamation with Kay Copper (the "Amalgamation"), whereby Newco would merge with a newly formed subsidiary of Kay Copper and the holders of shares of Newco would receive one share of Kay Copper for each Newco share held;
- Concurrently with the Amalgamation, Kay Copper would apply to list its shares for trading on the TSXV under the name of Kay Copper Corp; and
- Completion of the Transaction is subject to customary closing conditions including the completion of due diligence by each of Kodiak, Teck and Kay Copper, negotiating and executing definitive agreements, obtaining all necessary consents and regulatory approvals, TSXV acceptance and satisfaction of applicable listing requirements, the completion of the NewCo Concurrent Financing (as defined below) and other conditions.
Further details regarding the Transaction will be provided as the process continues to advance.
There can be no assurance that the Transaction or NewCo Concurrent Financing (as defined below) will be completed as proposed, or at all.
NewCo Concurrent Financing
In connection with the Transaction, NewCo intends to complete a subscription receipt financing at $0.25 per share for minimum gross proceeds of C$4.0 million (the "NewCo Concurrent Financing").
- Proceeds are intended to fund exploration work programs to materially advance both projects in 2026.
- Gross proceeds would be held in escrow and released concurrently with closing of the Transaction and upon satisfaction of specified escrow release conditions, including completion of the asset acquisitions, Amalgamation, and TSXV conditional approval, and all requisite corporate and regulatory approvals.
- If escrow release conditions are not satisfied, subscription receipt holders would be entitled to a return of funds in accordance with the terms of the subscription receipts.
See previous news release dated April 29th, 2026 for additional details concerning the proposed Transaction.
On behalf of the Board of DirectorsKay Copper Corp.
Cameron WhiteDirector
For further information, contact:Cameron White, Directorcam@caliber.vc+1 (604) 765-2601
Neither TSX Venture Exchange nor its Regulation Services Provider (as that term is defined in the policies of the TSX Venture Exchange) accepts responsibility for the adequacy or accuracy of this release.
Forward-Looking Statement (Safe Harbor Statement): This press release contains forward-looking statements within the meaning of applicable securities laws. The use of any of the words "anticipate", "plan", "can", "could", "continue", "expect", "estimate", "objective", "may", "will", "would", "project", "shall", "should", "predict", "potential" and similar expressions are intended to identify forward-looking statements. In particular, this press release contains forward-looking statements concerning: the proposed creation of a new U.S.-focused copper exploration company expected to list on the TSXV; Kodiak vending Mohave to NewCo; Teck vending Copper Hill to NewCo; that NewCo will be positioned for meaningful growth; completion of the NewCo Concurrent Financing; completion of the Amalgamation; the successful negotiation and execution of a definitive agreement; the receipt of consents or regulatory approvals, including potential TSXV approval; the closing of the Transaction in the third quarter of 2026, or at all; the closing of the NewCo Concurrent Financing; that Mark Osterberg will join Kay Copper as Vice-President Exploration on closing of the Transaction; and the future investor rights of Teck and Kodiak and future offtake rights of Teck regarding NewCo. Although Kay Copper believes that the expectations and assumptions on which the forward-looking statements are based are reasonable, undue reliance should not be placed on the forward-looking statements because Kay Copper cannot give any assurance that they will occur or prove to be correct. Since forward-looking statements address future events and conditions, they involve inherent assumptions, risks and uncertainties. Actual results could differ materially from those currently anticipated due to a number of assumptions, factors and risks. These assumptions and risks include, but are not limited to, assumptions and risks associated with: the ability of the parties to execute their business objectives related to the Transaction; the ability of the parties to negotiate and execute definitive agreements; the parties expectations regarding future results from Mohave and Copper Hill; the ability to obtain necessary capital for the NewCo Concurrent Financing; conditions in the equity financing markets; receipt of regulatory and shareholder approvals; the impact of increasing competition; the regulatory framework regarding royalties, taxes and environmental matters; the ability to achieve potential synergies and unlock value from the Transaction; and the nature of the proposed business of NewCo, including the exploration and production of natural resources.
Management has provided the above summary of risks and assumptions related to forward-looking statements in this press release in order to provide readers with a more comprehensive perspective on Kay Copper's future operations. Kay Copper's actual results, performance or achievement could differ materially from those expressed in, or implied by, these forward-looking statements and, accordingly, no assurance can be given that any of the events anticipated by the forward-looking statements will transpire or occur, or if any of them do so, what benefits Kay Copper will derive from them. These forward-looking statements are made as of the date of this press release, and, other than as required by applicable securities laws, Kay Copper disclaims any intent or obligation to update publicly any forward-looking statements, whether as a result of new information, future events or results or otherwise.
THIS NEWS RELEASE IS NOT FOR DISTRIBUTION TO U.S. NEWSWIRE SERVICES OR FOR DISSEMINATION IN THE UNITED STATES
To view the source version of this press release, please visit https://www.newsfilecorp.com/release/302265
Kodiak Copper [TSXV:KDK] is moving closer to unlocking the value of its Arizona assets through the creation of a dedicated US-focused copper exploration company, as the proposed transaction with Teck Resources continues to advance towards an expected third-quarter completion.
n
The Canadian explorer said key milestones had been achieved in the formation of Kay Copper, the new company that is intended to combine Kodiak’s Mohave project with Teck’s Copper Hill project in Arizona, creating a focused vehicle positioned to capitalise on growing demand for copper in North America.
n
The transaction comes at a time when copper has become increasingly central to global industrial policy. Demand for the metal is expected to rise sharply over the coming decade, driven by electrification, renewable energy infrastructure, artificial intelligence-related power demand and grid modernisation.
n
Against that backdrop, investors have shown renewed interest in exploration companies with exposure to prospective projects in mining-friendly jurisdictions.
n
- Kodiak Copper advances Arizona spin-out with Teck
- Kodiak Copper and Teck Resources in project merger plan
- Kodiak Copper expands Arizona footprint
nMark Osterberg to join Kay Coppern
Kodiak chief executive Claudia Tornquist said the transaction remained on track and represented the best route to maximise the value of the company’s non-core Arizona assets.
n
“I am pleased to report that the previously announced transaction to create Kay Copper, a US-focused copper exploration company, is progressing well and important milestones have been achieved,” she said.
n
Among the latest developments is the completion of an initial financing by NewCo, the private company established to facilitate the transaction. The financing raised C$830,000 from a broad group of investors and is intended to support the shareholder distribution requirements associated with a future TSX Venture Exchange listing.
n
The project has also secured a key addition to its technical leadership team. Veteran exploration geologist Mark Osterberg has agreed to join Kay Copper as vice-president of exploration following completion of the transaction. Based in Arizona, he will oversee exploration programmes at both Mohave and Copper Hill.
n
Osterberg brings decades of experience in porphyry copper systems, including work with major mining groups such as BHP, Cyprus Mining and Gold Fields. His career has included involvement in exploration programmes at several well-known copper deposits, including Bagdad, Robinson and Ok Tedi.
n
His appointment is being viewed as an important step in building the management team required to advance the combined asset portfolio.
nWhat the Kodiak-Teck transaction looks liken
The proposed transaction would see Kodiak and Teck each contribute their respective Arizona projects into the new company in exchange for substantial equity stakes. Following completion of the deal and a planned concurrent financing, both companies are expected to own approximately 28 per cent of Kay Copper.
n
The structure provides strong alignment between the parties and ensures continued support from two experienced industry participants as the new company advances exploration.
n
Attention is now turning towards a planned C$4m financing, the proceeds of which are expected to fund exploration programmes aimed at materially advancing both projects during 2026. The funds will be held in escrow until the transaction closes and all regulatory and listing requirements have been satisfied.
n
For Kodiak, the transaction reflects a broader strategy of creating value through focused asset development while maintaining exposure to upside. The company will retain a significant ownership stake in Kay Copper, allowing shareholders to benefit from any exploration success while Kodiak continues to advance its flagship MPD copper-gold project in British Columbia.
n
As global competition for future copper supply intensifies, the emergence of a dedicated Arizona-focused explorer backed by both Kodiak and Teck is attracting increasing attention. While the transaction remains subject to final agreements and regulatory approvals, the progress achieved so far suggests momentum is building behind a venture designed to tap into one of mining’s most compelling long-term themes.
nn
n
Get free weekly UK company analysis from The Armchair Trader here
Vancouver, British Columbia–(Newsfile Corp. – June 22, 2026) – Kodiak Copper Corp. (TSXV: KDK) (OTCQX: KDKCF) (FSE: 5DD1) (the "Company" or "Kodiak") is pleased to provide an update on the proposed transaction announced on April 29, 2026 (the "Transaction", see news release here) with Teck Resources Limited (collectively with its subsidiary Teck American Incorporated, "Teck") and Kay Copper Corp. ("Kay Copper", formerly Railtown II Capital Corporation), currently an unlisted reporting issuer.
Under the Transaction Kodiak would vend its 100% owned Mohave project ("Mohave") and Teck would vend its 100% owned Copper Hill project ("Copper Hill"), both located in Arizona, into a subsidiary of Kay Copper to create a new US-focused copper exploration company that would apply to list its shares on the TSX Venture Exchange ("TSXV"). The Transaction is subject to ongoing negotiations, the execution of definitive agreements, due diligence, consents and regulatory approval, approval of the TSXV and the completion of the NewCo Concurrent Financing (as defined below). There is no guarantee that the Transaction will be completed.
Transaction Progress
- The Transaction is advancing as planned and is expected to close in the third quarter of 2026;
- A new private company has been incorporated ("NewCo") for the purposes of the Transaction;
- NewCo has completed a non-brokered initial financing at $0.10 per share for gross proceeds of $830,000 (the "NewCo Initial Financing") to a broad group of investors, which is intended to support the distribution requirement for a listing on the TSXV;
- Mark Osterberg will join Kay Copper as Vice President, Exploration on closing of the Transaction. Other management and board appointments are being finalized and will be announced in due course; and
- The drafting of definitive agreements, due diligence and NewCo Concurrent Financing (as defined below) are under way in preparation for the application to list on the TSXV.
Claudia Tornquist, President and CEO of Kodiak said, "I am pleased to report that the previously announced transaction to create Kay Copper, a US-focused copper exploration company, is progressing well and important milestones have been achieved, particularly the closing of the NewCo Initial Financing. Mark Osterberg, an accomplished geologist with extensive copper porphyry experience, has agreed to join Kay Copper as VP Exploration, based in Arizona, and lead the Company's exploration programs at the Mohave and Copper Hill projects. This is a key appointment for the Company, and we are glad to have found such an excellent candidate to strengthen our technical leadership team. I have no doubt that this transaction represents the best path to unlock the value of Kodiak's non-core Mohave project and will generate compelling returns for our shareholders."
Management Appointment – VP Exploration
Further to the previously announced management and board appointments (see news release of April 29, 2026), Mark Osterberg has been named VP Exploration of Kay Copper. Mark is an exploration geologist with decades of base and precious metals mining experience, with a strong focus on porphyry copper deposits. He earned a PhD from the University of Arizona and spent the first half of his career working for Gold Fields Mining Corporation, Cyprus Mining Company, and BHP focused primarily on porphyry deposit exploration including Bagdad, Robinson, and Ok Tedi. Since 2001, he has worked as the founding principal for Mine Mappers, LLC, a geological consulting firm specializing in resource discovery and delineation, working for both major and junior mining and exploration companies.
Transaction Overview
The Transaction is anticipated to include the following steps:
- NewCo would acquire Mohave and Copper Hill from Kodiak and Teck respectively and issue to each of Kodiak and Teck 20 million common shares at a deemed price of $0.25 per share as consideration for Mohave and Copper Hill, respectively. The $0.25 share price is a deemed price for transaction purposes only and does not represent a valuation;
- NewCo would complete a three-cornered amalgamation with Kay Copper (the "Amalgamation"), whereby Newco would merge with a newly formed subsidiary of Kay Copper and the holders of shares of Newco would receive one share of Kay Copper for each Newco share held;
- Concurrently with the Amalgamation, Kay Copper would apply to list its shares for trading on the TSXV under the name of Kay Copper Corp; and
- Completion of the Transaction is subject to customary closing conditions including the completion of due diligence by each of Kodiak, Teck and Kay Copper, negotiating and executing definitive agreements, obtaining all necessary consents and regulatory approvals, TSXV acceptance and satisfaction of applicable listing requirements, the completion of the NewCo Concurrent Financing (as defined below) and other conditions.
Further details regarding the Transaction will be provided as the process continues to advance.
There can be no assurance that the Transaction or NewCo Concurrent Financing (as defined below) will be completed as proposed, or at all.
NewCo Concurrent Financing
In connection with the Transaction, NewCo intends to complete a subscription receipt financing at $0.25 per share for minimum gross proceeds of C$4.0 million (the "NewCo Concurrent Financing").
- Proceeds are intended to fund exploration work programs to materially advance both projects in 2026.
- Gross proceeds would be held in escrow and released concurrently with closing of the Transaction and upon satisfaction of specified escrow release conditions, including completion of the asset acquisitions, Amalgamation, and TSXV conditional approval, and all requisite corporate and regulatory approvals.
- If escrow release conditions are not satisfied, subscription receipt holders would be entitled to a return of funds in accordance with the terms of the subscription receipts.
Expected Capital Structure of Kay Copper
Following completion of the Transaction and the NewCo Concurrent Financing, Kay Copper is expected to have approximately 70,300,000 common shares outstanding, on an undiluted basis, with ownership expected to be held approximately as follows:
- Kodiak: 28%
- Teck: 28%
- Kay Copper existing shareholders: 9%
- NewCo Initial Financing subscribers: 12%
- NewCo Concurrent Financing subscribers: 23%
Final capitalization will be determined upon negotiation and execution of definitive agreements and the NewCo Concurrent Financing.
Additional Terms
- In addition to receiving common shares of Kay Copper, each of Teck and Kodiak are expected to enter into separate Investor Rights Agreements with Kay Copper.
- Teck is expected to be granted offtake rights with respect to certain concentrate production from the Mohave and Copper Hill projects, subject to definitive documentation.
On behalf of the Board of DirectorsKodiak Copper Corp.
Claudia TornquistPresident & CEO
For further information contact:Nancy Curry, VP Corporate Developmentncurry@kodiakcoppercorp.com+1 (604) 646-8362
About Kodiak Copper
Kodiak is focused on advancing its 100%-owned MPD copper-gold porphyry project in the prolific Quesnel Terrane in south-central British Columbia, Canada, an established mining region with producing mines and existing infrastructure. MPD exhibits all the hallmarks of a large, multi-centered porphyry district with the potential for future economic development. The initial Mineral Resource Estimate, published in 2025, outlines seven substantial deposits and underscores the scale and potential of the project. All known deposits remain open to expansion, and numerous targets across the property have yet to be tested. Kodiak continues to systematically explore MPD's district-scale potential with the goal of delivering new discoveries and building further critical mass toward being the region's next mine.
Kodiak's founder and Chairman, Chris Taylor, is well-known for his gold discovery success with Great Bear Resources. Kodiak is also part of Discovery GroupTM led by John Robins, one of the most successful mining entrepreneurs in Canada.
Neither TSX Venture Exchange nor its Regulation Services Provider (as that term is defined in the policies of the TSX Venture Exchange) accepts responsibility for the adequacy or accuracy of this release.
Forward-Looking Statement (Safe Harbor Statement): This press release contains forward-looking statements within the meaning of applicable securities laws. The use of any of the words "anticipate", "plan", "can", "could", "continue", "expect", "estimate", "objective", "may", "will", "would", "project", "shall", "should", "predict", "potential" and similar expressions are intended to identify forward-looking statements. In particular, this press release contains forward-looking statements concerning: the proposed creation of a new U.S.-focused copper exploration company expected to list on the TSXV; Kodiak vending Mohave to NewCo; Teck vending Copper Hill to NewCo; that NewCo will unlock value of Kodiak's non-core Mohave project and will generate compelling returns for its shareholders; that NewCo will be positioned for meaningful growth; completion of the NewCo Concurrent Financing; completion of the Amalgamation; the successful negotiation and execution of a definitive agreement; the receipt of consents or regulatory approvals, including potential TSXV approval; the closing of the Transaction in the third quarter of 2026, or at all; the closing of the NewCo Concurrent Financing; that Mark Osterberg will join Kay Copper as Vice-President Exploration on closing of the Transaction; and the future investor rights of Teck and Kodiak and future offtake rights of Teck regarding NewCo. Although the Company believes that the expectations and assumptions on which the forward-looking statements are based are reasonable, undue reliance should not be placed on the forward-looking statements because the Company cannot give any assurance that they will occur or prove to be correct. Since forward-looking statements address future events and conditions, they involve inherent assumptions, risks and uncertainties. Actual results could differ materially from those currently anticipated due to a number of assumptions, factors and risks. These assumptions and risks include, but are not limited to, assumptions and risks associated with: the ability of the parties to execute their business objectives related to the Transaction; the ability of the parties to negotiate and execute definitive agreements; the parties expectations regarding future results from Mohave and Copper Hill; the ability to obtain necessary capital for the NewCo Concurrent Financing; conditions in the equity financing markets; receipt of regulatory and shareholder approvals; the impact of increasing competition; the regulatory framework regarding royalties, taxes and environmental matters; the ability to achieve potential synergies and unlock value from the Transaction; and the nature of the proposed business of NewCo, including the exploration and production of natural resources.
Management has provided the above summary of risks and assumptions related to forward-looking statements in this press release in order to provide readers with a more comprehensive perspective on the Company's future operations. The Company's actual results, performance or achievement could differ materially from those expressed in, or implied by, these forward-looking statements and, accordingly, no assurance can be given that any of the events anticipated by the forward-looking statements will transpire or occur, or if any of them do so, what benefits the Company will derive from them. These forward-looking statements are made as of the date of this press release, and, other than as required by applicable securities laws, the Company disclaims any intent or obligation to update publicly any forward-looking statements, whether as a result of new information, future events or results or otherwise.
THIS NEWS RELEASE IS NOT FOR DISTRIBUTION TO U.S. NEWSWIRE SERVICES OR FOR DISSEMINATION IN THE UNITED STATES
To view the source version of this press release, please visit https://www.newsfilecorp.com/release/302249
Find winning stocks in any market cycle. Join 7 million investors using Simply Wall St’s investing ideas for FREE.
BHP Group (ASX:BHP) continues to attract attention after recent share price moves, with the stock up about 7% over the past month and about 29% over the past 3 months.
See our latest analysis for BHP Group.
The recent move has come after a strong run over 3 months, but the 1-day and 7-day share price returns are both down. This suggests some of that momentum may be cooling even as the 1-year total shareholder return of 76.63% highlights how rewarding the stock has been for investors over a longer period.
If you are looking beyond BHP Group in the resources space, this could be a useful moment to scan other copper focused opportunities through the 8 top copper producer stocks.
With BHP Group posting a 76.63% total return over the past year and trading around A$61.40, investors now face a key question: is there still value on the table, or is the market already pricing in future growth?
Most Popular Narrative: 49.5% Undervalued
According to the most followed narrative for BHP Group, a fair value of A$121.48 sits well above the recent A$61.40 share price, raising questions about how much of the company’s scale and profitability is currently reflected in the market.
BHP Group is one of the world’s largest mining companies, producing key commodities such as iron ore, copper, and metallurgical coal that are essential for global infrastructure, steel production, and the energy transition. In FY2024, BHP reported revenue of approximately US$55.7 billion and underlying attributable profit of US$13.7 billion, highlighting the company’s strong profitability and scale in global resource markets.
Want to see what underpins such a big gap between narrative value and price? The core assumptions rest on large scale output, resilient margins and long term demand for copper and iron ore. Curious how those inputs combine into that A$121.48 figure and what kind of earnings profile they imply over time?
Result: Fair Value of A$121.48 (UNDERVALUED)
Have a read of the narrative in full and understand what’s behind the forecasts.
However, BHP Group’s narrative could be tested if global steel demand weakens and iron ore prices soften, or if copper intensive projects are delayed or scaled back.
Find out about the key risks to this BHP Group narrative.
Another View on BHP Group Using Market Ratios
While the user narrative points to BHP Group as 49.5% undervalued at A$121.48 per share, the market’s own yardstick tells a different story. At a P/E of 21.4x, BHP trades well above the Australian Metals and Mining industry at 11.9x and above its fair ratio of 20.3x, which suggests less of a bargain and more valuation risk if earnings do not keep pace.
Compared with a peer average P/E of 30.2x, BHP does not look stretched across its wider peer set. However, the premium to its industry and to that 20.3x fair ratio invites a simple question for investors: is this pricing a quality premium you are comfortable paying at A$61.40?
See what the numbers say about this price — find out in our valuation breakdown.
ASX:BHP P/E Ratio as at Jun 2026
Next Steps
If the mix of optimism and caution around BHP Group has you weighing both sides, act quickly to review the numbers and risk indicators for yourself with the 1 key reward and 1 important warning sign.
Looking for more investment ideas beyond BHP Group?
If you are reassessing BHP Group, do not stop there. Use this moment to broaden your watchlist with fresh ideas that match your risk and income goals.
- Spot potential turnaround stories early by reviewing the 58 elite penny stocks with strong financials that already show stronger financial foundations than many investors expect.
- Zero in on quality at a price by scanning the 8 high quality undervalued stocks that combine solid cash flows with more conservative market expectations.
- Strengthen the core of your portfolio by assessing the solid balance sheet and fundamentals stocks screener (19 results) before other investors crowd into the same resilient stocks.
This article by Simply Wall St is general in nature. We provide commentary based on historical datan and analyst forecasts only using an unbiased methodology and our articles are not intended to be financial advice. It does not constitute a recommendation to buy or sell any stock, and does not take account of your objectives, or yourn financial situation. We aim to bring you long-term focused analysis driven by fundamental data.n Note that our analysis may not factor in the latest price-sensitive company announcements or qualitative material.n Simply Wall St has no position in any stocks mentioned.
Companies discussed in this article include BHP.AX.
Have feedback on this article? Concerned about the content? Get in touch with us directly. Alternatively, email editorial-team@simplywallst.com
Canadian National Railway Co (NYSE:CNI) is one of the best long-term stocks to invest in according to Bill & Melinda Gates Foundation Trust. Canadian National Railway shares have gone up more than 20% over the past six months.
n matthew siddons / Shutterstock.comn
Canadian National Railway Co (NYSE:CNI) has landed a deal to provide rail services to mining giant BHP, according to a June 4 press release. Canadian National Railway will transport potash from BHP’s Jansen mine in Saskatchewan to ports in Vancouver for export to the global markets.
n
In this arrangement, Canadian National Railway will operate unit trains between the mine and the export terminals using BHP-owned railcars. The initial contract will run for around four years and is focused on the Jansen Stage 1 production. The railroad operator may have a role in the next phases of the project. The Jansen mine is expected to begin production in mid-2027.
n
BHP said the rail transport deal with Canadian National Railway strengthens the reliability of its supply chain. It also said this arrangement ensures it’s well-positioned to deliver potash from Saskatchewan to global customers. Canadian National Railway said the Jansen project is a significant opportunity for Canada’s export industry.
n
Canadian National Railway Co (NYSE:CNI) is a freight rail company headquartered in Quebec, Canada. Its nearly 20,000-mile rail network serves Canada and the US, facilitating the movement of everything from resource materials and factory inputs to finished goods.
n
n
While we acknowledge the potential of CNI as an investment, we believe certain AI stocks offer greater upside potential and carry less downside risk. If you're looking for an extremely undervalued AI stock that also stands to benefit significantly from Trump-era tariffs and the onshoring trend, see our free report on the best short-term AI stock.
n
n
n
READ NEXT: Billionaire Ken Fisher’s Top 12 High-Growth Stock Picks and 12 Best Tech Stocks to Invest In on the Dip.
n
Disclosure: None. Follow Insider Monkey on Google News.
This article first appeared on GuruFocus.
BHP Group (NYSE:BHP) will record a $2.3 billion writedown on its giant Jansen potash mine after another cost and timeline reset at the Canadian project. The latest review showed phase two will now cost $6.9 billion, up from the previous $4.9 billion estimate, adding fresh pressure to a project that has already tested investor patience.
- Warning! GuruFocus has detected 8 Warning Signs with BHP.
- Is BHP fairly valued? Test your thesis with our free DCF calculator.
The world's largest miner moved ahead with Jansen's expansion in 2023, before phase one had even started production, as fertilizer prices surged after Russia's invasion of Ukraine. Since then, potash prices have fallen, while costs across both phases have continued to rise, making the project more controversial among some investors.
BHP approved construction of the Saskatchewan mine in 2021 after years of debate over its large price tag. Phase one is expected to begin production next year, while phase two is now expected to start producing toward the end of 2031. BHP still views Jansen as a long-life potash business that could potentially operate for a century and scale toward the size of its flagship Australian iron ore operations.
This article first appeared on GuruFocus.
BHP Group (NYSE:BHP) shares fell sharply after the miner flagged a $2.3 billion write-down on its Jansen potash mine in Canada, driven by higher costs and delays tied to the project's expansion. The move marked BHP's biggest one-day share decline in 14 months, adding fresh pressure on a project that has already faced investor scrutiny over its scale, spending, and long development timeline.
- Warning! GuruFocus has detected 8 Warning Signs with BHP.
- Is BHP fairly valued? Test your thesis with our free DCF calculator.
The company said phase two of Jansen will now cost $6.9 billion, up from an earlier estimate of $4.9 billion, with production expected toward the end of 2031. BHP shares closed 5.6% lower in Sydney on Friday, while its UK-listed shares fell 4.4% in London on Thursday. Barclays analysts estimate BHP has spent $20.3 billion on the project so far, with $4.1 billion now impaired.
Barclays analysts including Amos Fletcher said expected internal rates of return have declined, and now estimate total returns of 7.1% across the first two development stages. BHP does not expect total capital expenditure to rise for the 2027 fiscal year, though it did not provide estimates for later years. First production from phase one is still expected next year, while the mine could possibly become a century-long business that BHP believes may eventually rival its Australian iron ore operations in scale.
USA Rare Earth, Inc. USAR and Teck Resources Limited TECK are key participants in the Zacks Mining – Miscellaneous industry. Both companies are engaged in the extraction, processing and development of minerals that are essential to modern technologies and industrial applications. USAR and TECK are well-positioned to benefit from the growing demand for critical materials used in electrification, clean energy technologies and advanced manufacturing.Both companies operate in capital-intensive mining industries that require extensive investments in infrastructure, advanced technologies and project development, while also navigating regulatory clearances and regulatory approval processes. At the same time, growing demand for minerals and metals critical to electric vehicles, renewable energy and other clean-energy technologies is creating favorable long-term growth opportunities for these companies.
The Case for USAR
USA Rare Earth has commissioned its hydrometallurgical demonstration facility in Wheat Ridge, CO, in June 2026, marking a key step in building an integrated rare earth supply chain outside China. The company expects to begin producing commercial-quality separated rare earth oxides, including NdPr, dysprosium and terbium, in the third quarter of 2026.The facility will process material from multiple sources, including the Round Top facility, third-party feedstocks and recycled magnet swarf, while supporting feasibility studies and future commercial-scale operations.Also, the successful commissioning of Phase 1a of USAR’s commercial magnet production line at its Stillwater, OK, facility marks an important milestone in USAR’s growth strategy. The development enables the company to begin supplying sintered NdFeB permanent magnets to customers starting in the second quarter of 2026.The commissioning demonstrates USA Rare Earth’s capability to operate a complex rare earth magnet manufacturing process at a commercial scale. At its Stillwater facility, USAR transforms rare earth materials into high-performance NdFeB permanent magnets through a series of production steps used in end markets such as defense, aerospace and automotive.The Phase 1a is expected to achieve an annual production run rate of 600 metric tons by the end of 2026, while the planned Phase 1b expansion is projected to double total capacity to 1,200 metric tons annually by the first quarter of 2027. Once fully operational, the Stillwater facility is expected to be among the first large-scale NdFeB magnet manufacturing facilities in the United States, supporting a more resilient domestic rare earth supply chain.USAR has strengthened its growth strategy through a combination of financing and acquisitions. In June 2026, the company secured access to up to $1.6 billion in government-backed funding under the CHIPS Program from the U.S. Department of Commerce. The package includes up to $277 million in federal funding and up to $1.3 billion in loan support as the company advances key development milestones.In May 2026, USA Rare Earth secured a $14.2 million grant from the Texas Semiconductor Innovation Fund to boost the development of its Round Top Mountain rare earth project in West Texas, aimed at supporting domestic supply chains for critical minerals used in defense, semiconductors, AI and advanced technologies.Also, in March 2026, USAR agreed to acquire Texas Mineral Resources Corp. in an all-stock transaction valued at approximately $73 million, giving it full ownership of the Round Top Project. The company expects commercial production at Round Top to begin in 2028, with a long-term goal of processing nearly 40,000 metric tons of rare earth and critical mineral feedstock per day by 2030. The November 2025 acquisition of Less Common Metals is expected to provide critical metal and alloy feedstock for the Stillwater plant.While USAR is making progress with its growth initiatives, it is still in the early stages of commercialization and continues to report losses as it scales its operations. While the acquisition of Less Common Metals has started contributing to revenues, profitability remains under pressure from higher operating expenses associated with expansion efforts, acquisitions and workforce additions.In the first quarter of 2026, selling, general and administrative expenses surged to $21.2 million from $7 million in the prior-year period, driven by higher legal, consulting and personnel-related costs. Research and development expenses also rose to $14.2 million from $1.7 million a year ago, reflecting increased investment in product development and growth initiatives.
The Case for TECK
As part of its long-term growth strategy, Teck Resources is increasing its focus on copper and other critical minerals that are essential for electrification and clean energy technologies. The company has agreed to merge with Anglo American plc to form the Anglo Teck group, creating one of the world's largest copper-focused mining companies. It will have more than 70% exposure to copper and is set to be among the top five global copper producers. The new company will consist of six world-class copper assets and premium iron ore and zinc operations with a combined annual copper production of 1.2 million tons. It is projected to grow 10% to 1.35 million tons by 2027, strengthening its position in the global copper market.Teck Resources is further strengthening its copper growth pipeline by advancing several development projects toward sanction readiness. The company is progressing with permitting activities, securing land access and refining the business cases for its Zafranal and San Nicolás projects.Zafranal is expected to have a mine life of 19 years and produce copper-gold concentrates through open-pit mining and conventional processing. The project is anticipated to generate an average of 126,000 tons of contained copper annually during its first five years of operation. Meanwhile, the San Nicolás project is advancing through the feasibility study stage and is expected to produce approximately 63,000 tons of copper and 147,000 tons of zinc annually during its first five years, on a 100% ownership basis.Also, the Highland Valley Mine Life Extension is expected to extend the mine’s life from 2028 to 2046. Expected average annual copper production will likely be 132,000 tons over the life of the mine. The company expects to increase copper production to around 800,000 tons before the end of this decade.However, the company’s zinc in concentrate production declined to 120 thousand tons in the first quarter of 2026 from 137 thousand tons a year earlier, reflecting lower grades at Red Dog in line with the mine plan. TECK expects zinc production to trend lower over the next three years as the mine approaches the end of its life. Full-year 2026 zinc production guidance is 410-460 thousand tons compared with 565 thousand tons produced in 2025.Operating costs at several assets increased year over year due to higher contractor, energy and maintenance expenses. The company highlighted exposure to fuel price volatility and higher freight and explosives costs linked to geopolitical developments. Even though there is currently no significant risk of fuel supply disruption, the company expects an impact on costs at its Chilean operations due to the requirement for diesel imports.
How Does the Zacks Consensus Estimate Compare for USAR & TECK?
The Zacks Consensus Estimate for USAR’s 2026 bottom line is pegged at a loss of 35 cents per share. Also, the company’s consensus estimate for the 2027 bottom line is pegged at a loss of 32 cents per share.
Image Source: Zacks Investment Research
The Zacks Consensus Estimate for TECK’s 2026 bottom line is pegged at $3.35 per share. Also, the company’s consensus estimate for 2027 bottom line is pegged at $2.89 per share.
Image Source: Zacks Investment Research
Price Performance and Valuation of USAR & TECK
In the past year, USAR’s shares have surged 103%, while TECK stock has gained 71.9%.
Image Source: Zacks Investment Research
USA Rare Earth is trading at a forward 12-month price-to-earnings ratio of negative 73.33X while Teck Resources’ forward earnings multiple sits at 21.39X.
Image Source: Zacks Investment Research
Final Take
USAR is benefiting from the ramp-up of its commercial magnet production line, along with strategic acquisitions and investments designed to build a fully integrated domestic rare earth supply chain. The acquisitions of Less Common Metals and Texas Mineral Resources are expected to enhance the company’s operational capabilities and support its long-term growth strategy. However, USAR remains in the early stages of commercialization and continues to incur losses as it invests in capacity expansion, technology development and other growth initiatives.In contrast, Teck Resources’ strong performance in the coming quarters is supported by its scale of operation, asset diversity and strategic transformation. The planned merger with Anglo American will create a global copper and critical minerals leader, with more than 70% exposure to copper. Though near-term zinc in concentrate production at Red Dog has been impacted by operational issues, TECK’s long-life assets and growth projects are expected to lower execution risk.Given these factors, TECK seems a better pick for investors than USAR currently. While TECK Materials carries a Zacks Rank #3 (Hold) at present, USA Rare Earth has a Zacks Rank #4 (Sell).You can see the complete list of today’s Zacks #1 Rank (Strong Buy) stocks here.
Want the latest recommendations from Zacks Investment Research? Today, you can download 7 Best Stocks for the Next 30 Days. Click to get this free report
Teck Resources Ltd (TECK) : Free Stock Analysis Report
USA Rare Earth Inc. (USAR) : Free Stock Analysis Report
This article originally published on Zacks Investment Research (zacks.com).
Teck Resources Limited (NYSE:TECK) is one of the best copper stocks to buy for the AI and electrification boom. The company’s freshest relevant angle is tied to the planned Anglo-Teck merger. On May 18, 2026, Reuters reported that Anglo American agreed to sell its Australian steelmaking coal assets for up to $3.88 billion, a move aimed at simplifying the company and reducing debt ahead of its planned combination with Teck. The sale keeps investor attention on Anglo American’s portfolio reset before the merger closes.
n
For Teck investors, the update matters because the proposed combination would make copper the center of the future company’s investment case. Teck and Anglo American have said the combined Anglo Teck would become a top-five global copper producer and is expected to offer investors more than 70% exposure to copper. That gives Teck a cleaner link to electrification, grid expansion, and AI-related power demand, even without a direct data-center customer angle.
nn
Teck Resources Limited (NYSE:TECK) is a Vancouver-based resource company with copper and zinc operations across North and South America and a copper growth pipeline.
n
n
While we acknowledge the potential of TECK as an investment, we believe certain AI stocks offer greater upside potential and carry less downside risk. If you're looking for an extremely undervalued AI stock that also stands to benefit significantly from Trump-era tariffs and the onshoring trend, see our free report on the best short-term AI stock.
n
n
n
READ NEXT: 33 Stocks That Should Double in 3 Years and Cathie Wood 2026 Portfolio: 10 Best Stocks to Buy.
n
Disclosure: None. Follow Insider Monkey on Google News.
Toronto, Ontario–(Newsfile Corp. – June 17, 2026) – Honey Badger Silver Inc. (TSXV: TUF) (OTCQB: HBEIF) (FSE: 1QA) (Tradegate: 1QA) ("Honey Badger" or the "Company") is pleased to announce the appointment of Tom Chep. PEng., as Innovation Advisor.
"Tom brings a rare combination of advanced engineering expertise, entrepreneurial vision, and real-world experience developing and commercializing transformative technologies," said Chad Williams, Executive Chairman of Honey Badger Silver. "We are extremely fortunate to have Tom on our team. He will evaluate many new technologies, such as the latest drone, robotic, AI, and energy generation/storage technologies, to ensure that the PC Silver Mine re-starts production as quickly, efficiently, and as ecologically sound as possible. Tom's experience includes a strong partnership with an Indigenous technology group, considering Indigenous Knowledge in emerging technologies, and looks forward to working in partnership with Honey Badger Silver's Indigenous partners who will benefit from the PC Silver Mine's re-start."
Mr. Chep is an accomplished technology entrepreneur, engineer, and product development leader with extensive experience in advanced energy systems, infrastructure development, electrification, and complex technical project execution. He is the founder of Arc Motor Company Inc., where he has led the development of modular vehicle platforms, integrated energy systems, and scalable charging and power infrastructure solutions.
Throughout his career, Mr. Chep has worked across electrified transportation systems, industrial technologies, energy infrastructure, critical infrastructure projects, and large-scale construction environments. His expertise spans systems engineering, infrastructure integration, commercialization strategy, product development, and the deployment of advanced technologies from concept through commercial scale.
Mr. Chep holds a degree in Electrical Engineering and is a licensed Professional Engineer (P.Eng.).
"I am excited to join Honey Badger Silver at such a pivotal stage in the Company's growth," said Mr. Chep. "The PC Silver Mine is one of the most compelling undeveloped silver assets in North America and represents a unique opportunity to apply innovative technologies to enhance future operations. I look forward to working with the team to evaluate solutions that can improve project performance, strengthen sustainability, and help position Honey Badger Silver as a modern, technology-enabled mining company."
As Honey Badger Silver re-starts the PC Silver Mine, Mr. Chep will focus on identifying opportunities across electrification, energy infrastructure, automation, advanced mining technologies, remote operations, and innovative transportation and logistics solutions. His mandate will include evaluating emerging technologies that could reduce capital requirements, lower operating costs, improve reliability, and strengthen the long-term sustainability of the Company's operations.
About Honey Badger Silver (TSXV: TUF) (OTCQB: HBEIF) (FSE: 1QA) (Tradegate: 1QA)
Silver is rare and valuable. Honey Badger Silver controls some of Canada's richest untapped silver potential. With the acquisition of the fully permitted, high-grade PC Silver Mine, the Company has become a leading North American silver and critical minerals company.
Backed by an impressive portfolio of 8 high-quality silver mineral projects in Canada, including the Sunrise Lake, Plata, and Nanisivik properties, Honey Badger Silver controls district-scale land positions in some of the most metal-rich jurisdictions on the continent.
What sets Honey Badger Silver apart is its strategic blend of real silver ownership and growth leverage: the Company holds 10,000 ounces of physical silver yielding 12% annually, reinforcing tangible asset value while advancing aggressive exploration and acquisition plans.
Led by a proven team of mine-builders and capital markets professionals, Honey Badger Silver is building a cash-generating, asset-backed platform for the bull cycle in precious and critical minerals.
More information is available at www.honeybadgersilver.com.
Chad WilliamsExecutive Chairman, Interim CEO
Investor Relationsinvestors@honeybadgersilver.com | +1 (647) 226-7315
Neither the TSX Venture Exchange nor its Regulation Services Provider (as that term is defined in the policies of the TSX Venture Exchange) accepts responsibility for the adequacy or accuracy of this release.
Cautionary Note Regarding Forward-Looking Information
This news release contains "forward-looking information" within the meaning of the applicable Canadian securities legislation that is based on expectations, estimates, projections and interpretations as at the date of this news release, including without limitation, the potential for Tom Chep to reduce costs and improve the PC Silver Mine. Any statement that involves discussions with respect to predictions, expectations, interpretations, beliefs, plans, projections, objectives, assumptions, future events or performance (often but not always using phrases such as "expects", or "does not expect", "is expected", "interpreted", "management's view", "anticipates" or "does not anticipate", "plans", "budget", "scheduled", "forecasts", "estimates", "believes" or "intends" or variations of such words and phrases or stating that certain actions, events or results "may" or "could", "would", "might" or "will" be taken to occur or be achieved) are not statements of historical fact and may be forward-looking information and are intended to identify forward-looking information. This forward-looking information is based on reasonable assumptions and estimates of management of the Company at the time such assumptions and estimates were made, and involves known and unknown risks, uncertainties and other factors which may cause the actual results, performance or achievements of Honey Badger to be materially different from any future results, performance or achievements expressed or implied by such forward-looking information.
Such factors include, but are not limited to, risks relating to capital and operating costs varying significantly from estimates; delays in obtaining or failures to obtain required governmental, environmental or other project approvals; uncertainties relating to the availability and costs of financing needed in the future; changes in equity markets; inflation; fluctuations in commodity prices; delays in the development of projects; other risks involved in the mineral exploration and development industry; and those risks set out in the Company's public documents filed on SEDAR+ (www.sedarplus.ca) under Honey Badger's issuer profile. Although the Company believes that the assumptions and factors used in preparing the forward-looking information in this news release are reasonable, undue reliance should not be placed on such information, which only applies as of the date of this news release, and no assurance can be given that such events will occur in the disclosed timeframes or at all. The Company disclaims any intention or obligation to update or revise any forward-looking information, whether as a result of new information, future events or otherwise, other than as required by law.
To view the source version of this press release, please visit https://www.newsfilecorp.com/release/301839
Southern Copper (SCCO) ended the recent trading session at $193.22, demonstrating a +1.81% change from the preceding day's closing price. The stock's change was more than the S&P 500's daily gain of 1.65%. On the other hand, the Dow registered a gain of 0.92%, and the technology-centric Nasdaq increased by 3.07%.
Coming into today, shares of the miner had gained 7.36% in the past month. In that same time, the Basic Materials sector lost 4.3%, while the S&P 500 gained 0.48%.
Analysts and investors alike will be keeping a close eye on the performance of Southern Copper in its upcoming earnings disclosure. The company is forecasted to report an EPS of $1.85, showcasing a 51.64% upward movement from the corresponding quarter of the prior year. In the meantime, our current consensus estimate forecasts the revenue to be $4.23 billion, indicating a 38.73% growth compared to the corresponding quarter of the prior year.
Regarding the entire year, the Zacks Consensus Estimates forecast earnings of $7.25 per share and revenue of $16.54 billion, indicating changes of +38.36% and +23.22%, respectively, compared to the previous year.
Investors should also take note of any recent adjustments to analyst estimates for Southern Copper. These revisions typically reflect the latest short-term business trends, which can change frequently. As a result, we can interpret positive estimate revisions as a good sign for the business outlook.
Our research suggests that these changes in estimates have a direct relationship with upcoming stock price performance. To utilize this, we have created the Zacks Rank, a proprietary model that integrates these estimate changes and provides a functional rating system.
The Zacks Rank system, spanning from #1 (Strong Buy) to #5 (Strong Sell), boasts an impressive track record of outperformance, audited externally, with #1 ranked stocks yielding an average annual return of +25% since 1988. Over the past month, there's been a 4.05% rise in the Zacks Consensus EPS estimate. As of now, Southern Copper holds a Zacks Rank of #3 (Hold).
In terms of valuation, Southern Copper is presently being traded at a Forward P/E ratio of 26.17. This expresses a discount compared to the average Forward P/E of 26.42 of its industry.
It's also important to note that SCCO currently trades at a PEG ratio of 1.79. The PEG ratio bears resemblance to the frequently used P/E ratio, but this parameter also includes the company's expected earnings growth trajectory. Mining – Non Ferrous stocks are, on average, holding a PEG ratio of 1.55 based on yesterday's closing prices.
The Mining – Non Ferrous industry is part of the Basic Materials sector. This industry currently has a Zacks Industry Rank of 186, which puts it in the bottom 24% of all 250+ industries.
The Zacks Industry Rank gauges the strength of our industry groups by measuring the average Zacks Rank of the individual stocks within the groups. Our research shows that the top 50% rated industries outperform the bottom half by a factor of 2 to 1.
You can find more information on all of these metrics, and much more, on Zacks.com.
Want the latest recommendations from Zacks Investment Research? Today, you can download 7 Best Stocks for the Next 30 Days. Click to get this free report
Southern Copper Corporation (SCCO) : Free Stock Analysis Report
This article originally published on Zacks Investment Research (zacks.com).
How much a stock's price changes over time is important for most investors, since price performance can both impact your investment portfolio and help you compare investment results across sectors and industries.
FOMO, or the fear of missing out, also plays a role in investing, particularly with tech giants and popular consumer-facing stocks.
What if you'd invested in Teck Resources Ltd (TECK) ten years ago? It may not have been easy to hold on to TECK for all that time, but if you did, how much would your investment be worth today?
Teck Resources Ltd's Business In-Depth
With that in mind, let's take a look at Teck Resources Ltd's main business drivers.
Vancouver, Canada-based Teck Resources is committed to mining and mineral development with business units focused on copper and zinc. Teck is also a leading producer of lead and a significant producer of specialty metals such as germanium, indium and cadmium. It also produces gold dore and silver. Teck also produces industrial products and fertilizers, which are recovered from its zinc and lead smelting operations in Trail, B.C.
Teck Resources divested its Steelmaking Coal business or Elk Valley Resources (“EVR”) in July 2024. The company categorized it as discontinued operations and restated the revenue and EPS (in CAD) for all quarters of 2023 and for 2024.
Teck Resources is a significant copper producer in the Americas, with four operating mines in Canada, Chile and Peru, and development projects in North and South America. Its main projects are Highland Valley Copper in Canada and Antamina, Quebrada Blanca (QB) and Carmen de Andacollo in South America.
Teck Resources is one of the world's largest producers of mined zinc, with three operating mines in the United States and Peru, and it owns one of the world's largest fully integrated zinc and lead smelting and refining facilities located in Canada. Teck produces zinc concentrate from Red Dog Operations in Alaska. In addition to marketing its zinc concentrate around the world, the company’s concentrate team also purchases concentrate from other mines for processing at the Trail operations complex in British Columbia.In September 2025, Teck Resources entered the merger agreement with Anglo American to form the Anglo Teck group. The new company will boast an industry-leading portfolio, consisting of six world-class copper assets, and premium iron ore and zinc operations. The combined annual copper production of 1.2 million tons is projected to grow 10% to 1.35 million tons by 2027. The combined company will also be one of the world's largest zinc producers. Within four years of completion, the deal is expected to yield around $800 million in annual pre-tax synergies. It has been cleared by shareholders of both the companies.
Bottom Line
Anyone can invest, but building a successful investment portfolio requires research, patience, and a little bit of risk. So, if you had invested in Teck Resources Ltd, ten years ago, you're likely feeling pretty good about your investment today.
A $1000 investment made in June 2016 would be worth $5,687.72, or a 468.77% gain, as of June 15, 2026, according to our calculations. Investors should note that this return excludes dividends but includes price increases.
The S&P 500 rose 254.54% and the price of gold increased 214.85% over the same time frame in comparison.
Looking ahead, analysts are expecting more upside for TECK.
Teck delivered record copper sales and higher earnings in the first quarter of 2026, supported by elevated copper prices and improved performance at Quebrada Blanca and Trail. The balance sheet remains solid providing visibility on capital allocation. However, zinc production is set to decline as Red Dog matures, input cost volatility remains a risk and execution across large growth projects requires sustained discipline. The long-term prospects for copper remain positive, supported by the clean energy transition trend. Teck entered into a merger agreement with Anglo American plc to form the Anglo Teck group. The combined annual copper production of 1.2 million tons is projected to grow 10% to 1.35 million tons by 2027. Within four years of completion, the deal is expected to yield around $800 million in annual pre-tax synergies.
The stock has jumped 5.69% over the past four weeks. Additionally, no earnings estimate has gone lower in the past two months, compared to 14 higher, for fiscal 2026; the consensus estimate has moved up as well.
Want the latest recommendations from Zacks Investment Research? Today, you can download 7 Best Stocks for the Next 30 Days. Click to get this free report
Teck Resources Ltd (TECK) : Free Stock Analysis Report
This article originally published on Zacks Investment Research (zacks.com).
Drilling Confirms Continuity of Large-Scale Mineralized System & Delivers New Discovery
Toronto, Ontario–(Newsfile Corp. – June 15, 2026) – AbraSilver Resource Corp. (TSX: ABRA) (OTCQX: ABBRF) ("AbraSilver" or the "Company") is pleased to report assay results from the 2026 drill program at the La Coipita copper-gold-molybdenum project ("La Coipita" or the "Project") located in the San Juan Province of Argentina.
The drill program is fully funded and operated by a subsidiary of Teck Resources Limited ("Teck") under the terms of the earn-in and joint venture agreement, as per the Company's news release dated January 22, 2024.
The 2026 program comprised 5,248 metres ("m") of diamond drilling across seven holes (DDH-LC26-010 through DDH-LC26-016), designed to test the limits and vertical continuity of known mineralization at the Yaretas target and evaluate new targets generated by the first-ever magnetotelluric ("MT") geophysical survey completed across the property.
Key Highlights
- Hole DDH-LC26-010 returned the strongest drill intercept recorded to date at La Coipita: 747.5 m grading 0.69% Cu, 0.06 g/t Au and 142 ppm Mo, from 396 m to 1,143.5 m down-hole depth, confirming the presence of a robust and vertically extensive copper-gold-molybdenum system. Including:
- 108 m at 1.06% Cu, 0.10 g/t Au and 204 ppm Mo, from 396 to 504 m;
- 184 m at 0.78% Cu, 0.09 g/t Au and 123 ppm Mo, from 604 to 788 m
- Hole DDH-LC26-011 returned 250.6 m at 0.39% Cu, 0.07 g/t Au and 119 ppm Mo, from 550 to 800.6 m. This hole confirmed continuity of mineralization between previously reported holes DDHC-22-002 and DDH-LC25-006 (see Figures 1 and 2), further strengthening confidence in the scale and continuity of the Yaretas system.
- Hole DDH-LC26-012 resulted in a new, shallower discovery at the Yaretas Sur target, located approximately 1.9 km south of the main Yaretas drilling area (see Figures 1 and 3), intersecting multiple zones of copper-gold mineralization:
- 42 m at 1.03% Cu, 0.63 g/t Au and 41 g/t Ag, from 264 to 306 m, including 28 m at 1.45% Cu, 0.81 g/t Au and 45 g/t Ag
- Additional mineralized intervals that confirm a vertically extensive mineralized system at Yaretas Sur.
- The first-ever MT geophysical survey conducted during the 2026 season provides valuable new insights into the geometry of the mineral system and indicates potential extensions to the south, guiding target generation for future drill campaigns.
- Holes DDH-LC26-013 and DDH-LC26-015 intercepted indicative copper mineralization within the Yaretas zone, highlighting variability in the system; holes DDH-LC26-014 and DDH-LC26-016 were unable to reach planned target depths.
John Miniotis, President and CEO, commented, "The 2026 drill program delivered several important milestones at La Coipita. Most notably, hole DDH-LC26-010 returned the strongest intercept drilled on the property to date, while hole DDH-LC26-011 confirmed the continuity of mineralization across the core Yaretas system. Equally encouraging was the new, shallower discovery at Yaretas Sur, located nearly 2 km south of the main drilling area, which further demonstrates the district-scale potential of this project. We are pleased to have Teck, one of the world's leading mining companies, continuing to advance La Coipita, and we look forward to continued exploration success."
Stuart McCracken, Vice President, Exploration, Teck commented, "These results reinforce our commitment to responsible and sustainable exploration and our long-term interest in the geological potential of the region."
Table 1 – Summary of Key Drill Intercepts
Intercepts greater than 25%-metres copper shown in bolded text:
| Drill Hole | Area | From(m) | To(m) | Type | Interval (m) | Cu% | Au g/t | Moppm | Ag g/t |
| DDH-LC26-10 | Yaretas | 396.0 | 1,143.5 | – | 747.5 | 0.69 | 0.06 | 142 | 3 |
| Including | 396.0 | 504.0 | Secondary Enrichment | 108.0 | 1.06 | 0.10 | 204 | 6 | |
| Including | 604.0 | 788.0 | Hypogene & High Sulphidation ("HS") | 184.0 | 0.78 | 0.09 | 123 | 3 | |
| Including | 646.0 | 666.0 | Hypogene & HS | 20.0 | 1.05 | 0.13 | 147 | 4 | |
| Including | 724.0 | 742.0 | Hypogene & HS | 18.0 | 1.00 | 0.11 | 153 | 3 | |
| DDH-LC26-11 | Yaretas | 550.0 | 800.6 | – | 250.6 | 0.39 | 0.07 | 119 | 3 |
| including | 550.0 | 770.0 | HS | 220.0 | 0.42 | 0.08 | 127 | 3 | |
| DDH-LC26-12 | Yaretas Sur | 192.0 | 206.0 | HS | 14.0 | 0.67 | 0.28 | 1 | 6 |
| 264.0 | 306.0 | HS | 42.0 | 1.03 | 0.63 | 2 | 41 | ||
| including | 264.0 | 292.0 | HS | 28.0 | 1.45 | 0.81 | 2 | 45 | |
| 316.0 | 366.0 | HS | 50.0 | 0.29 | 0.12 | 1 | 4 | ||
| 398.0 | 464.0 | HS | 66.0 | 0.28 | 0.04 | 1 | 3 | ||
| 488.0 | 566.0 | HS | 78.0 | 0.39 | 0.24 | 1 | 4 | ||
| 584.0 | 604.0 | HS | 20.0 | 0.36 | 0.05 | 1 | 2 | ||
| 624.0 | 662.0 | HS | 38.0 | 0.28 | 0.02 | 1 | 3 |
Note: All results in this news release are rounded. Assays are uncut & undiluted. Widths are drilled widths, not true widths. True widths are unknown
La Coipita Project Overview
La Coipita is a district-scale property covering over 70,000 hectares in the western San Juan Province, adjacent to the Chilean border. Elevation across the property ranges between 3,500 and 4,500 MASL with moderate to high relief.
The property lies within the prolific Miocene porphyry-epithermal belt of Argentina and Chile, host to numerous world-class deposits, including Filo del Sol, Los Azules, El Indio, Veladero, Pascua Lama and El Pachon.
Since commencing the earn-in program in 2024, Teck has completed a total of 11,270 m of diamond drilling across 19 holes at La Coipita, representing approximately US$23 million in expenditures to date against the total earn-in commitment of US$20 million. In addition to Teck completing US$20 million in expenditures, certain cash payments defined in the earn-in and joint venture agreement remain to be completed by Teck. On completion of these obligations, it is anticipated the parties will form a Joint Venture (80% Teck, 20% AbraSilver).
The 2026 program successfully extended known mineralization at Yaretas, confirmed continuity between previously drilled areas and identified a new mineralized centre at Yaretas Sur. Together with the results of the MT survey, these findings support the potential for a large-scale mineralized system extending well beyond the currently drilled footprint.
The 2026 program, which included 5,248 metres of drilling and the first MT survey ever completed on the property, represents a significant step forward in defining the scale and geometry of the system as the project advances toward potential future Mineral Resource delineation.
Figure 1 – Plan Map – Drillhole Locations and Cu Results with MT-Resistivity Survey at 500 m Depth.
To view an enhanced version of this graphic, please visit:https://images.newsfilecorp.com/files/11792/301375_fd15b8c2a41daba3_001full.jpg
Figure 2 – A-A' Cross Section: Cu-Grade Results and MT-Resistivity
To view an enhanced version of this graphic, please visit:https://images.newsfilecorp.com/files/11792/301375_fd15b8c2a41daba3_002full.jpg
Figure 3 – B-B' Cross Section: Yaretas (left) and Yaretas Sur (right) Targets, Cu-Grade Results and MT-Resistivity
To view an enhanced version of this graphic, please visit:https://images.newsfilecorp.com/files/11792/301375_fd15b8c2a41daba3_003full.jpg
Collar Data
| Hole Number | UTM Coordinates | Elevation | Azimuth | Dip | Depth (m) | |
| DDH-LC26-10 | 383738 | 6615406 | 3937 | 340 | -70 | 1,143.5 |
| DDH-LC26-11 | 383408 | 6615329 | 4045 | 340 | -70 | 800.6 |
| DDH-LC26-12 | 384236 | 6613500 | 3870 | 340 | -70 | 794 |
| DDH-LC26-13 | 384027 | 6614707 | 3959 | 340 | -70 | 1,040 |
| DDH-LC26-14 | 383405 | 6615338 | 4044 | 160 | -70 | 639 |
| DDH-LC26-15 | 384026 | 6615398 | 3914 | 340 | -70 | 821 |
| DDH-LC26-16 | 383490 | 6615677 | 4025 | 340 | -70 | 9.7 |
Note: All results in this news release for La Coipita have been rounded. Assays are uncut and undiluted. Widths are drilled widths, not true widths. True widths cannot be determined due to the uncertain geometry of mineralization.
QA/QC and Core Sampling Protocols
Core samples were taken every 2m, sent to San Juan for cutting (where applicable), and submitted to ALS Labs for sample preparation and for four-acid digestion multi-element analysis with ICP-MS finish (method codes ME-MS61) and with AAS finish for overlimit of Cu, Pb, Ag, As, Zn, Mo (OG62), and for Au by fire assay with ICP-MS finish (Au-ICP21) and with gravimetry finish for overlimit (Au-GRA21). Steps taken to avoid copper loss from drill core of the supergene enrichment zone included: (1) drilling with triple tube core barrels; (2) sampling whole core in zones of supergene mineralization (retaining 15-20cm of representative skeleton core); (3) avoiding interaction with water or core saws; and (4) taking field duplicates with a hydraulic core splitter.
Qualified Persons
David O'Connor P.Geo., Chief Geologist for AbraSilver, is the Qualified Person as defined by National Instrument 43-101 Standards of Disclosure for Mineral Projects, and he has reviewed and approved the scientific and technical information in this news release.
About AbraSilver
AbraSilver is an advanced-stage exploration company focused on rapidly advancing its 100%-owned Diablillos silver-gold project in the mining-friendly Salta and Catamarca provinces of Argentina. The current Measured and Indicated Mineral Resource estimate for Diablillos (tank leach-only) consists of 102.0 Mt grading 65 g/t Ag and 0.62 g/t Au, containing approximately 213Moz of silver and 2.0Moz of gold, with significant further upside potential based on recent exploration drilling. The Company is led by an experienced management team and has long-term supportive shareholders. In addition, the Company has an earn-in option and joint venture agreement with Teck on the La Coipita project, located in the San Juan province of Argentina. AbraSilver is listed on the Toronto Stock Exchange under the symbol "ABRA" and in the U.S. on the OTCQX under the symbol "ABBRF."
The full Technical Report in respect of the updated MRE estimate is being prepared in accordance with NI 43-101 and will be available on SEDAR+ (www.sedarplus.ca) under the Company's issuer profile within 45 days from the news release dated May 06, 2026.
For further information please visit the AbraSilver Resource website at www.abrasilver.com, our LinkedIn page at AbraSilver Resource Corp., and follow us on X at www.x.com/abrasilver
Alternatively, please contact:
John Miniotis, President and CEOinfo@abrasilver.comTel: +1 416-306-8334
Cautionary Statements
This news release includes certain "forward-looking statements" under applicable Canadian securities legislation. Forward-looking statements are necessarily based upon a number of estimates and assumptions that, while considered reasonable, are subject to known and unknown risks, uncertainties, and other factors which may cause the actual results and future events to differ materially from those expressed or implied by such forward-looking statements. All statements that address future plans, activities, events or developments that the Company believes, expects or anticipates will or may occur are forward-looking information. There can be no assurance that such statements will prove to be accurate, as actual results and future events could differ materially from those anticipated in such statements. Accordingly, readers should not place undue reliance on forward-looking statements. When considering this forward-looking information, readers should keep in mind the risk factors and other cautionary statements in the Company's disclosure documents filed with the applicable Canadian securities regulatory authorities on SEDAR+ at www.sedarplus.ca. The risk factors and other factors noted in the disclosure documents could cause actual events or results to differ materially from those described in any forward-looking information. The Company disclaims any intention or obligation to update or revise any forward-looking statements, whether as a result of new information, future events or otherwise, except as required by law.
Neither the TSX nor its Regulation Services Provider (as that term is defined in the policies of the TSX) accepts responsibility for the adequacy or accuracy of this news release
To view the source version of this press release, please visit https://www.newsfilecorp.com/release/301375
MIAMI, June 10, 2026 (GLOBE NEWSWIRE) — EmergingGrowth.com a leading independent small cap media portal announces the schedule of the 93rd Emerging Growth Conference on June 10 & 11, 2026.
The Emerging Growth Conference identifies companies in a wide range of growth sectors, with strong management teams, innovative products & services, focused strategy, execution, and the overall potential for long-term growth.
Register for the Conference here.
Submit Questions for any of the presenting companies to: Questions@EmergingGrowth.com
For updates, follow us on Twitter
Presenting Today – Wednesday June 11, 2026
8:30Virtual Lobby opens.Register for the Conference. If you already registered, go back to the registration link and click “Already registered” and enter your email.
9:00Introduction
9:05 – 9:35Diagnos, Inc. (TSXV: ADK) (OTCQB: DGNOF)Keynote speaker: André Larente – President & CEO
9:40 – 10:10Aurbis Resources Corp. (CSE: AURR) (OTCQB: QNICF) Keynote speaker: Johan Lambrechts, Chief Executive Officer
10:15 – 10:45Nord Precious Metals Mining Inc. (TSXV: NTH) (OTCQB: CCWOF)Keynote speaker: Frank Basa, Chairman and CEO
10:50 – 11:20OneMeta Inc. (OTCQB: ONEI) Keynote speaker: Saul I. Leal Founder, CEO & Director
11:25 – 11:55Citizens, Inc. (NYSE: CIA) Keynote speakers: Jon Stenberg, President / CEO, and Jeff Conklin, CFO
12:00 – 12:30ZenaTech, Inc. (Nasdaq: ZENA) Keynote speaker: Linda Montgomery, Vice President, Corporate Development
12:35 – 1:05Jaguar Health, Inc. (NASDAQ: JAGX)Keynote speaker: Lisa A. Conte, Founder, CEO, President & Director
1:10 – 1:40U.S. Gold Corp. (NASDAQ: USAU)Keynote speaker: Luke Anthony Norman, Executive Chairman
1:45 – 2:15King Global Ventures, Inc. (OTCQB: KGLDF) (CSE: KING)Keynote speaker: Robert Michael Dzisiak, President / CEO
2:20 – 2:30Jupiter Neurosciences, Inc. (NASDAQ: JUNS)Keynote speaker: Christer Rosén, Chairman & CEO, and Alison Silva, COO and President
2:40 – 2:50Trillion Energy International Inc. (OTCQB: TRLEF) (CSE: TCF)Keynote speaker: Scott Lower, President
2:55 – 3:05Intrepid Metals Corp. (OTCQB: IMTCF) (TSXV: INTR)Keynote speaker: Matt Lennox-King, CEO
3:10 – 3:20African Discovery Group, Inc., now Copper Intelligence (OTCID: AFDG)Keynote speakers: Alan Kessler, Chairman / Director Copper Intelligence, Andrew Groves, Future Chairman Copper Intelligence & Aldo Cesano Director Copper Intelligence
3:25 – 3:35Highland Copper Company Inc. (OTCQB: HDRSF) (TSXV: HI)Keynote speaker: Barry O’Shea, CEO
3:40 – 3:50 Vista Gold Corp. (NYSE American: VGZ) (TSX: VGZ)Keynote speaker: Frederick Earnest, CEO
3:55 – 4:05Stakeholder Gold Corp. (OTCQB: SKHRF) (TSXV: SRC) Keynote speaker: Christopher James Berlet, President, CEO & Director
4:10 – 4:20Perpetuals.com Ltd (NASDAQ: PDC) Keynote Speaker: Patrick Gruhn, CEO
4:25 – 4:35 Imagion Biosystems Limited. (CXA: IBX) (ASX: IBX)Keynote speakers: Robert Romeo Proulx, Executive Chairman & Ward Detwiler, Chief Business Officer
4:40 – 4:50VisionWave Holdings, Inc. (NASDAQ: VWAV)Keynote speaker: Douglas Landers Davis, Executive Chairman & Interim CEO
Presenting Day 2 Tomorrow – Thursday June 11, 2026
8:30Virtual Lobby opens.Register for the Conference. If you already registered, go back to the registration link and click “Already registered” and enter your email.
9:00Introduction
9:05 – 9:35EpicQuest Education Group International Limited (NASDAQ: EEIQ)Keynote speaker: Zhenyu Wu, CFO
9:40 – 10:10SBC Medical Group Holdings, Inc. (NASDAQ: SBC)Keynote speakers: Stephen Rodgers, Head of Global Planning and Strategy & Hikaru Fukui, Head of Investor Relations
10:50 – 11:20First Phosphate Corp. (CSE: PHOS) (OTCQX: FRSPF)Keynote speaker: John Passalacqua, CEO
11:25 – 11:55Summit Royalties Ltd. (TSXV: SUM) (OTCQB: SUMMF) Keynote speaker: Drew Clark, Founder, President & CEO
12:00 – 12:30Lithium Ionic Corp. (TSXV: LTH) (OTCQB: LTHCF)Keynote speaker: Blake Hylands – CEO & Director
12:35 – 1:05Route1, Inc. (TSXV: ROI) (OTCQB: ROIUF) Keynote speaker: Tony Busseri, President / CEO
1:10 – 1:40Newton Golf Company, Inc., (NASDAQ: NWTG)Keynote speaker: Jeffery R. Clayborne, COO
1:45 – 2:15Nova Minerals Limited (NASDAQ: NVA) (ASX: NVA) Keynote speaker: Christopher Gerteisen – CEO & Executive Director
2:20 – 2:50Honey Badger Silver, Inc. (TSXV: TUF) (OTCQB: HBEIF) Keynote speaker: Chad Williams, Chairman and Interim CEO
2:55 – 3:05Unusual Machines, Inc. (NYSE American: UMAC)Keynote speaker: Brian Hoffman, CFO
3:10 – 3:20Signature Resources Ltd. (TSXV: SGU) (OTCQB: SGGTF)Keynote speaker: Dan Denbow, President, CEO & Director
3:25 – 3:35MetaVia Inc. (NASDAQ: MTVA) Keynote speakers: Hyung Heon “HH” Kim, President / CEO, & Marshall H. Woodworth, CFO
3:40 – 3:50Gensource Potash Corporation (TSXV: GSP) (OTC Pink: AGCCF) Keynote Speaker: Mike Ferguson, CEO
3:55 – 4:05Stallion Uranium Corp. (OTCQB: STLNF) (TSXV: STUD)Keynote speaker: Darren Slugoski, VP Exploration
4:10 – 4:20Generation Uranium, Inc. (TSXV: GEN) (OTCQB: GENRF) Keynote speaker: Michael Collins – CEO
4:25 – 4:35Tiger Gold Corp. (TSXV: TIGR)Keynote speaker: Fraser Macdougall, Director
4:40 – 4:55 Moxie Therapeutics, Inc., a private companyKeynote Presenter: Kate Beebe DeVarney, Ph.D., Founder, CEO
Register for the Conference here.
Submit Questions for any of the presenting companies to: Questions@EmergingGrowth.com
Replays: Subscribe to our YouTube Channel
About EmergingGrowth.comFounded in 2009, Emerging Growth.com quickly became a leader in its space and has developed an extensive history of identifying emerging growth companies that can be overlooked by the investment community.
About the Emerging Growth ConferenceThe Emerging Growth Conference is an effective way for public companies to engage with the investment community regarding their Company, new products, services and other major announcements from anywhere, in an effective and time efficient manner.
All sessions are conducted through video webcasts. Our conference serves as a vehicle for Emerging Growth to build relationships with our existing and potential clients. Accordingly, a certain number of the presenting companies are our current clients, and some may become our clients in the future. In exchange for services we provide, our clients pay us fees in the form of cash and securities, and we may currently have, or in the future may have investments in the securities of certain of the presenting companies. Finally, certain of the presenting companies have paid us a fee to secure a presentation time slot or to present generally. The presentations to be delivered by the presenting companies (including any virtual handouts of written materials) have not been approved, endorsed by or otherwise reviewed by EmergingGrowth.com nor should they in any way be construed to have been made in connection with an offer to sell or a solicitation of an offer to buy securities. Please consult an investment professional before investing in anything viewed on the Emerging Growth Conference or on EmergingGrowth.com.
If you believe or know of a company that might fit our audience, contact us here.
Thank you for your interest in our conference, and we look forward to your participation in future conferences.
Contact:
Emerging Growth Phone: 1-305-330-1985Email: Conference@EmergingGrowth.com
Investors interested in Mining – Miscellaneous stocks are likely familiar with Nexa Resources S.A. (NEXA) and Anglo American (NGLOY). But which of these two stocks is more attractive to value investors? We'll need to take a closer look to find out.
The best way to find great value stocks is to pair a strong Zacks Rank with an impressive grade in the Value category of our Style Scores system. The Zacks Rank is a proven strategy that targets companies with positive earnings estimate revision trends, while our Style Scores work to grade companies based on specific traits.
Nexa Resources S.A. has a Zacks Rank of #1 (Strong Buy), while Anglo American has a Zacks Rank of #2 (Buy) right now. Investors should feel comfortable knowing that NEXA likely has seen a stronger improvement to its earnings outlook than NGLOY has recently. However, value investors will care about much more than just this.
Value investors also try to analyze a wide range of traditional figures and metrics to help determine whether a company is undervalued at its current share price levels.
Our Value category highlights undervalued companies by looking at a variety of key metrics, including the popular P/E ratio, as well as the P/S ratio, earnings yield, cash flow per share, and a variety of other fundamentals that have been used by value investors for years.
NEXA currently has a forward P/E ratio of 4.88, while NGLOY has a forward P/E of 22.33. We also note that NEXA has a PEG ratio of 0.31. This metric is used similarly to the famous P/E ratio, but the PEG ratio also takes into account the stock's expected earnings growth rate. NGLOY currently has a PEG ratio of 0.51.
Another notable valuation metric for NEXA is its P/B ratio of 1.19. The P/B is a method of comparing a stock's market value to its book value, which is defined as total assets minus total liabilities. By comparison, NGLOY has a P/B of 2.5.
These metrics, and several others, help NEXA earn a Value grade of A, while NGLOY has been given a Value grade of C.
NEXA stands above NGLOY thanks to its solid earnings outlook, and based on these valuation figures, we also feel that NEXA is the superior value option right now.
Want the latest recommendations from Zacks Investment Research? Today, you can download 7 Best Stocks for the Next 30 Days. Click to get this free report
Nexa Resources S.A. (NEXA) : Free Stock Analysis Report
Anglo American (NGLOY) : Free Stock Analysis Report
This article originally published on Zacks Investment Research (zacks.com).
Investors interested in Basic Materials stocks should always be looking to find the best-performing companies in the group. Is Methanex (MEOH) one of those stocks right now? Let's take a closer look at the stock's year-to-date performance to find out.
Methanex is a member of the Basic Materials sector. This group includes 249 individual stocks and currently holds a Zacks Sector Rank of #11. The Zacks Sector Rank includes 16 different groups and is listed in order from best to worst in terms of the average Zacks Rank of the individual companies within each of these sectors.
The Zacks Rank is a proven system that emphasizes earnings estimates and estimate revisions, highlighting a variety of stocks that are displaying the right characteristics to beat the market over the next one to three months. Methanex is currently sporting a Zacks Rank of #1 (Strong Buy).
Over the past three months, the Zacks Consensus Estimate for MEOH's full-year earnings has moved 63% higher. This signals that analyst sentiment is improving and the stock's earnings outlook is more positive.
Our latest available data shows that MEOH has returned about 57.5% since the start of the calendar year. At the same time, Basic Materials stocks have gained an average of 16.7%. This shows that Methanex is outperforming its peers so far this year.
Another stock in the Basic Materials sector, Anglo American (NGLOY), has outperformed the sector so far this year. The stock's year-to-date return is 33.5%.
The consensus estimate for Anglo American's current year EPS has increased 37.1% over the past three months. The stock currently has a Zacks Rank #2 (Buy).
Looking more specifically, Methanex belongs to the Chemical – Diversified industry, which includes 29 individual stocks and currently sits at #109 in the Zacks Industry Rank. On average, stocks in this group have gained 26.8% this year, meaning that MEOH is performing better in terms of year-to-date returns.
On the other hand, Anglo American belongs to the Mining – Miscellaneous industry. This 72-stock industry is currently ranked #165. The industry has moved +30% year to date.
Investors interested in the Basic Materials sector may want to keep a close eye on Methanex and Anglo American as they attempt to continue their solid performance.
Want the latest recommendations from Zacks Investment Research? Today, you can download 7 Best Stocks for the Next 30 Days. Click to get this free report
Methanex Corporation (MEOH) : Free Stock Analysis Report
Anglo American (NGLOY) : Free Stock Analysis Report
This article originally published on Zacks Investment Research (zacks.com).
Find winning stocks in any market cycle. Join 7 million investors using Simply Wall St's investing ideas for FREE.
Analysts have nudged Anglo American’s fair value estimate from £36.53 to £36.80, a small shift that still matters if you are tracking where the stock might offer valuation support. This change sits against Street targets that range roughly from 2,800 GBp on the cautious side up to 4,000 GBp for the more optimistic brokers, reflecting a split view on risk and potential upside. Read on to see how to interpret these moving targets and keep up with the evolving narrative around Anglo American.
Stay updated as the Fair Value for Anglo American shifts by adding it to your watchlist or portfolio. Alternatively, explore our Community to discover new perspectives on Anglo American.
What Wall Street Has Been Saying 🐂 Bullish Takeaways
- Deutsche Bank has moved its price target on Anglo American from 3,600 GBp to 3,800 GBp and more recently to 4,500 GBp, which highlights a constructive view on valuation support and upside potential.
- Berenberg continues to carry Buy ratings while adjusting targets within a relatively tight band, from 4,200 GBp to 3,900 GBp and then 4,000 GBp, signalling that, in its view, execution and asset quality still justify a higher range than more cautious houses.
- Oddo BHF’s upgrade of Anglo American points to improving conviction around the company’s positioning, which investors may see as reinforcement for a more optimistic long term thesis.
🐻 Bearish Takeaways
- JPMorgan has shifted Anglo American to Underweight from Neutral with a 2,800 GBp target and later cited events in the Middle East and a new downside scenario for copper and iron ore, framing a more cautious stance on both execution risk and commodity exposure.
- CIBC’s reference to the proposed merger with Anglo American in the context of Teck Resources, along with a Tender rating on Teck, underlines that some analysts are focused on deal risk and regulatory timelines rather than pure upside on Anglo American’s standalone valuation.
Do your thoughts align with the Bull or Bear Analysts? Perhaps you think there's more to the story. Head to the Simply Wall St Community to discover more perspectives!
LSE:AAL 1-Year Stock Price Chart
What's in the News
- Anglo American reported first quarter 2026 production, including 170,400 tonnes of copper, 15.2 Mt of premium iron ore, 759,100 tonnes of manganese ore, 7.1 Mct of diamonds, 1.5 Mt of steelmaking coal and 9,100 tonnes of nickel.
- The company reiterated unchanged 2026 production guidance, with expected copper output of 700 kt to 760 kt, premium iron ore of 55 Mt to 59 Mt and diamonds of 21 Mct to 26 Mct.
- Anglo American confirmed that SIX Swiss Exchange Regulation approved the delisting of its 1,178,050,272 ordinary shares from the SIX Swiss Exchange, with the last trading day expected on 25 June 2026 and the delisting effective on 26 June 2026.
- The company highlighted a 15 May 2026 ruling by Chile's Second Environmental Tribunal related to the Collahuasi copper mine, and reported that Collahuasi is seeking clarification on the scope and operational impact of the decision.
How This Changes the Fair Value For Anglo American
- Fair value moved from £36.53 to £36.80, reflecting a small adjustment to the model output.
- Revenue growth assumption is held at about 5.43%, with no change to projected dollar revenue growth.
- Net profit margin assumption shifted from about 14.96% to about 13.84% relative to future dollar sales.
- Future P/E multiple moved from roughly 17.1x to about 18.8x on expected earnings.
- Discount rate moved from 9.80% to about 9.78%, indicating a marginal adjustment to the risk input.
Never Miss an Update: Follow The Narrative
Narratives connect Anglo American’s business story to analyst forecasts and fair value, so you can see how production plans, projects and risks map into the numbers. They refresh as new research, guidance and events are factored in.
Head over to the Simply Wall St Community and follow the Narrative on Anglo American to stay up to date on:
- How the planned exit from thermal coal, PGMs and diamonds, together with a greater focus on copper and premium iron ore, ties into electrification and decarbonization demand.
- The role of cost savings, portfolio reshaping and major copper and iron ore projects such as Quellaveco, as well as premiumization initiatives, in reshaping margins and cash generation.
- Key risks around production reliability at mines like Collahuasi, potential delays in selling discontinued assets such as De Beers, and ongoing exposure to South African rail and port infrastructure constraints.
This article by Simply Wall St is general in nature. We provide commentary based on historical datan and analyst forecasts only using an unbiased methodology and our articles are not intended to be financial advice. It does not constitute a recommendation to buy or sell any stock, and does not take account of your objectives, or yourn financial situation. We aim to bring you long-term focused analysis driven by fundamental data.n Note that our analysis may not factor in the latest price-sensitive company announcements or qualitative material.n Simply Wall St has no position in any stocks mentioned.
Companies discussed in this article include AAL.L.
Have feedback on this article? Concerned about the content? Get in touch with us directly. Alternatively, email editorial-team@simplywallst.com
With a short percentage of shares outstanding of 0.97%, Agnico Eagle Mines Limited (NYSE:AEM) is among the 9 Best Silver and Copper Stocks to Buy for the EV Transition.
n
On May 26, CIBC raised its price target on Agnico Eagle Mines Limited (NYSE:AEM) to $310 from $304 while maintaining an Outperformer rating on the shares. The firm cited the company’s favorable first-quarter results and additional exploration upside potential as key factors supporting the target increase.
n
n
On May 20, Agnico Eagle Mines Limited (NYSE:AEM) announced that it entered into a subscription agreement with Wallbridge Mining Company Limited to purchase approximately 243.9 million common shares at a price of C$0.092 per share for a total consideration of approximately C$22.4 million. Following completion of the transaction, Agnico Eagle is expected to increase its ownership stake in Wallbridge to nearly 20% on a partially diluted basis. The agreement also provides Agnico Eagle with participation rights in future equity financing and the ability to nominate a representative to Wallbridge’s board of directors, strengthening its strategic position and long-term exposure to exploration and development opportunities.
n
Agnico Eagle Mines Limited (NYSE:AEM) was founded in 1957 and is headquartered in Toronto. In addition to producing gold and silver, Agnico Eagle supports the electric vehicle transition through underground mining electrification initiatives, including the use of battery-electric mining equipment and the repurposing of used EV batteries for stationary energy storage applications.
n
n
While we acknowledge the potential of AEM as an investment, we believe certain AI stocks offer greater upside potential and carry less downside risk. If you're looking for an extremely undervalued AI stock that also stands to benefit significantly from Trump-era tariffs and the onshoring trend, see our free report on the best short-term AI stock.
n
n
n
READ NEXT: 7 Best Steel and Metal Stocks to Buy for Energy Infrastructure and 7 Best Electrical Contracting Stocks to Buy for Data Hall Fit-outs.
n
Disclosure: None. Follow Insider Monkey on Google News.
Momentum investing is all about the idea of following a stock's recent trend, which can be in either direction. In the "long context," investors will essentially be "buying high, but hoping to sell even higher." And for investors following this methodology, taking advantage of trends in a stock's price is key; once a stock establishes a course, it is more than likely to continue moving in that direction. The goal is that once a stock heads down a fixed path, it will lead to timely and profitable trades.
Even though momentum is a popular stock characteristic, it can be tough to define. Debate surrounding which are the best and worst metrics to focus on is lengthy, but the Zacks Momentum Style Score, part of the Zacks Style Scores, helps address this issue for us.
Below, we take a look at Anglo American (NGLOY), a company that currently holds a Momentum Style Score of A. We also talk about price change and earnings estimate revisions, two of the main aspects of the Momentum Style Score.
It's also important to note that Style Scores work as a complement to the Zacks Rank, our stock rating system that has an impressive track record of outperformance. Anglo American currently has a Zacks Rank of #2 (Buy). Our research shows that stocks rated Zacks Rank #1 (Strong Buy) and #2 (Buy) and Style Scores of "A or B" outperform the market over the following one-month period.
You can see the current list of Zacks #1 Rank Stocks here >>>
Set to Beat the Market?
In order to see if NGLOY is a promising momentum pick, let's examine some Momentum Style elements to see if this company holds up.
Looking at a stock's short-term price activity is a great way to gauge if it has momentum, since this can reflect both the current interest in a stock and if buyers or sellers have the upper hand at the moment. It's also helpful to compare a security to its industry; this can show investors the best companies in a particular area.
For NGLOY, shares are up 2.91% over the past week while the Zacks Mining – Miscellaneous industry is up 3.56% over the same time period. Shares are looking quite well from a longer time frame too, as the monthly price change of 15.27% compares favorably with the industry's 0.32% performance as well.
Considering longer term price metrics, like performance over the last three months or year, can be advantageous as well. Over the past quarter, shares of Anglo American have risen 28.05%, and are up 85.97% in the last year. In comparison, the S&P 500 has only moved 10.8% and 30.05%, respectively.
Investors should also pay attention to NGLOY's average 20-day trading volume. Volume is a useful item in many ways, and the 20-day average establishes a good price-to-volume baseline; a rising stock with above average volume is generally a bullish sign, whereas a declining stock on above average volume is typically bearish. NGLOY is currently averaging 446,351 shares for the last 20 days.
Earnings Outlook
The Zacks Momentum Style Score also takes into account trends in estimate revisions, in addition to price changes. Please note that estimate revision trends remain at the core of Zacks Rank as well. A nice path here can help show promise, and we have recently been seeing that with NGLOY.
Over the past two months, 2 earnings estimates moved higher compared to none lower for the full year. These revisions helped boost NGLOY's consensus estimate, increasing from $0.73 to $1.15 in the past 60 days. Looking at the next fiscal year, 2 estimates have moved upwards while there have been no downward revisions in the same time period.
Bottom Line
Taking into account all of these elements, it should come as no surprise that NGLOY is a #2 (Buy) stock with a Momentum Score of A. If you've been searching for a fresh pick that's set to rise in the near-term, make sure to keep Anglo American on your short list.
Want the latest recommendations from Zacks Investment Research? Today, you can download 7 Best Stocks for the Next 30 Days. Click to get this free report
Anglo American (NGLOY) : Free Stock Analysis Report
This article originally published on Zacks Investment Research (zacks.com).
FTSE 100 Live: Stocks inch higher as miners rise, BAT and Chemring fall Proactive uses images sourced from Shutterstock
- n
- FTSE 100 up 25 points to 10,364
- Miners gain as copper prices rise, gold steadies
- BAT and Chemring updates disappoint
n
n
n
n4.04pm: FTSE indices break losing streakn
UK equities have generally moved higher today, with strength in mining stocks and banks helping the blue-chip benchmark recover from three consecutive negative sessions.
n
Antofagasta, Glencore and Anglo American top the leaderboard, with Barclays, Rio Tinto, Standard Chartered next.
n
Some more consumer-focused names are also among the risers, with IHG, Kingfisher and M&S all up over 2%.
n
The FTSE 250 outperformed its big sibling, though still only up 0.4%.
n
This was supported by "broader buying interest in midcaps and rate-sensitive domestic shares", says market analyst Patrick Munnelly at Tickmill.
n
He flags the comments from Andrew Bailey to the House of Lords economic affairs committee this afternoon, where the Bank of England Governor said the monetary policy committee's priority remains returning inflation to its 2% target, not redefining it after repeated overshoots.
n
"Asked whether the persistence of above-target inflation through much of the 2020s meant the BoE should rethink its framework, Bailey pushed back, saying the focus must be on managing the journey back to target and ensuring the public believes in the legitimacy of the Bank’s objective," says Munnelly.
n
"He also rejected the idea that raising the target to 3% would be an appropriate response to missed targets."
n
After voting to keep rates steady at 3.75% at the last meeting on 30 April, part of an 8-1 majority, Bailey noted that rising market interest rates had given the Bank some breathing room to assess whether another rate increase is needed in response to inflationary pressures linked to the conflict in Iran.
n
"For investors, the message was balanced but firm: the BoE is not rushing into another hike, but it is also not ready to declare victory on inflation."
n3.12pm: Is there a shift back from private to public markets?n
Staying on the US, but with potential read-across for markets on this side of the Atlantic, Anthropic’s and SpaceX's IPO filings (with OpenAI expected too) and Alphabet’s planned $80 billion equity raise, this is a strong signal of a shift back toward public markets as funding demands accelerate, says Michael Field, chief equity analyst at Morningstar.
n
"Last year the talk was about unicorns and the advantages of remaining private. This year that narrative has been turned on its head, most recently with announcements from Anthropic and Alphabet.
n
"It’s no coincidence that Anthropic is now filing for an IPO at the same time as OpenAI and SpaceX. At the same time, Alphabet is reversing its long-held capital allocation policy of buying back shares and issuing $80 billion in equity.
n
"The game has changed. These companies are now burning through cash to win the AI race and public equity is the cheapest source available, particularly in a rising interest rate environment.
n
"Not only are these businesses injecting capital, they’re doing it at exactly the right time.
n
"We’ve seen investor sentiment change with the sell-off in AI-related stocks during 2025. This was a warning that just because the fundamentals look positive, investors’ attitudes towards these firms can quickly shift."
n2.52pm: Wall St opens in redn
US stocks have opened with wheels spinning but the4 big three indices not going anywhere much.
n
The Dow is down almost 0.2%, while broader S&P 500 is down less than 10 points or 0.1%, with the Nasdaq even flatter.
n
Back in London, the FTSE is also pretty much flat now.
n1.53pm: easyJet and Rosebank notesn
Some broker notes worth flagging from today.
n
Shares in easyJet have been sent higher after Citi estimated that the airline's aeroplane fleet could be worth 770-890p, around double the recent share price even after the.
n
The US investment bank said the company's aircraft assets should help underpin the share price as takeover speculation continues, following the Castlelake announcement that it was exploring a potential bid.
n
Rosebank Industries, the industrial turnaround vehicle run by former Melrose executives, is up 4% after attracting 'buy' ratings from both Jefferies and Citi as the two banks resume coverage following the completion of its acquisitions of MW Components and CPM, transforming the company from a single-asset story into a group of three US industrial businesses.
n
The twin acquisitions, totalling more than $3 billion, add a manufacturer of engineered fasteners, springs and precision metal products, and a global supplier of process equipment and aftermarket solutions for food, feed and energy markets. They join ECI, the electrical components business Rosebank acquired last year.
n
Elsewhere, Panmure Liberum has initiated on Rentokil Initial, seeing the pest control giant as poised for a recovery after years of disruption linked to its acquisition of US business Terminix.
n
Analyst Joe Brent expects new chief executive Mike Duffy to improve operational performance, accelerate growth and close the profitability gap.
n12.59pm: Net zero = £100bnn
Britain's net zero economy now contributes more than £100 billion a year to economic output and supports 1.1 million jobs across the country, according to new research from CBI Economics.
n
The report found that businesses involved in activities ranging from renewable energy and electric vehicles to home insulation and clean technology generated £105 billion of gross value added last year, equivalent to almost 4% of UK economic output.
n
A pipeline of around £455 billion of potential investment in energy infrastructure was identified, prompting the CBI to describe the sector as a growing economic "powerhouse".
n
Louise Hellem, the CBI's chief economist, said clean power and decarbonisation were already a significant part of Britain's industrial base and warned the UK "cannot afford to step back" from an industry with substantial future growth potential.
n
Workers in the sector earn an average salary of more than £43,000 a year, around 11% above the national average.
n12.23pm: FTSE still lagging Continental peers, US futures in redn
The FTSE and other European markets have essentially been moving sideways since 9.30am this morning.
n
The London index is still lagging, with the pan-European Stoxx 600 0.7% firmer.
n
This contrasts with a weaker outlook on Wall Street, where futures point to a softer open.
n
Dow Jones futures are down 214 points or 0.4%, while S&P 500 and Nasdaq futures slipped 0.2% and 0.1%.
n
In the background, oil prices are down, with Brent falling 1.3% to $93.70 a barrel and US WTI similarly lower at $90.93.
n11.41am: BP backs Blanc to lead search for another chairn
BP has backed Amanda Blanc to lead the search for a new chair despite concerns from some investors over her role in appointing Albert Manifold, who was ousted last week after only eight months in the job.
n
The Financial Times has reported that several shareholders had questioned whether Blanc, BP's senior independent director, should oversee the process after leading the search that resulted in Manifold's appointment last year.
n
However, interim chair Ian Tyler said in a statement: “At the request of the board, Amanda Blanc will lead the search process for BP’s next chair. As in previous searches, this will be a rigorous process involving the entire board and the final decision will reflect our collective view.”
n11.13am: Marvell flies on Huang commentsn
Marvell Technology shares have rocketed almost 27% higher in pre-market trading in New York, after Nvidia CEO Jensen Huang declared it as the "next trillion-dollar company".
n
Huang was speaking on stage at the Computex conference in Taipei, in a conversation with Marvell CEO Matthew Murphy.
n
He flagged Marvell's key role in providing the custom chips and high-speed interconnects required to scale massive, distributed artificial intelligence data centres.
n
Reports stated that the comment was "made in a lighthearted tone".
n10.57am: Warning for social media short sellersn
Short seller Andrew Left, best known as Citron Research, especially to investors in companies including Tesla, Palantir, Tilray, CV Sciences and Namaste Technologie, has been found guilty by a court in LA last night.
n
The ruling was that Left used social media posts to illegally manipulate stocks, causing price movements that he would quickly profit from. He was convicted on 13 of the 17 counts.
n
Prosecutors said he earned more than $20 million from such trades from 2018 to 2023.
n
Bloomberg calls it "a landmark case" that has been "closely watched by short sellers worried they could come under fire, too".
n
Short sellers such as Left typically build short positions in companies, ie betting that the shares will fall, then issue research reports detailing arguments why they think the company is no good.
n
“This sets a dangerous precedent for short sellers, who now fear that publishing negative research and exiting trades quickly will trigger federal audits and market manipulation charges,” Yale accounting professor Frank Zhang told Bloomberg.
n
Left plans to appeal the decision, saying, "The jury got it wrong." Business Insider reports that Left's lawyer has filed a motion for a mistrial due to an outdated verdict form used by the jury.
n10.20am: Gold price surge changes weighting for central bank reservesn
Gold has overtaken US Treasuries as world’s top reserve asset, the European Central Bank says, based on its calculations.
n
The precious metal made up 27% of total official foreign reserves at the end of 2025, the ECB says, compared to 22% for US Treasuries and the euro at 15%.
n
A year earlier, gold was 20% of reserves and US government bonds stood at 25%.
n
Geopolitical tensions are driving strong central bank demand for gold, says ECB president Christine Lagarde adding more poetically that "forces of fragmentation are becoming more pronounced."
n
But the ECB notes that price changes are the key factor, with the gold price surging around 60% in nominal terms last year and 30% in 2024, "which mechanically increases the share of gold in total official foreign reserves".
n
"Correcting for such valuation effects by using the gold price at the end of 2023, the share of the euro (16%) remains at par with the share of gold (16%), while the share of US Treasuries continues to be markedly higher (26%).
n
"Going forward, gold faces limitations as an official reserve asset compared with the major fiat currencies: its price is volatile, it is not remunerated and, when held in physical form, it is costly to store. More importantly, the supply of gold is not fully elastic and does not adjust seamlessly to shifts in international demand for liquidity."
n9.40am: BoE data just outn
Fresh Bank of England data points to a resilient housing market, even as borrowing growth cooled in April.
n
Mortgage approvals rose to 65,900, ahead of expectations at around 62K and up from a revised 63,980 in March and an average of around 63,100 over the past six months.
n
It was the highest level of approvals since January last year.
n
Net mortgage lending slowed sharply to £4.4 billion from a revised £6.8 billion the previous month, worse than the £5.2 billion consensus forecast.
n
This came as the ‘effective’ interest rate – the actual interest paid – on newly drawn mortgages increased to 4.08% from 4.03% in March. The rate on the outstanding stock of mortgages was 3.92% in April, down from 3.93% in March.
n
Net lending to individuals eased to £6.2 billion from £8 billion.
n
Consumer credit growth also moderated, with households borrowing an additional £1.9 billion in April, in line with March and the past six-month average.
n9.27am: FTSE adds to gainsn
The FTSE 100 has recouped around two thirds of yesteerday's loss, after almost an hour and a half of trading.
n
Miners are the key driving force, housebuilders and retailers are the most represented sectors on the leaderboard.
n
Falls for BAT and oil giants are resulting in the London index lagging mainland European peers, with the German DAX up 1.4% and others around the Continent all up over 1%.
n
Market analyst Neil Wilson at Saxo notes that the Footsie is advancing despite some losses for heavyweights "as advancers outnumbered decliners 4:1".
n
He adds that "headlines around Iran grab the steering wheel but the AI trade remains the engine for stock markets", with Nvidia powering Wall Street's gains overnight, as well as plans for an Anthropic IPO and Alphabet's $80 billion AI investment.
n
On the Stoxx 600, tech companies are in the lead, topped by Dutch technology investor Prosus after it was given more time to sell down its stake in Delivery Hero.
n
STMicroelectronics is up 8.2% as it raised its data centre revenue target to $1 billion, driven by strong AI demand and expanded capacity.
n9.09am: Euro inflation risesn
Eurozone inflation rose to 3.2% last month, its highest level since September 2023.
n
It adds to expecations that the European Central Bank could lift interest rates soon.
n
Euro-area consumer price inflation climbed from 3% in April, Eurostat data shows, driven by an increase in energy inflation to 10.9% in May, offsetting a fall in food, alcohol & tobacco inflation to 2.0%.
n8.46am: Elementis up, Chemring downn
One of the top risers on the FTSE 250 is Elementis, up 6.2% after completing the sale of its pharmaceutical manufacturing business to AB Foods and confirming a share buyback.
n
The specialty chemicals group said it had completed the disposal for an enterprise value of €34.3 million and expects to receive net cash proceeds of about €30 million ($35 million), all of which will be returned to shareholders via the buyback.
n
Elementis said the disposal would improve adjusted operating margins both at group level and within its personal care division, while also reducing future capital requirements.
n
Elsewhere, Chemring is down 5% after its results.
n
Analyst Andrew Humphrey at Peel Hunt says that with management’s expectations for the year unchanged, guiding to 70% of FY26 operating profit in the second half, this would support an full-year adjusted operating profit outturn of £81.7 million, which compares to his forecvast of £81.2 million and a wider City consensus of £80.8 million.
n
"We suspect our forecasts did not fully capture the import of comments made in the AGM statement in February, highlighting a slower start to the year at the US countermeasures business (Kilgore). The UK also remains slower than anticipated, given delays to the Defence Investment Plan, though this should be fully reflected in expectations, and we view the margin performance (40bps higher YoY) as strong."
n
He concludes: "Trading momentum is strong, though we may not see meaningful progress in the share price until short-term budget issues affecting Roke have been resolved."
n8.12am: FTSE 100 opens modestly highern
The FTSE 100 has opened 26 points higher at 10,365, with miners at the forefront.
n
Precious metals miner Fresnillo is prominent for the second day in a row, up 3.7%, while copper-focused Antofagasta is not far behind at 3%, Anglo American up 2.75%, gold digger Endeavour at 2.6% and Rio Tinto up 2.25%.
n
Perenially volatile names such as retailers Kingfisher and JD Sports, bookmaker Entain and Metlen Energy & Metals are also among the top risers.
n
Losers are led by BAT, which is down 3% after its half-year update.
n
Oil giants BP and Shell are down 1.7% and 0.95% after oil prices retreated.
n7.59am: Chemring backs outlook despite profits dipn
Defence technology specialist Chemring has reported lower first-half profits but a record order book, and said it remained on track to meet full-year expectations.
n
The maker of chaff, energetics and sensors posted revenue up 7% to £237.3 million for the six months to 30 April, while underlying operating profit fell 8% to £24.5 million as the underlying operating margin narrowed to 10.3% from 11.9%.
n
The decline reflected weaker profitability in its Sensors & Information division, where lower utilisation rates and a less favourable business mix weighed on performance.
n
Trading was said to have improved during the second quarter.
n7.45am: Anthropic files for IPO and other AI newsn
A major tech story overnight was that Anthropic, the maker of the Claude AI models, submitted draft registration for an IPO this autumn.
n
This would see it leapfrog ChatGPT developer OpenAI, which is also expected to file for an IPO in the coming days.
n
Also yesterday, Google owner Alphabet announced plans to raise $80 billion to fund its AI plans, one of the biggest equity issues deals in history, including a $10 billion investment from Berkshire Hathaway.
n7.33am: BAT guides to lower end of outlookn
British American Tobacco says revenue and profit will come in towards the bottom end of its guidance for the 2026 financial year as continued declines in traditional cigarette volumes are offset by stronger-than-expected growth in nicotine pouches and vaping products.
n
For its New Categories arm, the tobacco group upgraded its forecast to "mid-teens" percentage revenue growth in both the first half and full year, up from a previous forecast for "low double-digit" growth.
n
For the group overall, BAT maintained its guidance for revenue growth of 3-5%, adjusted profit growth of 4-6% and adjusted diluted earnings per share growth of 5-8% in 2026, though it expects results to come in at the lower end of those ranges.
n
Furthermore, profits growth is expected to be weighted towards the second half of the year.
n7.17am: FTSE 100 called higher as Trump helps oil retreatn
The FTSE 100 is set to claw back some losses on Tuesday morning trading, as oil prices simmered down on Donald Trump's soothing news that Hezbollah and Israel had agreed to "stop shooting" at each other.
n
London's blue-chip index has been called around 40 points higher on the futures market after ending the previous session down 70.33 points at 10,338.95.
n
The expected rebound mirrors moves elsewhere in Europe, while investors also took some encouragement from a modestly positive session on Wall Street overnight.
n
The tech-heavy Nasdaq rose 0.4%, the S&P 500 added 0.3% and the Dow Jones Industrial Average edged 0.1% higher, marking fresh record highs for all three indices as Nvidia jumped more than 6% after unveiling a new superchip for PCs.
n
Oil prices, which have become the market’s main barometer of Middle East geopolitical risk, eased back this morning after a volatile 24 hours.
n
Brent crude traded around $94.30 a barrel, down from a brief surge above $97 yesterday when Iran said it was suspending talks with the US unless Israeli attacks on Lebanon and Gaza ceased.
n
Ipek Ozkardeskaya, market analyst at Swissquote, said traders were struggling to keep pace with a rapidly changing picture in the Middle East.
n
“When you think that the geopolitical headlines could not get worse, they do,” she says, noting conflicting messages from Washington and Jerusalem over the prospects for a de-escalation in Lebanon, as Benjamin Netanyahu contradicted the US President by saying that fighting in Southern Lebanon would continue. "It’s a mess," says Ozkardeskaya.
n
Trump countered the news from Tehran, claiming talks with Iran were continuing "at a rapid pace" and telling reporters that he thinks a ceasefire agreement will be completed "over the next week".
n
The key issue for oil markets remains the reopening of the Strait of Hormuz, says Ozkardeskaya, though risks to prices remain "two-sided". She said crude could move back above $100 a barrel if peace efforts stall, while a lasting end to the fighting could pull prices closer to $80.
Vancouver, British Columbia–(Newsfile Corp. – June 1, 2026) – Rokmaster Resources Corp. (TSXV: RKR) (OTCQB: RKMSF) (FSE: 1RR1) ("Rokmaster" or "the Company") provides an update on exploration activities within the Nechako Project.
Crews will soon mobilize to complete a detailed Induced Polarization Survey ("IP Survey") over several porphyry Cu-(Mo±Au) targets on the Mystery Property. This survey will sharpen targets planned for drill testing during the fall. The IP Survey will be conducted by SJ Geophysics and is planned to be a pole-dipole active array capable of investigating chargeability and resistivity to depths of 300-400 m (Figure 2).
The current targets include the B2 and B3 zones which exhibit elevated copper, molybdenum, and gold in rock sample results associated with strongly potassic-altered andesite hosting a dense stockwork of pyrite-chalcopyrite-biotite-magnetite veinlets. The B2 Zone is exposed along a creek for approximately 200 m. The surrounding area, including ~800 m toward the B3 Zone, is covered by glacial till so the IP Survey will greatly assist in planning specific drill targets in this area.
Approximately 2.5 km to the northeast, an IP Survey is planned to investigate a coincident soil and magnetic anomaly in the northern portion of the Ford Anomaly area. This area is underlain by rhyolite belong to the Kasalka Group which displays strong phyllic alteration over a broad area including intense sericite replacement and disseminated pyrite. Hyperspectral work completed in the previous years indicates that higher-temperature paragonite occurs below a certain elevation in the Ford Anomaly area inferring that potential exists at depth.
Another ~1.1 km to the north of the Ford Anomaly, the planned IP Survey will test an area of stockwork quartz veining in sericite- and potassic-altered porphyritic monzonite. A Re-Os age dating study1 of molybdenite mineralization in this area indicates that it falls within the range of the productive late Cretaceous Bulkley Intrusive Suite that is related to porphyry systems in the region such as the Huckleberry, Ox, Seel, and Poplar Deposits.
Field work on the Fox-Coconut Property is planned for early June to further explore the high-grade gold and silver mineralization on that Property. Geochemical results from the drill program completed on the Hanson Property in April 2026 are expected soon and will be reported promptly afterwards.
John Mirko, President and CEO, comments:
"The IP Survey planned for the Mystery Property will capture valuable subsurface geophysical data to refine several compelling targets on the Property. We are excited to continue advancing the Nechako Project throughout 2026 and are fully funded to complete the programs as currently planned. This region and its underlying geology represent an exceptional setting for the discovery of significant porphyry copper mineralization – an opportunity that Rokmaster is actively pursuing."
Nechako Project
The Mystery Property is a part of the Company's Nechako Project, which totals 26,704 hectares (267 km2) across three properties located in west-central British Columbia. The Nechako Project features multiple exploration targets for significant porphyry Cu-(Mo±Au) mineralization and high-grade Au-Ag vein systems in the southern portion of the productive Stikine terrane (Figure 1). Rokmaster has advanced the Nechako Project over several years, systematically vectoring towards robust drill targets across its three drill permitted properties.
The technical information in this news release has been prepared in accordance with Canadian regulatory requirements as set out in National Instrument 43-101 and reviewed and approved by Eric Titley, P.Geo., who is independent of Rokmaster and who acts as Rokmaster's Qualified Person.
For more information please contact
Mr. John Mirko, President & CEO of Rokmaster Resources Corp., jmirko@rokmaster.com, Ph. +1 (604) 290-4647 or by website: www.rokmaster.com
On Behalf of the Board of Directors of
Rokmaster Resources Corp.
John Mirko, President & Chief Executive Officer.
Neither TSX Venture Exchange nor its Regulation Services Provider (as that term in defined in the policies of the TSX Venture Exchange) accepts responsibility for the adequacy or accuracy of this press release.
CAUTIONARY NOTE REGARDING FORWARD-LOOKING STATEMENTS: This news release may contain forward-looking information within the meaning of applicable securities laws ("forward-looking statements"). Forward-looking statements are statements that are not historical facts and are generally, but not always, identified by the words "expects," "plans," "anticipates," "believes," "intends," "estimates," "projects," "potential" and similar expressions, or that events or conditions "will," "would," "may," "could" or "should" occur. These forward-looking statements are subject to a variety of risks and uncertainties which could cause actual events or results to differ materially from those reflected in the forward-looking statements, including, without limitation: risks related to fluctuations in metal prices; uncertainties related to raising sufficient financing to fund the planned work in a timely manner and on acceptable terms; changes in planned work resulting from weather, logistical, technical or other factors; the possibility that results of work will not fulfill expectations and realize the perceived potential of the Company's properties; risk of accidents, equipment breakdowns and labour disputes or other unanticipated difficulties or interruptions; the possibility of cost overruns or unanticipated expenses in the work program; the risk of environmental contamination or damage resulting from Rokmaster's operations and other risks and uncertainties. Any forward-looking statement speaks only as of the date it is made and, except as may be required by applicable securities laws, the Company disclaims any intent or obligation to update any forward-looking statement, whether as a result of new information, future events or results or otherwise.
1 Rokmaster Resources Corp. news release January 23, 2026.
To view the source version of this press release, please visit https://www.newsfilecorp.com/release/299566
Agnico Eagle Mines Limited (NYSE:AEM) is one of the 8 Best Natural Resources Stocks to Buy Now.
n
On May 26, 2026, CIBC raised the firm’s price target on Agnico Eagle Mines Limited (NYSE:AEM) to $310 from $304 and maintained an Outperformer rating on the shares. CIBC cited the company’s “favorable” Q1 results and potential exploration upside for the target increase.
n
Meanwhile, Barclays initiated coverage of Agnico Eagle Mines Limited (NYSE:AEM) with an Overweight rating and a $213 price target. Barclays analyst Richard Garchitorena said investments in “transformative” technologies and higher trade barriers are driving renewed growth across metals and mining. Barclays also said it is positive on gold prices and gold equities and expects “significant demand growth” for rare earth magnets.
nn
On May 20, 2026, Agnico Eagle Mines Limited (NYSE:AEM) announced a subscription agreement with Wallbridge Mining Company to purchase 243,927,966 common shares of Wallbridge at C$0.092 per share for a total consideration of C$22,441,373. After closing, Agnico Eagle is expected to own 359,285,979 common shares and 6,275,897 warrants, representing approximately 19.62% of Wallbridge’s issued and outstanding common shares on a non-diluted basis and 19.90% on a partially diluted basis.
n
Agnico Eagle Mines Limited (NYSE:AEM) is a gold mining company engaged in the exploration, development, and production of precious metals, including gold, silver, copper, and zinc.
n
n
While we acknowledge the potential of AEM as an investment, we believe certain AI stocks offer greater upside potential and carry less downside risk. If you're looking for an extremely undervalued AI stock that also stands to benefit significantly from Trump-era tariffs and the onshoring trend, see our free report on the best short-term AI stock.
n
n
n
READ NEXT: 33 Stocks That Should Double in 3 Years and Cathie Wood 2026 Portfolio: 10 Best Stocks to Buy.
n
Disclosure: None. Follow Insider Monkey on Google News.
Toronto, Ontario–(Newsfile Corp. – May 28, 2026) – Honey Badger Silver Inc. (TSXV: TUF) (OTCQB: HBEIF) (FSE: 1QA) (Tradegate: 1QA) ("Honey Badger" or the "Company") is pleased to announce that it has appointed JDS Energy & Mining Inc. ("JDS") to be the lead author of an updated Preliminary Economic Assessment ("PEA") and updated Mineral Resource Estimate ("MRE") on its Prairie Creek Mine ("PC Silver Mine"), located in the Northwest Territories of Canada. Honey Badger Silver expects this PEA and updated MRE to be completed in Q3 2026 and believes the studies could represent major technical and economic catalysts for the Company.
The PC Silver Mine is one of the world's highest-grade undeveloped silver-zinc-lead projects and benefits from substantial historical infrastructure and development work, including:
- approximately 5 km of underground development;
- an existing mill and surface infrastructure;
- an airstrip;
- advanced permitting;
- agreements with Indigenous governments associated with the project area and transportation corridor; and,
- a $25 Million grant from the Government of Canada under the National Trade Corridor Fund.
The Company believes current metal prices and updated technical assumptions may have the potential to materially enhance project economics relative to prior studies.
The last MRE was completed by Global Mineral Resources Services in October 2021[1], and outlined a measured and indicated resource of 9.8 million tonnes grading 139 g/t Ag, 9.7% Zn, and 8.8% Pb and an inferred resource of 6.4 million tonnes grading 150 g/t Ag, 12.9% Zn, and 6.7% Pb using a US$20/oz silver price, a US$1.15/lb zinc price and a US$1.00/lb lead price. Current spot prices of the metals are US$79/oz Ag, US$1.60/lb Zinc and US$0.91/lb lead.
Along with JDS Mining, several well-known, experienced, and specialized consultants will be providing input to the study, as shown below.
| Consultant | Expertise |
| Global Mineral Resource Services | Geology and Mineral Resource Estimation |
| Knight Piésold | Waste and water management, environment and permitting |
| Giffen Consulting | Process and Infrastructure |
| T Engineering | Underground mine backfill |
Ron Halas, Chief Operating Officer commented: "Given the rise in the price of silver and other metals since the 2021 report, combined with the many project advancements completed by prior operators, the time is right to update the MRE and evaluate the current economics of this world-class asset. We believe the updated studies will help better demonstrate the strategic importance and economic potential of the PC Silver Mine. JDS is an excellent choice given its extensive underground mine development and northern Canadian project experience. We are looking forward to working with this team of consultants to advance the PC Silver Mine through these studies and ultimately toward production."
Chad Williams, Executive Chairman said, "We are eager to initiate these updated technical studies. The Company believes current precious and base metal prices have the potential to materially improve project economics relative to prior studies. Importantly, the updated MRE and PEA will be based on historical technical reports and prior drilling completed on the project. The studies are not currently expected to incorporate potential future upside associated with critical mineral opportunities, including germanium and tungsten, nor new technology, which Honey Badger intends to continue evaluating. We believe the PC Silver Mine represents a rare opportunity to redevelop a high-grade strategically important silver-zinc-lead project in a Tier-1 mining jurisdiction with significant existing infrastructure already in place."
About the Consultants
JDS provides end-to-end engineering, project development, and mining construction services and solutions for mining projects. Their expertise includes technical engineering studies, project and construction management, underground and surface mining services, heavy civil and tunneling work, operational safety services, and environmental reclamation for mining projects worldwide, with extensive expertise in Northern Canada.
Global Mineral Resource Services offers in-depth technical knowledge and experience to conduct the estimation of mineral resources and the evaluation of mineral deposits. They have world-wide experience with a broad range of mineral commodities and mineral deposits and are qualified to prepare technical reports for all major reporting jurisdictions.
Knight Piésold is an employee-owned global consulting firm specializing in services for the mining, power, and water sectors. Its mining expertise spans hundreds of surface and underground projects worldwide, covering every stage of development, with particular emphasis on waste and water management and environmental services. This includes the design of sound, cost-effective engineering solutions for mines in Canada's North.
Giffen Consulting Ltd. specializes in providing fit for purpose design and engineering services specializing in the utility, mining, and heavy industrial sectors with a focus on mineral processing, infrastructure design and construction.
T Engineering is a Canadian engineering consulting company based in Toronto, Ontario. With expertise and operation experience in cemented rockfill, hydraulic fill, and cemented paste backfill, T Engineering provides all aspects of backfill engineering services around the world.
Qualified Person
The scientific and technical data contained in this news release pertaining to the Project was reviewed and approved by Benjamin Kuzmich, P.Geo. who is an independent consultant and "qualified person" within the meaning of NI 43-101.
This news release does not constitute an offer to sell or a solicitation of an offer to buy, nor shall there be any sale of any of the securities in any jurisdiction in which such offer, solicitation or sale would be unlawful, including any of the securities in the United States of America. The securities have not been and will not be registered under the United States Securities Act of 1933, as amended (the "1933 Act") or any state securities laws, and may not be offered or sold within the United States or to, or for account or benefit of, U.S. Persons (as defined in Regulation S under the 1933 Act) unless registered under the 1933 Act and applicable state securities laws, or an exemption from such registration requirements is available.
About the PC Silver Mine
The PC Silver Mine is a high-grade silver-zinc-lead brownfield redevelopment project located in the Northwest Territories, Canada. The project benefits from substantial historical investment and infrastructure, including underground development, an existing mill, an airstrip and advanced permitting.
Honey Badger believes the project is strategically positioned to support growing North American demand for secure domestic supplies of silver, zinc, lead and potentially additional critical metals.
About Honey Badger Silver (TSXV: TUF) (OTCQB: HBEIF) (FSE: 1QA) (Tradegate: 1QA)
Honey Badger Silver is unlocking some of Canada's richest untapped silver potential. With the acquisition of the fully permitted, high-grade PC Silver Mine, the Company has become a leading North American silver and critical minerals company.
Backed by an impressive portfolio of 8 high-quality silver mineral projects across the Northwest Territories, Yukon, and Nunavut, including the Sunrise Lake, Plata, and Nanisivik properties, Honey Badger controls district- scale land positions in some of the most metal-rich jurisdictions on the continent.
What sets Honey Badger apart is its strategic blend of real silver ownership and growth leverage: the Company holds 10,000 ounces of physical silver yielding 12% annually, reinforcing tangible asset value while advancing aggressive exploration and acquisition plans.
Led by a proven team of mine-builders and capital markets professionals, Honey Badger is building a cash-generating, asset-backed platform for the bull cycle in precious and critical metals.
More information is available at www.honeybadgersilver.com
Chad WilliamsExecutive Chairman, Interim CEO
Sonya PekarInvestor Relationsinvestors@honeybadgersilver.com | +1 (647) 498-8244
Neither the TSX Venture Exchange nor its Regulation Services Provider (as that term is defined in the policies of the TSX Venture Exchange) accepts responsibility for the adequacy or accuracy of this release.
Cautionary Note Regarding Forward-Looking Information
This news release contains "forward-looking information" within the meaning of the applicable Canadian securities legislation that is based on expectations, estimates, projections and interpretations as at the date of this news release, including without limitation, the historic infrastructure and potential merits of the PC Silver Mine, the timing and anticipated results for the updated MRE and PEA, the experience and capabilities of the technical consultants, and Honey Badger's strategic objectives. Any statement that involves discussions with respect to predictions, expectations, interpretations, beliefs, plans, projections, objectives, assumptions, future events or performance (often but not always using phrases such as "expects", or "does not expect", "is expected", "interpreted", "management's view", "anticipates" or "does not anticipate", "plans", "budget", "scheduled", "forecasts", "estimates", "believes" or "intends" or variations of such words and phrases or stating that certain actions, events or results "may" or "could", "would", "might" or "will" be taken to occur or be achieved) are not statements of historical fact and may be forward-looking information and are intended to identify forward-looking information. This forward-looking information is based on reasonable assumptions and estimates of management of the Company at the time such assumptions and estimates were made, and involves known and unknown risks, uncertainties and other factors which may cause the actual results, performance or achievements of Honey Badger to be materially different from any future results, performance or achievements expressed or implied by such forward-looking information.
Such factors include, but are not limited to, risks relating to capital and operating costs varying significantly from estimates; delays in obtaining or failures to obtain required governmental, environmental or other project approvals; uncertainties relating to the availability and costs of financing needed in the future; changes in equity markets; inflation; fluctuations in commodity prices; delays in the development of projects; other risks involved in the mineral exploration and development industry; and those risks set out in the Company's public documents filed on SEDAR+ (www.sedarplus.ca) under Honey Badger's issuer profile. Although the Company believes that the assumptions and factors used in preparing the forward-looking information in this news release are reasonable, undue reliance should not be placed on such information, which only applies as of the date of this news release, and no assurance can be given that such events will occur in the disclosed timeframes or at all. The Company disclaims any intention or obligation to update or revise any forward-looking information, whether as a result of new information, future events or otherwise, other than as required by law.
(1) The historical estimates for PC Silver Project is supported by a technical report dated October 15, 2021 prepared in accordance with NI 43-101, completed by Ausenco Engineering Canada Inc., for NorZinc Ltd., which was the parent company of Canadian Zinc. These historical estimates have not been verified as current mineral resources. A "qualified person" (as defined in NI 43-101) has not done sufficient work to classify the historical estimate as current mineral resources, and the Company is not treating the historical estimate as current mineral resources. The Company considers the historical estimates to be relevant for the proper understanding of the Project, however, significant data compilation, re-drilling, re-sampling and data verification may be required by a Qualified Person for the historical estimates to be in accordance with NI 43-101 standards and to verify the historical estimates as current mineral resources.
To view the source version of this press release, please visit https://www.newsfilecorp.com/release/299202
TORONTO, ON / ACCESS Newswire / May 28, 2026 / 55 North Mining Inc. (CSE:FFF)(FSE:6YF) ("55 North" or the "Company") is pleased to announce the appointment of Mr. Michael Thompson, P.Geo., as Vice President of Exploration, effective immediately.
Mr. Thompson is a seasoned geologist with over 25 years of mineral exploration experience. He is a founding partner of Fladgate Exploration Consulting, a full-service mineral exploration consulting firm in Northwestern Ontario. He specializes in the structural interpretation of gold deposits and brings extensive gold and base metal exploration expertise gained through roles with Teck Resources, Placer Dome, and Goldcorp. He previously held various management positions with both public and private companies, most notably as President and CEO of Kesselrun Resources, which was acquired by Gold X2 in 2025. Mr. Thompson holds an Honours B.Sc. in Geology from the University of Toronto and is a Professional Geologist (P.Geo.) registered in Ontario.
Wayne Parsons, President and CEO of 55 North Mining, commented: "We are delighted to welcome Michael to the 55 North team. His deep expertise in structural geology, combined with a proven track record of successful gold exploration in Canada, makes him the ideal leader to advance our high-grade Last Hope Gold Project. Michael's experience will be instrumental as we continue to unlock the full potential of this exciting asset located in one of Manitoba's most prospective gold districts."
Mr. Thompson added: "I am excited to join 55 North Mining at this pivotal stage in the Company's growth. The Last Hope Gold Project represents a compelling opportunity in an established mining district, and I look forward to working with the team to help unlock additional value through disciplined exploration and technical evaluation."
Lynn Lake Gold District
Alamos Gold's Lynn Lake Gold Project, comprising the Gordon, MacLellan, Linkwood, and BT deposits, hosts combined Proven and Probable Mineral Reserves of 3.436 million ounces of gold at 1.25 g/t Au contained within 85.4 million tonnes, with additional Measured and Indicated Mineral Resources of 0.885 million ounces of gold at 1.27 g/t Au contained within 21.7 million tonnes, and Inferred Mineral Resources of 0.308 million ounces of gold at 0.80 g/t Au contained within 11.9 million tonnes.
The Lynn Lake Gold Project, currently under construction, is expected to average 186,000 ounces over its initial 10 years with total production estimated at three million ounces over the life-of-mine. Initial production is expected to commence in the first half of 2029. The Last Hope Gold Project is located approximately 10 km southeast of Alamos Gold's Linkwood and BT deposits.
The information regarding Alamos Gold's Lynn Lake Gold Project is taken from publicly available sources and has not been independently verified by 55 North Mining Inc. or its Qualified Person. Readers are cautioned that the Company has no interest in the Lynn Lake project and the proximity of the Last Hope Gold Project to Alamos Gold's deposits does not imply that similar mineralization or economic results will be encountered on the Company's property.
About 55 North Mining Inc.
55 North Mining Inc. is a Canadian exploration and development company advancing its 100% owned high-grade Last Hope Gold Project. The 2021 NI 43-101 mineral resource estimate ("MRE") for the Last Hope Gold Deposit is 71,100 ounces of Indicated gold resources at 5.41 g/t Au contained within 0.4 million tonnes and 273,800 ounces of Inferred gold resources at 5.48 g/t Au contained within 1.5 million tonnes. The deposit remains open both down-plunge and along strike, highlighting strong exploration potential for resource expansion through additional drilling.
The Mineral Resource estimate for the Last Hope Gold Project is based on the 2021 NI 43-101 Technical Report. Mineral Resources that are not Mineral Reserves do not have demonstrated economic viability. There is no certainty that all or any part of the Mineral Resources will be converted into Mineral Reserves. The estimate remains open down-plunge and along strike. Investors are cautioned that the Company has not completed a Preliminary Economic Assessment, Pre-Feasibility Study, or Feasibility Study on the Project and there is increased uncertainty and specific economic and technical risks of failure associated with any production decision based on the current mineral resource estimate.
Qualified Person
The technical content of this news release has been reviewed and approved by Michael Thompson, P.Geo., Qualified Person ("QP") as defined in National Instrument 43-101, Standards of Disclosure for Mineral Projects.
For further information, please visit the Company's website at www.55northmining.ca.
ON BEHALF OF THE BOARD OF DIRECTORS:
Wayne ParsonsPresident & CEO Phone: 519-871-3998Email: parsonswayne27@gmail.com
For Further Information, Please Contact:
Bruce ReidExecutive Chairman Phone: 647-500-4495Email: bruce@mine2capital.ca
Neither the Canadian Securities Exchange nor its Regulation Services Provider (as that term is defined in the policies of the Canadian Securities Exchange) accepts responsibility for the adequacy or accuracy of this release.
All mineral resource and mineral reserve estimates disclosed in this news release have been prepared in accordance with National Instrument 43-101 – Standards of Disclosure for Mineral Projects ("NI 43-101") and the Canadian Institute of Mining, Metallurgy and Petroleum ("CIM") Definition Standards on Mineral Resources and Mineral Reserves, adopted by the CIM Council, as amended.
Readers are cautioned that Mineral Resources are not Mineral Reserves and do not have demonstrated economic viability. The estimate of Mineral Resources may be materially affected by environmental, permitting, legal, title, taxation, socio-political, marketing, or other relevant issues. Inferred Mineral Resources have a high degree of uncertainty as to their existence, and as to whether they can be mined economically or legally. It cannot be assumed that all or any part of an Inferred Mineral Resource will ever be upgraded to a higher category. Under Canadian rules, estimates of Inferred Mineral Resources may not form the basis of feasibility or pre-feasibility studies, except in rare cases.
CAUTION REGARDING FORWARD-LOOKING INFORMATION
This news release contains certain "forward-looking statements" within the meaning of applicable securities laws. All statements, other than statements of historical fact, included in this release, including, without limitation, statements regarding future plans and objectives of the Company, are forward-looking statements that involve various risks and uncertainties. There can be no assurance that such statements will prove to be accurate, and actual results and future events could differ materially from those anticipated in such statements. Important factors that could cause actual results to differ materially from the Company's expectations include, but are not limited to, market conditions, risks associated with mineral exploration, and other factors detailed from time to time in the Company's filings with Canadian securities regulators.
SOURCE: 55 North Mining Inc
View the original press release on ACCESS Newswire
Vancouver, British Columbia–(Newsfile Corp. – May 27, 2026) – Rokmaster Resources Corp. (TSXV: RKR) (OTCQB: RKMSF) (FSE: 1RR1) ("Rokmaster" or the "Company") announces that it has elected to adopt semi-annual financial reporting ("SAR") in reliance on the Coordinated Blanket Order 51-933 – Exemptions to Permit Semi-Annual Reporting for Certain Venture Issuers (the "Blanket Order"), issued by the Canadian Securities Administrators.
The Blanket Order is a pilot program which permits eligible venture issuers listed on the TSX Venture Exchange (the "TSXV") to voluntarily move from quarterly to semi-annual financial reporting. The Company confirms that it meets the eligibility criteria under the Blanket Order. By adopting SAR, the Company aims to reduce the administrative and financial burden associated with quarterly reporting.
As a result of this election, the Company will file interim financial reports and related management's discussion and analysis ("MD&A") on a semi-annual basis, rather than quarterly. The Company's fiscal year-end is December 31, and it will continue to file annual audited financial statements (due within 120 days of December 31). The Company will continue to remain subject to timely disclosure requirements and will continue to report all material changes and significant developments in accordance with National Instrument 51-102 – Continuous Disclosure Obligations.
Under the Blanket Order, the Company will be exempt from filing interim financial reports and related MD&A for its three-month and nine-month interim periods. The Company will not file quarterly interim financial reports or related MD&A for the three-month period ending March 31, 2026 and the nine-month period ending September 30, 2026, and all subsequent periods ending March 31 and September 30. The Company will file its next interim financial report and related MD&A for the six-months ended June 30, 2026 (due within 60 days of June 30, 2026).
This news release is being issued and filed pursuant to the Blanket Order.
For more information please contact:Mr. John Mirko, President & CEO of Rokmaster Resources Corp.,jmirko@rokmaster.com, Ph. +1 (604) 290-4647 or by website: www.rokmaster.com
On Behalf of the Board of Directors ofRokmaster Resources Corp.John Mirko,President & Chief Executive Officer
Neither TSX Venture Exchange nor its Regulation Services Provider (as that term in defined in the policies of the TSX Venture Exchange) accepts responsibility for the adequacy or accuracy of this press release.
CAUTIONARY NOTE REGARDING FORWARD-LOOKING STATEMENTS: This news release may contain forward-looking information within the meaning of applicable securities laws ("forward-looking statements"). Forward-looking statements are statements that are not historical facts and are generally, but not always, identified by the words "expects," "plans," "anticipates," "believes," "intends," "estimates," 'projects," "potential" and similar expressions, or that events or conditions "will," "would," "may," "could" or "should" occur. These forward-looking statements are subject to a variety of risks and uncertainties which could cause actual events or results to differ materially from those reflected in the forward-looking statements, including, without limitation: receipt of regulatory approval with respect to the Hanson Property transaction; risks related to fluctuations in metal prices; uncertainties related to raising sufficient financing to fund the planned work in a timely manner and on acceptable terms; changes in planned work resulting from weather, logistical, technical or other factors; the possibility that results of work will not fulfill expectations and realize the perceived potential of the Company's properties; risk of accidents, equipment breakdowns and labour disputes or other unanticipated difficulties or interruptions; the possibility of cost overruns or unanticipated expenses in the work program; the risk of environmental contamination or damage resulting from Rokmaster's operations and other risks and uncertainties. Any forward-looking statement speaks only as of the date it is made and, except as may be required by applicable securities laws, the Company disclaims any intent or obligation to update any forward-looking statement, whether as a result of new information, future events or results or otherwise.
To view the source version of this press release, please visit https://www.newsfilecorp.com/release/299173
Honey Badger Silver (TUF.V) on Wednesday detailed its three primary near-term strategic priorities at its flagship Prairie Creek Silver Mine (PC) Silver Mine in the Northwest Territories.nnThe company plans to progress on site access infrastructure, on refurbishment and advancement of existing mill infrastructure and drilling and resource expansion. Honey Badger, in parallel with these operational priorities, intends to continue evaluating opportunities to reduce project risk and minimize shareholder dilution through potential government funding programs, strategic partnerships, debt financing, non-silver royalty structures, and concentrate marketing initiatives, it said.nnIts primary financial objective is to maximize the net present value of the PC Silver Mine on a per share basis, it said. nn"Major factors that could lead to a higher net present value are: bringing future expected free-cash flows closer to the present, adding mine life, lowering capital costs, de-risking, and lowering operating costs which in our case may come from critical metal by-product credits," said the company in a statement.nnShares of the company were last seen down $0.06 to $1.11 on the TSX Venture Exchange.
Toronto, Ontario–(Newsfile Corp. – May 27, 2026) – Honey Badger Silver Inc. (TSXV: TUF) (OTCQB: HBEIF) (FSE: 1QA) (Tradegate: 1QA) ("Honey Badger" or the "Company") is pleased to outline its three primary near-term strategic priorities at its flagship Prairie Creek Silver Mine ("PC Silver Mine") located in the Northwest Territories, Canada.
The Company's primary financial objective is to maximize the net present value of the PC Silver Mine on a per share basis. Major factors that could lead to a higher net present value are: bringing future expected free-cash flows closer to the present, adding mine life, lowering capital costs, de-risking, and lowering operating costs which in our case may come from critical metal by-product credits.
This work will be done as quickly, but also as conscientiously, as possible. Honey Badger will continue working collaboratively with Indigenous Governments, Parks Canada, the Government of the Northwest Territories and other regulators as part of the ongoing development process.
Chad Williams, Executive Chairman of Honey Badger Silver commented, "Management and the Board are aligned around a clear near-term operating strategy to add value to our PC Silver Mine. We believe the PC Silver Mine is one of the most compelling high-grade silver redevelopment projects in the world. This is an opportunity for us to demonstrate the quality and scale of the asset. We acknowledge and appreciate the substantial work already completed at the PC Silver Mine by previous operators over many decades. To maximize the benefits of our efforts, the activities listed below will also be coordinated with the world-class experts that will provide an updated economic study and a new mineral resource estimate for the PC Silver Mine."
Mr. Williams continued "The PC Silver Mine is undoubtedly Honey Badger's main focus. However, the Company will also conduct activities at certain of its other promising silver projects in the near term. Details on those will be discussed in future releases."
Priority Near-Term Activities at the PC Silver Mine
The following are summaries intended to highlight our top three operating priorities. The Company will provide details and updates regarding these activities on an ongoing basis.
1. Progressing on Site Access Infrastructure
Demonstrating progress on bringing the PC Silver Mine closer to production is a priority.
A key component is initiating tangible work on the future all-season road.
Planned activities are:
- upgrades and preparation work along portions of the existing transportation corridor;
- next-stage authorization conditions for construction;
- and mobilization planning and logistical preparations intended to accelerate future development activities.
The Company believes continued advancement of transportation infrastructure will:
- reduce long-term project risk;
- improve logistics and operating flexibility;
- lessen future development timelines;
- and further demonstrate project momentum to Indigenous Governments and potential strategic/funding partners.
2. Refurbishment and Advancement of Existing Mill Infrastructure
Demonstrating the operating capability of our existing infrastructure is a priority.
The Company plans to initiate phased refurbishment of the existing mill and surface infrastructure at the PC Silver Mine.
Honey Badger believes the project's substantial existing infrastructure represents an important strategic advantage relative to many other mining projects anywhere in the world.
Over time, these activities are expected to support:
- further technical de-risking;
- operational readiness planning;
- and future development flexibility
3. Drilling and Resource Expansion
Growing the silver and critical minerals resource at the PC Silver Mine is a priority.
Honey Badger intends to pursue underground/surface drilling programs focused on:
- resource expansion and category upgrading by extending known mineralized zones;
- and evaluation of broader district-scale exploration targets.
Existing core and outcrops will be sampled for germanium, tungsten and other strategic metals.
Management believes the project may possess important additional exploration upside beyond the currently defined mineralized areas. Details on our exploration program will be released soon.
Other Significant Corporate Activities
In parallel with these operational priorities, Honey Badger intends to continue evaluating opportunities to reduce project risk and minimize shareholder dilution through potential:
- government funding programs;
- strategic partnerships;
- debt financing;
- non-silver royalty structures;
- and concentrate marketing initiatives.
Qualified Person
The scientific and technical data contained in this news release pertaining to the Project was reviewed and approved by Benjamin Kuzmich, who is an independent consultant and "qualified person" within the meaning of NI 43-101.
This news release does not constitute an offer to sell or a solicitation of an offer to buy, nor shall there be any sale of any of the securities in any jurisdiction in which such offer, solicitation or sale would be unlawful, including any of the securities in the United States of America. The securities have not been and will not be registered under the United States Securities Act of 1933, as amended (the "1933 Act") or any state securities laws, and may not be offered or sold within the United States or to, or for account or benefit of, U.S. Persons (as defined in Regulation S under the 1933 Act) unless registered under the 1933 Act and applicable state securities laws, or an exemption from such registration requirements is available.
About the PC Silver Mine
The PC Silver Mine is a high-grade silver-zinc-lead brownfield redevelopment project located in the Northwest Territories, Canada. The project benefits from substantial historical investment and infrastructure, including underground development, an existing mill, an airstrip and advanced permitting.
Honey Badger believes the project is strategically positioned to support growing North American demand for secure domestic supplies of silver, zinc, lead and potentially additional critical minerals.
About Honey Badger Silver (TSXV: TUF) (OTCQB: HBEIF) (FSE: 1QA) (Tradegate: 1QA)
Honey Badger Silver is unlocking some of Canada's richest untapped silver potential. With the acquisition of the fully permitted, high-grade PC Silver Mine, the Company has become a leading North American silver and critical minerals company.
Backed by an impressive portfolio of 8 high-quality silver mineral projects across the Northwest Territories, Yukon, and Nunavut, including the Sunrise Lake, Plata, and Nanisivik properties, Honey Badger controls district- scale land positions in some of the most metal-rich jurisdictions on the continent.
What sets Honey Badger apart is its strategic blend of real silver ownership and growth leverage: the Company holds 10,000 ounces of physical silver yielding 12% annually, reinforcing tangible asset value while advancing aggressive exploration and acquisition plans.
Led by a proven team of mine-builders and capital markets professionals, Honey Badger is building a cash-generating, asset-backed platform for the bull cycle in precious and critical metals.
More information is available at www.honeybadgersilver.com
Chad WilliamsExecutive Chairman, Interim CEO
Sonya PekarInvestor Relationsinvestors@honeybadgersilver.com | +1 (647) 498-8244
Neither the TSX Venture Exchange nor its Regulation Services Provider (as that term is defined in the policies of the TSX Venture Exchange) accepts responsibility for the adequacy or accuracy of this release.
Cautionary Note Regarding Forward-Looking Information
This news release contains "forward-looking information" within the meaning of the applicable Canadian securities legislation that is based on expectations, estimates, projections and interpretations as at the date of this news release, including without limitation, the historic infrastructure and potential merits of the PC Silver Mine, the timing and priorities for the PC Silver Mine, and Honey Badger's strategic objectives. Any statement that involves discussions with respect to predictions, expectations, interpretations, beliefs, plans, projections, objectives, assumptions, future events or performance (often but not always using phrases such as "expects", or "does not expect", "is expected", "interpreted", "management's view", "anticipates" or "does not anticipate", "plans", "budget", "scheduled", "forecasts", "estimates", "believes" or "intends" or variations of such words and phrases or stating that certain actions, events or results "may" or "could", "would", "might" or "will" be taken to occur or be achieved) are not statements of historical fact and may be forward-looking information and are intended to identify forward-looking information. This forward-looking information is based on reasonable assumptions and estimates of management of the Company at the time such assumptions and estimates were made, and involves known and unknown risks, uncertainties and other factors which may cause the actual results, performance or achievements of Honey Badger to be materially different from any future results, performance or achievements expressed or implied by such forward-looking information.
Such factors include, but are not limited to, risks relating to capital and operating costs varying significantly from estimates; delays in obtaining or failures to obtain required governmental, environmental or other project approvals; uncertainties relating to the availability and costs of financing needed in the future; changes in equity markets; inflation; fluctuations in commodity prices; delays in the development of projects; other risks involved in the mineral exploration and development industry; and those risks set out in the Company's public documents filed on SEDAR+ (www.sedarplus.ca) under Honey Badger's issuer profile. Although the Company believes that the assumptions and factors used in preparing the forward-looking information in this news release are reasonable, undue reliance should not be placed on such information, which only applies as of the date of this news release, and no assurance can be given that such events will occur in the disclosed timeframes or at all. The Company disclaims any intention or obligation to update or revise any forward-looking information, whether as a result of new information, future events or otherwise, other than as required by law.
To view the source version of this press release, please visit https://www.newsfilecorp.com/release/299043
Never miss an important update on your stock portfolio and cut through the noise. Over 7 million investors trust Simply Wall St to stay informed where it matters for FREE.
- Agnico Eagle Mines (NYSE:AEM) has agreed to acquire approximately 243.9 million shares of Wallbridge Mining Company Limited.
- The deal will lift Agnico Eagle’s ownership in Wallbridge to nearly 20%, giving it greater influence over Wallbridge’s future direction.
- The transaction also grants Agnico Eagle new rights, including the ability to nominate a director to Wallbridge’s board and participate in future financings.
For investors tracking NYSE:AEM, this move comes as the stock trades around $180.57 and sits on very large multi year gains, including about 57% over the past year. The company already carries a value score of 3, and this additional exposure to Wallbridge adds another layer to how its project pipeline is shaping up.
The increased stake and board nomination rights place Agnico Eagle closer to Wallbridge’s exploration and development decisions, which could influence how its long term growth options evolve. The new participation rights in future financings may also shape how Agnico Eagle allocates capital across internal projects and external partnerships.
Stay updated on the most important news stories for Agnico Eagle Mines by adding it to your watchlist or portfolio. Alternatively, explore our Community to discover new perspectives on Agnico Eagle Mines.
NYSE:AEM Earnings & Revenue Growth as at May 2026
Investor Checklist Quick Assessment
- ✅ Price vs Analyst Target: At US$180.57 versus a consensus target of about US$256.07, the stock trades roughly 30% below where analysts cluster.
- ⚖️ Simply Wall St Valuation: Shares are described as trading close to estimated fair value, so expectations already reflect much of the current outlook.
- ❌ Recent Momentum: The stock is down 9.8% over the last 30 days, so short term sentiment has cooled.
There is only one way to know the right time to buy, sell or hold Agnico Eagle Mines. Head to Simply Wall St’sncompany report for the latest analysis of Agnico Eagle Mines’s Fair Value.
Key Considerations
- 📊 The larger Wallbridge stake tightens Agnico Eagle’s link to an exploration focused partner, which could influence how you think about its project pipeline and long term options.
- 📊 Watch how management talks about Wallbridge in future updates, including any capital commitments, resource estimates and timing of potential development decisions.
- ⚠️ Earnings are forecast to decline by an average of 0.4% per year over the next 3 years, so investors may want to consider how this transaction fits alongside that outlook.
Dig Deeper
For the full picture including more risks and rewards, check out thencomplete Agnico Eagle Mines analysis. Alternatively, you can check out thencommunity page for Agnico Eagle Mines to see how other investors believe this latest news will impact the company’s narrative.
This article by Simply Wall St is general in nature. We provide commentary based on historical datan and analyst forecasts only using an unbiased methodology and our articles are not intended to be financial advice. It does not constitute a recommendation to buy or sell any stock, and does not take account of your objectives, or yourn financial situation. We aim to bring you long-term focused analysis driven by fundamental data.n Note that our analysis may not factor in the latest price-sensitive company announcements or qualitative material.n Simply Wall St has no position in any stocks mentioned.
Companies discussed in this article include AEM.
Have feedback on this article? Concerned about the content? Get in touch with us directly. Alternatively, email editorial-team@simplywallst.com
For Immediate Release
Chicago, IL – May 26, 2026 – Zacks.com announces the list of stocks featured in the Analyst Blog. Every day the Zacks Equity Research analysts discuss the latest news and events impacting stocks and the financial markets. Stocks recently featured in the blog include: Texas Instruments Inc. TXN, Linde plc LIN, BHP Group Ltd. BHP, Landmark Bancorp, Inc. LARK and Global Self Storage, Inc. SELF.
Here are highlights from Friday’s Analyst Blog:
Top Research Reports for Texas Instruments, Linde and BHP
The Zacks Research Daily presents the best research output of our analyst team. Today's Research Daily features new research reports on 16 major stocks, including Texas Instruments Inc., Linde plc and BHP Group Ltd., as well as two micro-cap stocks Landmark Bancorp, Inc. and Global Self Storage, Inc. The Zacks microcap research is unique as our research content on these small and under-the-radar companies is the only research of its type in the country.These research reports have been hand-picked from the roughly 70 reports published by our analyst team today.You can see all of today’s research reports here >>>Today's Featured Research ReportsTexas Instruments’ shares have outperformed the Zacks Semiconductor – General industry over the past six months (+95.2% vs. +30.2%). The company is benefiting from solid data center demand, which is boosting its prospects in the enterprise systems market. A sustained focus on expanding its product portfolio across the Analog and Embedded Processing segments helps capture market share.Texas Instruments’ deepening focus on internal manufacturing and advanced technology infusion is another positive. Its robust cash flows and aggressive shareholder return policies instill confidence in its long-term prospects.However, its overall growth might be impacted by a slow recovery in the industrial market as customers are cautiously spending amid ongoing macroeconomic uncertainties. Rising manufacturing costs and the growing tech war between the United States and China are other concerns. Our model estimates indicate that revenues are likely to witness a CAGR of 12.1% through 2026-2028.(You can read the full research report on Texas Instruments here >>>)Shares of Linde have outperformed the Zacks Chemical – Specialty industry over the past six months (+28.5% vs. +12.7%). The company is a leading industrial gas supplier serving energy, healthcare, manufacturing, metals and electronics markets through long-term contracts with minimum purchase commitments that support stable cash flows during downturns.LIN has a $9.9B project backlog, including $7.1B of long-term Sale of Gas projects, providing durable earnings visibility and double-digit returns. Management expects operating margins to expand above its traditional 40–60 basis-point range via cost controls, automation and AI-driven efficiency initiatives. LIN reported strong first-quarter 2026 earnings on higher pricing and incremental project start-ups.However, Linde faces pressure in EMEA from weak industrial activity, softer chemicals demand, geopolitical disruptions and policy uncertainty, which could reduce volumes, delay investments and weigh on profitability.(You can read the full research report on Linde here >>>)BHP’s shares have outperformed the Zacks Mining – Miscellaneous industry over the past six months (+61.8% vs. +39.1%). The company remains a high-quality diversified miner with leadership in iron ore and growing leverage to copper and potash, supported by low-cost operations and disciplined capital allocation. Recent updates point to resilient iron ore volumes despite weather disruption, strong execution at Escondida and Copper South Australia.BHP’s strategic shift toward future-facing commodities like copper and potash positions it well to benefit from global decarbonization and trends. Strong cash generation, efforts to lower debt and portfolio actions support funding flexibility.However, weak steel demand, commodity price volatility and cost pressures in parts of the footprint remain headwinds. Large project delivery and capital intensity at Jansen, along with the suspended nickel business and regulatory uncertainty in Australia, remain key risks.(You can read the full research report on BHP here >>>)Shares of Landmark Bancorp have gained +5.9% over the past six months against the Zacks Financial – Savings and Loan industry’s gain of +17.9%. This microcap company with a market capitalization of $170.37 million benefits from a diversified community banking franchise across Kansas and Missouri, supporting balanced exposure to residential, commercial, agricultural, and municipal lending markets.The company is strengthening profitability through disciplined deposit pricing, improved loan yields, and expansion in net interest margin, creating a more resilient earnings profile. Credit quality remains manageable with stable reserves and limited charge-offs despite modest increases in delinquencies. Capital levels and tangible book value continue to improve, supported by consistent earnings generation and a long history of dividend payments.Management is also enhancing funding flexibility by emphasizing core relationship deposits while reducing reliance on brokered funding. In addition, liquidity management and active securities portfolio positioning help mitigate interest-rate volatility.(You can read the full research report on Landmark Bancorp here >>>)Global Self Storage’s shares have gained +6.8% over the past six months against the Zacks REIT and Equity Trust – Other industry’s gain of +11.9%. This microcap company with a market capitalization of $59.51 million has its investment thesis centered on targeting underserved secondary and tertiary markets, where supply growth is more rational and competition is lower than in major metropolitan areas.Global Self Storage’s focus on operational efficiency, customer retention and technology-enabled revenue management has supported strong occupancy and recurring cash-flow generation. Growth opportunities remain tied to selective acquisitions, JVs and redevelopment initiatives that can expand earnings without significant development risk.Investors should monitor margin pressure from rising labor and property-tax costs, which have recently limited profitability. SELF’s small scale also increases sensitivity to localized fluctuations. Current valuation levels suggest the market is discounting concerns around scale and margins, though continued growth could support upside and dividends.(You can read the full research report on Global Self Storage here >>>)
Why Haven't You Looked at Zacks' Top Stocks?
Since 2000, our top stock-picking strategies have blown away the S&P's +7.7% average gain per year. Amazingly, they soared with average gains of +48.4%, +50.2% and +56.7% per year.
Today you can access their live picks without cost or obligation.
See Stocks Free >>
support@zacks.com
https://www.zacks.com
Past performance is no guarantee of future results. Inherent in any investment is the potential for loss. This material is being provided for informational purposes only and nothing herein constitutes investment, legal, accounting or tax advice, or a recommendation to buy, sell or hold a security. No recommendation or advice is being given as to whether any investment is suitable for a particular investor. It should not be assumed that any investments in securities, companies, sectors or markets identified and described were or will be profitable. All information is current as of the date of herein and is subject to change without notice. Any views or opinions expressed may not reflect those of the firm as a whole. Zacks Investment Research does not engage in investment banking, market making or asset management activities of any securities. These returns are from hypothetical portfolios consisting of stocks with Zacks Rank = 1 that were rebalanced monthly with zero transaction costs. These are not the returns of actual portfolios of stocks. The S&P 500 is an unmanaged index. Visit https://www.zacks.com/performance for information about the performance numbers displayed in this press release.
Want the latest recommendations from Zacks Investment Research? Today, you can download 7 Best Stocks for the Next 30 Days. Click to get this free report
Texas Instruments Incorporated (TXN) : Free Stock Analysis Report
BHP Group Limited Sponsored ADR (BHP) : Free Stock Analysis Report
Linde PLC (LIN) : Free Stock Analysis Report
Landmark Bancorp Inc. (LARK): Free Stock Analysis Report
Global Self Storage, Inc. (SELF): Free Stock Analysis Report
This article originally published on Zacks Investment Research (zacks.com).
If you would like to receive our free newsletter via email, simply enter your email address below & click subscribe.
 Follow us on Twitter
 Become our facebook fan
CONNECT WITH US
Tweets
Tweet with hash tag #miningfeeds or @miningfeeds and your tweets will be displayed across this site.
MOST ACTIVE MINING STOCKS
Daily Gainers
 CMC Metals Ltd. CMC Metals Ltd. |
CMB.V | +900.00% |
 Eden Energy Ltd Eden Energy Ltd |
EDE.AX | +200.00% |
| GoviEx Uranium Inc. |
GXU.V | +42.86% |
| Eagle Nickel Ltd. |
ENL.AX | +41.67% |
| Citigold Corp. Limited |
CTO.AX | +33.33% |
| Mount Burgess Mining NL |
MTB.AX | +33.33% |
| Exalt Resources Limited |
ERD.AX | +31.94% |
| Casa Minerals Inc. |
CASA.V | +30.00% |
| Cariboo Rose Resources Ltd |
CRB.V | +28.57% |
| Belmont Resources Inc. |
BEA.V | +28.57% |


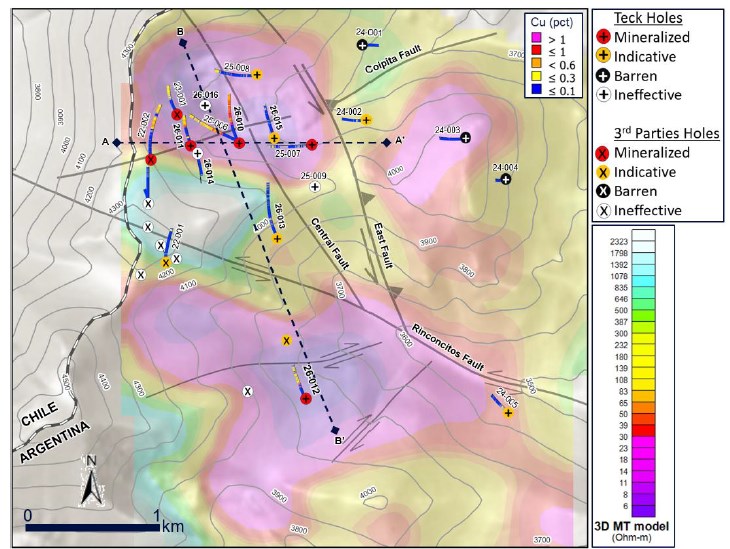
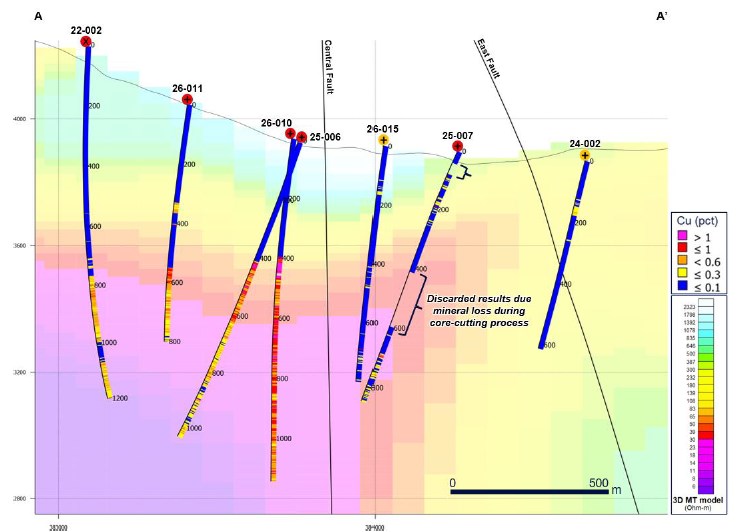
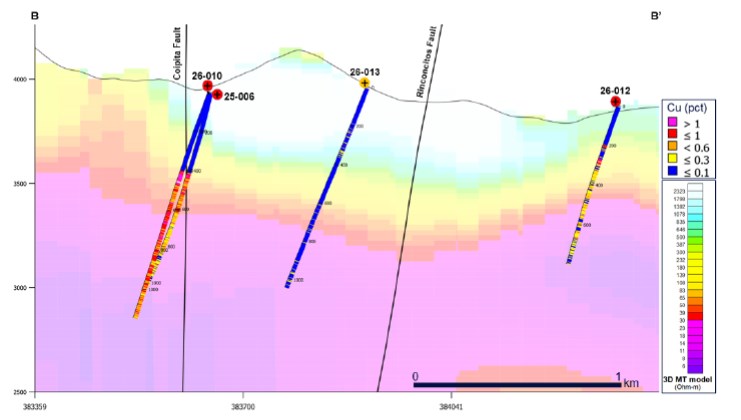